1. Introduction
Providing affordable and reliable electricity to remote Labrador communities has been a long-standing challenge. Many settlements historically relied on diesel generators because of their distance from existing power networks. While diesel was relatively easy to deploy, it carried high financial and environmental costs. Rising fuel prices, transportation difficulties, and greenhouse gas emissions further exposed its limitations.
The southern Labrador community of L’Anse au Loup, together with Forteau, Red Bay, and Capstan Island, receives electricity from Hydro-Québec’s Lac Robertson hydroelectric facility, which provides about 4000 kW of capacity [
1]. Despite access to clean hydroelectric power, these communities lack local control, depend on an external supplier, and remain vulnerable to transmission failures. The system serves more than a thousand users with an average demand of 4000 kW, which increases the risk of outages, higher costs, and reduced long-term energy security [
2]. As demand continues to grow, the strain on existing infrastructure will intensify.
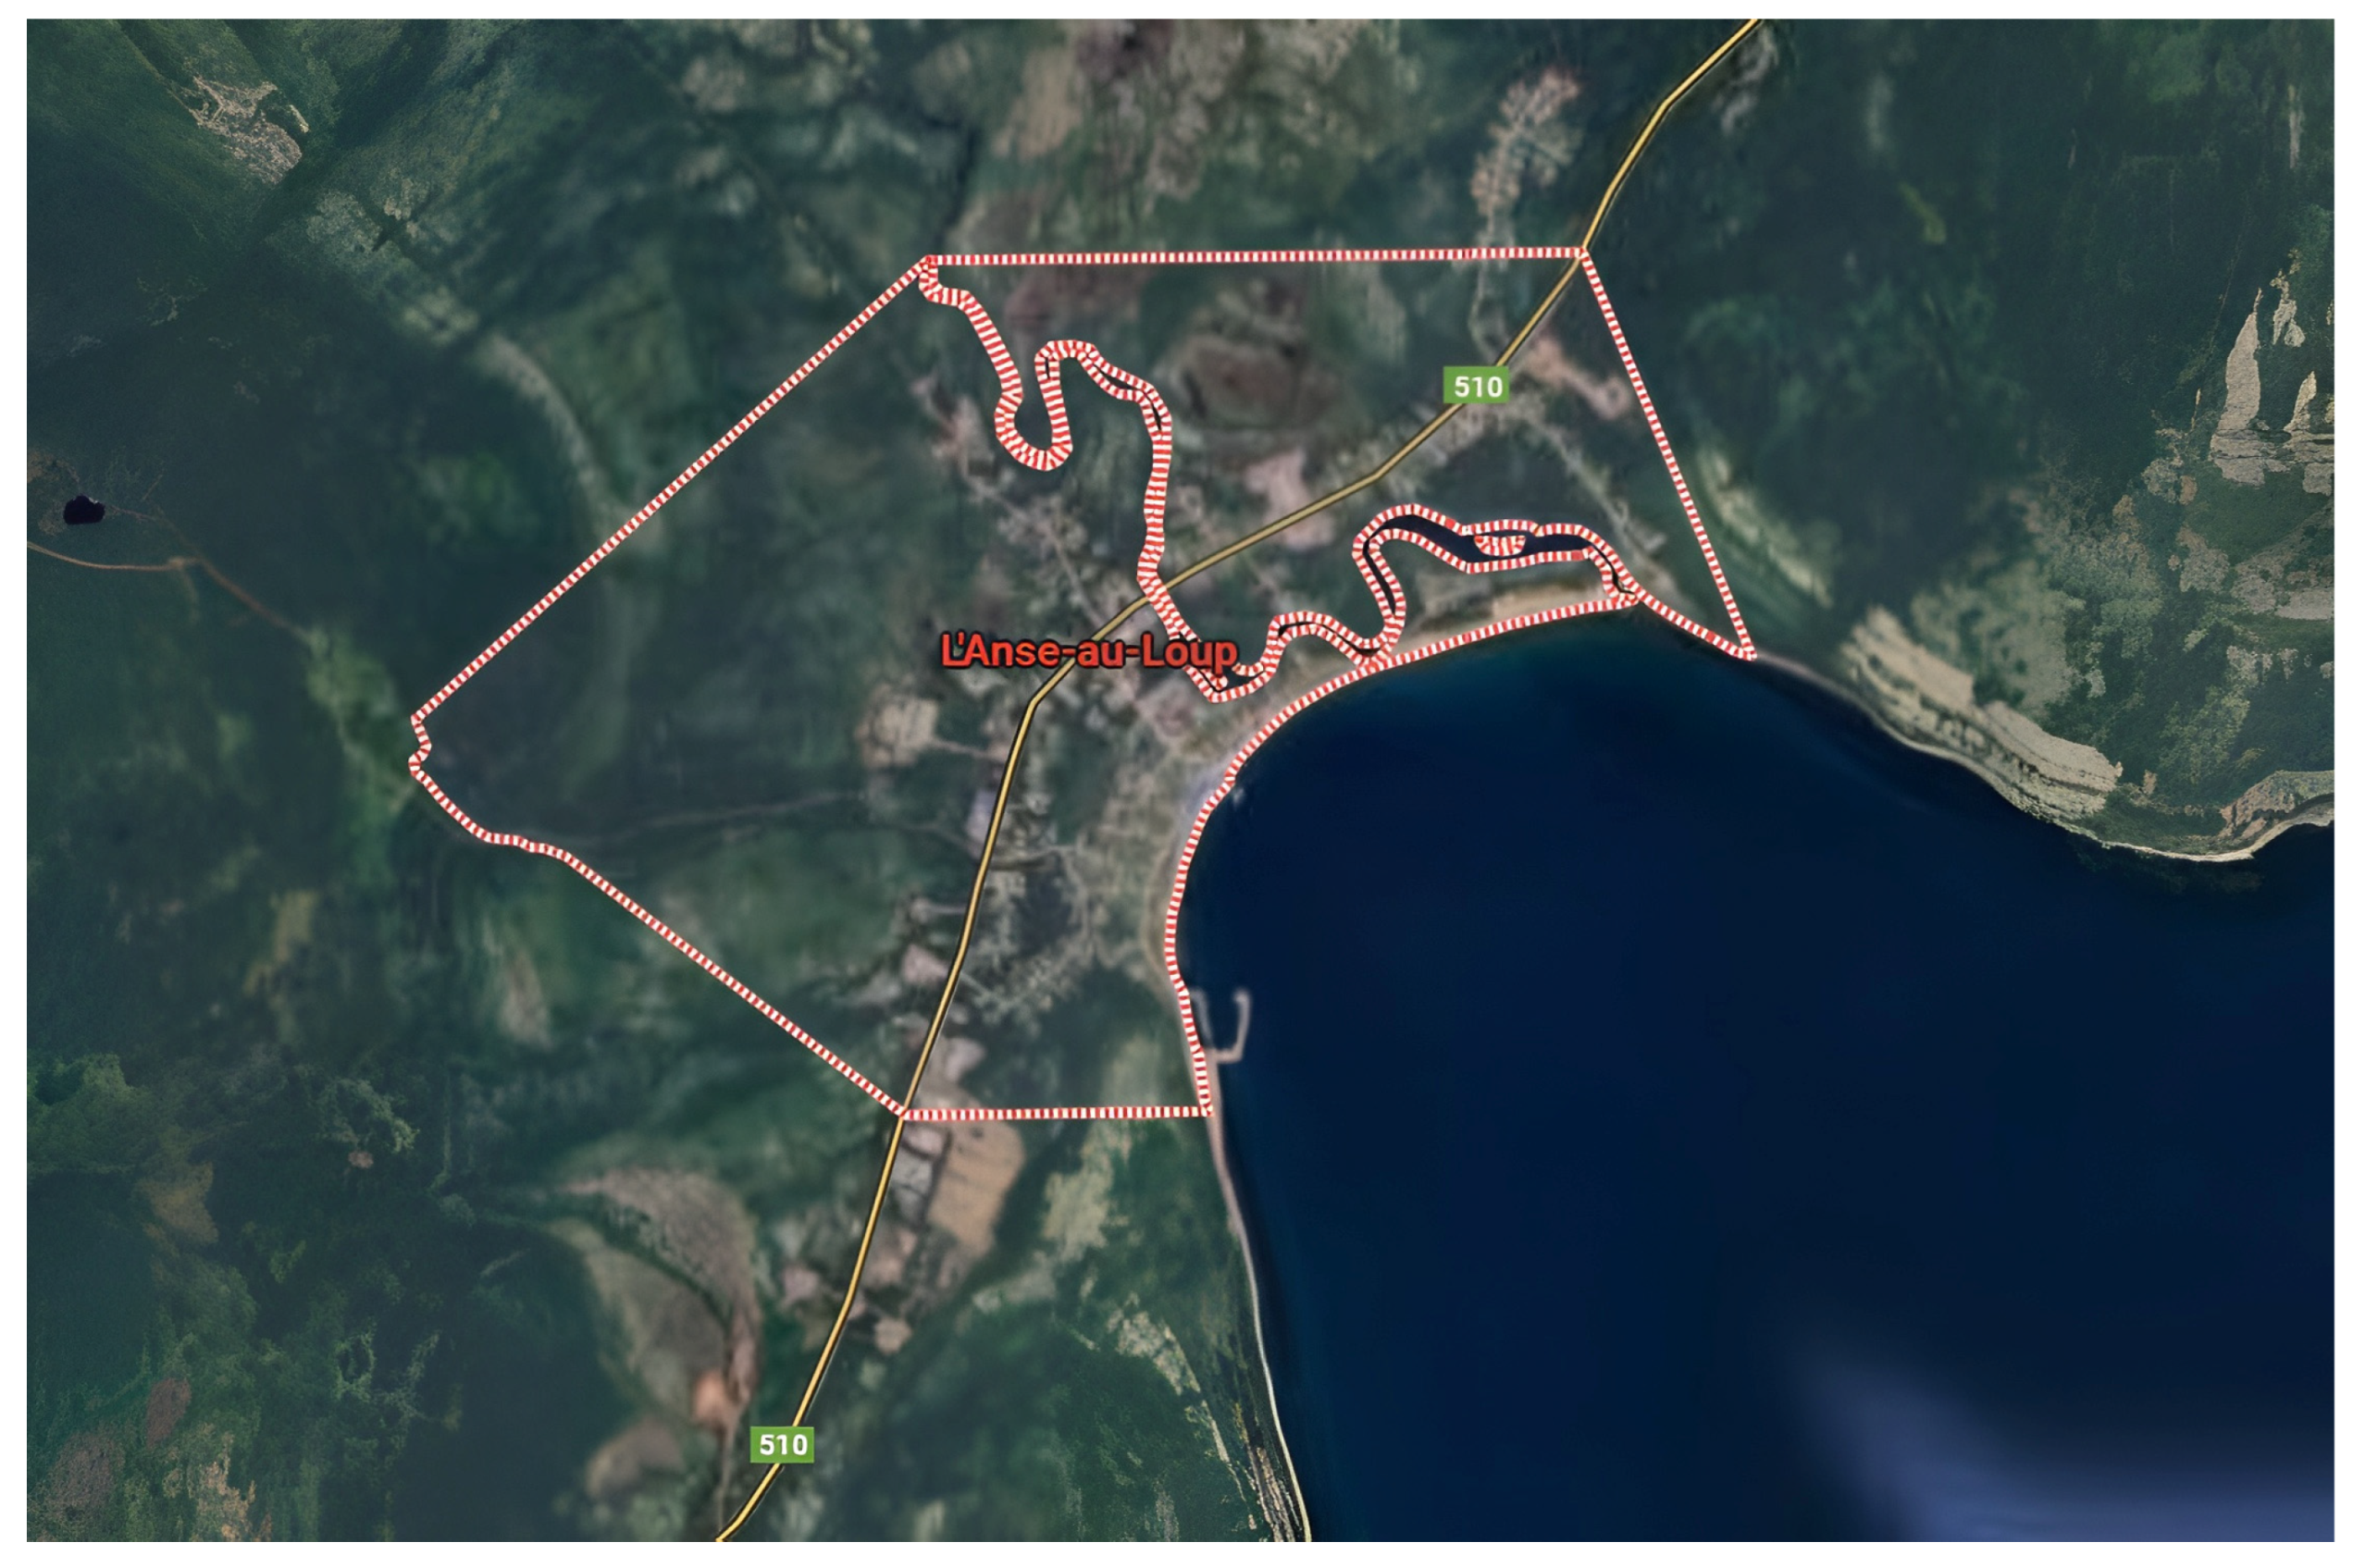
During supply disruptions, the L’Anse au Loup Diesel Generating Station provides backup capacity (
Figure 1). In 2014, authorities proposed replacing the 600 kW unit with a 1.8 MW generator to ensure continuity during Hydro-Québec outages [
3]. Recent data indicate the station’s installed capacity is about 8.05 MW [
3]. On 1 August 2024, electricity rates in L’Anse au Loup and other isolated rural areas increased by 3.6–6.8% for residential users and 7.0–8.3% for commercial users. These adjustments followed the Northern Strategic Plan and the provincial rate reduction policy, which caps annual residential increases at 2.25% until 2030. Without this policy, rates would have nearly doubled, making electricity unaffordable for many households and businesses [
4].
At present, L’Anse au Loup purchases electricity through the Labrador Interconnected System at one of Canada’s lowest subsidized retail rates, around 3.15 ¢/kWh [
5], compared to typical household tariffs of about 7.3 ¢/kWh in Québec [
6]. This difference shows that local rates do not reflect full market costs. Reliance on subsidies creates long-term risks, as future tariff adjustments or reductions could sharply increase consumer costs. These concerns underscore the need to establish local renewable resources to diversify supply, improve resilience, and hedge against tariff volatility.
Research on hybrid renewable systems in small, remote Canadian communities is limited, particularly in cold coastal regions like southern Labrador. Many existing evaluations also neglect technical, financial, and environmental dimensions, and often overlook seasonal climate effects and temperature-dependent PV performance. This study addresses these gaps by developing a methodology for evaluating the viability of solar–wind hybrid systems for community energy supply.
Although L’Anse au Loup maintains diesel capacity, this study deliberately excludes diesel generation from the proposed design. Instead, it considers a grid-connected configuration using complementary solar and wind resources to ensure a stable supply while avoiding the costs, emissions, and logistical difficulties associated with diesel. Microgrids are increasingly recognized as an effective way to integrate renewable energy into existing systems, improve resilience, and balance local resources [
7,
8,
9]. By decentralizing generation, microgrids also allow communities to reduce dependence on external suppliers. Energy Management Systems (EMSs) are essential in balancing real-time supply and demand, managing power flows, and improving efficiency [
10,
11].
Hybrid renewable systems offer an effective response to these challenges. For coastal Labrador, solar and wind resources are complementary across seasonal and daily cycles, providing a more consistent supply throughout the year [
12]. This arrangement can reduce dependence on imports, stabilize electricity prices, and increase resilience against disruptions [
6]. This study also models a 1% annual increase in electricity demand in HOMER Pro to account for future growth.
One of the key advantages of a grid-connected hybrid system is its ability to reduce emissions compared to a diesel-based supply. The proposed design lowers annual CO
2 emissions by about 95%, or roughly 1897 tonnes, relative to current conditions. By excluding large-scale battery storage, the system avoids the environmental concerns of raw material extraction, recycling, and disposal [
13]. It also reduces the footprint and cost of battery replacement while maintaining stability through grid interaction. This design choice makes the proposed hybrid system both environmentally responsible and financially viable for coastal Labrador.
Hybrid renewable energy systems for remote or rural regions are often designed with diesel engines and battery storage to ensure reliability. In Italy, Gatta et al. [
14] presented the Giglio Smart Island Project, which introduced PV panels, lithium batteries, and a synchronous condenser to replace conventional diesel units. Murugaperumal and Vimal Raj [
15] studied rural electrification systems that paired solar PV and wind with battery storage to maintain supply stability. Almutairi et al. [
16] examined microgrids that combined wind, solar, diesel, and battery systems, and reported gains in both sustainability and reliability. Schmid and Hoffmann [
17] drew attention to the high cost of transporting diesel in the Amazon, similar to the challenges of supplying fuel to coastal Labrador. Hossain et al. [
18] demonstrated the techno-economic feasibility of hybrid renewable systems for Newfoundland and Labrador using HOMER Pro, though their models still relied on diesel. In Pakistan, Ref. [
19] developed a grid-connected PV–wind configuration with HOMER Pro, showing the tool’s usefulness for hybrid design in developing countries. Adefarati and Bansal [
20] assessed microgrids with high renewable penetration, analyzing their reliability, costs, and environmental impacts, and concluded that such systems can operate dependably while reducing environmental burdens. In addition, Hassan et al. [
21] reviewed second-life batteries from electric vehicles, noting that these units often retain 70–80% of their original capacity and can be repurposed for grid services such as frequency regulation, power smoothing, and peak shaving, thus lowering the ecological footprint of storage systems.
In contrast, this study excludes diesel generation and large-scale battery storage. The system maintains stability by relying on the existing grid connection and the complementary generation of solar and wind resources. This approach reduces capital costs, avoids environmental problems linked to diesel fuel and battery disposal, and demonstrates that high renewable penetration is possible without backup power. While previous work confirms the general viability of hybrid systems, very few studies consider regions dependent on imported hydropower and exposed to tariff risks. This study addresses that gap for Newfoundland and Labrador by applying HOMER Pro to optimize system size, site selection, and load assessment with community-specific data [
22]. The analysis also evaluates tariff sensitivity, financial sustainability, and the long-term technical viability of a community-scale solar–wind system without battery storage.
This study applies a grid-tied techno-economic design approach to the case of L’Anse au Loup and presents a methodology that also applies to other remote or coastal communities with similar conditions. The literature shows that most hybrid renewable studies still rely on diesel or large-scale batteries, leaving a gap in assessing grid-tied systems that achieve high renewable penetration without these components. To close this gap, we develop a framework that integrates measured wind and solar resources with community demand data and evaluates tariff sensitivity, financial sustainability, and system performance using HOMER Pro [
8,
9]. While the analysis focuses on Newfoundland and Labrador, the methodology remains transferable and provides insights for policymakers, utilities, and stakeholders planning sustainable energy transitions [
22].
2. Methodology
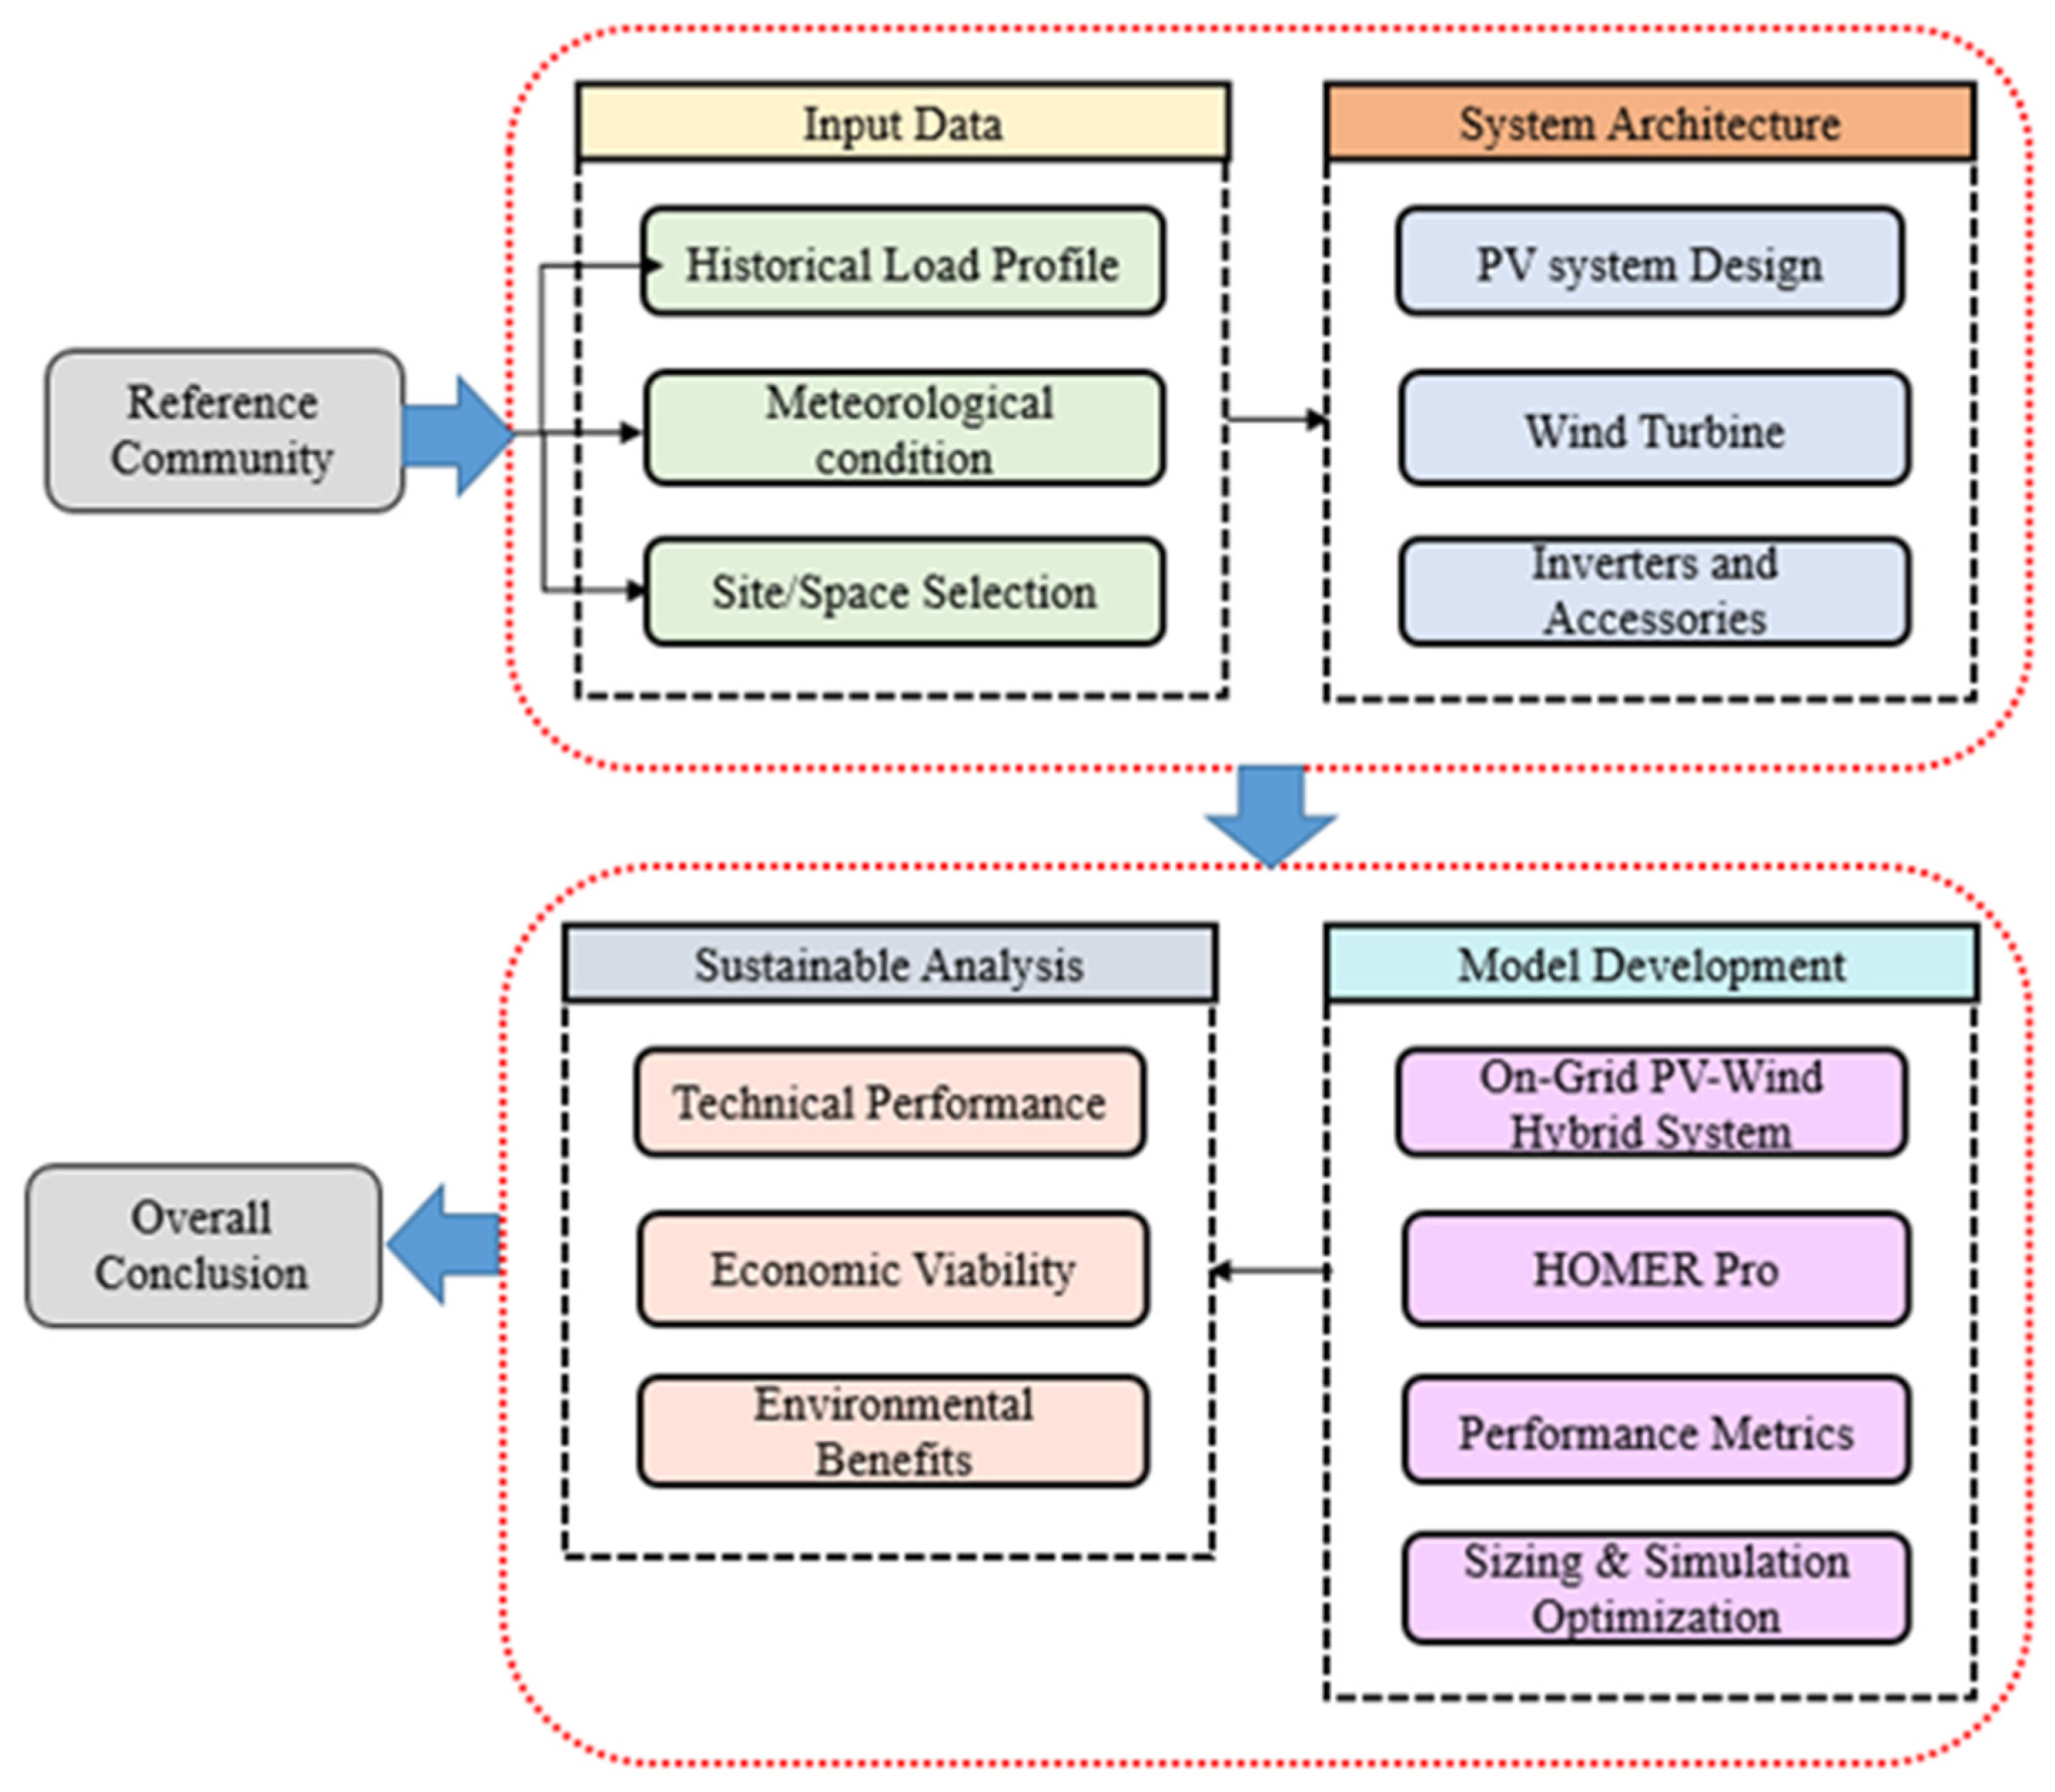
This section outlines a generalized methodology for designing and evaluating grid-tied PV–wind hybrid systems.
Section 3 applies this framework to the case study community.
2.1. Data Collection
The methodology begins with selecting the reference community and gathering local input data. The study collects historical load profiles, meteorological records, and site information to establish the baseline for system design. These datasets guide demand modeling and align renewable resources with community needs.
2.2. System and Model Development
The collected data guide the system architecture’s design, including the PV array, wind turbines, and required inverters and accessories. The study then develops the model in HOMER Pro through four steps: performance modeling, load characterization, resource assessment with system sizing, and simulation-based optimization. The model builds an on-grid PV–wind hybrid system, applies performance metrics, and compares configurations to identify the most reliable and cost-effective design.
2.3. Sustainability Analysis
The simulation results are analyzed to assess technical performance, economic viability, and environmental benefits. The study evaluates system cost, efficiency, long-term sustainability, and community impact.
Figure 2 summarizes the overall process, from data collection to subsystem modeling and sustainability assessment, showing how each stage contributes to the study’s conclusions.
2.4. Load Characterization
The first step is to measure the energy demand of the community. If
represents the total average demand in Kilowatts, the daily and annual requirements can be defined as [
23]:
The load demand is allocated between PV and the wind resources using two factors,
and
, such that
= 1. The respective daily contributions from PV and wind are expressed as
This separation ensures that each subsystem is designed to meet its designated share of the demand.
2.5. Photovoltaic Subsystem Modeling
Capacity sizing and hourly performance estimation were the two phases of the PV subsystem modeling process.
2.5.1. Capacity Sizing
Using the peak-sun-hours approach, which divides the daily PV energy demand by the product of average solar hours and the performance ratio, the installed PV capacity was approximated [
24]:
Here,
H is the average daily peak-sun hours (h/day), and the performance ratio that accounts for wiring, inverter, and other system losses, typically ranging between 0.70 and 0.85 [
24]. If each PV module has a rated power
and a surface area
then the number of required modules and the effective array footprint can be expressed as
To account for spacing, tilt, and maintenance access, the actual land requirement is usually taken as two to three times the module area [
25]
2.5.2. Photovoltaic Performance Modeling (Hourly)
Incident solar radiation on the PV array is estimated using the HDKR model (Hay, Davies, Klucher, Reindl), which is widely applied for transposing horizontal irradiance data onto tilted or tracked planes [
26]. The array was considered to function under dual-axis tracking in this study, which enables the modules to continually optimize incident irradiance by aligning with the sun. Tracking corrections were therefore applied to the HDKR outputs following standard practice [
23].
The corrected PV power output was then modeled using the widely adopted temperature-adjusted performance expression [
27]:
In this formulation,
denotes the rated capacity of the PV array under Standard Test Conditions (kW), and
represents a derating factor that accounts for shading, soiling, and mismatch losses.
(
t) is the solar irradiance incident on the PV array under real conditions (kW/m
2), while
corresponds to the irradiance at STC (1000 W/m
2, 25 °C, AM1.5 spectrum) [
27]. The coefficient
is the negative temperature coefficient of the module, expressed as a percentage change in output per degree Celsius.
is the operating cell temperature, while
= 25 °C is the reference cell temperature under STC. This performance model captures both irradiance variability and temperature-induced derating, which are critical for reliable PV system simulation [
28].
Modelling the hourly cell temperature using the Nominal Operating Cell Temperature (NOCT) relation [
27]:
where
is the solar irradiance (W/m
2) and
is the ambient temperature (°C). The
datasheet parameter (usually set at ~45 °C) is specified for 800 W/m
2 of irradiance, 20 °C ambient air, 1 m/s wind, and open rack installation [
27].
The corresponding hourly PV output is then
The model scales the rated PV capacity at Standard Test Conditions (
) by the ratio of instantaneous irradiance
to the STC reference value (1000 W/m
2). A temperature correction term accounts for performance changes: output decreases in proportion to the module’s temperature coefficient (
) when the cell temperature
exceeds 25 °C, and increases when it is lower. Additional system-level losses, including soiling, wiring resistance, and inverter inefficiencies, are represented by the derating factor
[
23,
27]. Additional system-level losses, including soiling, wiring resistance, and inverter inefficiencies, are represented by the derating factor
. Once the instantaneous PV output
is defined, the total PV energy yield over the simulation horizon can be obtained by integrating the hourly values. This provides the long-term estimate of PV production:
where Δ
t is the time step (1 h in this investigation) and
(
t) is the AC output at time
t. This integration provides an accurate estimate of long-term PV production, capturing both seasonal and daily fluctuations in temperature and irradiance [
25].
2.6. Wind Subsystem Modeling
The wind subsystem model uses annual energy sizing and hourly turbine performance modeling.
2.6.1. Wind Energy Sizing
The annual wind energy requirement is determined from the daily allocation as
The annual energy Output of a wind turbine rated at
can be expressed as
where
is the turbine Capacity factor, derived from the site–specific wind profile and the manufacturer’s power curve [
29]. The number of turbines required to satisfy the annual wind energy demand is therefore
2.6.2. Wind Speed and Power Corrections
The power generated by wind turbines was determined using a three-step procedure in this study. Firstly, the wind speed at the hub height was calculated from measured values at an anemometer height. This was attained by relating the logarithmic wind profile, which corrects for differences in height and surface roughness conditions [
30]. The hub-height wind speed was calculated as:
where
represents the wind speed at the hub height in meters per second (m/s), and
represents the wind speed at the anemometer height in m/s.
and
represent the surface roughness length, the anemometer height, and the hub height, respectively.
Second, the manufacturer’s power curve was used to estimate the turbine power output at each wind speed under typical air density circumstances. Lastly, to better represent site-specific meteorological circumstances, this power was adjusted for actual differences in air density [
31]:
where
is the corrected turbine power output (kW),
is the rated turbine power curve at the standard air density (kW),
is the actual air density (kg/m
3), and
= 1.225 kg/m
3 is the standard air density.
Finally, the annual energy from all turbines is obtained by combining the turbine output that has been adjusted for density throughout all time steps [
32]:
where
is the time step (1 h). This three-step approach (hub-height correction, power curve adjustment, and time-resolved yields) ensures a realistic estimate of wind turbine performance at the chosen site.
2.7. Grid Interaction and Reliability Metrics
The net load balance at each hour is [
32]:
where
is the community demand,
is the AC output from PV, and
is the AC output from all turbines. Imports cover shortfalls up to the maximum limit
, while surplus generation beyond
is curtailed.
System reliability was measured by the Unserved Energy Fraction (UEF) [
33]:
This metric quantifies the share of demand that is not met by available generation and grid imports [
33].
And curtailment was evaluated with the curtailment Ratio (
). Curtailment is quantified as the share of renewable generation that cannot be exported to the grid due to the export limit
:
The summations are evaluated over the entire simulation period (one year, with hourly resolution). These Metrics quantify reliability and efficiency under intermittency.
The methodology starts by characterizing the community load and available renewable resources, then developing PV and wind generation models. The PV model calculates output from irradiance data, derating factors, and temperature corrections. The wind model calculates generation from hub-height wind speeds, density adjustments, and hourly yields. The outputs of both subsystems feed into system-level metrics that measure net load balance, unserved energy, and curtailment. This process links local data, subsystem models, and performance indicators to assess the feasibility of the proposed hybrid system.
2.8. Site Selection Framework
Selecting suitable sites is critical in designing grid-tied PV–wind hybrid systems, as location strongly influences long-term sustainability, system reliability, and technical performance [
34]. To ensure transparency, we adopt a generalized multi-criteria evaluation framework, consistent with established practice in renewable energy siting [
35,
36]. For a set of n candidate sites, we define m evaluation parameters that capture technical, economic, and environmental aspects. We score each parameter on a standardized Likert scale (1 = least suitable, 5 = most suitable) and assign weighting factors according to relative importance. We then aggregate the weighted scores into a composite index, which enables systematic comparison and ranking of alternatives [
34].
The procedure follows three phases. First, we calculate the required land area from the system size, accounting for the footprint of PV arrays and the spacing of wind turbines [
25]. We also consider provisions for access roads, safety setbacks, and maintenance [
35]. Second, the evaluation of suitable sites follows a set of logistical and technological criteria, including geographic location, ease of access, wind resource availability, solar exposure, and proximity to power lines or substations [
36]. Environmental and regulatory factors, such as land-use restrictions and protected zones, are also taken into account [
37].
Each potential site is then assessed using a multi-criteria ranking framework that scores locations based on land availability, scalability, infrastructure cost, and environmental impact [
38,
39]. This ranking process ensures that the selected site meets spatial and technical requirements, minimizes challenges related to grid integration, and supports future system expansion.
2.9. Key Performance Indicators
The evaluation of the grid-connected PV–wind hybrid system relied on a framework of Key Performance Indicators (KPIs) that captured technical reliability and economic feasibility. These indicators followed established practices in hybrid renewable energy studies [
40,
41,
42].
The Capacity Factor (CF) measures how efficiently each generation unit operated compared to its rated capacity, which follows the expression:
where
is the annual energy output (kWh) and
is the installed capacity (kW). Higher CF values indicated more effective utilization of PV and wind installations.
The Annual Renewable Generation combined the contributions from PV and wind subsystems:
where
and
are the annual PV and wind outputs (kWh/yr). Reporting this value allowed direct comparison between renewable production and demand.
The Renewable Fraction (RF) quantified the proportion of annual demand met by renewable sources:
where
is the renewable energy delivered to the load and
is the total annual demand (kWh/yr). Because the absence of storage meant part of the renewable generation was exported, RF alone did not fully represent local consumption. To capture this aspect, the Self-Sufficiency Ratio (SSR) was introduced:
where
is the renewable energy directly consumed by the community. A small difference between RF and SSR suggested good alignment between production and demand, while a large difference indicated greater reliance on exports.
Two further technical indicators addressed the balance between generation and demand. The Excess Electricity (EE) expressed the share of production that exceeded local demand:
where
is the annual excess generation. The Unmet Load (UL) measured the fraction of demand not served by the hybrid system:
where
is the unmet load (kWh/yr) and
is the total annual essential load (kWh/yr). Low UL values confirmed a more reliable supply.
Economic performance was assessed using long-term cost metrics. The Net Present Cost (NPC) represented the discounted value of all project costs over the lifetime:
where
is the cost in year
,
is the discount rate, and
is the project lifetime. The Levelized Cost of Energy (LCOE) reflected the average cost of electricity:
where
is the annualized cost of the system and
is the total yearly energy output.
The Internal Rate of Return (IRR) identifies the discount rate that reduces the NPC to zero. It uses the condition:
where
is the net cash flow in year
and
is the analysis horizon.
The Return on Investment (ROI) expresses the ratio of net profit to the initial investment:
where
denotes the capital cost of installation.
The Payback Period evaluates how quickly an investment recovers its cost. The Simple Payback Period (SPB) follows:
While the Discounted Payback Period (DPB) considers the time value of money:
where
represents an incremental investment in year
,
is annual savings, and
is the discount rate.
Finally, the Total Life Cycle Cost (TLCC) aggregates all costs incurred across the analysis period:
where
denotes costs in year
,
is the analysis period, and
is the annual discount rate. TLCC provides a comprehensive cost benchmark for comparing alternatives.
Together, these indicators—
,
,
,
,
,
,
,
,
,
,
,
, and
—formed a coherent evaluation framework. This combination ensured that both technical performance and financial feasibility were rigorously assessed, consistent with hybrid energy system evaluation methods reported in the literature [
40,
41,
42].
2.10. Simulation and Optimization
Once the photovoltaic and wind subsystems were defined in HOMER Pro, the balance-of-system components, including converters, inverters, and grid connections, were added. In order to reflect intra-day and seasonal variability, the model included normalized community demand profiles and 8760-h time-series meteorological inputs, including temperature, wind speed, and irradiance.
HOMER Pro’s optimization engine tries several setups by adjusting the number of wind turbines, PV capacity, and inverter size (including DC/AC ratios). Dynamic dispatch algorithms balance curtailment, grid imports, and renewable energy while simulating every configuration. Through curtailment and unmet load limitations, the goal is to reduce the Net Present Cost (NPC) while maintaining technical dependability [
43].
Three areas comprise the main modeling outputs: environmental (avoided emissions), economic (Net Present Cost, NPC; Levelized Cost of Energy, LCOE), and technical (renewable penetration, yearly generation, capacity factors) [
44]. A thorough evaluation of the hybrid system’s sustainability is based on these outputs.
3. Case Study of L’Anse Au Loup
3.1. Case Study Inputs-L’Anse-Au-Loup
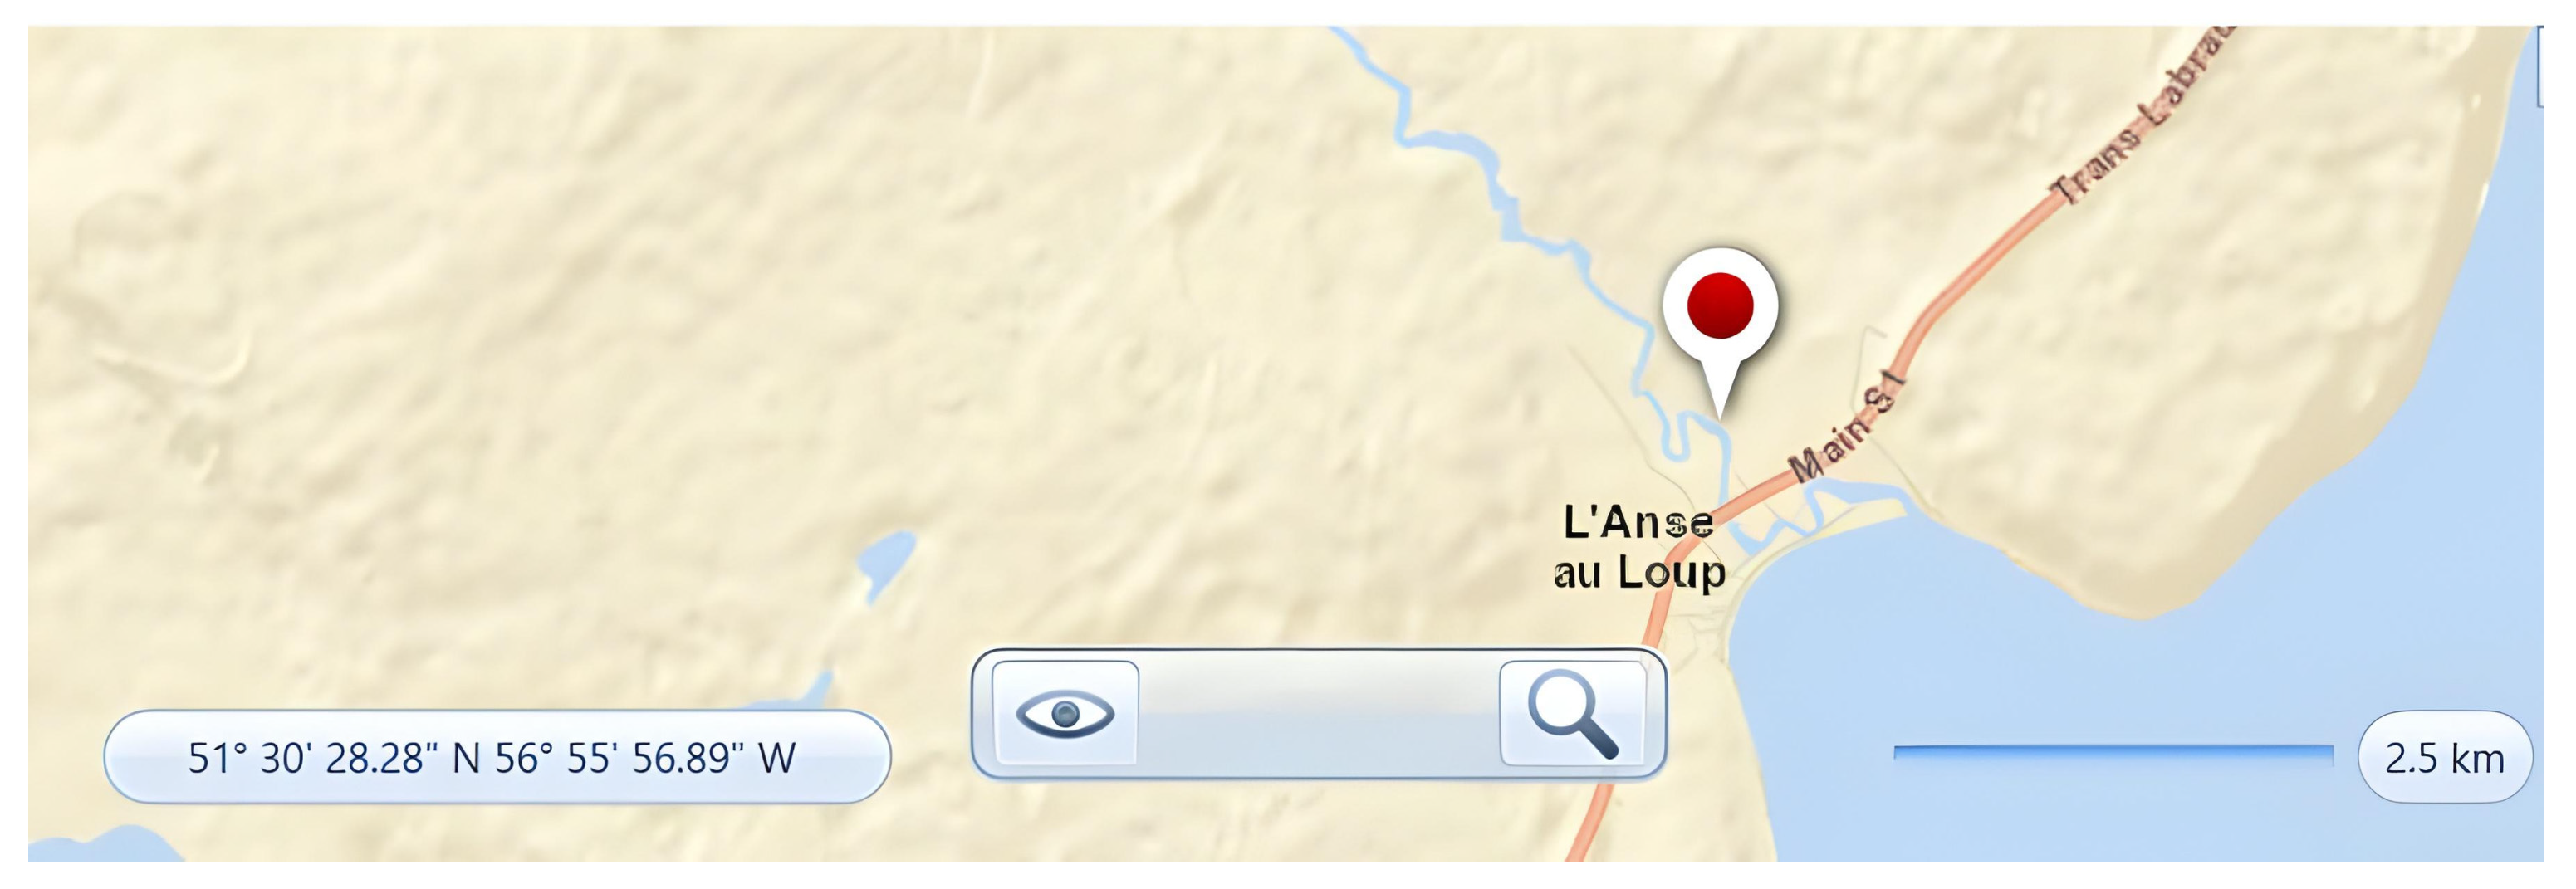
The study applies the methodology to L’Anse-au-Loup, a coastal community in southern Labrador, Newfoundland and Labrador (51.526° N, –56.834° W) [
2]. The area experiences a cold maritime climate with strong seasonal fluctuations, which makes it an appropriate location for testing a hybrid PV–wind–grid energy system.
Researchers gathered meteorological data from validated databases, including Environment Canada, NASA POWER, the National Renewable Energy Laboratory (NREL), and The Weather Network. They processed these datasets into monthly averages, which covered solar irradiance, clearness index, wind speed, and ambient temperature [
45,
46,
47].
Table 1 summarizes the results, showing an annual mean daily solar radiation of 3.11 kWh/m
2/day and average wind speeds of about 5.3 m/s. Seasonal differences stand out: spring and summer provide higher solar availability, while winter months combine lower solar input with stronger winds. Average temperatures range from –14.2 °C in January to 18 °C in July, reflecting the harsh conditions under which the energy system must operate [
45,
46,
47].
3.2. L’Anse Au Loup Community Load Information
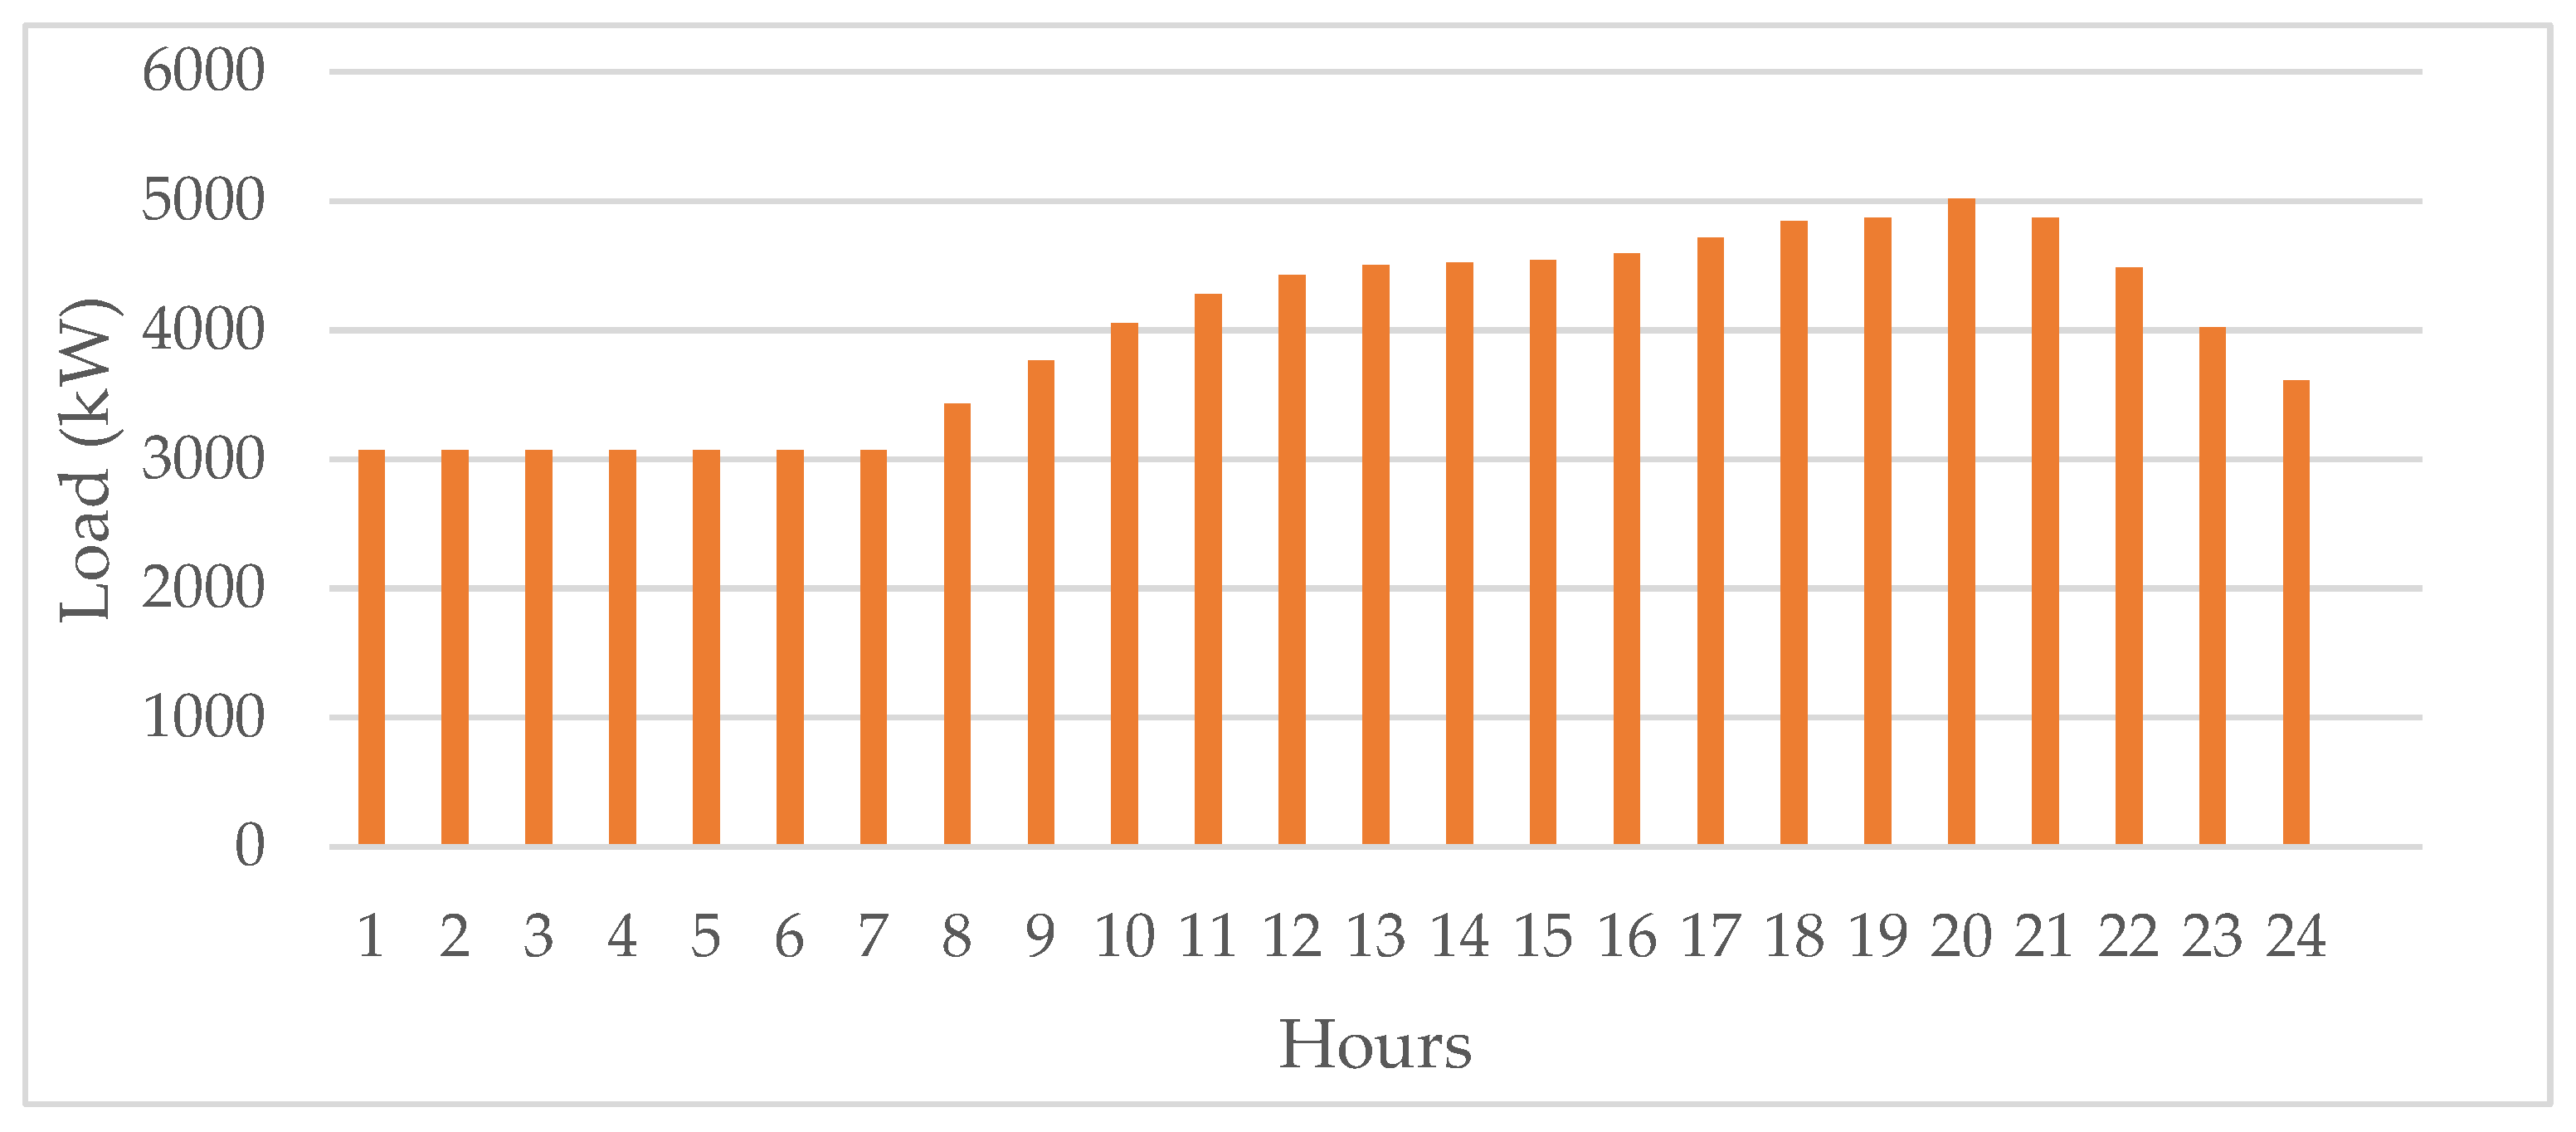
The system analysis uses hourly and monthly load profiles of the L’Anse au Loup region to capture both short-term variations and seasonal demand patterns. The community consumes on average 4000 kW daily, corresponding to about 96,000 kWh of electricity per day, which serves as the baseline input for HOMER Pro simulations [
2]. These profiles ensure the designed hybrid renewable system can meet peak and average loads throughout the year.
Figure 3 presents the annual average hourly load profile of the community. The curve represents the mean hourly demand averaged across all 365 days of the year, rather than the load of a single day. Each point, such as Hour 1, represents the average of all values recorded at that hour from January through December. The profile shows demand remaining steady most of the day before rising sharply in the evening, exceeding 5000 kW between 19:00 and 20:00 due to heating, lighting, and appliance use. Early morning hours show the lowest demand, reflecting reduced residential activity [
2].
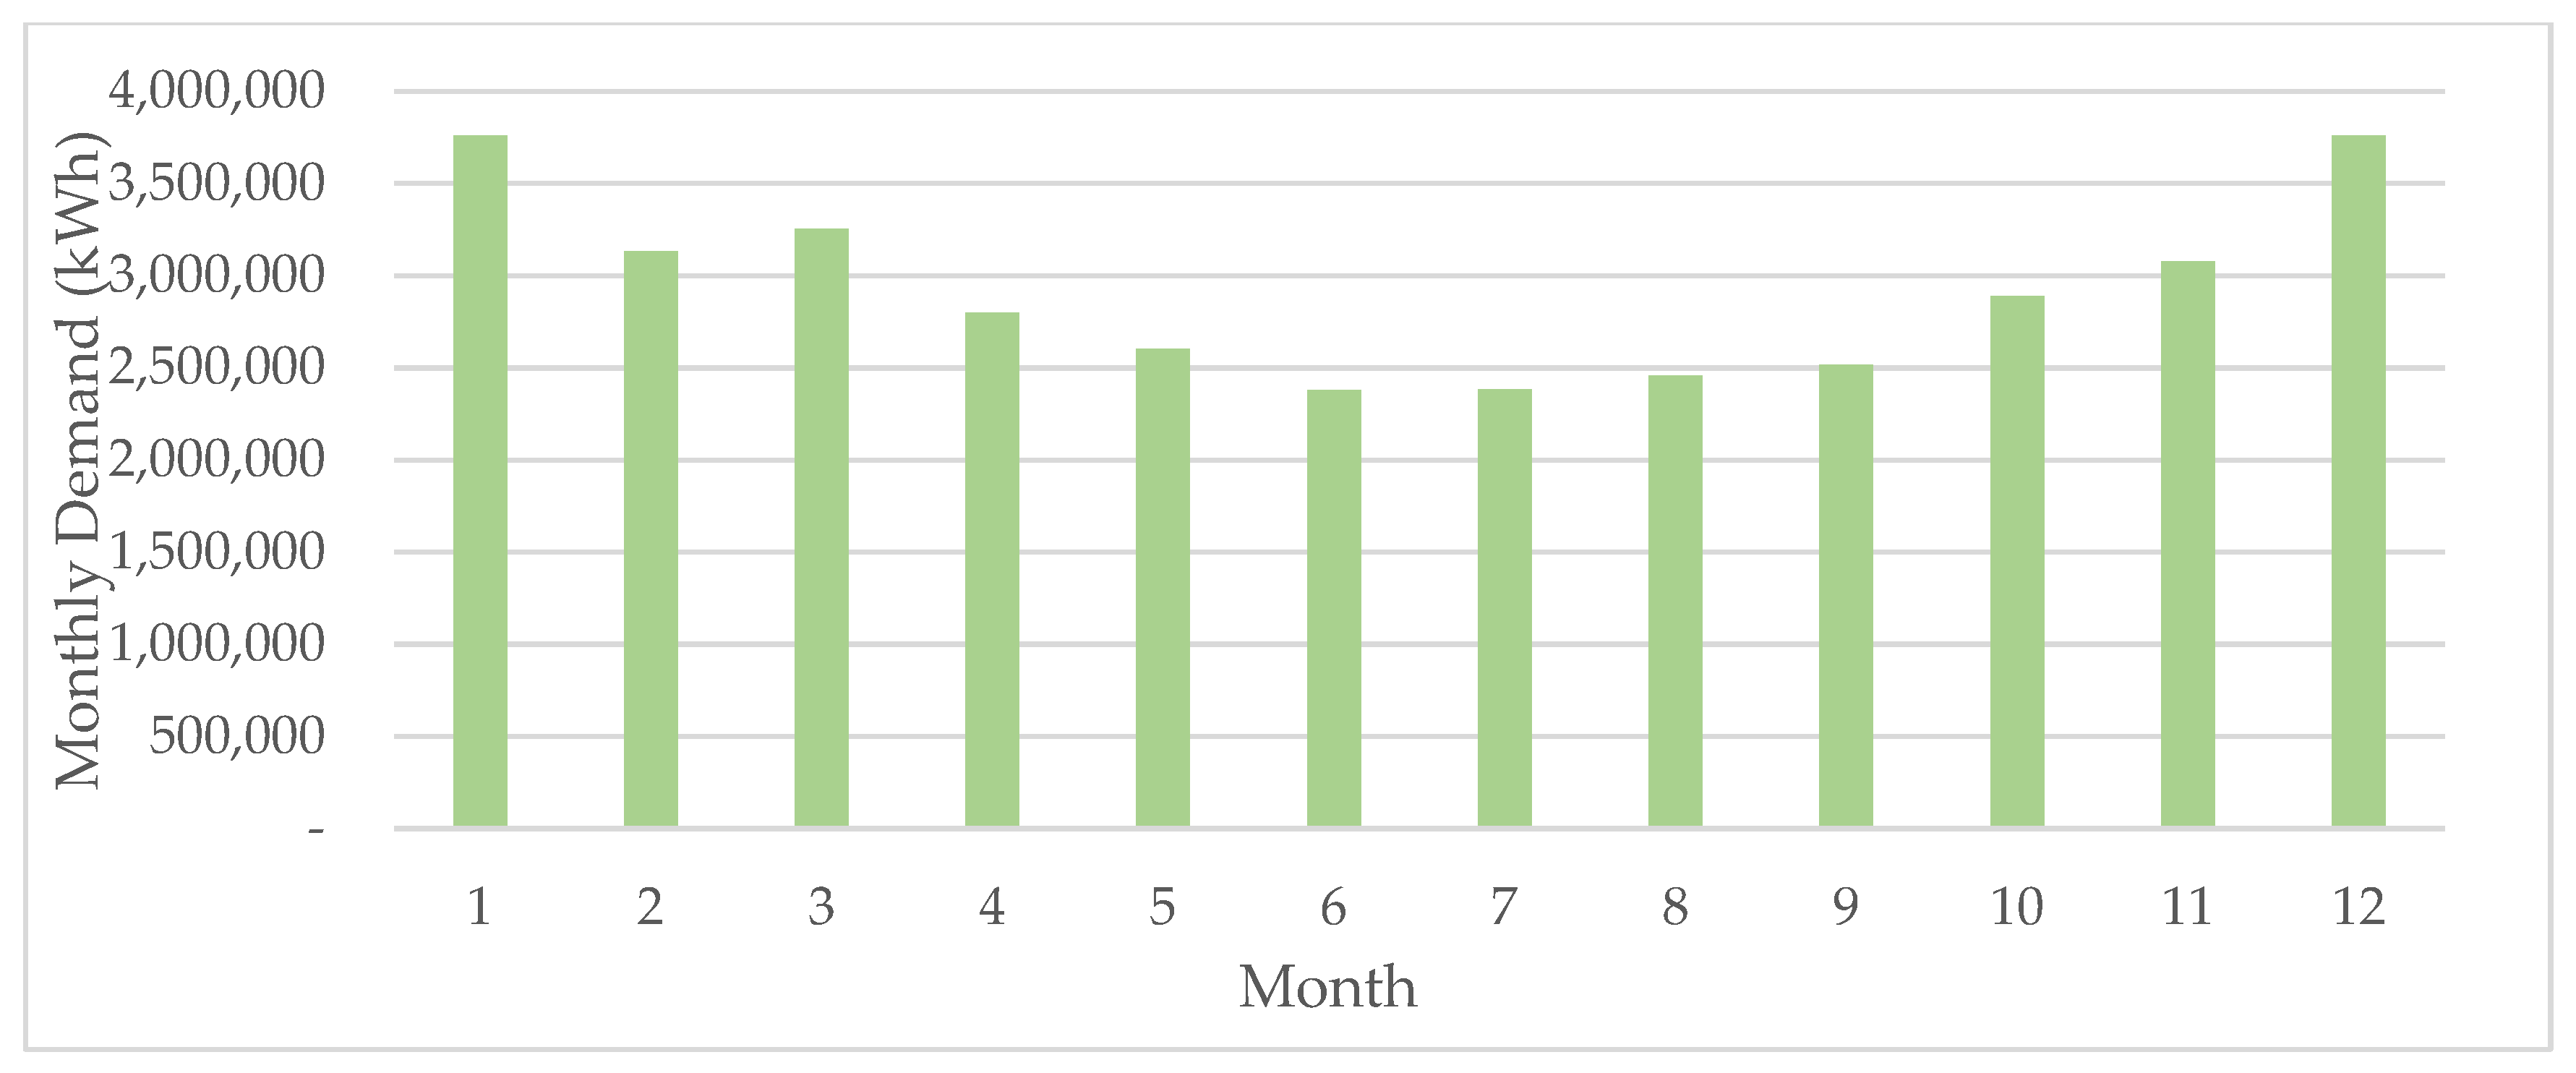
Figure 4 shows the monthly electricity demand. Consumption peaks in January and December at more than 3.7 GWh, driven by high heating requirements, while it falls below 2.5 GWh during summer months such as June and July. These seasonal differences underline the strong influence of climate on community demand and the importance of evaluating system performance under varying seasonal conditions.
The hourly and monthly load profiles provide the baseline for system sizing, component selection, and economic analysis. This dual representation ensures that the PV–wind–grid configuration is tested against both daily fluctuations and long-term seasonal extremes, strengthening the reliability of the design.
3.3. Photovoltaic System Calculation
The daily community demand is:
The average power demand is:
The corresponding annual energy demand is:
Assuming PV contribution, the PV system is estimated to supply approximately 55% of the total daily demand:
The PV system capacity is calculated using the peak-sun hours method:
here:
is the equivalent peak-sun hours,
PR = 0.75 is the performance ratio.
The peak-sun-hour method indicates a theoretical PV capacity requirement of 22.7 MWp. However, the subsequent HOMER Pro optimization process refined this estimate, determining that an installed capacity of 16 MWp provides the most cost-effective configuration. This optimized capacity achieves a balanced trade-off between renewable penetration, land use, and net present cost.
The corresponding capacity factor is:
The number of PV modules required is:
Area Required for Solar Installation
Considering spacing, tilt, and access, the actual land requirement is estimated at 3 times the module area
3.4. Wind Energy System Sizing Calculation
Assuming wind contribution, the wind turbines are estimated to supply approximately 45% of the total daily demand:
From the monthly wind speed profile (
Figure 5) at L’Anse au Loup:
Calculate the required installed wind capacity:
The wind subsystem was initially sized to contribute about 45% of the total daily demand, equivalent to 11 units of 660 kW turbines. However, HOMER Pro optimization selected 8 units as the most cost-effective configuration, achieving a balanced trade-off between renewable penetration, land use, and net present cost.
Using a Conservative Spacing guideline of 5D cross-wind ×10D down-wind per turbine (rotor diameter D = 47 m).
Area required for Wind turbine Installation
Total Area Required for PV–Wind Hybrid Installation
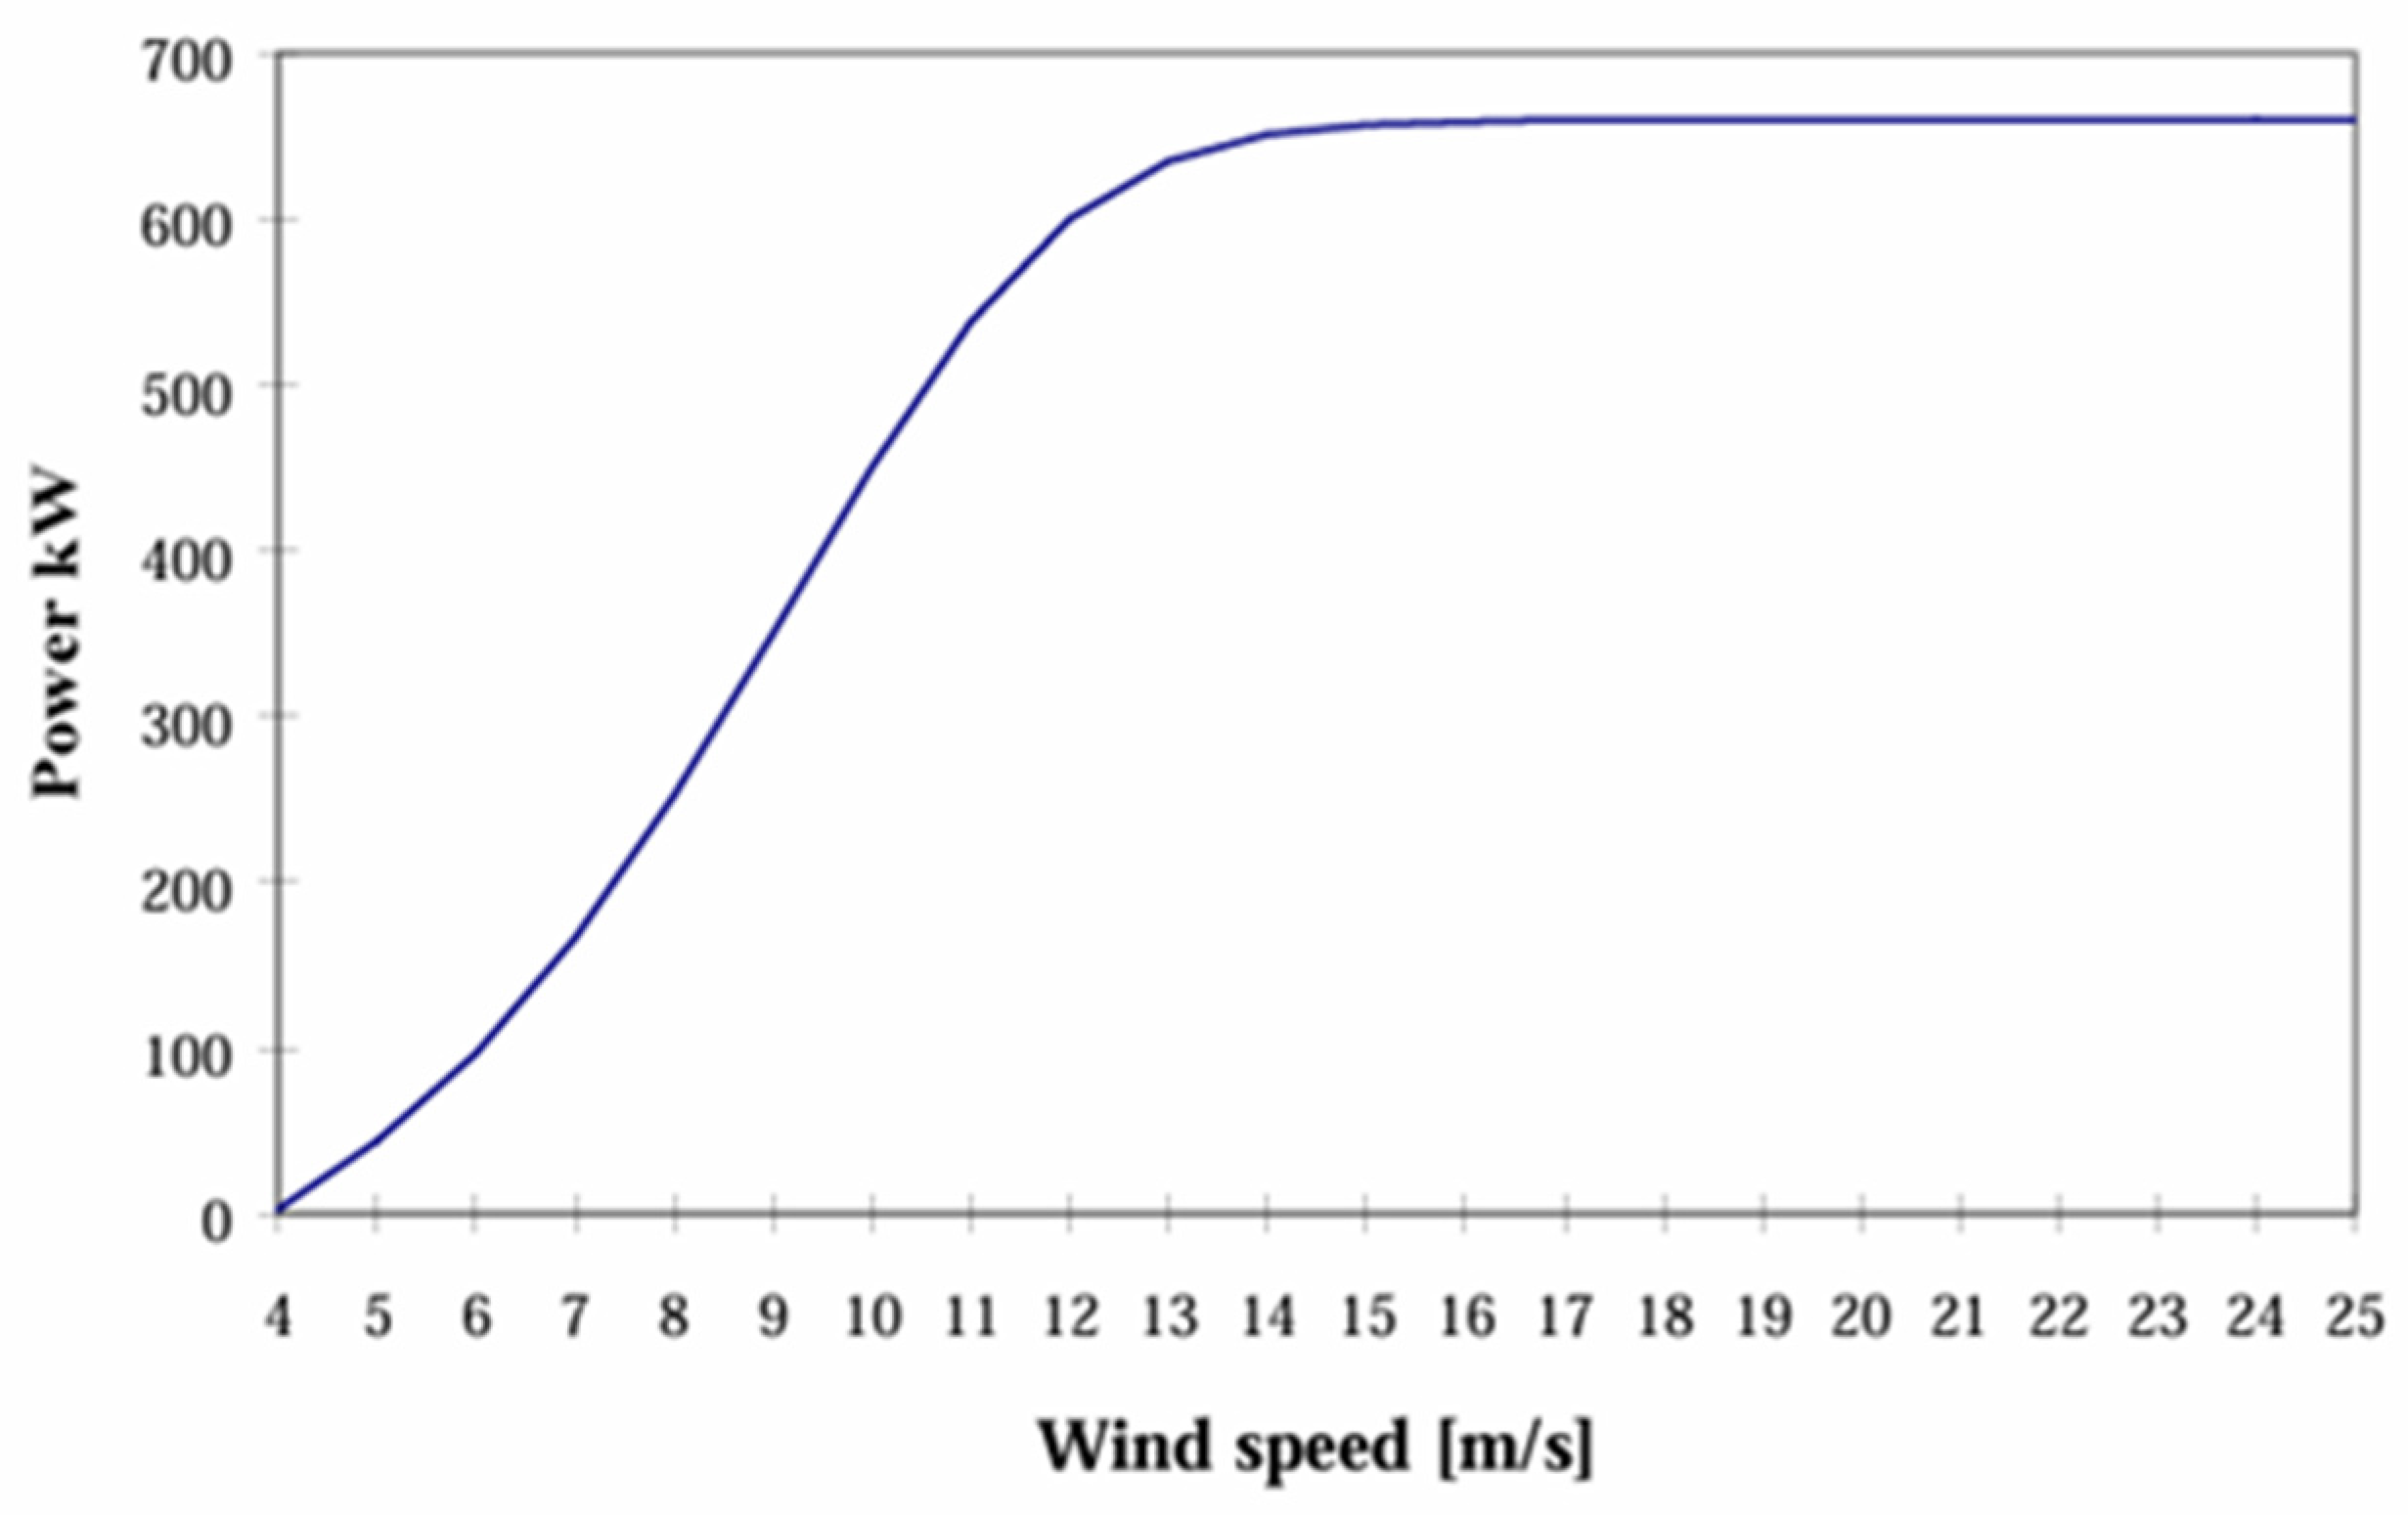
The selected wind turbine’s power curve illustrates how electrical output changes with wind speed. The turbine produces between 20 and 50 kW at a cut-in speed of around 4 m/s. After that, output increases quickly as wind velocity increases. It would be feasible to generate about 150 kW at 6 m/s, 350 kW at 8 m/s, and 550 kW at 10 m/s. The generation stabilizes at around 12 m/s, and the rated capacity of 660 kW is maintained up to roughly 20 m/s. The turbine uses control systems to limit production beyond this range and shuts down to safeguard its components at the cut-out speed of 25 m/s. This characteristic curve is essential for predicting site-specific energy yield, as it directly links local wind conditions to potential electricity generation [
48].
3.5. Site Selection
The proper site selection is crucial for grid-tied hybrid solar–wind energy system installation to maximize energy output, ensure system sustainability, and integrate with existing infrastructure. The planned system is designed to fulfil L’Anse au Loup’s daily energy consumption of 96,000 kWh, with 45% coming from wind turbines and 55% coming from solar PV, needing approximately 1.60 km
2.
Figure 6 shows three potential locations analyzed based on environmental constraints, shade, proximity to the substation, land availability, and resource potential.
Option 1, next to the existing diesel plant & Substation, offers cheap transmission costs and reasonable grid proximity. However, with only 0.10–0.15 km2 land area is insufficient for the necessary distances between turbines and solar arrays. Aside from potential land-use disputes and restricted scalability, the location is surrounded by infrastructure, which makes it more appropriate for pilot or auxiliary installations than full-scale deployment.
Option 2, which is located north of the community, is the most promising location for hybrid deployment. An expansive location that surpasses the 1.59 km2 threshold. The most practical option has minimal environmental concerns and favorable exposure to both solar and wind resources. Scalability, shared maintenance access, and little regulatory friction outweigh the primary trade-off of the requirement for 2–3 km of transmission infrastructure.
Option 3, which is situated along the southern coast, provides the best solar irradiance levels and the least shade, making it perfect for photovoltaic performance. However, several legal and licensing obstacles exist because of its placement in environmentally sensitive coastal areas, particularly when installing wind turbines. Coastal land-use regulations, the preservation of marine habitat, and the possibility of public resistance may cause delays or limitations in development in this area.
The potential sites were evaluated in the final stage using a multi-criteria approach, as shown in
Table 2, which looked at environmental impact, scalability, infrastructure cost, and land availability. Option 2, north of L’Anse au Loup, stood out when this method was used in the case study. It combines a feasible grid connection, decent resource exposure, and the area required for both solar and wind. These benefits make it the most compelling option, demonstrating that the chosen location can sustain a dependable and reasonably priced hybrid renewable energy system for the neighborhood.
3.6. System Simulation and Performance Analysis
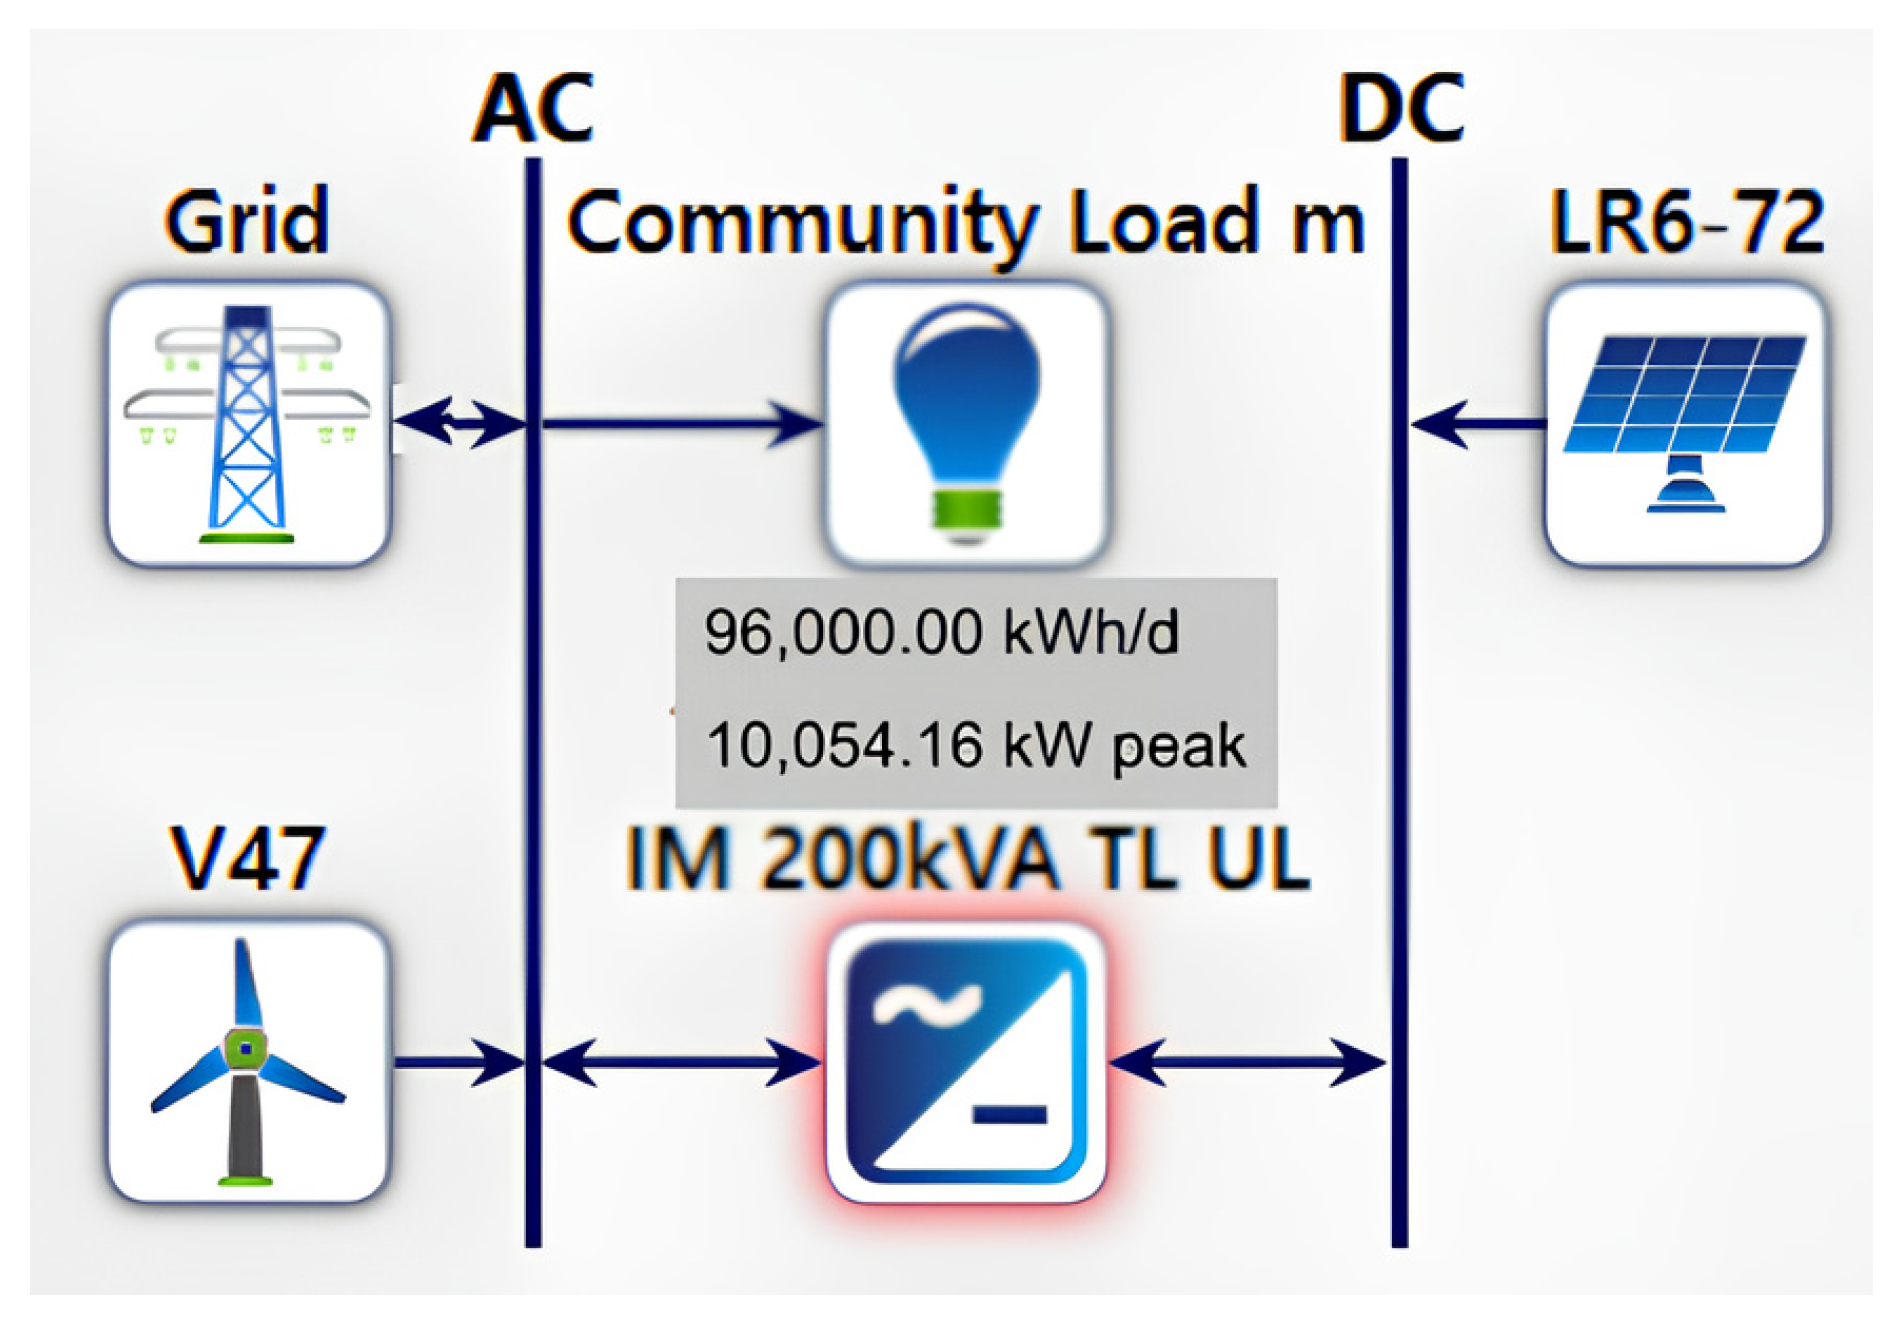
The proposed hybrid energy system for L’Anse au Loup (
Figure 7 and
Figure 8) combines solar photovoltaic (PV), wind turbines, and the utility grid through a coordinated AC–DC interface. The system supplies an average daily load of 96,000 kWh and meets a peak demand of 10.05 MW. The community’s load factor, defined as the average to peak demand ratio, is approximately 40%, derived from the average demand of 4.0 MW compared to the peak of 10.05 MW. This low value reflects substantial seasonal variation driven mainly by winter heating needs and highlights the importance of balancing renewable generation with grid support to maintain a reliable supply.
The PV subsystem has an installed capacity of 16 MWp using crystalline silicon modules. It contributes about 55% of the community’s annual electricity demand, not the daily load. PV output varies with irradiance: generation can exceed the average load of 4–5 MW during midday, and surplus power is exported to the grid. In the evening, when demand peaks at about 5 MW between 19:00 and 21:00 (
Figure 3), solar output falls and the grid supplies the shortfall. Preliminary sizing using the peak-sun-hours method suggested 22.7 MWp (Equation (23)). However, HOMER Pro optimization set the installed capacity at 16 MWp as the most cost-effective configuration. The proposed PV subsystem employs dual-axis tracking crystalline silicon panels, selected because they provide 20–30% higher annual output than fixed-tilt systems [
49]. Standard panels convert 15–25% of incident light into electricity, while bifacial modules further increase efficiency by collecting light on both sides. A Smart Dual-Axis Tracking System (STS) uses light sensors and servomotors for continuous alignment, boosting power output by up to 19.7% compared with fixed panels. Seasonal simulations show that PV generation peaks in spring, while dual-axis tracking sustains production through the low-sun winter months [
50]. Total system losses from inverters, wiring, and environmental factors are about 19%.
The design assigns the wind subsystem to supply about 45% of the annual demand. Based on a daily share of 43,200 kWh, the annual requirement equals 15.77 GWh (Equation (28)). The average wind speed at 50 m hub height is 5.7 m/s, corresponding to a 26.5% capacity factor for the Vestas V47 turbine. Preliminary calculations indicated a total capacity requirement of 6.79 MW (≈11 turbines, Equations (29) and (30)). Land requirements based on 5D × 10D spacing equal about 1.21 km2 (Equation (31)). The V47 power curve shows production increasing from 20–50 kW at 4 m/s cut-in speed to 660 kW at rated speed, with automatic shutdown at 25 m/s. The analysis modeled the wind subsystem in HOMER Pro with a search space of 0 or 8 turbines. The optimization selected eight turbines (5.28 MW) as the most economical configuration, balancing renewable penetration, grid purchases, and net present cost while avoiding oversizing beyond demand needs.
A 200 kVA SUNSYS PCS2 IM inverter manages integration of PV and wind with the grid. The inverter converts DC from the PV system to AC, regulates voltage and frequency, and ensures full grid compatibility. It exports surplus electricity when available and imports power when renewable generation is insufficient. The coordinated operation of PV, wind, and grid sources improves supply stability and ensures continuous power delivery throughout the year.
System performance was evaluated using levelized energy cost (LCOE), net present cost (NPC), renewable fraction, and avoided emissions. The optimized design achieves a renewable fraction exceeding 70%, with annual generation closely matching the community’s total demand. The configuration reduces reliance on external grid supply, displaces fossil-based imports, and supports greenhouse-gas-reduction goals. Overall, the hybrid PV–wind–grid system for L’Anse au Loup is environmentally sustainable, economically viable, and technically feasible.
4. Results & Discussions
This study employs HOMER Pro to analyze the technical, economic, and environmental performance of a hybrid PV–wind–grid energy system designed for L’Anse au Loup under local climatic conditions. The evaluation focuses on the system’s ability to meet the community’s annual electricity demand of approximately 35 GWh while enhancing cost efficiency and supporting long-term sustainability. It further examines the performance of the photovoltaic array, wind turbines, and inverter. It provides detailed discussions on grid exchange behavior, economic viability, emission reduction potential, and the sensitivity of the optimal configuration to variations in cost and design parameters.
4.1. Technical Performance
4.1.1. Overall System Behavior
As summarized in
Table 3 the optimized configuration integrates a 16 MW
p photovoltaic array, eight Vestas V47 (660 kW) turbines totaling 5.28 MW, and the existing utility grid. The hybrid system achieves an annual renewable generation of ≈39 GWh, satisfying the community’s ≈ 35 GWh per year demand with a renewable penetration of ≈71.6%.
The hybrid system achieves a renewable share of about 70%. It records a net annual export of roughly 3 GWh, indicating that it can operate as a small net generator while maintaining a reliable power supply. The system runs continuously without storage, alternating between energy import and export according to seasonal changes in solar and wind resources.
Figure 9 shows the monthly electric production of the PV–wind–grid system, with higher renewable generation from March to September and increased grid imports during the winter months. This seasonal pattern reflects the system’s ability to balance variations in resource availability and is consistent with results reported for other grid-connected hybrid systems in coastal and northern regions [
51,
52].
4.1.2. Solar Photovoltaic Performance
The 16 MW
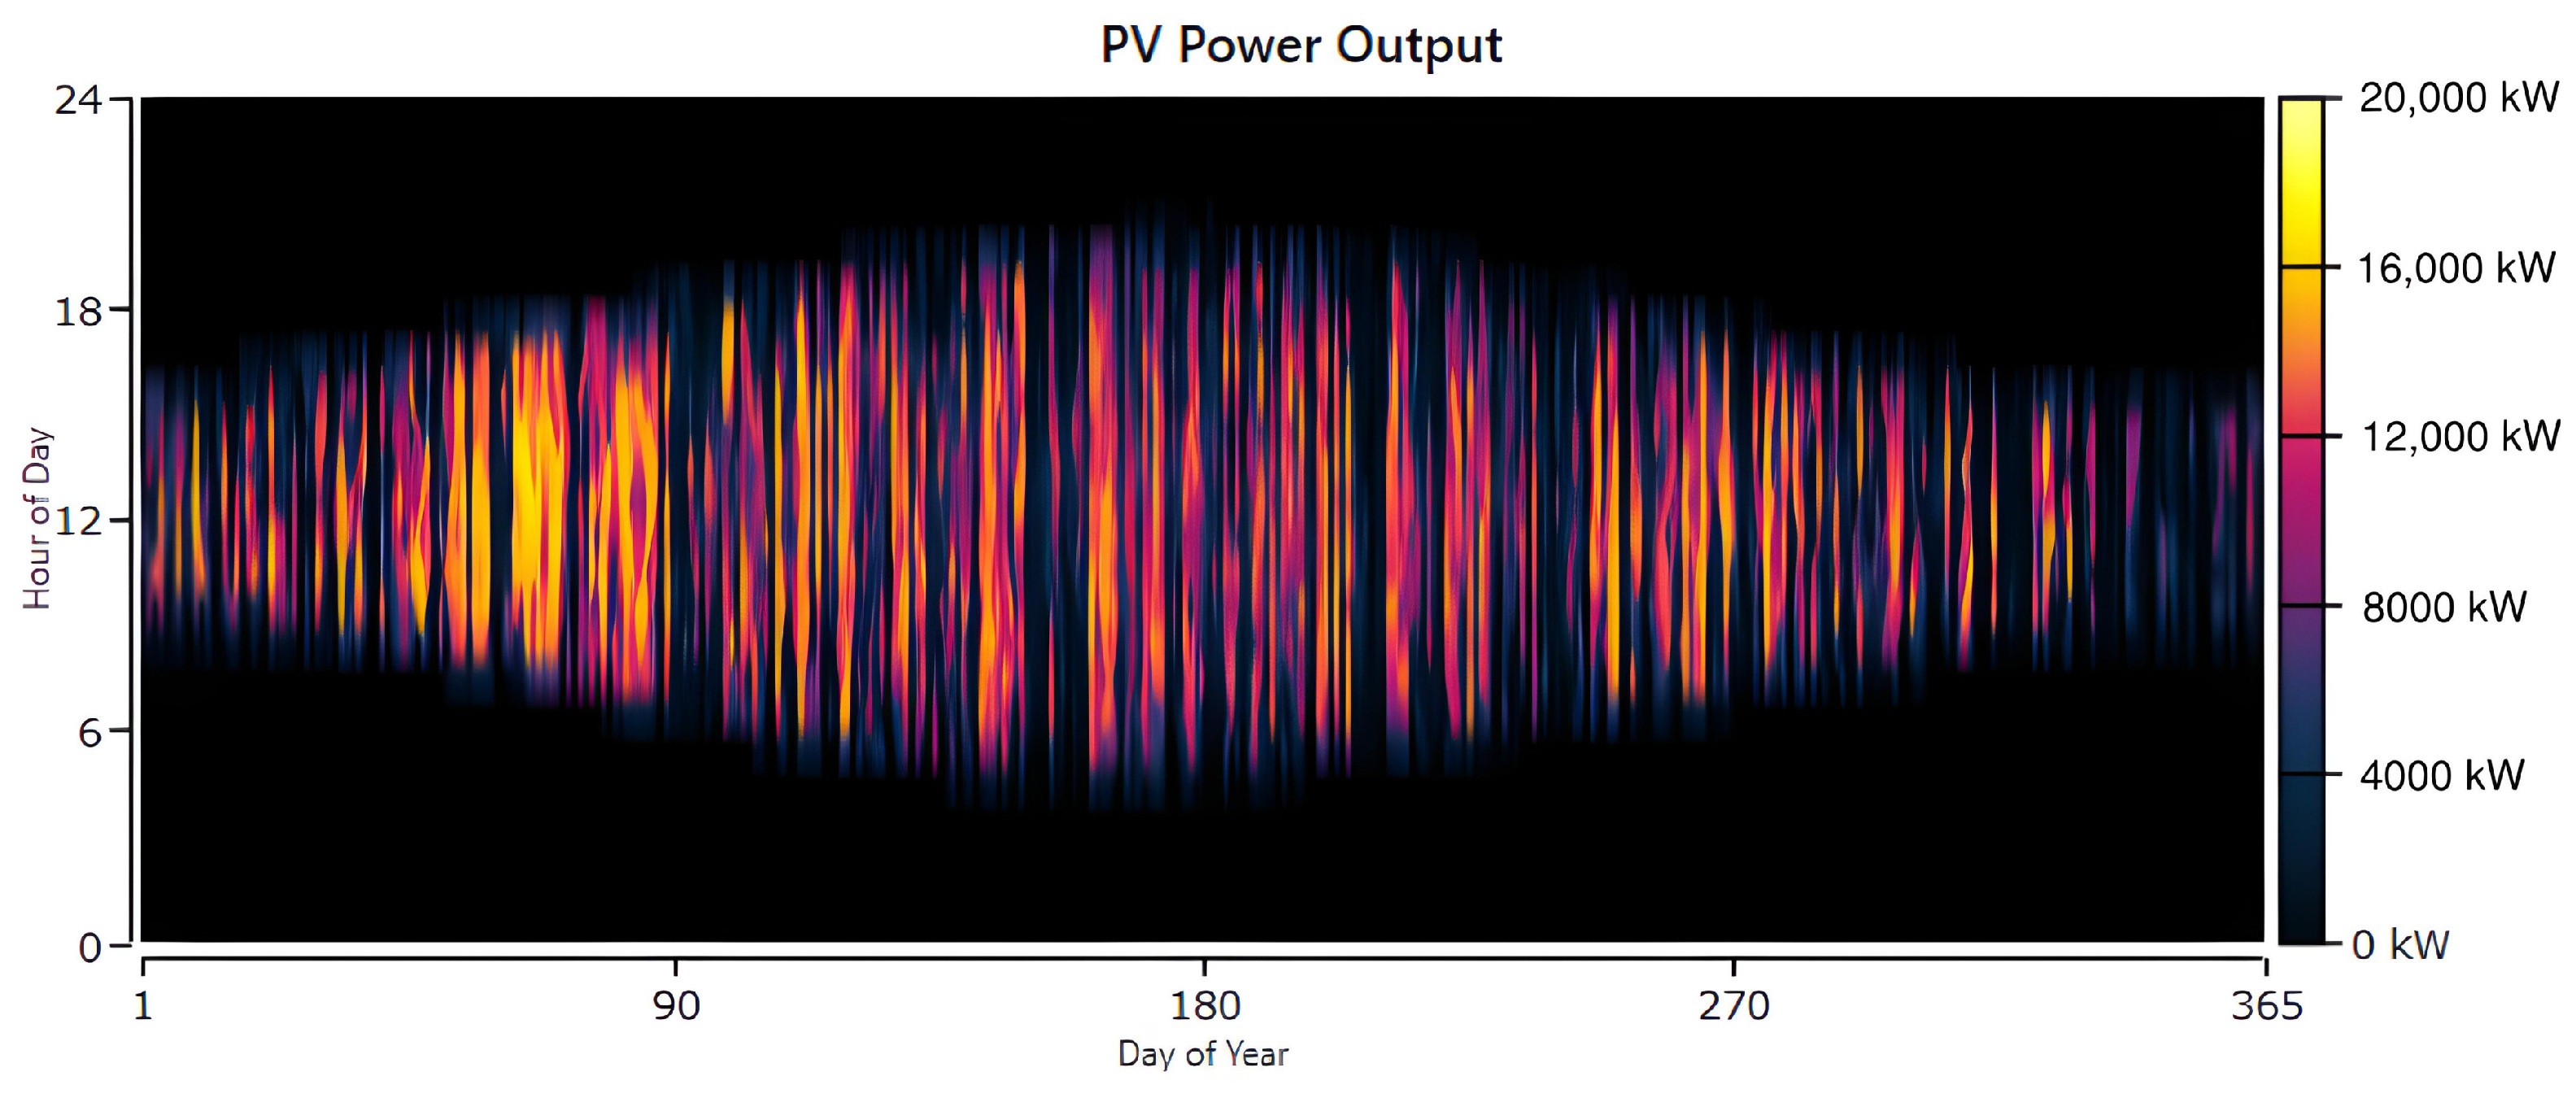
p photovoltaic array generates approximately 25.9 GWh per year, with an average output of 2.96 MW and a capacity factor of 18.5%. The annual PV power output profile (
Figure 10) indicates that the power production peaks between April and August, when solar irradiance and daylight duration reach their maximum. During these months, generation frequently exceeds the community load of 4–5 MW, resulting in mid-day electricity exports to the grid. In winter, solar production decreases, and the system imports limited energy from the grid to satisfy evening demand.
The dual-axis tracking configuration enhances winter generation and ensures consistent year-round utilization. The modeled capacity factor slightly surpasses the 17% theoretical estimate derived from peak-sun-hour data because HOMER Pro captures short, high-irradiance intervals that increase overall output. Overall, the PV subsystem contributes nearly two-thirds of total renewable generation and is the primary source of exported energy within the hybrid configuration.
While the photovoltaic array dominates power generation during the spring and summer months, wind power becomes the principal contributor in winter, maintaining supply continuity and improving the seasonal balance of the system.
4.1.3. Wind Turbine Performance
The wind subsystem comprises eight Vestas V47 turbines, each rated at 660 kW, providing a total installed capacity of 5.28 MW in the HOMER Pro model. The turbines are connected directly to the AC bus through dedicated controls and transformers. Using hourly site-specific wind data adjusted for air density and hub height, HOMER estimated an annual gross generation of 13.1 GWh, corresponding to a capacity factor of 28.3%, slightly higher than the 26.5% theoretical value derived from preliminary sizing. This difference arises because HOMER applies the whole turbine power curve to time-series wind data, capturing short, high-speed events that increase total yield.
As shown in
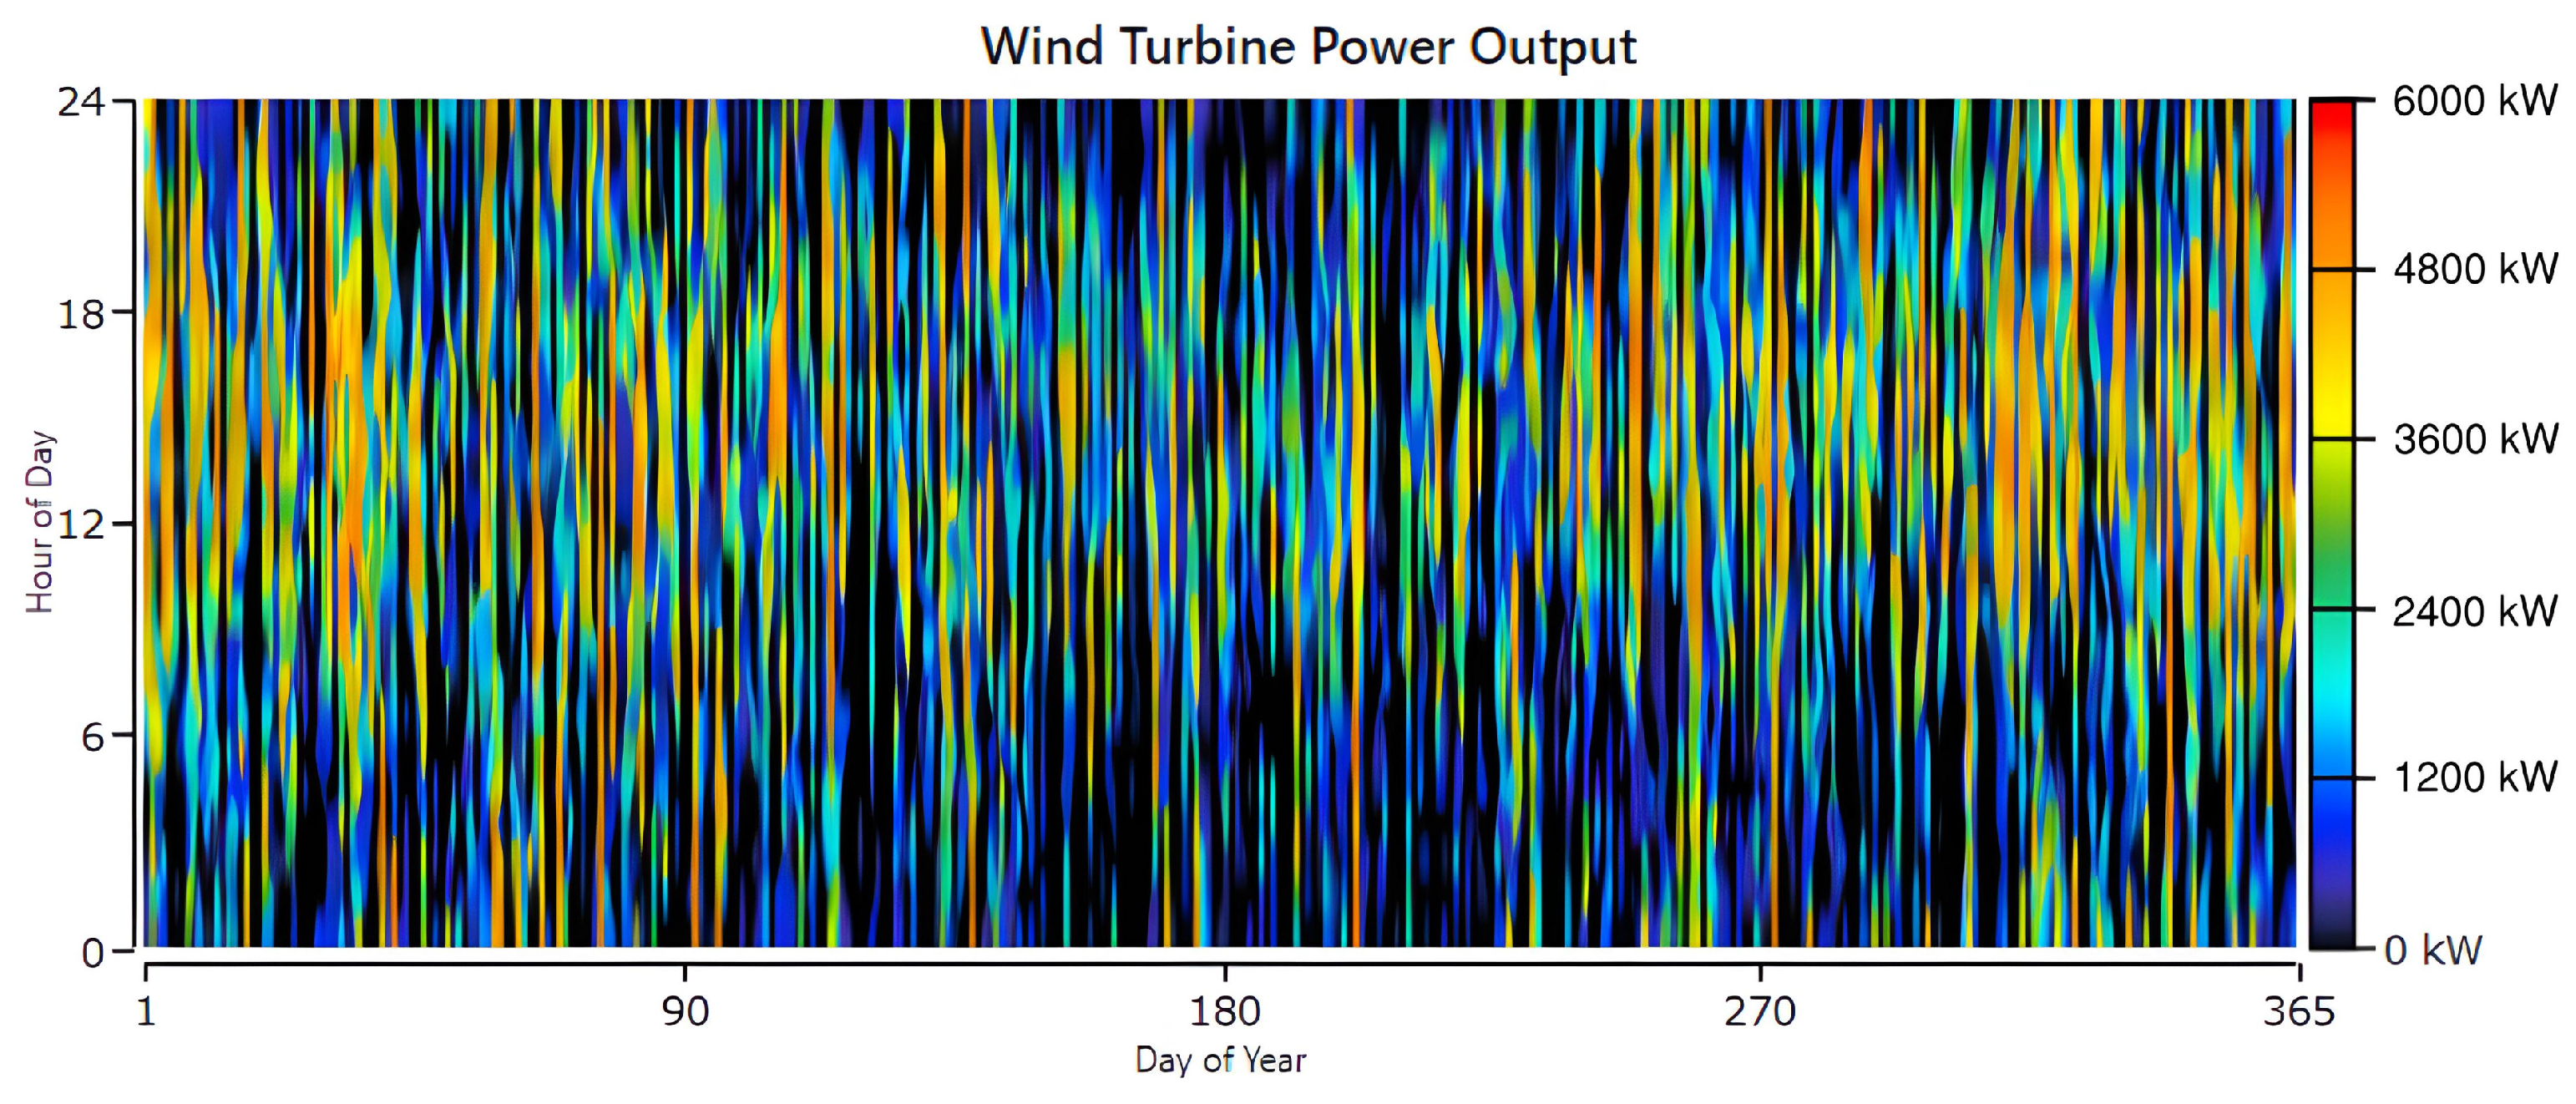
Figure 11 the Wind power fluctuates throughout the year. Due to this variability, the wind generation often peaks when electricity demand is lower, the system exports part of the produced energy to the grid and uses the balance locally. Wind output reaches its highest levels during winter and early spring, complementing solar production and strengthening the hybrid system’s renewable contribution. The seasonal anti-correlation between wind speed and solar irradiance enhances generation stability—when solar output declines, wind power compensates, reducing the need for grid imports. Although the model does not explicitly include wake losses or reactive power effects, the simulated results agree well with the observed coastal Labrador wind speeds of 5–7 m·s
−1, confirming the validity of the wind resource assumptions.
This complementarity reflects the findings of previous studies, which show that dual-source hybrid systems yield lower variability and higher reliability than single-source configurations [
53].
4.1.4. Utility-Scale Inverter Performance
HOMER Pro models the utility-scale inverter block as the DC–AC interface between the PV field and the hybrid system’s AC bus. In the optimized configuration, the installed inverter capacity is 13.7 MW AC, serving a 16 MWp PV array (DC/AC ≈ 1.17). This sizing minimizes clipping while maintaining good part-load efficiency.
Over one year, the inverters convert 25.57 GWh_DC into 24.96 GWh_AC, corresponding to ≈0.61 GWh of conversion losses and a weighted efficiency of 97.6%, exceeding the 95% nominal assumption. The delivered energy equals an average annual output of about 2.85 MW. Relative to the 13.7 MW_AC rating, the plant-level capacity factor is 20.8%. On a PV-DC basis, the capacity factor is 18.5%. During 4397 h of production, the mean operating output is ≈5.68 MW. Because the system excludes battery storage, all PV energy flows directly through the inverter to the AC bus.
Figure 12 presents the inverter output heat map, illustrating the seasonal and diurnal variations that mirror PV generation patterns. Minimal excess energy (≈0.34 GWh, about 0.6% of annual output) confirms that the selected DC/AC ratio of 1.17 effectively limits clipping losses. The highest instantaneous inverter outputs occur in March, influenced by low module temperatures and enhanced spring irradiance, including snow-albedo effects, while daily totals peak during late spring and summer. Overall, the inverter subsystem operated with high reliability and low conversion losses, maintained full grid compliance, and effectively supported the system’s high renewable penetration. The achieved conversion efficiency (≈97.6%) is comparable to values reported for large-scale PV systems in the literature, confirming that inverter losses represent only a minor component of total system inefficiency [
54].
In this study, the hybrid configuration operates without energy-storage units. This design choice reflects the close alignment between the community’s demand profile and the complementary nature of solar and wind resources, which reduces the need for intermediate storage. Although integrating batteries could enhance system flexibility and improve short-term reliability, it would also increase capital cost and maintenance complexity. As highlighted by Hassan et al. [
52], storage systems primarily benefit applications where generation–load mismatch is significant or reliability standards are very high. For the L’Anse-au-Loup case, the grid connection effectively serves as the balancing mechanism, enabling continuous operation and a stable power supply without dedicated storage.
4.1.5. Grid Exchange and Reliability
Table 4 summarizes the monthly grid exchange and shows how the hybrid system balances imported and exported energy throughout the year. During the simulation, the system exported about 18.1 GWh to the grid and imported 15.1 GWh, giving a net annual export of roughly 3 GWh. These results confirm that the system acts as both a producer and consumer of electricity, adapting its operation to seasonal changes in solar and wind resources.
As shown in
Figure 13 and
Figure 14, the Seasonal patterns are clear. Grid imports rise in winter, when renewable resources weaken, while exports dominate from March to September, when sunlight and wind are stronger. For example, in March the system exported 2.35 GWh and imported 1.20 GWh, but in January the situation reversed, with 1.84 GWh imported and only 0.75 GWh exported.
Although the community remains connected to the provincial grid, integrating renewables has significantly reduced annual electricity imports and associated costs. Under a grid-only supply scenario, the community would purchase its entire annual demand of approximately 35 GWh, corresponding to an estimated cost of about
$7.7 million USD annually. With the optimized PV–wind–grid configuration, imports decline to 15.1 GWh, representing a reduction of nearly 57% in purchased electricity and a decrease in annual grid expenditure to approximately
$0.6 million USD. These results confirm that hybrid renewable integration can substantially reduce operating costs while maintaining supply reliability, consistent with findings from comparable studies on northern and coastal hybrid systems in Canada and the Arctic region [
8].
The grid now plays a supporting rather than dominant role, absorbing surplus power when renewable production exceeds demand and supplying electricity only during low-demand periods. This operational balance improves cost efficiency and enhances resilience, reducing the community’s exposure to transmission interruptions or extreme weather events such as snowstorms that often affect remote regions.
The hybrid system operated smoothly throughout the year, with no unmet load, curtailment, or capacity limitations. Technical losses from wiring, environmental derating, and inverter conversion remained low, confirming efficient performance consistent with industry standards.
Overall, two outcomes stand out:
Lower grid imports and greater resilience: Local renewable generation now supplies most of the community’s energy needs, cutting dependence on external power and ensuring a more robust local supply.
Improved reliability and stability: The grid balances seasonal variations by absorbing excess power in summer and covering shortfalls in winter, maintaining an uninterrupted electricity supply.
The hybrid configuration provides a renewable contribution exceeding 70%, reduces grid imports from 35 to 15 GWh, and strengthens energy security through a well-balanced exchange between local renewable generation and the utility network.
4.2. Economic Performance
The economic assessment examines the cost effectiveness and financial viability of the proposed PV–wind–grid hybrid system over its 25-year lifetime. The analysis quantifies the system’s total life-cycle cost, energy price, and investment performance through indicators such as the Net Present Cost (NPC), Levelized Cost of Energy (LCOE), Return on Investment (ROI), Internal Rate of Return (IRR), and Payback Periods. These measures collectively capture the project’s long-term affordability, profitability, and potential for sustainable implementation in a remote northern context.
4.2.1. Cost Structure
The hybrid configuration achieves an NPC of $38.91 million USD, an annual O&M cost of $1.57 million USD, and a Levelized Cost of Energy of $0.079 USD kWh−1.
Table 5 summarizes the capital, replacement, O&M, and salvage costs by component.
The PV subsystem accounts for about 49.5% of total NPC, the wind subsystem contributes 21.5%, the inverter and balance-of-system 9.0%, and grid-related costs 19.9%, primarily from O&M, contribute the remaining share. The dominance of PV expenditure reflects its central role in energy production and its contribution to lowering the long-term energy price.
4.2.2. Financial Indicators
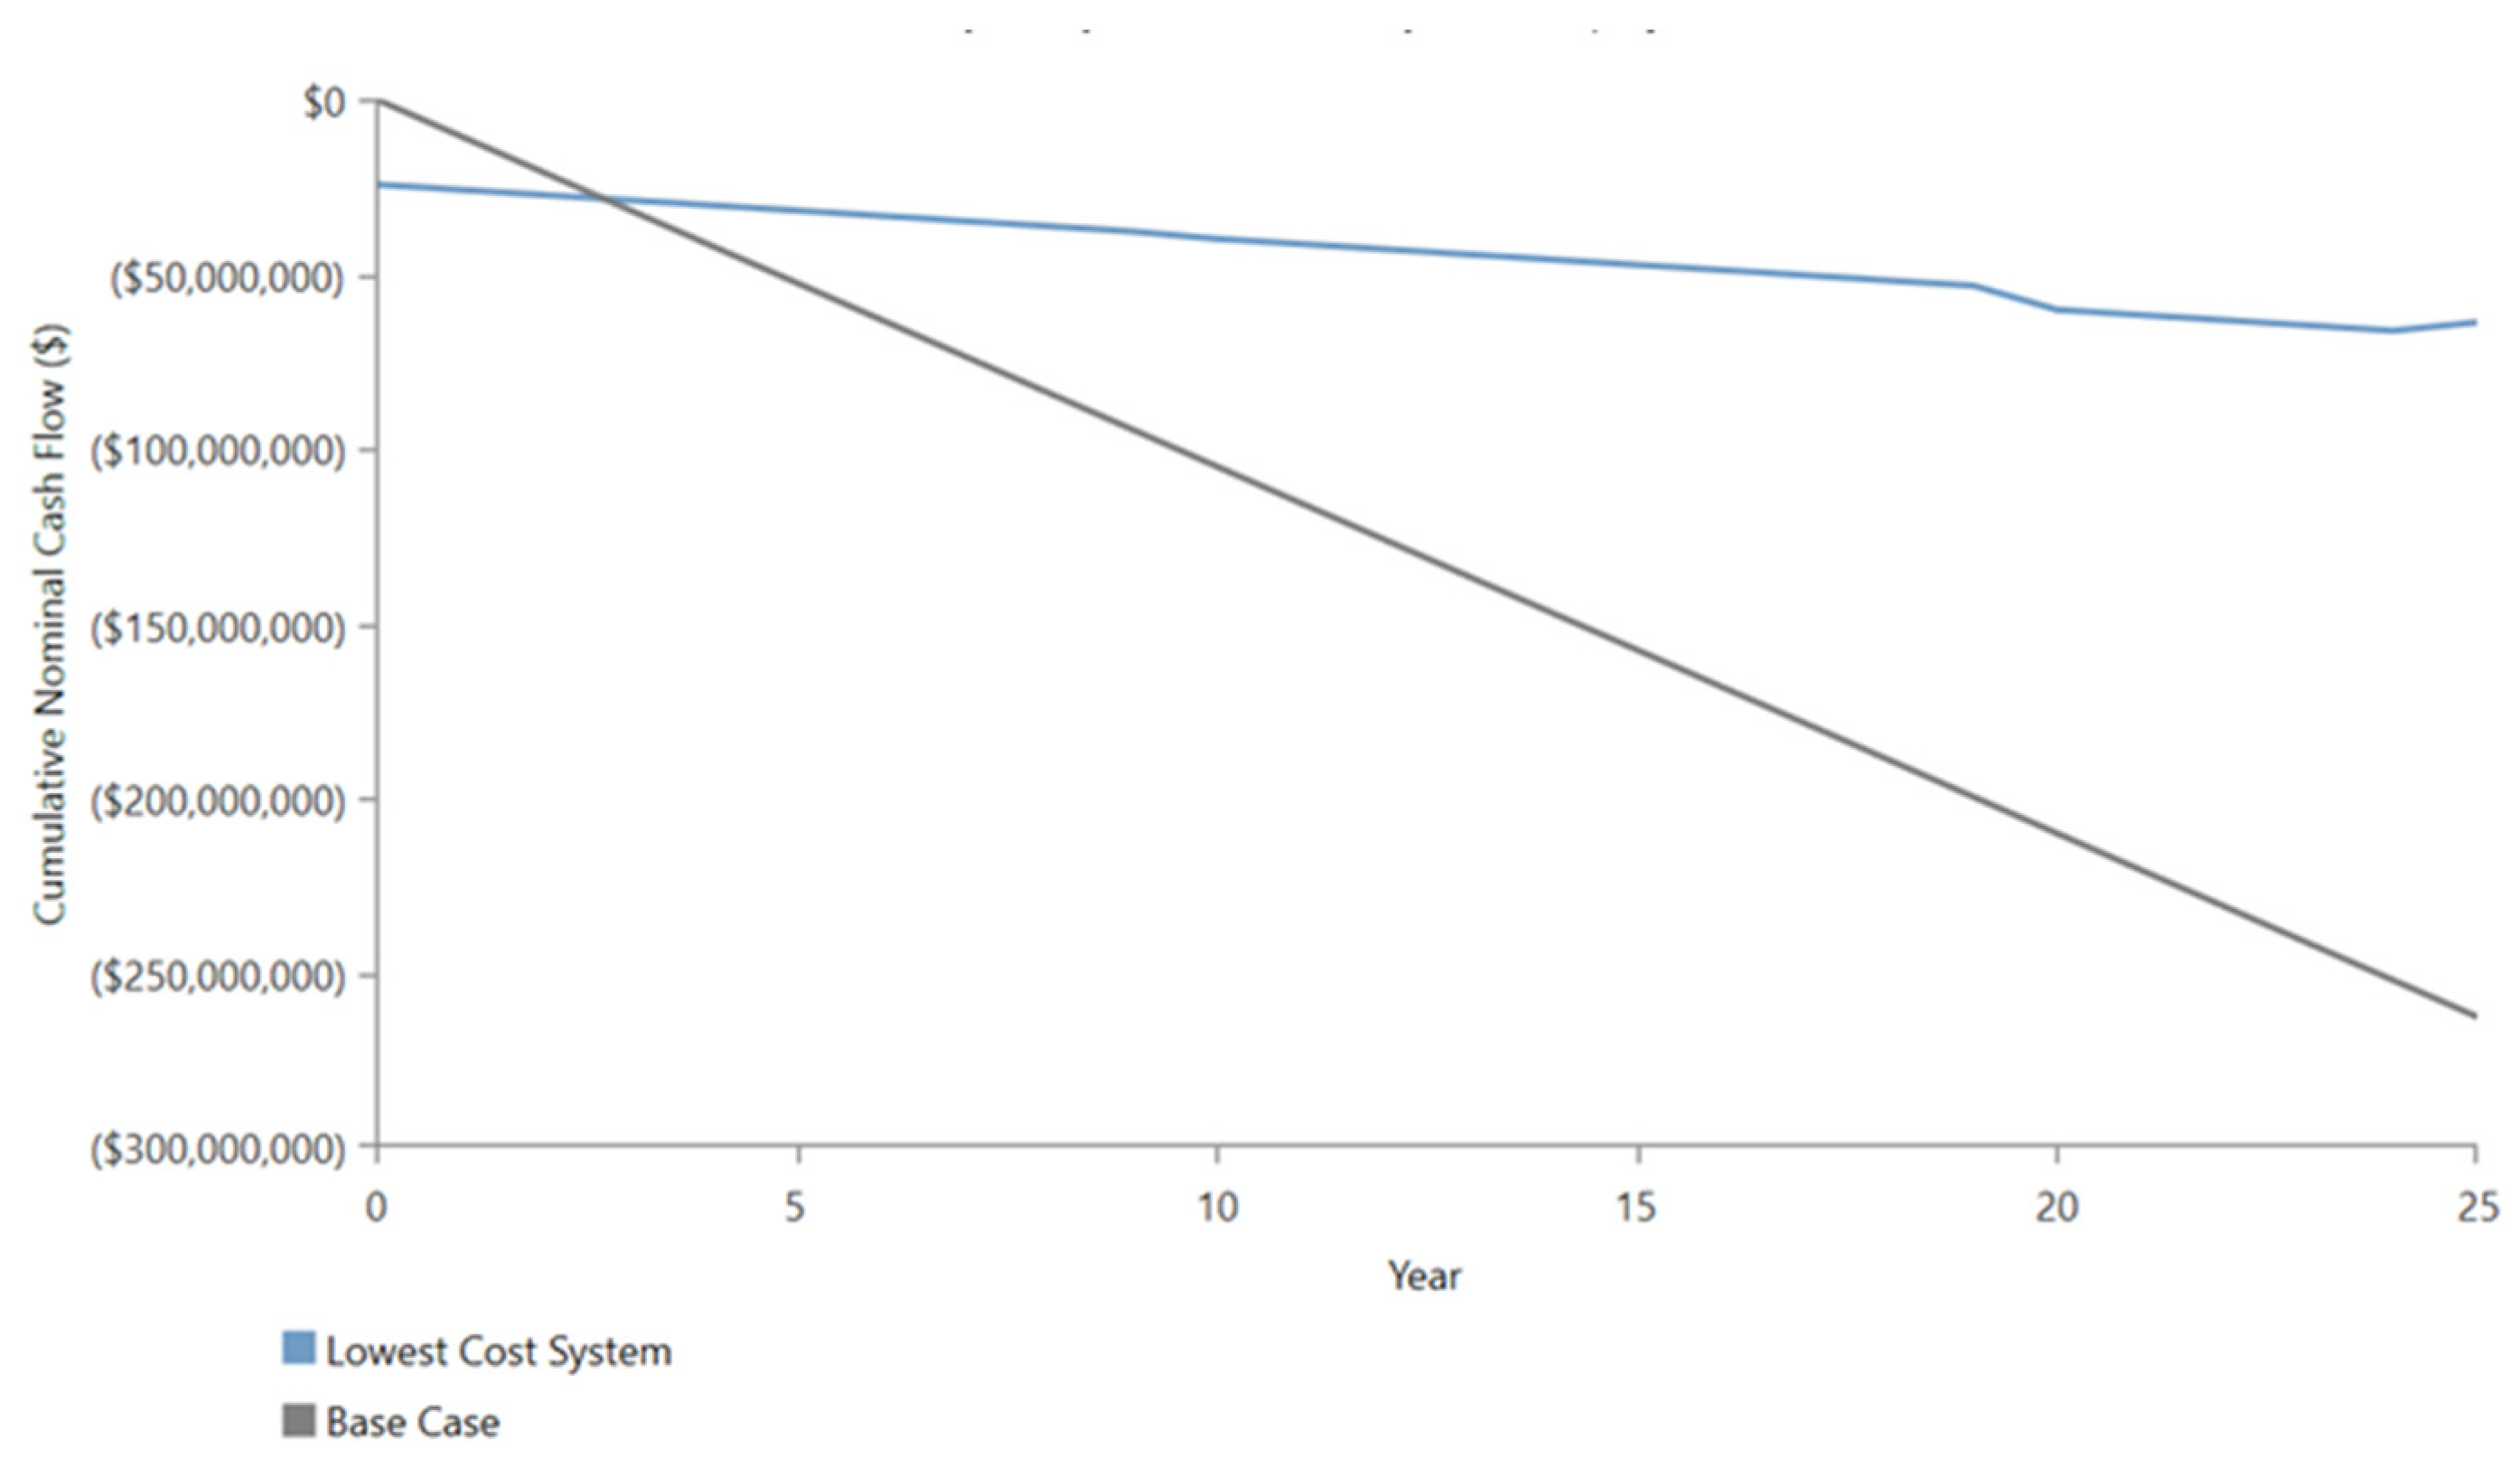
HOMER Pro’s comparative analysis (
Figure 15) shows that the hybrid system has a much lower life-cycle cost than the grid-only case. As shown in
Table 6, the hybrid configuration demonstrates strong financial performance, with reduced long-term costs and attractive return values. The Net Present Cost decreases from about
$96.9 million USD in the grid-only scenario to
$38.9 million USD for the hybrid system, giving a lifetime saving of nearly
$58 million USD. The Levelized Cost of Energy also drops from roughly
$0.30 USD kWh
−1 to
$0.079 USD kWh
−1, reflecting a significant improvement in generation cost over the 25-year project period.
Table 6 lists the leading financial and economic indicators, including Net Present Cost, Levelized Cost of Energy, Annual Operating Cost, Internal Rate of Return, Return on Investment, and Simple Payback Period.
The hybrid curve (
Figure 15) shows a markedly slower cost accumulation and stabilizes around
$–50 million USD by year 25, while the grid-only case declines to
$–280 million USD.
The divergence around year 3 to 4 indicates the onset of positive cash flow for the hybrid project, consistent with its short 2.7-year payback period.
After payback, the hybrid configuration maintains net savings for the remainder of its operational life, confirming its strong financial resilience.
Even though the hybrid configuration offers clear technical and economic advantages, its successful implementation ultimately depends on access to suitable financing mechanisms. Instruments such as investment tax credits, capital cost buy-downs, production-based incentives, accelerated depreciation, and community equity models can significantly reduce upfront costs and improve project bankability. Integrating these support measures would align the project with federal and provincial decarbonization strategies, shorten payback periods, and de-risk private investment. Moreover, locally driven financing frameworks would enhance community participation and social acceptance, promoting equitable and sustainable energy transitions in northern and remote regions.
4.3. Environmental Benefits
Compared with the grid-only baseline, the hybrid PV–wind system markedly reduces greenhouse gas and air pollutant emissions. As summarized in
Table 7, the system achieves annual reductions of approximately 1897 t CO
2, 8.2 t SO
2, and 4.0 t NO
x, based on HOMER Pro simulations.
To contextualize this benefit, the avoided 1897 t CO
2 yr
−1 means eliminating the annual emissions of roughly 413 passenger vehicles, assuming an average of 4.6 t CO
2 per car yr
−1 [
55]. These reductions arise from the system’s 71.6% renewable contribution, which replaces a significant portion of the electricity that fossil-fuel power plants would otherwise generate.
Eliminating SO2 and NOx emissions is important for improving local air quality, as these pollutants directly contribute to respiratory illnesses and acid deposition. By replacing high-emission grid energy with clean generation, the hybrid configuration supports environmental compliance, reduces the community’s carbon footprint, and contributes to broader regional decarbonization objectives.
The results show significant environmental benefits to incorporating wind and solar PV into the community’s electricity supply. These include mitigating climate impacts through CO2 reduction, improving local air quality, and aligning the energy system with broader sustainability and decarbonization goals.
4.4. System Sensitivity Analysis
The sensitivity analysis conducted in HOMER Pro evaluates how key financial and design parameter variations influence the hybrid system’s overall performance and cost. A nominal discount rate of 12% and a 15% reduction in the capital costs of both PV and wind subsystems were applied to assess the robustness of the optimal configuration.
The optimization surface (
Figure 16) illustrates the variation in Net Present Cost (NPC) as a function of PV capacity and the number of V47 wind turbines. The lowest-cost region occurs between 11.7 MW and 16 MW of PV capacity combined with eight turbines, yielding NPC values below
$45 million USD. Configurations based solely on PV or wind exhibit higher costs and reduced performance, confirming the economic advantage of a balanced hybrid integration.
The ten best-performing configurations identified through the sensitivity analysis are summarized in
Table 6. The lowest NPC of
$34.9 million USD occurs at 12.8 MW of PV with eight turbines, corresponding to a Levelized Cost of Energy (LCOE) of
$0.103 USD kWh
−1 and a renewable fraction of 68.1%. Across the top-ten configurations, NPC ranges from
$34.9–41.8 million USD, LCOE from
$0.079–0.119 USD kWh
−1, and the renewable fraction remains consistently between 66.7% and 71.6%. In all optimized cases, diesel consumption is zero, avoiding approximately 1900 t CO
2 yr
−1 relative to the grid-only baseline.
For comparison, the grid-only configuration yields an NPC of $96.8 million USD and an LCOE of $0.30 USD kWh−1 with zero renewable contribution. A PV-only system (27 MW) reduces NPC to $49.2 million USD and LCOE to $0.084 USD kWh−1, achieving a renewable fraction of 66.6%. A wind-only configuration (8 × V47 turbines) generates $69.1 million USD NPC, $0.208 USD kWh−1 LCOE, and 36.3% renewable penetration.
The hybrid system outperforms all alternatives, achieving the lowest NPC, competitive LCOE, complete diesel displacement, and maximum emission reduction. The optimal configuration remains robust across moderate variations in PV capacity (12–16 MW) with eight turbines, as shown in
Figure 16 and
Table 8. Minor increases in PV capacity above 12 MW lead to small rises in NPC but negligible changes in renewable fraction or emissions. These results confirm that the hybrid configuration maintains economic and environmental resilience under market conditions and capital-cost scenarios.
6. Conclusions
This research evaluated the feasibility of a large-scale hybrid solar–wind energy system for L’Anse au Loup, Labrador, using techno-economic and environmental simulations using HOMER Pro. With 25.9 GWh of PV and 13.1 GWh of wind generation per year, the optimum design generated a renewable proportion of 71.6%. The system prevents about 1897 t of CO2, 8.2 t of SO2, and 4.0 t of NOx emissions annually, and economically, it delivers a net present cost of $38.9 million and a levelized cost of $0.0795/kWh, which is significantly less than the base-case grid-only supply.
The results show that the hybrid system continually met community demand by integrating renewable energy with grid support. However, the system cannot be said to have “zero unmet load” in a stand-alone sense because the grid supplies backup. Instead, it maintains dependability while drastically lowering local reliance on imported electricity and fossil fuels.
The system’s scalability and proven technical performance make it a good choice for replication in other isolated or semi-isolated communities dealing with comparable energy difficulties. By highlighting the need for hybrid renewable systems and planning the future growth in energy demand for remote areas, this complete proposal supports the long-term goals of energy autonomy, grid modernization, and climate action [
62].
Overall, the results show that HOMER Pro-optimized PV–wind hybrids are a viable solution to lessen dependency on fossil fuels, provide local energy security, and cut lifetime energy costs.
