Abstract
As large common areas, cruise ship atriums affect passenger comfort and HVAC efficiency. Due to their complexity and high occupancy, maintaining a suitable thermal environment is difficult. Experimental measurements, thermal load analysis, and CFD simulation are used to assess and improve the atrium’s summer thermal climate. Experimental data supported the use of the RNG - turbulence model to forecast airflow and temperature. To meet the cooling demand of 28,784 W, a supply air volume of 10,742 m3/h was required. Various air-supply methods were evaluated for temperature distribution, airflow velocity, PMV, and air age. Larger diffusers and better air dispersion increased temperature homogeneity, air age, and comfort. Redistributing airflow to corridors reduced localized overheating but raised core temperatures, whereas adding diffusers without boosting supply volume caused interference. The configuration with larger diffuser areas and equilibrated airflow maintained a temperature of 21–23 , a PMV of −0.1 to 0.1, an air velocity of 0–0.3 , and an average air age of 350 s. The findings provide theoretical and engineering guidance for energy-efficient HVAC systems in cruise ship atriums and other large public spaces.
1. Introduction
Cruise ship atriums are expansive communal spaces characterized by elevated ceilings, intricate geometries, and substantial occupancy levels. In the maritime context, maintaining thermal comfort is challenging due to the combined effects of convective and radiative heat transfer, airflow stratification, and variable human activities. A comprehensive assessment of thermal conditions must consider essential parameters such as air temperature, mean radiant temperature, air velocity, relative humidity, metabolic rate, and clothing insulation. These variables collectively determine the operative temperature, which governs perceived comfort in dynamically changing environments [1].
Historically, maritime HVAC research has focused on cabin-level load assessments and comfort regulation. Jin and Qi [2] developed computational tools for estimating ship refrigeration heat loads, while Charisis and Karakatsanis [3] categorized calculation methodologies for comprehensive air-conditioning system design. Wu [4] proposed database-supported load coefficient methods, and Thiangchanta et al. [5] applied regression models to predict room heat loads. AlHarbi [6] compared E20 and HAP software, confirming the efficiency of software-assisted load calculations for complex ship compartments. More recent studies have extended this research toward large-scale public spaces: Zhao et al. [7] employed coupled Building Energy Simulation (BES) and CFD models to analyze thermal environment and energy consumption characteristics in large indoor spaces, and Luo et al. [8] optimized combined natural and HVAC ventilation systems to balance passenger comfort and energy efficiency in different seasons.
Thermal comfort assessment remains a key concern for maritime HVAC design. The PMV/PPD framework defined in ISO 7730:2025 [9] and ASHRAE 55 standards is the most widely applied comfort model, though its quasi-steady assumptions may limit precision in shipboard environments [10]. Zhou et al. [10] proposed PMV modifications for nonstandard and low-pressure conditions to improve accuracy. Alternative thermoregulation models such as THERMODE 2023, JOS-3, and Fiala-type physiological models [11] can provide a more detailed representation of transient heat exchange and human thermoregulation, but PMV remains a pragmatic engineering choice when integrated with CFD-derived fields of air temperature, velocity, relative humidity, air age, and, when feasible, mean radiant temperature [9].
Previous studies have also explored large-space ventilation strategies, including displacement, stratified, and underfloor air distribution systems, to mitigate stratification and improve energy efficiency [12,13,14,15,16,17]. Wan et al. [14] and Che et al. [15] applied DeST-based CFD optimization to atriums, while Kim et al. [16] and Nada et al. [17] validated UFAD systems that enhanced vertical temperature uniformity. Nevertheless, research specifically targeting cruise ship atriums remains limited. Few studies have integrated (i) ISO-based thermal load partitioning (including solar radiation and envelope conduction), (ii) experimental validation, and (iii) multi-parameter CFD analyses comparing multiple air-supply configurations using quantitative comfort metrics such as temperature uniformity, velocity field, PMV, and air age.
Accordingly, the present study aims to fill this research gap. Under representative summer conditions departing from Shanghai, ISO 7547:2022 [18]-based thermal load calculations, on-site experiments, and validated RNG k–ε CFD simulations were conducted to: (1) evaluate how diffuser size and air-distribution schemes influence the thermal environment (temperature, velocity, PMV, air age); and (2) develop practical design guidance for improving thermal comfort and energy efficiency in cruise ship atriums.
The main contributions of this study are as follows:
- (a)
- coupling radiative and conductive thermal loads in ISO-compliant boundary conditions within the CFD model;
- (b)
- providing a multi-criteria evaluation framework that simultaneously quantifies thermal comfort and ventilation effectiveness;
- (c)
- proposing engineering parameters—such as diffuser area and balanced airflow allocation—to achieve uniform temperature distribution and improved passenger comfort in large maritime public spaces.
2. Turbulence Model Selection and Experimental Validation with Thermal Environment Evaluation in Cruise Ship Atriums
2.1. Selection of Turbulence Models
The airflow in the cruise ship atrium is dominated by turbulence, which is highly nonlinear and stochastic. For numerical simulation and prediction of such flows, two-equation models such as the standard k–ε and RNG k–ε models are commonly employed.
The standard - model relates turbulent viscosity to the turbulent kinetic energy () and its dissipation rate (), thereby establishing their relationship with the eddy viscosity. This approach provides reasonable accuracy for simulating airflow in the study domain and is widely used in HVAC and indoor airflow applications due to its relatively low computational cost and fast convergence.
The transport equations for and are expressed as follows:
where the turbulent viscosity is given by
and the production term of k is calculated as follows:
where is the turbulent kinetic energy per unit mass, is the time, and are the Cartesian coordinate components, and are the velocity components in the and directions, and are the turbulent Prandtl numbers for and , is the turbulent dissipation rate per unit mass, is the molecular viscosity, , and are the empirical constants, is the turbulent (eddy) viscosity, is the production rate of k per unit volume, is the Kronecker delta, is the strain-rate tensor.
The empirical constants of the model were adopted according to the default values commonly used in the literature and recommended by Launder and Spalding, which ensure stable convergence and reliable prediction accuracy for a wide range of engineering applications. Specifically, the model coefficients were set as follows: , , , , and .
The RNG - model is derived using the renormalization group (RNG) statistical technique. While similar in form to the standard - model, its transport equation for turbulent kinetic energy () can be written as follows:
where ;; ; ;
where is the air density, is the time, is the effective viscosity, and are the effective inverse turbulent Prandtl numbers for and , and are the turbulent Prandtl numbers for and , is the turbulent kinetic energy generated by the mean velocity gradients, is the turbulent kinetic energy generated by buoyancy effects, is the contribution of fluctuating dilatation in compressible turbulence to the overall dissipation rate, and are the user-defined source terms for and , is the additional term in the RNG model accounting for the interaction between turbulence dissipation and mean shear, is the dimensionless strain rate parameter, and are the RNG-specific empirical constants, is the mean strain rate magnitude.
Compared with the standard model, the RNG formulation introduces an additional term in the equation to improve accuracy for rapidly strained flows, explicitly accounts for swirl effects, and provides an analytical expression for the turbulent Prandtl number. These features enable the RNG - model to achieve higher accuracy and reliability across a wider range of flow conditions. In this study, both the standard and RNG - models are applied in AIRPAK simulations for comparative analysis.
The commonly used closure coefficients are listed in Table 1.

Table 1.
RNG - Model closure coefficients.
2.2. Experimental Scheme for Temperature Measurement in the Cruise Ship Atrium
A temperature measurement experiment was conducted in the atrium of a cruise ship under summer operating conditions in Shanghai. The overall measurement arrangement is shown in Figure 1, where Figure 1a illustrates the layout of measurement points and Figure 1b presents the schematic of sensor heights and numbering. Five points were located in the main hall with the highest passenger density, while two additional points were arranged in each of the two first-deck corridors. To capture vertical temperature variations representative of typical occupant activity, each measurement tree was equipped with sensors at 0.6 m, 1.2 m, and 1.8 m, corresponding approximately to the leg, sitting, and standing head levels. Once the air-conditioning system reached stable operating conditions, the data acquisition system continuously recorded temperature variations until steady-state values were obtained at all measurement points.
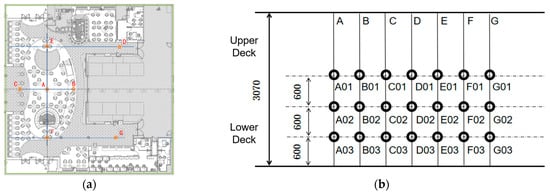
Figure 1.
Measurement points arrangement and schematic of heights in the cruise ship atrium. (a) Indoor measurement points layout of the atrium; (b) schematic diagram of measurement heights and point numbering.
During the experiment, the air-conditioning system was adjusted until the supply air temperature stabilized at the designated summer condition. The air supply volume and outlet parameters were measured and verified using an anemometer, Pitot tube, and temperature sensors to ensure consistency with the design requirements. The airflow velocity was measured using a high-precision DP1000-IIIB anemometer (Shanghai Yiou Instrument Equipment Co., Ltd., Shanghai, China) paired with an L-type Pitot tube, with a measurement accuracy of ±3 + 0.5. The air temperature was recorded using a SWBZ-PT100 temperature sensor (Shanghai Jingfeng Measurement and Control Co., Ltd., Shanghai, China), with an accuracy class of 0.2 at 20 °C.
After the system reached a steady state, all personnel left the atrium, and the data acquisition system was activated to continuously record the temperature variation at each measurement point. The automatic recording lasted from 14:38 to 08:49 the following day, yielding 2532 temperature data points. This corresponds to a recording interval of approximately 26 s, ensuring sufficient temporal resolution for reliable thermal field analysis. The exported data from the temperature measurement instrument are shown in Figure 2.
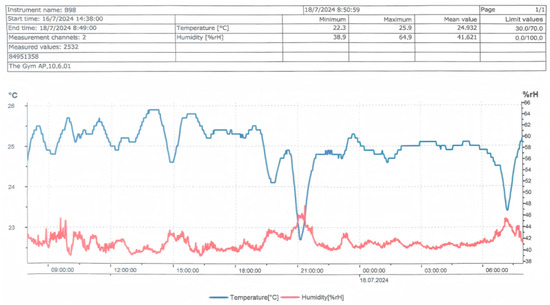
Figure 2.
Exported data from the temperature measurement instrument.
2.3. Construction and Validation of the Atrium Numerical Simulation Model
The atrium serves as a central public space on the cruise ship, where passengers frequently gather and interact. As a hub connecting different functional areas, the atrium plays an important role in ensuring passenger comfort. Structurally, the atrium is a vertically oriented rectangular space extending through three decks, with dimensions of 24.2 m (length) × 24.2 m (width) × 9.98 m (height). Its layout is illustrated in Figure 3.
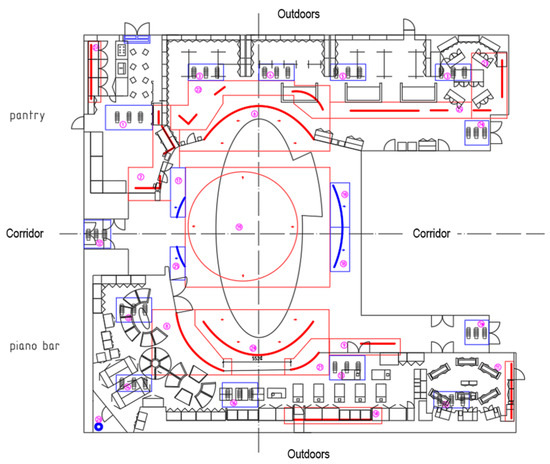
Figure 3.
Plan view of the cruise ship atrium.
In this study, a three-dimensional atrium model was established in AIRPAK based on actual ship dimensions. The modeled space consists of a 24.2 × 24.2 × 9.98 m cubic framework, including two corridors on the starboard side. Since the atrium contains numerous interior facilities, most of which have negligible influence on airflow patterns, these were simplified and treated as insulated bodies to reduce mesh density and computational load. The simplified model retained the essential geometric and boundary characteristics of the actual atrium, thereby ensuring reliable simulation of thermal and airflow conditions. The atrium is designed to accommodate 50 people, and 11 occupants were represented in the model, distributed across the first and second decks. Since passenger activity is concentrated on the first deck hall, this area was emphasized in the simulations. The simplified three-dimensional model is shown in Figure 4.
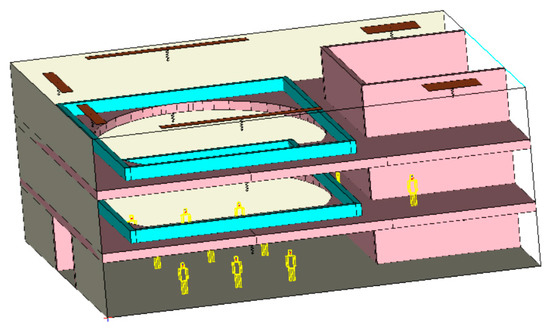
Figure 4.
Three-dimensional simplified model of the cruise ship atrium.
Based on the measured data obtained on the day of the experiment, boundary conditions were defined and the atrium temperature distribution was simulated in AIRPAK 3.0.16 using both the standard - and RNG - models. Seven representative measurement points were selected, and temperature values at different heights were recorded for comparison. The temperature contours of cross-sections at corresponding heights simulated by the two models are shown in Figure 5.
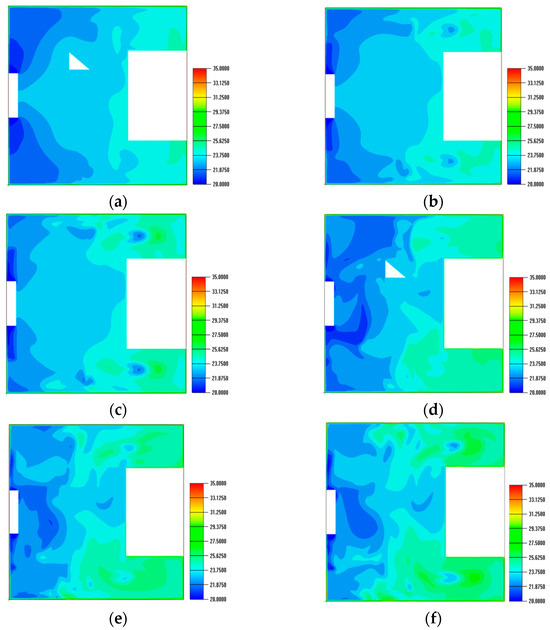
Figure 5.
Temperature contours of the atrium at different heights. (a) z = 0.6 m, standard -; (b) z = 1.2 m, standard -; (c) z = 1.8 m, standard -; (d) z = 0.6 m, RNG -; (e) z = 1.2 m, RNG -; (f) z = 1.8 m, RNG -.
A detailed comparison between experimental values and simulation results is presented in Table 2.
Table 2.
Comparison of experimental and simulated temperatures at different heights.
The results indicate that at measurement points A and B, the predicted temperatures of both models show little difference. At corridor points D and G, however, the RNG model produces higher values than the standard model, closer to the experimental data. In the hall (points E and F), the standard model underestimates temperatures compared with measurements. Moreover, the error of the standard model increases with height at the same point, while the RNG model maintains relatively consistent accuracy across different heights. Therefore, the RNG - model was adopted for subsequent numerical simulations in this study.
3. Calculation of Air-Conditioning Thermal Load in the Cruise Ship Atrium
3.1. Design Parameters of the Atrium
As the central hub of the cruise ship, the atrium requires careful consideration of temperature and humidity design parameters to balance indoor thermal comfort and energy consumption. In this study, summer operating conditions are considered. According to ISO-7547, the indoor design parameters are a dry-bulb temperature of 24 and a relative humidity of 55%.
The outdoor design parameters were determined based on local meteorological data. Since the cruise ship departs from Shanghai, the representative summer outdoor conditions were selected as a dry-bulb temperature of 35 and a relative humidity of 80%. In accordance with the design manual, a supply air temperature difference of 8 was adopted. The detailed design parameters are summarized in Table 3.
Table 3.
Design parameters of the atrium under summer conditions.
3.2. Calculation of Total Thermal Load and Required Air Supply in the Atrium
The total thermal load of the atrium consists of heat transfer through the envelope, heat released by occupants, and lighting heat gains. Since no large electrical equipment is installed in the atrium, equipment heat is not considered. The total load can be expressed as follows.
where is the total thermal load, is the heat transfer load, is the total heat released by occupants, is the lighting heat gain.
The total heat transfer load refers to the overall heat entering the atrium per unit time through multiple transfer mechanisms, primarily including conduction through structural boundaries and radiative heat gains caused by solar exposure. Conduction occurs across bulkheads, decks, and other envelope components due to temperature differences between the indoor and outdoor environments.
Meanwhile, radiative transfer—particularly solar radiation absorbed and transmitted through glazing surfaces and metallic enclosures—constitutes a significant portion of the thermal load in large enclosed maritime spaces. In accordance with ISO 7547, solar radiation is accounted for through two components: (1) surface radiation gains on sun-exposed decks and bulkheads, and (2) direct and transmitted solar radiation through transparent elements such as windows and skylights. The total heat transfer is therefore determined as the sum of the conductive and radiative components, as expressed as follows.
where is the total heat transfer load, is the sum of conduction through bulkheads and decks, is the sum of heat transfer through glass windows or balcony doors, is the heat transfer coefficient of bulkheads or decks with insulation, is the effective envelope area excluding glazing and its 100 mm edge zone, is the design dry-bulb temperature of the adjacent boundary, is the indoor design dry-bulb temperature, is the heat transfer coefficient of glazing, with values of 6.5 for single glazing and 3.5 for double glazing is the effective glass area, is the outdoor dry-bulb temperature, is the solar radiation heat gain coefficient and is the glass surface area. The final calculation shows that the total heat transfer load of the atrium under summer conditions is 17,143 W.
The heat released by cruise ship passengers can be obtained by multiplying the number of occupants by the heat emitted per person, with both sensible and latent components considered. The calculation is expressed as follows.
where is the total heat released by occupants, is the sensible heat release and is the latent heat release.
According to ISO-7547, under an indoor dry-bulb temperature of 35, a passenger engaged in light activity (such as sitting or mild social interaction) releases 50 W of sensible heat and 70 W of latent heat, resulting in a total of 120 W per person. Since the atrium functions primarily as a leisure and social space, passengers are assumed to be in a light activity state. With a design capacity of 50 occupants, the total occupant heat load of the atrium is calculated as 6000 W.
For compartments exposed to sufficient daylight, the heat generated by artificial lighting can be neglected. For compartments without daylight, however, the lighting heat load is calculated as follows.
where is the floor area illuminated by incandescent lamps, is the heat emission per unit floor area from incandescent lamps, is the floor area illuminated by fluorescent lamps, is the heat emission per unit floor area from fluorescent lamps, is the floor area illuminated by LED lamps and is the heat emission per unit floor area from LED lamps.
In this study, the atrium lighting is primarily composed of LEDs. Due to the open configuration of the atrium, the first deck serves as the main hall with the largest illuminated floor area, resulting in the highest lighting heat load. The second and third decks contribute less to the total. The final calculation shows that the lighting heat load of the atrium is 5641 W.
Based on Equation (7), the total thermal load of the atrium was calculated as 28,784 W. According to the Chinese National Standard GB/T 13409–1992 [19]—Design Conditions and Calculation Methods for Air-Conditioning and Ventilation of Ship Accommodation Spaces, the supply air volume of a cabin or compartment is calculated as follows.
where is the air supply volume of the air-conditioning system, is the total thermal load of the atrium and is the supply air temperature difference.
For the summer operating condition considered in this study, the indoor design temperature of the atrium is 24 . According to the design manual, the supply air temperature difference is determined to be 8 . Substituting these values yields an air supply volume of 10,742 .
In subsequent numerical simulations, the total thermal load of 28,784 W and the air supply volume of 10,742 m3/h
are adopted as boundary parameters.
4. Numerical Simulation Analysis of the Thermal Environment in the Cruise Ship Atrium
4.1. Evaluation Indicators for Atrium Thermal Environment
The evaluation of thermal environment is based on established comfort standards and can generally be divided into three categories: thermal comfort indicators, air distribution effectiveness indicators, and contaminant removal effectiveness indicators. In this chapter, the numerical simulations primarily focus on thermal comfort indicators such as the temperature field and Predicted Mean Vote (PMV), as well as air distribution effectiveness indicators including the velocity field and air age.
The PMV index reflects the average thermal sensation of occupants in a given environment. It is derived from the thermal comfort equation and the ASHRAE seven-point scale, and has been incorporated into the ISO 7730 standard. PMV takes into account factors such as metabolic rate, clothing insulation, air temperature, humidity, air velocity, and mean radiant temperature. Its general expression is given as follows.
where is the human thermal load, defined as the difference between the rate of heat production and the rate of heat loss and can be calculated as follows:
where is the metabolic heat production rate of the human body, is the mechanical work accomplished by human activity, is the air temperature surrounding the human body, is the partial water vapor pressure of the surrounding air, is the surface temperature of the clothing, is the radiant temperature, is the convective heat transfer coefficient, is the clothing area factor.
The clothing surface temperature can be determined iteratively using Equations (14)–(16).
where is the metabolic heat production rate of the human body, is the clothing thermal insulation rate.
In the thermal comfort evaluation, the metabolic rate (MET) and clothing thermal insulation () were defined in accordance with the typical conditions of a cruise ship atrium. The atrium serves as a semi-public leisure and social area where passengers generally engage in light physical activities such as walking slowly, sitting, or conversing. Therefore, the metabolic rate was set to 1.2 MET, corresponding to “Sedentary activity (office, dwelling, school, laboratory)” as recommended in ISO 7730.
For the clothing ensemble, the summer attire commonly worn by passengers in the atrium was considered. According to ISO 7730, the total clothing insulation during summer typically ranges from 0.2 to 0.6 m2 · K/W. In the Airpak simulation, the following garments were selected: short-sleeved shirts/blouses (0.15 m2 · K/W), light-weight trousers (0.20 m2 · K/W), and a light summer jacket (0.25 m2 · K/W). The combined thermal insulation of 0.60 m2 · K/W falls within the standard range for light summer clothing. These settings appropriately reflect the realistic thermal conditions and attire of passengers within the cruise ship atrium during summer operation. Thus, the selected parameters ensure that the predicted PMV values accurately represent occupants’ thermal perception under realistic conditions.
The PMV index is typically divided into seven levels of thermal sensation, ranging from +3 (hot) to −3 (cold), with 0 representing a neutral condition, which are listed in Table 4. According to ISO 7730:2025 (Ergonomics of the Thermal Environment), thermal comfort is classified into three categories: Category A (−0.2 ≤ PMV ≤ +0.2), Category B (−0.5 ≤ PMV ≤ +0.5), and Category C (−0.7 ≤ PMV ≤ +0.7). In this study, Category B was adopted as the evaluation criterion. The cruise ship atrium serves as a large semi-public leisure and social space where passenger activity levels are generally light but occupant density and environmental variability are relatively high. Under such conditions, achieving an absolute precision of Category A is unnecessary and energy-intensive. Therefore, Category B provides a balanced and practical reference standard, ensuring an adequate level of thermal comfort for occupants while maintaining reasonable energy efficiency in HVAC operation.
Table 4.
PMV Values and Thermal Sensation Levels [20].
In this study, the effectiveness of air supply in the atrium is evaluated using two indicators: air age (LMA) and ventilation effectiveness. Air age refers to the time taken by air to travel from its entry point into a space until it is exhausted. At any given point in the room, the air is composed of molecules with different residence times, which can be described by a frequency distribution function and a cumulative distribution function . Their relationship is expressed as follows:
The local mean age of air (LMA) at a given point is defined as the mean residence time of air molecules at that location. When is known, it can be calculated as follows:
The ventilation effectiveness is defined as the ratio of the nominal time constant under ideal piston flow to the actual mean age of air under real ventilation conditions, and is expressed as follows:
where , is the nominal time constant of the room, is the room volume and is the ventilation rate.
From the perspective of fluid particle dynamics, a higher ventilation effectiveness indicates that the system can reduce the mixing of pollutants during air distribution and maintain a higher concentration of fresh air. On a whole-room scale, this indicator reflects the rate at which existing indoor air is replaced. When the ventilation effectiveness exceeds 50%, the ventilation system is generally considered to have good pollutant removal capability.
4.2. Selection of Representative Planes and Measurement Points
In the analysis of airflow organization in the atrium, it is essential to reasonably select representative planes and measurement points. The first deck of the cruise ship atrium is the core area of passenger activity, and due to its high occupant density and mobility, it was chosen as the primary focus of analysis. Eleven validation points were selected at a height of Z = 1.2 m on the first deck, as shown in Figure 6. Considering passenger height and activity status, two additional horizontal planes at Z = 1.0 m and Z = 1.8 m were also analyzed. Furthermore, to investigate the vertical distribution characteristics of thermal parameters, a vertical plane at Y = 3 m was selected for detailed analysis.
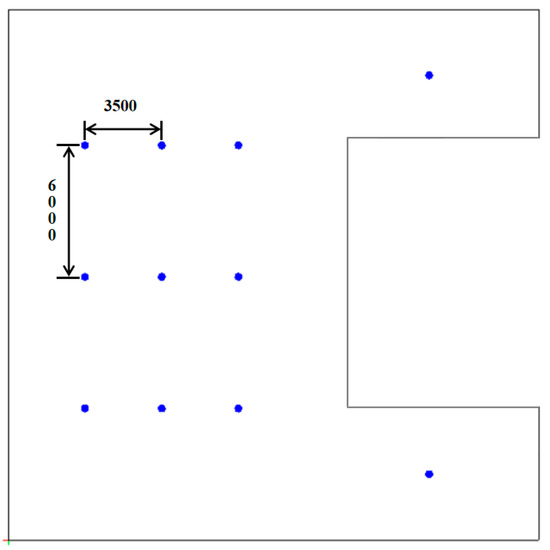
Figure 6.
Layout of measurement points in the cruise ship atrium.
4.3. Grid Independence Verification
In computational fluid dynamics (CFD) simulations, mesh quality is one of the most critical factors influencing numerical accuracy and convergence stability. Regular and structured grid elements—preferably with a low aspect ratio—help ensure the reliability of the simulation.
To verify grid independence, three different mesh resolutions were tested for the atrium model, including 1.12 million (coarse mesh, unrefined inlets), 2.57 million (medium mesh, refined inlets), and 3.64 million (fine mesh, refined inlets). The corresponding mesh configurations are shown in Figure 7.
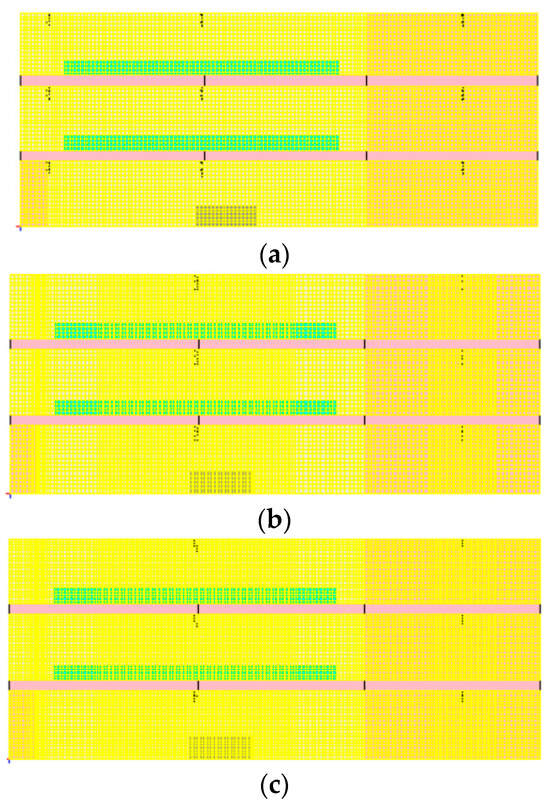
Figure 7.
Mesh generation of the cruise ship atrium model under different grid densities. (a) 1.12 million cells (unrefined inlets); (b) 2.57 million cells (refined inlets); (c) 3.64 million cells (refined inlets). (Yellow represents the mesh lines, orange indicates air supply inlets, green indicates exhaust outlets, and pink represents the walls.)
A comparison of temperature data at several representative monitoring points under different mesh sizes is presented in Figure 8. The results indicate that the temperature variation trends are consistent across all cases, and when the grid size increased from 2.57 million to 3.64 million, the difference in calculated temperatures was minimal. Therefore, the model with approximately 2.57 million grid cells was selected for subsequent simulations, balancing computational cost and result accuracy.
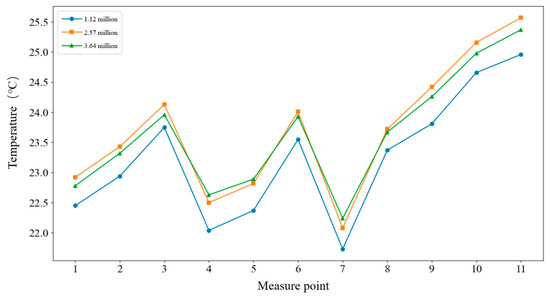
Figure 8.
Comparison of measured temperatures at monitoring points under different grid resolutions for grid independence verification.
4.4. Thermal Environment Analysis Under Different Air Supply Schemes
4.4.1. Boundary Conditions of Air Supply Schemes
To investigate the influence of diffuser arrangement, size, and air volume distribution on the thermal environment of the cruise ship atrium, five air supply cases were designed, as summarized in Table 5 and illustrated in Figure 9.
Table 5.
Boundary conditions of different air supply cases.
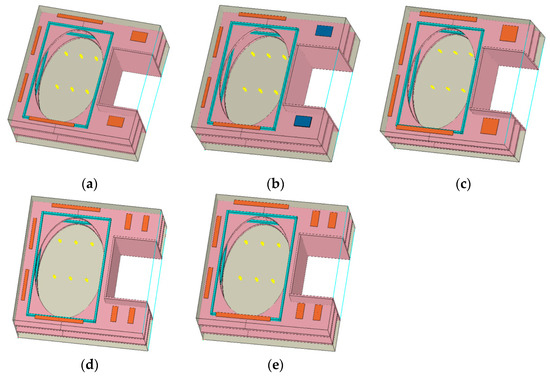
Figure 9.
Configurations of different air supply schemes. (a) Case 1; (b) Case 2; (c) Case 3; (d) Case 4; (e) Case 5. (Orange represents the air supply inlets, while blue indicates the modified air supply inlets in Case 2 with adjusted airflow rates.)
4.4.2. Temperature Field Analysis
The temperature distributions at Z = 1.0 m are shown in Figure 10, with overall atrium values between 22–25 . Corridors remained warmer than the hall due to limited space and heat transfer through bulkheads. Larger diffuser areas in Cases 3 and 5 produced more uniform temperatures and cooler corridors, although the extra 0.9 in Case 5 had little additional effect. Case 2 redistributed airflow to corridors, reducing hot spots but raising central hall temperatures. Case 4, which added two diffusers without increasing supply, caused uneven distribution and higher corridor temperatures, indicating that a single large diffuser is more effective than multiple smaller ones.
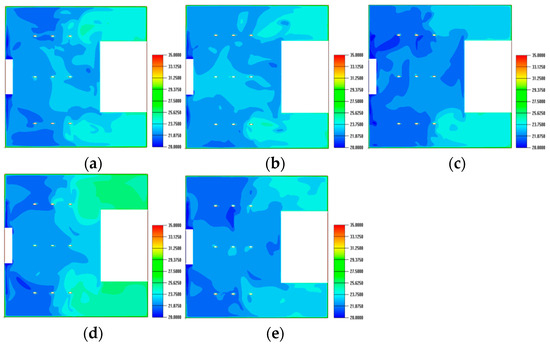
Figure 10.
Temperature distributions at Z = 1.0 m under different air supply schemes. (a) Case 1; (b) Case 2; (c) Case 3; (d) Case 4; (e) Case 5.
The results for Z = 1.8 m are presented in Figure 11.
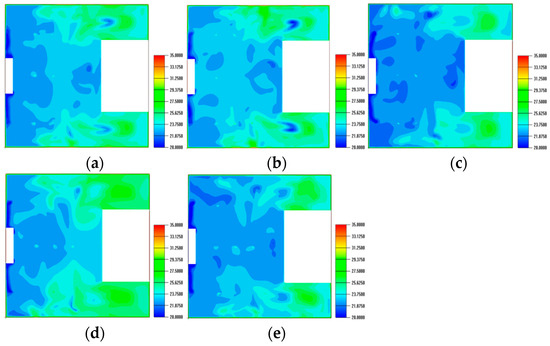
Figure 11.
Temperature distributions at Z = 1.8 m under different air supply schemes. (a) Case 1; (b) Case 2; (c) Case 3; (d) Case 4; (e) Case 5.
Temperatures at this elevation were generally higher than at Z = 1.0 m. Diffuser area and arrangement had a significant effect on the thermal field. Case 3 demonstrated that larger diffuser areas improve uniformity at this height, while redistribution of corridor airflow (Case 2) showed negligible impact.
The vertical temperature distributions at Y = 3.0 m are shown in Figure 12.
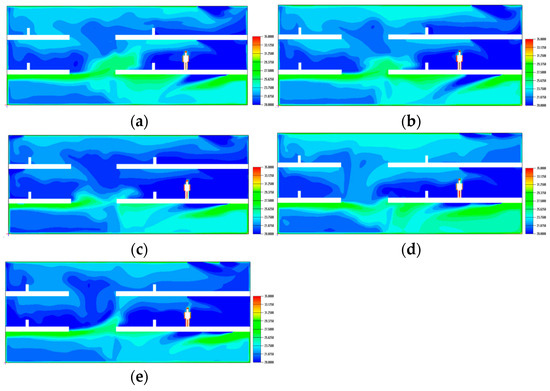
Figure 12.
Temperature distributions at Y = 3.0 m under different air supply schemes. (a) Case 1; (b) Case 2; (c) Case 3; (d) Case 4; (e) Case 5.
The second deck maintained lower and more uniform temperatures than the first and third decks due to smaller temperature gradients, suggesting reduced airflow could be considered. On the first deck, ceiling stratification occurred because supply air was directed mainly downward and exhaust placement limited heat removal. The third deck exhibited elevated ceiling temperatures from external heat transfer. Case 2 increased corridor airflow, enlarging cooler regions but failing to eliminate stratification. Cases 3 and 5, with larger diffuser areas, lowered overall temperatures, with Case 5 providing the most uniform distribution due to greater supply volume.
Temperatures at selected points are compared in Figure 13 as follows.
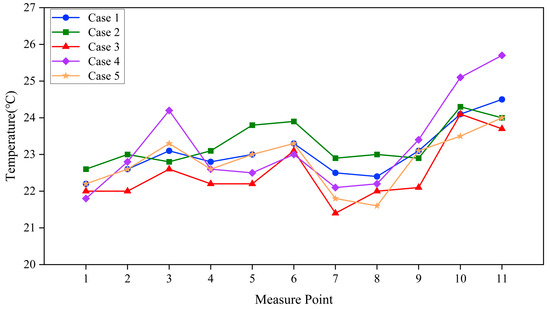
Figure 13.
Temperature comparison at representative points under different air supply schemes.
Corridors consistently exhibited higher values than the main hall. Case 4 showed the largest fluctuations, likely caused by airflow interference from the additional diffusers, which reduced ventilation effectiveness. Cases 3 and 5, with larger diffuser areas, achieved lower overall temperatures. In Case 2, the redistribution of airflow increased corridor supply but decreased hall supply, raising central hall temperatures.
4.4.3. PMV Analysis
The PMV distributions at Z = 1.0 m under different air supply schemes are illustrated in Figure 14.
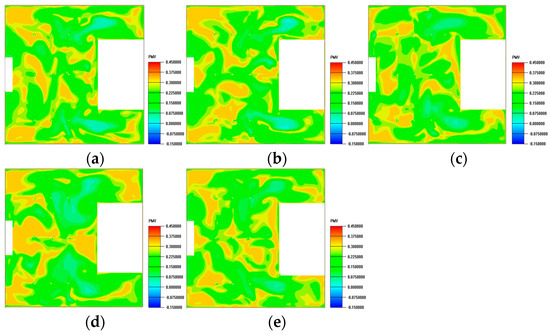
Figure 14.
PMV distributions at Z = 1.0 m under different air supply schemes. (a) Case 1; (b) Case 2; (c) Case 3; (d) Case 4; (e) Case 5.
The atrium, as a social activity space, was evaluated under light activity conditions. Across all five cases, PMV values ranged between −0.15 and 0.45, indicating a generally comfortable environment classified as “slightly warm”. In Cases 1 and 2, PMV values near the corridor diffusers were lower; Case 2, with increased corridor airflow, produced slightly cooler conditions there but raised PMV values in the main hall due to reduced supply. Case 3, with larger diffuser areas, achieved the most uniform and comfortable distribution. Case 4 showed higher PMV near the walls, enlarging the slightly warm zone in the hall center. Case 5, with increased airflow compared to Case 3, yielded slightly higher PMV values overall.
4.4.4. Velocity Field Analysis
The velocity distributions at Z = 1.0 m under different air supply schemes are shown in Figure 15.
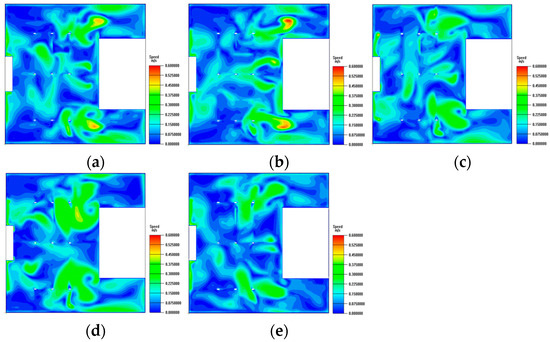
Figure 15.
Velocity distributions at Z = 1.0 m under different air supply schemes. (a) Case 1; (b) Case 2; (c) Case 3; (d) Case 4; (e) Case 5.
Overall air velocity ranged from 0 to 0.4 m/s, which is within the comfort range for most occupants. Higher velocities were observed near entrances and corridor junctions, caused by structural constraints and opposing jets between corridor and hall diffusers.
Case 3, with larger diffuser areas, produced a more uniform velocity field and reduced corridor air speeds, leading to improved airflow organization. In contrast, Case 2, with increased corridor airflow, generated locally excessive velocities. Case 4, which added corridor diffusers, further expanded high-velocity zones and disrupted airflow. Case 5, by enlarging both diffuser area and supply volume, mitigated some of the negative effects observed in Case 4, reducing the extent of high-speed regions.
The vertical velocity distributions along Y = 3.0 m are presented in Figure 16.
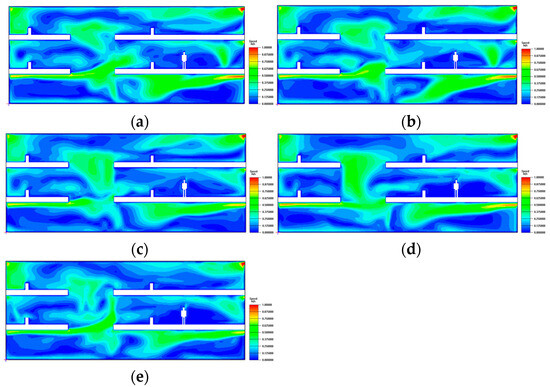
Figure 16.
Velocity distributions at Y = 3.0 m under different air supply schemes. (a) Case 1; (b) Case 2; (c) Case 3; (d) Case 4; (e) Case 5.
Air velocities were higher near exhaust outlets, with fast-flow regions concentrated in the upper atrium. This was mainly due to buoyancy effects, as heat transfer through the top and bottom decks induced upward movement of warm air and downward flow of cooler air.
All cases showed similar vertical patterns, with relatively low velocities in the lower zone, providing minimal draft sensation for occupants. However, Case 2 produced a distinct high-velocity zone near the corridor base, which may adversely affect thermal comfort.
4.4.5. Air Age Analysis
The air age distributions at Z = 1.0 m under different air supply schemes are shown in Figure 17 as follows.
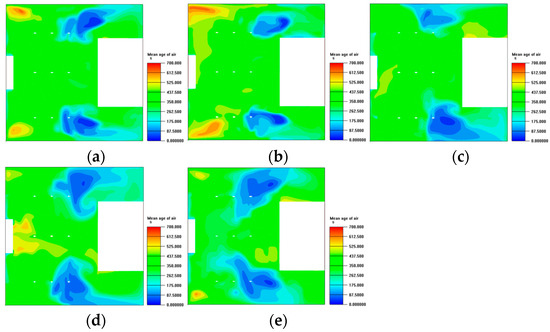
Figure 17.
Air age distributions at Z = 1.0 m under different air supply schemes. (a) Case 1; (b) Case 2; (c) Case 3; (d) Case 4; (e) Case 5.
Air age reflects ventilation effectiveness and the freshness of indoor air. Across most of the atrium, values ranged from 200 to 300 s, which ensures adequate air renewal in such a large space. Localized zones near the walls reached up to 600 s, likely because diffusers were positioned farther from the enclosure, limiting fresh air penetration. By contrast, corridor regions close to diffusers exhibited much lower values (0–100 s) due to rapid replacement by supply air.
Overall, the five cases showed similar distributions. Case 3 achieved the most uniform results, with no areas of excessively high air age, as the enlarged diffuser areas enhanced airflow diffusion and improved air exchange.
5. Conclusions
This research thoroughly examined the thermal load characteristics and thermal environment of a cruise ship atrium using both full-scale experiments and CFD models. According to ISO-7547 design criteria, the overall thermal load of the atrium was assessed at 28,784 W, and the necessary summer air supply volume was established at 10,742 m3/h. A computational model utilizing the RNG - turbulence model was validated with experimental data and later employed to evaluate various ventilation strategies concerning thermal comfort and airflow distribution. The primary conclusions are as follows:
- Experimental validation demonstrated that the RNG - model more precisely replicated the vertical temperature distribution of the atrium in comparison to the regular - model. This underscores its appropriateness for recreating expansive, layered environments like cruise ship atriums.
- Augmenting diffuser regions (Cases 3 and 5) markedly enhanced the homogeneity of temperature distributions, mitigated localized overheating, and facilitated more efficient air exchange. Case 5, characterized by an increased supply capacity, further improved airflow homogeneity but exhibited only slight enhancements in thermal comfort compared to Case 3.
- The redistribution of airflow towards the corridors (Case 2) significantly diminished high-temperature areas adjacent to the corridors; nevertheless, it elevated the temperature and PMV values in the central hall, highlighting the trade-off between localized enhancement and overall comfort.
- Simply augmenting the quantity of corridor diffusers without modifying the supply volume (Case 4) led to airflow disruption and enlarged high-velocity areas, therefore undermining comfort. This suggests that diffuser dimensions and air volume are more essential than the number of diffusers in attaining a balanced interior atmosphere.
- The examination of thermal comfort indicators, such as PMV and air age, indicated that the majority of schemes sustained PMV between −0.15 and 0.45, reflecting slightly warm yet tolerable circumstances. Case 3 exhibited the most equitable performance, integrating temperature homogeneity, diminished air age, enhanced airflow organization, and consistent comfort levels.
This study developed a systematic framework for the integration of load computation, experimental validation, and CFD analysis in assessing cruise ship atrium environments. The results furnish theoretical insights for optimizing HVAC design in expansive public areas of cruise ships and present practical solutions to improve passenger comfort while minimizing energy usage.
Author Contributions
Conceptualization, methodology, software, validation, formal analysis, data curation, visualization, writing—review and editing, D.L.; supervision, writing—review & editing, J.Z.; resources, data curation, and formal analysis, Y.B. and X.Z.; literature collection, conceptualization, H.G. and N.L.; methodology, resources, D.Q. and K.W. All authors have read and agreed to the published version of the manuscript.
Funding
This research received no external funding.
Institutional Review Board Statement
Not applicable.
Data Availability Statement
The original contributions presented in this study are included in the article. Further inquiries can be directed to the corresponding author.
Acknowledgments
We would like to thank the anonymous referees for their helpful comments and suggestions.
Conflicts of Interest
Author Yichao Bai was employed by the Shanghai Waigaoqiao Shipbuilding Co., Ltd. Author Xinqiao Zhang was employed by the CSSC Cruise Technology Development Co., Ltd. The remaining authors declare that the research was conducted in the absence of any commercial or financial relationships that could be construed as a potential conflict of interest.
Abbreviations
The following abbreviations are used in this manuscript:
| CFD | Computational Fluid Dynamics |
| BES | Building Energy Simulation |
| JOS | Joint System Thermoregulation Model |
| RNG | Renormalization Group |
| HVAC | Heating, Ventilation, and Air Conditioning |
| PMV | Predicted Mean Vote |
| LMA | Local Mean Age of Air |
| ISO | International Organization for Standardization |
| PPD | Predicted Percentage of Dissatisfied |
| HAP | Hourly Analysis Program |
| DeST | Designer’s Simulation Toolkits |
| LED | Light Emitting Diode |
| ASHRAE | American Society of Heating, Refrigerating and Air-Conditioning Engineers |
References
- Palella, B.I.; Quaranta, F.; Riccio, G. On the Management and Prevention of Heat Stress for Crews Onboard Ships. Ocean Eng. 2016, 112, 277–286. [Google Scholar] [CrossRef]
- Jin, Z.; Qi, X. Study on Heat Load Characteristics of Ship Refrigeration Systems. China Ship Res. 2007, 3, 59–62. (In Chinese) [Google Scholar]
- Charisis, G.C.; Karakatsanis, S.T. Calculation Methods for a Complete Air Conditioning Study: Case Study of an Industrial Installation. Struct. Surv. 2012, 30, 460–474. [Google Scholar] [CrossRef]
- Wu, R. Research and Application of Rapid Load Calculation Software. Master’s Thesis, Hunan University, Changsha, China, 2012. (In Chinese). [Google Scholar]
- Thiangchanta, S.; Chatchawan, C. The Multiple Linear Regression Models of Heat Load for Air-Conditioned Rooms. Energy Rep. 2020, 6, 972–977. [Google Scholar] [CrossRef]
- AlHarbi, F. Comparison of Cooling Load Calculations by E20 and HAP Software. Univ. J. Mech. Eng. 2019, 7, 285–298. [Google Scholar] [CrossRef]
- Zhao, H.; Li, Y.; Zhang, T.; Chen, Y.; Wang, X.; Liu, M.; Sun, Q.; Gao, R.; Zhou, P.; Xu, L.; et al. Analysis of Thermal Environment, Energy Consumption Changing Patterns, and Influencing Factors in Large Spaces Based on Dynamic Co-simulation Platform. J. Build. Eng. 2025, 103, 112049. [Google Scholar] [CrossRef]
- Luo, Q.; Ou, C.; Li, Y.; Luo, Z.; Tian, W.; Zeng, L.; Hang, J. Optimal Natural and HVAC Ventilation to Balance Passenger Infection Risk and Thermal Comfort across Seasons on a Cruise Ship. Build. Environ. 2025, 282, 113306. [Google Scholar] [CrossRef]
- ISO 7730:2025; Ergonomics of the Thermal Environment—Analytical Determination and Interpretation of Thermal Comfort Using Calculation of The PMV and PPD Indices and Local Thermal Comfort Criteria. International Organization for Standardization: Geneva, Switzerland, 2025.
- Zhou, B.; Huang, Y.; Nie, J.; Ding, L.; Sun, C.; Chen, B. Modification and Verification of the PMV Model to Improve Thermal Comfort Prediction at Low Pressure. J. Therm. Biol. 2023, 117, 103722. [Google Scholar] [CrossRef] [PubMed]
- Fiala, D.; Havenith, G. Modelling Human Heat Transfer and Temperature Regulation. In The Mechanobiology and Mechanophysiology of Military-Related Injuries; Gefen, A., Epstein, Y., Eds.; Studies in Mechanobiology, Tissue Engineering and Biomaterials; Springer: Cham, Switzerland, 2016; Volume 19, pp. 265–302. [Google Scholar] [CrossRef]
- Mateus, M.N.; Graça, D.C.G. Simulated and Measured Performance of Displacement Ventilation Systems in Large Rooms. Build. Environ. 2017, 114, 470–482. [Google Scholar] [CrossRef]
- Chu, G.; Liu, X.; Gao, Q.; Guo, X.; Shen, W. Influence of Air Supply Parameters of Building Atrium on Air Conditioning Effect in Winter. Procedia Eng. 2017, 205, 1913–1919. [Google Scholar] [CrossRef]
- Wang, L.; Kumar, P.; Makhatha, M.E.; Jagota, V. Numerical Simulation of Air Distribution for Monitoring the Central Air Conditioning in Large Atrium. Int. J. Syst. Assur. Eng. Manag. 2021, 13 (Suppl. S1), 340–352. [Google Scholar] [CrossRef]
- Che, C.; Lv, Z.; Wei, J.; Wang, X.; Zhao, M. Optimization of Atrium Thermal Environment in Summer Based on DeST Platform. Integr. Ferroelectr. 2023, 236, 109–129. [Google Scholar] [CrossRef]
- Kim, G.; Schaefer, L.; Lim, T.S.; Kim, J.T. Thermal Comfort Prediction of an Underfloor Air Distribution System in a Large Indoor Environment. Energy Build. 2013, 64, 323–331. [Google Scholar] [CrossRef]
- Nada, S.A.; El-Batsh, H.M.; Elattar, H.F.; Ali, N.M. CFD Investigation of Airflow Pattern, Temperature Distribution and Thermal Comfort of UFAD Systems for Theater Buildings. J. Build. Eng. 2016, 6, 274–300. [Google Scholar] [CrossRef]
- ISO 7547:2022; Ships and Marine Technology—Air-Conditioning and Ventilation of Accommodation Spaces and Other Enclosed Compartments on Board Ships—Design Conditions and Basis of Calculations. International Organization for Standardization: Geneva, Switzerland, 2022.
- GB/T 13409–1992; Design Conditions and Calculation Methods for Air-Conditioning and Ventilation of Ship Accommodation Spaces. Chinese Standards Press: Beijing, China, 1992.
- Wu, Y.; Tang, W.; Wang, M.; Wang, Y.; Deng, Q. Study on New Natural Ventilation Performance Based on Seat Air Supply in Gymnasiums. Buildings 2025, 15, 1600. [Google Scholar] [CrossRef]


Disclaimer/Publisher’s Note: The statements, opinions and data contained in all publications are solely those of the individual author(s) and contributor(s) and not of MDPI and/or the editor(s). MDPI and/or the editor(s) disclaim responsibility for any injury to people or property resulting from any ideas, methods, instructions or products referred to in the content. |
© 2025 by the authors. Licensee MDPI, Basel, Switzerland. This article is an open access article distributed under the terms and conditions of the Creative Commons Attribution (CC BY) license (https://creativecommons.org/licenses/by/4.0/).