Abstract
Counter-current, spontaneous imbibition of brine into oil-saturated rocks is a critical process for recovery of bypassed oil in carbonate reservoirs. However, the classic Amott-cell test introduces experimental artifacts that distort the true dynamics of oil recovery, complicating the interpretation and modeling of recovery histories. In this study, we applied a modified Amott procedure to eliminate these artifacts, producing smooth and reproducible recovery histories for both water-wet and mixed-wet carbonate core plugs saturated with brine and oil. By applying Generalized Extreme Value (GEV) statistics, we modeled cumulative oil production and showed that a GEV model is able to capture the essentially non-equilibrium nature of spontaneous imbibition. Our results demonstrate that water-wet systems exhibit faster recovery rates and shorter induction times due to favorable capillary forces, while mixed-wet samples have slower dynamics and longer induction times, reflecting the influence of wettability alterations. We demonstrate that the GEV fitting parameters systematically correlate with key rock–fluid properties, such as wettability, oil viscosity, and pore network characteristics, offering a semi-quantitative approach to analyze recovery behavior. This study demonstrates the potential of a GEV-based statistical model to deepen understanding of the spontaneous imbibition mechanisms and to enhance predictive capabilities for oil production dynamics.
1. Introduction
Capillarity-driven, counter-current spontaneous imbibition is the key process that increases oil recovery from mixed-wet carbonate reservoir zones that have been exposed to water injection or are close to oil–water contact. Either way, average water saturation is high. The essentially non-equilibrium dynamics [1] of imbibition and ultimate recovery depend strongly on reservoir rock wettability [2,3]. Adsorption of polar crude oil compounds, such as asphaltenes, alters wettability, making larger pore surfaces oil-wet while smaller pores, pore corners, and rough surfaces remain water-wet, forming mixed wettability [4,5]. This mixed wettability hinders capillary-driven recovery and complicates waterflooding, particularly in carbonate reservoirs with complex pore structures [6].
Low- or modified-salinity waterflooding injects brines with altered composition to modify rock wettability toward water-wet conditions, enhancing spontaneous imbibition and oil recovery [7,8]. While many studies have explored wettability alteration and identified optimal brine compositions for improved recovery, these findings often lack a clear understanding of the underlying mechanisms [9,10,11,12,13,14,15]. Consequently, experimental results can rarely be applied at reservoir scale.
The dynamics of oil recovery are closely linked to the displacement processes occurring within reservoir cores, which offer valuable insights into underlying recovery mechanisms and support the development of more efficient and cost-effective production strategies [3,16]. In particular, analyzing spontaneous imbibition dynamics at the pore scale reveals fluid displacement behavior that can guide the selection of optimal brine compositions during laboratory screening. Although numerous models have been developed to simulate spontaneous imbibition, comparatively less attention has been paid to designing experiments that improve mechanistic understanding and predictive capability [17]. To interpret the shapes of production curves meaningfully, several critical factors must be taken into account.
One critical aspect of dynamic experiment is re-evaluating variables relevant to spontaneous imbibition in mixed-wet rocks. Many studies examine brine imbibition into fully oil-saturated core plugs without initial water saturation [18,19,20]. While simplifying experimental and modeling protocols, this approach fails to reflect dynamic and non-equilibrium reservoir conditions, where imbibition never approaches a steady state [1]. Spontaneous imbibition of water into oil-saturated rocks containing a finite amount of initial water is a dynamic invasion percolation process influenced by pore-scale mechanisms including snap-off, cooperative pore–body filling, and oil bypassing [21]. These processes, in turn, depend on pore geometry [21], rock wettability [2,3], and initial water saturation [2,22], which control pore-level dynamics. Thus, accounting for initial water saturation is essential for realistic experimental designs and interpretations useful for field-scale applications.
The second key aspect is minimizing experimental artifacts that distort imbibition dynamics and hinder accurate interpretation and modeling of oil recovery curves. The Amott test [23] simulates spontaneous imbibition governed by capillarity and wettability, and is commonly used for evaluating the impact of brine composition on oil recovery. However, while the classic Amott test provides ultimate recovery values, it introduces artifacts that misrepresent oil production dynamics, such as oil holdup at the core surface and delayed production onset [3,24,25,26,27,28,29,30]. As a result, production curves become jagged and challenging to interpret or model. Methods such as manual shaking, gravimetric recovery measurements, mechanical droplets removal, and centrifuge-assisted imbibition have been attempted to mitigate oil holdup effects [3,24,26,28,31], but none of these methods have consistently produced smooth recovery histories.
In our earlier study [32], we introduced a modified Amott-cell procedure that effectively mitigated external oil holdup and enhanced the resolution of recovery dynamics for water-wet Indiana limestone rock samples saturated with mineral oil. In the present work, this analysis is expanded to include brine imbibition into mixed-wet limestone samples saturated with crude oil, which present additional experimental complexities. Our findings demonstrate that the improved Amott methodology results in smooth and reproducible oil recovery histories across core plugs exhibiting different wettability conditions.
Numerous studies have proposed modeling approaches for spontaneous imbibition. Classical simulations typically rely on fitting equilibrium capillary pressure and steady-state relative permeability curves to experimental data [33,34,35,36]. However, spontaneous imbibition is inherently a non-equilibrium multiphase flow process, where the assumptions of static capillarity break down. The Young–Laplace equation, which governs interface curvature under equilibrium, no longer applies: flow occurs so rapidly that fluid interfaces do not have sufficient time to attain constant-mean-curvature configurations. As a result, the use of static capillary pressure and relative permeability curves—often applied without due caution—loses validity. Classical models, by ignoring this non-equilibrium character, lack predictive power and cannot be reliably scaled, even if they reproduce specific experimental results. These fundamental limitations, and approaches to overcome them, were articulated more than two decades ago by Barenblatt et al. [1] and the references therein, yet remain largely unacknowledged by much of the current technical community working in this field. It has been clearly demonstrated by Barenblatt et al. [1], and later corroborated by Guen and Kovscek [37] and Schembre and Kovscek [38], that the classical mathematical model fails to accurately reproduce spontaneous imbibition in complex porous media due to its omission of non-equilibrium effects.
We developed a different scaling approach that models spontaneous imbibition without disregarding its non-equilibrium behavior. We applied Generalized Extreme Value (GEV) statistics to model experimental cumulative oil production. The GEV statistics [39] represent extreme event distributions and have been used to model gas production in U.S. shale reservoirs [40] and in many references cited therein (see p. 5), where gas production from an individual well was interpreted as the maximum potential output of that well. In the context of spontaneous imbibition, the release of oil droplets is considered analogous: each droplet corresponds to the maximum volume that a given rock surface area can retain against capillary and gravitational forces. Thus, we posit that the GEV distribution can effectively model the distribution of produced oil droplets in the Amott imbibition test.
In our earlier work, we have applied GEV statistics to model cumulative oil production for water-wet limestone core plugs [32]. Our results demonstrate that the GEV modeling parameters systematically correlate with key physical characteristics of the oil–rock systems, such as oil viscosity and rock permeability. In this work, we extend the application of GEV statistics to model experimental production from carbonate core plugs with altered wettability.
2. Materials and Methods
2.1. Brines
Brine solutions were prepared using ACS or reagent-grade chemicals (Fisher Scientific, Hampton, NH, USA) and purified water (Milli-Q Advantage A10 system, Millipore, Burlington, MA, USA). The compositions of brines used in this study are summarized in Table 1. Brines containing only chloride salts are labeled as “Chlor,” followed by molar concentration of chloride; for instance, 0.1M NaCl solution is denoted as Chlor0.1. Brines containing carbonate and bicarbonate salts are abbreviated as “Carb” and “Bicarb” followed by carbonate/bicarbonate concentration, respectively. Because calcite slightly dissolves in brines and core plugs were used in multiple tests, all brine solutions were equilibrated with CaCO3 and atmospheric CO2 for a minimum of 24 h, followed by filtration prior to use to minimize samples dissolution during saturation.

Table 1.
Chemical composition and physical properties of the brines utilized for core plug saturation and spontaneous imbibition experiments.
Brine pH measurements were conducted at room temperature using a Thermo Scientific pH meter. Mineral oil/brine and crude oil/brine interfacial tension (IFT) were measured at 60 °C with an Automated Tensiometer (Rame-hart Instruments Co., Succasunna, NJ, USA). The crude oil–brine mixtures were equilibrated at 60 °C for three days before measurements were conducted. Table 1 lists IFT values obtained with mineral oil for the Chlor0.1 brine and with crude oil for the remaining brines.
2.2. Oils
Different-density mineral oils (Fisher Scientific) were used in this study. Light mineral oil was diluted with hexadecane (85 wt.% and 15 wt.%, respectively) to achieve similar viscosity to crude oil, and referred to as Mineral-1. Heavy mineral oil, labeled as Mineral-2, was used without further treatment. Oil density and viscosity were analyzed using an Anton Paar densitometer DMA4500 and rheometer MCR 302/CC27 (Anton Paar, Graz, Austria).
Dead crude oil sourced from a carbonate reservoir was utilized for core plug aging. For all experiments and analyses, the crude oil was stirred and applied without filtration. The physico-chemical characterization of crude oil was conducted by the SLB Reservoir Laboratory in Dhahran. Table 2 summarizes the characteristics of the mineral and crude oils.

Table 2.
Physical and chemical characteristics of mineral and crude oils utilized for core plug saturation.
2.3. Core Plugs
Indiana limestone (IL) core plugs, 1.5 in. × 12 in. in size (Kocurek Industries Inc., Caldwell, TX, USA), were sectioned into 3-inch samples and used in all experiments without cleaning. In the repetitive tests, after the first imbibition run, the core plug was cleaned with dichloromethane using Soxhlet extraction, then dried in an oven at 60 °C overnight. Porosity () and permeability () of a core plug were determined using 0.1 M NaCl brine in the Basic Core Flood System (CFSH2B, MetaRock Laboratories, Houston, TX, USA). The core plug saturation and flooding were conducted at 500 psi confining pressure with a 150 psi back pressure. Table 3 summarizes the petrophysical data of the core plugs used in this study.

Table 3.
Petrophysical properties of Indiana limestone (IL) rock samples and conditions of spontaneous imbibition testing. The postfixes (a and b) in the sample code indicate subsequent experiments conducted on the same core plug. Core plugs IL-7 and IL-23 were first tested using mineral oil and later in crude oil experiments, denoted as (m) and (c), respectively.
2.4. Core Plug Saturation and Aging
A dry rock sample was saturated with brine using a 10-Cell System (MetaRock Laboratories, Houston, TX, USA). The core plug was first placed in a stainless-steel holder with a Viton sleeve and confined at 500 psi. Evacuation was performed for several hours until a vacuum of 5.8 × 10⁻³ psi (300 mTorr) was reached. The plug was then saturated by introducing brine from a calibrated burette at the inlet. Subsequently, the brine-saturated plug was displaced with oil. To promote uniform oil distribution, a hydrophilic ceramic porous plate was installed at the base of the plug. Oil injection was conducted at 500 psi confining pressure under ambient temperature conditions. A pore pressure of 80 psi was maintained during the whole saturation process. Average oil saturation was calculated from the volume of displaced brine collected in a calibrated burette attached to the outlet.
In all mineral oil tests, the core plugs were saturated with 0.1 M NaCl brine. Mineral oil was subsequently injected at room temperature until oil saturation of 70–80% was achieved, which generally required 2 or 3 days. For crude oil tests, core plugs were saturated with brines of varying compositions and then subjected to aging (see Table 1). Crude oil was injected at room temperature until oil saturation of 60–70%. Then, the pore pressure was reduced to 35–40 psi and the core holder was heated up to 60 °C for core aging. The core aging was performed for 4 weeks. Based on industrial experience, these conditions are considered sufficient to establish mixed wettability [41]. The final values of oil saturation () are reported in Table 3.
2.5. Spontaneous Imbibition Experiments
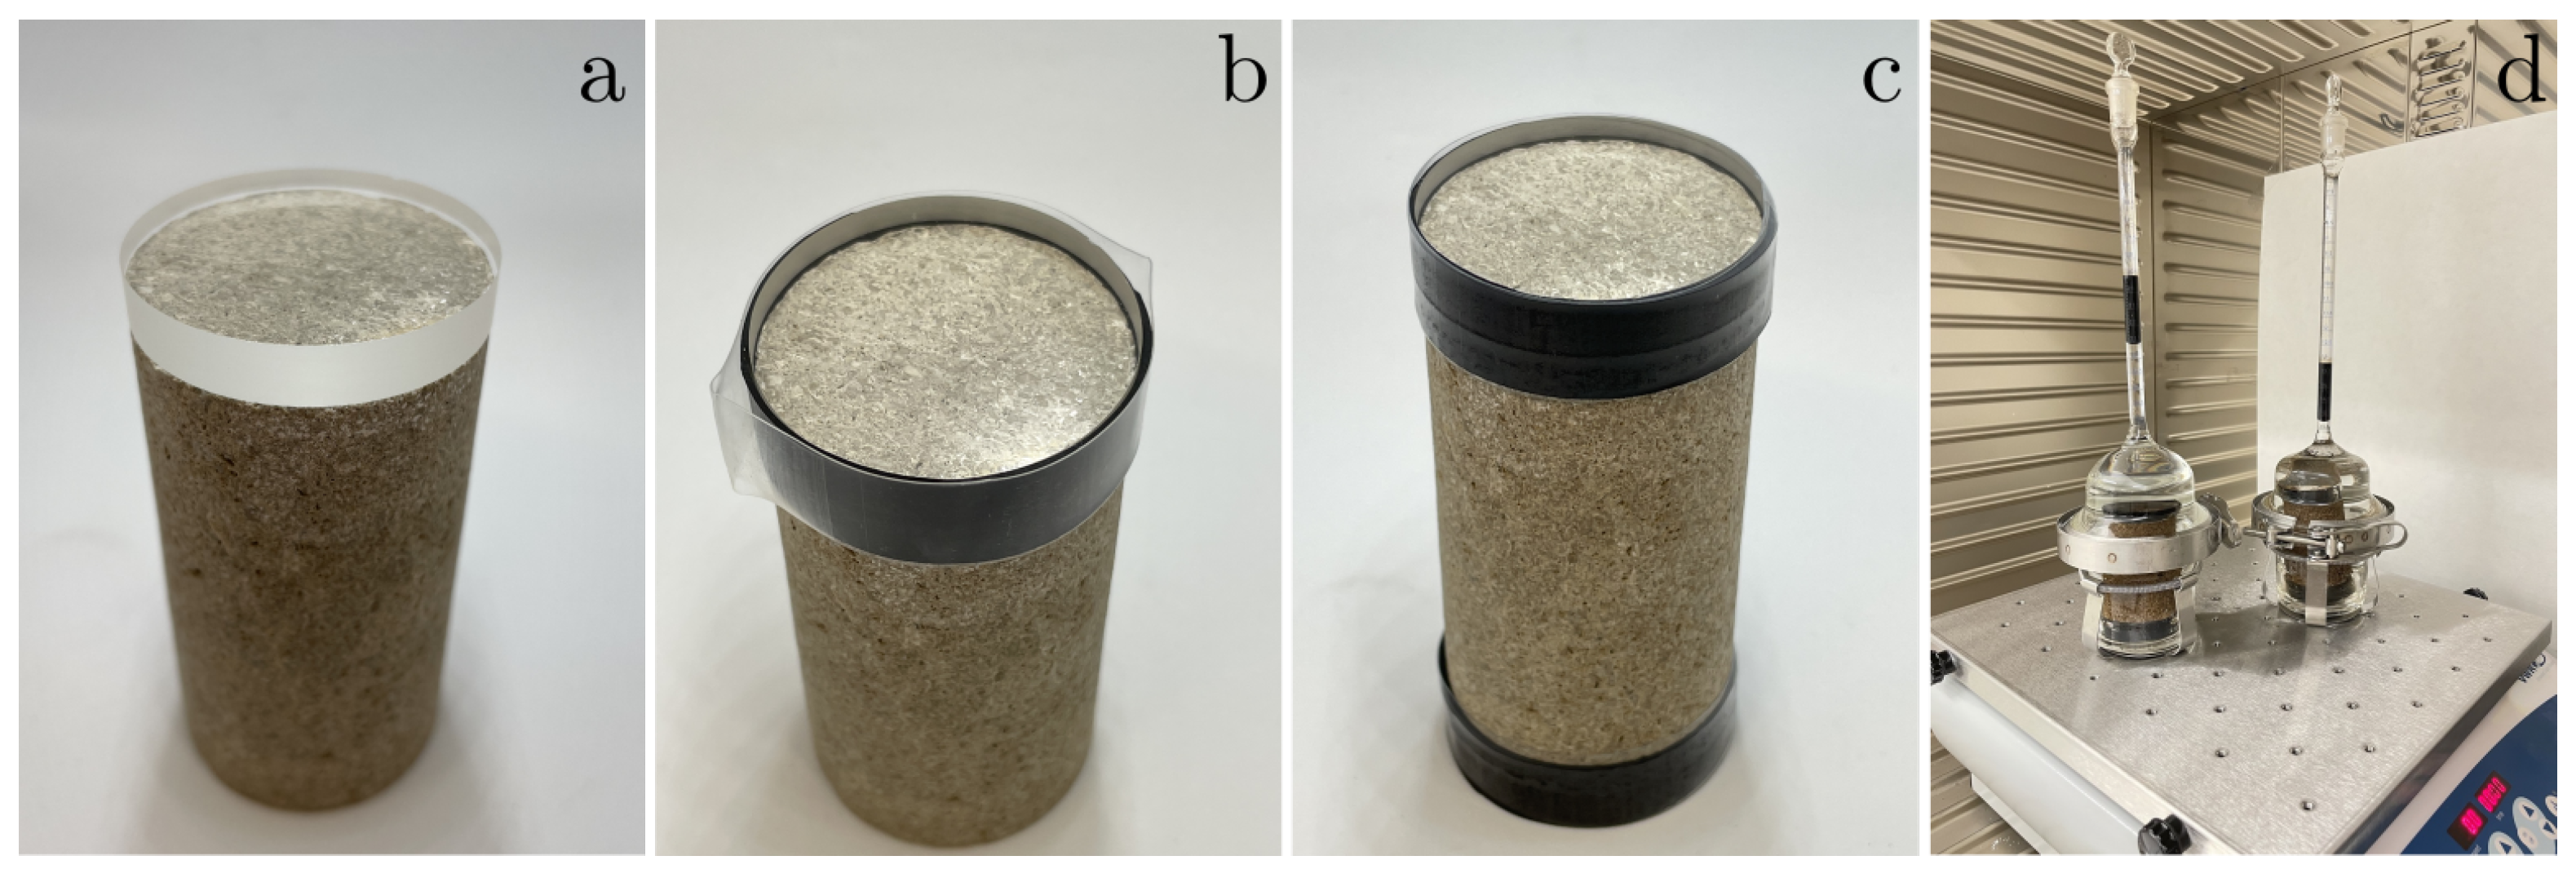
The modified Amott-cell spontaneous imbibition experimental procedure [32] was used to study oil recovery. After core plug saturation and aging, both faces of the core plug were sealed with glass discs, as illustrated in Figure 1. Introduced modification reduces axial flow and prevents oil droplet retention on the upper surface of the core. The rock sample with sealed faces was positioned in a custom-made Amott cell. The new design allowed maintaining lateral stability of the core plug during cell orbital motion. Preheating and degassing of the brine before each run minimized gas bubbles formation on the rock surface.
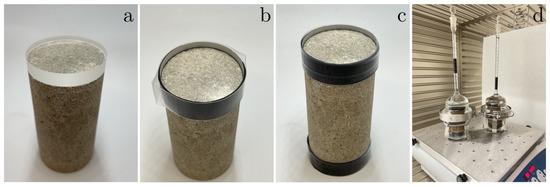
Figure 1.
Preparation of Indiana limestone sample for the spontaneous imbibition test: (a) Two glass discs seal core plug faces. (b) Heat-shrinkable Viton and Teflon bands fix the glass discs to core faces. (c) Rock sample is ready for testing. (d) Two Amott cells are mounted on a shaker platform and are ready for testing. Refer to [32] for details.
An Amott cell was fixed on the platform of an orbital shaker. The shaker, holding two Amott cells, was placed inside an oven, as illustrated in Figure 1. The experiment was performed at 60 °C to simulate reservoir conditions. The shaker maintained continuous orbital motion during the whole experiment. This modification minimized droplet retention on the core and provided a smooth, continuous oil production history. A rotation speed of 200 RPM was found to be optimal for facilitating the external oil snap-off while maintaining the stability of the glass Amott cell during imbibition experiments. We have previously shown that the selected experimental conditions do not impact either the initial production delay or the maximal oil production [32].
Regular short pauses of shaking were performed to record oil recovery. Produced mineral/crude oil volume was estimated visually using a calibrated burette. The details on our experimental procedure are available in [32].
2.6. GEV Modeling of Oil Production Dynamics
The exact protocol of using Generalized Extreme Value (GEV) statistics [39] to model experimental oil production for core plugs with non-zero initial water saturation is detailed in our previous contribution [32]. Below, we present the key elements of our approach. The main idea behind using GEV to model oil recovery in an Amott experiment is that each oil droplet corresponds to the maximum volume that a given rock surface area can retain against capillary and gravitational forces. The distribution of droplet sizes and their frequency of appearance are described by an extreme value probability density function (pdf). The integral of the pdf, the cumulative distribution function (cdf), corresponds to the scaled cumulative recovery function RF.
It is well known that in a generalized extreme value distribution of a random variable with outcomes x, defines the location parameter, defines the scale parameter, and defines the shape parameter. The probability density function is given by
The cumulative distribution function (cdf) is obtained by integrating Equation (1) with respect to x. For the case ,
Cumulative oil recovery was normalized by the ultimate recovery from Amott-cell tests, giving . The experimental time t was scaled by characteristic capillary pressure diffusion time, [42], , which replaces x in Equations (1) and (2). The parameters , , , and were obtained by fitting the data to Equation (2) using a four-parameter Nelder–Mead simplex algorithm.
The outcomes of GEV modeling (, , , and ) reflect characteristics of the oil–brine–rock systems, including oil viscosity, rock permeability, and rock wettability state. In Section 3 we demonstrate that GEV modeling allows for a qualitative estimation of oil recovery dynamics based on experimental settings. In our prior study [32], we provide details on the transformation of the GEV cdf curves depending on variations in the GEV fitting parameters.
3. Results and Discussion
We begin our discussion by addressing the challenges associated with the classic Amott-cell experiment. We demonstrate that well-designed, artifact-free experiments enhance result interpretation and significantly improve the reproducibility of experimental data. Next, we present spontaneous imbibition experiments and modeling results for water-wet and mixed-wet Indiana limestone cores, and analyze the influence of oil–rock system properties on the dynamics of oil production. We show that the Generalized Extreme Value (GEV) statistics can successfully describe the spontaneous imbibition process. Finally, we address the issue of core plug contamination with crude oil.
3.1. Artifacts of the Classic Amott-Cell Experiment
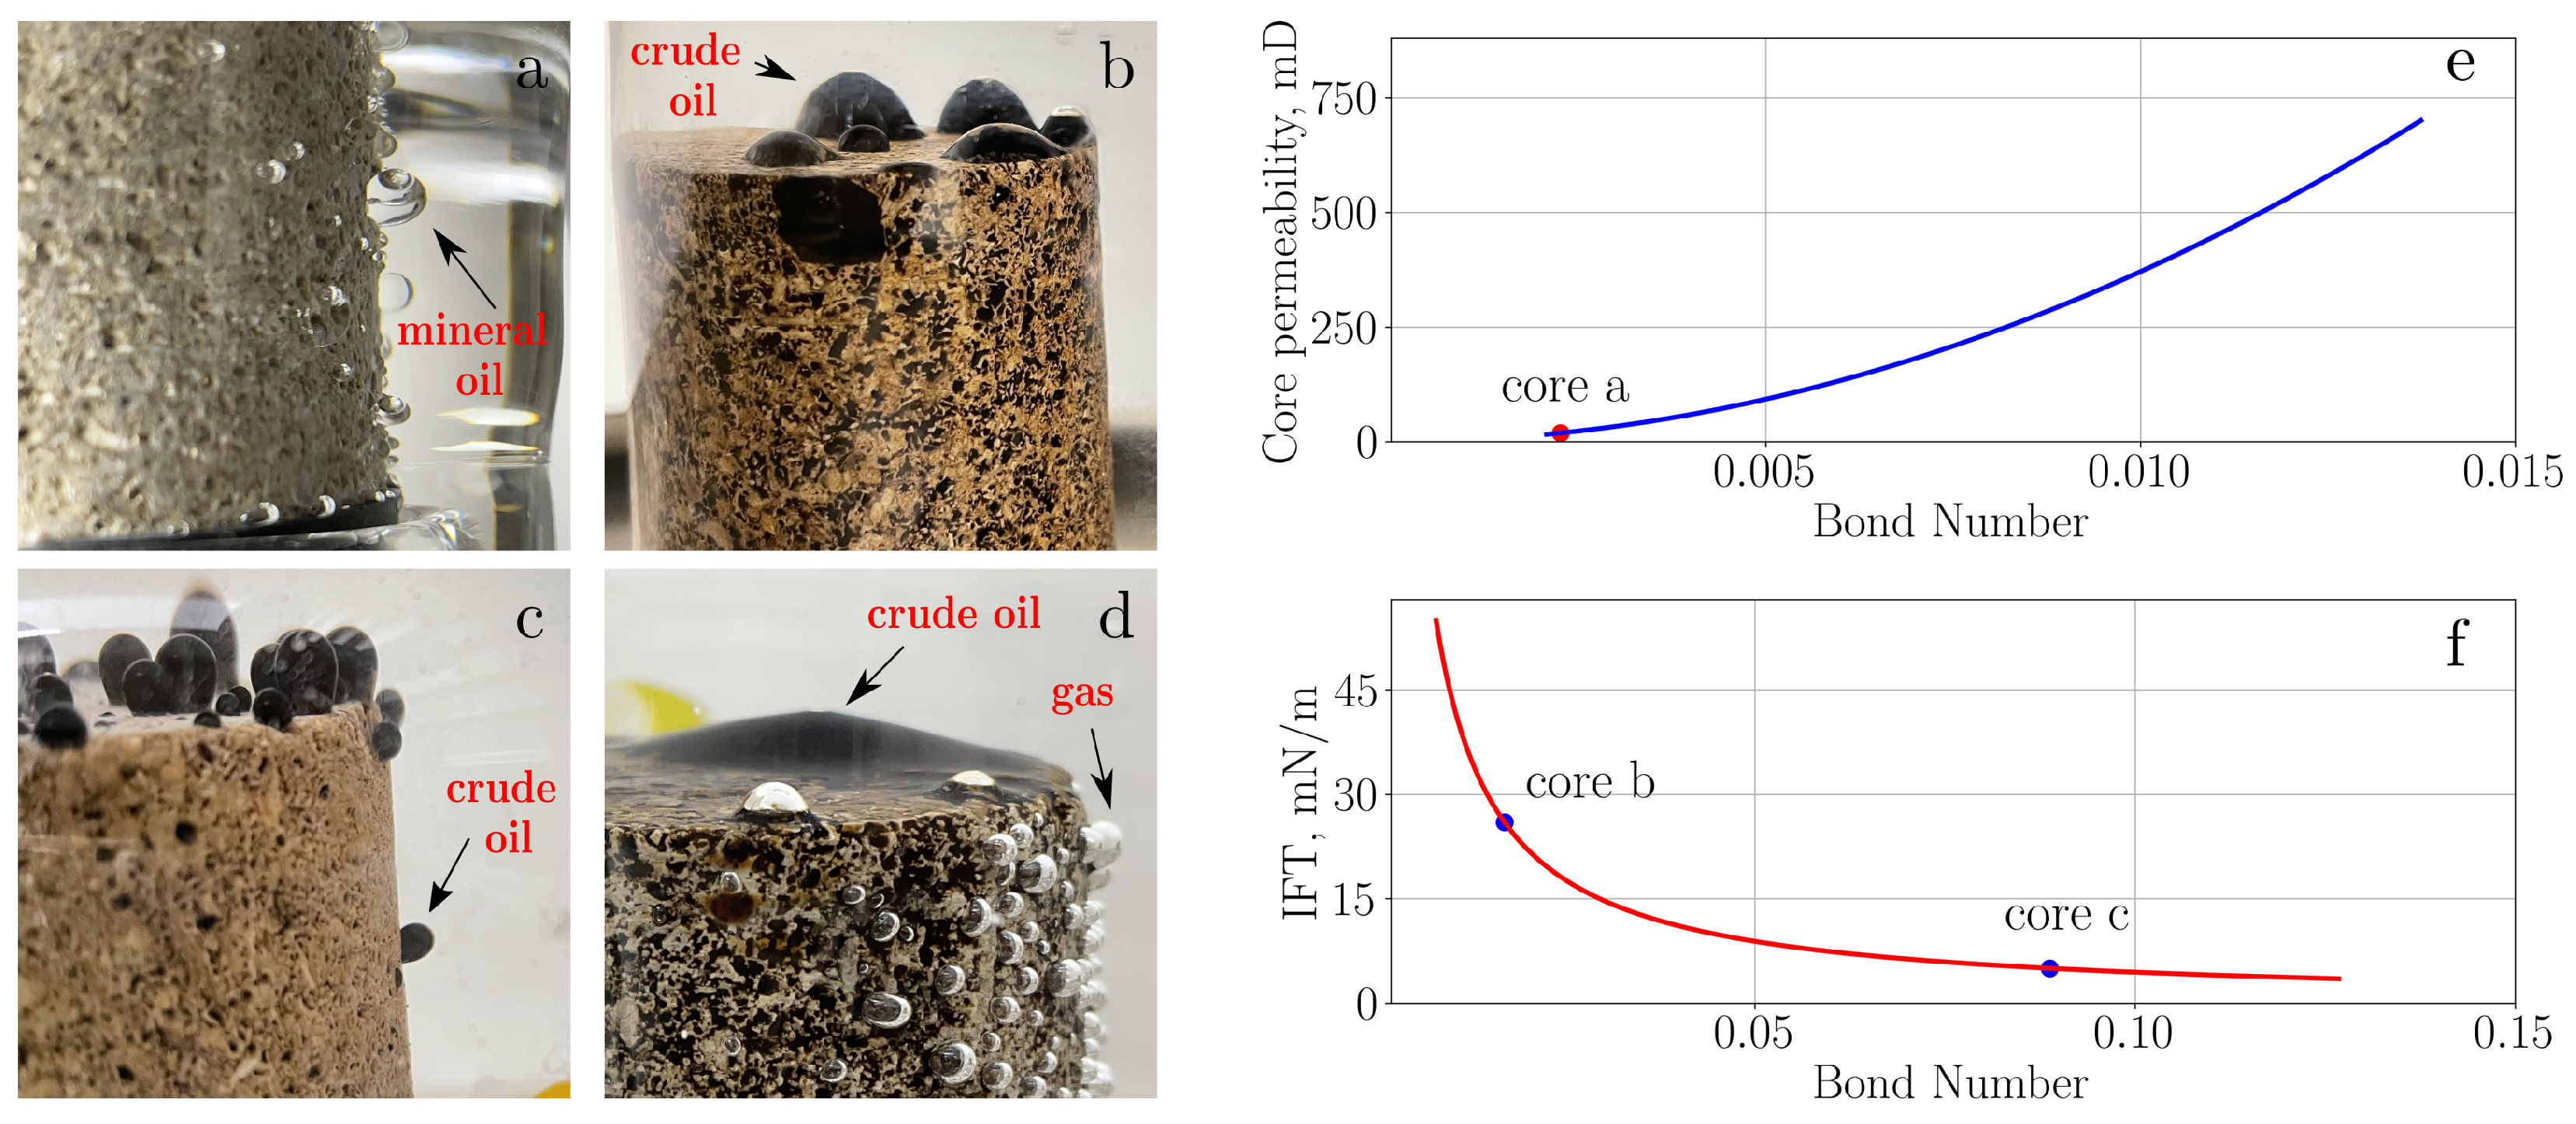
Indiana limestone core samples were saturated and aged in various conditions and then tested in the classic Amott-cell spontaneous imbibition experiment. The core plugs photographed in Figure 2a–d reveal varying behaviors of mineral oil and crude oil during spontaneous imbibition. In these experiments, mineral oil (photo a) and crude oil (photos b, c, and d) demonstrate different patterns of droplet formation and retention on the external rock surface. This oil retention, or oil holdup, is the main experimental challenge in the Amott imbibition experiment [32]. The mineral oil droplets appear more uniformly distributed along the core, while crude oil tends to accumulate more prominently on the top face. This suggests different wetting behaviors and various flow regimes that dominate brine imbibition and oil production.
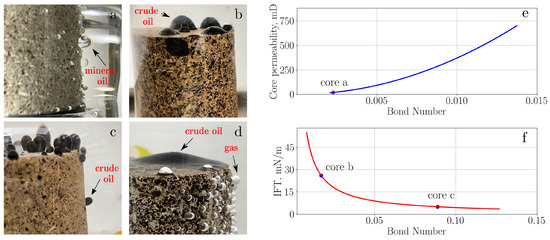
Figure 2.
Illustration of oil holdup effect during Amott-cell imbibition experiments with Indiana limestone samples of varied wettability: (a) Core plug IL-6a was saturated with mineral oil. The mineral oil did not alter rock wettability leaving it water-wet. (b) Core plug IL-0 was aged in chloride brine, leading to wettability alteration towards more oil-wet state. (c) Core plug IL-3 was aged in a high-pH brine, retaining predominantly water-wet wettability. (d) Carbonate core plug aged in crude oil with gas bubbles formed during heating. Calculated Bond numbers for: (e) Mineral oil experiments with varied core permeabilities and fixed IFT = 52 mN/m. (f) Crude oil experiments with varied oil/brine interfacial tension and fixed = 270 mD. Details of the Bond number calculations can be found in [32].
Figure 2e,f shows the calculated Bond number (Bo) for various core permeabilities and oil/brine interfacial tensions (IFT) used in the current study. For water-wet core sample saturated with mineral oil, shown in Figure 2a, a higher IFT (52 mN/m) results in a lower Bond number, indicating that capillary forces dominate the imbibition process. This is confirmed by the Bo values plotted in Figure 2e, which are consistently below the 0.2 threshold [43]. The strong capillary forces and high IFT resist the detachment of mineral oil droplets.
For mixed-wet core plug saturated with crude oil, shown in Figure 2b, Bo values remain significantly lower than gravity-segregation threshold (Figure 2f), proposed by Schechter et al. [43]. However, in these experiments, crude oil droplets predominantly exit the core from the top face. This behavior is due to the blocking of pore paths by crude oil on the outer rock surface, as observed in Figure 2b. Despite the lower IFT compared with the mineral oil case (26 mN/m), oil holdup may be more significant due to both capillary and adhesion forces that retain crude oil droplets. In contrast, for predominantly water-wet core plug saturated with crude oil in Figure 2c, much lower IFT (5 mN/m) significantly increases Bond number, approaching the 0.2 threshold (Figure 2f). This suggests a greater contribution of gravitational forces, leading to phase segregation along the core length. Under these conditions, the lower IFT and water-wet conditions facilitate easier detachment and movement of oil droplets, reducing the holdup effect.
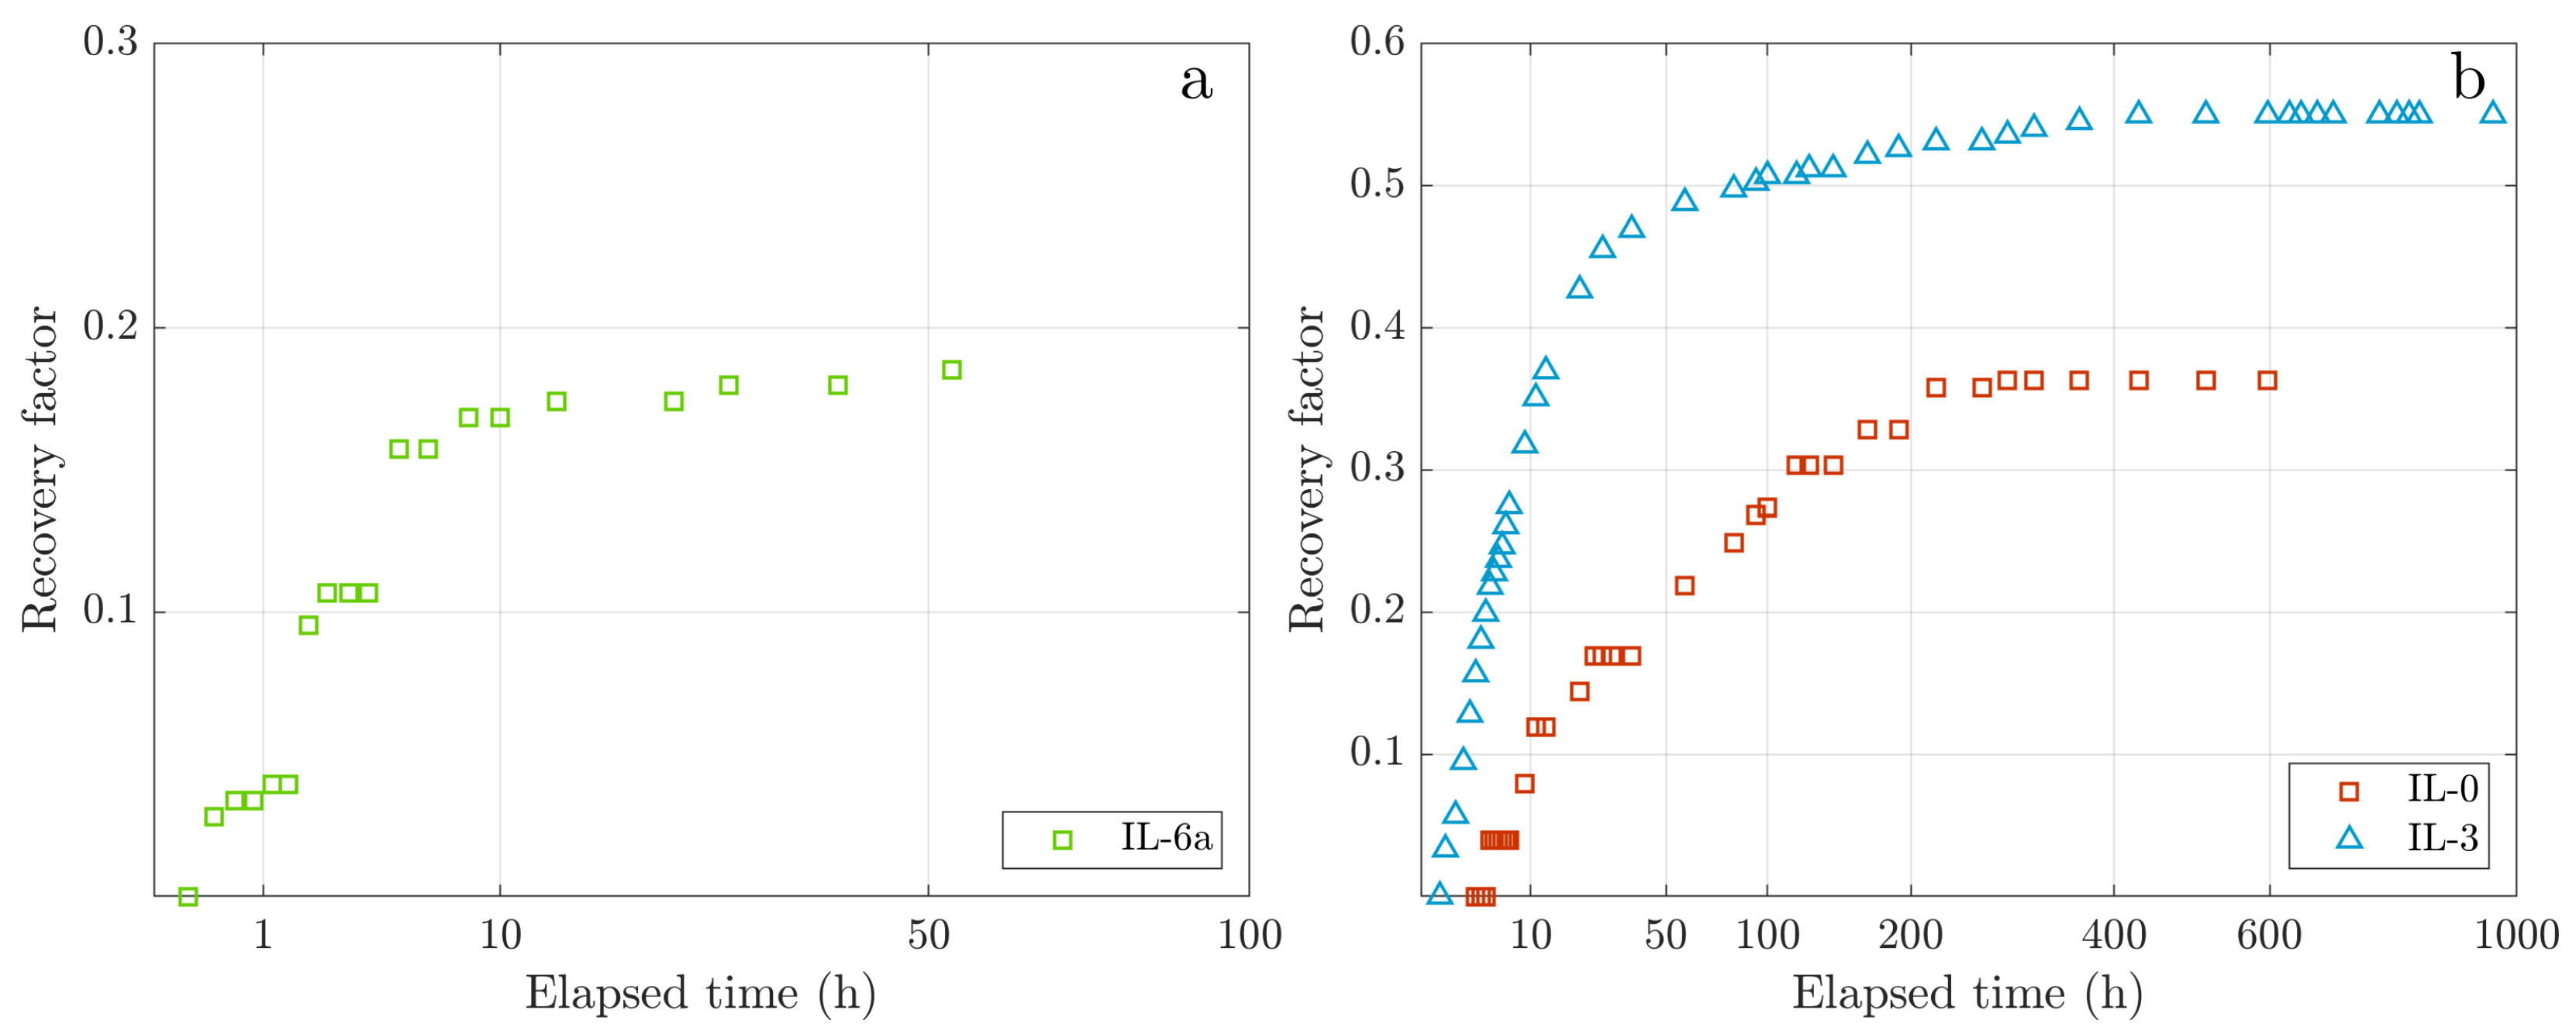
Regardless of the experimental conditions, oil holdup consistently introduces a delay in the early recovery dynamics and adds noise to the recovery history. Additionally, gas bubbles that evolve during heating (Figure 2d) obstruct pore pathways, further delaying oil production. Figure 3 shows the recovery histories from mineral oil (core IL-6a) and crude oil (IL-0) experiments shown in Figure 2a,b. The resulting stepwise patterns, caused by the oil holdup effect, mask the true production dynamics and make it challenging to accurately describe the spontaneous imbibition process.
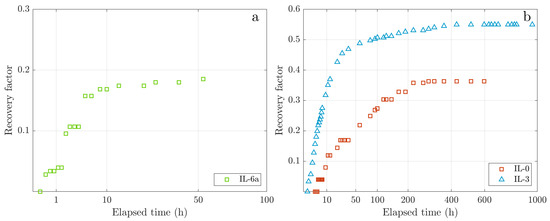
Figure 3.
Cumulative oil recovery during the classic Amott-cell spontaneous imbibition experiment for Indiana limestone core plugs: (a) Core IL-6a was saturated with mineral oil. (b) Cores IL-0 and IL-3 were saturated with crude oil and aged for 4 weeks at elevated temperature. Different aging conditions resulted in varied wettability states: mixed wettability and predominantly water-wet wettability, respectively (see caption to Figure 2).
For core IL-3 in Figure 2c, both the low interfacial tension and water-wet rock wettability minimized oil holdup and facilitated easy detachment of crude oil droplets from the rock surface. Gentle manual shaking of the Amott cell during the experiment resulted in continuous oil production and a smooth recovery history, as demonstrated in Figure 3b. This experiment, however, does not represent realistic field conditions and is used to test the GEV model, as will be discussed in a subsequent section.
Our improved Amott-cell experiment, as presented in Kaprielova et al. [32], introduces several modifications to eliminate or minimize the effects of experimental artifacts and provide more reliable and reproducible data: (a) sealing both ends of the core plug using glass discs to prevent accumulation of oil droplets and enforce radial two-phase flow, reducing contribution of gravity-driven axial flow to the production. Our sealing technique is non-destructive and allows the core plugs to be reused in sequential or reproducibility experiments; and (b) implementing continuous automated shaking of the Amott cell to minimize delays in oil production and produce smoother recovery histories. Additionally, to avoid the formation of gas bubbles, brine solutions were degassed and preheated before conducting Amott experiments.
In the following section, we show that carefully designed experiments based on a modified Amott method enable a systematic investigation of spontaneous imbibition dynamics. Furthermore, they allow for the quantification of oil recovery behavior through Generalized Extreme Value (GEV) statistical modeling.
3.2. Spontaneous Imbibition and GEV Modeling Results
3.2.1. Mineral Oil/Indiana Limestone Rock
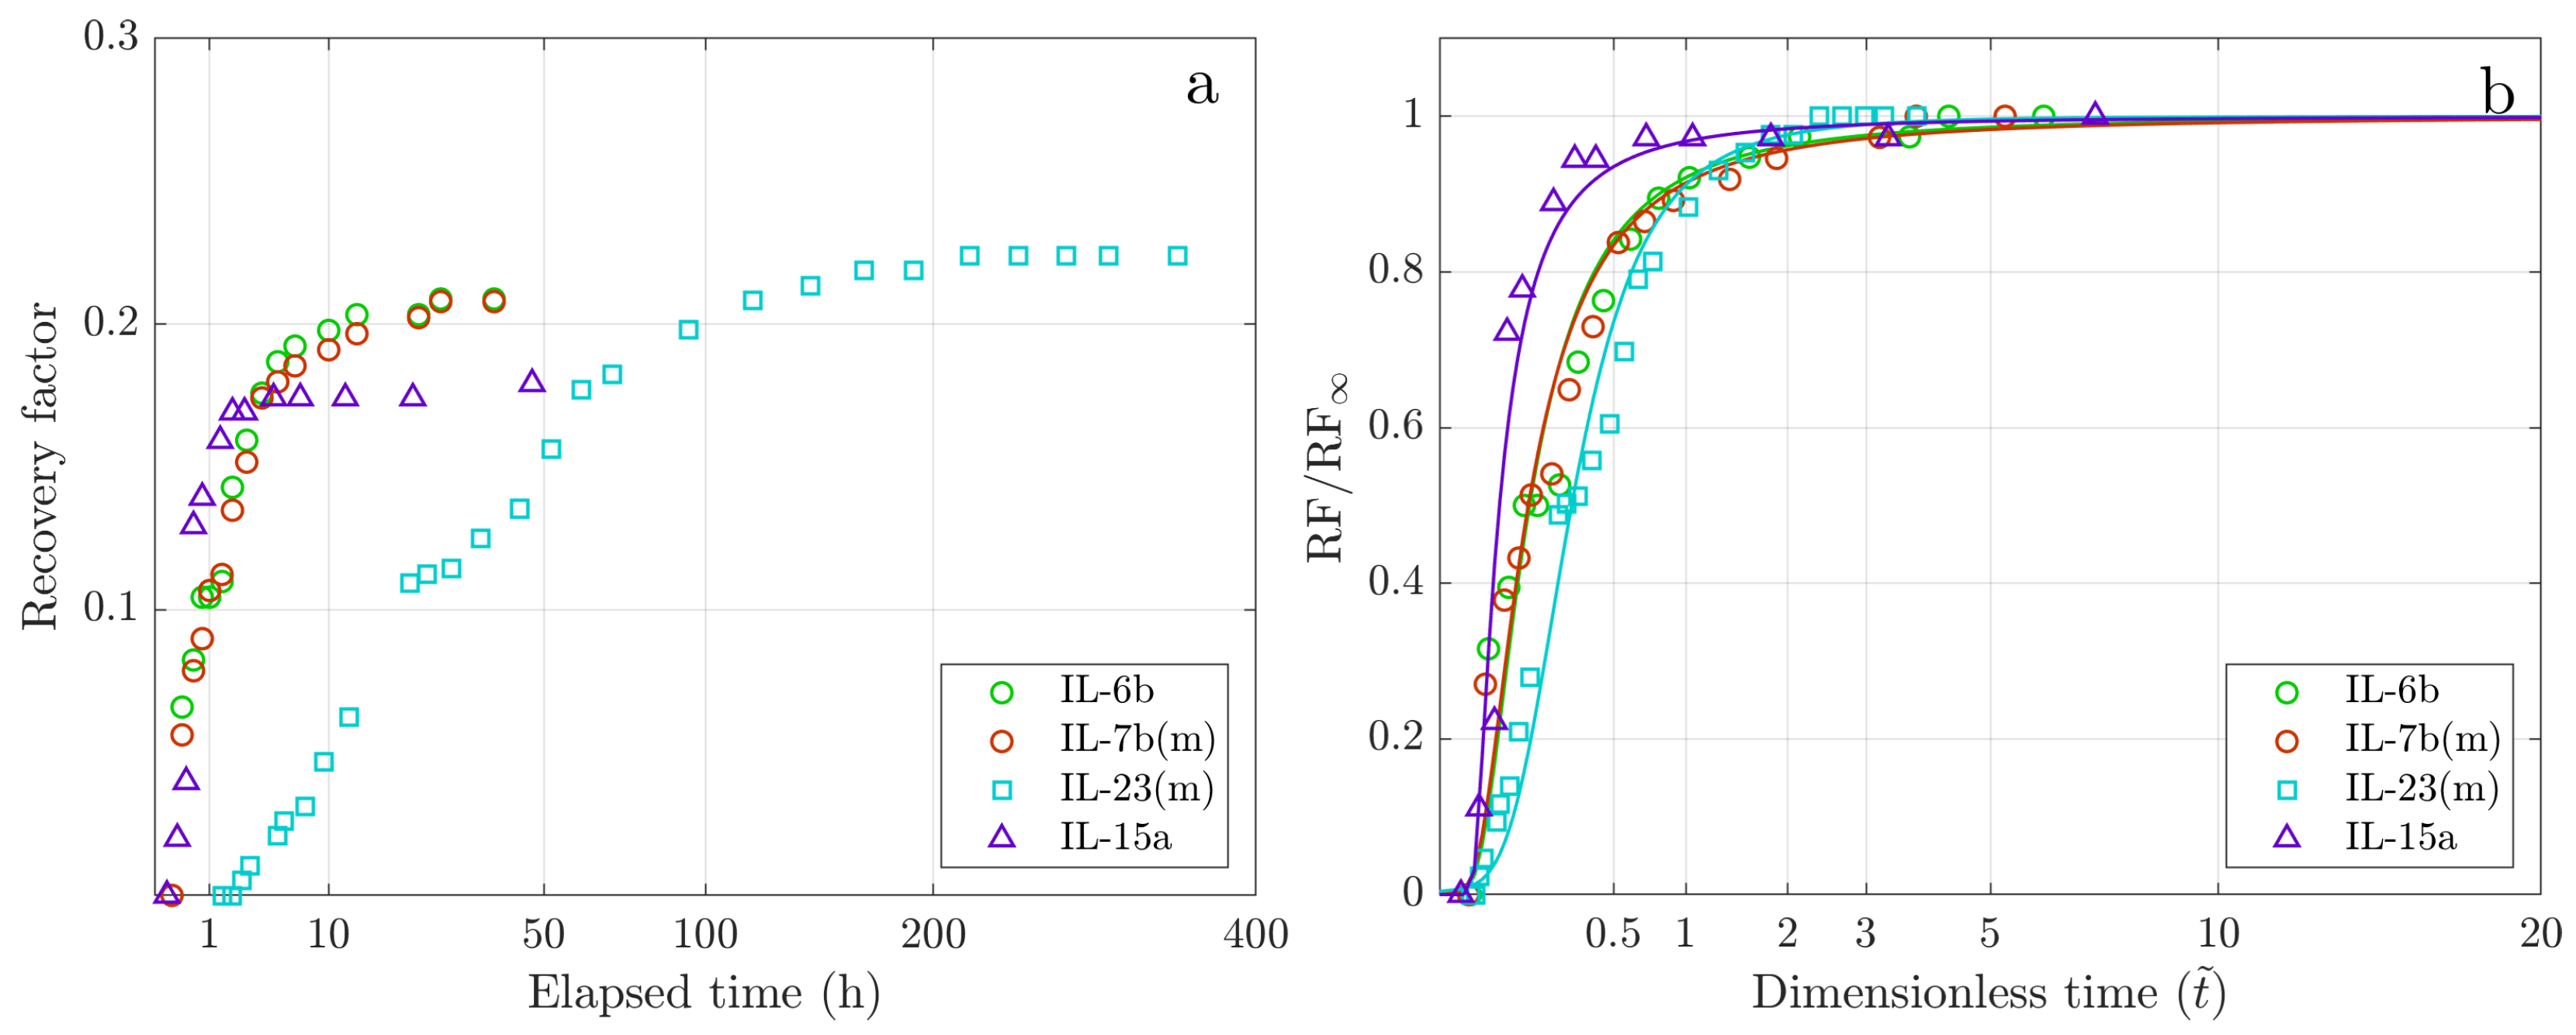
Figure 4a presents the experimental cumulative recoveries for mineral oil-saturated Indiana limestone rock samples. The smoothness of all recovery curves in Figure 4a is attributed to the improved design of the Amott test. The experiments have high reproducibility, as shown by oil production curves for the twin core plugs IL-6b and IL-7b in Figure 4a. Additionally, the samples demonstrate high reproducibility in sequential imbibition runs after core cleaning and re-saturation [32].
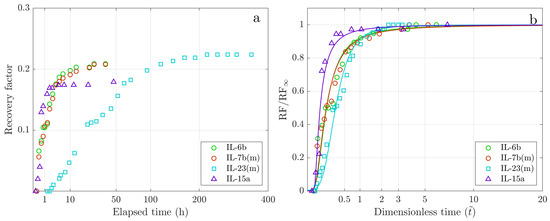
The experiments shown in Figure 4a demonstrate how oil production history depends on mineral oil viscosity and core plug permeability. High-permeability core plug IL-15a exhibits rapid initial recovery followed by a steep decline, whereas the experiment with high-viscosity mineral oil (core IL-23(m)) shows much slower initial recovery followed by a more gradual decline. We highlight that all recovery curves in Figure 4a exhibit an induction time, regardless of the oil–rock properties. The observed initial delay in oil production is indicative of spontaneous imbibition into rock with finite water saturation [32].
Another key characteristic of strongly water-wet rock initially containing water is the relatively low ultimate oil recovery due to extensive snap-off effects. When water is initially present in narrow pores and pore corners, capillarity-driven flow in these regions occurs rapidly enough to form necks and cause internal snap-off, trapping oil ganglia within the rock [43].
Figure 4b shows scaled cumulative oil recoveries using GEV model for mineral oil experiments. The GEV model accurately describes cumulative oil recoveries free of experimental artifacts. The obtained parameters of GEV modeling—, , , and —are summarized in Table 4. Values of these parameters define the shapes of scaled GEV curves, and allow for a qualitative analysis of imbibition mechanisms (refer to experimental part of Kaprielova et al. [32]).

Table 4.
Fitting parameters of GEV modeling: is capillary pressure diffusion time; is location parameter; is scale parameter; and is shape parameter.
The characteristic capillary pressure diffusion time represents the rate of oil recovery and indicates the duration of the imbibition process. As shown in Table 4, the characteristic times are shorter for fast spontaneous imbibition experiments (cores IL-6, IL-7b(m), and IL-15a) and longer for slower imbibition process (core IL-23). The location parameter represents the induction time of the imbibition process. Larger values are observed in experiments with high mineral oil viscosity and low core permeability (core IL-23), while smaller values are obtained from experiments with high-permeability sample IL-15a. The scale parameter governs the overall recovery dynamics. A large value for core IL-23 denotes low-rate dynamics at both early and late stages, while a small value for core IL-15a implies rapid recovery in both initial and late times. Finally, the shape parameter controls the right tail behavior in scaled recovery curve and influences the rate of late production. A minimal value for core IL-23 suggests faster decline in late-time production rate.
3.2.2. Crude Oil/Indiana Limestone Rock
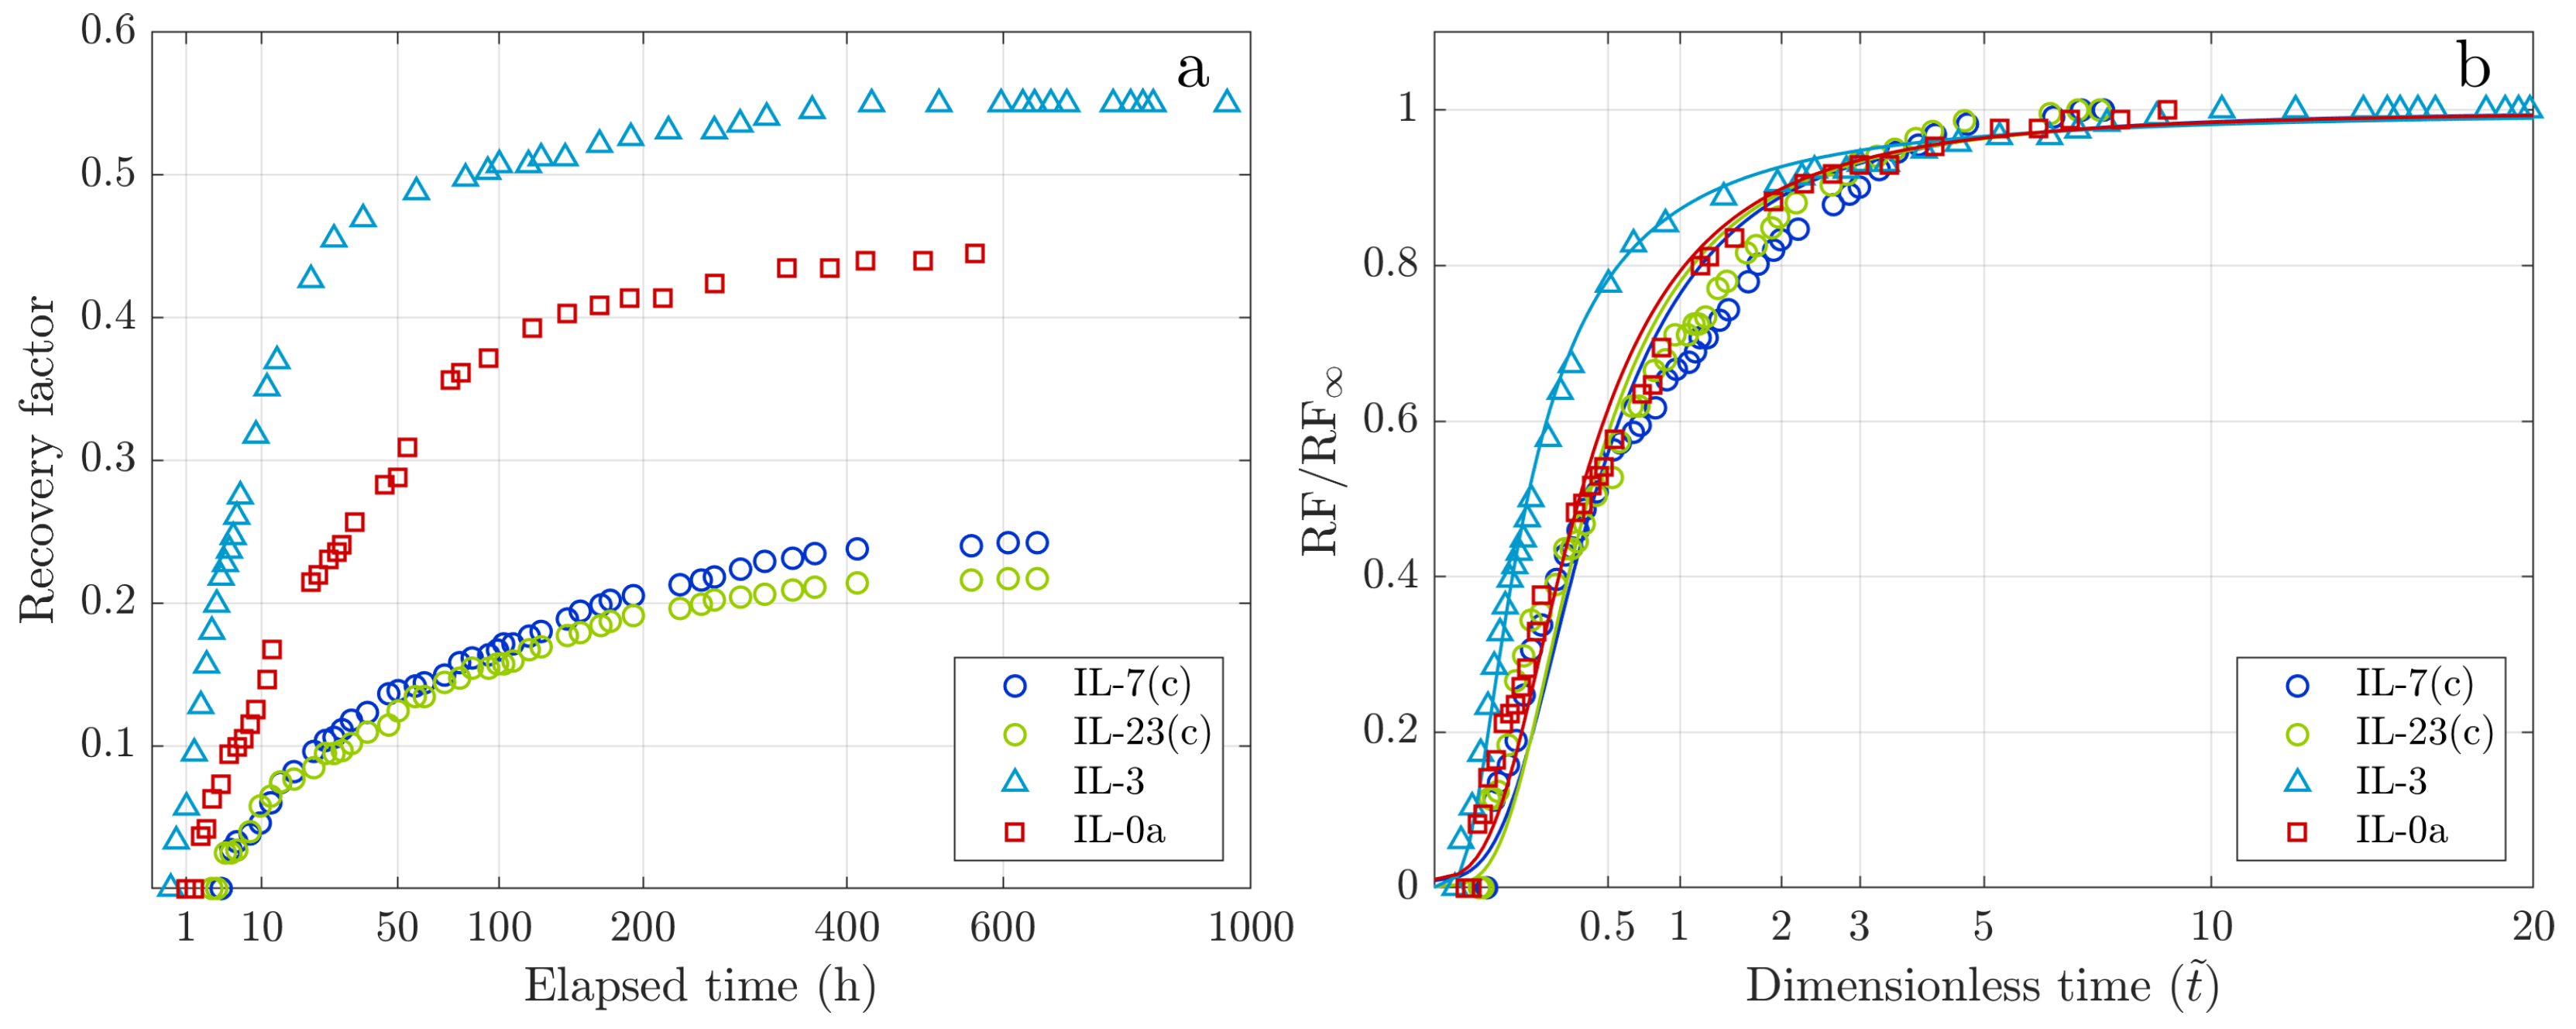
Figure 5a demonstrates experimental imbibition curves for crude oil-saturated Indiana limestone rock samples, followed by aging under different conditions. Brine compositions used for core plug aging were selected to obtain various wettability states of carbonate rock. Core plugs IL-7(c) and IL-23(c) were aged in chloride brine with salinity close to that of reservoir connate water (see Table 1), resulting in significant alteration of the rock wettability towards mixed-wet state and, consequently, relatively low oil recovery. Despite that, this twin core pair demonstrates smooth and reproducible oil recovery histories owing to modifications introduced to the Amott test.
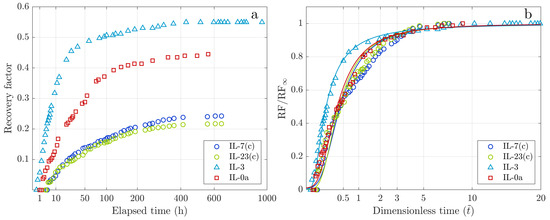
Core plug IL-3 was aged in carbonate-containing brine, which did not favor significant wettability alteration due to its high pH, leaving the rock predominantly water-wet. For core IL-3, both rate of oil production and the ultimate recovery increased substantially, compared with cores IL-7(c) and IL-23(c). In this experiment, the internal snap-off of oil ganglia is suppressed by reduced interfacial tension [43]. Owing to gravity segregation, the trapped oil droplets are displaced before the snap-off occurs. Core plug IL-0a was aged in a bicarbonate-containing brine, leading to intermediate rock wettability and displaying an intermediate oil recovery rate and ultimate recovery.
Despite low crude oil viscosity, all production histories always exhibit induction time of 1 to 4 h. This induction time increases as the rock wettability shifts from more water-wet towards more oil-wet states: IL-3→IL-0a→IL-7(c)/IL-23(c). These results corroborate the findings of Fernø et al. [30], who linked the initial delay of oil production to the wettability state of rock samples saturated with crude oil.
Figure 5b shows the GEV modeling results for crude oil recovery from Indiana limestone core plugs. The GEV modeling accurately captures the experimental oil recovery curves, although minor deviations are observed in the intermediate-time regime for the IL-7(c)/IL-23(c) core pair. By comparing the modeling results for water-wet samples IL-6/IL-7b(m) in Figure 4 and mixed-wet samples IL-7(c)/IL-23(c) in Figure 5, one may see that while the ultimate recoveries for both mineral oil and crude oil experiments are similar, the imbibition dynamics in mixed-wet samples are significantly slower. As shown in Table 4, the characteristic times () for the mixed-wet samples are ten times longer than those for the water-wet samples. The delayed onset of production in crude oil samples is reflected in the location parameters (), which are 2-3 times larger compared with those of mineral oil samples. Additionally, larger values for the mixed-wet samples indicate slower recovery dynamics for crude oil.
For core IL-3, the GEV modeling results yield smaller and values, indicating a shorter induction time and faster production dynamics, similar to those observed in mineral oil-saturated water-wet rock samples. Yet, the characteristic time () for core IL-3 is longer, indicating an extended period of crude oil production compared with the mineral oil recovery, which was suppressed by internal snap-off. The higher shape factor () suggests a slower decline in the late-time production dynamics for IL-3. The GEV fitting parameters for the IL-0a core plug are close to those of the mixed-wet samples (IL-7(c) and IL-23(c)), despite its higher permeability (see Table 4). This suggests that the wettability of core IL-0a is close to the wettability state of the IL-7(c) and IL-23(c) core pair. The GEV modeling results closely align with the experimental observations.
3.2.3. Core Plug Contamination
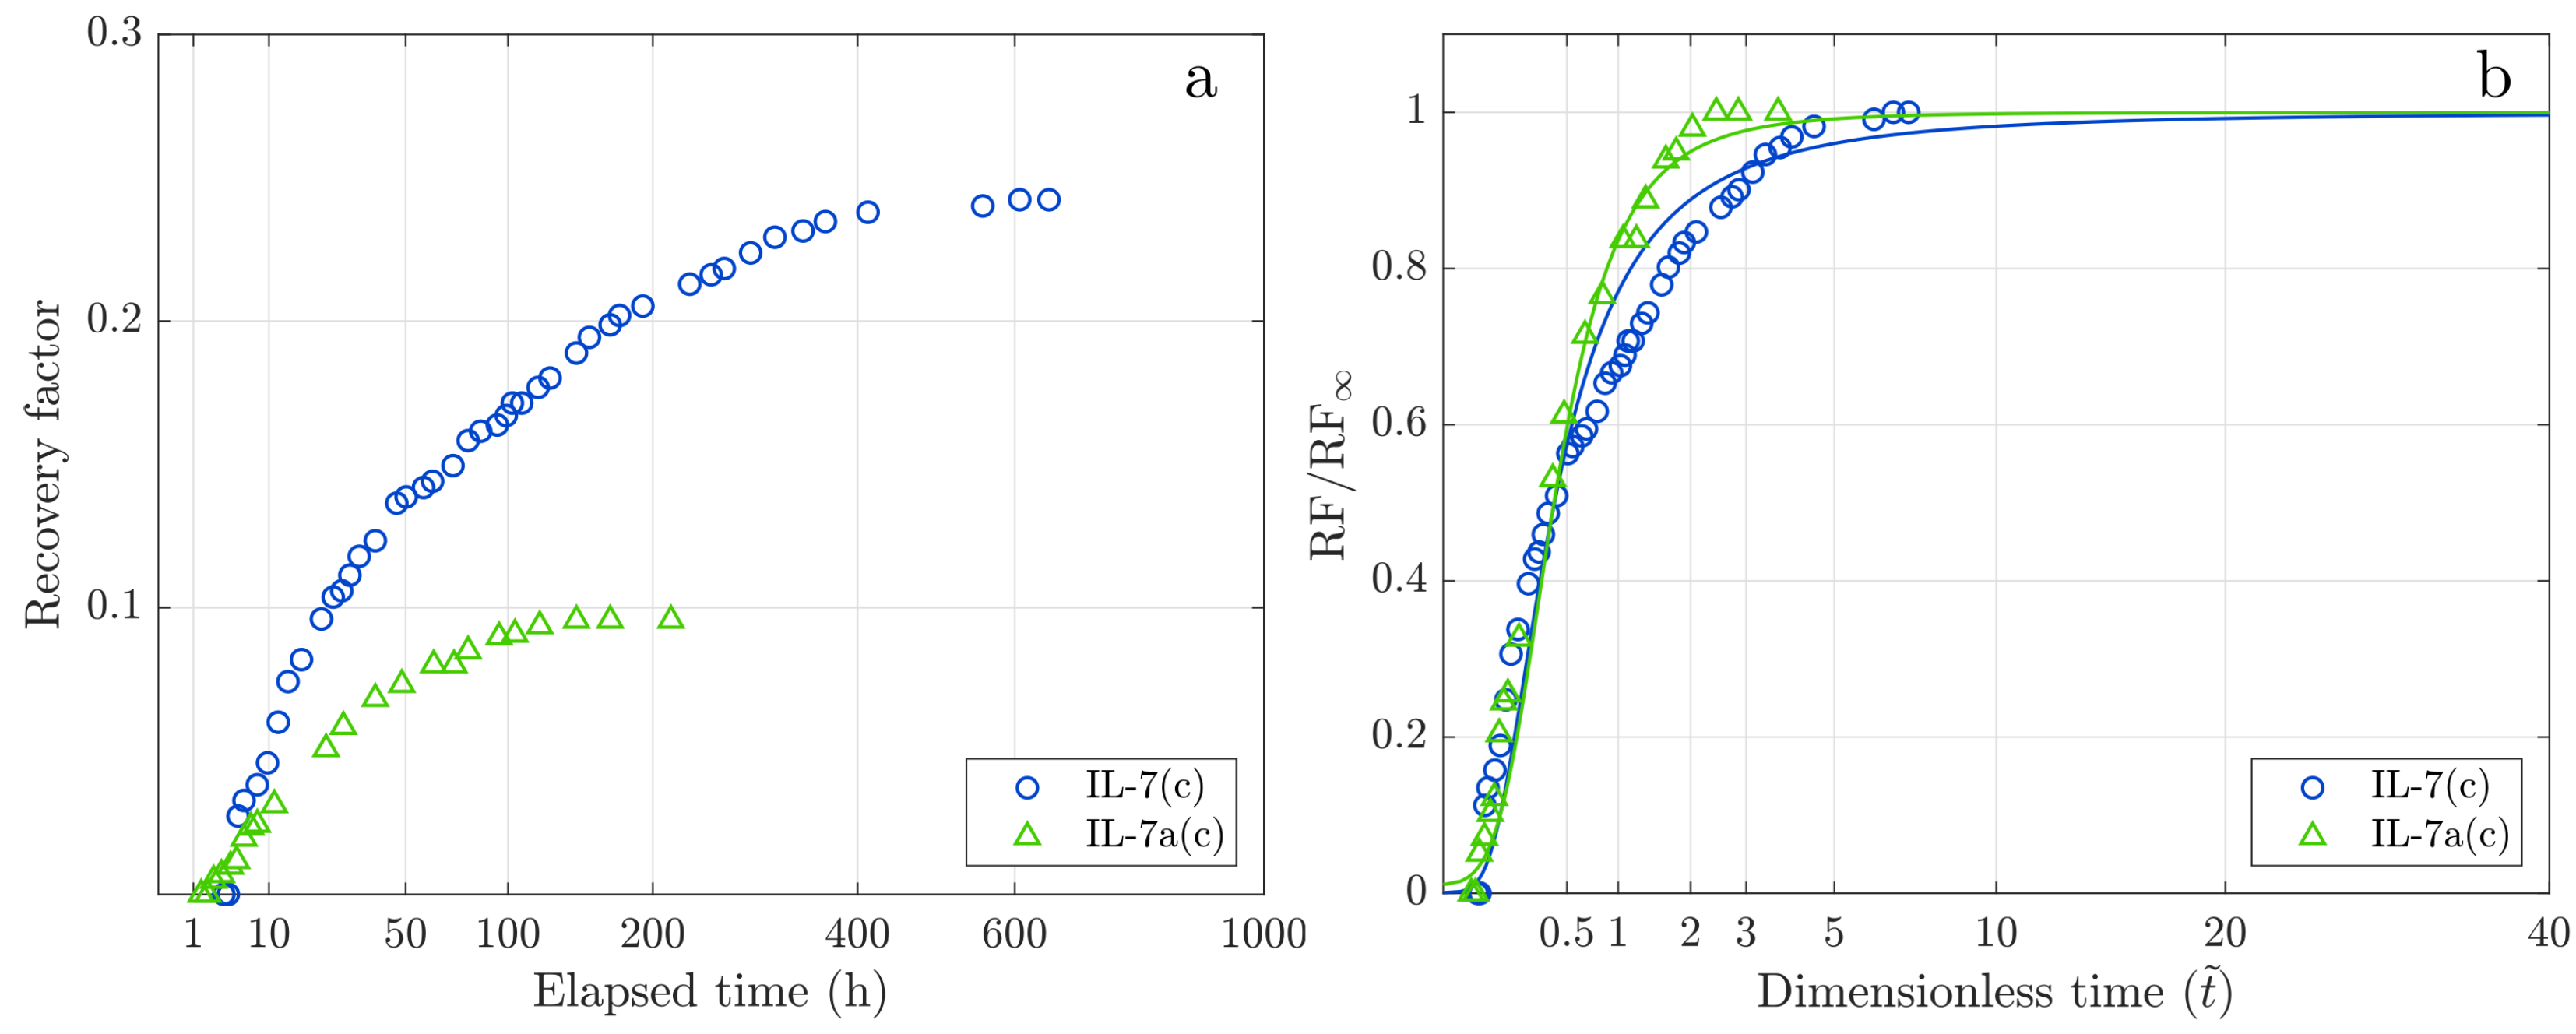
To evaluate the reproducibility of crude oil experiments, core plug IL-7(c) was cleaned using dichloromethane Soxhlet extraction, resaturated with brine, and repeatedly aged in crude oil. Figure 6a compares experimental oil production curves in the sequential experiments for Indiana limestone, IL-7(c) and IL-7a(c), under the same conditions. While all recovery histories appear smooth, they show significant differences in ultimate recovery and rate of oil recovery between the first and second imbibition run. We attribute this outcome to two main factors: (1) contamination of core plugs by inorganic residue from the crude oil left after the first experiment; and (2) permanent local wettability alterations in the first run followed by second round of aging in crude oil.
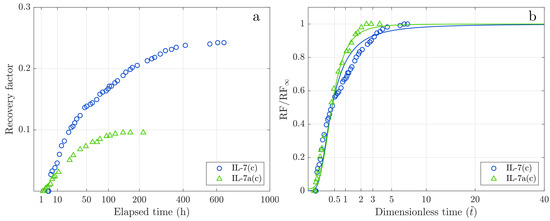
Despite core plug contamination in subsequent imbibition runs, the GEV model accurately represents the experimental oil recovery curves for samples IL-7(c) and IL-7a(c), as shown in Figure 6b. The GEV fitting parameters in Table 4 for IL-7a(c) sample indicate shorter characteristic time, suggesting a faster recovery process in the second cycle. However, the overall dynamics of the oil production history remain unchanged, with and values close to those of IL-7(c). The shape parameter is lower for the second imbibition run (IL-7a(c)), indicating faster decline in late-stage production rate compared with the initial experiment (IL-7(c)), likely due to sample contamination.
3.2.4. Summary of Spontaneous Imbibition and GEV Modeling
Our study highlights that the dynamics of oil production are misrepresented by the classic Amott test. The actual production dynamics are obscured by the external oil holdup effect, which varies significantly under different imbibition conditions (Figure 2). To address this limitation, we proposed modified Amott test that minimizes the holdup effect, providing imbibition dynamics closer to the actual dynamics observed in both water-wet and mixed-wet cores (Figure 4a, Figure 5a and Figure 6a).
The developed GEV model effectively captures smooth cumulative recovery curves. The GEV modeling outcomes offer valuable insights into the dynamics of imbibition, which depend on rock properties and experimental conditions (Figure 4b, Figure 5b and Figure 6b). Thus, the GEV statistical model enables a semi-quantitative analysis of oil recovery behavior. Oil viscosity and core plug permeability impact on oil production modeling was discussed in detail in our previous work [32] and is summarized in Figure 4. This study focuses on the effect of rock wettability, demonstrating that the GEV modeling outcomes systematically reflect the wettability state of the core plug.
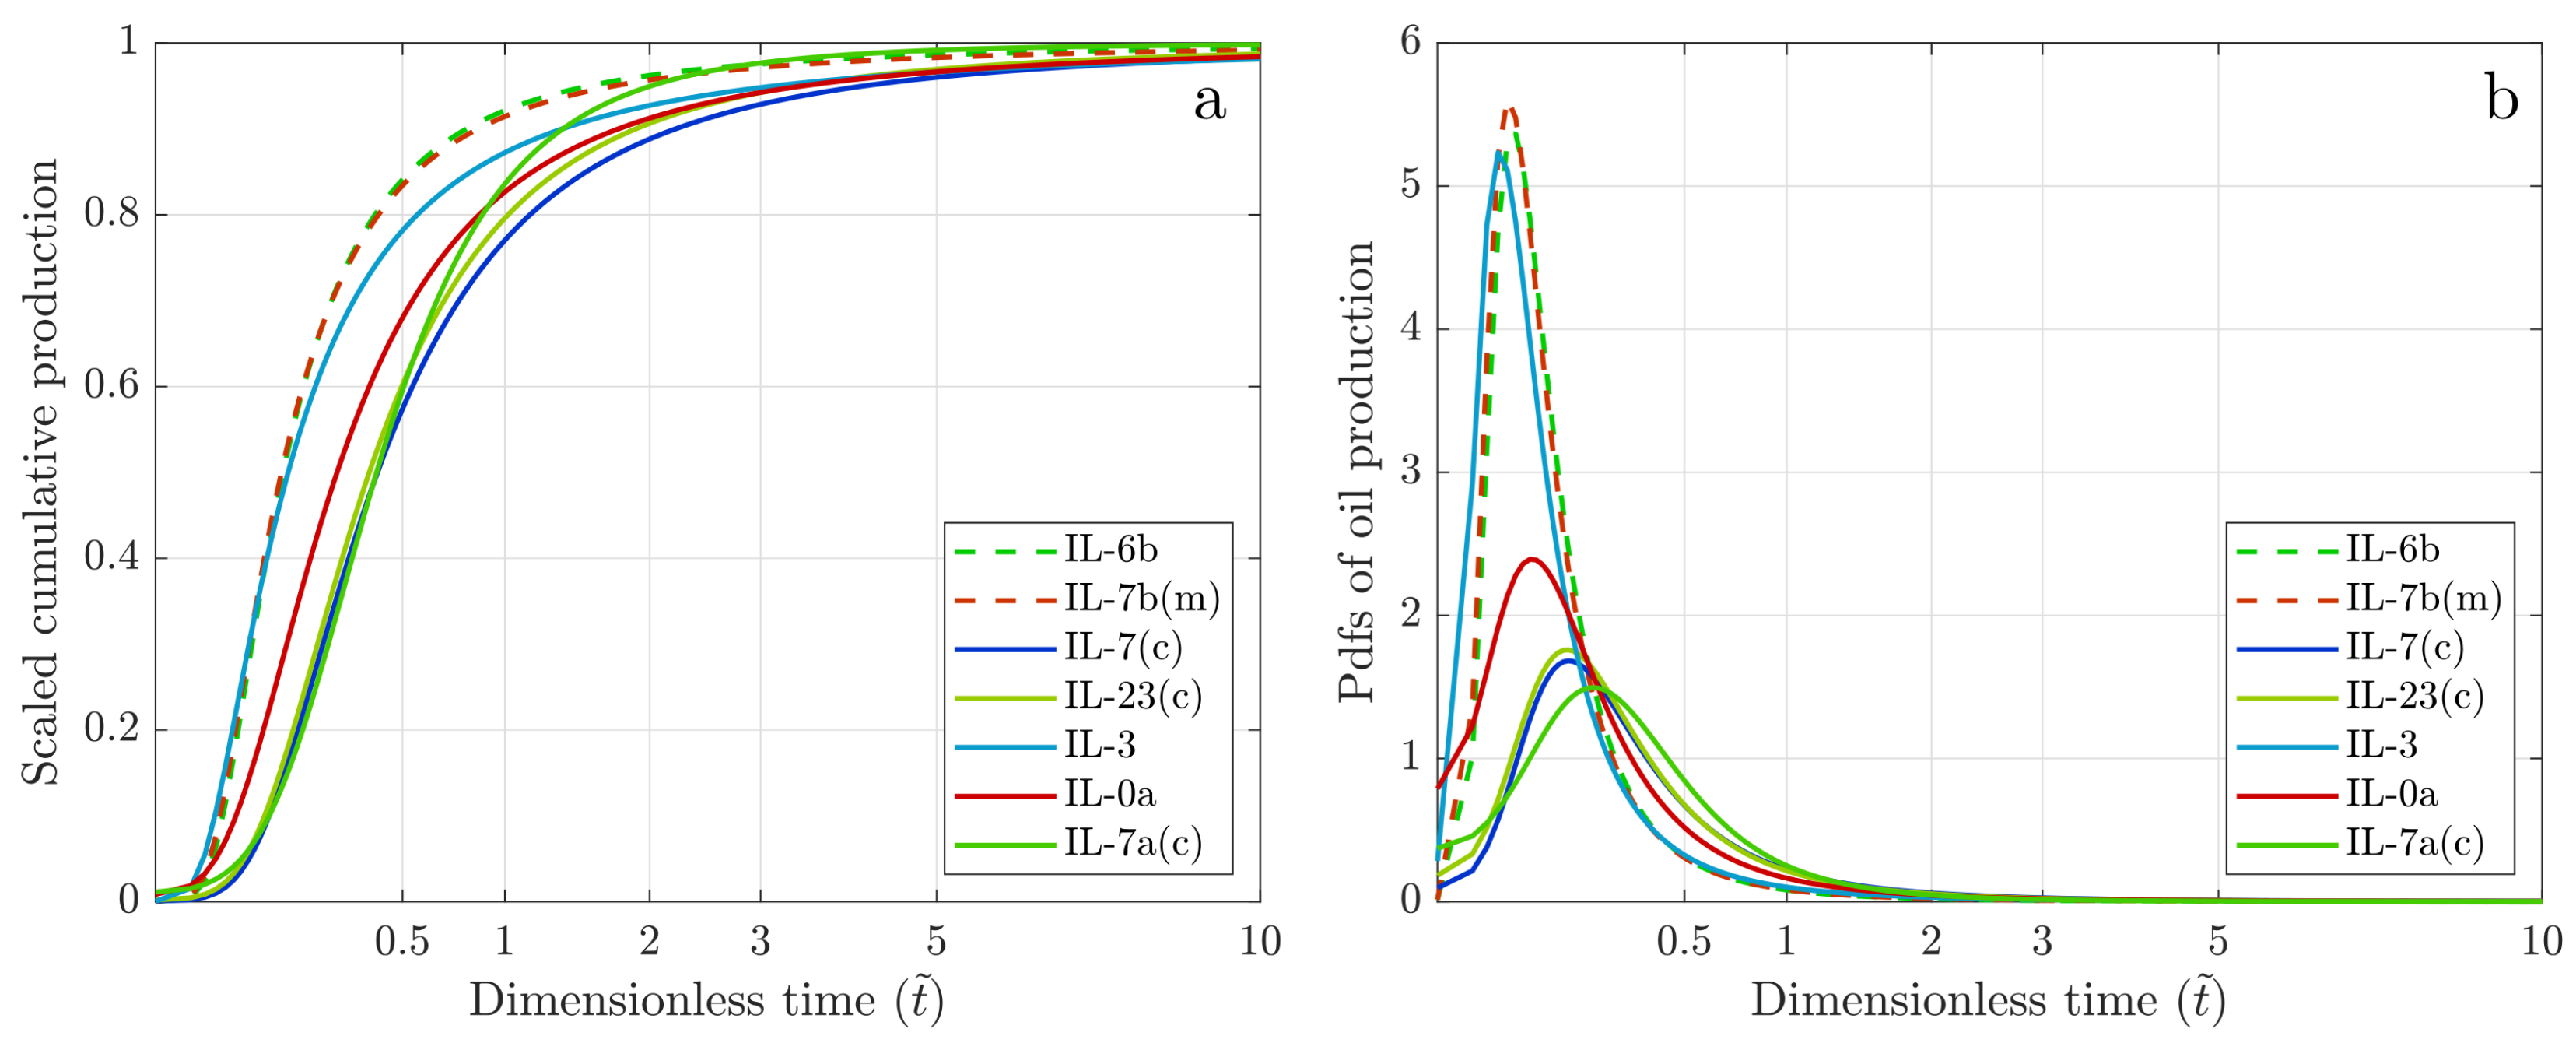
Figure 7a presents scaled cumulative oil production for both mineral oil and crude oil experiments, while Figure 7b shows the normalized rates of oil production derived using the GEV probability density function (see Section 2.6). It is evident that water-wet Indiana limestone samples (dashed lines) exhibit faster and more efficient oil recovery, both in cumulative production and production rates. This is characteristic of water-wet systems due to favorable capillary forces. In contrast, mixed-wet Indiana limestone samples (solid lines) display longer induction times and slower overall recovery, reflecting the reduced influence of capillary forces and the impact of wettability alterations. The plug IL-3, predominantly water-wet, exhibits behavior consistent with that of water-wet samples regarding both production history and output rates, thereby confirming the sensitivity of the model to rock wettability state.
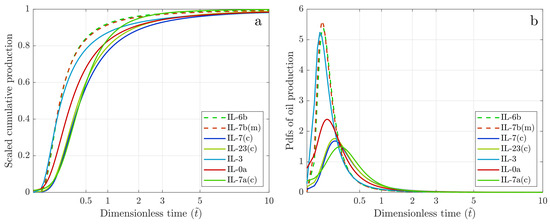
Figure 7.
GEV-modeled summary curves: (a) Cumulative oil production. (b) Rates of oil recovery. In both plots, dashed line—experiments with mineral oil; solid lines—experiments with crude oil. Parameters of GEV modeling are summarized in Table 4.
Despite variations in petrophysical properties (Table 3), Indiana limestone samples with similar wettability states exhibit consistent model behavior. These results suggest that the pore geometry and interconnectivity within the outcrop are consistent across the tested core plugs.
In conclusion, GEV modeling results underscore the challenges in predicting recovery behavior in heterogeneous reservoir rocks, highlighting the critical role of pore structure and wettability in influencing production dynamics. The developed statistical model offers valuable insights and provides a semi-quantitative tool for analyzing oil production dynamics under various experimental conditions. However, the interplay between core properties and experimental factors complicates the attribution of specific GEV fitting parameters to individual rock–fluid properties or experimental conditions. This highlights the need for linking the GEV model to a physics-based model that accounts for the mechanisms governing spontaneous imbibition. Integration of statistical and physics-based models will enhance predictive power of the model, allowing for more accurate forecasting of recovery dynamics in new experiments and improving the understanding of how rock and fluid properties influence imbibition-driven oil recovery.
4. Conclusions
This study demonstrates that the modified Amott experiment effectively minimizes external-surface oil holdup, providing smooth and repeatable production histories for limestone samples prepared with different wettability conditions. Our approach enables a precise investigation of the true dynamics of oil production from water-wet and mixed-wet carbonate rocks during spontaneous imbibition in an Amott-cell experiment. By employing the Generalized Extreme Value (GEV) statistical model, we systematically captured the non-equilibrium dynamics of spontaneous counter-current imbibition, offering a semi-quantitative approach to analyze the recovery process. We showed that the four GEV scaling parameters correlate with key physical properties of the rock–oil systems, including wettability, oil viscosity, and pore network characteristics. Specifically, slower crude oil recovery rates compared with mineral oil were captured by longer characteristic capillary pressure diffusion times (). Water-wet samples exhibited shorter induction times characterized by smaller location parameters (), and higher recovery rates were reflected by larger scale parameters () due to favorable capillary forces. In contrast, mixed-wet samples showed slower recovery rates (smaller ) and longer induction times (larger ), reflecting the reduced influence of capillary forces. Our findings suggest that our GEV statistical model helps to understand the factors influencing imbibition process in water-wet and mixed-wet carbonate rock, advancing the predictive capabilities for recovery dynamics.
Author Contributions
Conceptualization, T.W.P. and C.J.R.; methodology, T.W.P., K.M.K. and M.P.Y.; software, T.W.P.; validation, T.W.P. and K.M.K.; formal analysis, T.W.P., K.M.K. and M.P.Y.; investigation, T.W.P., C.J.R., K.M.K. and M.P.Y.; resources, T.W.P., K.M.K. and M.P.Y.; data curation, T.W.P. and K.M.K.; writing—original draft preparation, T.W.P., K.M.K., and M.P.Y.; writing—review and editing, T.W.P., C.J.R., K.M.K., M.P.Y., A.G., S.A. and A.Y.; visualization, T.W.P. and K.M.K.; supervision, T.W.P.; project administration, T.W.P., A.G., S.A. and A.Y.; funding acquisition, T.W.P., A.G., S.A. and A.Y. All authors have read and agreed to the published version of the manuscript.
Funding
This research received no external funding.
Institutional Review Board Statement
Not applicable.
Informed Consent Statement
Not applicable.
Data Availability Statement
The original contributions presented in this study are included in the article. Further inquiries can be directed to the corresponding author.
Acknowledgments
We acknowledge Sirisha Kamireddy (KAUST) and Samuel D. Fontalvo Guzman (KAUST) for their contribution to the experimental program. We sincerely thank Joshua Cassidy and Dhahran SLB Reservoir Laboratory for conducting the physicochemical analyses of crude oil and for their valuable insights.
Conflicts of Interest
Author Ahmed Gmira, Subhash Ayirala and Ali Yousef were employed by the company Saudi Aramco. The remaining authors declare that the research was conducted in the absence of any commercial or financial relationships that could be construed as a potential conflict of interest.
References
- Barenblatt, G.I.; Patzek, T.W.; Silin, D.B. The Mathematical Model of Non-Equilibrium Effects in Water-Oil Displacement. SPEJ 2003, 8, 409–416. [Google Scholar] [CrossRef]
- Jadhunandan, P.P.; Morrow, N.R. Effect of Wettability on Waterflood Recovery for Crude-Oil/Brine/Rock Systems. SPE Reserv. Eng. 1995, 10, 40–46. [Google Scholar] [CrossRef]
- Morrow, N.; Ma, S.; Zhou, X.; Zhang, X. Characterization of Wettability from Spontaneous Imbibition Measurements. J. Can. Pet. Technol. 1999, 38. [Google Scholar] [CrossRef]
- Salathiel, R. Oil Recovery by Surface Film Drainage In Mixed-Wettability Rocks. J. Pet. Technol. 1973, 25, 1216–1224. [Google Scholar] [CrossRef]
- Kovscek, A.R.; Wong, H.; Radke, C.J. A Pore-Level Scenario for the Development of Mixed Wettability in Oil Reservoirs. AIChE J. 1993, 39, 1072–1085. [Google Scholar] [CrossRef]
- Clerke, E.A.; Mueller, H.W., III; Phillips, E.C.; Eyvazzadeh, R.Y.; Jones, D.H.; Ramamoorthy, R.; Srivastava, A. Application of Thomeer Hyperbolas to Decode the Pore Systems, Facies and Reservoir Properties of the Upper Jurassic Arab D Limestone, Ghawar Field, Saudi Arabia: A “Rosetta Stone” Approach. GeoArabia 2008, 13, 113–160. [Google Scholar]
- Hosseinzadehsadati, S.; Bonto, M.; Mokhtari, R.; Eftekhari, A.A.; Feilberg, K.L.; Nick, H.M. Modified salinity waterflooding in chalk reservoirs: A journey from rock and fluid interfaces to field scale applications. Fuel 2024, 356, 129461. [Google Scholar] [CrossRef]
- Marquez, R.; Ding, H.; Barrios, N.; Vera, R.E.; Salager, J.L.; Al-Shalabi, E.W.; Mettu, S. Recent Advances in Enhanced Oil Recovery with Low-Salinity Waterflooding and Its Hybrid Methods in Carbonate Reservoirs. Energy Fuels 2025, 39, 8769–8799. [Google Scholar] [CrossRef]
- Zhang, P.; Tweheyo, M.T.; Austad, T. Wettability Alteration and Improved Oil Recovery by Spontaneous Imbibition of Seawater into Chalk: Impact of the Potential Determining Ions Ca2+, Mg2+, and SO42−. Colloids Surf. A Physicochem. Eng. Asp. 2007, 301, 199–208. [Google Scholar] [CrossRef]
- Song, J.; Wang, Q.; Shaik, I.; Puerto, M.; Bikkina, P.; Aichele, C.; Biswal, S.L.; Hirasaki, G.J. Effect of salinity, Mg2+ and SO42− on “smart water”-induced carbonate wettability alteration in a model oil system. J. Colloid Interface Sci. 2020, 563, 145–155. [Google Scholar] [CrossRef]
- Mushabe, R.; Azizov, I.; Adejumo, G.; van der Net, A.; Berg, C.F. Ion Composition Effect on Spontaneous Imbibition in Limestone Cores. Energy Fuels 2022, 36, 12491–12509. [Google Scholar] [CrossRef]
- Akindipe, D.; Saraji, S.; Piri, M. Carbonated Water Injection in Oil-Wet Carbonate Rock Samples: A Pore-Scale Experimental Investigation of the Effect of Brine Composition. Energy Fuels 2022, 36, 4847–4870. [Google Scholar] [CrossRef]
- Khan, M.A.I.; Torrijos, I.D.P.; Algazban, S.H.A.; Strand, S.; Puntervold, T. Polysulphate: A New Eor Additive to Maximize the Oil Recovery from Carbonate Reservoirs at High Temperature. In Proceedings of the ADIPEC, Abu Dhabi, UAE, 31 October 2022. [Google Scholar] [CrossRef]
- Khan, M.A.I.; Pinerez Torrijos, I.D.; Ullah, H.; Puntervold, T.; Strand, S. Comparing Inexpensive, customized brine compositions for enhanced oil recovery in high temperature outcrop and reservoir chalk. Fuel 2025, 396, 135337. [Google Scholar] [CrossRef]
- Zahedi, M.; Dehaghani, A.H.S. Mechanistic evaluation of surfactant assisted smart water flooding with sulfate and phosphate anions. Sci. Rep. 2025, 15, 31594. [Google Scholar] [CrossRef]
- Morrow, N.R.; Mason, G. Recovery of Oil by Spontaneous Imbibition. Curr. Opin. Colloid Interface Sci. 2001, 6, 321–337. [Google Scholar] [CrossRef]
- Mason, G.; Morrow, N.R. Developments in Spontaneous Imbibition and Possibilities for Future Work. J. Pet. Sci. Eng. 2013, 110, 268–293. [Google Scholar] [CrossRef]
- Meng, Q.; Liu, H.; Wang, J. A critical review on fundamental mechanisms of spontaneous imbibition and the impact of boundary condition, fluid viscosity and wettability. Adv.-Geo-Energy Res. 2017, 1, 1–17. [Google Scholar] [CrossRef]
- Karimova, M.; Kashiri, R.; Pourafshary, P.; Hazlett, R. A Review of Wettability Alteration by Spontaneous Imbibition Using Low-Salinity Water in Naturally Fractured Reservoirs. Energies 2023, 16, 2373. [Google Scholar] [CrossRef]
- Xiao, Y.; You, Z.; He, Y.; Du, Z.; Zheng, J.; Wang, L. Capillary-dominated imbibition in heterogeneous-wet reservoirs: Mechanisms, characterizations, and critical insights. Geoenergy Sci. Eng. 2025, 246, 213606. [Google Scholar] [CrossRef]
- Patzek, T.W. Verification of a Complete Pore Network Model of Drainage and Imbibition. SPEJ 2001, 6, 144–156. [Google Scholar] [CrossRef]
- Akin, S.; Schembre, J.M.; Bhat, S.K.; Kovscek, A.R. Spontaneous Imbibition Characteristics of Diatomite. J. Petroleum Sci. Eng. 2000, 25, 149–165. [Google Scholar] [CrossRef]
- Amott, E. Observations Relating to the Wettability of Porous Rock. Pet. Trans. AIME 1959, 216, 156–162. [Google Scholar] [CrossRef]
- Graue, A.; Viksund, B.G.; Eilertsen, T.; Moe, R. Systematic Wettability Alteration by Aging Sandstone and Carbonate Rock in Crude Oil. J. Pet. Sci. Eng. 1999, 24, 85–97. [Google Scholar] [CrossRef]
- Babadagli, T. Dynamics of Capillary Imbibition When Surfactant, Polymer, and Hot Water Are Used as Aqueous Phase for Oil Recovery. J. Colloid Interface Sci. 2002, 246, 203–213. [Google Scholar] [CrossRef]
- Clerke, E.; Funk, J.; Shtepani, E. Spontaneous Imbibition of Water into Oil Saturated M_1 Bimodal Limestone. In Proceedings of the International Petroleum Technology Conference, Beijing, China, 26–28 March 2013. [Google Scholar] [CrossRef]
- Bartels, W.B.; Rücker, M.; Boone, M.; Bultreys, T.; Mahani, H.; Berg, S.; Hassanizadeh, S.M.; Cnudde, V. Imaging Spontaneous Imbibition in Full Darcy-Scale Samples at Pore-Scale Resolution by Fast X-ray Tomography. Water Resour. Res. 2019, 55, 7072–7085. [Google Scholar] [CrossRef]
- Cobos, J.E.; Sandnes, M.; Steinsbo, M.; Brattekas, B.; Sogaard, E.G.; Graue, A. Evaluation of Wettability Alteration in Heterogeneous Limestone at Microscopic and Macroscopic Levels. J. Pet. Sci. Eng. 2021, 202, 108534. [Google Scholar] [CrossRef]
- Tang, G.Q.; Firoozabadi, A. Effect of Pressure Gradient and Initial Water Saturation on Water Injection in Water-Wet and Mixed-Wet Fractured Porous Media. SPE Reserv. Eval. Eng. 2001, 4, 516–524. [Google Scholar] [CrossRef]
- Fernø, M.A.; Torsvik, M.; Haugland, S.; Graue, A. Dynamic Laboratory Wettability Alteration. Energy Fuels 2010, 24, 3950–3958. [Google Scholar] [CrossRef]
- Zhou, X.; Morrow, N.; Ma, S. Interrelationship of Wettability, Initial Water Saturation, Aging Time, and Oil Recovery by Spontaneous Imbibition and Waterflooding. SPE J. 2000, 5, 199–207. [Google Scholar] [CrossRef]
- Kaprielova, K.M.; Yutkin, M.P.; Mowafi, M.; Gmira, A.; Ayirala, S.; Yousef, A.; Radke, C.J.; Patzek, T.W. Improved Amott Method to Determine Oil Recovery Dynamics from Water-Wet Limestone Using GEV Statistics. Energies 2024, 17, 3599. [Google Scholar] [CrossRef]
- Kashchiev, D.; Firoozabadi, A. Analytical Solutions for 1D Countercurrent Imbibition in Water-Wet Media. SPE J. 2003, 8, 401–408. [Google Scholar] [CrossRef]
- Schmid, K.S.; Geiger, S. Universal scaling of spontaneous imbibition for water-wet systems. Water Resour. Res. 2012, 48. [Google Scholar] [CrossRef]
- Schmid, K.; Geiger, S. Universal scaling of spontaneous imbibition for arbitrary petrophysical properties: Water-wet and mixed-wet states and Handy’s conjecture. J. Pet. Sci. Eng. 2013, 101, 44–61. [Google Scholar] [CrossRef]
- Schmid, K.S.; Alyafei, N.; Geiger, S.; Blunt, M.J. Analytical Solutions for Spontaneous Imbibition: Fractional-Flow Theory and Experimental Analysis. SPE J. 2016, 21, 2308–2316. [Google Scholar] [CrossRef]
- Guen, S.S.L.; Kovscek, A.R. Nonequilibrium Effects During Spontaneous Imbibition. Transp. Porous Media 2006, 63, 127–146. [Google Scholar] [CrossRef]
- Schembre, J.M.; Kovscek, A.R. Estimation of Dynamic Relative Permeability and Capillary Pressure from Countercurrent Imbibition Experiments. Transp. Porous Media 2006, 65, 31–51. [Google Scholar] [CrossRef]
- Gumbel, E.J. Statistics of Extremes; Columbia University Press: New York, NY, USA, 1958. [Google Scholar] [CrossRef]
- Arias-Ortiz, D.; Patzek, T.W. Physics-based, data-driven production forecasting in the Utica and Point Pleasant Formation. Geoenergy Sci. Eng. 2025, 246, 213491. [Google Scholar] [CrossRef]
- McPhee, C.; Reed, J.; Zubizarreta, I. Chapter 7—Wettability and Wettability Tests. In Core Analysis; McPhee, C., Reed, J., Zubizarreta, I., Eds.; Developments in Petroleum Science; Elsevier: London, UK, 2015; Volume 64, pp. 313–345. [Google Scholar] [CrossRef]
- Patzek, T.W.; Male, F.; Marder, M. Gas Production in the Barnett Shale Obeys a Simple Scaling Theory. Proc. Natl. Acad. Sci. USA 2013, 110, 19731–19736. [Google Scholar] [CrossRef] [PubMed]
- Schechter, D.; Zhou, D.; Orr, F. Low IFT Drainage and Imbibition. J. Pet. Sci. Eng. 1994, 11, 283–300. [Google Scholar] [CrossRef]
Disclaimer/Publisher’s Note: The statements, opinions and data contained in all publications are solely those of the individual author(s) and contributor(s) and not of MDPI and/or the editor(s). MDPI and/or the editor(s) disclaim responsibility for any injury to people or property resulting from any ideas, methods, instructions or products referred to in the content. |
© 2025 by the authors. Licensee MDPI, Basel, Switzerland. This article is an open access article distributed under the terms and conditions of the Creative Commons Attribution (CC BY) license (https://creativecommons.org/licenses/by/4.0/).

