Article

Machine Learning Improves Performance Prediction and Interpretation of Efficiency Influencing Factors of a Novel Basalt-Fiber-Bundle Thermal Flow-Reversal Reactor for Methane Recovery

1
State Key Laboratory of Marine Resource Utilization in South China Sea, Hainan University, Haikou 570228, China
2
Key Laboratory of Solar Energy Science and Technology in Jiangsu Province, Institute of Energy and Environment, Southeast University, Nanjing 210096, China
3
School of Mechanical Engineering, Southeast University, Nanjing 211189, China
4
School of Science, Aalto University, P.O. Box 15100, FI-00076 Espoo, Finland
*
Author to whom correspondence should be addressed.
Energies 2025, 18(21), 5730; https://doi.org/10.3390/en18215730
Submission received: 30 August 2025 / Revised: 15 October 2025 / Accepted: 24 October 2025 / Published: 31 October 2025

Abstract

Low-concentration methane emissions from mines can be recovered using different reactor designs. Here, different artificial intelligence network techniques were employed to predict thermal performance of a basalt-fiber-bundle thermal flow-reversal reactor and investigate the influence of input parameters. The Back Propagation (BP) model gave the best accuracy (R2 = 0.974 for outlet temperature, 0.967 for thermal efficiency), exceeding that of traditional Computational Fluid Dynamics (CFD) simulations. For the present design, when flow velocity exceeded 1.5 m/s, the outlet gas temperature shifted from rising to falling, explained by the heat transfer between the gas and the solid inside the flow channel. Increasing the length of the flow-reversal period in the high-temperature phase reduced the outlet temperature, e.g., an increase from 60 s to 200 s decreased the outlet temperature by 34.1 K. Increasing inlet methane concentration (e.g., from 0.3% to 0.8%) first showed a slight improvement in thermal efficiency but further increase accelerated the oxidation reaction rate inside the reactor, reducing the temperature difference between the solid and gas in the channel, which slowed the heat exchange process and resulted in a downward trend in efficiency. The results indicate that the reactor can handle a wide range of exhaust gas concentrations, being suitable to treat low-methane-concentration exhaust gas. The BP model helped to establish the theoretical basis for setting optimal parameters values for the operation of the proposed reactor.

1. Introduction

Reducing greenhouse gas (GHG) emissions will require massive investment in clear energy production and improvements in energy efficiency. Though carbon dioxide is the most important greenhouse gas, methane also needs consideration through its 25-times higher global warming potential than CO2 [1]. For example, the annual emissions from ventilation air methane (VAM) in Chinese mines account for 45% of the world’s total VAM emissions [2,3,4,5]. To recover low-concentration gas [2], thermal flow-reversal reactors (TFRRs) are widely used in industries and are also able to recover heat [6,7].
However, a traditional ceramic honeycomb thermal flow-reversal reactor has high pressure losses, requires much floor area, and has a short service life [8,9,10]. These reactors often employ ceramic materials composed of cordierite, mullite, and other materials, which can easily be damaged by sharp stress variations from temperature change, resulting in performance degradation and shorter service life [11,12], whereas basalt fibers show much better performance and are utilized in automobile, military, and aerospace applications [13]. Dhand et al. [13] give more specific data on improved mechanical properties, heat resistance, and chemical resistance of basalt fiber in specific industrial fields. Liu et al. [14,15] showed that the mechanical and chemical properties of basalt melt at high temperature are excellent. Also, basalt fibers made from basalt melt have higher elastic modulus and tensile breaking strength than ordinary glass fiber, in addition to good chemical and thermal stability, which enable continuous operation over a wide temperature range important to methane oxidation.
Understanding the functioning of the thermal flow-reversal reactor is also important for optimal use of VAM. Slepterev et al. [16] performed numerical simulations on oxidation mechanisms of methane in a thermal flow-reversal reactor and found that a large amount of CO is generated during the homogeneous oxidation of methane; they also suggested that the conversion rate of methane was related to the size of the filler in the reactor. Glarbor et al. [17] developed a four-step simplified reaction mechanism for methane oxidation considering methane, oxygen, hydrogen, carbon monoxide, carbon dioxide, and water as independent reactors, showing good agreement to detailed mechanisms. Wang et al. [18] simplified the methane oxidation mechanism by combining experiments with numerical analysis and proposed a two-step continuous mechanism of methane oxidation using determined kinetic parameters to describe the combustion process of methane in the reactor.
As methane oxidation reaction involves hundreds of free radicals, adopting detailed reaction mechanisms will increase the simulation time of the reactor. To reduce the time needed, a simplified single-step reaction mechanism in the simulation process has been developed [19,20,21]. Gosiewski [22] et al. adopted a simplified aerodynamic CFD model and used the quasi-steady state QSS-CFD method to simulate airflow, which can be used to evaluate the resistance characteristics and flow velocity. Zhang et al. [23] used a 3D CFD-model and ignored radiation heat transfer to simulate the exhausted air and gas with a thermal flow-reversal oxidizer, presenting a new model of gas–solid pressure loss heat transfer in the reactor. Lan et al. [24] conducted a 3D numerical analysis of the oxidation and combustion process of exhaust gas in the thermal flow-reversal oxidizer, analyzing the effects of the channel length, feed methane concentration, inlet gas velocity, and circulation time on the reactor behavior. You et al. [25] compared the accuracy of a 3D model and a 2D model of a ceramic honeycomb thermal flow-reversal oxidizer and that found the former was closer to experimental data but the error between the two models and the experimental data was within 5%. Gosiewski et al. [26] compared 1D simulations of the thermal flow-reversal oxidizer to experimental data, showing that the 1D model could meet the calculation stability and accuracy. More complex 2D and 3D models can improve the accuracy but at the cost of increased calculation instability.
Previous studies on oxidation inside the reactor have included, e.g., experimental investigation of mixed gases showing that higher gas yields and temperatures were obtained with premixed air–methane–CO2 conditions [27]. Mao et al. [28] were able to accelerate the convergence of the high-temperature zone of the reactor by controlling the flame tilt through adjusting the flow valve opening and implementing asymmetric flow-reversal timing. Kuang et al. [29] showed that methane gas concentrations as low as 0.1% could be handled by the reactor under certain parameter conditions, e.g., inlet velocity. Li et al. [30] investigated the effects of inlet concentration and flow-reversal period on reactor thermal stability, being able to mitigate asymmetry while maintaining stable reactor operation. Mullite, cordierite, and similar materials have commonly been used for the thermal flow-reversal oxidizers in previous studies, with lower gas treatment capability and a shorter lifetime than basalt fiber, which is also subject of this work. Basalt material enables high-temperature operation for methane oxidation, and its specific heat capacity increases with temperature, facilitating thermal flow-reversal oxidation and the utilization of residual heat.
Traditional thermal flow-reversal oxidizers often employ honeycomb structures [8,9,10,27,28] that have several remaining issues such as large footprint, high pressure loss, and relatively high initial cost, albeit including extensive research work [27,28]. In this study, a basalt fiber bundle thermal flow-reversal oxidizer with mixed flow channels is proposed, combining large channels with microchannels. Microchannels force the fluid to achieve rapid heat exchange between the solid and fluid, while the large channels minimize resistance, allowing the heated gas to exit quickly, effectively reducing system pressure loss and increasing gas throughput per unit time. The design employs a transverse fluid flow pattern that induces secondary flow. Furthermore, after twisting, the fiber bundles assume a braided configuration, which enhances surface flow disturbance compared with smooth surfaces, disrupting the boundary layer and improving heat transfer. An important contribution of this configuration is that it effectively enhances the reactor’s oxidation performance and broadens the range of treating low-concentration mine ventilation gas.
Although the advantages of a basalt-fiber-bundle thermal flow-reversal reactor as an oxidizer have widely been acknowledged, the understanding of its thermal performance and modeling of its thermal performance are still incomplete. modeling and simulation tools for thermal flow-reversal oxidizers are important to their design and analyses, but these have mainly focused on ceramic honeycomb reactors [24,25,28], e.g., mathematical models for internal heat transfer and flow. In this study, a 2D mathematical model for a basalt fiber bundle thermal flow-reversal oxidizer was therefore developed first, resulting in a CFD-type of model. Traditional approaches to modeling, such as CFD, solve nonlinear partial differential equations requiring simplified assumptions, which reduces the accuracy of the models [31,32]. For example, using a 2D model here focusing on the radial flows only simplifies the actual 3D unsteady oxidation process, whereas machine learning technologies such as artificial neural network (ANN)-based models can, however, effectively learn and find the nonlinear relationship between system input and output [33] and thus provide new insight and understanding to science–engineering problems. In this work, ANN was applied to detailed prediction and analysis of the thermal performance of a basalt-fiber-bundle thermal flow-reversal reactor, which has not been tested before to our best knowledge, also filling a major gap in the modeling of the reactors. In the present work, the Back Propagation (BP) approach is utilized and compared with multiple linear regression (MLR), Computational Fluid Dynamics (CFD) simulations, and real measurements. The application of the machine learning method in the present application represents a novel approach.
One of the main objectives of this study was improving the thermal analysis of basalt-fiber-bundle thermal flow-reversal reactor and enabling more effective optimization of their design, typically not covered by present studies. This work also aims at providing a theoretical foundation for further exploration of predictive performance enhancement of such systems and providing insight to integration of mathematical models with machine learning methods to improve the predictive capability of models, e.g., using computational results from mathematical models as input for machine learning. Such an approach may advance performance prediction not only for basalt-fiber-bundle thermal flow-reversal reactors but also for a wider range of emerging energy systems.
The rest of this paper is organized as follows. First, the design and structure of a basalt fiber bundle thermal flow-reversal reactor are described, and the experimental setup is explained. Then, the results of using an artificial neural network to evaluate the thermal efficiency of the reactor are presented and compared with the MLR and CFD simulations using statistical indicators. After that, based on the evaluation data of the BP method, the influence of main input variables on the thermal performance of the studied reactor is analyzed. Finally, the major analysis results and conclusions are discussed.

2. Basalt-Fiber-Bundle Thermal Flow-Reversal Reactor System

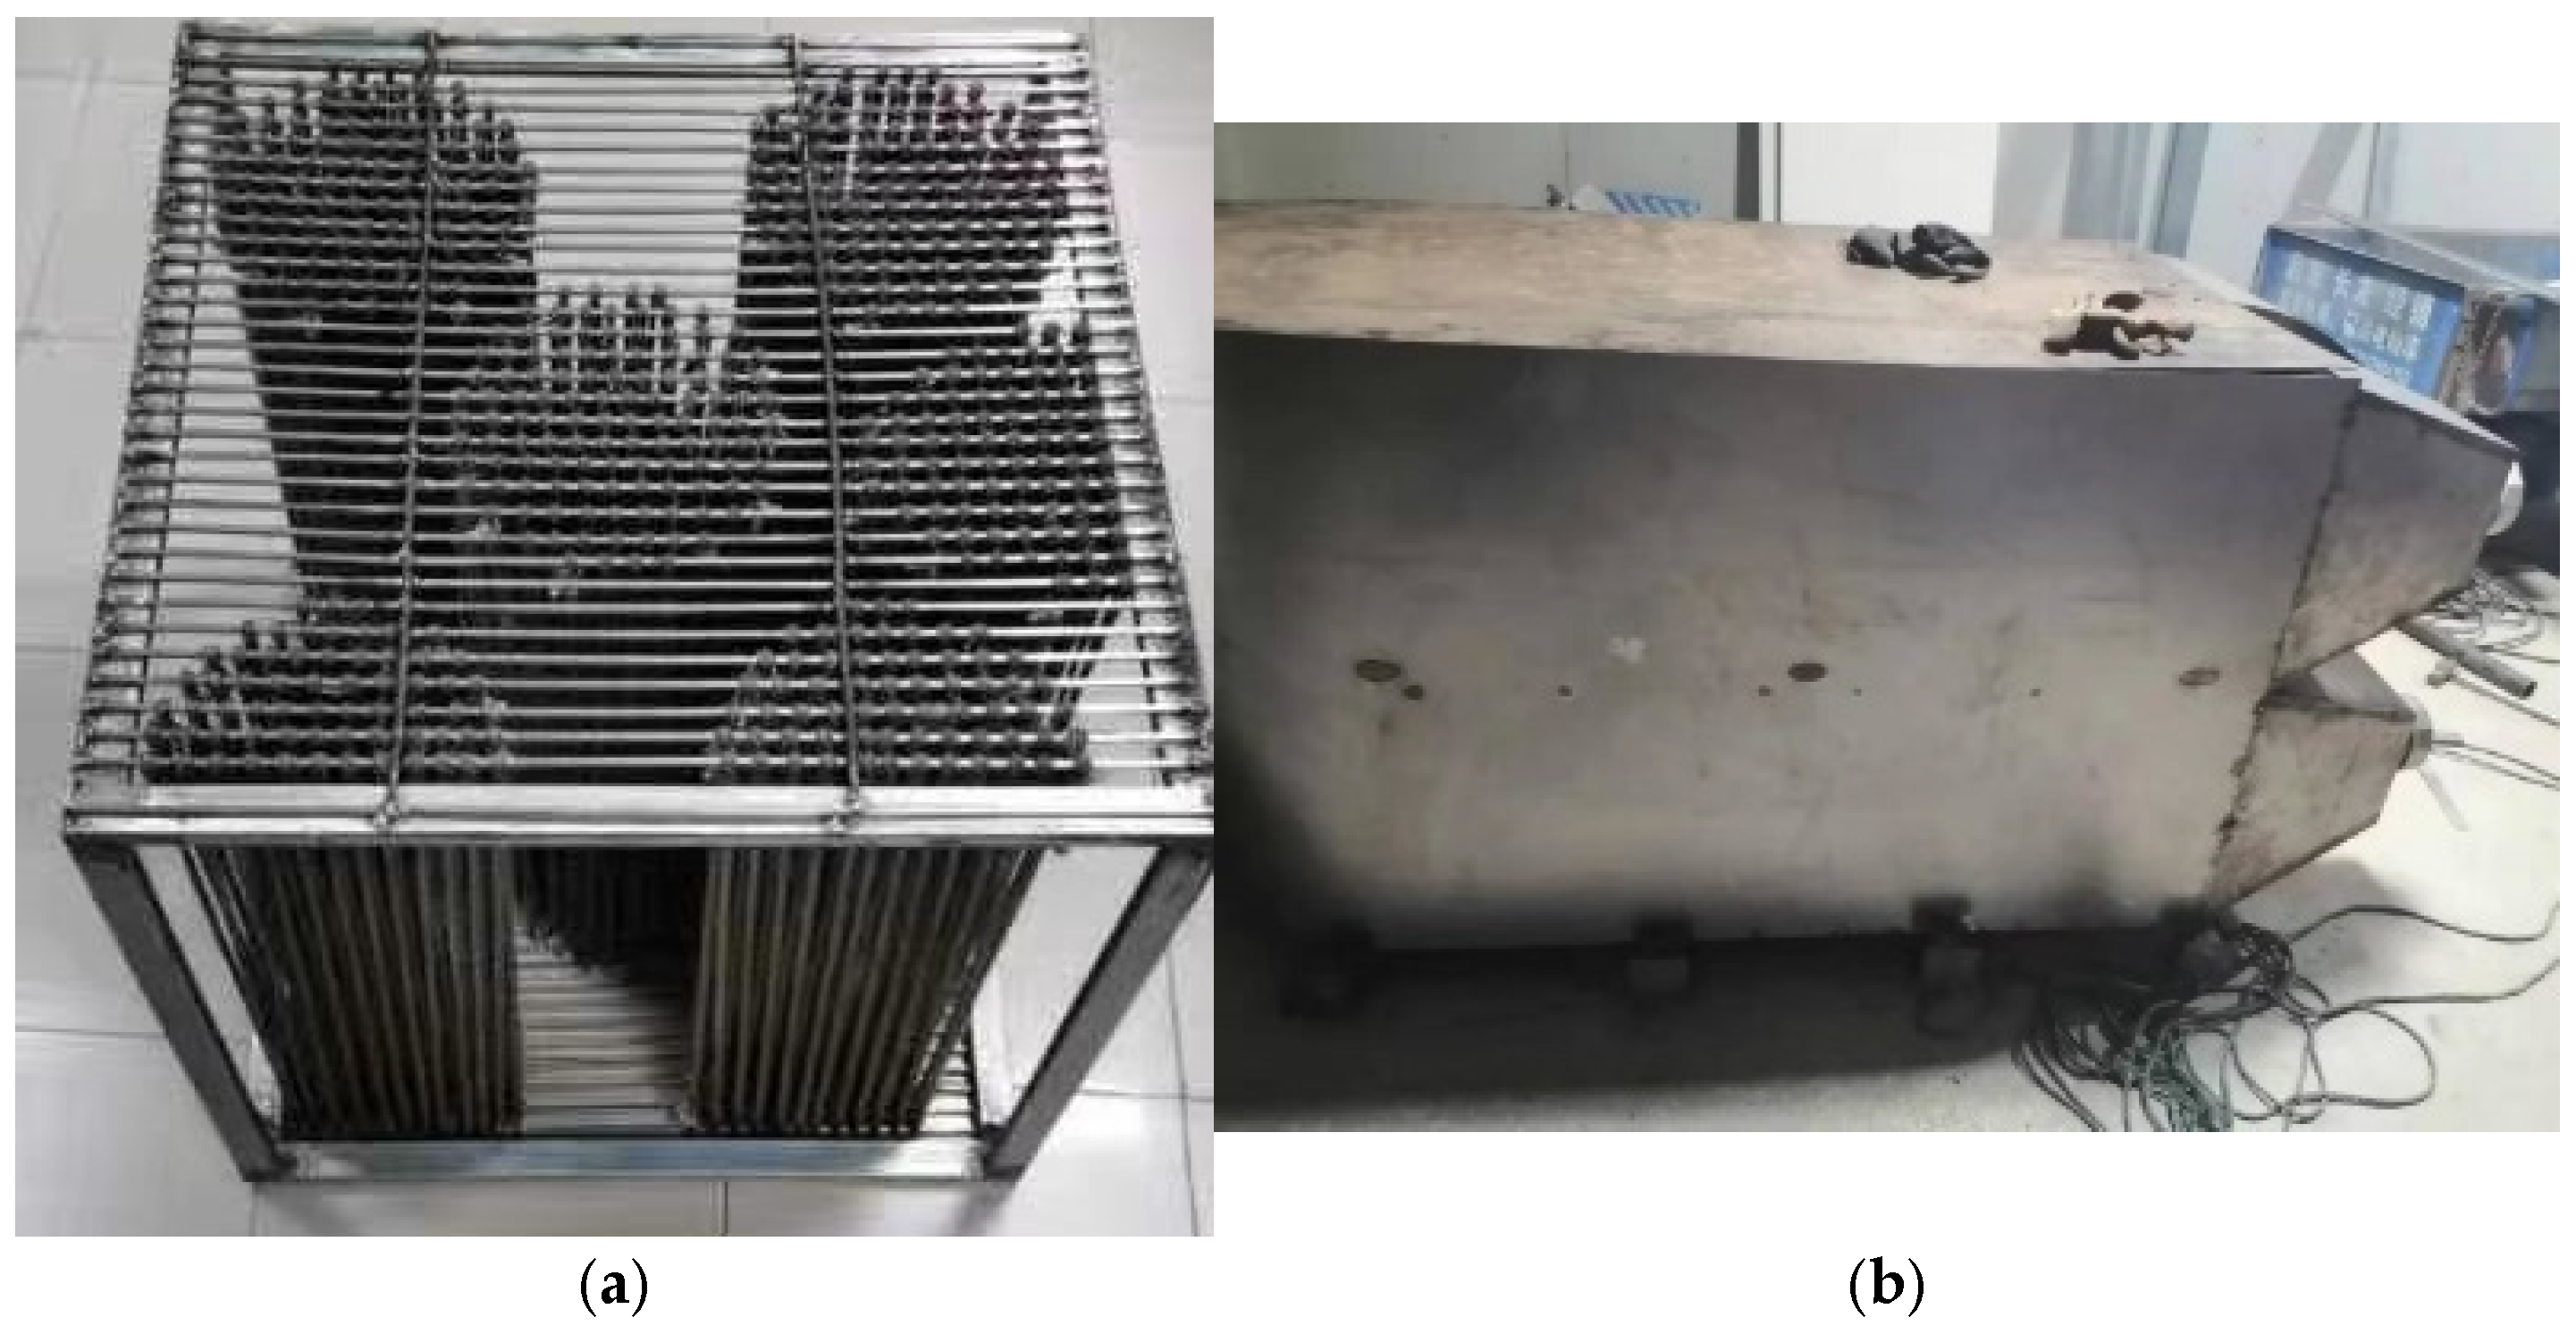
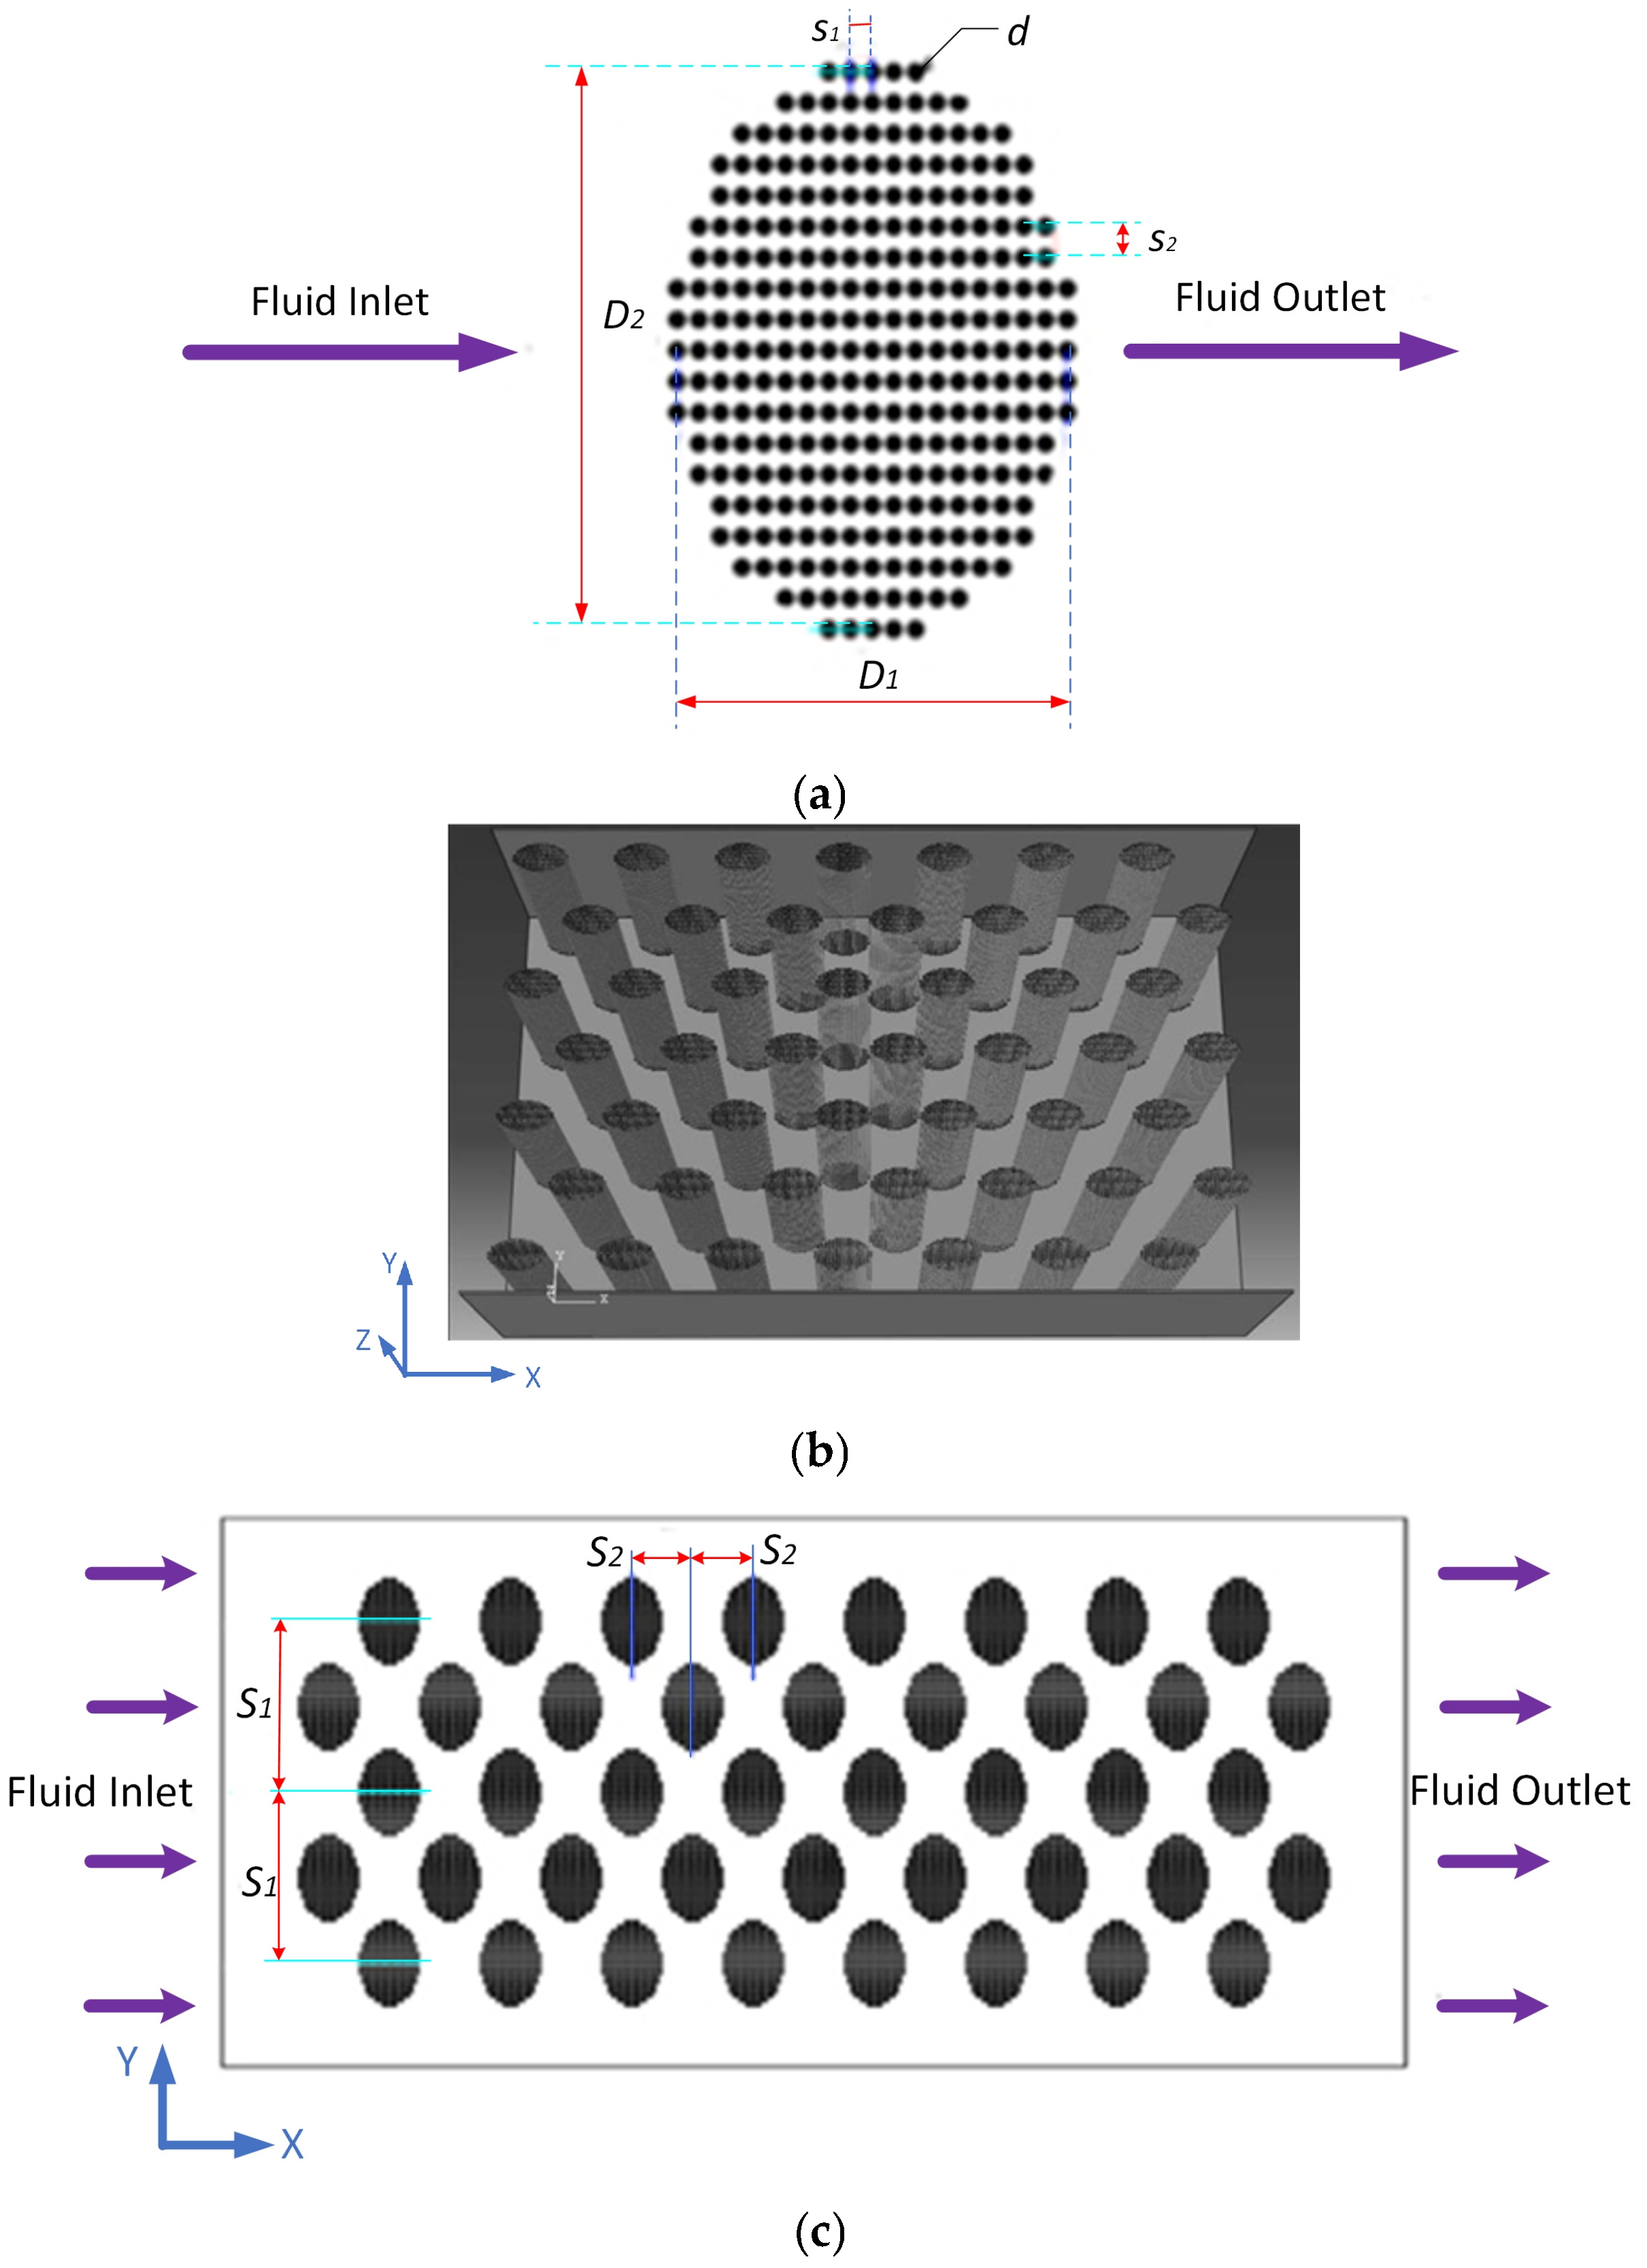
The compactness, firmness, and load resistance of a single fiber is relatively weak when arranged in parallel, which also affect the heat transfer efficiency and flow rate of fluid. Therefore, in this work, several basalt fibers of 20 μm were twisted 50 times to form a fiber bundle with a diameter of 3 mm as the basic material of the oxidizer bed. The physical structure of the basalt fiber bundle is illustrated in Figure 1. The new type of thermal reactor composed of basalt fiber bundles and mixed flow channels includes a four-chamber basalt fiber bundle group. The flow channels formed by the staggered arrangement of these fiber bundles are folded in series so that the inlet and outlet are on the same side and placed in an incubator to decrease the heat loss of the system. The reactor device was manufactured by a mechanical component processing factory located in Xi’an, Shanxi province, China. The physical structure of the reactor is shown in Figure 2. In this system, 277 fiber bundles with a diameter of 3 mm are arranged in order to form a fiber bundle group. The flow channel inside the fiber bundle group is called the “micro channel”, and the flow channel containing 50 fiber bundles in the staggered arrangement is called the “big channel”. The arrangement structure is illustrated in Figure 3. The arrangement spacing of fiber bundles in the fiber bundle group is s 1 = 2.6 d in the direction of the vertical flow channel and s 2   =   1.4 d in the direction of the parallel flow channel. The gas temperature is measured at 0.07 m, 0.78 m, 1.57 m, 2.35 m, 3.14 m, and 3.93 m from the inlet of the flow channel. The gas reverses periodically in the basalt-fiber-bundle thermal flow-reversal reactor. The period where the gas continues to flow in one direction is called the cycle semiperiod. The gas flows in from the inlet of the reactor keeps the flow direction unchanged until the end of a cycle semiperiod and reverses the flow in a complete cycle in the reactor [29,34].
The infrared methane detector used for measuring methane concentration has an uncertainty of ±0.5% when the methane concentration is below 1%. The differential pressure orifice flowmeter employed for measuring the gas inlet flow rate has an uncertainty of ±1%. The K-type thermocouple applied for temperature measurement has a measurement range of −200 °C to 1370 °C, with an uncertainty of ±0.75%.

3. Modeling of the Reactor

In the next section, the models used in this study are presented in detail, including the CFD, MLR, and BP models.

3.1. Computational Fluid Dynamics (CFD)

The mathematical model of the reactor is presented in the next section. It will also be used later used for comparison with the ANN model. For modeling purposes, the state of the basalt melt rod bundle is assumed to be consistent in the axial direction, i.e., no temperature gradient in the axial direction [29]. The axial length of the basalt fiber bundle is <600 mm regardless of the influence of air buoyancy. Thus, the 3D model of the cross-swept fiber bundle group can be simplified into a 2D model. Figure 3 shows a schematic of the 2D model. Taking into consideration that the basalt fiber bundles inside the reactor are arranged in a staggered and symmetrical array, assuming that the entire basalt melt bundle is infinite and periodic in geometric characteristics, it can be regarded that the heat transfer in each flow channel inside the reactor is the same, so a flow channel inside the reactor is selected for single-channel numerical analysis.
The following assumptions in the modeling are made [29]:
  • Regardless of thermal expansion and cold contraction of the basalt fiber bundle with temperature, it is assumed that the volume of the material will not change, i.e., the density is constant. This was also confirmed by actual material measurements;
  • Radiation heat transfer in the channel is ignored, and convection heat transfer only is considered;
  • It is assumed that the gas is an incompressible ideal gas.
The 2D geometric model of the reactor based on the above assumptions is shown in Figure 3c. The oxidation heat transfer process in the reactor should consider unsteady chemical reaction and heat transfer processes, which requires considering conservation of gas composition, mass, momentum, and energy [29]:
Methane consumption rate w ¯ :
w ¯ = ρ g Y C H 4 A e E R T g
where A is the pre-exponential factor, E represents the activation energy of the reaction, and R is the universal gas constant.
Conservation equation of the gas composition:
ρ g Y i t + ρ g u g Y i x + Y i y + w ¯ = 0
Gas energy conservation equation:
V g ρ g c g T g t + V g ρ g c g u g T g x + T g y = V g x λ g T g x + V g y λ g T g y + h v T b T g + Q w ¯
Solid energy conservation equation:
V b ρ b c b T b t = λ b 2 T 2 x + 2 T 2 y + h v T b T g β T b T g
where V g , ρ g , c g , u g , and T g are the volume, density, specific heat capacity, flow rate, and temperature of the gas; V b , ρ b , c b , T b , and λ b are the volume, density, specific heat capacity, temperature, and thermal conductivity of the basalt fiber, respectively; h v is the convective heat transfer coefficient between two-phase gas–solid; and β is the heat loss coefficient.
The thermal properties of the basalt fiber are from [29], including specific heat capacity, thermal diffusivity, density, and thermal conductivity.
Further assumptions used in solving Equations (1)–(4) include the following: The thermal resistance of the basalt fibers is considered negligible because they are low-dimensional devices with a low Biot number. The basalt melt fiber bundle is assumed to be uniform along the axial direction, i.e., no temperature gradient in this direction. Furthermore, since the axial length of the basalt fiber bundle studied in this work is less than 600 mm, the effects of air buoyancy were negligible. All boundaries except for the inlet and outlet were treated as symmetric adiabatic boundaries, while the interfaces between the fluid and solid regions were assigned as coupled boundaries. Additionally, a fluid boundary-layer mesh comprising 10 layers was applied on the fluid side to more accurately capture the fluid–solid heat transfer within the thermal boundary layer.
In the basalt-fiber-bundle thermal flow-reversal oxidizer, the feed gas undergoes periodic flow reversal. The duration of continuous flow in one direction is defined as a half-cycle, and the reversal itself is assumed to be instantaneous, exerting no influence on the reactor’s internal state or parameters. In the numerical simulations, the reversal is represented as follows: the feed gas enters the reactor through a velocity inlet and maintains its flow direction until the end of a half-cycle, at which point the reversal occurs. After reversal, the original velocity inlet becomes a pressure outlet, with boundary conditions identical to those in the previous half-cycle, while the original pressure outlet becomes the new velocity inlet, again with the same parameter settings as in the preceding half-cycle. Through this mechanism, the feed gas completes one full cycle consisting of forward and reverse flows within the reactor.
The physical parameters, boundary condition settings, initial conditions, solver settings, etc., of the fluid and solid used in theoretical calculation, as well as the specific calculation methods and steps, are from the literature [30]. ANSYS Fluent 2021 R1 computational fluid dynamic (CFD) [35,36,37] software was used to solve the mathematical model described above.
For the fluid model, the k–ε model in ANSYS Fluent was selected, as it can accommodate both laminar and turbulent flow regimes. Based on the standard k–ε formulation, Fluent further provides the RNG k–ε model and the realizable k–ε model by introducing different modifications to the ε term. Although the latter two models are capable of simulating more complex swirling flows, they are still constrained by the assumption of isotropic eddy viscosity. Comparative calculations indicated little difference between the RNG k–ε model and the standard k–ε model in this study. Given that the physical model involves multiple cylinder flow-around problems, the RNG k–ε model was adopted.
For the chemical reaction model, ANSYS Fluent offers several approaches for gas-phase transport and combustion. Among them, the general finite-rate model computes reaction rates based on the Arrhenius formulation and allows for user-defined chemical mechanisms, making it applicable to premixed combustion, partially premixed reactions, and non-premixed turbulent reactions. Since this study focuses on the high-temperature oxidation and decomposition of methane, with the objective of obtaining spatial distribution of species and reaction rates, the general finite-rate model was selected.
The cyclic flow-reversal process was implemented in ANSYS Fluent using the Journal file function and was simulated until the basalt-fiber-bundle thermal flow-reversal oxidizer reached a stable periodic state.
Due to the periodic reversal of flow direction, the operation of the thermal flow-reversal oxidizer remains in a continuously unsteady state. For reactors with periodically reversed flow, a cyclic quasi-steady state (CSS) can be defined: when the accumulation of mass and energy disappears during the cycle, the reactor reaches CSS, and its internal behavior becomes repeatable. Therefore, determining whether the reaction has reached CSS is crucial for reducing computational time and effort.
In this study, six different operating conditions were investigated: For the reactor at vin = 1.0 m/s, methane concentrations φ C H 4 = 0.3%, 0.4%, 0.5%, 0.6%, and 0.7% were considered, and additionally φ C H 4 = 0.2% at v i n   = 0.85 m/s. The cyclic stability of the reactor was assessed using the method proposed by Gosiewski [38], where the average temperature difference between monitoring points in adjacent half-cycles, T a v < 10 K, was used as the criterion for reaching CSS.
In the basalt-fiber-bundle thermal flow-reversal oxidizer, monitoring points were placed along the main flow path at the center of each fiber bundle, as well as at the inlet and outlet, resulting in a total of 52 monitoring points. The evolution of T a v over time for the six operating conditions was calculated (see Ref. [29] for detailed procedures and results). It was observed that ΔTav gradually converged as the periodic flow-reversal reaction proceeded until the reactor reached steady cyclic behavior. For instance, at φ C H 4 = 0.7%, v i n = 1.0 m/s, and − t c = 80 s, only 4.5 cycles (360 s) were required to satisfy the CSS criterion T a v < 10 K. When the inlet methane concentration decreased to 0.3%, achieving CSS required 10 cycles (800 s). These results indicate that higher methane concentrations in the feed gas reduce the time required to reach CSS.
Additionally, based on the oxidation temperature of low-concentration methane, regions within the reactor exceeding 973.2 K were defined as high-temperature platforms. Once the cyclic process reached CSS, the width of the high-temperature platform no longer decreased significantly with increasing cycles. Analysis of six different methane concentrations showed that for φ C H 4 = 0.3%, v i n = 1.0 m/s, the width reduction trend stabilized by the 10th cycle and remained at 1.1 m after the 16th cycle (1280 s). When the inlet methane concentration increased to 0.7%, the high-temperature platform stabilized at 2.28 m within 1120 s (14 cycles).
These results demonstrate that higher inlet methane concentrations shorten the time required to reach CSS while producing a wider high-temperature platform. This is because higher methane concentrations release more heat during oxidation, maintaining a stable high-temperature reaction zone, shortening the heating and cooling section lengths, and facilitating stabilization of the cyclic process while widening the high-temperature platform.
Based on these analyses, all methane concentrations reached CSS within 20 cycles; therefore, data from the 20th cycle were used for subsequent simulation analyses.

3.2. Multiple Linear Regression (MLR) Model

The second model used in the comparison is the multiple linear regression (MLR) model. In practical engineering problems, such as the reactor performance in this study, the variation in dependent variables is often affected by several factors, i.e., it is necessary to use two or more influencing factors as independent variables to describe the change in the dependent variables. In this kind of multiple linear regression, the relation of the dependent variable y and independent variables x 1 , x 2 , , x k is as follows [39]:
y = β 0 + β 1 x 1 + β 2 x 2 + + β n x n
The functional relationship between the dependent and independent variables can be expressed as follows:
Y = X β + e
where Y is the output variable vector, X is the input variable matrix, and β is a coefficient vector and e is the error. Equation (6) can furthermore be written as follows:
Y 1 Y 2 · Y n = 1 1 X 11 X 21 · · X 1 p X 2 p · 1 · X n 1 · · · X n p β 1 β 2 · β n + e 1 e 2 · e n
β is the regression coefficient which can be determined from
β = X X 1 X Y

3.3. Back Propagation (BP) Model

The artificial neural network used here is a Back Propagation (BP) model. The BP neural network consists of an input, an output, and one or more hidden layers. The input signal is from the input layer to the output layer through hidden layer calculation. The output value is compared with the desired output value, and if there is a difference between these, the error is propagated from the output layer to the input layer in reverse. In the process, the gradient descent algorithm is employed to adjust the neuron weights [40,41,42]. The output is defined as follows [33,43]:
Y = σ i = 1 n w i j a i + b j
where σ is the activation function, n is the number of input data, w i j represent the interconnecting weights of input variables a i , and b j is the bias for the neuron.
The activation function employed here is “ r e l u ”-function which is defined in Equation (10):
r e l u z = z       i f   z 0 0       i f   z < 0

4. Data Analysis

4.1. Thermal Efficiency

Because the thermal flow-reversal oxidizer can be used both as a high-temperature gas purification device and a heat exchanger, thermal efficiency is a key indicator to assess the internal thermal performance and economic performance of the thermal flow-reversal oxidizer [34]. The internal part of the reactor is divided into three processes: the preheating, the reaction, and the heat storage sections [29,34]. To measure the comprehensive energy utilization efficiency of the three processes, thermal efficiency is calculated by employing the temperature of the high-temperature reaction section, the inlet temperature of the feed gas preheating section, and the outlet temperature of the heat storage section:
η = m o u t T T o u t m i n T T i n
where m i n is the reactor inlet gas mass flow rate, k g / s ; m o u t is the reactor outlet gas mass flow rate, k g / s ; T is the average temperature of the high temperature section in the reactor; K; T i n is the gas inlet temperature, K; and T o u t is the gas outlet temperature, K.
In this work, the content of methane in the gas is only within the range of 0.1~0.8%, and most of the feed gas is air, so it will not cause a large difference in the mass flow of the fluid at the inlet and outlet. It can be considered that the mass flow of gas at the inlet and outlet is equal. Equation (11) is the simplified to the following [34]:
η = T T o u t T T i n

4.2. Normalization

Different measurement indicators often have different dimensions and dimension units, which will affect the interpretation of the data analysis [33]. Therefore, the data is normalized here to a of range (0, 1) or (−1, 1) [33] to avoid the chance that any data dimension would dominate. The normalization is performed with Equation (13):
Y = Y i Y m i n Y m a x Y m i n H i g h v a l u e L o w v a l u e + L o w v a l u e
where Y i is the experimental data, Y m i n and Y m a x are the maximum and minimum value of sample values, and H i g h v a l u e and L o w v a l u e are 1 and −1, respectively [44,45].

4.3. Statistical Indicators

The performance metrics adopted in this work include efficiency of determination ( R 2 ), root mean square error ( R M S E ), and mean absolute error ( M A E ), which are defined as follows [44,46,47]:
Coefficient of Determination:
R 2 = 1 i = 1 n X A , i X P , i 2 i = 1 n X P , i 2
Root Mean Square Error:
R M S E = 1 n i = 1 n X A , i X P , i 2
Mean Absolute Error:
M A E = 1 n i = 1 n X A , i X P , i
These indicators are used to measure the relationship between the experimental data and prediction results and are necessary for evaluating the accuracy of the predicted performance of the model.

5. Results

CFD, MLR, and BP models were applied to predict the thermal performance of the basalt-fiber-bundle thermal flow-reversal reactor. A total of 240 experimental datasets were used, 80% of which were used for training and 20% for testing. The inlet gas concentration, inlet gas flow rate, and commutation cycle are the input variables, and the outlet temperature and reactor thermal efficiency are included in the output layer of the model.
In the neural network models, the number of neurons in the hidden layer is an important parameter that affects the performance of the model. In this work, the following equation is employed to determine the number of neurons [33]:
H n = M + N 2 + T n
where H n is the number of hidden layer neurons, M and N are the number of input neurons and output neurons, respectively, and T n is the number of training data.
The specific training, validation, and testing procedures were as follows:
  • Based on certain potential rules (e.g., Equation (17)), a set of hyperparameters is initially assumed for the model, such as the number of neurons in the hidden layers of a neural network.
  • The training dataset is divided into a training subset and a validation subset. Cross-validation is then employed to train the model on the training subset and optimize the hyperparameters using the validation subset. The detailed steps are as follows:
    2.1. The original dataset is randomly partitioned into k subsets without replacement.
    2.2. In each iteration, one subset is selected as the validation set, while the remaining k − 1 subsets are used as the training set.
    2.3. Step 2.2 is repeated k times, so that each subset is used once as a validation set and k − 1 times as part of a training set.
    2.4. The model is trained on each training set.
    2.5. The trained model is evaluated on the corresponding validation set; the performance metrics are calculated and stored.
    2.6. The average of the k evaluation results is taken as an estimate of accuracy serving as the performance metric of the model under k-fold cross-validation.
By averaging the results across k different partitions, k-fold cross-validation reduces variance, thereby making the model performance less sensitive to data partitioning.
3.
The model hyperparameters are modified and Step 2 is repeated until all possible hyperparameter combinations have been tested and evaluated.
4.
Through cross-validation, the model with the minimum error is selected and retrained using the entire training dataset.
5.
Finally, the validated model is tested on the independent test dataset to assess its generalization capability.

5.1. Multiple Linear Regression (MLR)

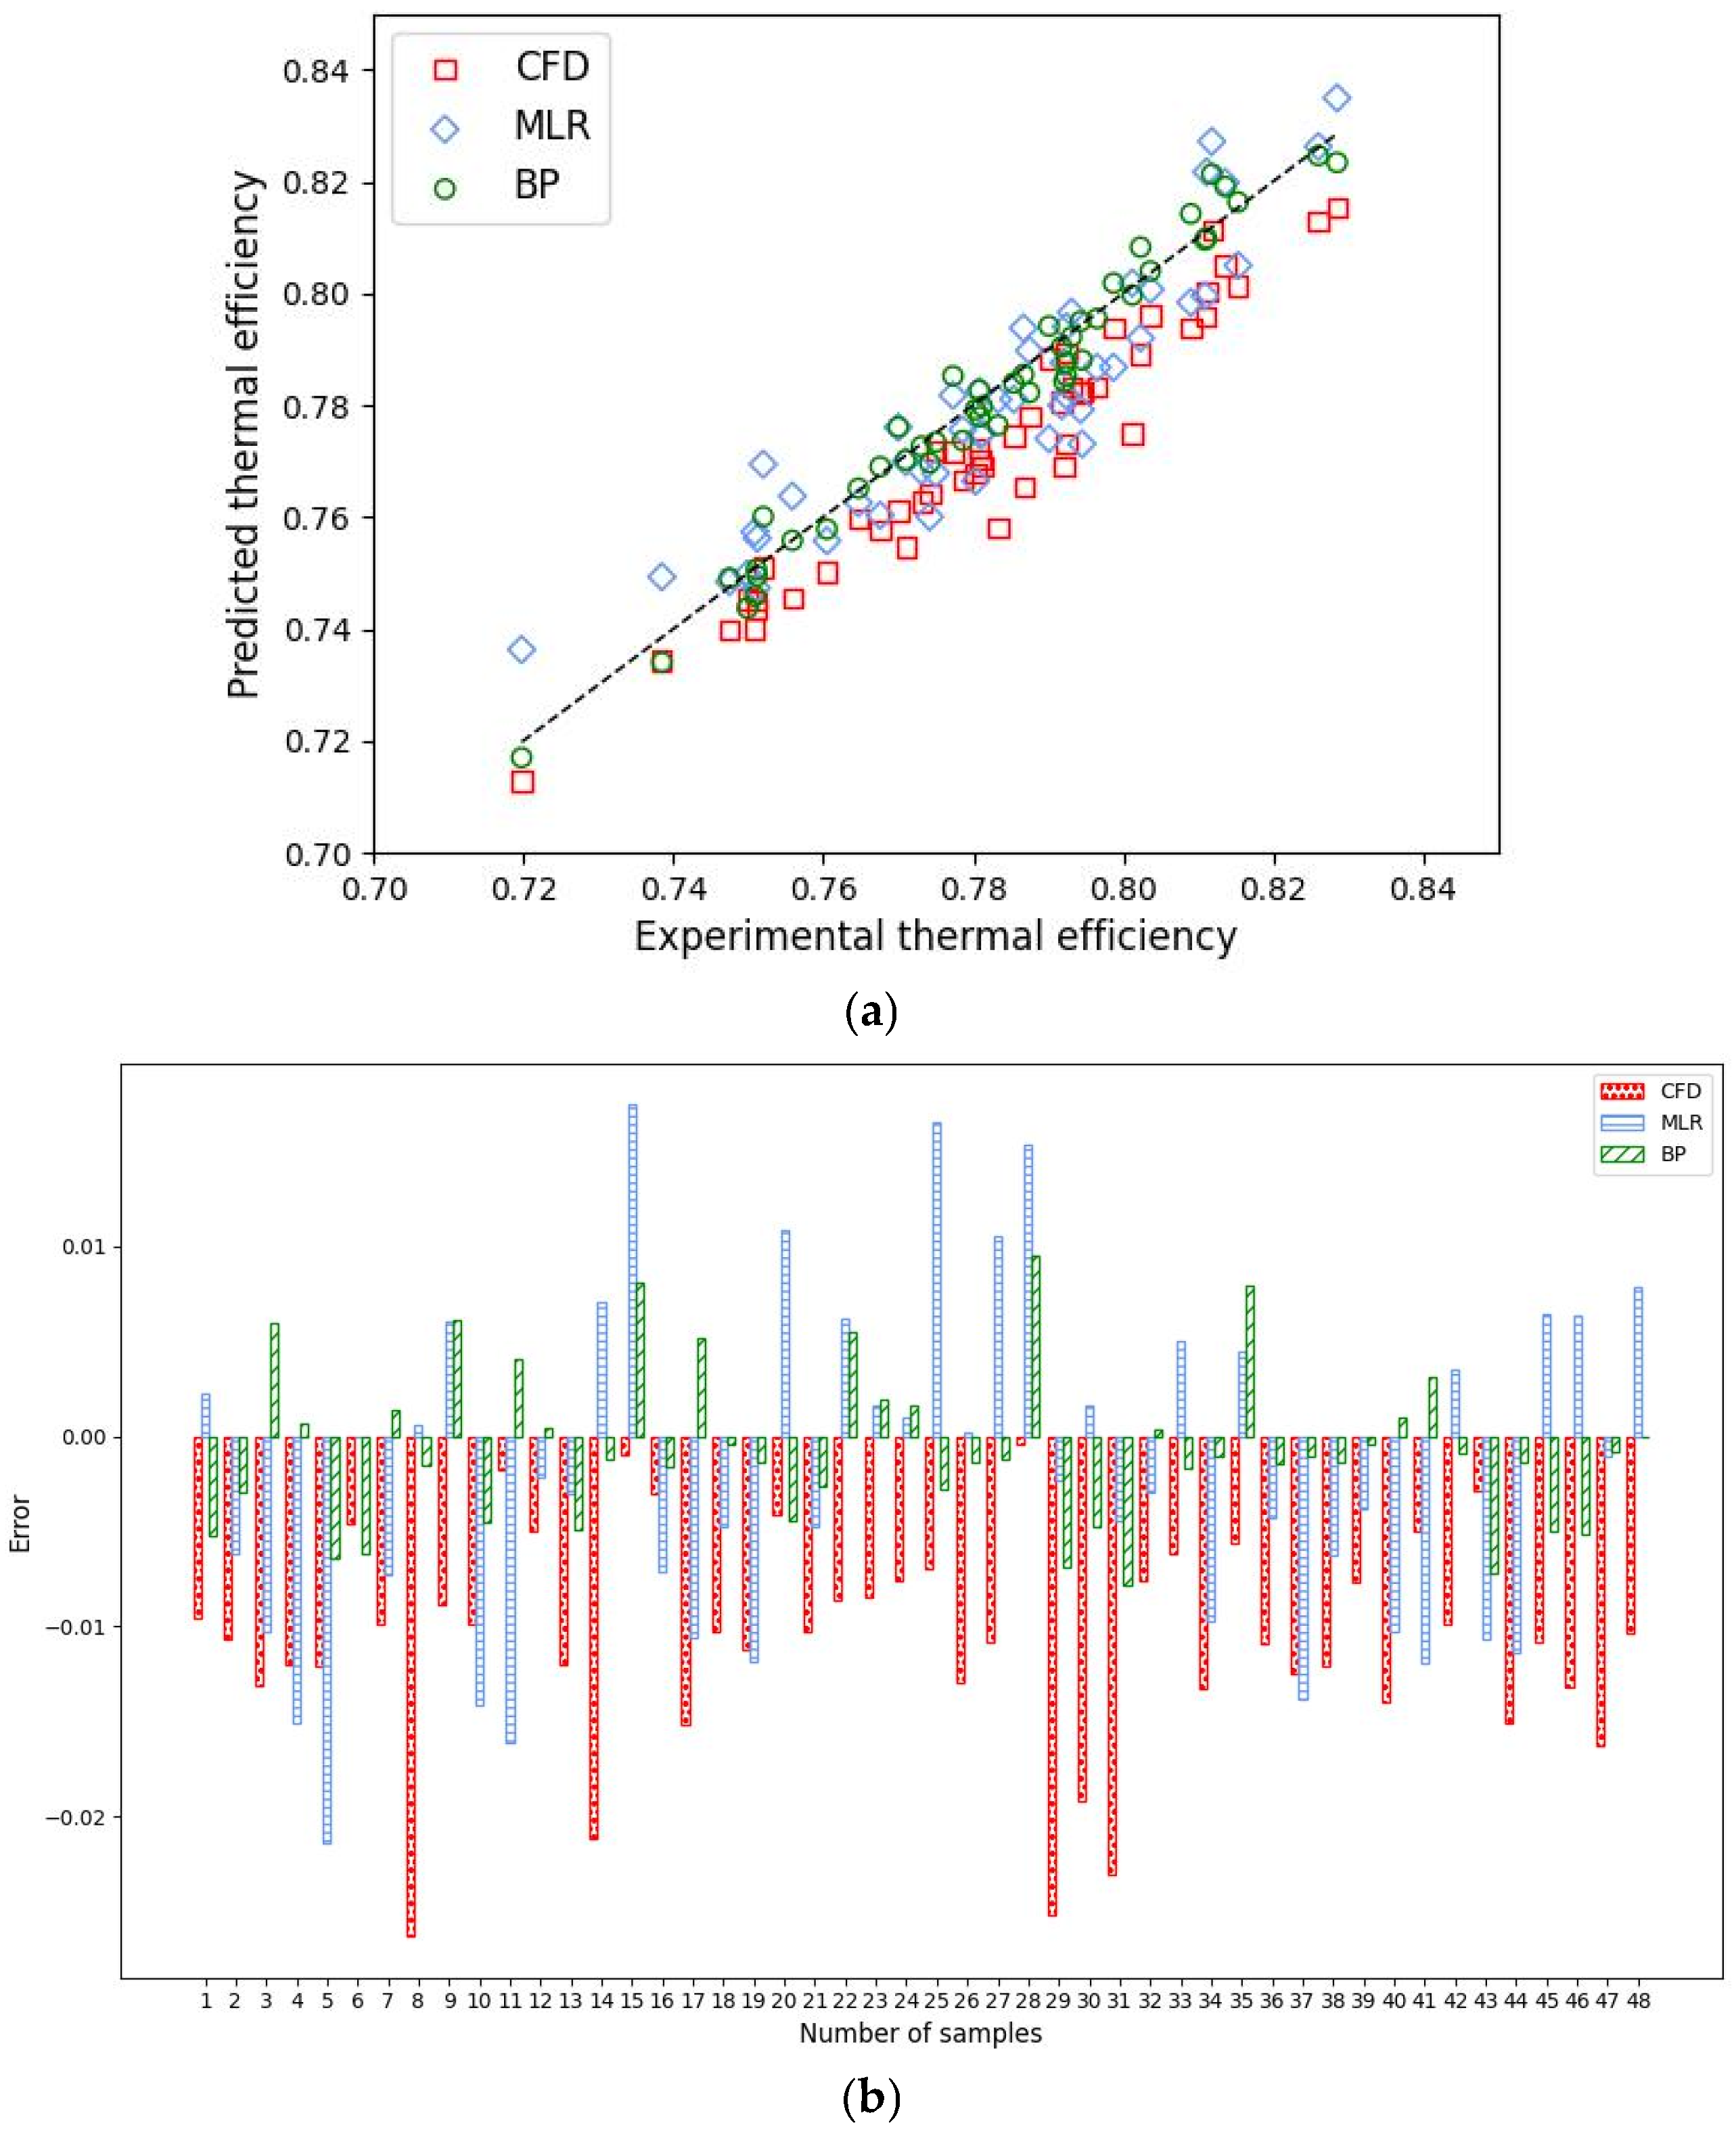
The results of MLR l are illustrated in Figure 4 and Figure 5. The outlet temperature calculated by MLR ranges from a minimum of 454.0 K to a maximum of 557.4 K, while the predicted thermal efficiency lies within the range of 0.736~0.835. The maximum error of the modeled outlet temperature is 21.4 K, and the maximum error of thermal efficiency prediction reached −0.0214. The absolute error of the thermal efficiency prediction over the whole range exceeded 0.01, and R 2 was 0.8647, This indicates that the MLR method was not ideal for this case.

5.2. Back Propagation (BP)

Figure 4a and Figure 5a indicate that the BP model matches the experimental result well. The prediction errors are shown in Figure 4b and Figure 5b. The difference between the measured and predicted values of the outlet are within ±10 K, while the gap between the calculated value of thermal efficiency and the actual data is between −0.0078 and +0.0095. The predicted performance indicator R 2 of the outlet temperature and thermal efficiency is 0.9742 and 0.9665, respectively. Clearly, the performance of the BP model is better than that of the MLR model and CFD simulation result.

5.3. Comparison of Prediction Performance of Different Models

The prediction accuracy of the models for the outlet temperature and thermal efficiency of the basalt-fiber-bundle thermal flow-reversal reactor are shown in Figure 4 and Figure 5. Compared to CFD and MLR, the BP model has the lowest mean absolute error values and the highest coefficient of determination for both the outlet temperature evaluation and thermal efficiency as illustrated in Table 1. When determining the outlet temperature, M A E values of CFD, MLR, and BP are 15.8 K, 7.9 K, and 3.8 K, respectively. The R M S E values of CFD, MLR, and BP for predicting thermal efficiency are 0.0120, 0.0077, and 0.0043, respectively, while R 2 of CFD, MLR, and BP is 0.6819 and 0.8647 vs. 0.9665. Therefore, the accuracy of the BP model is the best among the methods investigated in this work, followed by the MLR model, both of which outperform the CFD model described in Section 3. The mathematical CFD model is based on many simplifications, which results in a relatively large error in the simulation results, as the performance of the studied reactor is affected by many factors, thus negatively affecting the accuracy [31]. For example, geometric parameters, such as the spacing between fiber bundles, also have a significant impact on the oxidation performance and flow resistance characteristics of the reactor. Studies have shown that methane conversion increases with larger spacing in the parallel flow direction but decreases with larger spacing in the perpendicular flow direction, with the parallel flow spacing exhibiting a more pronounced effect on oxidation performance. Under constant conditions for other parameters, the flow resistance inside the reactor decreases as the bundle spacing increases. In this study, the fiber bundle spacing was set based on a comprehensive evaluation to achieve a relatively optimal solution. It should be noted that the detailed discussion of this aspect is beyond the scope of the present work. So, it is usually difficult to accurately evaluate its performance with a simplified mathematical model. MLR is not proficient in dealing with nonlinear problems, whereas the main advantage of the neural network technique is that it can solve complicated nonlinear relationships between variables and extracted data [33,48].

6. Effect of Gas Inlet Flow Rate, Commutation Cycle, and Gas Inlet Concentration on Thermal Efficiency

6.1. Gas Inlet Flow Rate

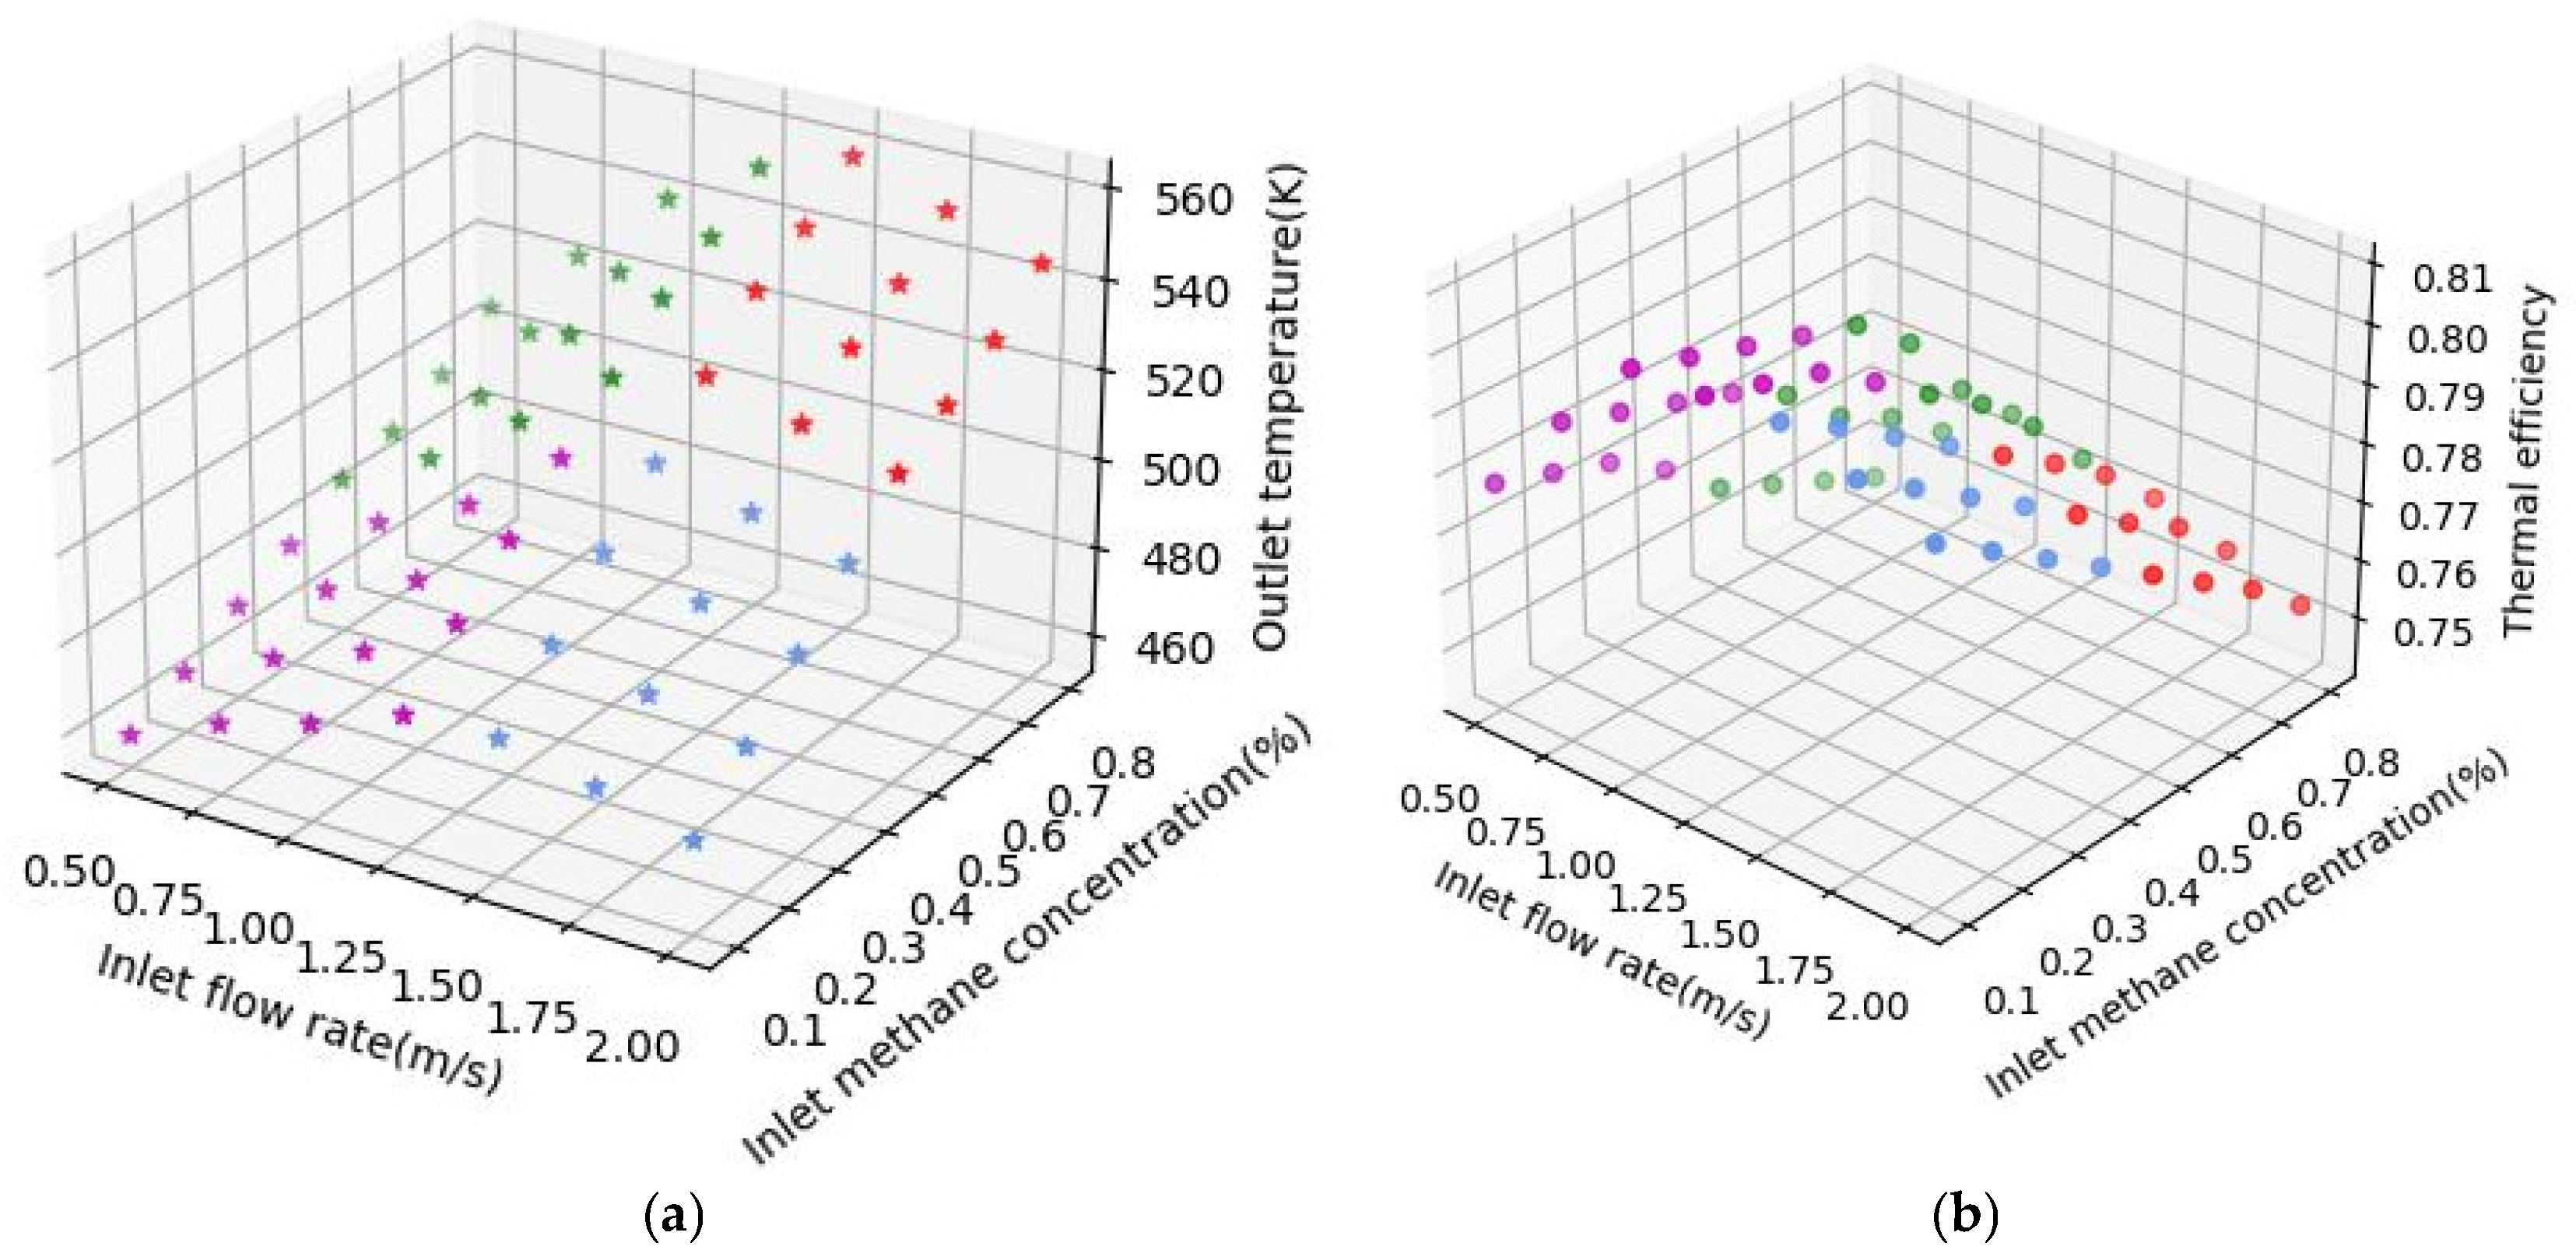
The gas processing capacity considerably affects the performance of a thermal flow-reversal reactor. When the inlet and outlet dimensions of the basalt-fiber-bundle thermal flow-reversal reactor are fixed, the treatment capacity of the reactor directly depends on the inlet flow rate of methane gas. The arrangement spacing of the fiber bundles is S 1 = 2 D 1 = 0.22   m , S 2 =   D 2 = 0.07   m , the methane concentration at the oxidizer inlet is 0.5%, and the commutation cycle is 80 s. After 20 cycles [30], the influence of the inlet gas flow rate on the methane gas temperature and thermal efficiency at the reactor outlet is shown in Figure 6. With the increase in the gas inlet flow rate, the flow rate of the low-temperature feed gas entering the reactor increases, the lengths of the inlet preheating section and outlet heat storage section inside the reactor becomes longer, and the speed of temperature rise and drop becomes slower. As increasing the inlet flow rate raises the gas volume in the oxidizer and shortens the gas residence time in the reactor, part of the high-temperature gas is blown out before it can fully exchange heat with the solid fiber bundle in the heat storage section. Thus, the outlet temperature of methane gas starts to rise, and as the heat transfer between gas and solid is strengthened, thermal efficiency first increases. As shown in Figure 6, when the inlet flow rate increases from 0.5 m/s to 1.5 m/s, the outlet temperature rises from 486.5 K to 530.5 K. When the flow rate continues to increase from 1.5 m/s, the oxidative decomposition reaction of methane in the reactor is not enough to reduce the temperature as a whole, resulting in a decrease in the outlet temperature. When the inlet flow rate rises to 2 m/s, the outlet temperature drops to 519.8 K. When the inlet flow rate rises from 1.0 m/s to 2 m/s, thermal efficiency drops from 0.795 to 0.773.

6.2. Commutation Cycle

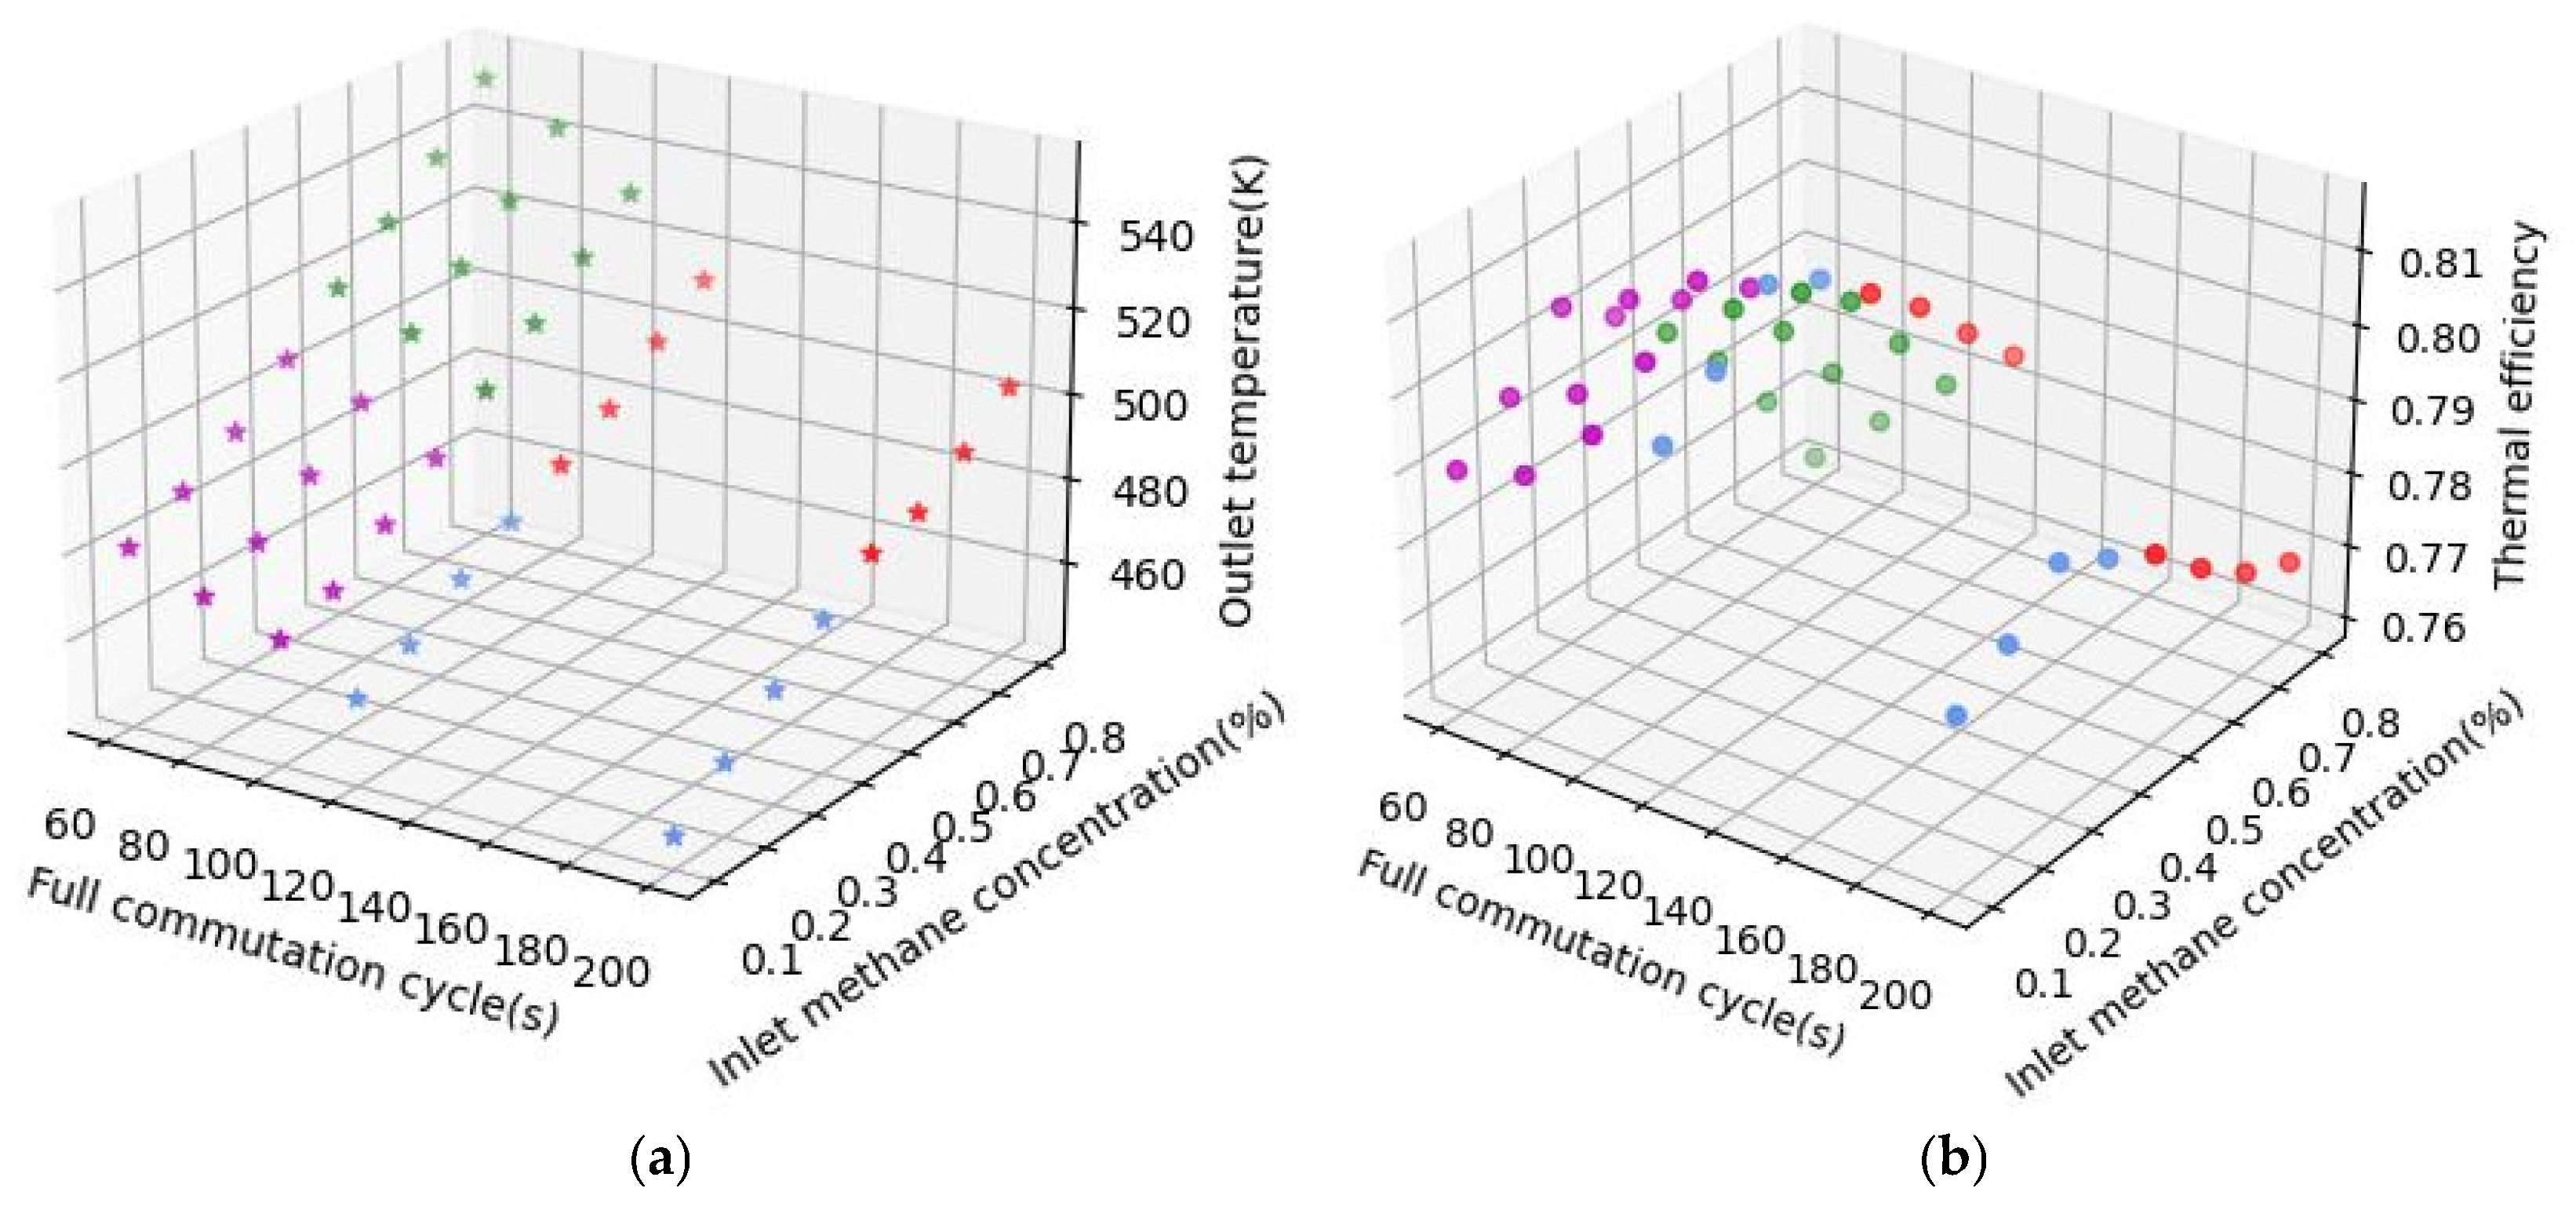
In the next test, the arrangement spacing of basalt fiber bundles is kept at S 1 = 2 D 1 = 0.222   m , S 2 = D 2 = 0.0786   m , inlet methane gas flow rate is 1 m/s, and inlet methane concentration increases from 0.5 to 0.8%; commutation cycle t c takes 60 s, 80 s, 100 s, 120 s, and 200 s, respectively, to analyze the variation in the outlet temperature and reactor thermal efficiency in Figure 7. Extending the commutation cycle, the high-temperature reaction section in the reactor gradually moves towards the outlet. For the inlet temperature section, the temperature of the inlet section drops gradually due to the extension of the commutation cycle, and the fluid requires a longer flow channel to increase the temperature to the oxidation temperature. The outlet heat storage section of the second half-cycle is in the inlet preheating section of the first half-cycle, so the low-temperature solid area of the outlet heat storage section rises, the temperature difference between fluid and solid is increased, the heat transfer rate rises, and the outlet temperature gradually decreases. When the commutation cycle is extended to a certain extent, the long commutation time causes the high-temperature platform in the reactor to be blown out of the reactor, and the overall temperature in the reactor reduces significantly, leading to a drop in the outlet temperature. As illustrated in Figure 7, when the commutation cycle increases from 60 s to 200 s, the outlet temperature decreases from 517.0 K to 482.8 K. When the commutation cycle is extended, due to the enhanced heat exchange caused by the increase in the temperature difference between the fluid and the solid, the outlet temperature gradually drops, and the heat carried by the system in the outlet gas decreases, leading to the rise in the reactor’s thermal efficiency. When the commutation cycle is extended from 60 s to 120 s, thermal efficiency is increased from 0.792 to 0.803. According to the data in Figure 7, when the commutation cycle of the studied reactor rises to 200 s, the reactor goes out, the overall temperature decreases, and thermal efficiency drops significantly.

6.3. Inlet Methane Concentration

Based on Figure 6 and Figure 7, the outlet temperature increases with the rise in inlet methane concentration. When the inlet methane concentration increases from 0.3% to 0.8%, thermal efficiency decreases. The increase in methane concentration accelerates the oxidation reaction, which will release more oxidation heat. The temperature of the fluid region in the reactor will rise, the temperature difference between the fluid and the solid will drop, and the heat transfer between fluid and solid will slow down. This means that only a small part of the heat in the reactor is used in the preheating section and the heat storage section, and most of the heat is discharged from the reactor, resulting in a reduction in thermal efficiency. When the inlet methane concentration drops to 0.2%, compared to the 0.3% inlet methane concentration, its peak temperature decreases, the width of the high-temperature platform shortens sharply, the fluid temperature in the reactor decreases, and thermal efficiency declines as a consequence.

6.4. Analysis of Relative Importance

The influence of input variables on the model output was assessed using permutation importance [49], which enables a clearer understanding of their relative contributions. As illustrated in Figure 8, the permutation importance of each input variable for both the MLR and BP models indicates that the inlet methane concentration has the most pronounced impact on the reactor’s thermal performance, followed by the inlet velocity and the flow-reversal period.

7. Discussion and Conclusions

In this work, CFD, neural network, and multiple linear regression models were employed to predict the thermal performance of a new basalt-fiber-bundle thermal flow-reversal reactor. The inlet gas concentration, inlet gas flow rate, and commutation cycle are the main input variables used in the analysis. More than 200 experimental datasets were collected to train and test the models.
A set of statistical indicators ( R 2 , R M S E and M A E ) were used for the comparison of the models. The forecast accuracy of MLR and BP was within acceptable range, and the predicted values are in good agreement with the experimental data. The BP model showed the best performance in determining the thermal efficiency of the basalt-fiber-bundle thermal flow-reversal reactor, which is directly reflected in the lowest R M S E (0.0044) and highest R 2 (0.9623), followed by the MLR. Similar results appeared in the prediction of outlet gas temperature because MLR is not proficient in dealing with nonlinear problems. The predictions based on CFD had the lowest accuracy compared to BP and MLR, as mathematical simulation models often use simplified assumptions and may overlook some factors that affect the performance of the reactor.
According to the BP model, the thermal efficiency of the reactor decreases with increasing inlet gas concentration, and shows a rise–fall trend as flow rate and flow-reversal period increase. An increase in the inlet methane concentration accelerates the oxidation rate inside the reactor, releasing more heat from the oxidation reaction. Consequently, the temperature of the fluid region increases, while the temperature difference between the fluid and solid phases decreases, which adversely affects heat transfer between gas and solid. This implies that most of the heat within the reactor is discharged, thereby reducing thermal efficiency. The case studies presented in this work indicate that thermal efficiency decreases as the methane concentration increases from 0.3% to 0.8%. With decreasing inlet methane concentration, the oxidation reaction zone gradually shifts toward the reactor center, the reaction slows down, the high-temperature reaction section shortens, and the fluid temperature inside the reactor decreases. As a result, when the methane concentration decreases, e.g., from 0.3% to 0.2%, thermal efficiency is also reduced.
With increasing inlet velocity, the width of the high-temperature plateau becomes narrower, the methane conversion decreases, and thermal efficiency exhibits a peak. When the inlet velocity reaches 1.5 m/s, the reactor extinguishes and its oxidation performance deteriorates, leading to a decrease in reactor temperature and a subsequent drop in outlet temperature. As the inlet velocity increases, both the inlet preheating section and the outlet heat storage section inside the reactor become longer, leading to a smaller temperature variation. Meanwhile, the width of the high-temperature plateau decreases and gradually shifts toward the reactor center. Although a higher inlet velocity enhances heat transfer between fluid and solid, it also shortens the residence time of methane within the reactor. As a result, part of the gas is expelled before sufficient heat exchange can occur in the heat storage section and with the solid phase. Consequently, as shown in Figure 6, the outlet temperature increases with increasing inlet velocity, whereas thermal efficiency decreases.
The flow-reversal period governs the oxidation performance of the reactor primarily by modifying the internal temperature field. When the period is too short, thermal efficiency decreases; conversely, an excessively long period causes reactor extinction. Both conditions impair oxidation performance. As shown in Figure 7, extending the period from 60 s to 120 s increases the gas–solid temperature gradient, thereby enhancing heat transfer and improving thermal efficiency. However, further extending the period to 200 s leads to reactor extinction, a drop in overall temperature, and a subsequent decline in thermal efficiency.
Based on the results shown here, the basalt-fiber-bundle thermal reversal-flow reactor can reach higher performance when the methane content is low, which means adjusting the concentration range of the exhaust gas to be treated; however, a technical solution for thermal oxidation treatment of low-concentration exhaust gas would also be needed. In the actual working process, to maintain good thermal performance, the operational parameters can be reasonably well-selected. In this case, it was appropriate to set the inlet flow rate to 0.75~1 m/s and keep the commutation cycle at 80 s~120 s. The pressure drop of gas in the reactor and methane conversion also influences the overall performance of the basalt-fiber-bundle thermal reversal-flow reactor, which is subject to future work.
There are some recommendations for further investigation to improve the models developed here. First, the CFD reactor model considers only the radial flow direction, i.e., its extension to 3D could better describe the unsteady oxidation process inside the reactor. This could also include refinement of the numerical model to better approximate real operating conditions. Second, the study revealed non-uniform temperature and flow fields within the large channels of the reactor, i.e., techniques to mitigate these temperature and velocity field inhomogeneities would be useful. Third, other deep learning approaches, such as convolutional neural networks, could be interesting for comparison to predict the performance of the reactor.
Finally, this study adequately demonstrates that applying deep learning techniques to energy devices could be an important direction for future development, which could include combining traditional numerical models and machine learning, e.g., using simulation model outputs as input into machine learning models to predict the performance of energy systems more accurately, thereby improving computational precision and providing deeper insight into device behavior.

Author Contributions

Conceptualization, R.K. and B.D.; methodology, B.D. and Y.L.; software, B.D. and Y.L.; validation, B.D. and R.K.; formal analysis, B.D.; investigation, B.D.; resources, B.D. and R.K.; data curation, B.D.; writing—original draft preparation, B.D.; writing—review and editing, P.D.L.; visualization, B.D.; supervision, R.K.; project administration, J.W.; funding acquisition, R.K. and B.D. All authors have read and agreed to the published version of the manuscript.

Funding

This research was funded by the National Natural Science Foundation of China, grant number 52166012 and the APC was funded by this National Natural Science Foundation of China, grant number 52166012.

Data Availability Statement

The raw data supporting the conclusions of this article will be made available by the authors on request.

Acknowledgments

The work is funded by the National Natural Science Foundation of China (Grant number 52166012), Hainan Province Science and Technology Special Fund (grant number ZDYF2020207) and the Research Start-up Fund Project of Hainan University (Grant number KYQD(ZR)21092). The support of Aalto University is also acknowledged. All individuals included in this section have consented to the acknowledgement.

Conflicts of Interest

The authors declare that they have no known competing financial interests or personal relationships that could have appeared to influence the work reported in this paper. The authors declare no conflict of interest.

Nomenclature

Apre-exponential factor
BPback propagation
CFDcomputational fluid dynamics
dfiber bundle diameter (mm)
c a specific heat of air ( J / ( k g · K ) )
c b specific heat of basalt bundle ( J / ( k g · K ) )
D 1 short axis of elliptical fiber bundles (mm)
D 2 long axis of elliptical fiber bundles (mm)
Eactivation energy
h v heat transfer coefficient between gas and solid
H i g h v a l u e +1
L o w v a l u e −1
m i n reactor inlet temperature (K)
m o u t reactor outlet temperature (K)
M A E mean absolute error
M L R multiple linear regression
Runiversal gas constant
R 2 coefficient of determination
R M S E root mean square error
s 1 fiber bundle arrangement horizontal spacing (mm)
s 2 fiber bundle arrangement vertical spacing (mm)
t c full commutation cycle (s)
Tthe average temperature of the high temperature section in the reactor (K)
T b temperature of the basalt fiber (K)
T g temperature of gas (K)
T i n gas inlet temperature (K)
T o u t gas outlet temperature (K)
u g flow rate of gas
V b volume of basalt fiber
V g volume of gas
w ¯ methane consumption rate
X A actual value
X p predicted value
Y i mass fraction of gas component i
Greek letters
ρ b density of the basalt fiber
ρ g density of gas
λ b thermal conductivity of the basalt fiber
ηthermal efficiency

References

  1. Forster, P.; Ramaswamy, V.; Artaxo, P.; Berntsen, T.; Betts, R.; Fahey, D.W.; Haywood, J.; Lean, J.; Lowe, D.C.; Myhre, G.; et al. Changes in Atmospheric Constituents and in Radiative Forcing. In Climate Change 2007: The Physical Science Basis. Contribution of Working Group I to the 4th Assessment Report of the Intergovernmental Panel on Climate Change; Cambridge University Press: Cambridge, UK; New York, NY, USA, 2007. [Google Scholar]
  2. Su, S.; Beath, A.; Guo, H.; Mallett, C. An assessment of mine methane mitigation and utilization technologies. Prog. Energy Combust. Sci. 2005, 31, 123–170. [Google Scholar] [CrossRef]
  3. Su, S.; Agnew, J. Catalytic combustion of coal mine ventilation air methane. Fuel 2006, 85, 1201–1210. [Google Scholar] [CrossRef]
  4. Cheng, Y.P.; Wang, L.; Zhang, X.L. Environmental impact of coal mine methane emissions and responding strategies in China. Int. J. Greenh. Gas Control 2011, 5, 157–166. [Google Scholar] [CrossRef]
  5. Karakurt, I.; Aydin, G.; Aydiner, K. Mine ventilation air methane as a sustainable energy source. Renew. Sustain. Energy Rev. 2011, 15, 1042–1049. [Google Scholar] [CrossRef]
  6. Gosiewski, K.; Pawlaczyk, A. Catalytic or thermal reversed flow combustion of coal mine ventilation air methane: What is better choice and when? Chem. Eng. J. 2014, 238, 78–85. [Google Scholar] [CrossRef]
  7. Gosiewski, K.; Pawlazyk, A.; Jaschik, M. Energy recovery from ventilation air methane via reverse-flow reactor. Energy 2015, 92, 13–23. [Google Scholar] [CrossRef]
  8. Zhang, B.; Liu, Y.; Liu, R.; Meng, J.; Mao, M. Experimental investigation of flow resistance in a coal mine ventilation air methane preheated catalytic oxidation reactor. J. Chem. 2015, 2015, 375789. [Google Scholar] [CrossRef]
  9. Yuan, F.; Wang, H.; Zhou, P.; Xu, A.; He, D. Heat transfer performances of honeycomb regenerator with square or hexagon cell opening. Appl. Therm. Eng. 2017, 125, 790–798. [Google Scholar] [CrossRef]
  10. Li, Q.; Bai, F.; Yang, B.; Wang, Y.; Xu, L.; Chang, Z.; Wang, Z.; EI Hefni, B.; Yang, Z.; Kubo, S.; et al. Dynamic simulatioons of a honeycomb ceramic thermal energy storage in a solar thermal power plant using air as the heat transfer fluid. Appl. Therm. Eng. 2018, 129, 636–645. [Google Scholar] [CrossRef]
  11. Huang, J.S.; Chiang, M.S. Effects of microstructure, specimen and loading geometries on KIC of brittle honeycombs. Eng. Fract. Mech. 1996, 54, 813–821. [Google Scholar] [CrossRef]
  12. Kakroudi, M.G.; Vafa, N.P.; Asl, M.S.; Shokouhimehr, M. Effects of SiC content on thermal shock behavior and elastic modulus of cordierite-mullite composites. Ceram. Int. 2020, 46, 23780–23784. [Google Scholar] [CrossRef]
  13. Dhand, V.; Mittal, G.; Rhee, K.Y.; Park, S.-J.; Hui, D. A short review on basalt fiber reinforced polymer composites. Compos. Part B-Eng. 2015, 73, 166–180. [Google Scholar] [CrossRef]
  14. Liu, J.; Chang, Z.; Wang, L. Exploration of Basalt Glasses as High-Temperature Sensible Heat Storage Material. ACS Omega 2020, 5, 19236–19246. [Google Scholar] [CrossRef] [PubMed]
  15. Liu, J.; Yang, J.; Chen, M.; Lei, L.; Wu, Z. Effects of SiO2, Al2O3 on heat resistance of basalt fiber. Thermochim. Acta 2018, 660, 56–60. [Google Scholar] [CrossRef]
  16. Slepterev, A.A.; Tsyrul’nikov, P.G.; Sal’nikov, V.S.; Zagoruiko, A.N. A study of the Homogeneous Oxidation of Low-Concentration Methane-containing Gases at High Temperature. Russ. J. Appl. Chem. 2012, 85, 1570–1576. [Google Scholar] [CrossRef]
  17. Glarborg, P.; Lilleheie, N.I.; Byggstoyl, S.; Magnussen, B.F.; Kilpinen, P.; Hupa, M. A reduced mechanism for nitrogen chemistry in methane combustion. Symp. Combust. 1992, 24, 889–898. [Google Scholar] [CrossRef]
  18. Wang, Y.; Liu, Y.; Qi, C. Homogeneous Combustion of Fuel Ultra-Lean Methane-Air Mixtures: Experimental Study and Simplified Reaction Mechanism. Energy Fuels 2011, 25, 3437–3445. [Google Scholar] [CrossRef]
  19. Gosiewski, K.; Matros, Y.S.; Warmuzinski, K. Homogenerous vs. catalytic combustion of lean methane-air mixtures in reverse-flow reactors. Chem. Eng. Sci. 2008, 63, 5010–5019. [Google Scholar] [CrossRef]
  20. Litto, R.; Hayes, R.E.; Sapoundjiev, H. Optimization of a flow reversal reactor for the catalytic combustion of lean methane mixture. Catal. Today 2006, 117, 536–542. [Google Scholar] [CrossRef]
  21. Xie, M.Z.; Shi, J.R.; Deng, Y.B.; Liu, H.; Zhou, L.; Xu, Y.-N. Experimental and numerical investigation on performance of a porous medium burner with reciprocating flow. Fuel 2009, 88, 206–213. [Google Scholar] [CrossRef]
  22. Gosiewski, K.; Pawlaczyk-Kure, K.A. Aerodynamic CFD simulations of experimental and industrial thermal flow reversal reactors. Chem. Eng. J. 2019, 373, 1367–1379. [Google Scholar] [CrossRef]
  23. Zhang, G.; Li, Q.; Liu, X.; Lin, B.; Li, D. Investigations on the mitigation of ventilation air methane and energy recovery in site trial thermal flow-reversal reactor. Chem. Eng. Process. Process Intensif. 2022, 170, 108703. [Google Scholar] [CrossRef]
  24. Lan, B.; Lia, Y.-R. Numerical study on thermal oxidation of lean coal mine methane in a thermal flow-reversal reactor. Chem. Eng. J. 2018, 351, 922–929. [Google Scholar] [CrossRef]
  25. You, Y.; Huang, H.; Shao, G. A three-dimensional numerical model of unsteady flow and heat transfer in ceramic honeycomb regenerator. Appl. Therm. Eng. 2016, 108, 1243–1250. [Google Scholar] [CrossRef]
  26. Gosiewski, K.; Pawlaczyk, A.; Warmuzinski, K.; Jaschik, M. A study of thermal combustion of lean methane-air mixtures: Simplified reaction mechanism and kinetic equations. Chem. Eng. J. 2009, 154, 9–16. [Google Scholar] [CrossRef]
  27. Fierro, M.; Arriagada, A.; Araneda, H.; Rosas, J.; Subiabre, G. Experimental investigation of steam and carbon dioxide influence on methane filtration combustion in a reversal flow porous media reactor. Int. J. Hydrogen Energy 2024, 82, 134–142. [Google Scholar] [CrossRef]
  28. Mao, M.; Liu, Y.; Shi, J.; Li, C.; Zhang, Q. Experimental study on control of flame inclination in a thermal flow reversal reactor with extra lean premixed methane/air intake. Fuel 2022, 318, 123722. [Google Scholar] [CrossRef]
  29. Kuang, R.; Liu, Y.; An, T.; Shen, Y. Numerical analysis of oxidation performance of basalt fiber bundle thermal flow-reversal reactor. Appl. Therm. Eng. 2022, 215, 118886. [Google Scholar] [CrossRef]
  30. Li, Q.; Chen, G.; Zhu, Y.; Li, X.; Yao, Y. Resonance response in the catalytic combustion of methane and propane binary mixture in reverse-flow reactor. Chem. Eng. J. 2018, 345, 375–388. [Google Scholar] [CrossRef]
  31. Elsheikh, A.H.; Sharshir, S.W.; Elaziz, M.A.; Kabeel, A.E.; Wang, G.L.; Zhang, H. Modeling of solar energy systems using artificial neural network: A comprehensive review. Sol. Energy 2019, 180, 622–639. [Google Scholar] [CrossRef]
  32. Bellos, E.; Tzivanidis, C. Development of an analytical model for the daily performance of solar thermal systems with experimental validation. Sustain. Energy Technol. Assess. 2018, 28, 22–29. [Google Scholar] [CrossRef]
  33. Ghritlahre, H.K.; Prasad, R.K. Application of ANN technique to predict the performance of solar collector systems—A Review. Renew. Sustain. Energy Rev. 2018, 84, 75–88. [Google Scholar] [CrossRef]
  34. Amelio, M.; Morrone, P. Numerical evaluation of the energetic performances of structured and random packed beds in regenerative thermal oxidizers. Appl. Therm. Eng. 2007, 27, 762–770. [Google Scholar] [CrossRef]
  35. Filipovic, P.; Dovic, D.; Ranilovic, B.; Horvat, I. Numerical and experimental approach for evaluation of thermal performance of a polymer solar collector. Renew. Sustain. Energy Rev. 2019, 112, 127–139. [Google Scholar] [CrossRef]
  36. Tagliafico, L.A.; Scarpa, F.; De Rosa, M. Dynamic thermal models and CFD analysis for flat-plate thermal solar collectors-A review. Renew. Sustain. Energy Rev. 2014, 30, 526–537. [Google Scholar] [CrossRef]
  37. Alfaro-Ayala, J.A.; Martinez-Rodriguez, G.; Picon-Nunez, M.; Uribe-Ramirez, A.R.; Gallegos-Munoz, A. Numerical study of a low temperature water-in-glass evacuated tube solar collector. Energy Convers. Manag. 2015, 94, 472–481. [Google Scholar] [CrossRef]
  38. Gosiewski, K. Effective approach to cyclic steady state in the catalytic reverse-flow combustion of methane. Chem. Eng. Sci 2004, 59, 4095–4101. [Google Scholar] [CrossRef]
  39. Sahin, M.; Kaya, Y.; Uyar, M. Comparison of ANN and MLR models for estimating solar radiation in Turkey using NOAA/AVHRR data. Adv. Space Res. 2013, 51, 891–904. [Google Scholar] [CrossRef]
  40. Kalogirou Soteris, A. Application of artificial neural-networks for energy systems. Appl. Energy 2000, 67, 17–35. [Google Scholar] [CrossRef]
  41. Wang, Z.; Wang, F.; Su, S. Solar irradiance short-term prediction model based on BP neural network. Energy Procedia 2011, 12, 488–494. [Google Scholar] [CrossRef]
  42. Liu, L.; Liu, D.; Sun, Q.; Li, H.; Wennersten, R. Forecasting power output of photovoltaic system using a BP network method. Energy Procedia 2017, 142, 780–786. [Google Scholar] [CrossRef]
  43. Sadeghi, G.; Nazari, S.; Ameri, M.; Shama, F. Energy and exergy evaluation of the evacuated tube solar collector using Cu2O water nanofluid utilizing ANN methods. Sustain. Energy Technol. Assess. 2020, 37, 100578. [Google Scholar] [CrossRef]
  44. Ghritlahre, H.K.; Prasad, R.K. Investigation of thermal performance of unidirectional flow porous bed solar air heater using MLP, GRNN, and RBF models of ANN technique. Therm. Sci. Eng. Prog. 2018, 6, 226–235. [Google Scholar] [CrossRef]
  45. Sozem, A.; Menlikm, T.; Unvar, S. Determination of efficiency of flat-plate solar collectors using neural network approach. Expert Syst. Appl. 2008, 35, 1533–1539. [Google Scholar] [CrossRef]
  46. Hu, Q.; Zhang, R.; Zhou, Y. Transfer learning for short-term wind speed prediction with deep neural networks. Renew. Energy 2016, 85, 83–95. [Google Scholar] [CrossRef]
  47. Qureshi, A.S.; Khan, A.; Zameer, A.; Usman, A. Wind power prediction using deep neural network based meta regression and transfer learning. Appl. Soft Comput. 2017, 58, 742–755. [Google Scholar] [CrossRef]
  48. Khatib, T.; Mohamd, A.; Sopian, K. A review of solar energy modeling techniques. Renew. Sustain. Energy Rev. 2012, 16, 2864–2869. [Google Scholar] [CrossRef]
  49. Alvarez, M.E.; Hernandez, J.A.; Bourouis, M. Modelling the performance parameters of a horizontal falling film absorber with aqueous (lithium, potassium, sodium) nitrate solution using artificial neural networks. Energy 2016, 102, 313–323. [Google Scholar] [CrossRef]
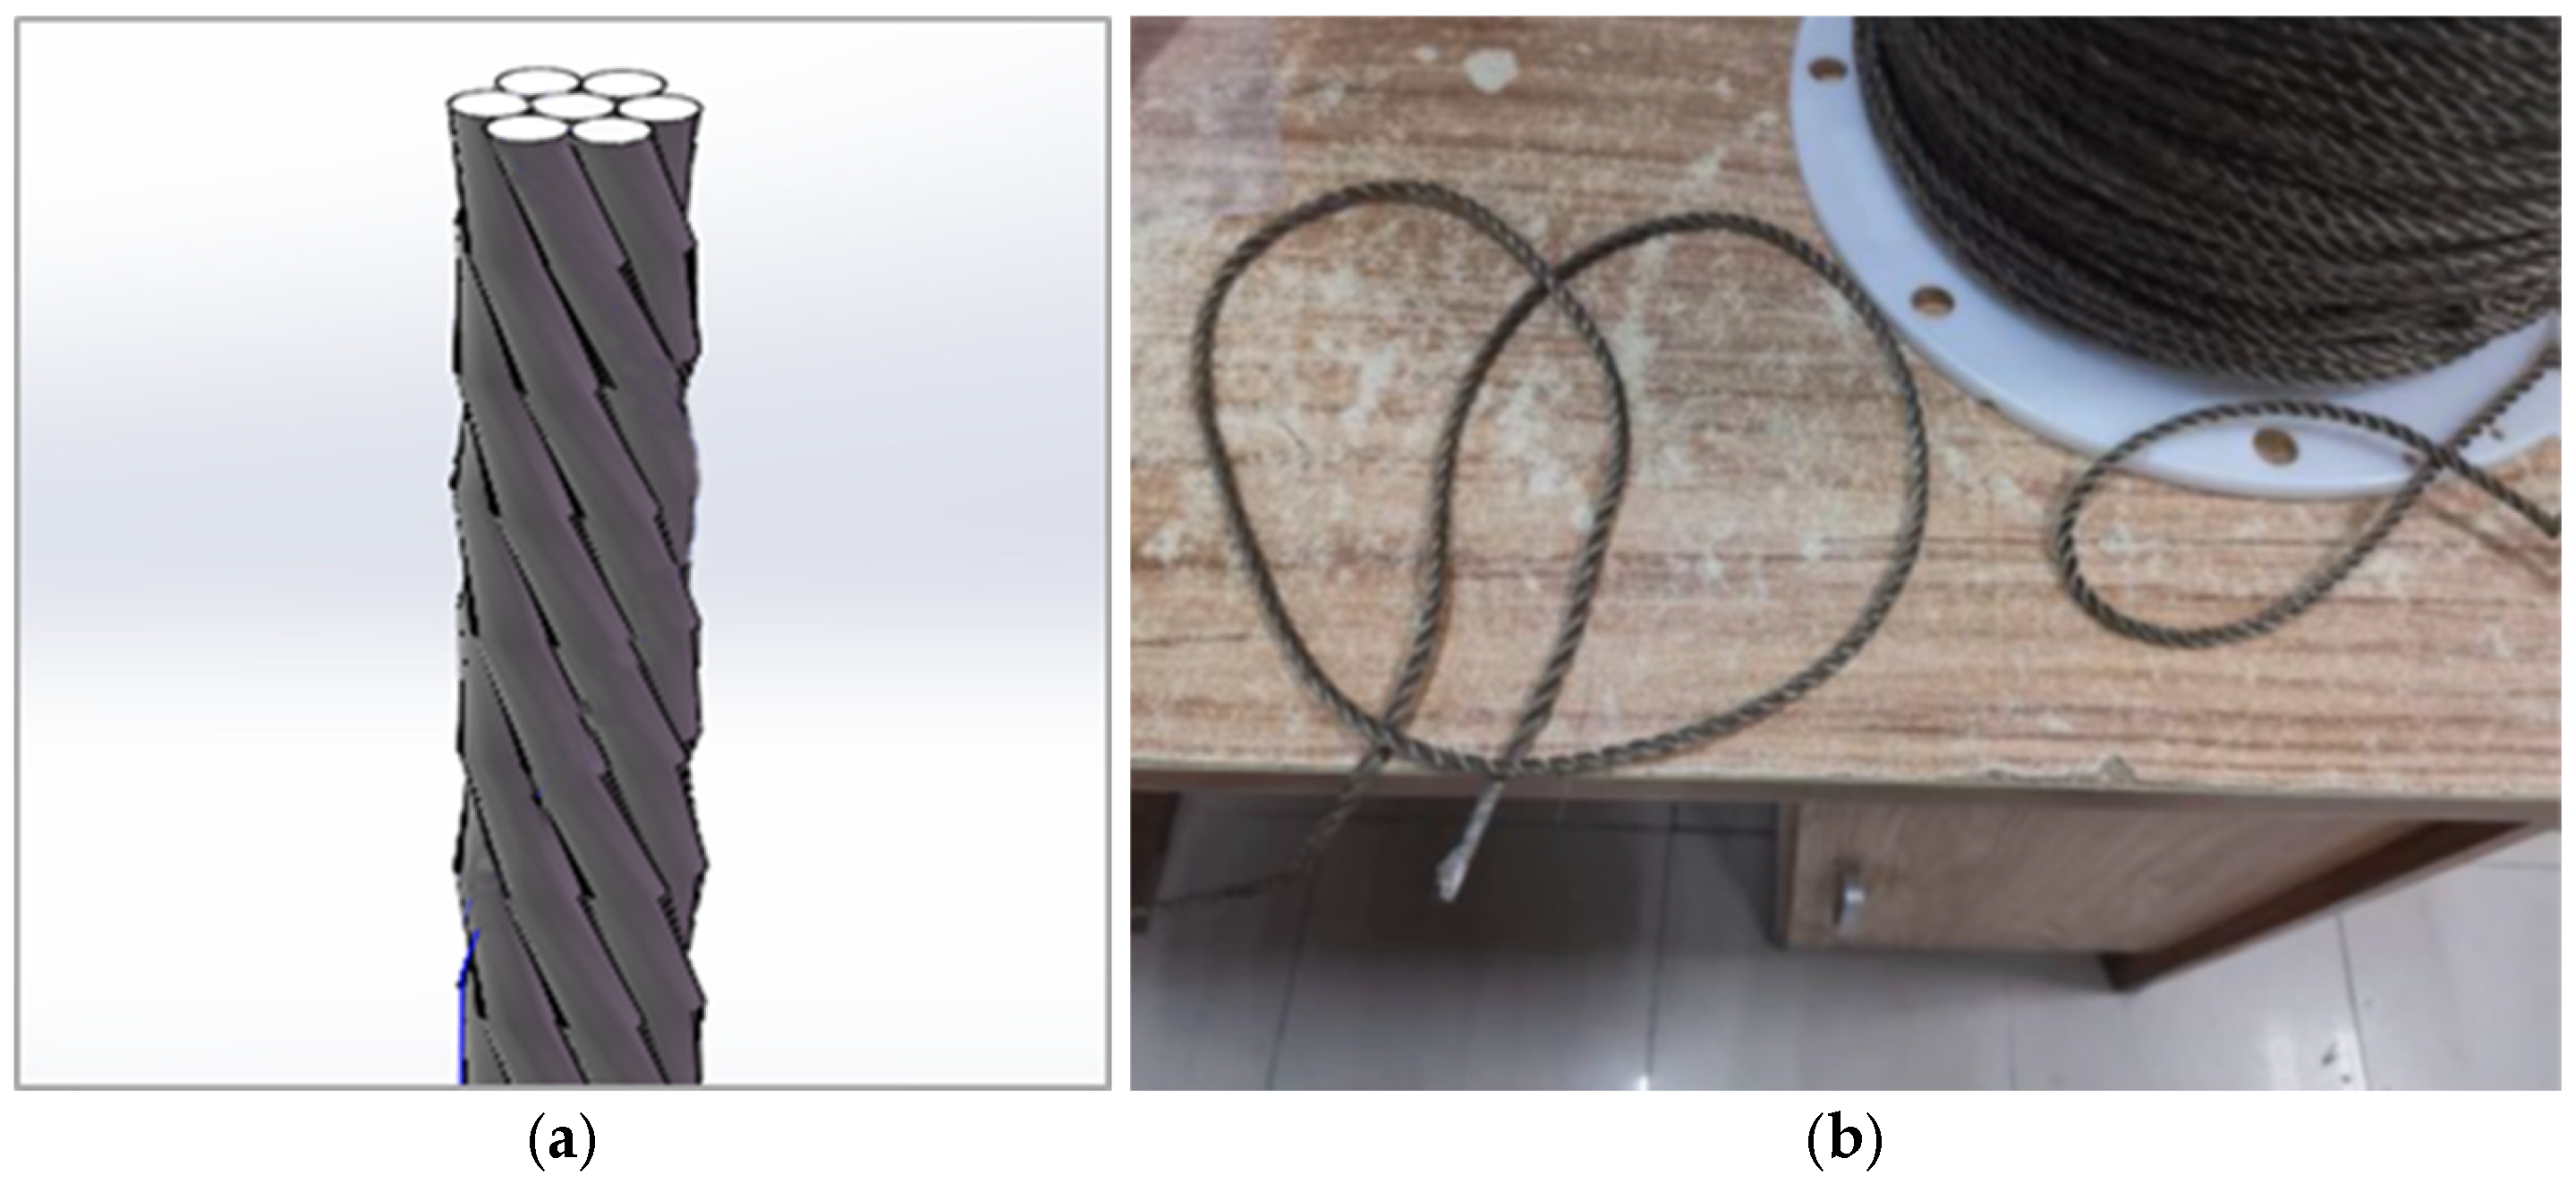
Figure 1. Basalt-fiber-bundle model and physical structure. (a) Three-dimensional model of a basalt fiber bundle; (b) basalt fiber bundle.
Energies 18 05730 g001
Figure 2. Basalt-fiber-bundle flow-reversal reactor device. (a) The fiber bundle group; (b) The appearance of the reactor device.
Energies 18 05730 g002
Figure 3. Structure of basalt-fiber-bundle thermal flow-reversal reactor. (a) Schematic diagram of micro flow channel inside fiber bundle, (b) top view of reactor internal structure, (c) schematic diagram of arrangement of multiple fiber bundle groups.
Energies 18 05730 g003
Figure 4. Result on outlet temperature. (a) Comparison of experimental and modeled outlet temperature by CFD, MLR, and BP (K); (b) individual error of modeled outlet temperatures by CFD, MLR, and BP (K).
Energies 18 05730 g004
Figure 5. Results on thermal efficiency. (a) Comparison between experimental and modeled thermal efficiency by CFD, MLR, and BP; (b) individual error of modeled thermal efficiency of CFD, MLR, and BP.
Energies 18 05730 g005
Figure 6. Outlet temperature and thermal efficiency vs. inlet flow rate and inlet methane concentration (The star symbol in (a) illustrate the variation trend of the gas outlet temperature corresponding to the different ranges of inlet methane concentrations and inlet flow rates, primarily reflecting the influence of these two parameters on the reactor’s thermal performance; red points: inlet flow rate > 1.25 m/s, inlet methane concentration > 0.4%; blue points: inlet flow rate > 1/25 m/s, inlet methane concentration ≤ 0.4%; green points: inlet flow rate ≤ 1.25 m/s, inlet methane concentration > 0.4%; magenta points: inlet flow rate ≤ 1.25 m/s, inlet methane concentration ≤ 0.4%). Variation in (a) outlet temperature and (b) in thermal efficiency by inlet flow rate and inlet methane concentration.
Energies 18 05730 g006
Figure 7. Outlet temperature and thermal efficiency vs. commutation cycle and inlet methane concentration (The star symbol in (a) illustrates the variation trend of the gas outlet temperature corresponding to the different ranges of inlet methane concentrations and inlet flow rates, primarily reflecting the influence of these two parameters on the reactor’s thermal performance; red points: commutation cycle > 100 s, inlet methane concentration > 0.4%; blue points: commutation cycle > 100 s, inlet methane concentration ≤ 0.4%; green points: commutation cycle ≤ 100 s, inlet methane concentration > 0.4%; magenta points: commutation cycle ≤ 100 s, inlet methane concentration ≤ 0.4%). Variation in (a) outlet temperature and (b) thermal efficiency by full commutation cycle and inlet methane concentration.
Energies 18 05730 g007
Figure 8. Permutation importance of input variables in MLR and BP models.
Energies 18 05730 g008
Table 1. Accuracy of different models.
ModelR2 RMSE MAE
Gas outlet temperatureThermal efficiencyGas outlet temperatureThermal efficiencyGas outlet temperatureThermal efficiency
CFD0.70370.681916.70760.012015.77390.0106
MLR0.89430.86479.84880.00867.86790.0070
BP0.97420.96654.86490.00433.75670.0033
Disclaimer/Publisher’s Note: The statements, opinions and data contained in all publications are solely those of the individual author(s) and contributor(s) and not of MDPI and/or the editor(s). MDPI and/or the editor(s) disclaim responsibility for any injury to people or property resulting from any ideas, methods, instructions or products referred to in the content.