1. Introduction
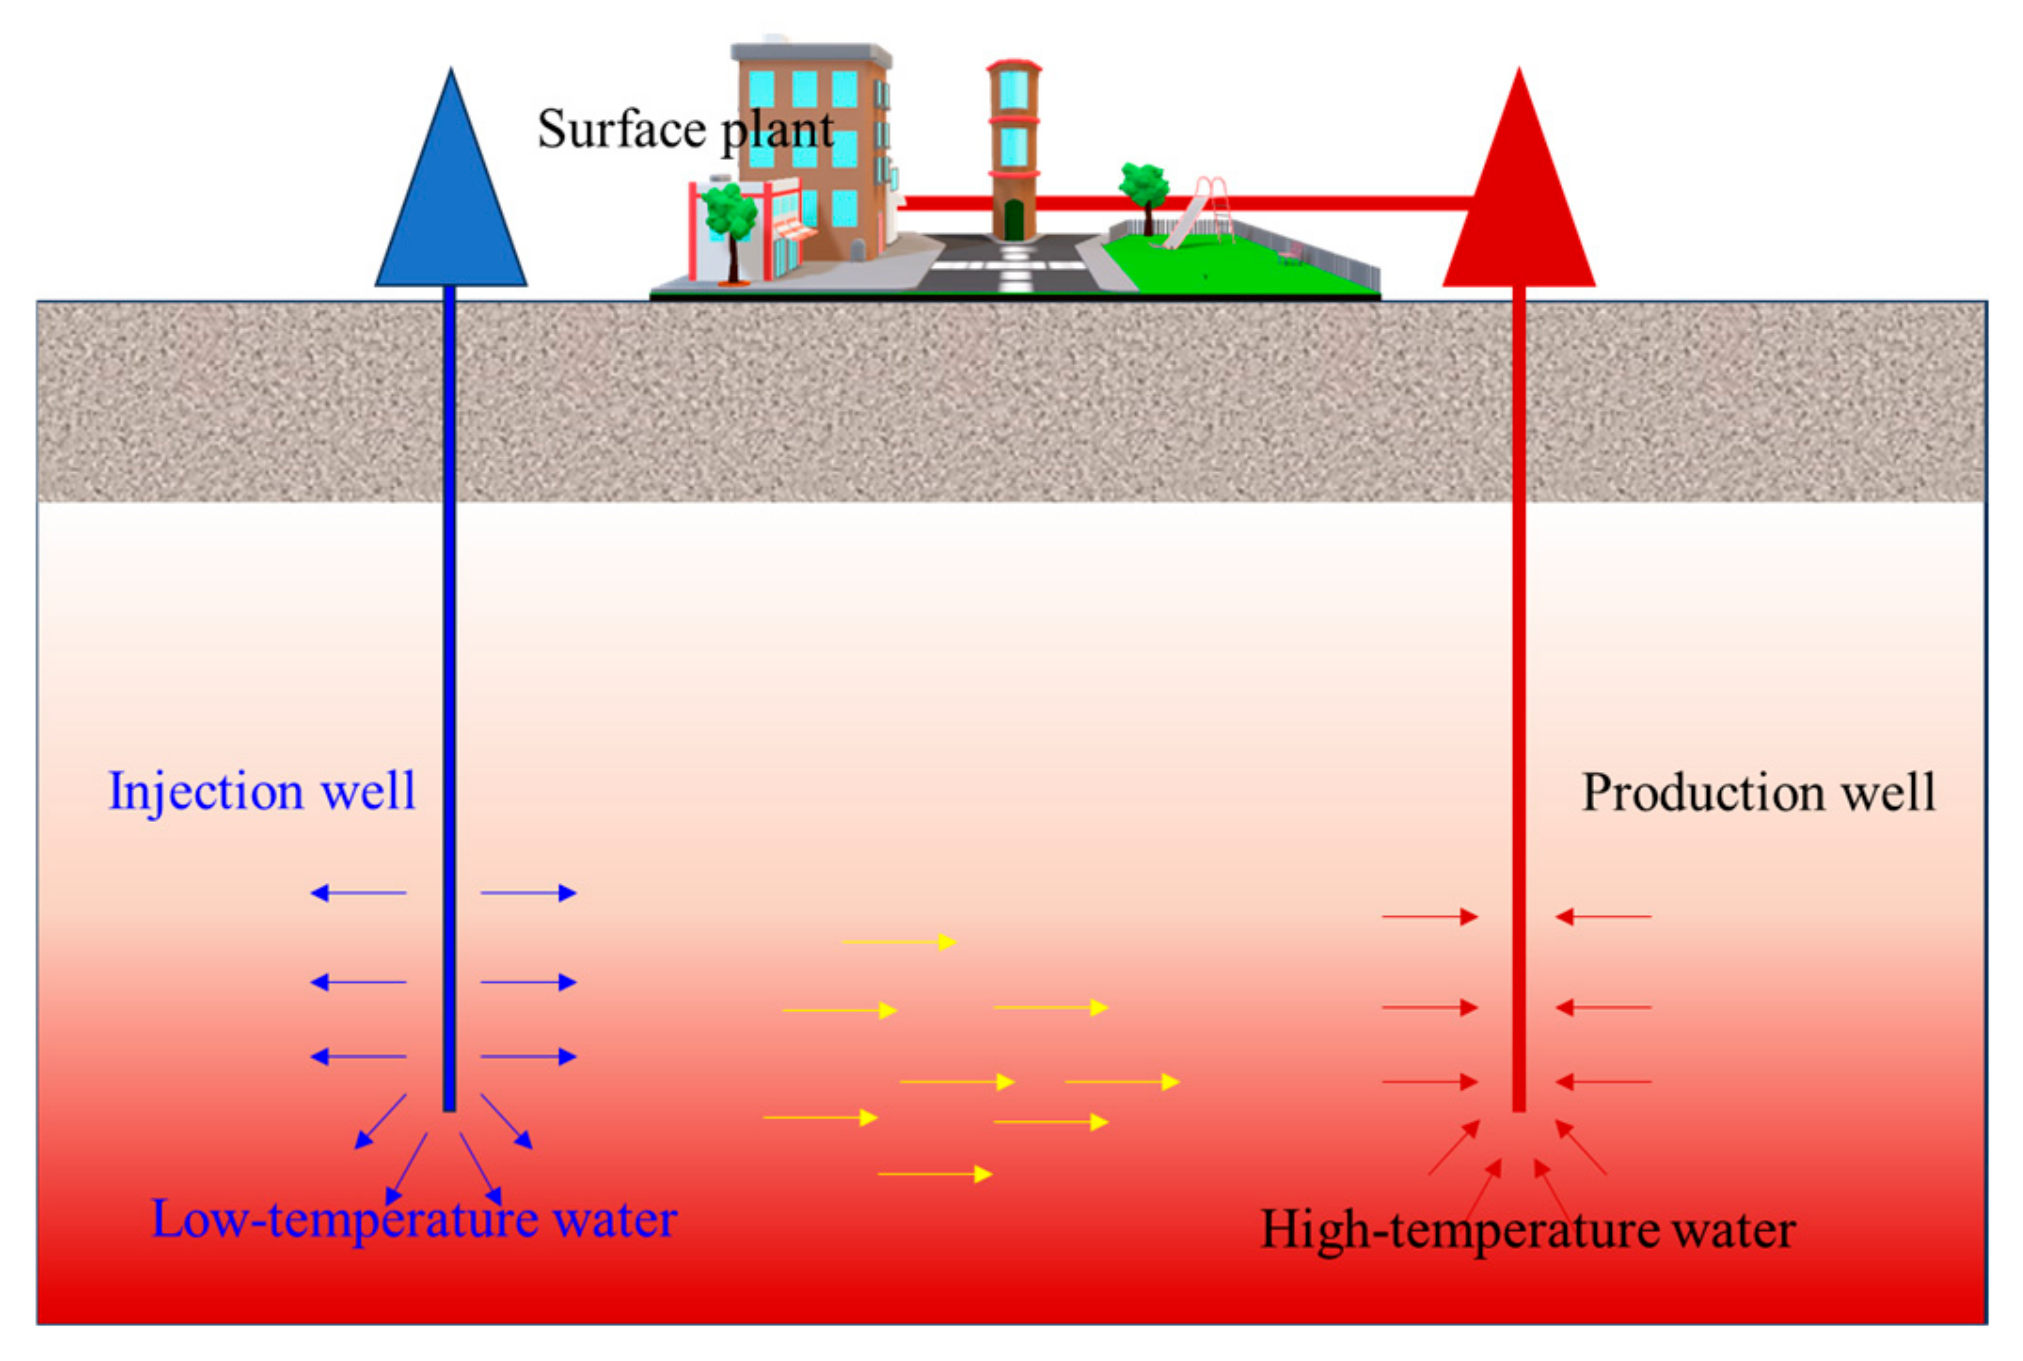
Under the context of the global energy transition and “dual carbon” goals, geothermal energy, as a clean, stable, and sustainable renewable energy source, occupies a core position in the optimization of energy structures [
1,
2,
3,
4,
5,
6,
7,
8]. Key indicators, such as heat extraction efficiency (including instantaneous heat production power, cumulative heat extraction, and thermal depletion cycle), in geothermal system development directly determine the economic feasibility of projects and energy benefits. Injection–production pressure difference (driving fluid seepage), well spacing (affecting the spatial scope of heat exchange), and injection temperature (determining the temperature difference for heat exchange) are the core controllable parameters influencing heat extraction efficiency [
9,
10,
11], and their action mechanisms require quantification [
12]. Clarifying the correlation mechanism between operational parameters and heat extraction efficiency under the “thermo–hydro–mechanical (THM) multi-physics coupling” of geothermal reservoirs, improving the theoretical system of numerical simulation for geothermal development, and providing a quantitative basis for well pattern design (well spacing) and injection–production process optimization (pressure difference, injection temperature) in medium-deep geothermal development are of great significance for reducing development costs and extending the effective production cycle of reservoirs.
In this study, ‘medium-deep geothermal reservoirs’ refers to hydrothermal or engineered systems typically located at depths between 1500 and 3000 m. While the fundamental thermo–hydro–mechanical (THM) coupling principles explored here are highly relevant to enhanced geothermal systems (EGS), the specific model and parameters in this work are primarily configured for the analysis of a permeable medium-deep reservoir, and thus the terms are related in context but not used interchangeably. During geothermal extraction, the working fluid flows within high-temperature rock masses, and this flow process is subject to the coupling effects of the temperature field, seepage field, and stress field (thermal–hydrologic–mechanical, THM). The theory of THM multi-physics coupling serves as the core foundation for the numerical simulation of geothermal reservoirs. Early scholars conducted extensive pioneering work on the establishment and simplification of coupling equations for saturated/unsaturated and homogeneous/heterogeneous media. The origin of THM coupling theory can be traced back to the porous elasticity theory proposed by Biot [
13] in the 1950s, which, for the first time, quantified the correlation between fluid flow and solid skeleton deformation in porous media, laying a mechanical foundation for the subsequent development of coupling models. In 1984, Noorishad et al. [
14], based on Biot’s consolidation theory, specifically derived the THM coupling formulas and finite element discretization format for fractured rock masses, breaking through the limitations of homogeneous media. Furthermore, with the principles of consolidation and thermoelasticity as the core, they established the basic coupling equations for saturated porous media. Although water–rock heat exchange and thermally induced changes in mechanical parameters were not incorporated, this work still provided important references for simplified coupling models. For the completeness of the model, Hart et al. [
15] constructed a fully coupled mechanical–thermal–hydraulic (MTH) model for saturated porous media under dynamic loading, systematically proposing fluid mass balance, mixture momentum balance, and energy balance equations, and clarifying the mathematical relationships for the collaborative evolution between fields. Mctigue [
16], based on mixture theory, proposed the fully coupled theory of saturated porous thermoelastic media under the assumption of small temperature fluctuations, providing a theoretical basis for coupling simulations in medium–low-temperature scenarios. H.H. Vaziri [
17] established a THM coupling model for the oil sand heating process and developed a specialized calculation program; he further constructed a coupling model of non-isothermal, single-phase seepage and nonlinear elastic deformation, which was solved using the finite element method, providing a reference for the simulation of mechanical responses during long-term extraction of geothermal reservoirs. In terms of the refinement of medium characterization, international research mainly focuses on two mainstream approaches: the equivalent continuous medium and the dual-medium approach. Rutqvist [
18] adopted the porous homogeneous medium method to derive the governing equations of four software programs in the field of nuclear waste disposal, providing theoretical support for the coupled simulation of fractured rock masses.
The regulatory mechanisms of operational parameters, such as injection–production pressure difference, well spacing, and injection temperature, are central to the economic viability of geothermal development. Regarding well spacing optimization, 3D coupling simulations [
19,
20,
21] have shown that a well spacing of 800 m can balance the production temperature, reservoir lifespan, and total heat production. Studies [
22,
23,
24] have confirmed that within the spacing range of 200–500 m, every 100 m increase in spacing can raise the production well temperature by 8–12 °C over 30 years, and this design must be coordinated with fracture aperture. Li et al. [
25] designed a geothermal development case based on the embedded discrete fracture model (EDFM), quantified the influence of well spacing on the spatiotemporal evolution of pressure and temperature fields, and further verified the importance of spacing optimization. For the impact of injection–production pressure difference, research focusing on the “pressure-seepage-heat efficiency” dynamic balance [
26,
27,
28] has indicated that pressure difference affects heat extraction efficiency by regulating the range of fracture stimulation zones, and it exhibits a positive correlation with the improvement of permeability. Zhang et al. [
29] proposed a mesoscopic THM damage model, analyzed the mechanism of thermal stress in hot dry rock (HDR) fracturing, and pointed out that an excessively high pressure difference accelerates the expansion of cold zones and shortens the thermal depletion cycle. It is a widely accepted consensus that the temperature difference between the injected fluid and the reservoir determines the driving force for heat exchange. Relevant simulations [
30,
31,
32,
33] have shown that heat exchange efficiency is relatively high when the fluid velocity is 0.7 m/s and the flow rate is 20–26 m
3/h; however, these studies lack sensitivity analysis of small temperature differences in the normal temperature range of 15–35 °C. Li et al. [
34] established a multi-field coupling model, analyzed the interaction of thermo–chemical effects under fracture width and stress gradient, and provided insights for parameter synergistic optimization, but did not incorporate the regulatory mechanism of injection temperature. Multi-parameter synergistic research remains a gap: Existing studies mainly focus on single-factor analysis, exploring the correlation between individual parameters and field evolution. A synergistic optimization framework linking “injection–production pressure difference–well spacing-injection temperature” has not yet been established, making it difficult to directly guide engineering practice.
To address the issues of insufficient sensitivity analysis of normal-temperature injection parameters, unclear long-term effects of medium-short well spacing, lack of a multi-parameter synergistic framework, and insufficient analysis of key locations, this study takes medium-deep geothermal reservoirs as the research object, establishes a fully coupled THM model, and conducts single-factor and long-term simulations. It quantifies the influences of injection–production pressure difference, well spacing, and injection temperature on heat extraction efficiency, focuses on capturing the temperature–pressure evolution at the midpoint of injection–production wells and production wells, reveals the coupling mechanism, proposes directions for parameter optimization, and provides theoretical support for medium-deep geothermal development. While the single-factor simulations aim to isolate and quantify the effects of individual parameters, the coupling mechanisms revealed in this study lay the foundation for future multi-parameter synergistic design.
4. Simulation Results
4.1. Evolution of Reservoir Temperature and Pore Pressure
Based on the simulation scheme designed in
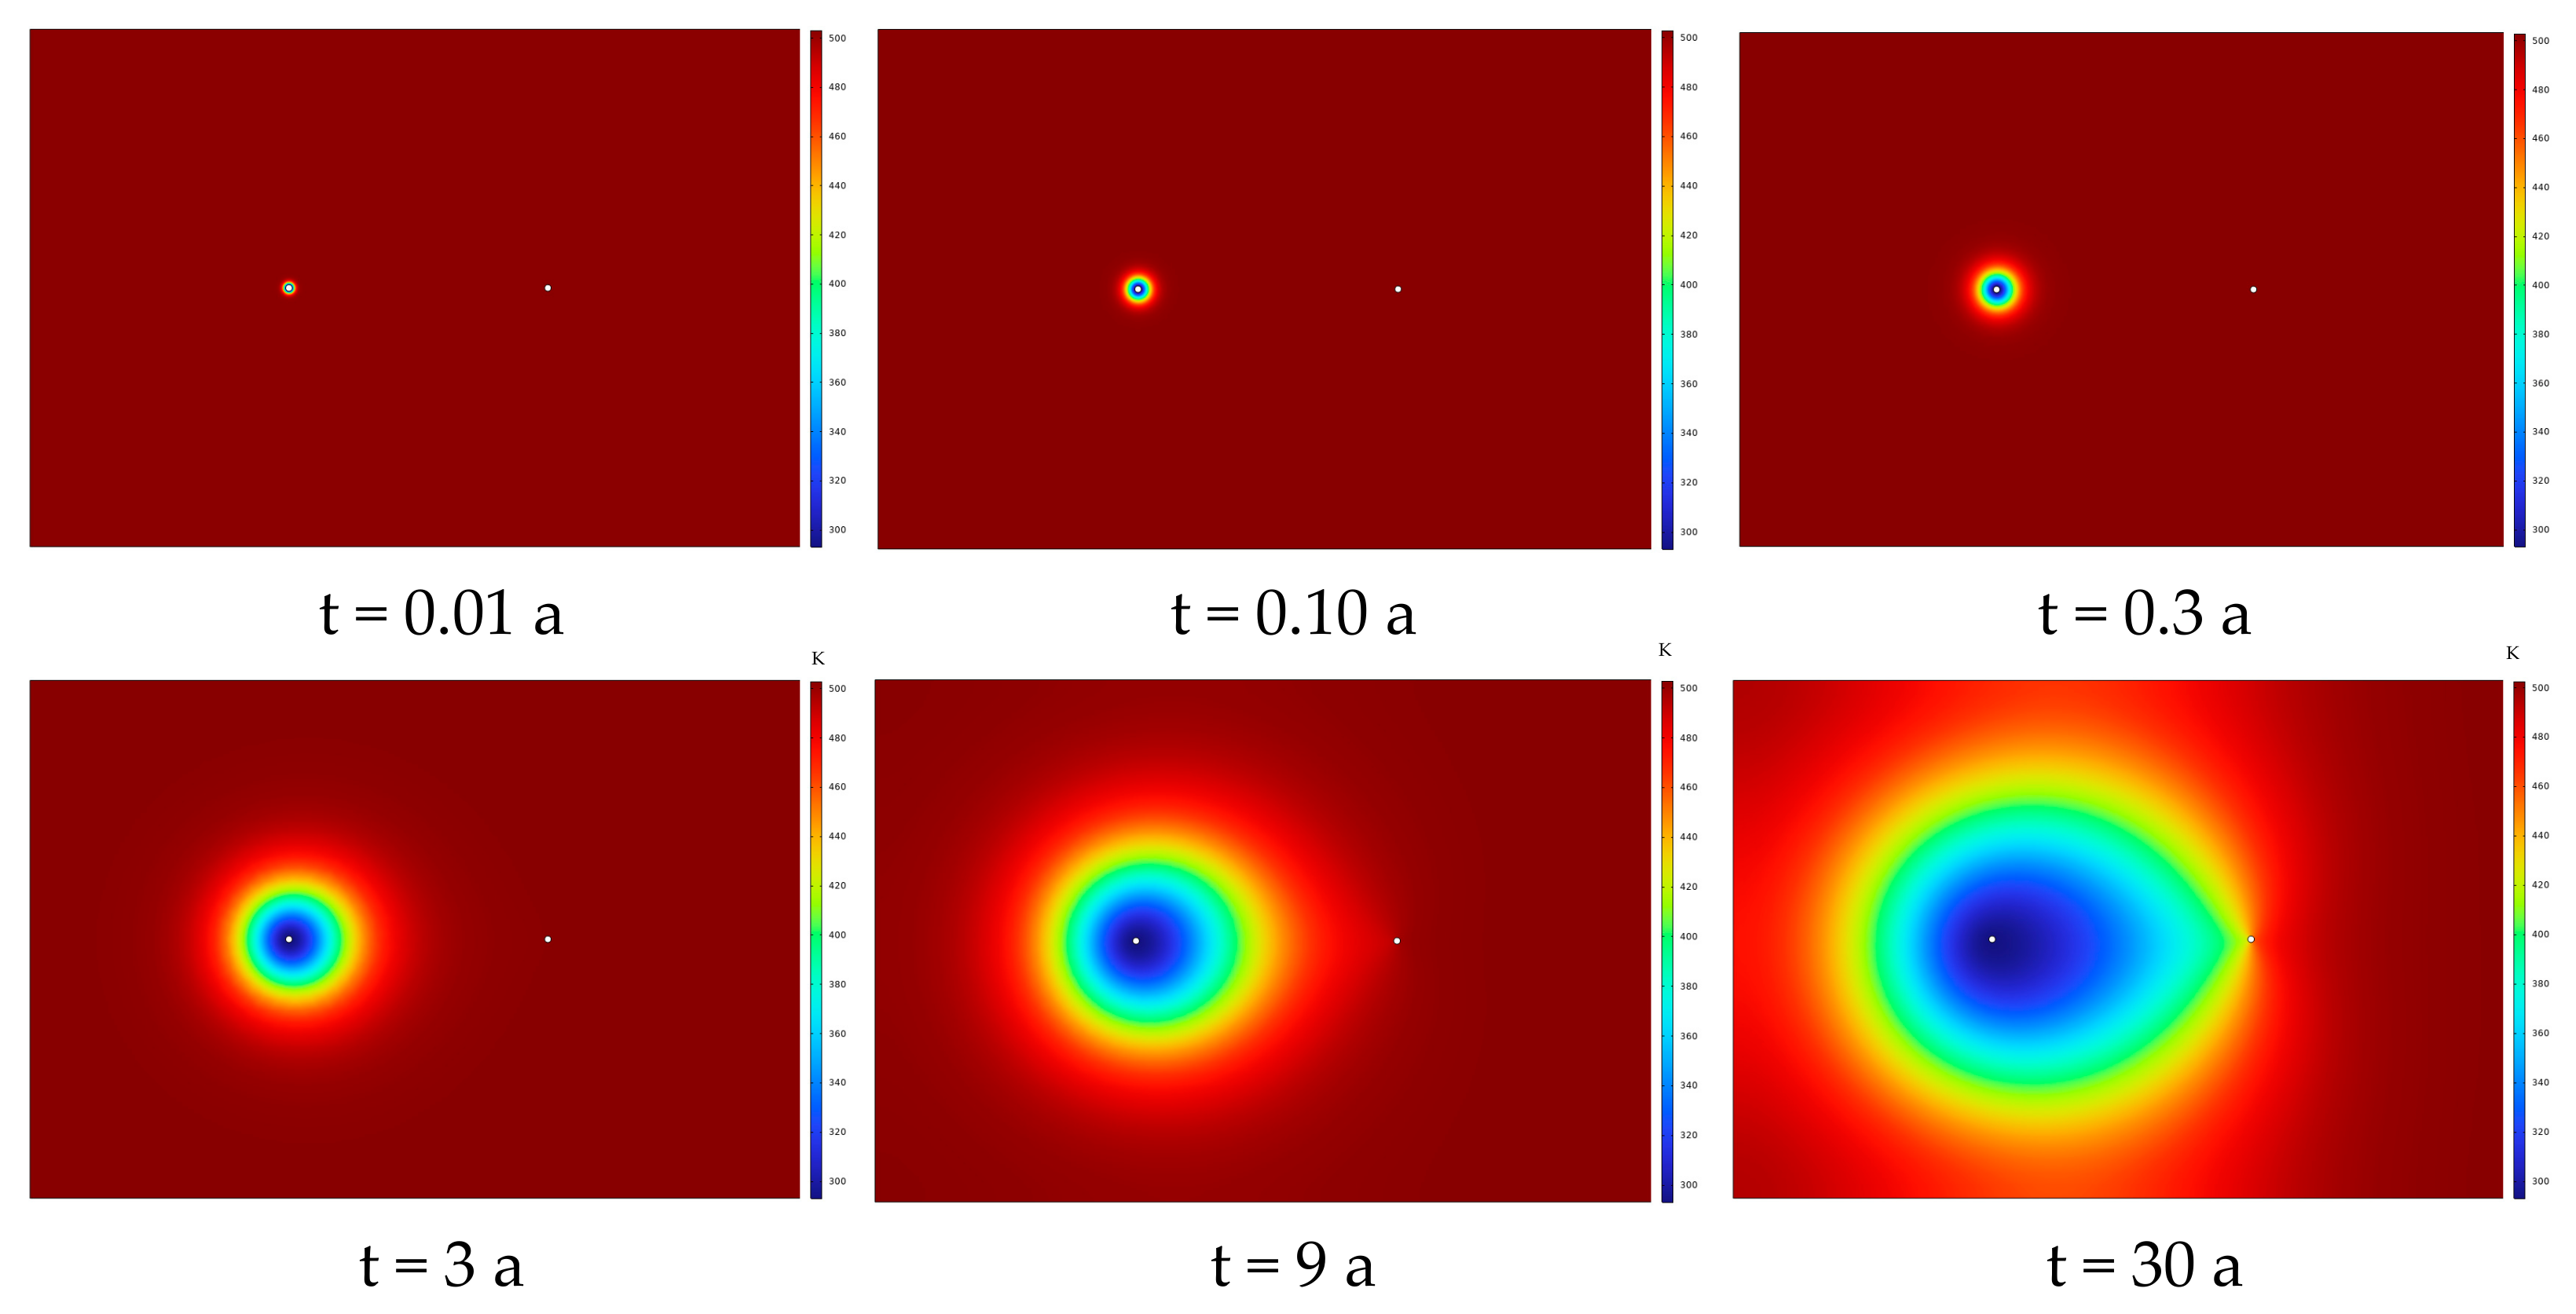
Section 3, this section selects a typical working condition (well spacing: 80 m, injection–production pressure difference: 8 MPa, injection temperature: 20 °C, initial reservoir temperature: 230 °C) to simulate the 30-year thermal extraction process. Focusing on the simulation results of this benchmark parameter combination, this section systematically analyzes the attenuation law of the reservoir temperature field, the migration characteristics of high-temperature regions, and the evolution trend of the distribution gradient of the pore pressure field with the progress of extraction. It also reveals the multi-field coupling coordinated evolution mechanism of the geothermal reservoir, laying a foundation for subsequent parameter sensitivity analysis.
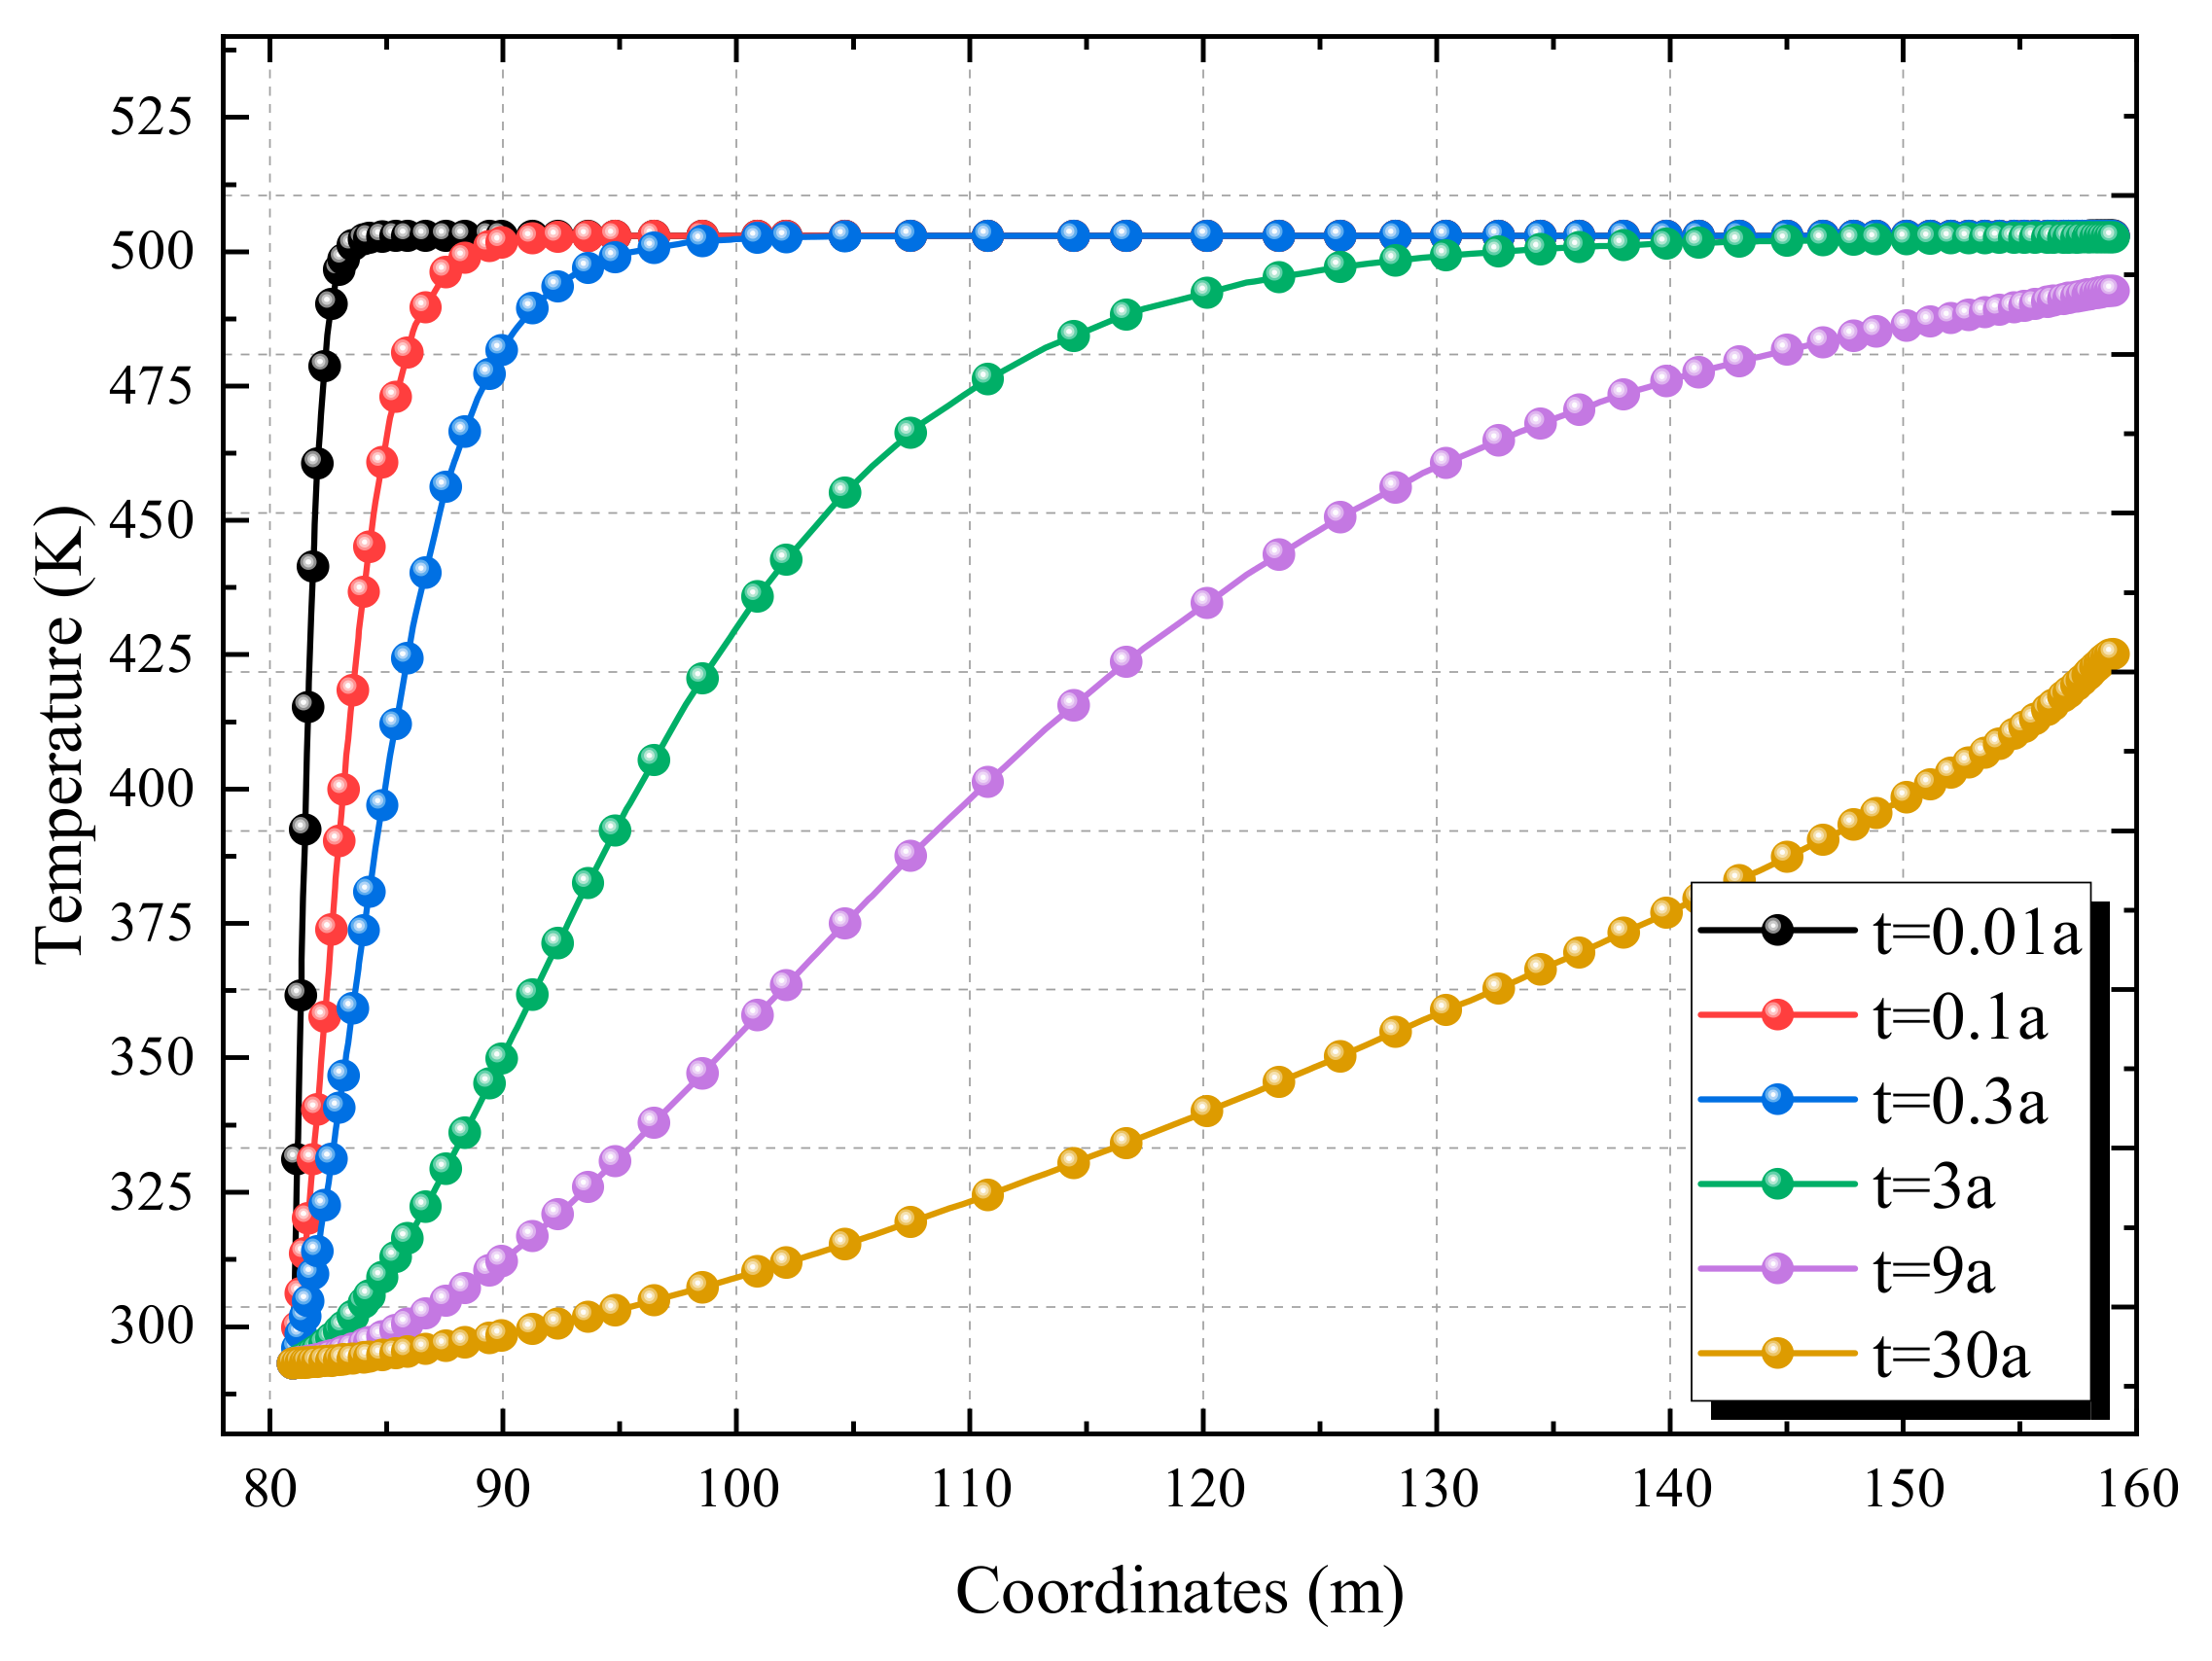
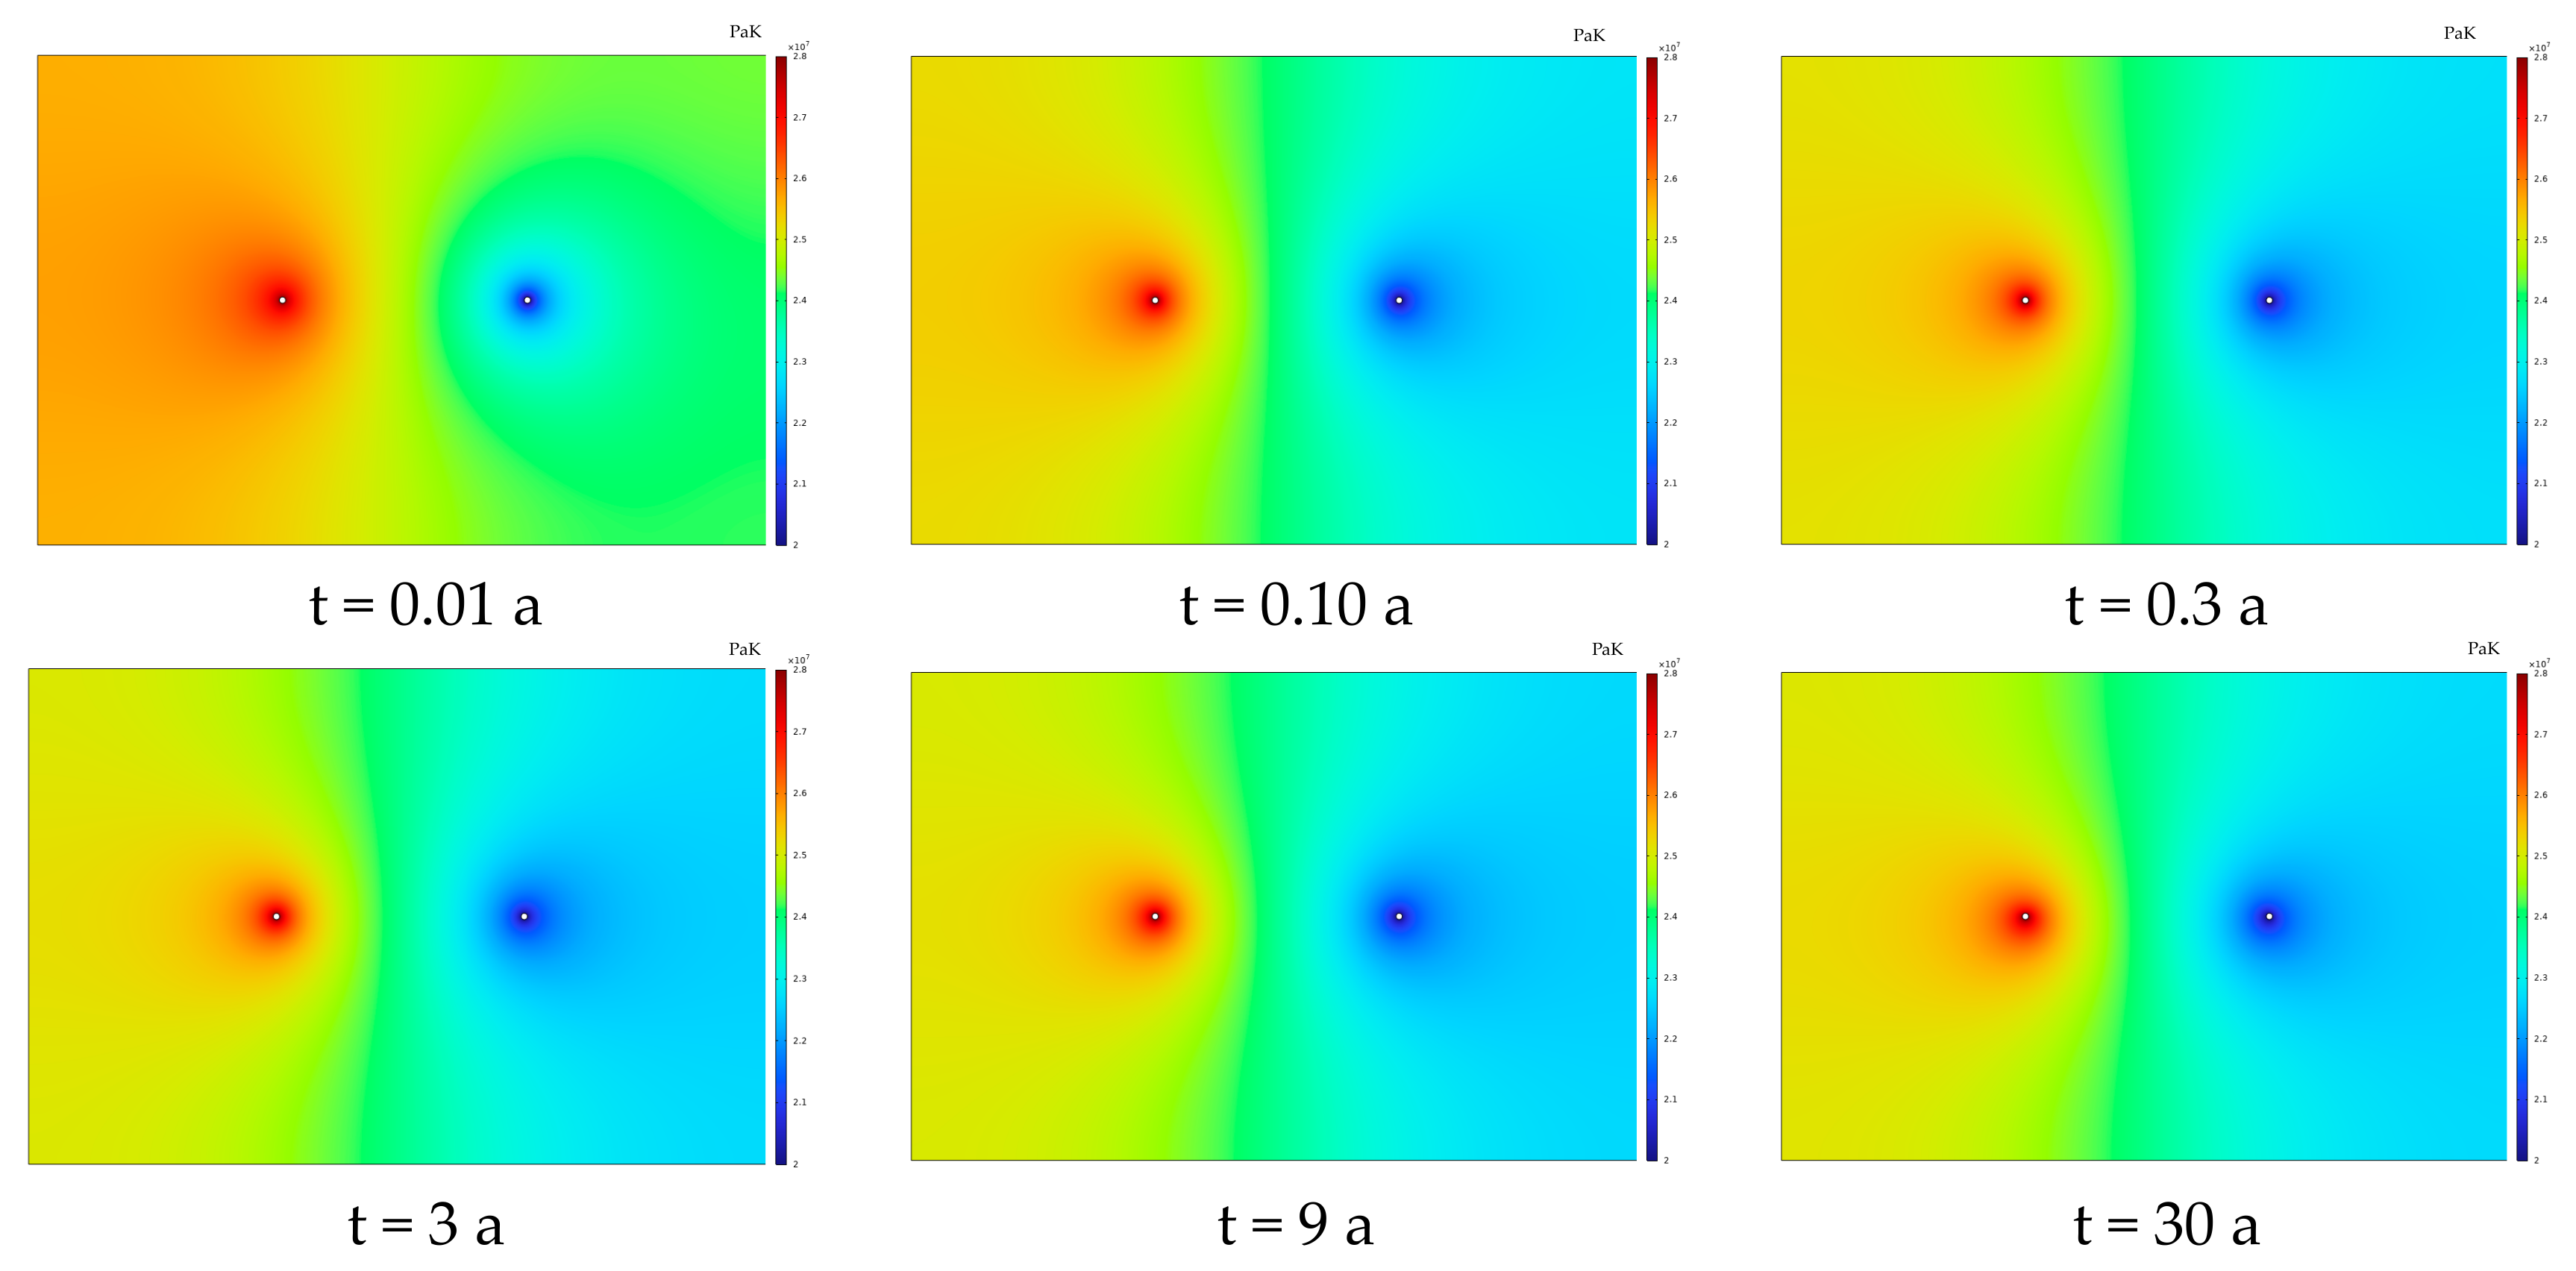
As can be seen from
Figure 3 and
Figure 4, the injection well (at the 80 m coordinate) continuously injects low-temperature water (20 °C). As the extraction time increases, the cold water gradually advances toward the production well (at the 160 m coordinate), showing an obvious process of “cold zone expansion—high-temperature zone compression”.
In the early extraction stage (t = 0.01~0.3 a): At t = 0.01 a, only the temperature near the injection well (80~83 m) drops rapidly to around 300 K, while the area beyond 90 m still maintains the initial high temperature of the reservoir; at t = 0.3 a, the cold zone has advanced to 100 m, the temperature in the 80~100 m interval decreases significantly, and the area beyond 100 m remains a high-temperature zone. During this stage, the cold water advances at the fastest speed, which reflects the strong fluid seepage and thermal convection driven by the injection–production pressure difference in the early extraction stage.
In the middle extraction stage (t = 3~9 a): At t = 3 a, the cold zone advances to 120 m; at t = 9 a, the cold zone further expands to 145 m. The advancement speed of cold water slows down at this stage. This is because after the reservoir temperature decreases, the thermal convection efficiency declines, and the cold water front is dominated by heat conduction, so the advancement rate shifts from “seepage control” to “heat conduction control”.
In the late extraction stage (t = 30 a): The cold zone almost runs through the entire interval between the injection and production wells (80~160 m), and only a small amount of high-temperature zone remains near 150~160 m. This indicates that the cold water has approached the production well and most areas of the reservoir have been cooled.
From the analysis of absolute temperature values and distribution gradients, the temperature field presents an evolution law of “sharp drop in the early stage—slow drop in the middle stage—stabilization in the late stage”. The initial high temperature of the reservoir continuously decreases during the extraction process; at t = 30 a, the temperature in most areas between the injection and production wells drops to 300~400 K, with only the terminal area remaining above 400 K. In the early extraction stage (e.g., t = 0.01 a), the temperature gradient in the 80~90 m interval is extremely large (jumping from 300 K to 500 K); as time goes by, the gradient gradually flattens (e.g., at t = 30 a, the temperature in the 80~160 m interval slowly rises from 300 K to 425 K), which reflects the transformation of the geothermal reservoir from “strong temperature heterogeneity” to “weak temperature heterogeneity”.
The evolution of the temperature field directly reflects the timeliness and sustainability of heat extraction. In the short term (0~3 a): The cold water advances rapidly, the high-temperature zone has a large range, and the heat extraction efficiency is high (the outlet temperature of the production well is high, and the heat production power is large). In the middle term (3~9 a): The high-temperature zone is compressed but still maintains a certain scale; the heat extraction efficiency gradually decreases with the advancement of cold water, but it still has development value. In the long term (9~30 a): The high-temperature zone is greatly reduced, and the heat extraction efficiency decreases significantly. It is necessary to consider the risk of reservoir “thermal depletion” or extend the effective extraction cycle by adjusting parameters such as well spacing and injection–production pressure difference.
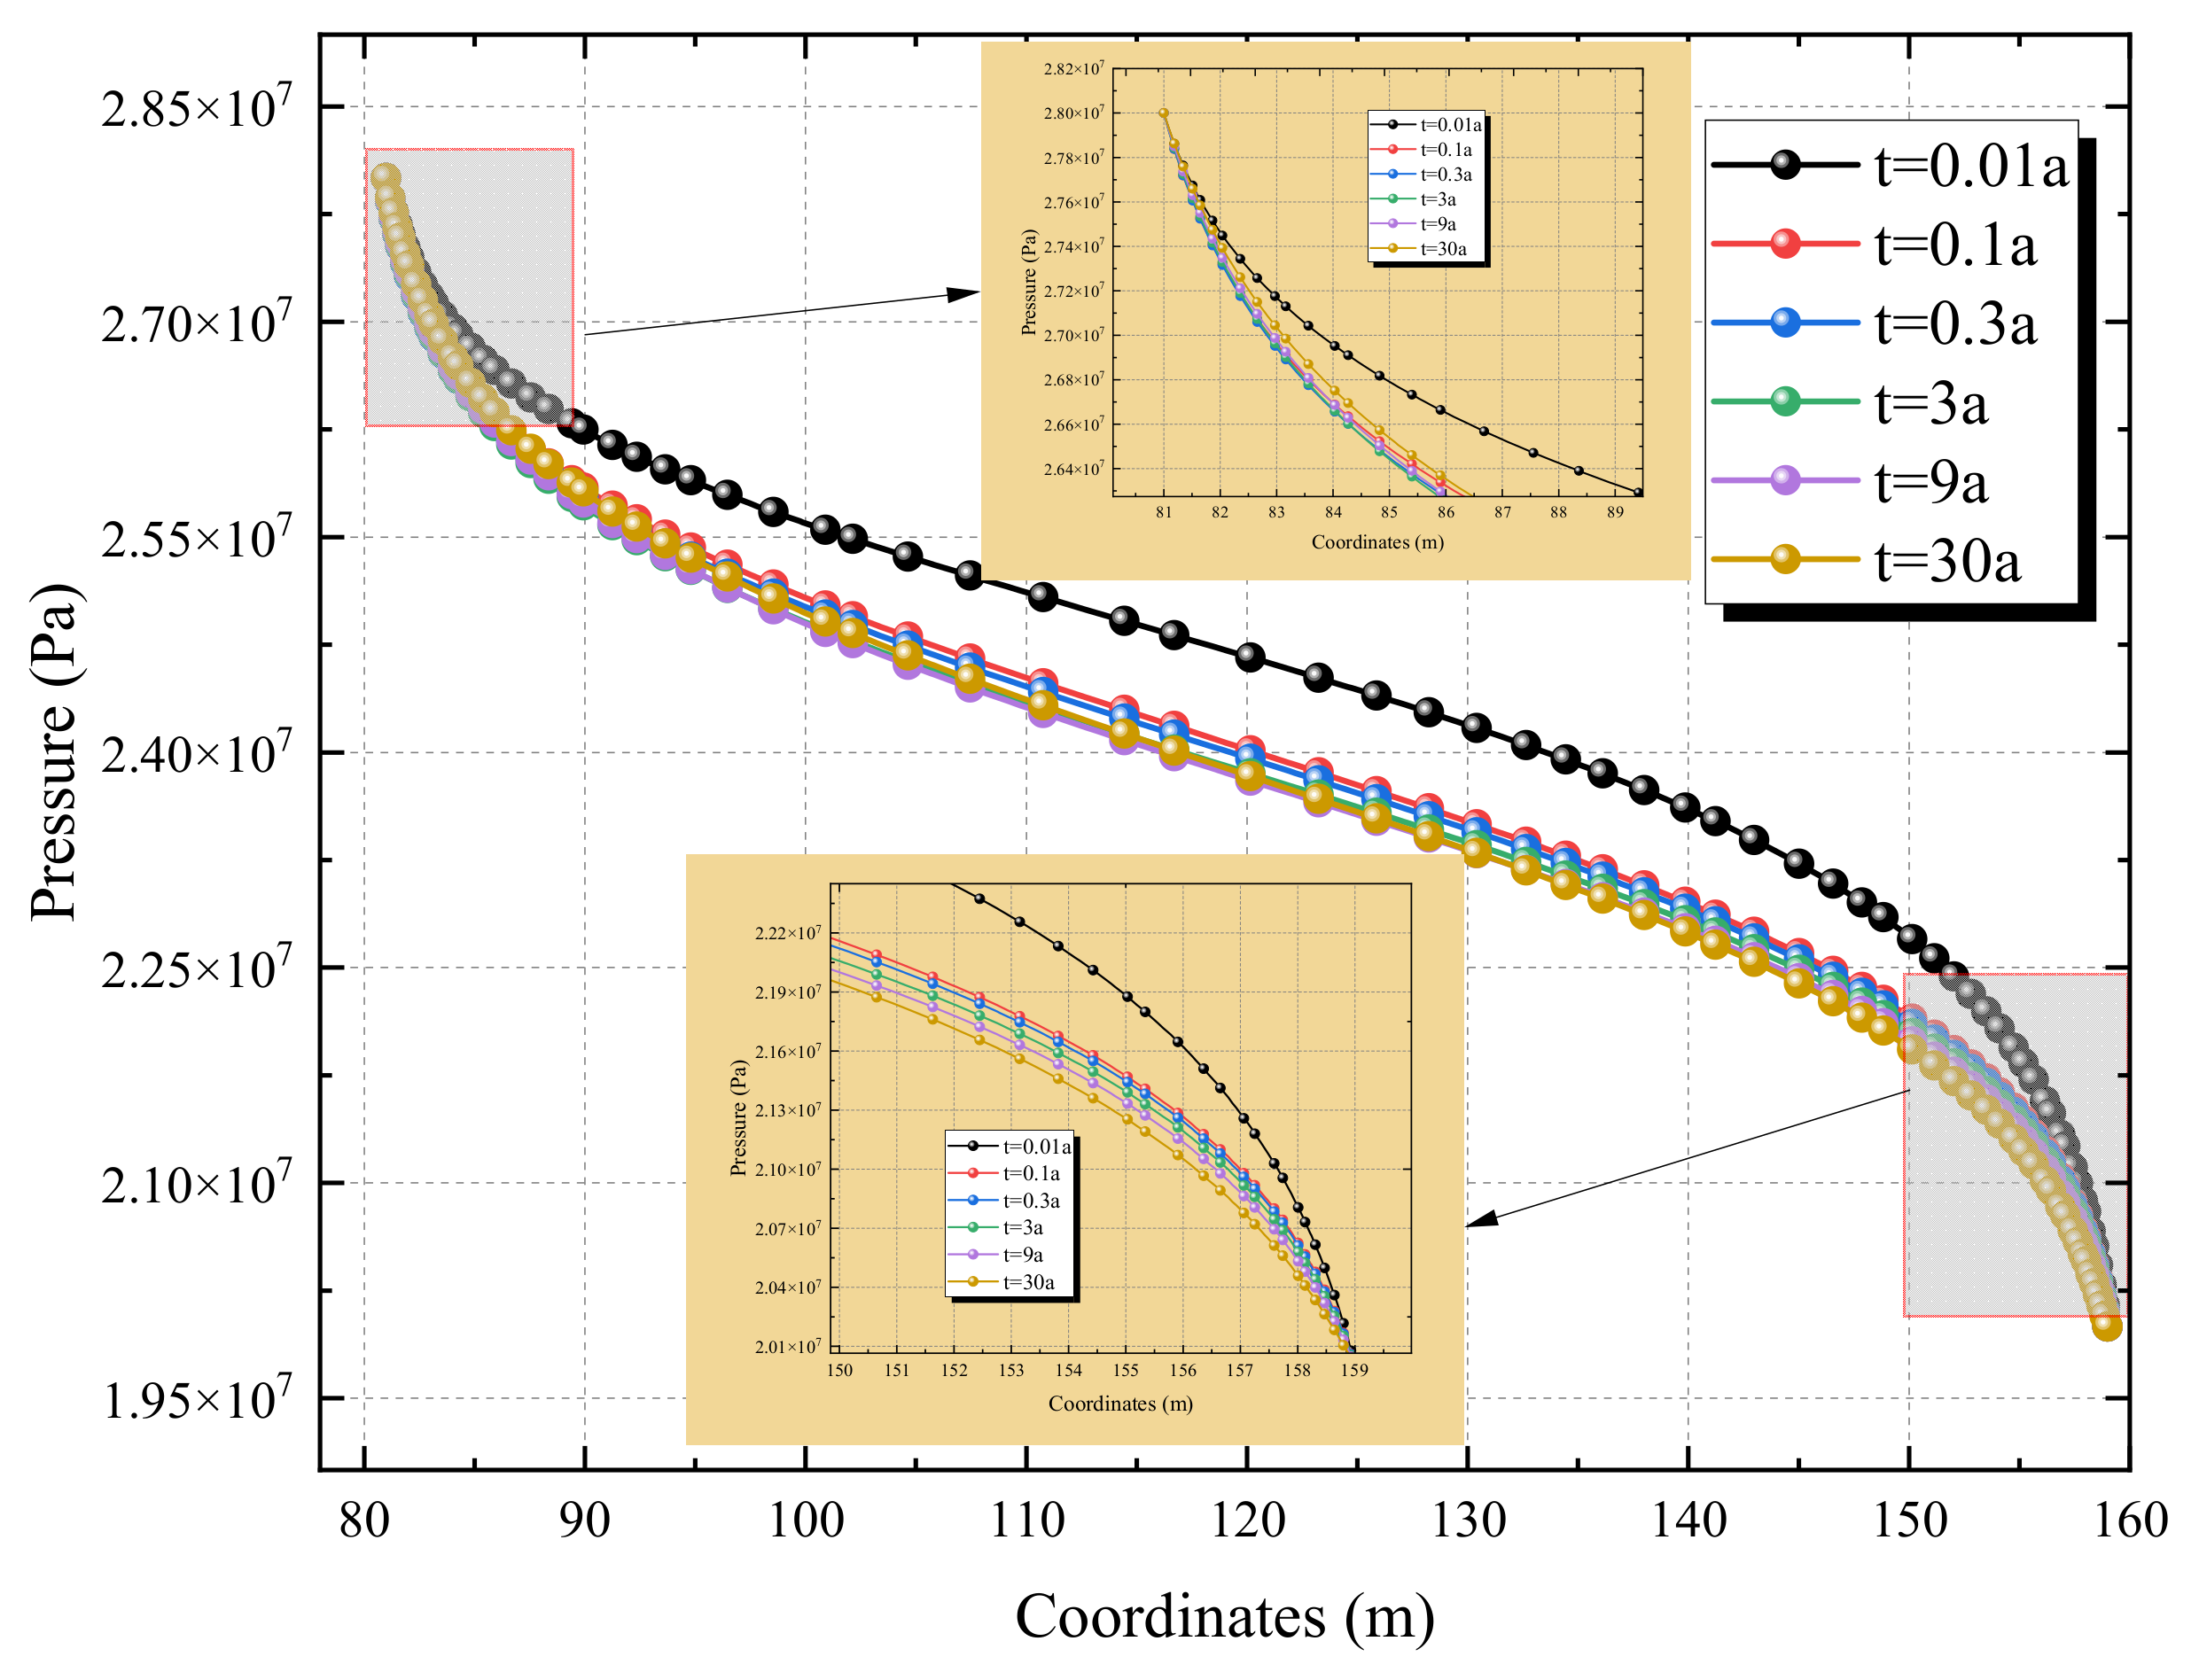
From the perspective of the overall trend (
Figure 5 and
Figure 6), the pore water pressure shows a monotonically decreasing characteristic along the line connecting the injection and production wells (80→160 m), which is a direct reflection of fluid seepage from the injection well to the production well driven by the injection–production pressure difference.
Near the injection well (80~90 m, enlarged view at the top-left corner): After the extraction enters the stable stage (t > 0.01 a), the pressure gradient is extremely steep in the early stage (t = 0.1 a), which reflects the process of “rapid pressure relief—seepage initiation” of the fluid near the injection well; in the later stage (t = 9 a, 30 a), the gradient gradually flattens, indicating that the seepage field near the injection well gradually stabilizes.
Near the production well (150~160 m, enlarged view at the bottom-right corner): Throughout the entire extraction cycle, the pressure curve shows an obvious “steep drop” characteristic in the early stage, which reflects the rapid disturbance of local pressure caused by the production extraction of the production well; in the later stage, the curve tends to be flat, indicating that the seepage field near the production well also gradually reaches dynamic equilibrium.
There is strong coupling between the evolution of the pore water pressure field and the temperature field (analyzed in the previous section), and the intrinsic mechanism can be revealed from the following two aspects: (1) Seepage-driven thermal convection: In the early stage, a large pressure gradient leads to a high fluid seepage velocity, which further causes the rapid advancement of the cold water front (corresponding to the rapid temperature drop in the 80~100 m area in the temperature field); in the later stage, a small pressure gradient results in a low seepage velocity, leading to a decline in thermal convection efficiency (corresponding to the attenuation of heat extraction efficiency in the temperature field). (2) Synergy between pressure attenuation and thermal depletion: Under long-term extraction, the continuous decrease in pressure and the continuous attenuation of temperature occur simultaneously, which reflects the dual consumption of “fluid–heat” in the reservoir and ultimately leads to a gradual decline in heat extraction efficiency with extraction time.
4.2. Influence of Injection–Production Pressure Difference on Heat Extraction Efficiency of Geothermal Systems
As the core dynamic parameter driving fluid seepage in geothermal reservoirs, the magnitude of the pressure difference directly determines the seepage velocity and migration path of fluids in the reservoir and significantly changes the spatiotemporal distribution characteristics of the geothermal reservoir temperature field through the thermo–hydro–mechanical (THM) multi-field coupling effect. To intuitively reveal the macroscopic regulation law of the injection–production pressure difference on the geothermal reservoir temperature field, this section conducts specialized simulations under the working conditions of injection–production pressure differences of 4 MPa, 6 MPa, 8 MPa, 10 MPa, and 12 MPa based on the thermo–hydro–mechanical coupled numerical model, with the well spacing fixed at 80 m, injection temperature at 20 °C, and initial reservoir temperature at 230 °C. Through the post-processing module of COMSOL Multiphysics, the temperature field contour maps of the geothermal reservoir under different injection–production pressure differences are output, which intuitively present the distribution differences and evolution trends of the temperature field from the spatial scale. This provides macroscopic visual support for the subsequent dynamic evolution analysis of temperature at key locations of injection–production wells and the quantitative analysis of heat extraction efficiency (
Figure 7).
The expansion rate of the low-temperature zone (blue-green zone) in the temperature field shows a positive correlation with the injection–production pressure difference, which reflects the direct driving effect of the pressure difference on fluid seepage velocity:
Early extraction stage (t = 0.1 a): Under all pressure differences, the cold zone is confined to the vicinity of the injection well, with no significant difference (since seepage has just started, the driving effect of the pressure difference has not been fully manifested).
Middle extraction stage (t = 6 a): The larger the pressure difference, the wider the expansion range of the cold zone. For example, the radius of the blue low-temperature zone under 12 MPa is much larger than that under 4 MPa, which indicates that a high pressure difference drives fluid to seep rapidly and significantly improves thermal convection efficiency.
Late extraction stage (t = 30 a): Under high pressure differences (e.g., 12 MPa, 10 MPa), the cold zone almost penetrates the entire area between the injection and production wells; under low pressure differences (e.g., 4 MPa), the range of the cold zone is relatively small. This shows that high pressure differences accelerate the extraction of reservoir heat, while low pressure differences delay the thermal depletion process.
At the same time node, the response of the temperature field to the injection–production pressure difference presents a “stepwise sensitivity” characteristic: From 4 MPa to 12 MPa, for every 2 MPa increase, the “magnitude and rate” of cold zone expansion are significantly enhanced. For example, at t = 6 a, the cold zone range under 8 MPa is approximately 1.2 times that under 6 MPa, and the range under 12 MPa is approximately 1.3 times that under 8 MPa. This reflects the “marginal effect” of pressure difference on thermal convection—the larger the pressure difference, the more significant the promoting effect of unit pressure increment on cold zone expansion.
The evolutionary differences of the temperature field directly correspond to two types of development strategies: “short-term high efficiency” and “long-term stability”.
High pressure differences (e.g., 10 MPa, 12 MPa): The cold zone expands rapidly, and the heat extraction efficiency is high in the short term (0~6 a), which is suitable for development scenarios pursuing “rapid heat production”. However, the reservoir is prone to thermal depletion in the long term (>30 a), so it is necessary to plan well pattern adjustment or reservoir reinjection in advance.
Low pressure differences (e.g., 4 MPa, 6 MPa): The cold zone expands slowly, and the efficiency is low in the short term, but stable heat production can still be maintained in the long term (>30 a). This is suitable for geothermal projects oriented to “long-term sustainable development”, especially for scenarios with high requirements for heat production stability.
In summary, by regulating fluid seepage velocity, the injection–production pressure difference significantly affects the spatiotemporal evolution of the geothermal reservoir temperature field: the larger the pressure difference, the faster the cold zone expands, and the higher the short-term heat extraction efficiency, but the higher the long-term thermal depletion risk; the smaller the pressure difference, the slower the cold zone expands, and the lower the short-term efficiency, but the better the long-term sustainability. This law provides a visual and quantitative basis for the optimal design of pressure differences in geothermal systems.
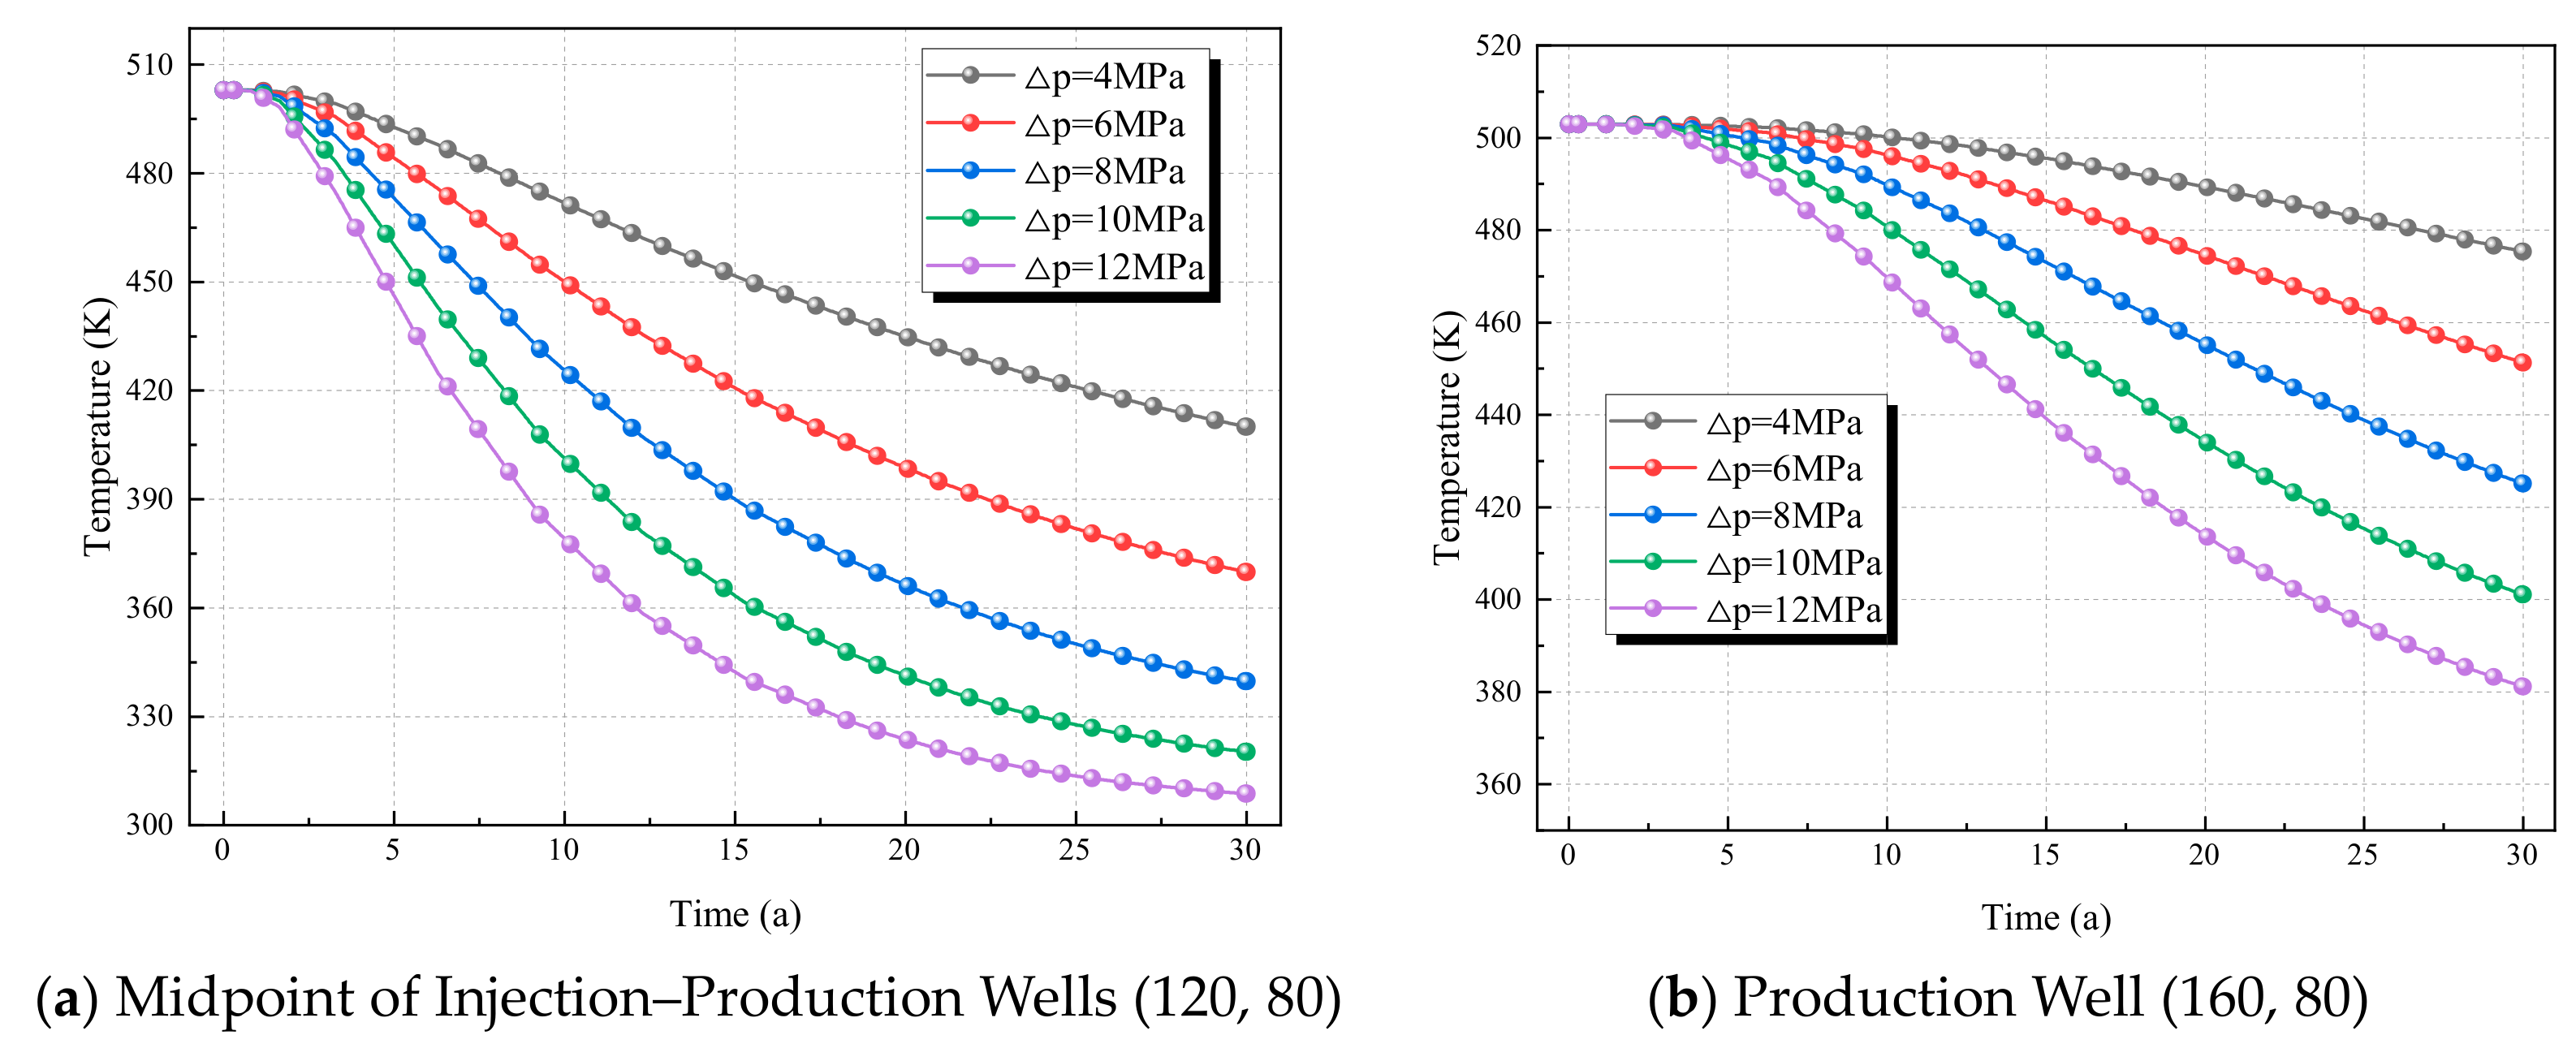
To further quantify the dynamic regulatory effect of the injection–production pressure difference on the geothermal reservoir seepage field, the midpoint of the injection–production wells (120, 80) and the production well (160, 80) are selected as key monitoring points: the former can reflect the average seepage and heat exchange status of the area between the injection and production wells, while the latter directly reflects the pressure response characteristics of the heat extraction terminal. Based on the thermo–hydro–mechanical coupled simulation results under different injection–production pressure differences (4 MPa, 6 MPa, 8 MPa, 10 MPa, 12 MPa), the pore water pressure time-series data of the two monitoring points are extracted. The influence law of pressure difference on the evolution of pore water pressure at key locations is intuitively presented through line charts, laying a theoretical foundation for the seepage field for the subsequent quantitative analysis of heat extraction efficiency and total heat extraction.
As can be seen from
Figure 8, under all pressure differences, the temperature of the production well decreases continuously over time, which reflects the continuous heat extraction process of the geothermal reservoir. The larger the injection–production pressure difference, the faster the temperature drop rate. For example:
- −
Under Δp = 12 MPa (purple curve): The temperature drops from approximately 500 K to below 450 K after 30 years, showing the fastest drop rate;
- −
Under Δp = 4 MPa (gray curve): The temperature only drops to around 475 K after 30 years, with the slowest drop rate.
A larger pressure difference leads to a faster fluid seepage velocity, and the cold water front advances more rapidly toward the production well, resulting in a rapid attenuation of the production well temperature.
As can be seen from
Figure 8, consistent with the production well, the temperature at the midpoint decreases continuously over time, but the drop amplitude is more pronounced (within the same time period, the midpoint temperature is 10–50 K lower than that of the production well). It also follows the law that “the larger the pressure difference, the faster the temperature drops”. For example:
- −
Under Δp = 12 MPa (purple curve): The temperature drops sharply from approximately 500 K to around 300 K after 30 years;
- −
Under Δp = 4 MPa (gray curve): The temperature drops to around 410 K after 30 years, and the attenuation rate is much lower than that under high-pressure difference conditions.
The midpoint is located between the injection and production wells, serving as the core area for fluid seepage and thermal convection. The heat exchange of the cold water front is more direct here, so the temperature attenuation is more intense than that at the production well. The significantly higher temperature attenuation rate at the midpoint of the injection–production wells reflects that “the area between the injection and production wells is the core action zone for heat extraction”, and the thermal convection effect of fluid seepage is more prominent in this middle area.
High pressure differences (e.g., 10 MPa, 12 MPa) can quickly reduce the reservoir temperature and improve short-term heat extraction efficiency (with high outlet temperature of the production well and large heat production power), whereas low pressure differences (e.g., 4 MPa, 6 MPa) result in slow temperature attenuation and low reservoir heat consumption rate, leading to a longer “effective cycle” for long-term heat extraction, which is suitable for development scenarios pursuing stable heat production. In summary, by regulating the fluid seepage velocity, the injection–production pressure difference significantly affects the temperature evolution at key locations of the geothermal reservoir: the larger the pressure difference, the faster the temperature drops, and the higher the short-term heat extraction efficiency, but the higher the long-term thermal depletion risk. Moreover, the temperature attenuation at the midpoint of the injection–production wells is more intense than that at the production well, making it the core response zone of the thermo–hydro coupling effect. This law provides a quantitative basis for the optimal design of the injection–production pressure difference in geothermal systems (balancing short-term efficiency and long-term stability).
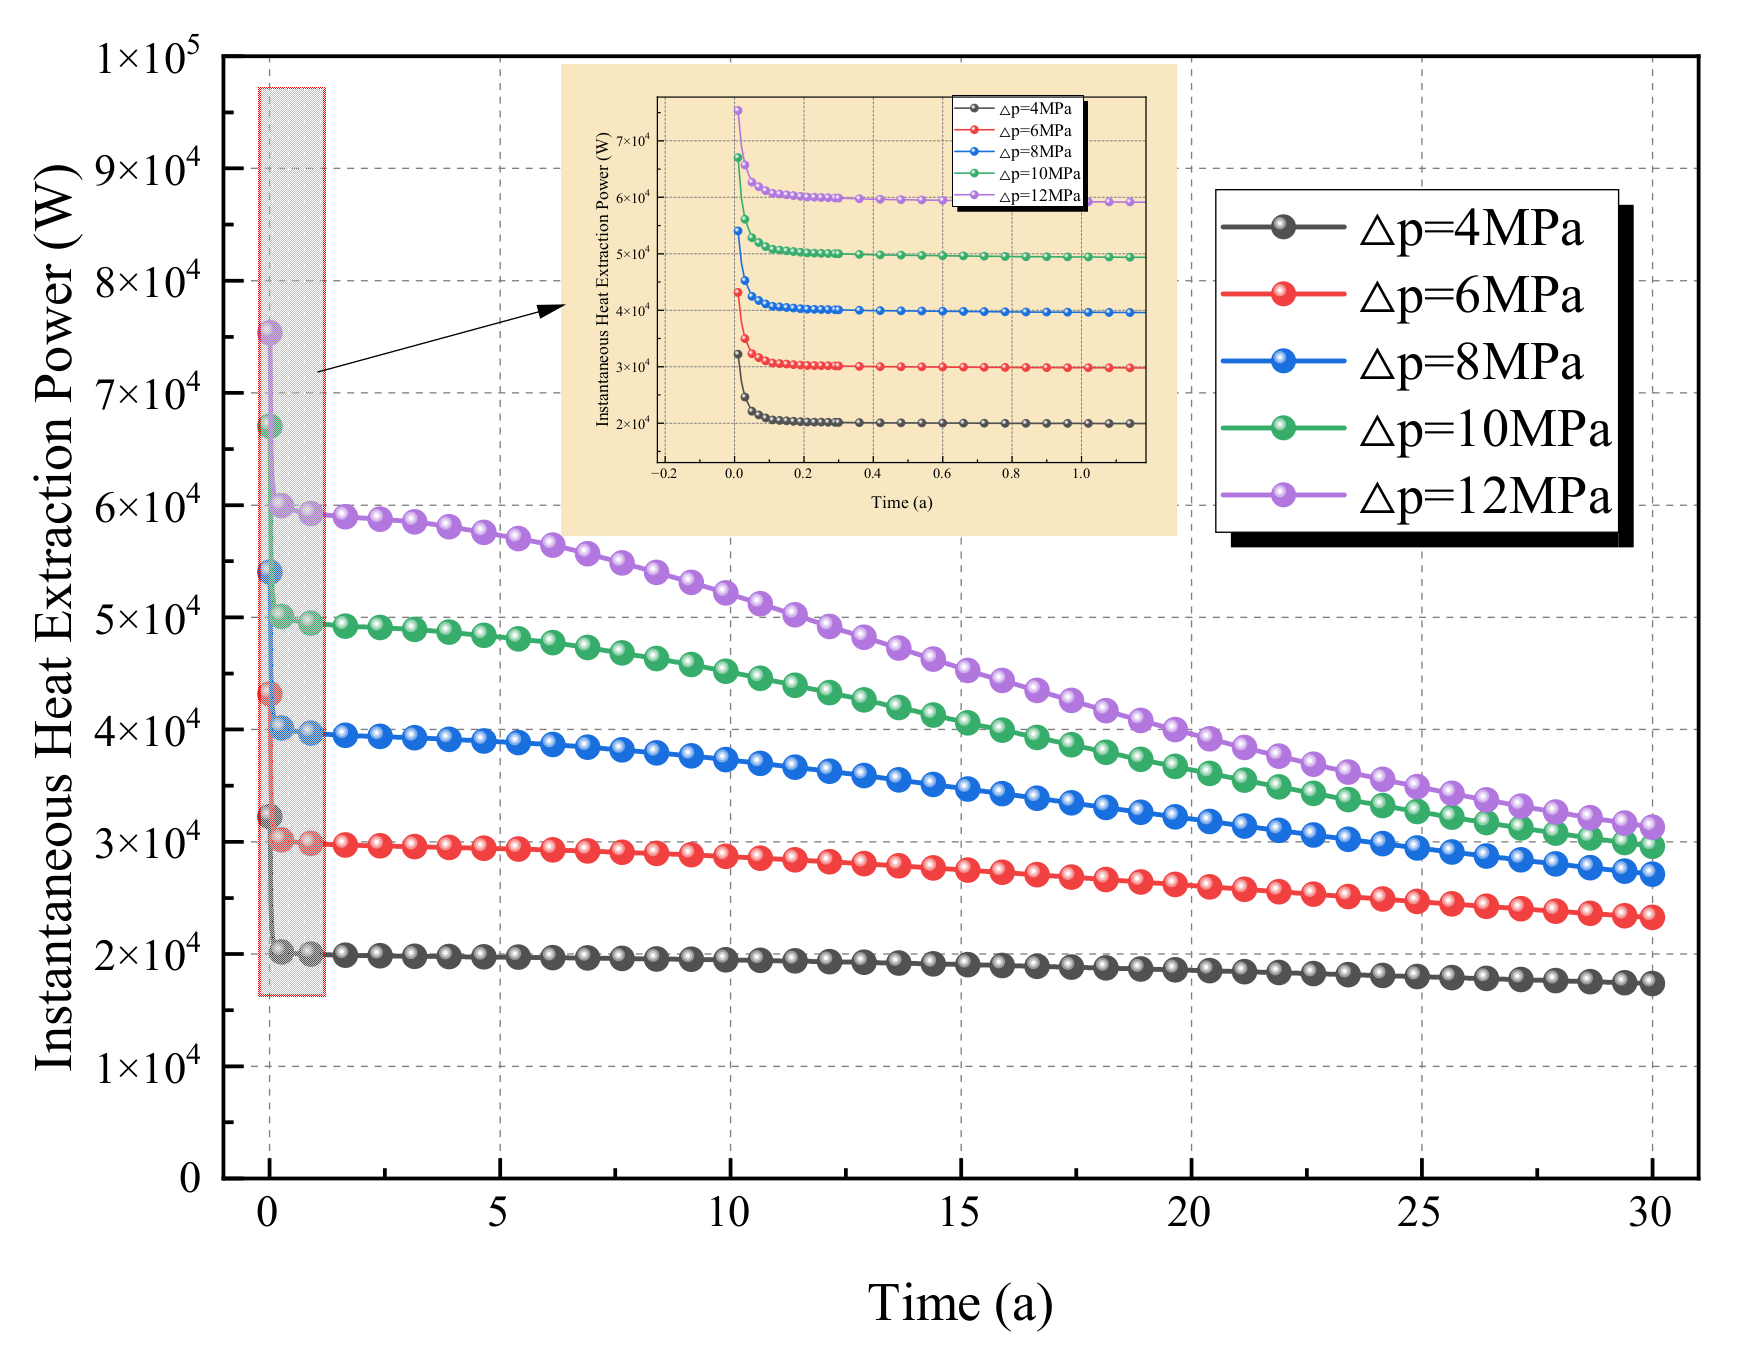
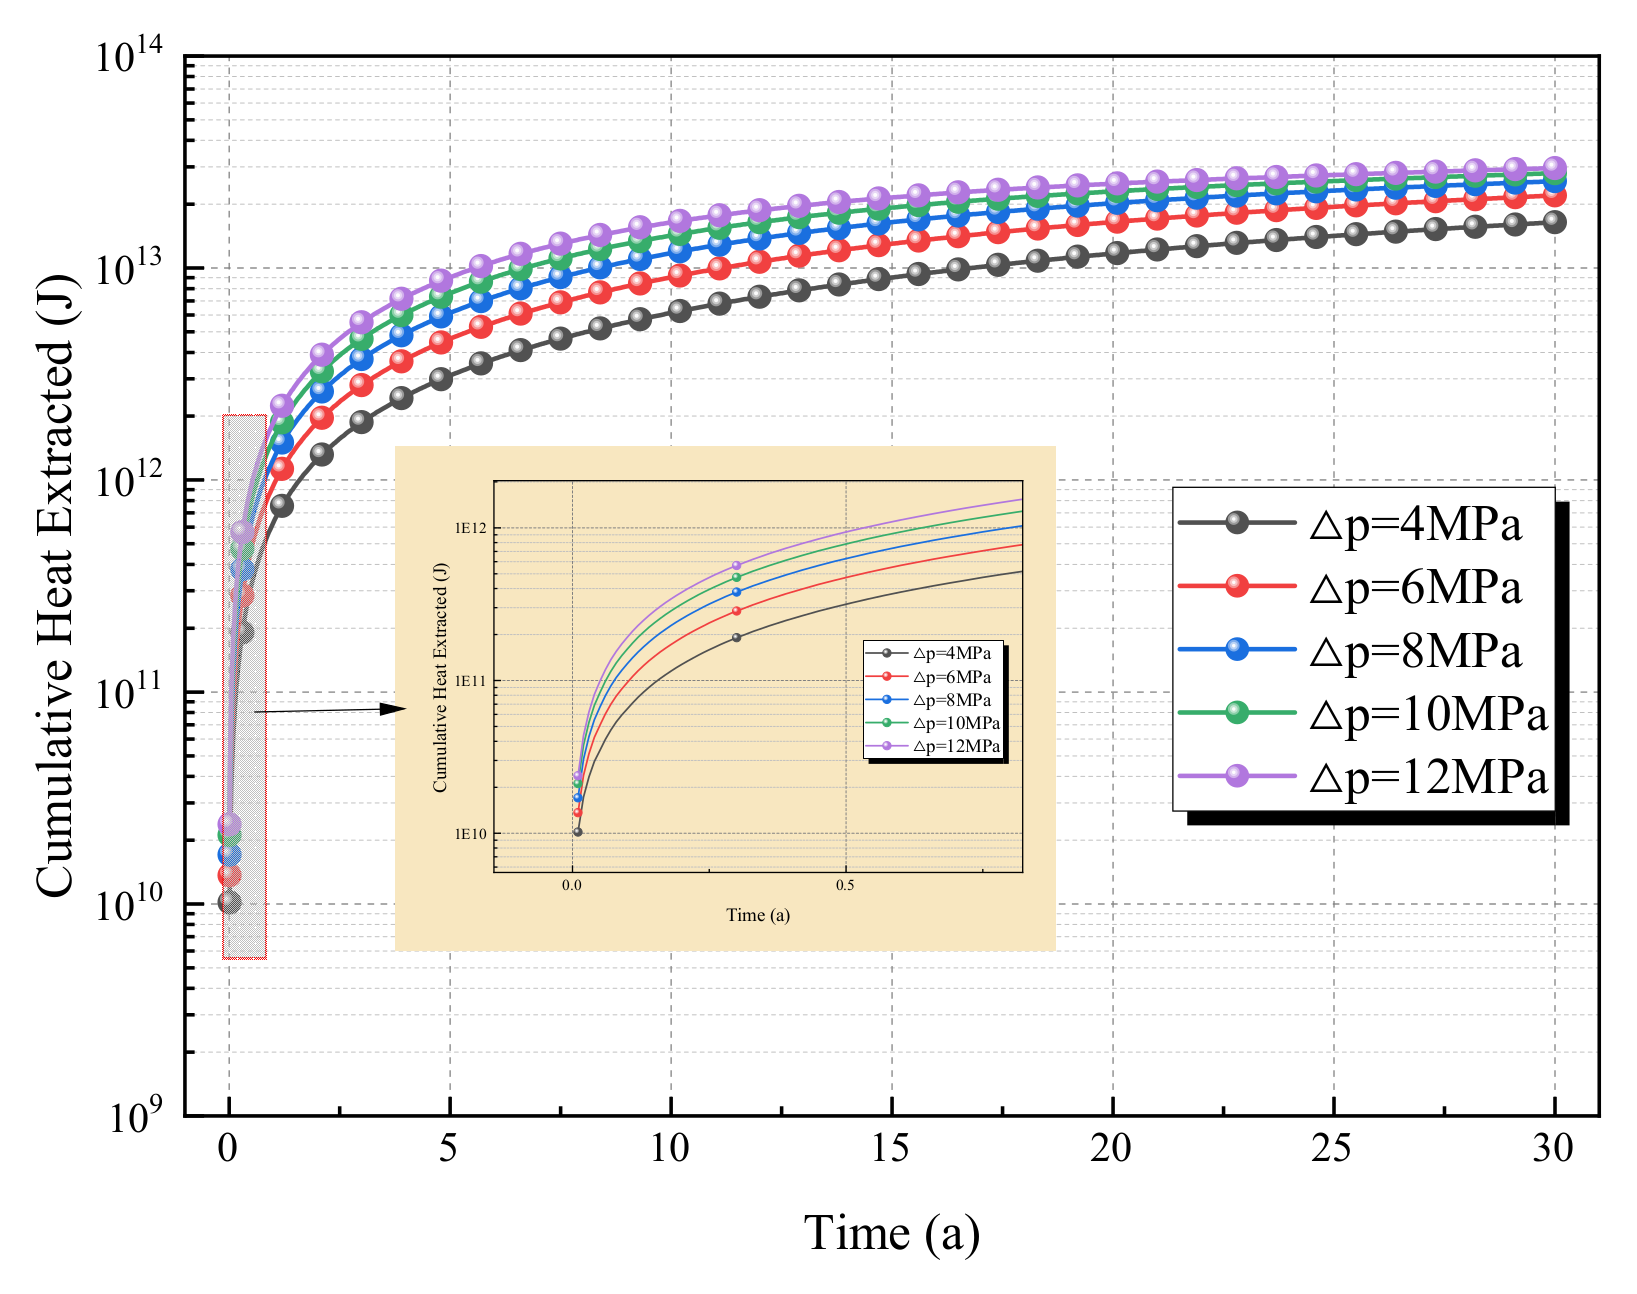
To quantify the dynamic regulatory effect of the injection–production pressure difference on heat extraction efficiency, instantaneous heat extraction power (reflecting the heat production intensity at a certain moment, unit: W) and cumulative heat extraction (reflecting the total heat gain during the extraction cycle, unit: J) are selected as core evaluation indicators. Based on the thermo–hydro–mechanical coupled simulation results under different injection–production pressure differences (4 MPa, 6 MPa, 8 MPa, 10 MPa, 12 MPa), time-series data are extracted and variation curves are plotted to intuitively present the dynamic fluctuation characteristics of heat extraction power and the cumulative evolution law of heat extraction. This provides key data support for the subsequent optimal design of the injection–production pressure difference and the quantitative evaluation of heat extraction efficiency.
As can be seen from
Figure 9 and
Figure 10, the instantaneous power under all pressure differences continuously attenuates, yet the power under high pressure differences remains consistently higher than that under low pressure differences. For instance, after 30 years, the power under Δp = 12 MPa is approximately 3 × 10
4 W, while it is only about 1.5 × 10
4 W under Δp = 4 MPa. This indicates that the “short-term heat production advantage” of high pressure differences can be maintained over the long term, but the attenuation rate is faster; low pressure differences result in lower heat production intensity but better stability.
The cumulative heat extraction continuously increases over time and gradually approaches saturation. The cumulative amount under high pressure differences (10 MPa, 12 MPa) is eventually significantly higher than that under low pressure differences (4 MPa, 6 MPa). For example, after 30 years, the cumulative heat extraction under Δp = 12 MPa is close to 2.9 × 10¹³ J, while it is approximately 1.6 × 10¹³ J under Δp = 4 MPa.
4.3. Influence of Injection Temperature on Heat Extraction Efficiency of Geothermal Systems
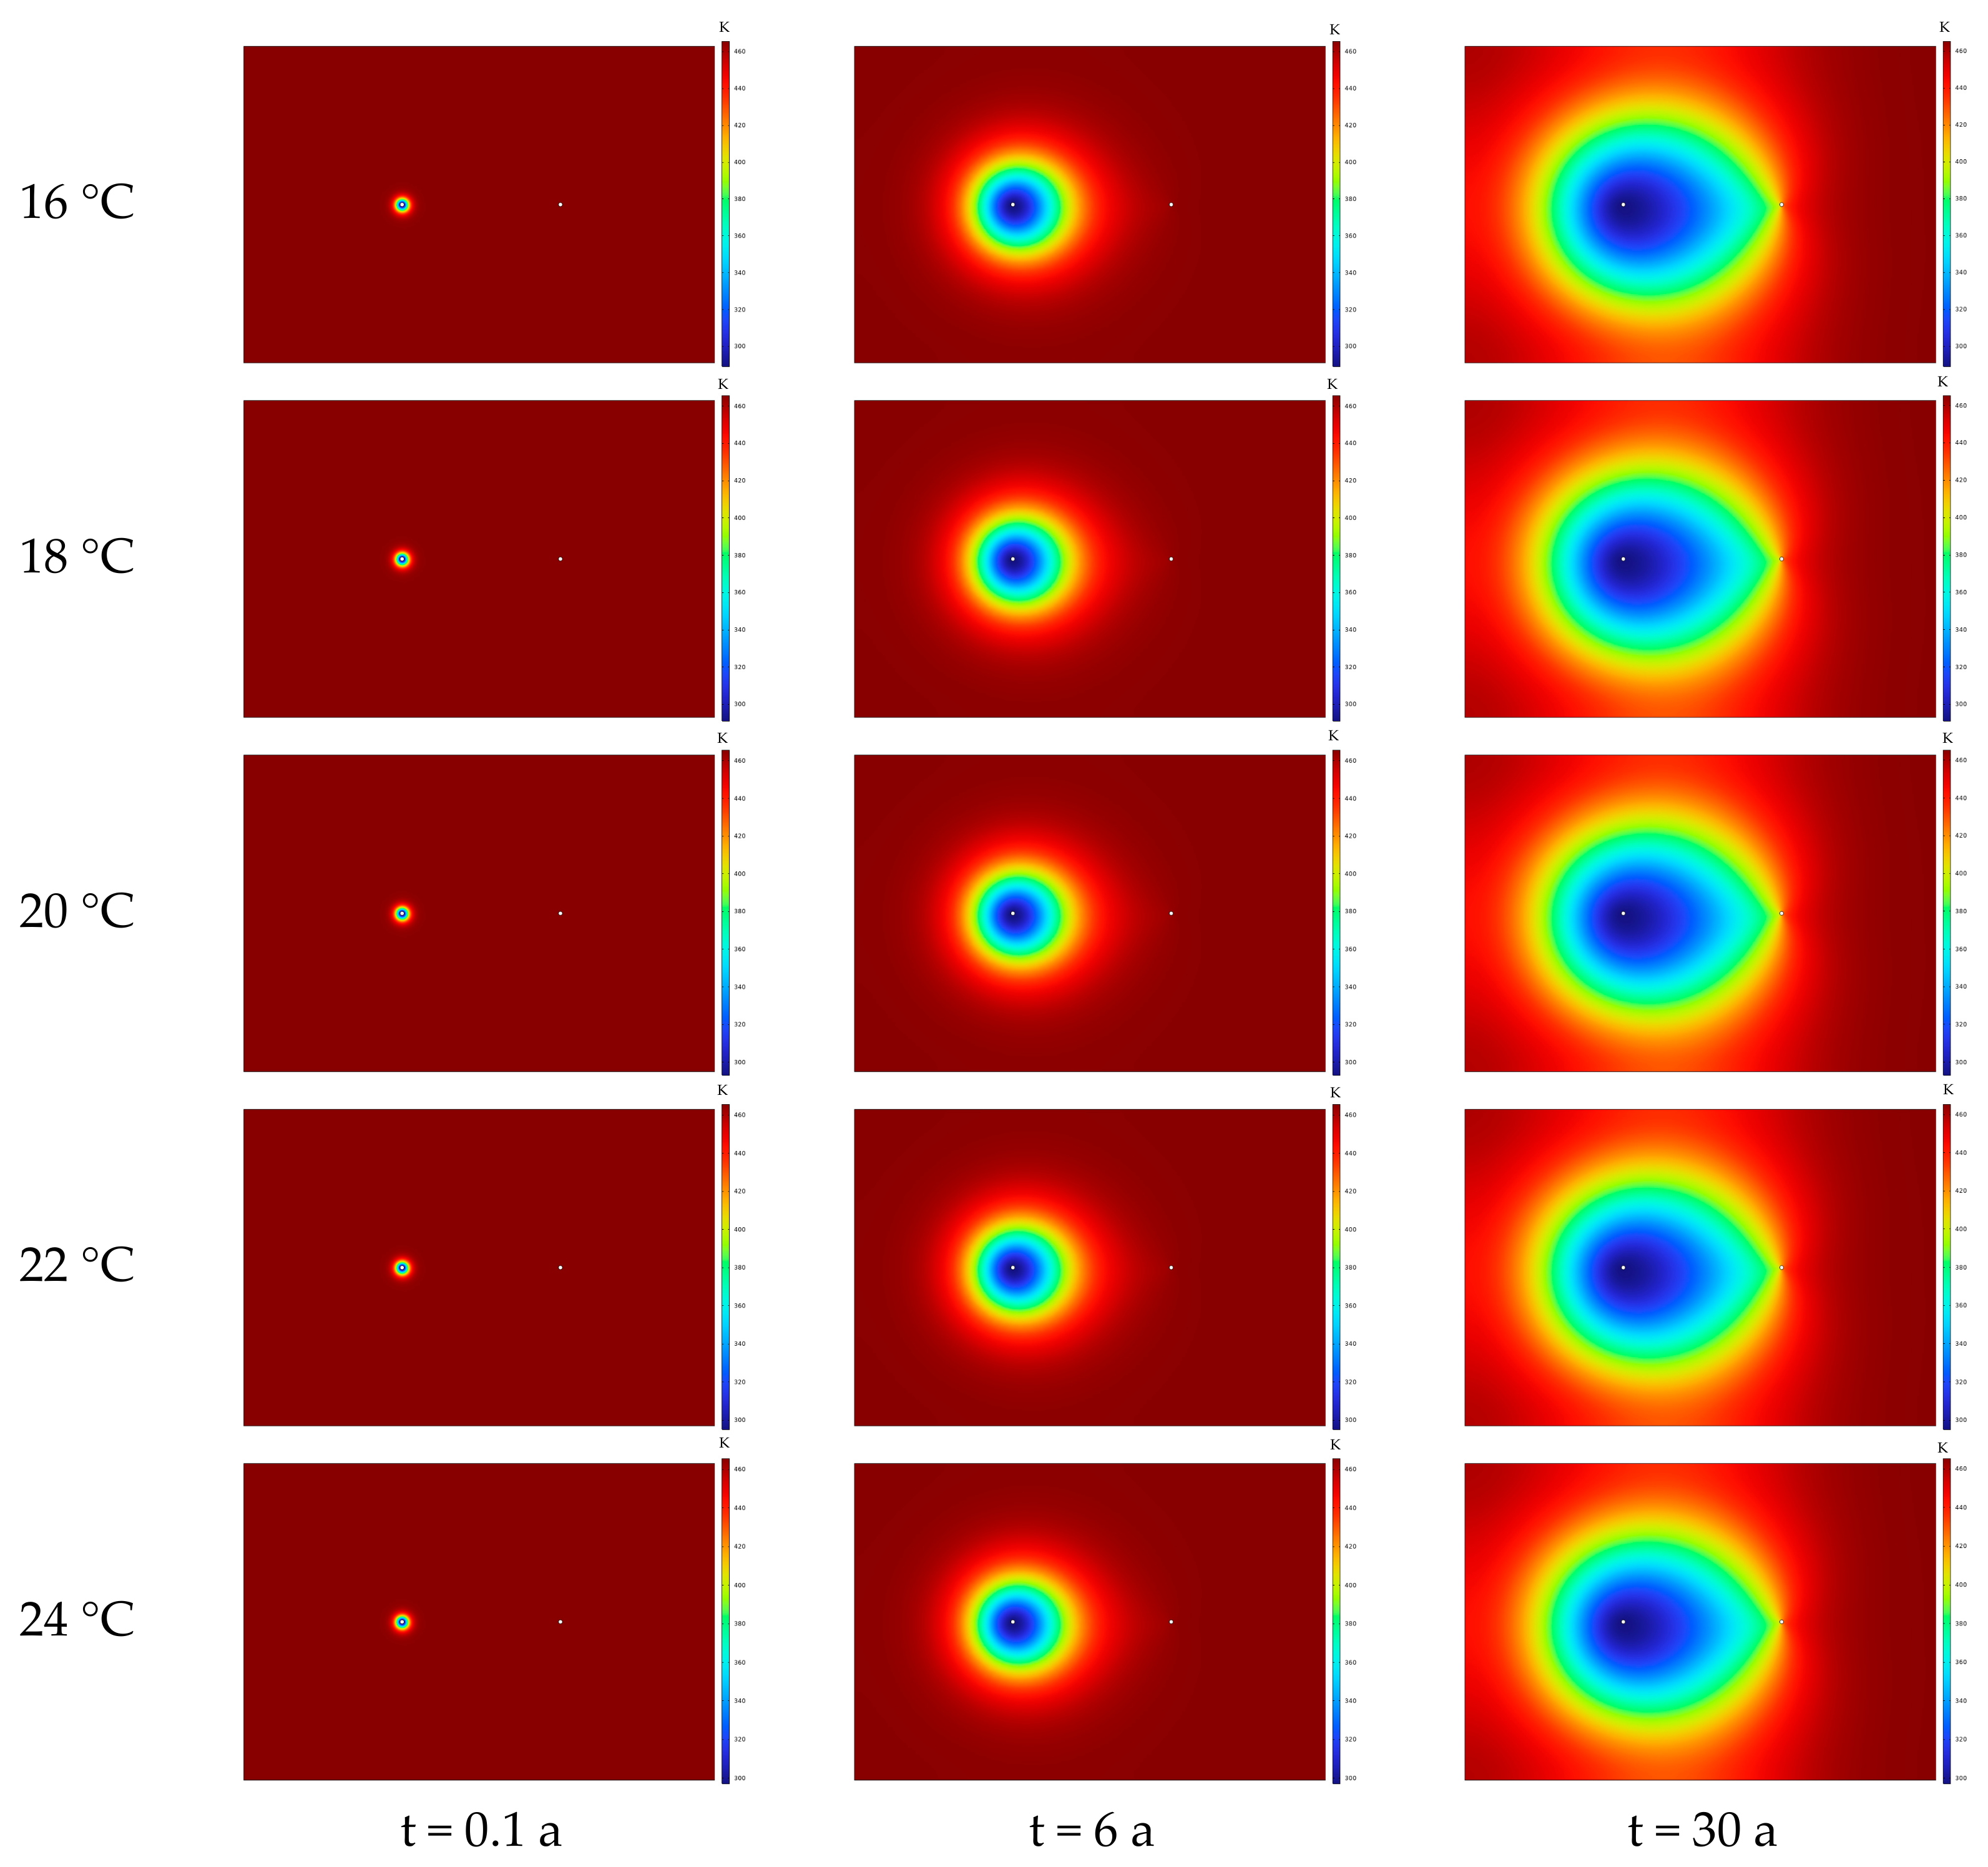
To clarify the macroscopic regulation mechanism of injection temperature on the heat exchange process in geothermal reservoirs, this section conducts thermo–hydro–mechanical (THM) coupled simulations with an injection temperature gradient (16 °C, 18 °C, 20 °C, 22 °C, 24 °C). The selection of 16 °C, 18 °C, 20 °C, 22 °C, and 24 °C as injection temperatures is due to their proximity to the normal temperature range, which facilitates the exploration of heat extraction response laws of geothermal systems under normal temperature injection conditions in practical engineering. Through temperature field contour maps of the geothermal reservoir under different injection temperatures, the influence laws of injection temperature on the range of thermal convection and the degree of high-temperature zone compression are intuitively revealed from the spatial scale.
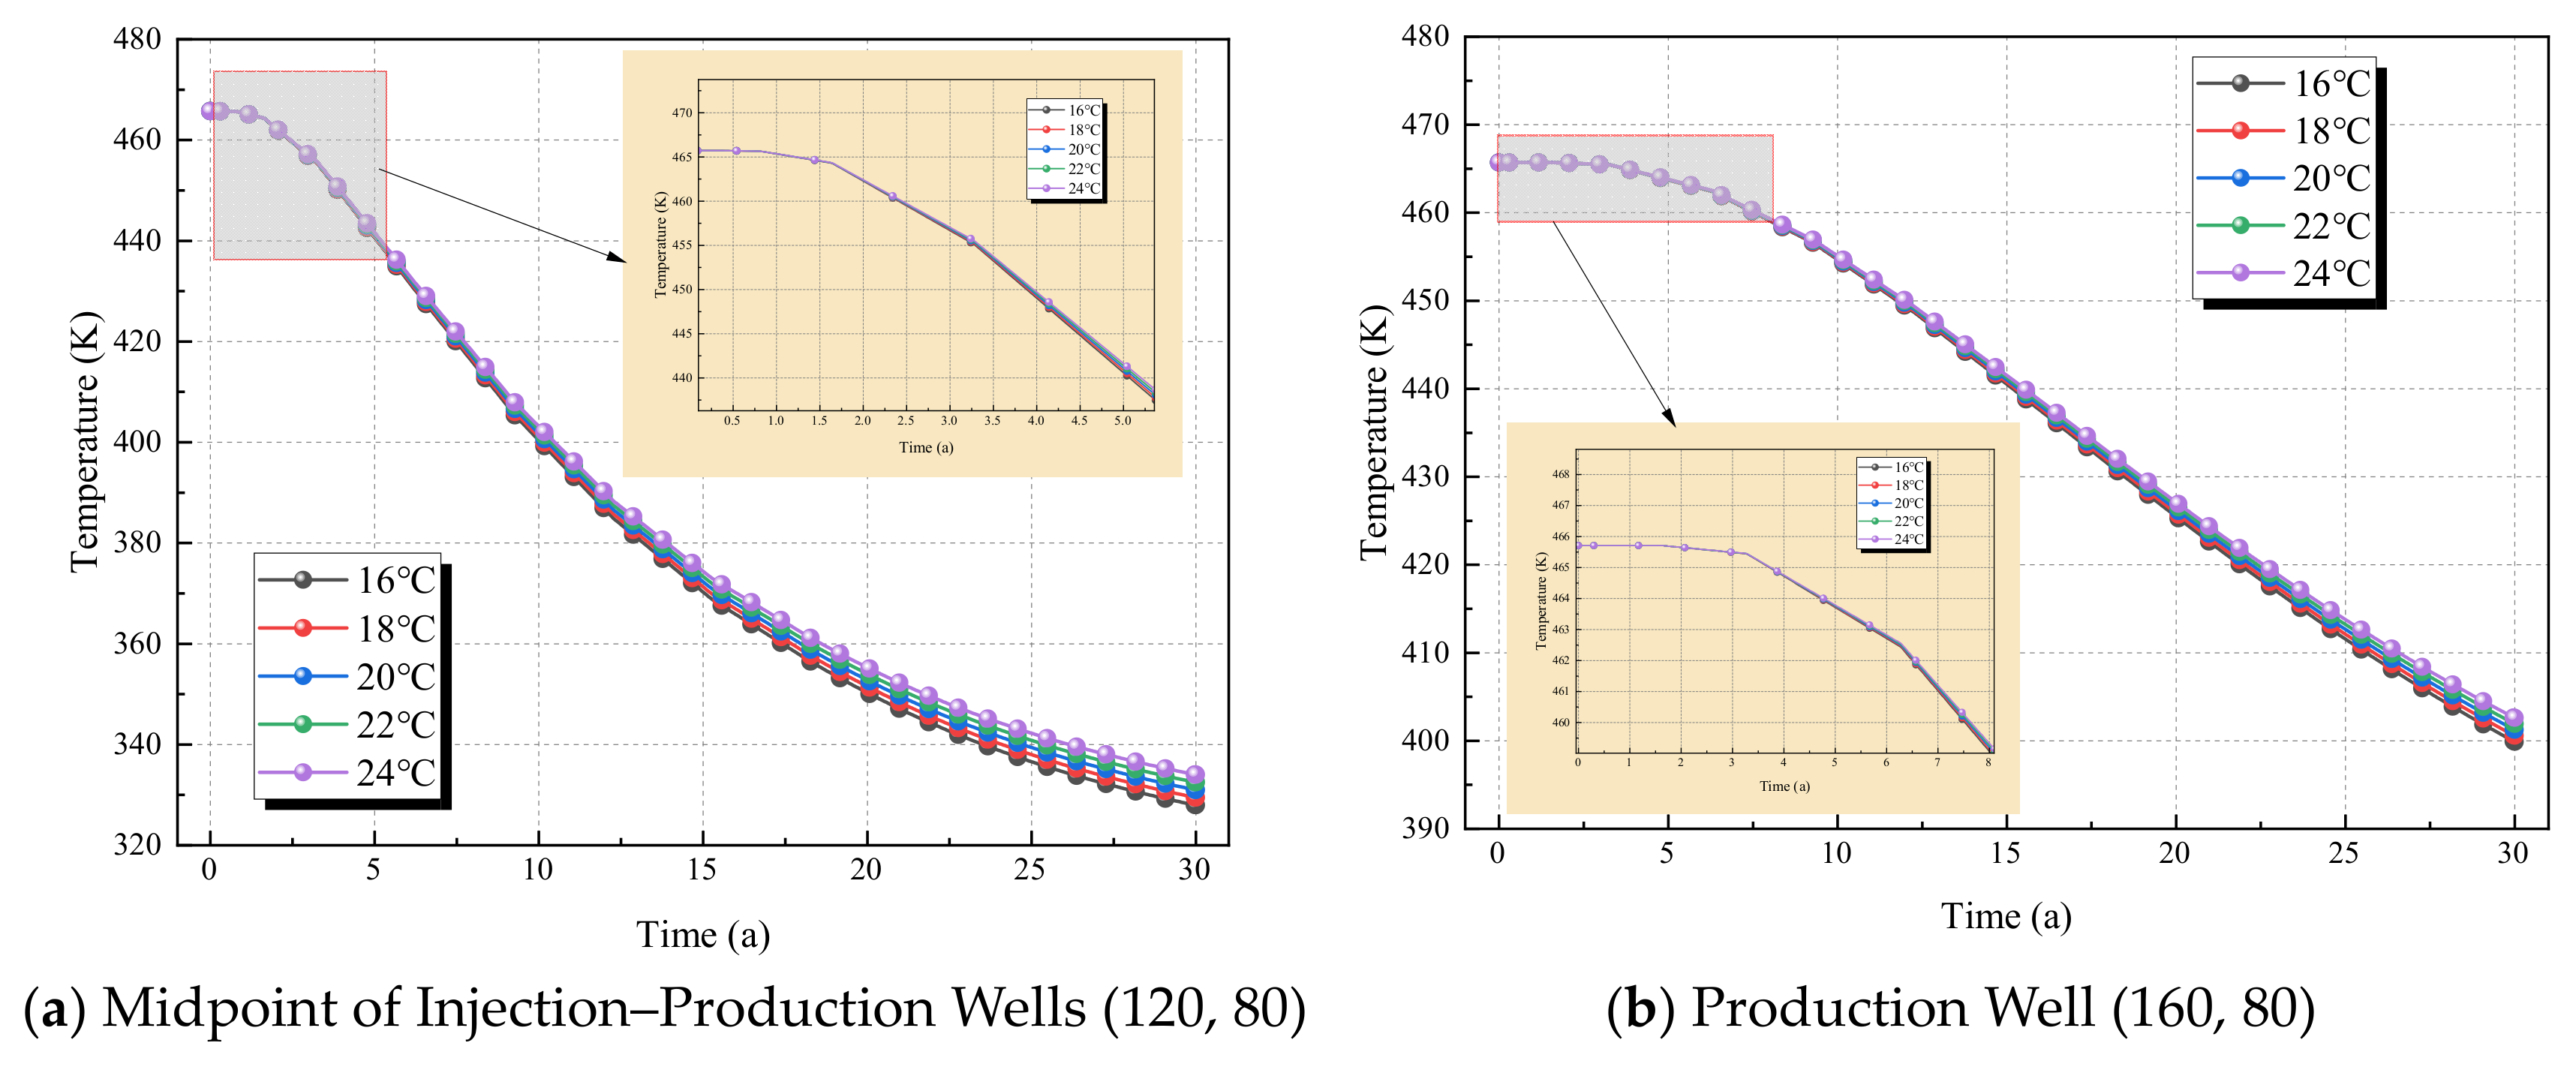
To further quantify the dynamic regulatory effect of injection temperature on the geothermal reservoir temperature field, the midpoint of the injection–production wells (120, 80) and the production well (160, 80) are selected as key monitoring points: the former reflects the average heat exchange status of the area between the injection and production wells, while the latter directly embodies the temperature response characteristics of the heat extraction terminal. Based on the THM coupled simulation results under different injection temperatures (16 °C, 18 °C, 20 °C, 22 °C, 24 °C), temperature time-series data of the two monitoring points are extracted, and the influence law of injection temperature on the temperature evolution at key locations is intuitively presented through line charts.
As can be seen from
Figure 11 and
Figure 12, the under all injection temperatures, the midpoint temperature decreases continuously over time, and the lower the injection temperature, the faster the temperature drop rate. For example, under 16 °C (gray curve), the temperature drops from approximately 460 K to 330 K after 30 years, while under 24 °C (purple curve), it only drops from 460 K to around 340 K during the same period. The temperature evolution of the production well (160, 80) follows the same law as the midpoint: the temperature decreases continuously over time, but the production well temperature is always higher than the midpoint temperature (the production well temperature is 20–50 K higher than the midpoint temperature at the same time). For instance, after 30 years, the production well temperature under 16 °C is approximately 400 K, while the midpoint temperature is only 330 K.
The temperature difference between the injection temperature and the initial reservoir temperature is the core driving force for thermal convection—the lower the injection temperature, the larger the temperature difference, and the stronger the thermal convection. This is manifested as rapid expansion of the cold zone in the temperature field (contour maps) and rapid temperature attenuation at key locations (curve charts), resulting in high short-term heat extraction efficiency but a higher risk of long-term reservoir “thermal depletion”. For “short-term high-efficiency heat production”, a low injection temperature of 16–18 °C is preferred to quickly improve heat extraction power using a large temperature difference, whereas for “long-term stable heat production”, a high injection temperature of 22–24 °C is selected to delay thermal depletion and prolong the effective extraction cycle by reducing the temperature difference.
In summary, through the coupling mechanism of “temperature difference–thermal convection”, injection temperature significantly affects the temperature evolution at key locations of the geothermal reservoir: Lower injection temperatures lead to higher short-term heat extraction efficiency but poorer long-term stability, whereas higher injection temperatures result in lower short-term efficiency but better long-term sustainability.
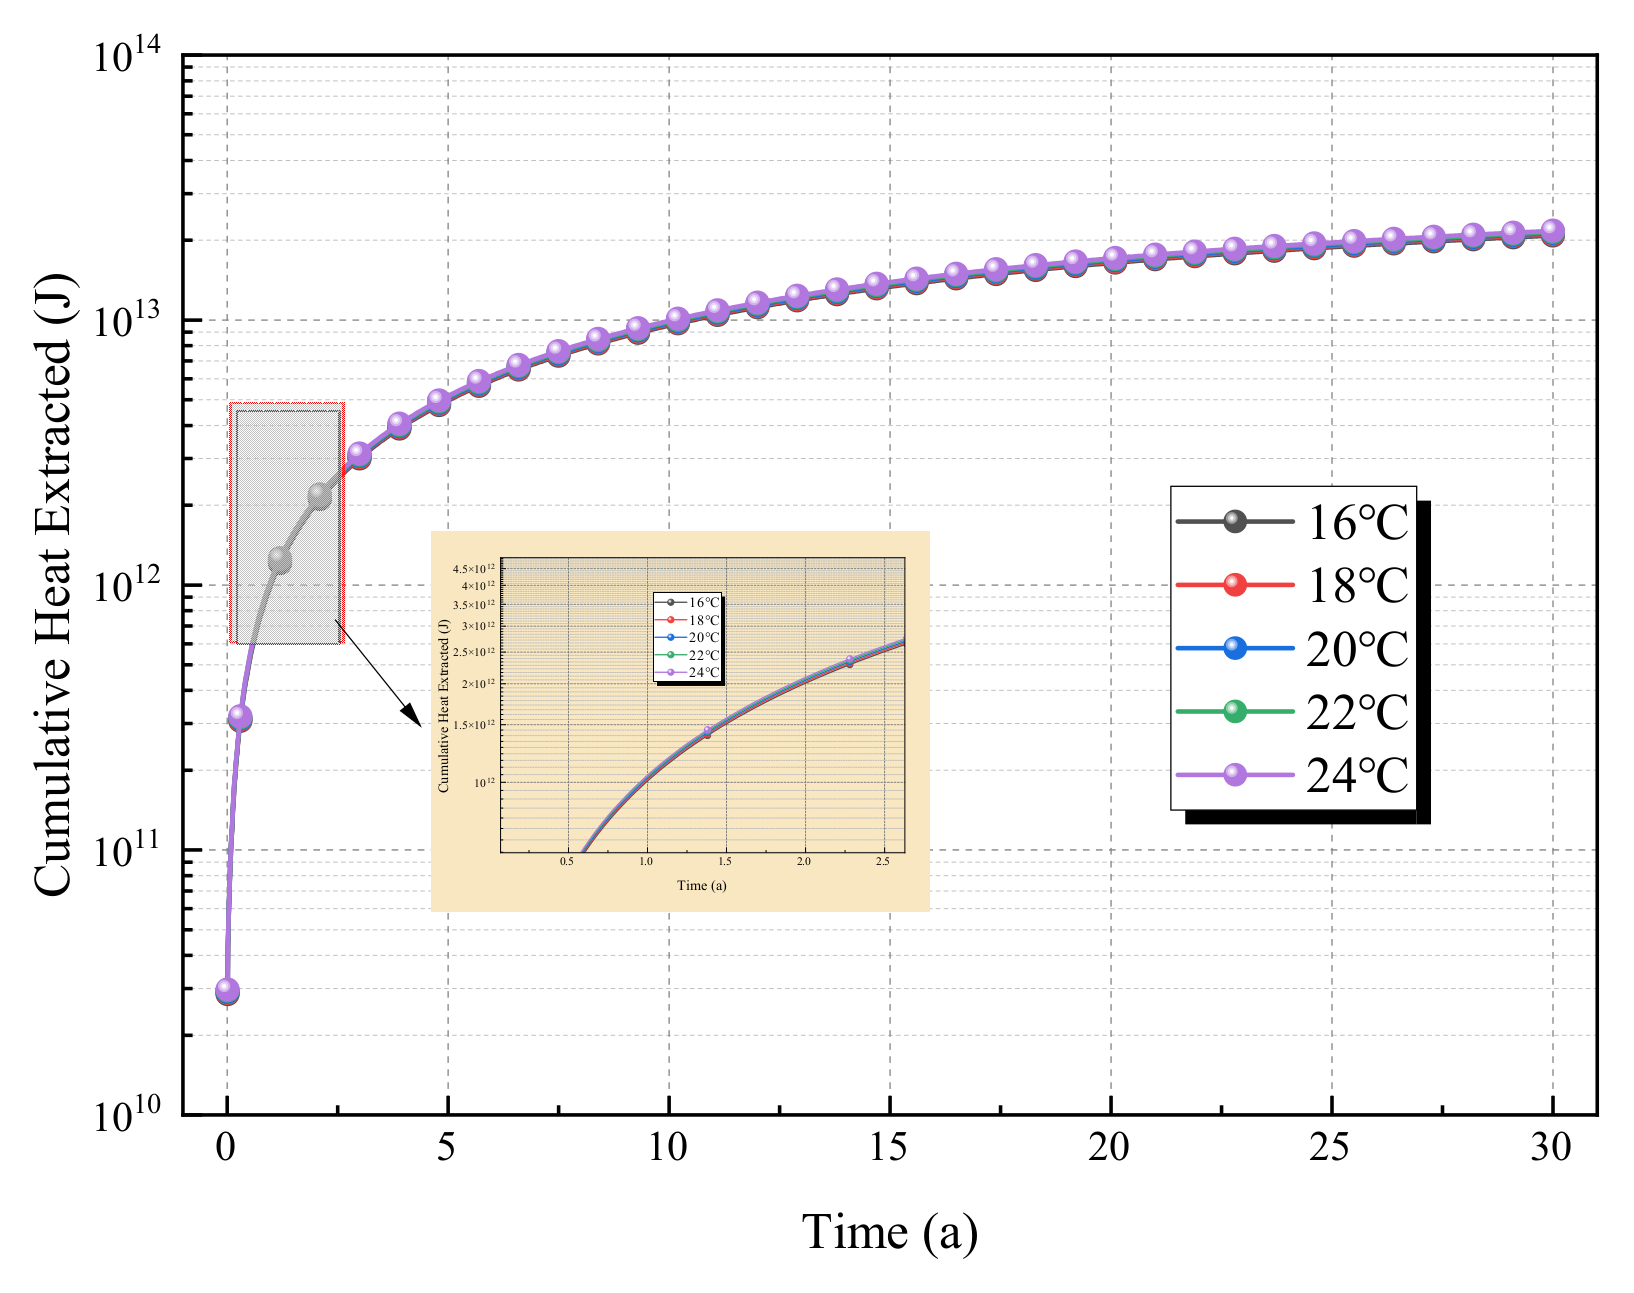
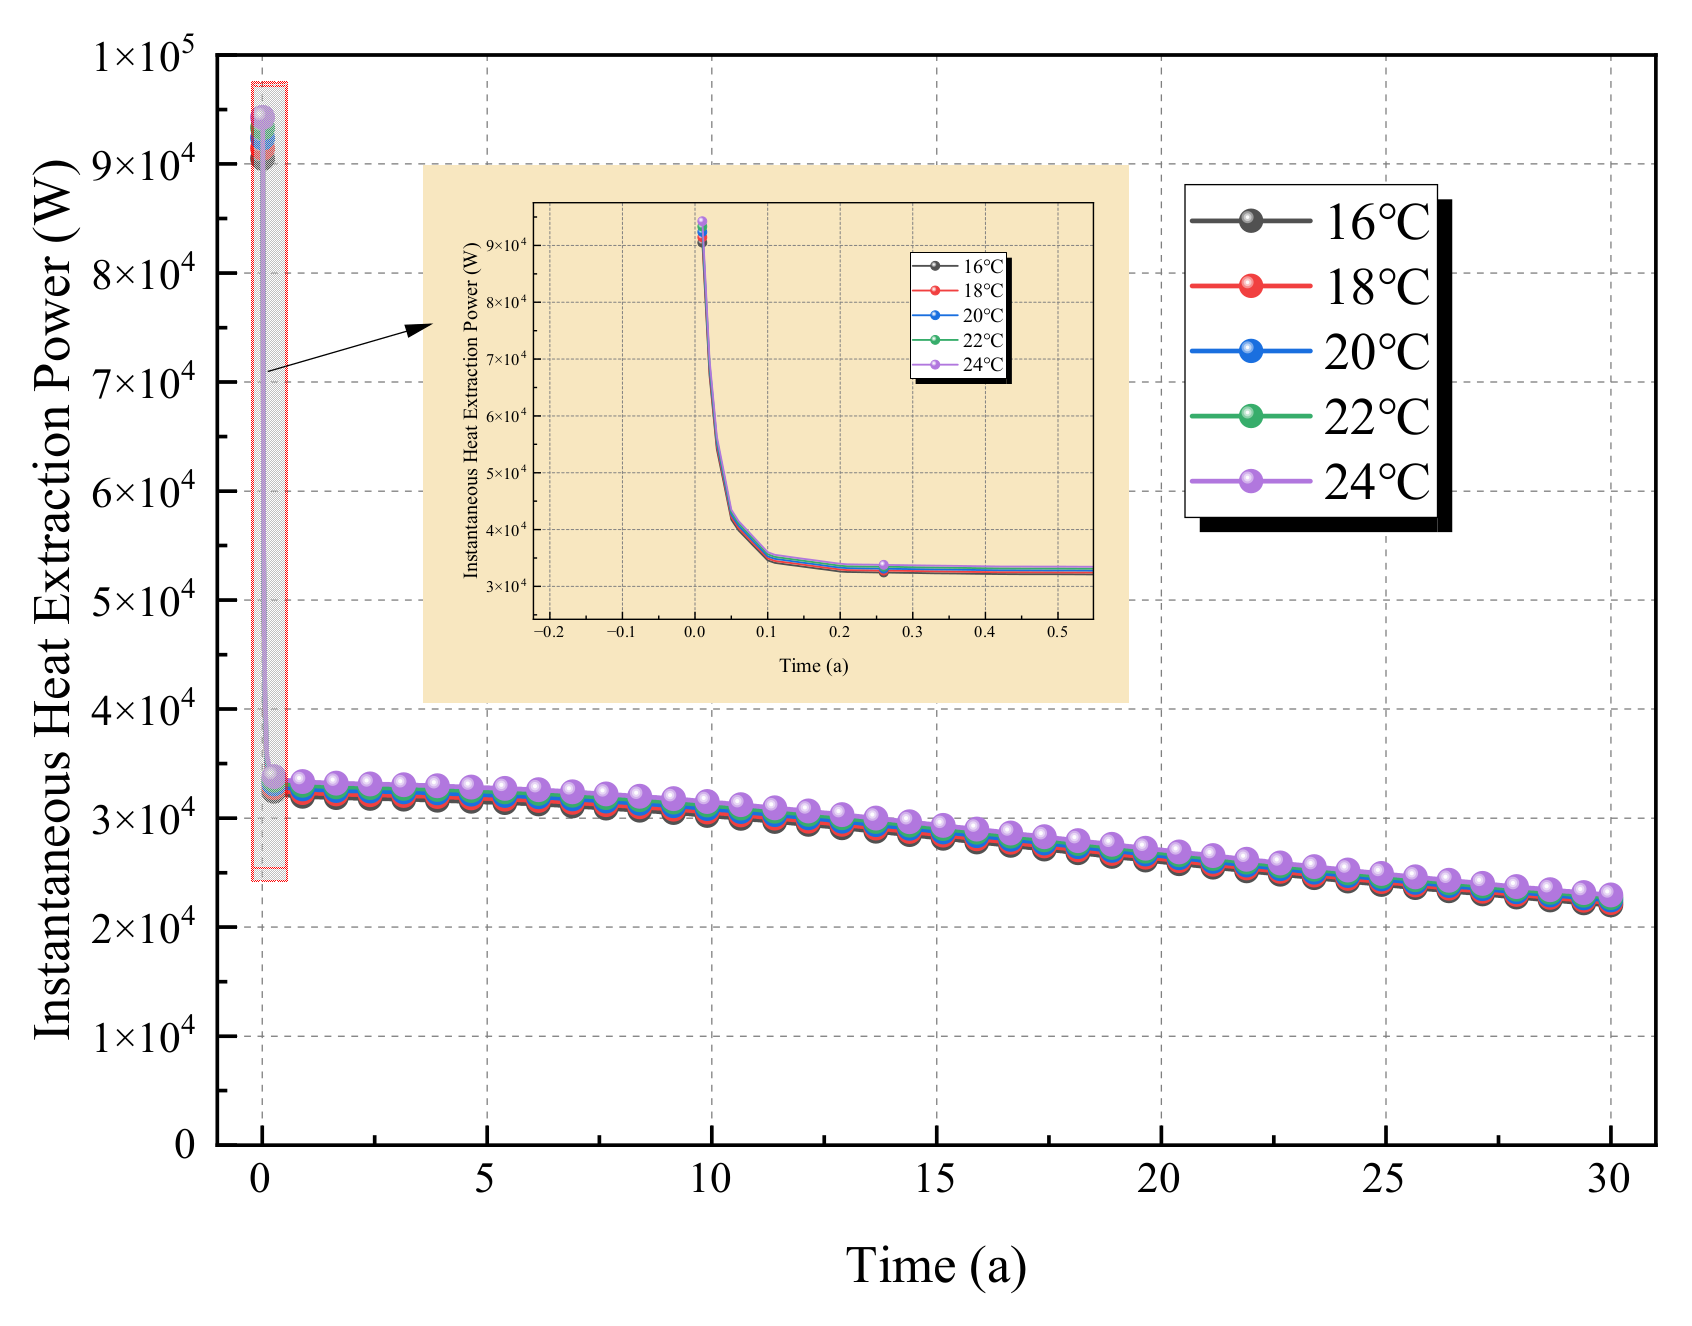
These two figures present the evolution laws of heat extraction efficiency under different injection temperatures (16 °C, 18 °C, 20 °C, 22 °C, 24 °C) from the perspectives of long-term heat gain and instantaneous heat production intensity, respectively (
Figure 13 and
Figure 14). Under all injection temperatures, the cumulative heat extraction continuously increases over time and gradually approaches saturation. The overlapping curves indicate that within the normal temperature range of 16–24 °C, the regulatory effect of injection temperature on long-term cumulative heat extraction is extremely weak. The temperature difference between the injection temperature (16–24 °C) and the initial reservoir temperature is sufficiently large, so thermal convection is dominated by the “strong temperature difference between the high reservoir temperature and normal injection temperature” rather than minor differences in injection temperature (e.g., only an 8 °C difference between 16 °C and 24 °C), leading to the convergence of long-term cumulative heat extraction.
The initial heat extraction power is high, followed by continuous attenuation. The overlapping curves show that within the 16–24 °C range, the influence of injection temperature on the dynamic evolution of instantaneous heat production intensity is consistent. In the early extraction stage, the strong temperature difference drives rapid fluid seepage, and the thermal convection efficiency reaches a relatively high level; the marginal impact of minor changes in injection temperature (16–24 °C) on the “seepage–thermal convection” coupling process is negligible. Therefore, the initial peak value and attenuation trend of instantaneous power both show overlap.
Within the normal temperature range of 16–24 °C, due to the sufficiently large temperature difference with the high reservoir temperature, the regulatory effect of injection temperature on heat extraction efficiency (cumulative heat extraction, instantaneous power) is extremely insignificant, as reflected by overlapping curves. This means that in practical engineering, if the injection water is at normal temperature (e.g., groundwater, surface water), there is no need to overemphasize its minor temperature fluctuations; the optimization of heat extraction efficiency should focus more on core parameters such as injection–production pressure difference and well spacing. The “insensitivity” of injection temperature within this range also provides flexibility in the selection of injection water for geothermal projects—as long as normal temperature conditions are met, stable heat extraction effects can be achieved.
4.4. Influence of Well Spacing on Heat Extraction Efficiency of Geothermal Systems
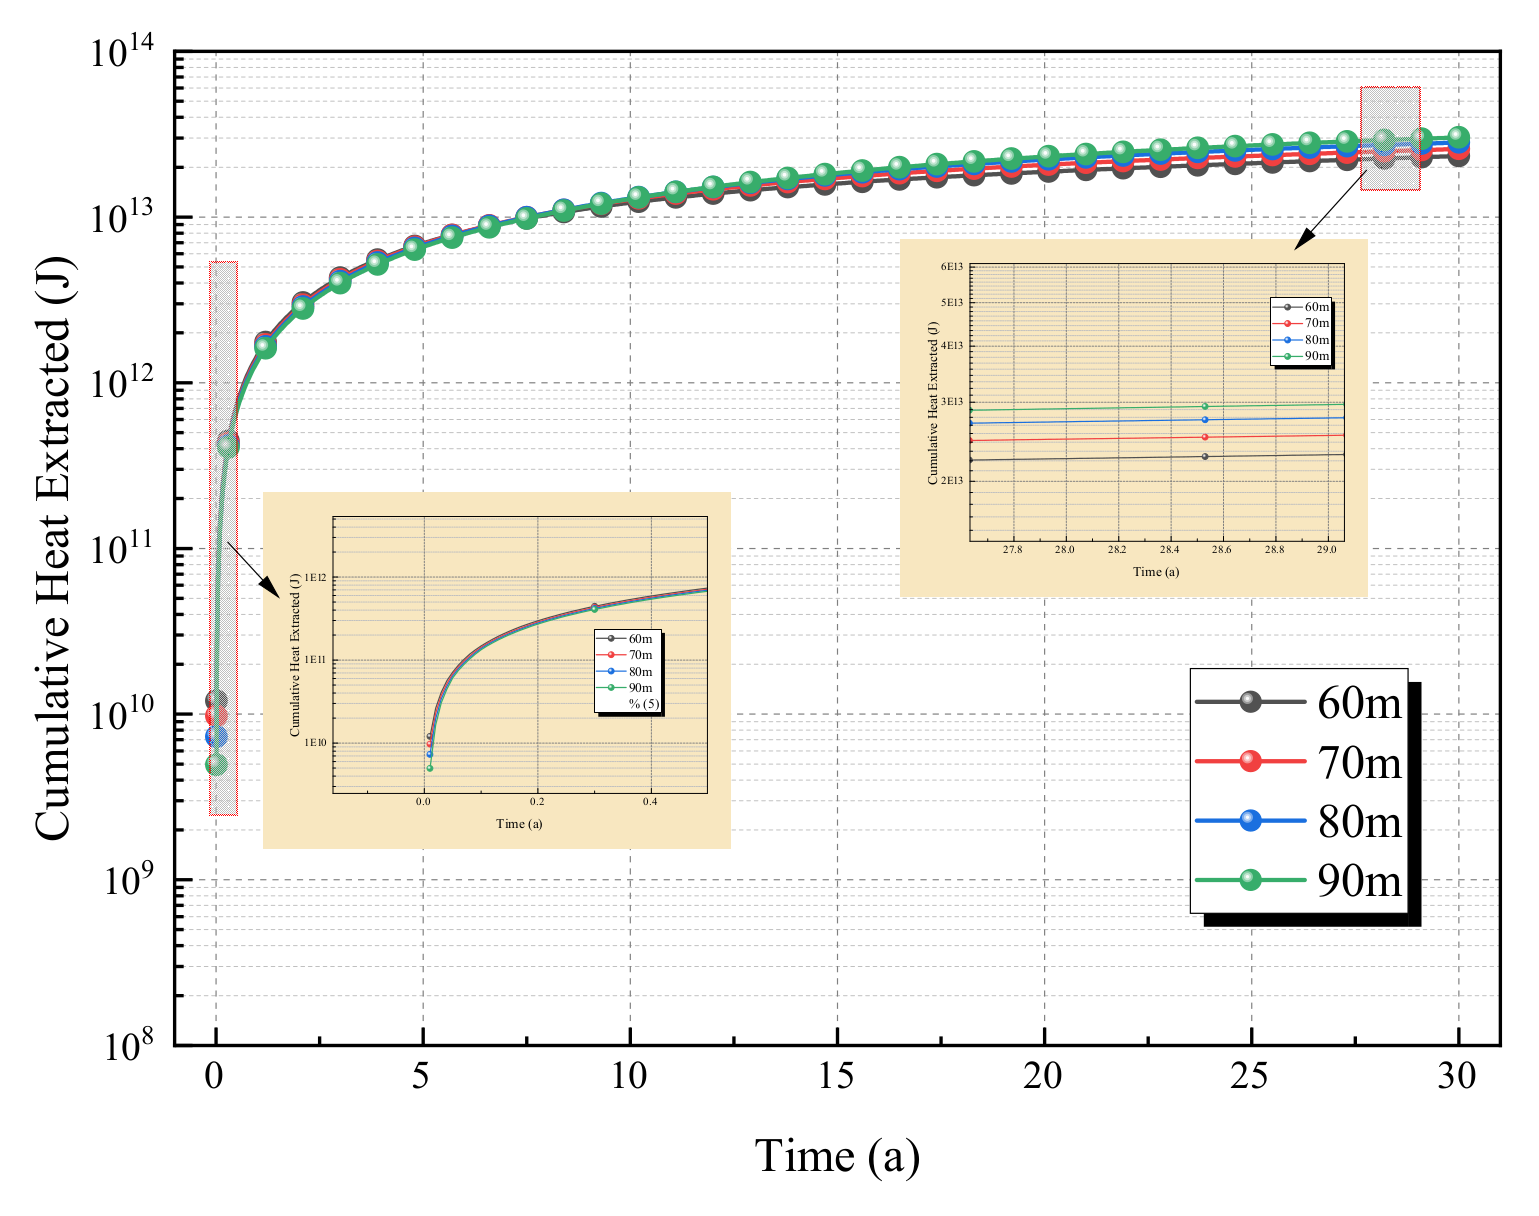
To quantify the macroscopic regulation mechanism of well spacing on heat transfer and thermal convection processes in geothermal reservoirs, this section focuses on the spatial coupling effect between well spacing and the geothermal reservoir temperature field. THM coupled simulations are conducted with a fixed injection temperature of 20 °C, a fixed injection–production pressure difference of 8 MPa, and a well spacing gradient (60 m, 70 m, 80 m, 90 m).
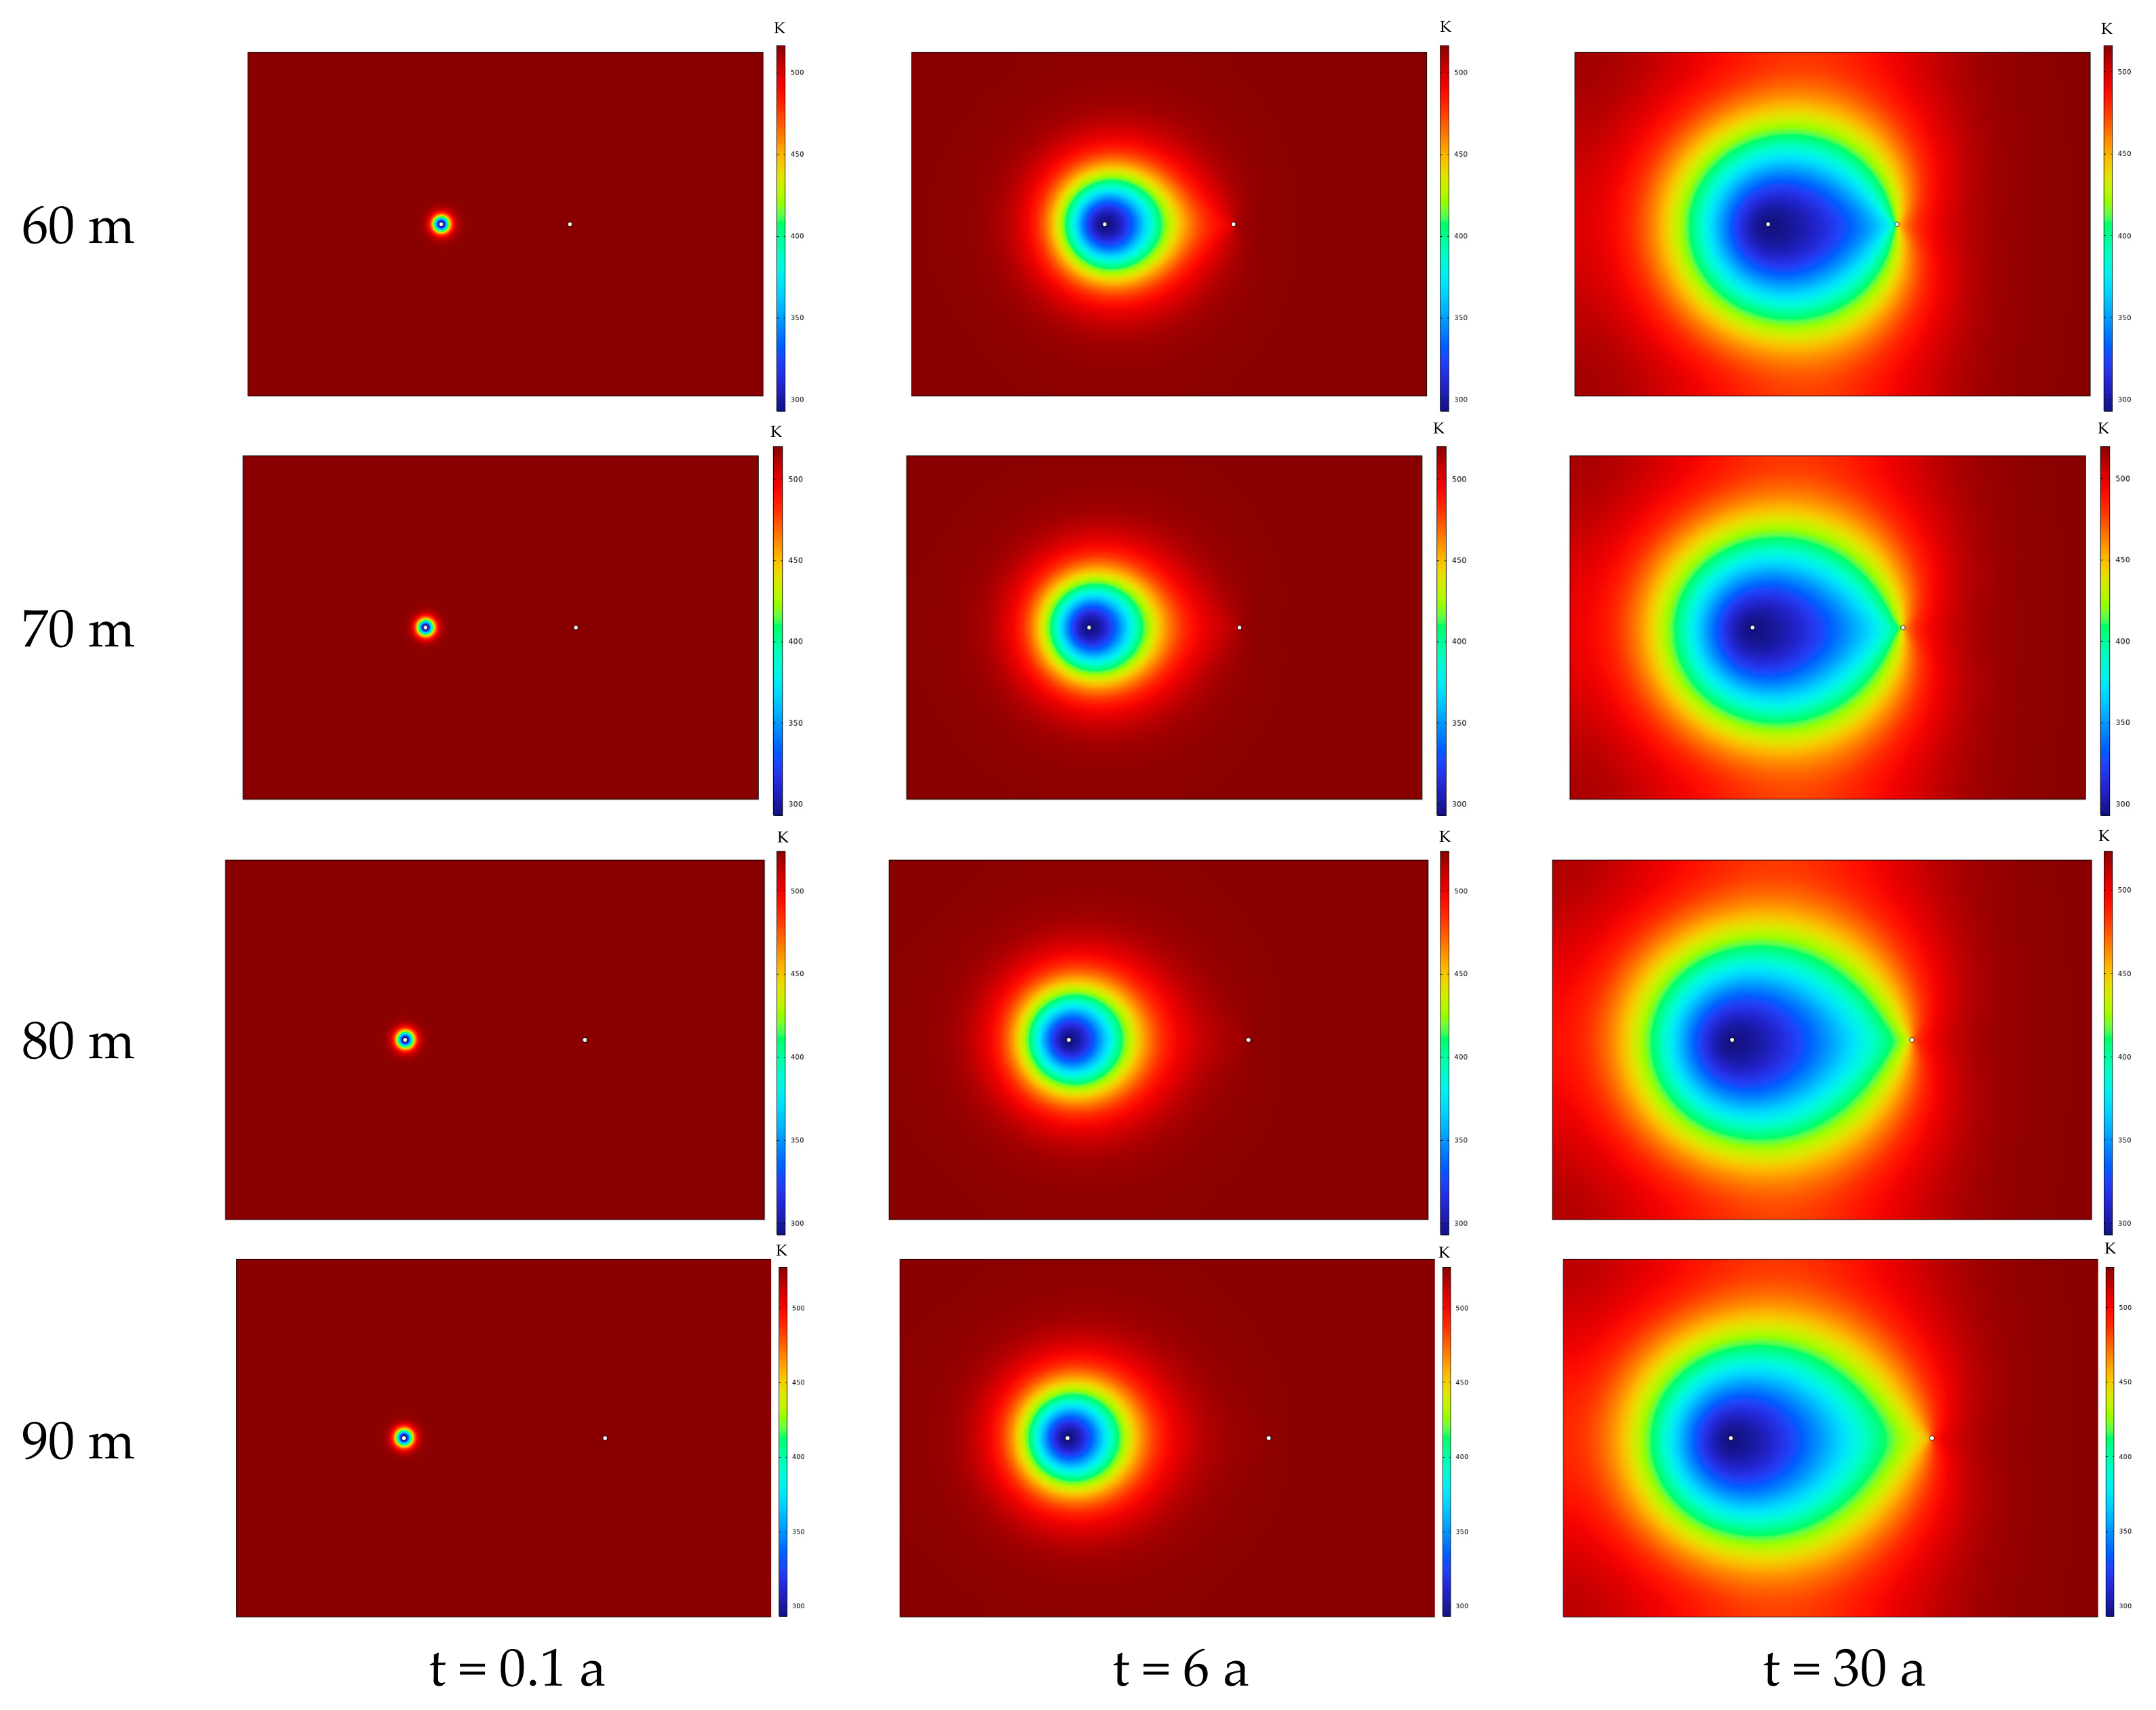
As can be seen from
Figure 15 and
Figure 16 the well spacing directly affects the range of thermal convection between injection and production wells and the expansion rate of the cold zone:
- -
Early extraction stage (t = 0.1 a): Under all well spacings, the cold zone is confined to the vicinity of the injection well, with no significant differences (thermal convection has just started, and the spatial effect of well spacing has not been fully manifested).
- -
Middle extraction stage (t = 6 a): The smaller the well spacing, the wider the expansion range of the cold zone. For example, the radius of the blue low-temperature zone at a well spacing of 60 m is significantly larger than that at 90 m, indicating that smaller well spacing results in shorter seepage paths between injection and production wells, higher thermal convection efficiency, and faster advancement of the cold water front.
- -
Late extraction stage (t = 30 a): The cold zone at a well spacing of 60 m almost penetrates the entire area between the injection and production wells, while the cold zone range at 90 m is relatively small. This shows that smaller well spacing leads to faster reservoir heat consumption and a more rapid thermal depletion process.
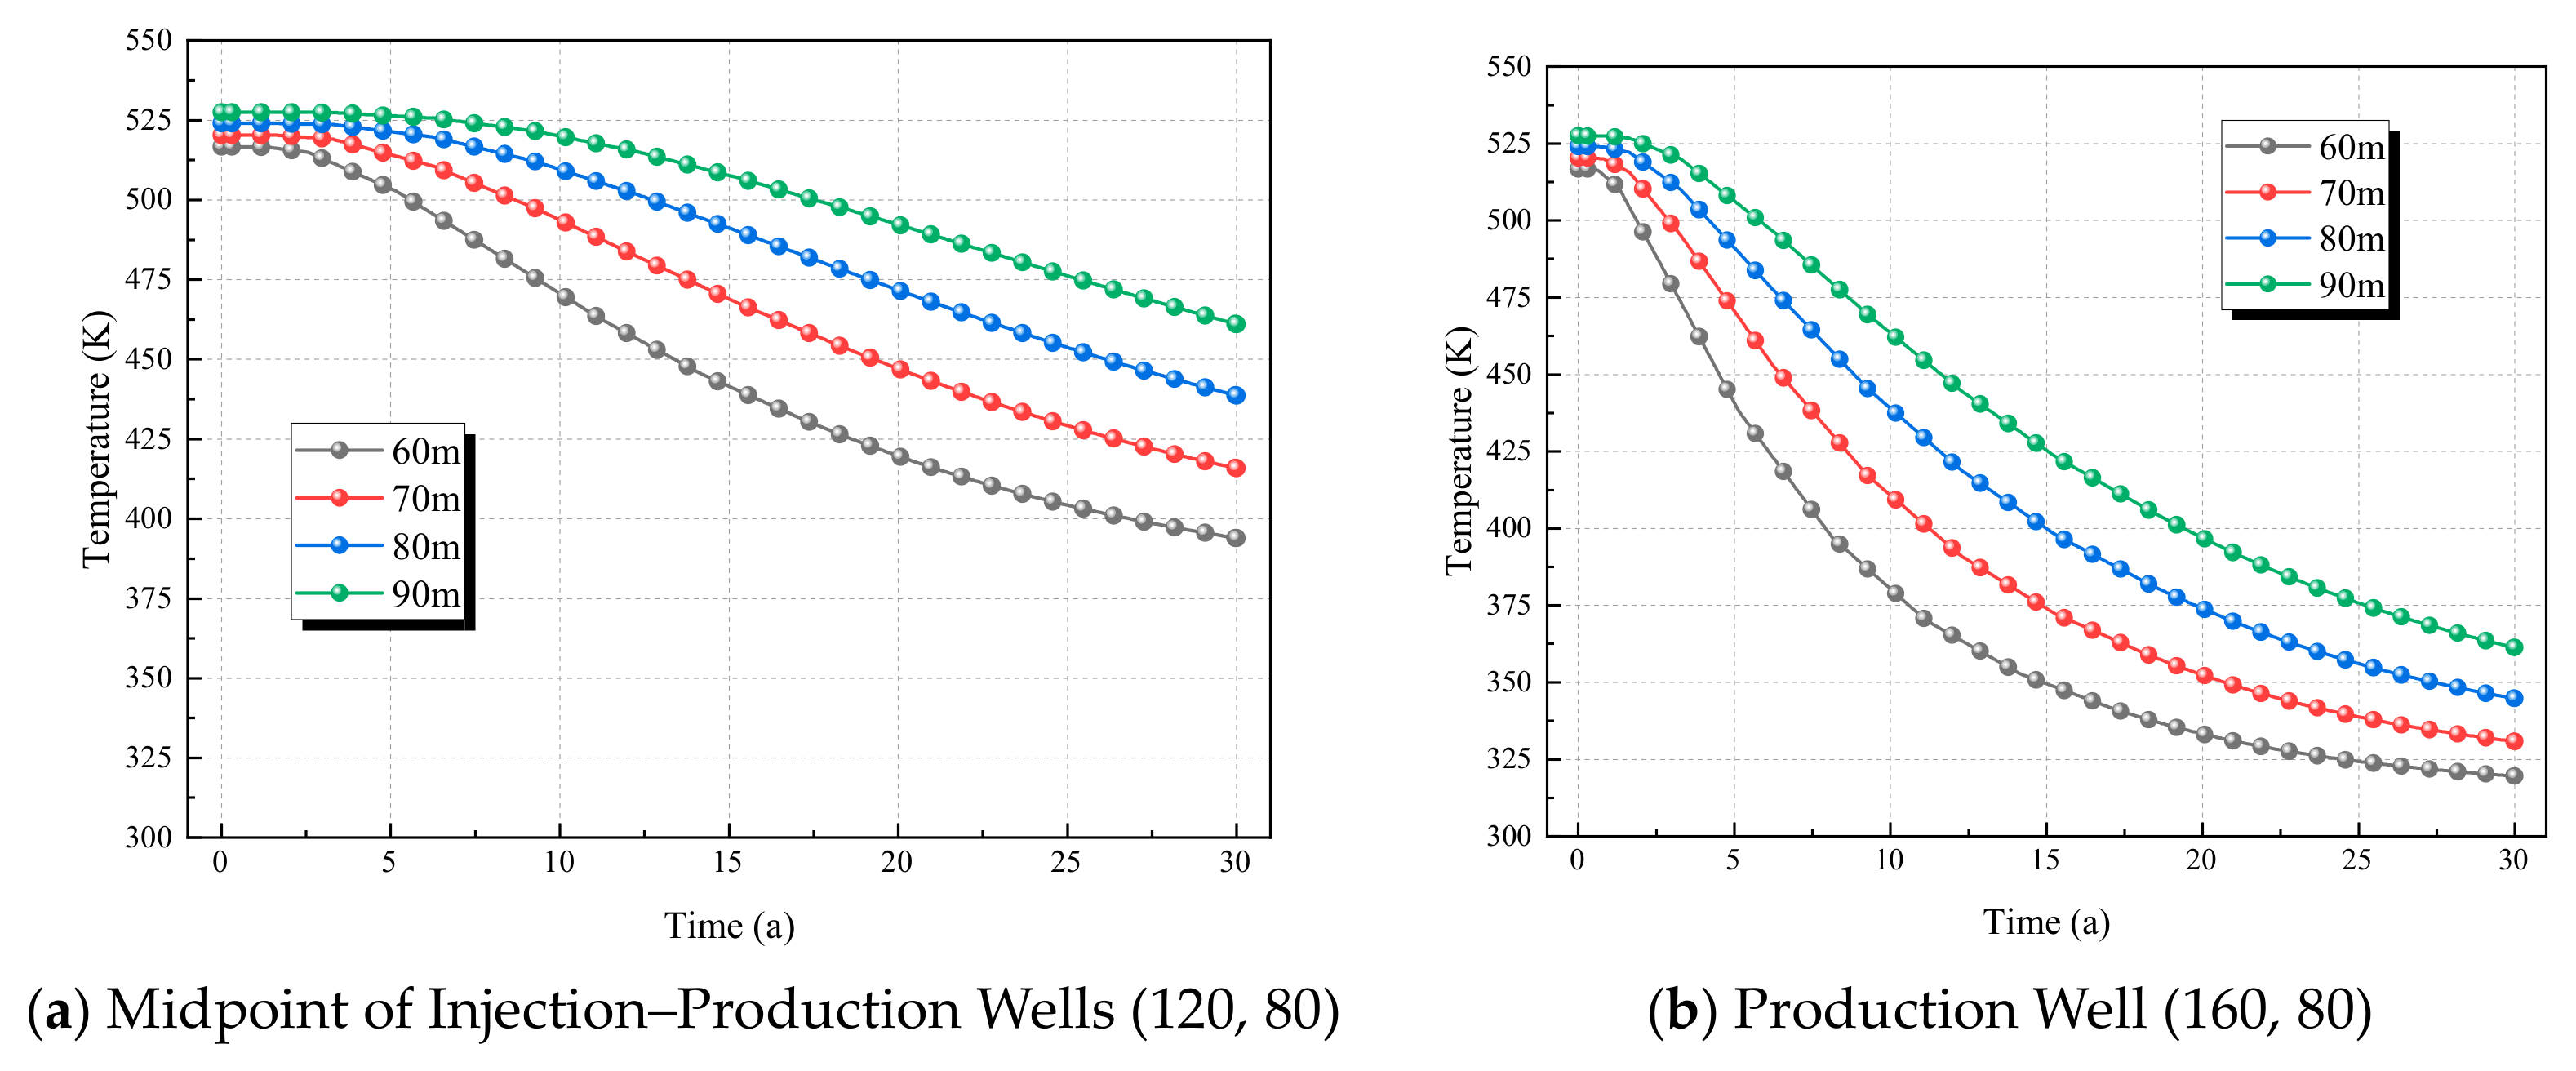
Under all well spacings, the midpoint temperature decreases continuously over time, and the smaller the well spacing, the faster the temperature drop rate. For example, at a well spacing of 60 m (gray curve), the temperature drops from approximately 525 K to below 400 K after 30 years, while at 90 m (green curve), it only drops from 525 K to around 450 K during the same period. The production well follows the same law as the midpoint: the temperature decreases continuously over time, but the production well temperature is always higher than the midpoint temperature (the production well temperature is 20–50 K higher than the midpoint temperature at the same time). For instance, after 30 years, the production well temperature at a well spacing of 60 m is approximately 325 K, while the midpoint temperature is only below 400 K.
In summary, well spacing is a core spatial parameter for regulating the heat extraction efficiency of geothermal systems: smaller well spacing leads to higher short-term heat extraction efficiency but poorer long-term stability; larger well spacing results in lower short-term efficiency but better long-term sustainability. This law provides a quantitative basis for the “optimized spacing design” of geothermal well patterns.
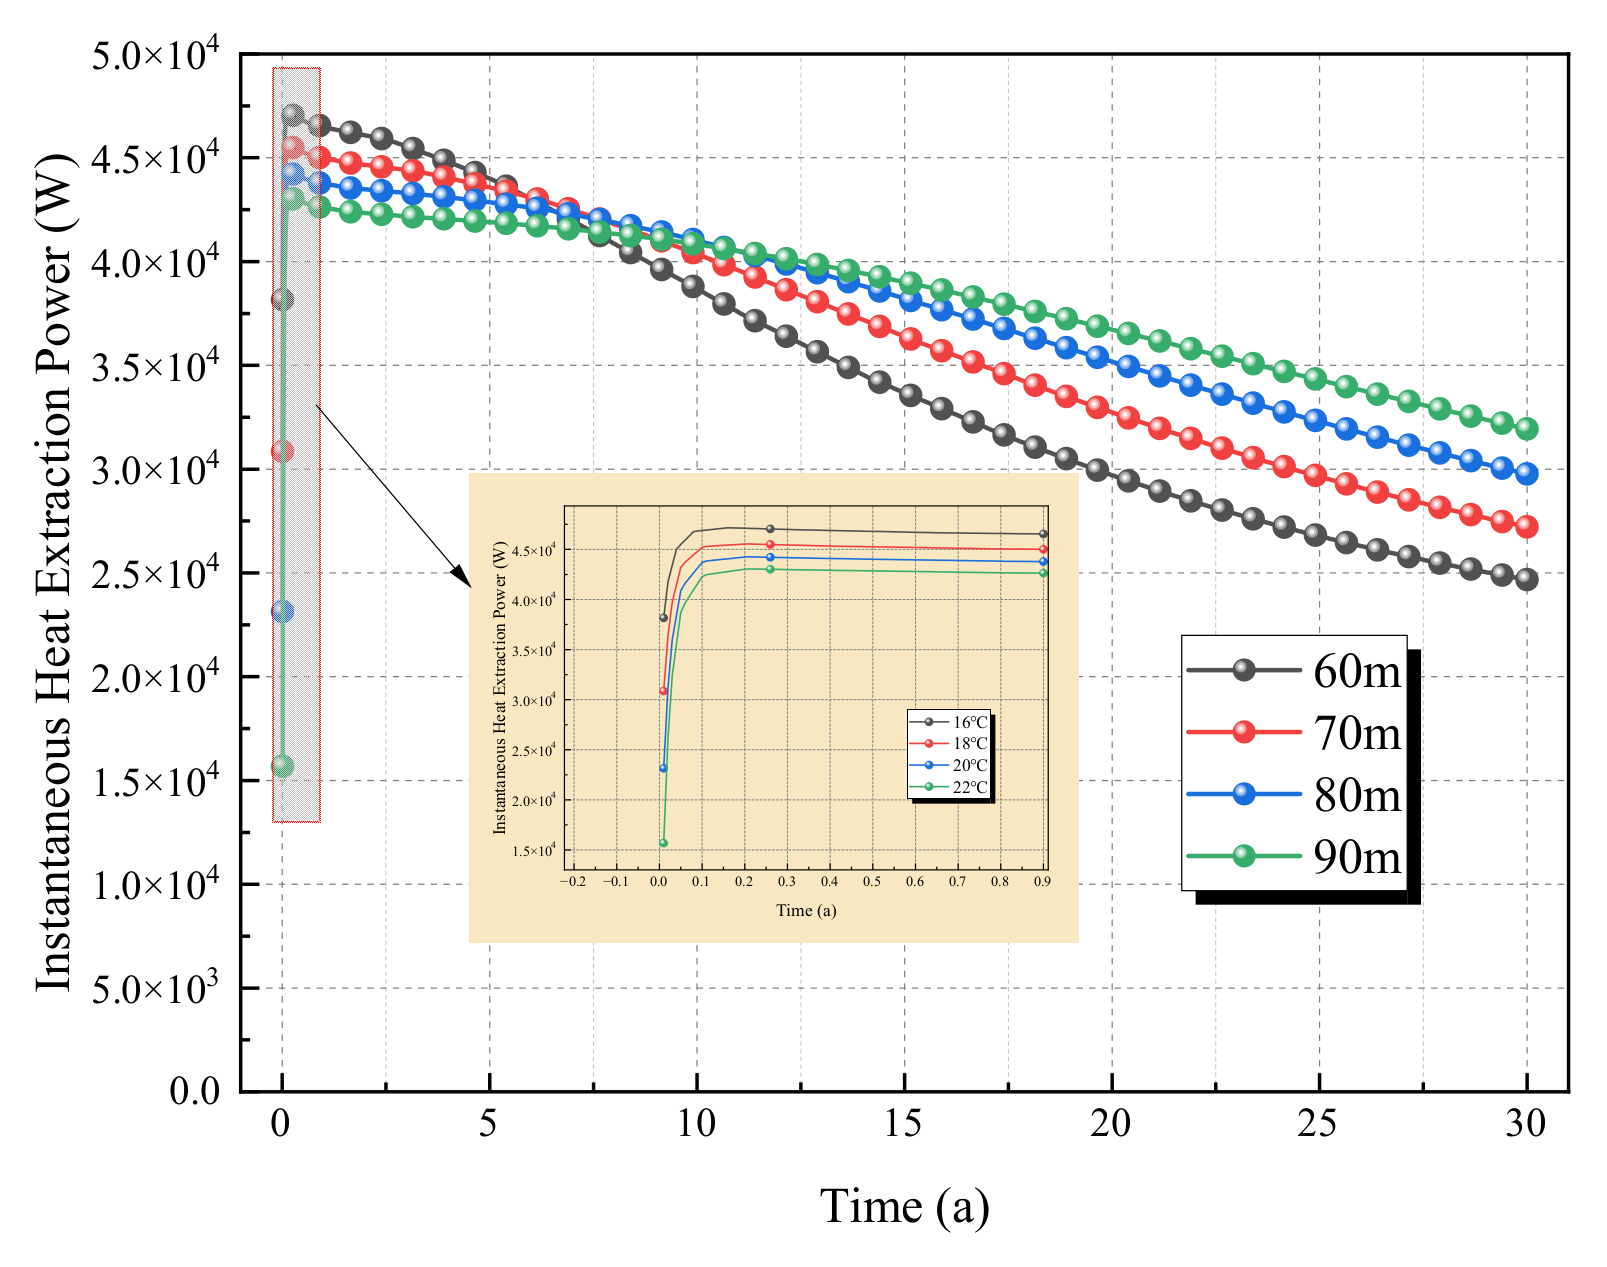
As can be seen from
Figure 17 and
Figure 18 the smaller well spacing leads to a higher initial peak of instantaneous power and faster attenuation. For example, at a well spacing of 60 m (gray curve), the initial power can reach 4.75 × 10
4 W, but it rapidly attenuates to approximately 3 × 10
4 W after 30 years; in contrast, at 90 m (green curve), the initial power is about 4.45 × 10
4 W, with relatively gentle attenuation. Mechanism: Smaller well spacing results in shorter seepage paths between injection and production wells, a stronger driving force for thermal convection, and higher initial heat production power; however, rapid reservoir heat consumption leads to rapid power attenuation. The “short-term heat production advantage” of small well spacing diminishes rapidly over time, while the “long-term stability” of large well spacing becomes more prominent.
The cumulative heat extraction continuously increases over time and gradually approaches saturation. The final cumulative amount at large well spacing (90 m) is significantly higher than that at small well spacing (60 m). For example, after 30 years, the cumulative heat extraction at 90 m is close to 2.97 × 10¹³ J, while it is approximately 2.21 × 10¹³ J at 60 m. Growth rate: In the early stage (0–5 years, enlarged view), the cumulative amount at small well spacing increases extremely rapidly, while the growth at large well spacing is relatively slow. In the later stage (10–30 years), the growth of the cumulative amount at small well spacing tends to stagnate (due to thermal depletion), while large well spacing still maintains stable growth and eventually surpasses the cumulative amount at small well spacing. Mechanism: The high instantaneous power at small well spacing drives the rapid rise of cumulative amount in the early stage; however, the reservoir heat is quickly exhausted, leading to stagnant growth in the later stage; large well spacing results in slow reservoir heat consumption, sustainable long-term growth, and ultimately higher total gain.
In summary, by regulating the “intensity of thermal convection and the rate of reservoir heat consumption”, well spacing exhibits the law of “high short-term efficiency but rapid long-term attenuation for small well spacing, and moderate short-term performance but higher long-term total gain for large well spacing” in terms of both instantaneous heat production intensity and long-term heat accumulation.
