Article

Numerical Analysis of Thermal Performance of PCM-Containing Honeycomb Wallboard for Building Energy Harvesting

1
State Key Laboratory of Simulation and Regulation of Water Cycle in River Basin, China Institute of Water Resources and Hydropower Research, Beijing 100038, China
2
College of Science, China Agricultural University, Beijing 100083, China
3
National Center for International Research on Deep Earth Drilling and Resource Development, Faculty of Engineering, China University of Geosciences, Wuhan 430074, China
4
Department of Ocean Science and Engineering, Southern University of Science and Technology, Shenzhen 518055, China
*
Authors to whom correspondence should be addressed.
Energies 2025, 18(21), 5720; https://doi.org/10.3390/en18215720
Submission received: 23 September 2025 / Revised: 12 October 2025 / Accepted: 21 October 2025 / Published: 30 October 2025

Abstract

This study investigates a wallboard integrating encapsulated phase change materials (PCMs) within aluminum honeycomb cells to reduce building energy consumption. The thermal performance of a concrete wall enhanced with this PCM-honeycomb composite was evaluated under varying weather conditions through a two-dimensional heat transfer model. The thermal improvement of PCM is revealed in a comparative analysis of three distinct building envelope materials, i.e., concrete, concrete covered by the honeycomb wallboard, and concrete covered by the honeycomb wallboard containing PCMs. The results demonstrated that the PCM-honeycomb wallboard effectively delays and reduces peak cooling loads. The proposed system lowered building energy consumption by 28.46% and 32.12% in energy consumption over the entire summer season (and 5.76% and 6.27% over one year), respectively, compared to these reference cases. Among the tested PCMs, RT25 was identified as the most effective. The results confirm that incorporating PCM-infused honeycomb wallboards into building envelopes is a viable strategy for passive, year-round temperature regulation.

1. Introduction

Against the backdrop of increasingly prominent environmental challenges and a marked surge in global energy consumption and carbon emissions in recent years [1], solar energy has emerged as a highly sought-after solution to address these pressing issues. As a renewable, abundant, and clean energy source, it has garnered immense demand in modern society [2], alongside other renewable energy sources such as wind energy. Solar energy is even projected to become the dominant source of electricity globally [3]. However, its inherent discontinuity and volatility due to diurnal cycles and weather variations lead to unstable energy output, hindering its efficient utilization. To address these challenges, thermal energy storage (TES) provides a viable technical pathway by capturing and storing solar energy as heat in storage devices, and releasing it when needed. Though sensible heat TES is currently the most widely used commercial method, latent heat TES boasts a higher energy density and smaller storage requirements. The high thermal efficiency and isothermal property of phase change materials (PCMs) make latent heat energy storage a promising technology for energy storage [4,5,6].
Given that buildings account for over 40% of global energy consumption, researchers have increasingly focused on enhancing building energy efficiency and indoor thermal comfort [7,8,9,10,11,12] in recent years. Among the various technologies, the integration of PCMs into building materials for energy storage systems has made significant contributions to the advancement of energy-efficient buildings [13,14,15,16,17]. Alawadhi et al. [18] and Kant et al. [19] investigated the thermal behavior of PCMs encapsulated in the cylindrical cavities of building bricks via numerical simulation, observing a marked reduction in indoor heat flux following the incorporation of PCMs into the bricks. Similarly, Silva et al. [20] investigated the effect of PCM incorporation into hollow bricks on the attenuation of the indoor temperature, both experimentally and numerically. However, a key drawback of introducing cavities into bricks for PCM encapsulation is a reduction in the mechanical strength of building walls—particularly when the number of cavities is increased to enhance thermal performance [19]. Therefore, the PCM panel can be applied to the surface of the building envelope. Wang et al. [21] developed a concrete wall with a glass window and examined the impact of the PCM layer on reducing heat load at different positions. Their findings indicate the optimal performance with a 20 mm RT42 layer placed externally on the wall, resulting in a 34.9% reduction in heat rate. Fateh et al. [22] conducted a comparable study, yielding consistent insights into the efficacy of surface-applied PCM layers for building thermal regulation.
Unfortunately, the inherently low thermal conductivity of most PCMs impedes heat transfer, resulting in reduced charging and discharging rates. This not only prolongs the system’s response time but also undermines its intended thermal regulation efficacy [23]. To address this limitation, researchers have added nanoparticles with high thermal conductivity [24,25] and incorporated metal matrices, including porous foam [26,27] and fin structures [28,29,30], into PCMs. Notably, among these strategies, researchers have adopted bionic honeycomb fins (inspired by natural structures) and successfully applied this design to battery thermal management [31], building thermal management systems, and others [32,33]. Lai et al. [34] constructed a prototype utilizing aluminum honeycomb wallboard with encapsulated PCMs, presenting an experimental investigation into the heat transfer characteristics and heat storage capacity of this structure under varying heat flow boundary conditions. Wang et al. [35] experimentally examined the effect of indoor conditions on the thermal behavior of PCM honeycomb wallboard, finding effective operations under the forced convection condition. Additionally, Hasse et al. [36] studied the short-term heat storage in honeycomb panels and experimentally demonstrated the effectiveness of latent heat storage within the structure.
Different PCMs exhibit distinct phase change temperatures. Ideally, to fully leverage the efficiency of PCMs, a fundamental principle is to ensure the operating temperature exceeds the PCM’s phase change temperature. Yet, a subset of existing studies entirely overlooks this critical requirement [37]. Furthermore, to minimize a building’s energy consumption, it is also crucial to consider the indoor comfortable temperature. When the phase change temperature aligns with the indoor comfortable temperature, it minimizes annual energy flux and temperature fluctuations [38].
Until now, in the field of building engineering, the thermal performance of honeycomb wallboard with PCMs has been predominantly explored through experimental methods. However, these experiments mainly focused on the honeycomb structure itself, rather than on the integrated building walls. The high cost of comprehensive wall-level experiments has constrained the research scope, resulting in an incomplete understanding of how PCM-honeycomb wallboards perform when integrated into full building envelopes. Therefore, numerical simulations are essential to complement the experimental research. Nevertheless, the majority of studies on the thermal analysis of PCMs in buildings have overlooked the natural convection effect of PCMs. This oversight has consequently restricted the accuracy of relevant models. Moreover, previous numerical studies on this subject have been plagued by limited and monotonous boundary conditions. This shortcoming has restricted the ability to accurately capture the complex thermal behaviors that occur under real world scenarios. As a result, a comprehensive numerical study that analyzes the thermal performance under diverse external environmental conditions is still remarkably scarce.
This study investigates the thermal performance of a building wall integrated with a honeycomb-structured PCM wallboard on its exterior. The design leverages a high-conductivity internal fin structure with low solar absorptivity to shield the building from external heat while efficiently transferring and storing thermal energy in the PCM. A cyclic thermal storage and release model is developed to enhance indoor comfort and building energy efficiency. To this end, we adopt the sensible heat capacity method, a widely used approach for phase change analysis in building thermal systems. This method simplifies the energy equation by treating temperature as the sole variable, approximating heat capacity near the phase change temperature with a tailored nonlinear curve. Specifically, the Gaussian function, which is characterized as an extremely narrow, high-magnitude function with an integral of 1, is employed to represent the latent heat release/absorption at the phase change point. This ensures continuity and smoothness within a small temperature interval (ΔT) around the melting point, effectively simulating latent heat as a sharp increase in heat capacity. Such simplification enables direct and efficient computations, and is readily implementable in commercial finite element software, which is critical for modeling the cyclic thermal storage and release behavior of our PCM-honeycomb system. This paper is structured as follows: Section 2 introduces the computational model, including geometry, material properties, and boundary conditions. Section 3 establishes the mathematical formulation for the phase change process, detailing the application of the sensible heat capacity method. Section 4 validates the finite element simulation against relevant literature. Finally, the energy storage efficiency of four structural configurations and the thermal performance of three PCM-based envelopes are evaluated, with parametric analysis conducted to identify the optimal phase transition temperature.

2. Computational Model

Figure 1 presents a prototype of a honeycomb-like wallboard constructed from an aluminum alloy that incorporates PCM and operates on a diurnal cycle for passive thermal regulation. During the daytime, it rejects most solar radiation while absorbing a fraction, which is then transferred via the conductive fins to charge the PCM. As ambient temperatures fall at night, the PCM discharges, with the fins dissipating the stored latent heat into the room to augment thermal comfort.
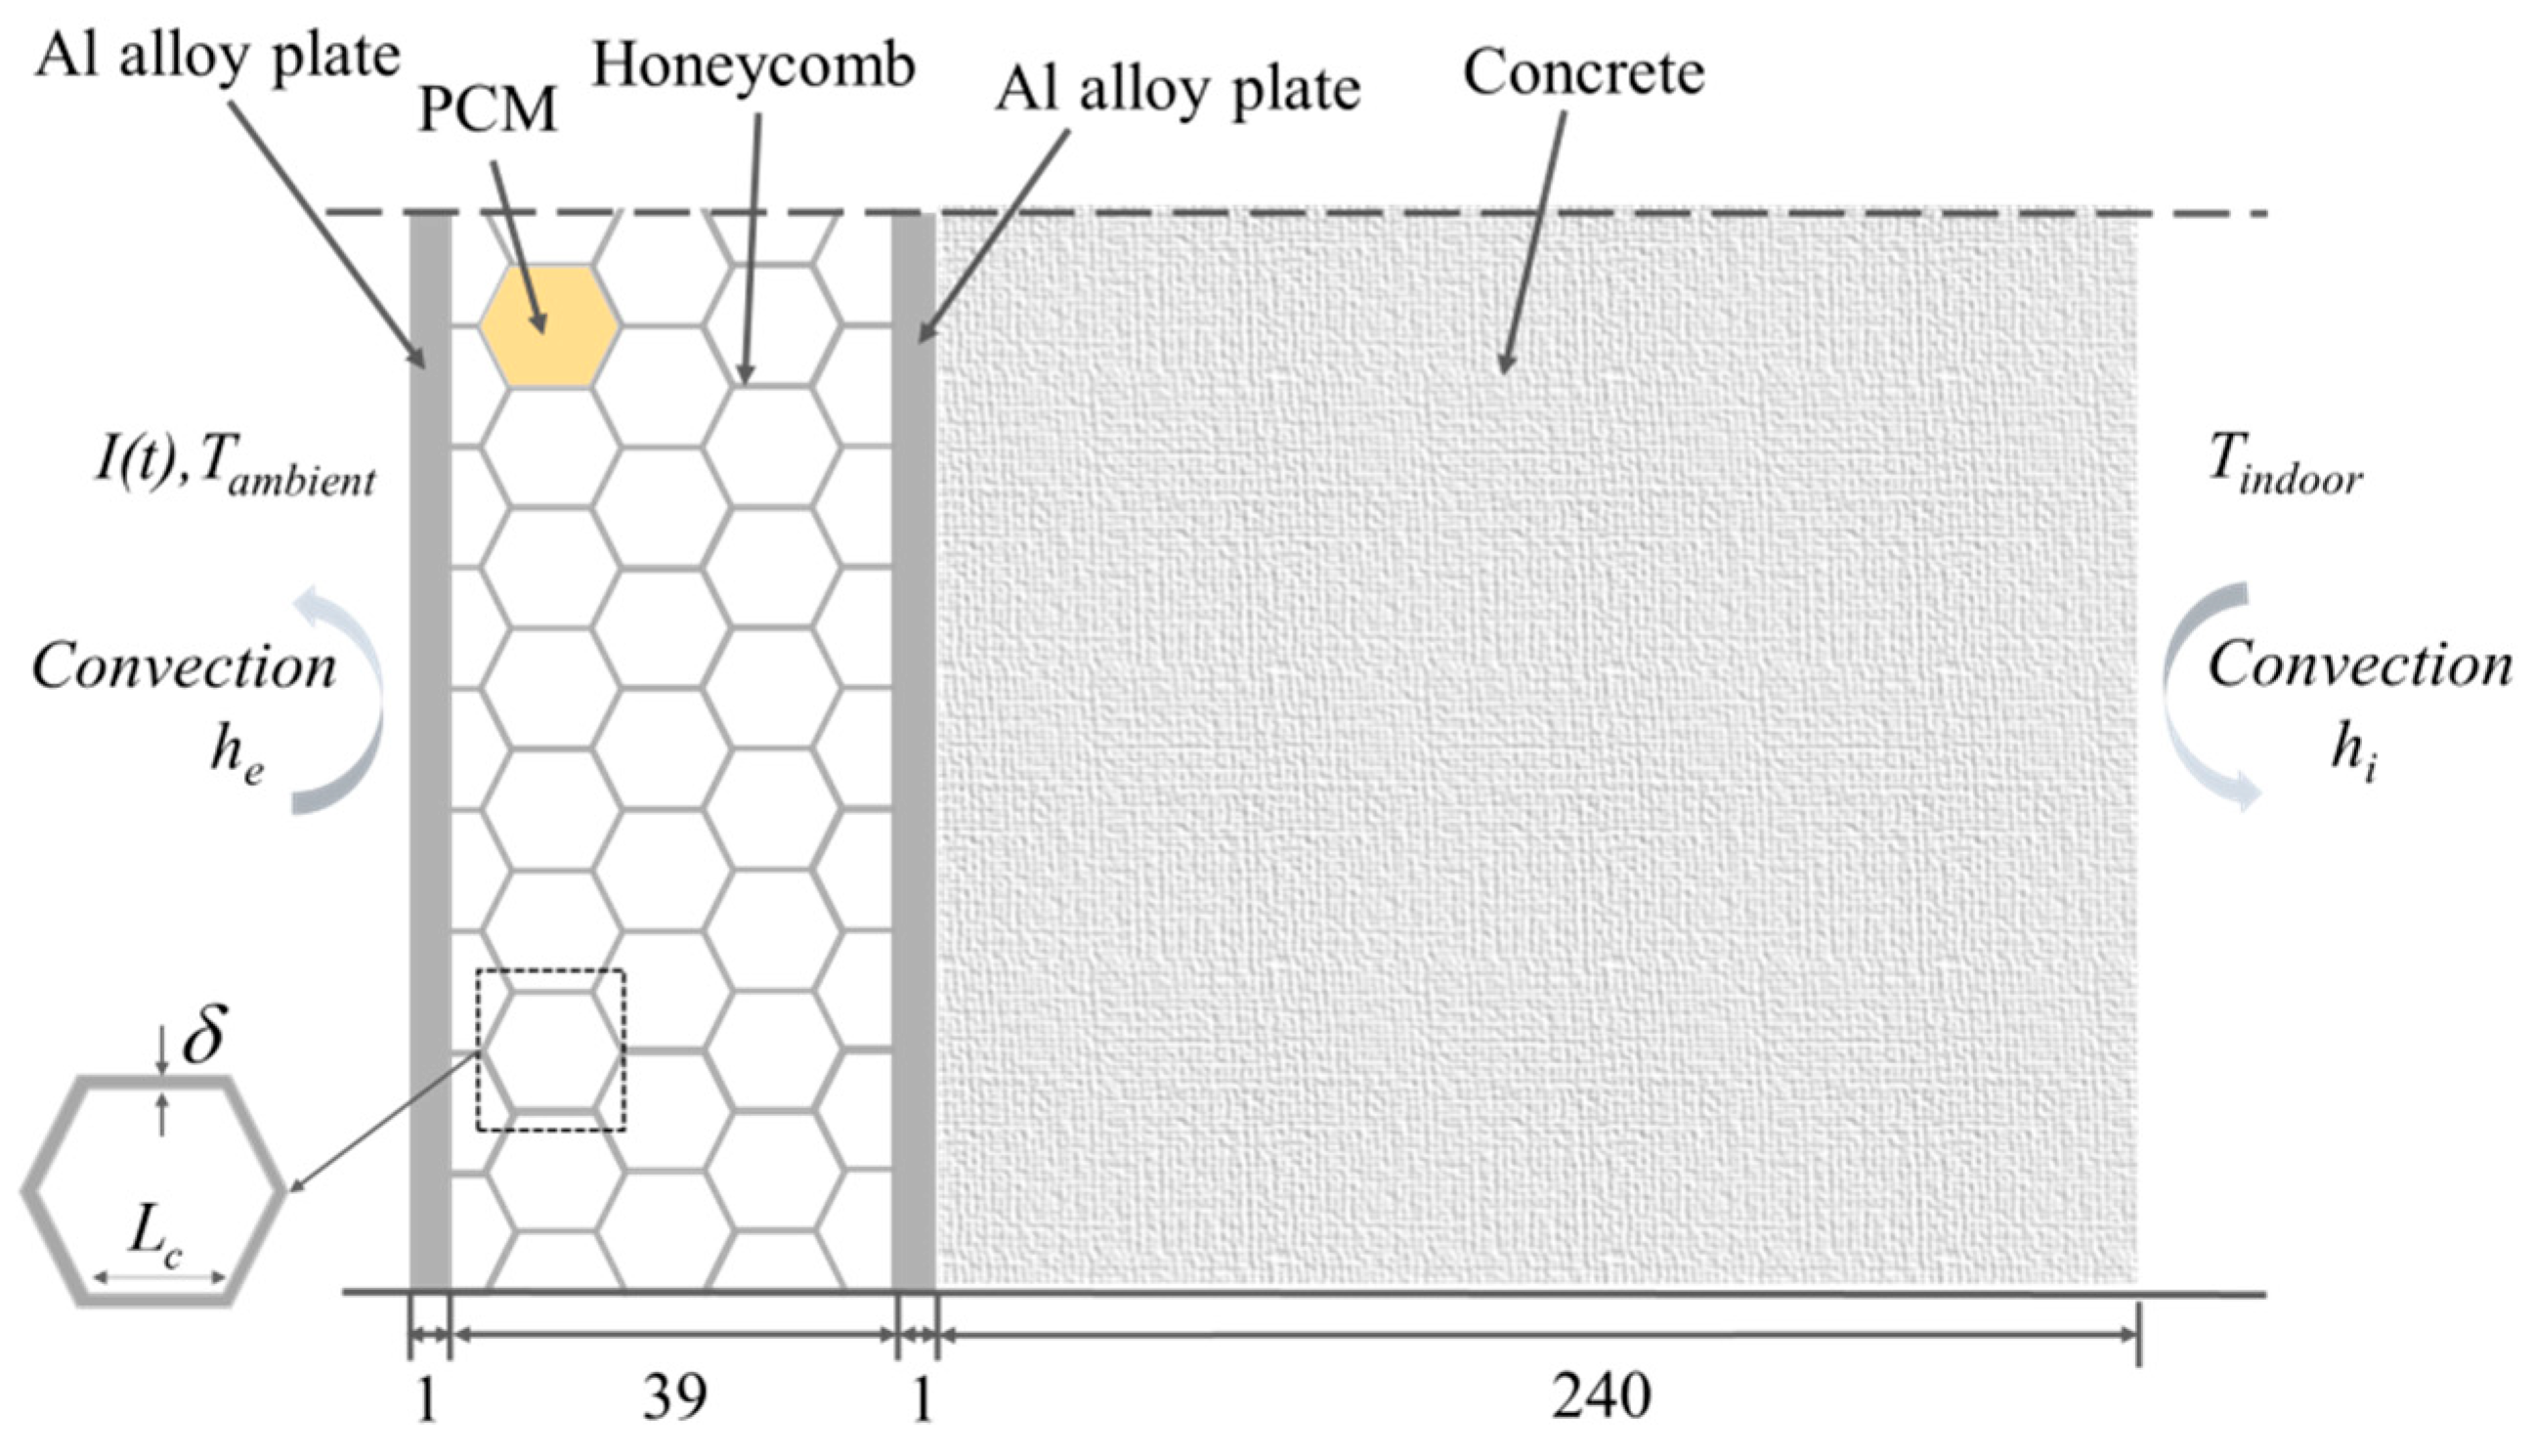
Figure 2 shows a simplified model of the honeycomb-concrete envelope structure. The section of aluminum alloy honeycomb-like wallboard containing PCM has a width of 39 mm, while the internal honeycomb size measures a length of Lc = 6.5 mm and a thickness of δ = 0.5 mm. The honeycomb composite board, with a height of 0.045033321 m in the y-direction, exhibits high symmetry. The PCM volume fraction within this structure is 86.89%, calculated from the cross-sectional area ratio. The corresponding mass loading of the PCM is thus 1.305 kg/m2. The honeycomb structure comprises two vertical aluminum alloy plates connected to the honeycomb wallboard, serving as connecting walls, shielding, and sealing components. The analysis model features adiabatic boundaries on both the upper and lower sides, along with a constant downward gravitational acceleration. The outer surface is exposed to solar radiation I(t) and forced convection driven by ambient temperature and the speed of the wind, while the inner wall is exposed to forced convection with indoor temperature. Accordingly, the heat transfer coefficient he on the outer surface exhibits variability depending on the wind speed, whereas hi on the inner wall is fixed at 10 W/(m2·K) [21] with a constant indoor temperature of 26 °C [39] for simplifying the calculation.
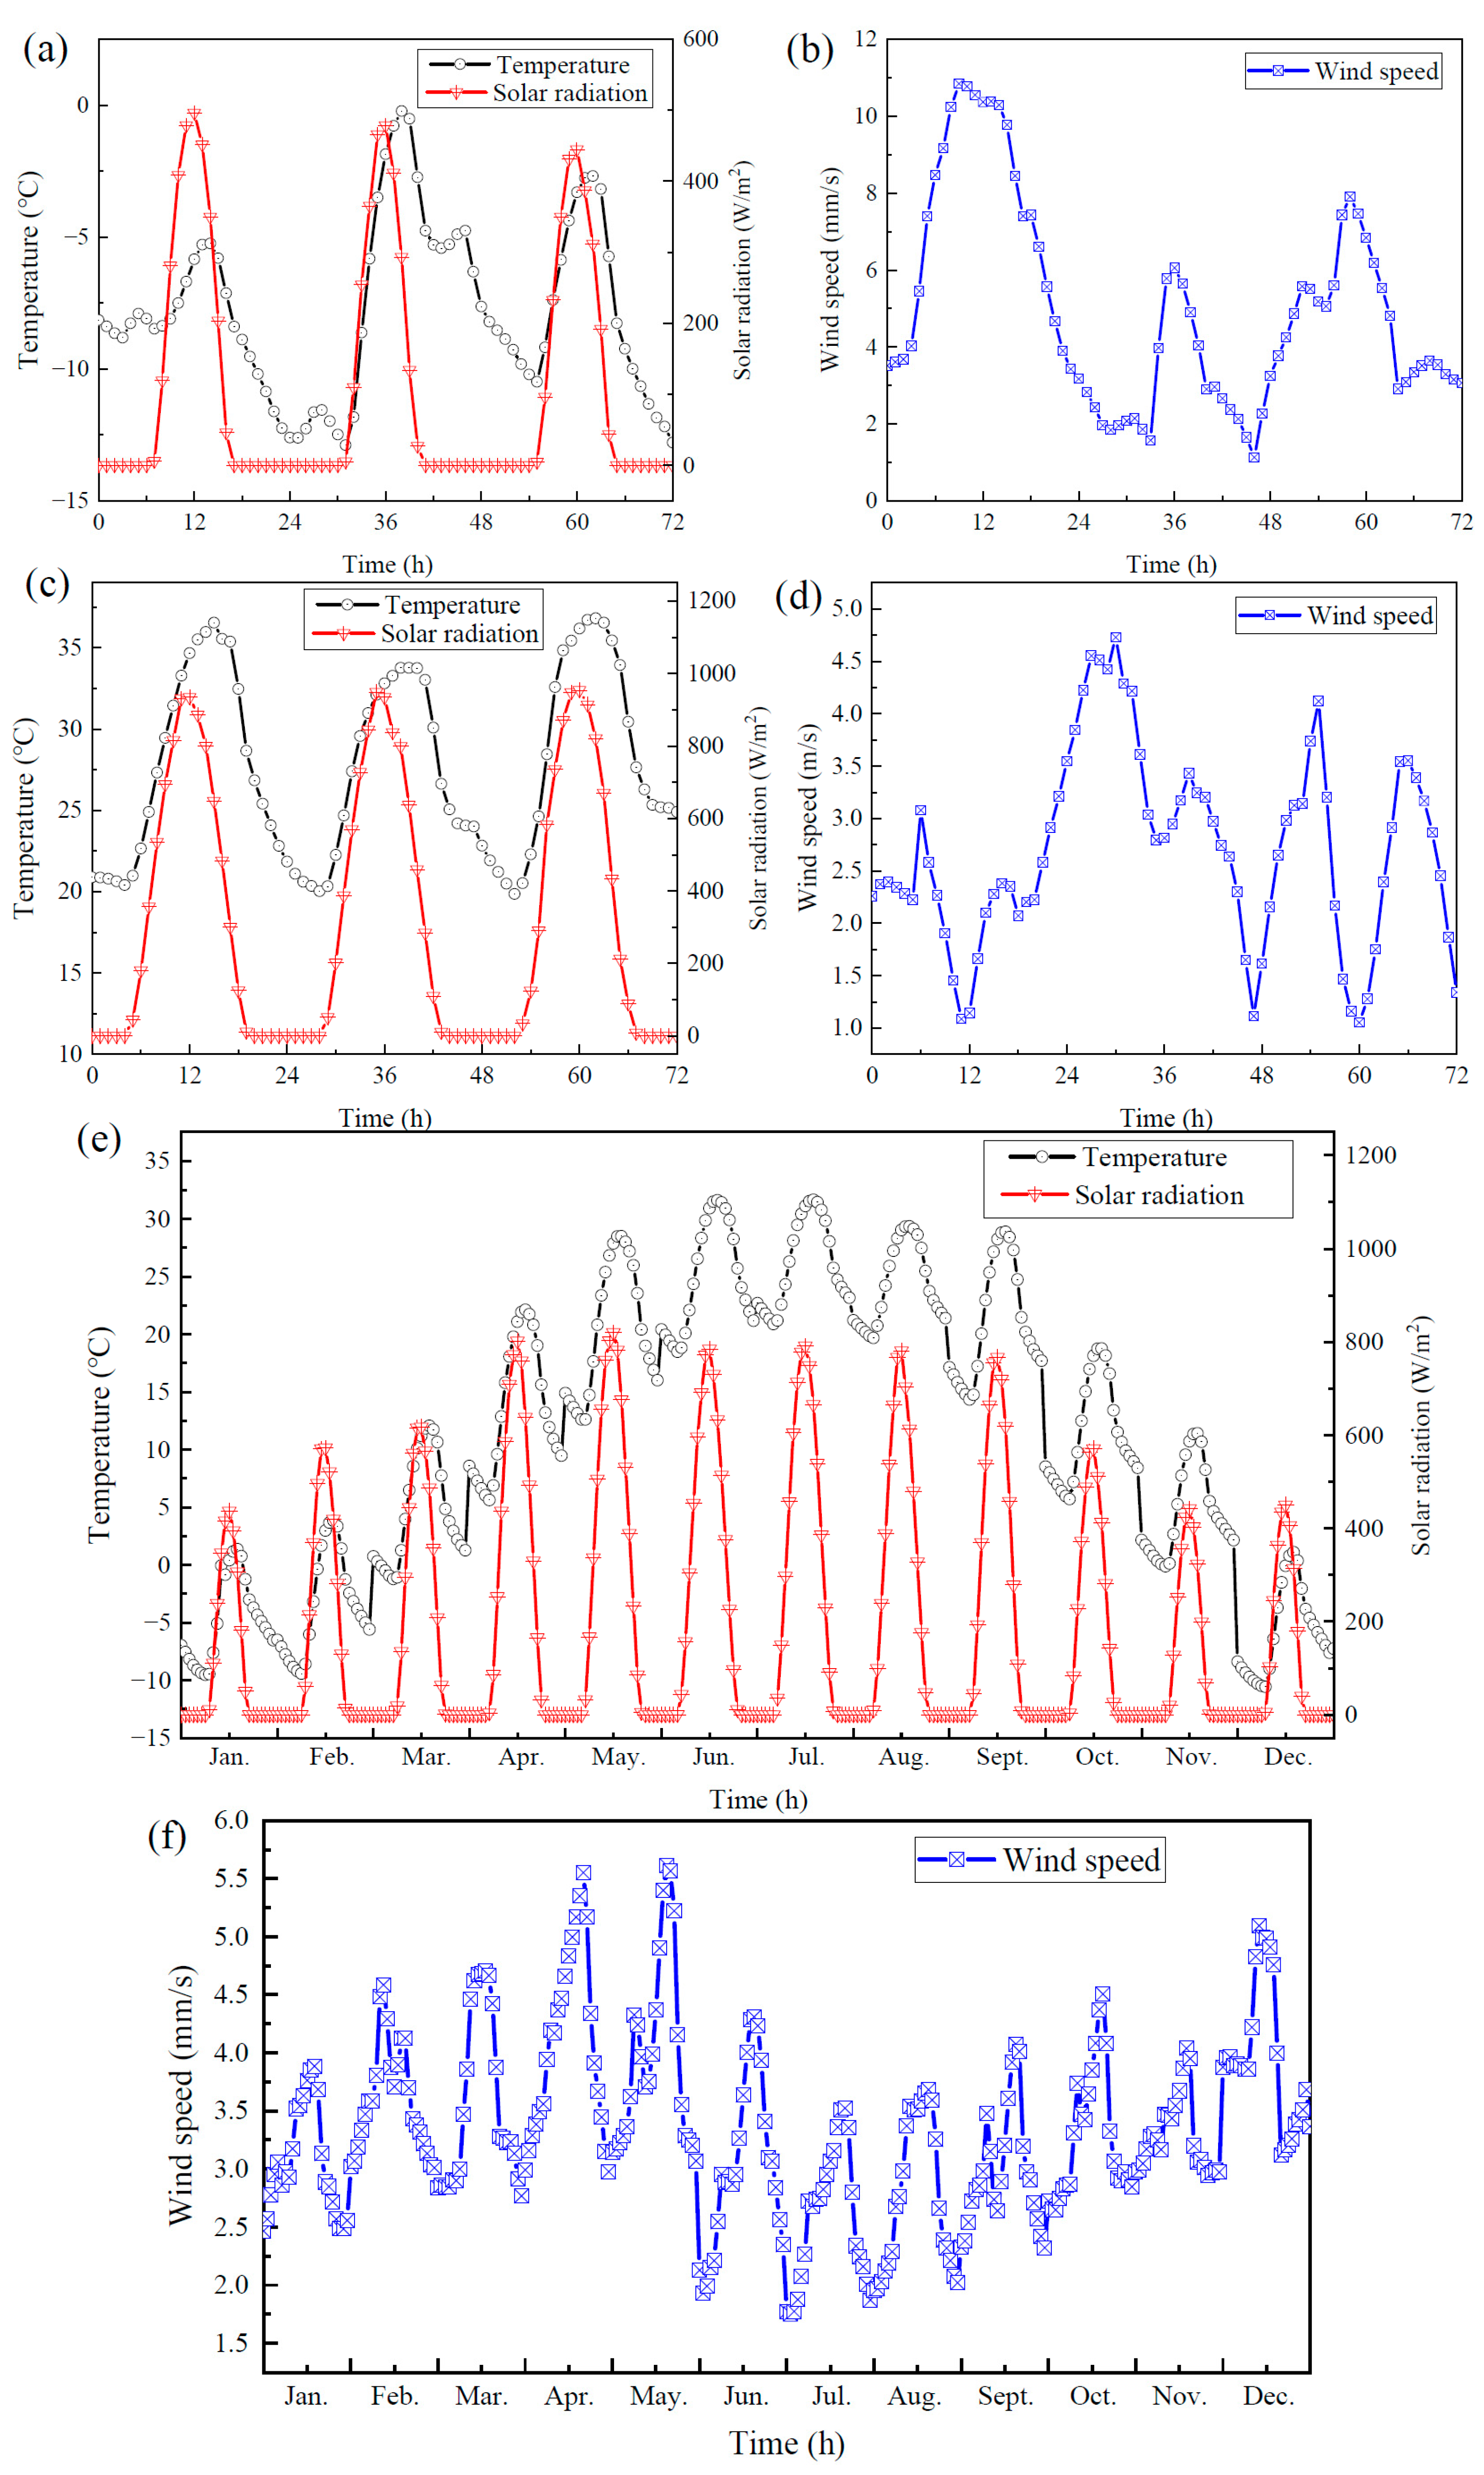
In this study, three computational models are employed: concrete, concrete covered by the honeycomb wallboard and concrete covered by the honeycomb wallboard, containing PCMs, as depicted in Figure 3. These models are subjected to solar radiation and convection at the front surface, enabling the examination of temperature and heat flux changes at the rear side. The thermophysical properties of PCMs and concrete considered in this study are presented in Table 1. The hourly variations in radiant intensity, wind speed, and ambient temperature on three typical days in summer, winter, and 12 design days were derived to capture the climatic conditions. Weather data for this study were obtained from historical reanalysis datasets provided by the European Centre for Medium-Range Weather Forecasts (ECMWF) and the National Aeronautics and Space Administration (NASA), accessed via the Xihe Energy Platform [40]. This data was obtained by averaging hourly data from each month in Beijing (coordinates 39.9371° N, 116.4113° E) for 2022, as illustrated in Figure 4. To efficiently analyze the average characteristics of long-term trends and minimize computing resources, the annual weather dataset was condensed into a set of 12 representative diurnal profiles, one for each month. For any given month, the data for a specific hour of the day were averaged to produce a single value for that hour in the representative day. The 12-day period represents a complete year, enabling the examination of seasonal variations in research topics such as solar radiation. In addition, the heat transfer coefficients on the aluminum alloy plate and concrete surfaces are denoted as he_plate(v) and he_concrete(v), respectively, where v represents the speed of wind. Given an initial temperature of 23 °C, we initialized the numerical calculation one day ahead in order to minimize the impact of the initial condition.
The conjugate heat transfer method was employed to simulate the heat and mass transfer between solid and liquid. It was observed that the PCM melts nearly simultaneously along the direction of thickness [31]. To facilitate the present study, we made the following assumptions:
(i)
The thermal physical properties of solid domains (aluminum alloy and concrete walls) remain independent of temperature;
(ii)
The melted PCM flow is Newtonian incompressible laminar, with negligible three-dimensional convection, thermal radiation, and viscous dissipations.
(iii)
The PCM is homogeneous and isotropic.
(iv)
The influence of natural convection within the fluid region is calculated using the Boussinesq approximation.
In summary, this section has outlined the prototype, modeling methodology, computational framework, and key assumptions established for investigating the thermal performance of PCMs in building cooling systems.

3. Mathematical Formulations

3.1. Front and Back Surfaces

This study investigates heat transfer in walls containing PCM-filled honeycomb structures. The external boundary condition accounts for combined convective heat transfer and solar radiation, mathematically represented by the following equation [43]:
k p l a t e T x = h e _ p l a t e ( T a m b i e n t T p l a t e ) + α p l a t e I ( t )
k c o n c r e t e T x = h i ( T i n d o o r T c o n c r e t e )
where kplate and kconcrete are the thermal conductivities of aluminum alloy plate and concrete, respectively. The αplate is the solar absorptivity of the plate surface and its value is taken as 0.39 [43].
Similarly, when concrete wall is exposed to the outdoor environment, the heat transfer on its surface is described as follows:
k c o n c r e t e T x = h e _ c o n c r e t e ( T a m b i e n t T c o n c r e t e ) + α c o n c r e t e I ( t )
Here, αconcrete represents the solar absorption of the concrete surface, with a fixed value set at 0.65 [21]. Tamb is the outdoor ambient temperature, I(t) is the solar radiation. The he_plate and he_concrete are the heat transfer coefficients of the plate and concrete surface, which are related to wind speed and can be determined using experimental equations derived from previous studies [44,45] (Equations (4) and (5)) as follows:
h e _ p l a t e = 8.55 + 2.56 v
h e _ c o n c r e t e = 10.7 + 4.96 v
where v is wind velocity.

3.2. Inside the Concrete and Honeycomb Fins

The heat transfer process primarily involves conduction heat transfer, just as follows:
ρ C p T t + · ( k T ) = 0
Equation (6) describes the conduction thermal conductivity mode, where ρ, k and Cp represent the density, thermal conductivity and specific heat, respectively.

3.3. Inside the PCM

3.3.1. Energy Equation

This involves both convection and conduction heat transfer within PCM domain and is considered as shown in Equation (7) as follows:
ρ C p T t + · ( k T ) + ρ C p u · T = 0
Inside the PCM, a temperature-dependent function, denoted as B(T), has been introduced to account for the solid–liquid transition. This function can be mathematically expressed using Equation (8) as follows:
B ( T ) = 0 T < ( T m Δ T / 2 ) ( T T m + Δ T / 2 ) / Δ T ( T m Δ T / 2 ) < T ( T m + Δ T / 2 ) 1 T > ( T m + Δ T / 2 )
where ΔT is the transition temperature and is given as 2 °C, Tm represents the melting temperature. B(T) is 0 and 1 in the solid and liquid phases, respectively. Within the transition zone, where the PCM undergoes a phase transition, B ( T ) increases linearly from 0 to 1 [46]. The density and thermal conductivity of PCM can are defined below as follows:
ρ ( T ) p c m = ρ s + ( ρ l ρ s ) B ( T )
k ( T ) p c m = k s + ( k l k s ) B ( T )
where ρs and ρl denote the PCM density during solid and liquid phases, respectively. Likewise, ks and kl represent the thermal conductivity, respectively. The specific heat of the PCM is formulated as a function of temperature, with an additional term to account for the latent heat of fusion. This yields an effective specific heat, defined as follows [26]:
C p ( T ) = C p s + ( C p l C p s ) B ( T ) + L f D ( T )
where Cps and Cpl represent the specific heat of the PCM. Lf is the latent heat. D ( T ) is the Gaussian function, which uniformly distributes latent heat over the interval [Tm ΔT/2, Tm + ΔT/2]. It is defined as follows:
D ( T ) = e ( T T m ) 2 ( Δ T / 4 ) 2 π ( Δ T / 4 ) 2

3.3.2. Momentum Equation

The momentum equation is activated exclusively in the molten PCM region. To accurately represent the phase transition, the governing equations for mass and momentum are modified to account for the change from solid to liquid behavior. It is crucial to account for the specific characteristics of the melted PCM to ensure an accurate representation of flow behavior and relevant physical phenomena. Such modifications can be implemented through the following equation:
ρ · u = 0 ρ u t + ρ ( u · ) u = · p I + μ u + u T + F b + F a
where F b is the buoyancy force based on the Boussinesq approximation [47] as follows:
F b = ρ l ( 1 β ( T T m ) ) g
Here, β represents the thermal expansion coefficient and the second source term F a as follows:
F a = A ( T ) u
The expression of A(T) is derived from the Carman-Koseny relationship in a porous medium, based on Darcy’s law, which can be expressed as follows [48]:
A ( T ) = C ( 1 B ( T ) ) 2 ( B ( T ) 3 + ε )
Equation (15) describes convection within the PCM. To simulate fluid flow in the liquid phase while suppressing it in the solid phase during the phase transition of PCM, it is modeled as a porous medium. The constant ε = 0.001 aims to prevent division by 0. For cases where the melting fraction B ( T ) is close to 1 in the liquid region, the source term approaches zero, the source term A ( T ) is approaches 0, resulting in flow governed by the standard Navier–Stokes equation. In the solid and transition regions, where the melting fraction B ( T ) < 1 , the source term takes on large values according to the size of the mushy zone constant C. The constant C is a key parameter with a substantial value that governs the morphology of the phase transition region and critically influences the accuracy of the numerical results. It has been reported that there is no notable alteration in the outcomes for C ≥ 1 × 10⁴ kg/(m3·s) in incompressible flows [49]. In the present work, we adopt a mushy zone constant of C = 1 × 10⁵ kg/(m3·s) to enhance fluid flow convergence [50]. Consequently, fluid flow is diminished in solid region, leading to a well-defined transition zone between the solid and liquid phases. Furthermore, to achieve optimal outcomes, Additionally, we adjust to the viscosity of PCM that it is higher in solid phase but relatively lower in the liquid phase (as indicated in Equation (16)). In other studies, the viscosity coefficient of the fluid can be determined through experimental data and fitted to the viscosity curve [47].
μ ( T ) = μ l ( 1 + A ( T ) / C 0 )
It represents the viscosity coefficient of PCM in different phases, and its selection is crucial for maintaining physical consistency in the equations and calculations. The value of C0 = 1 kg/(m3·s) is chosen to maintain unit consistency. μl represents the dynamic viscosity of PCM in liquid phase.

4. Numerical Method and Model Verification

4.1. Method and Mesh Dependency

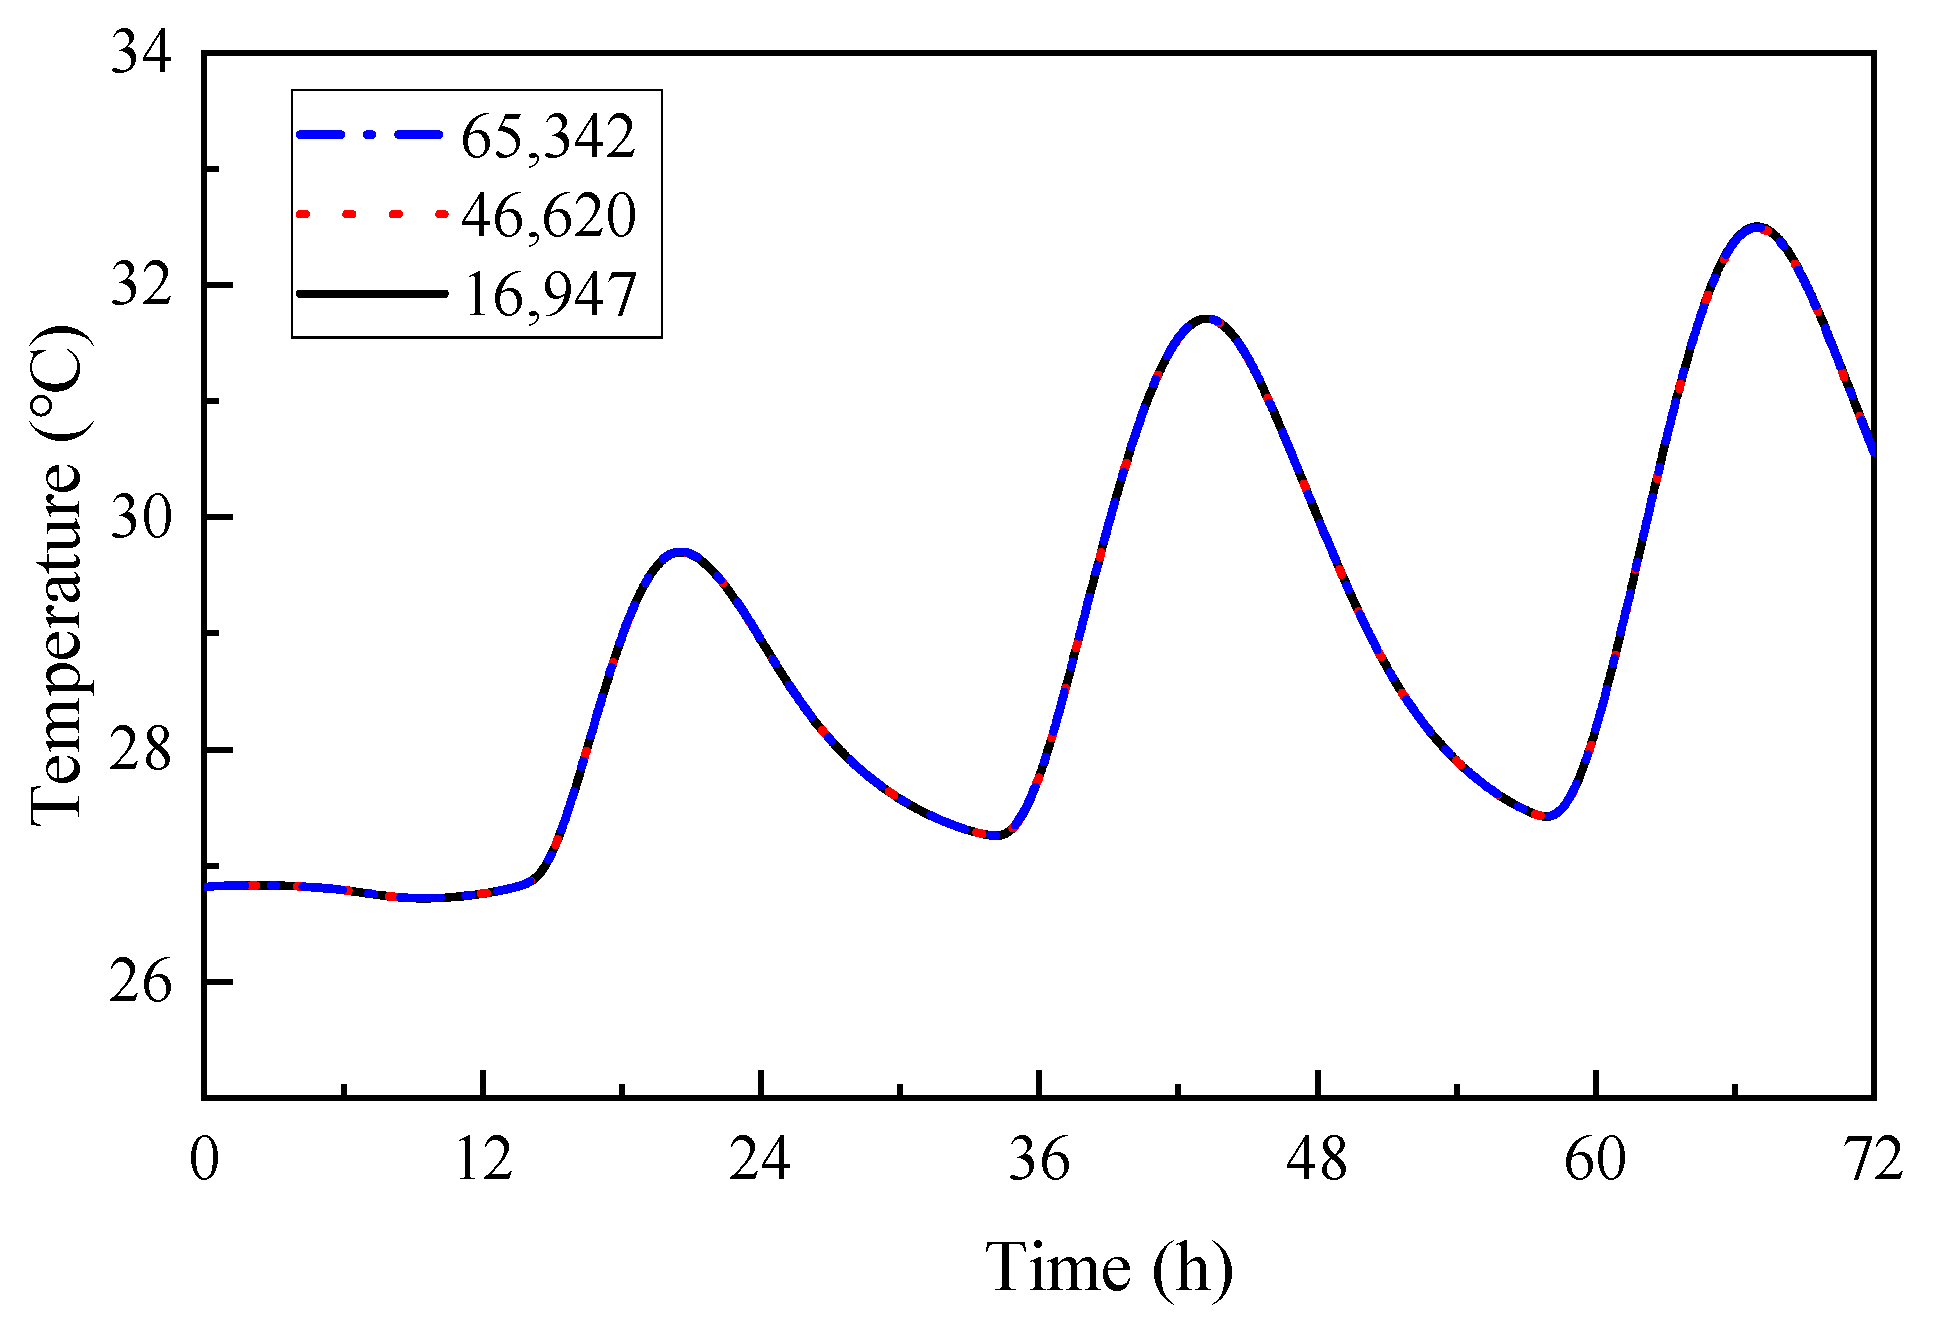
Utilizing a fixed-grid approach, simulations were conducted to address the phase change heat transfer problem. The finite element method was employed to solve this model. The transient simulations utilized a segregated solver for efficient multi-physics coupling, with convergence governed by a relative tolerance of 0.001. This is enforced through an internal tolerance factor of 0.1 in the segregated steps, thereby ensuring an effective iteration tolerance of 10−4 for each individual physics field. The backward differentiation formulas (BDF) time step method is employed, with a maximum order of 2 and a minimum order of 1. For the mesh sensitivity test, a mesh system composed of triangular elements was established in this study, with three distinct mesh types (containing 16,947, 46,620, and 65,342 elements, respectively) generated through systematic refinement by controlling the element size. To enhance computational efficiency while accurately resolving key physical processes, local mesh refinement was applied to the PCM region and the PCM-fin interfaces, whereas coarser elements were adopted for the metal fins and concrete areas. A mesh independence study, as shown in Figure 5, using the average wall temperature as the monitoring variable, demonstrated that the medium mesh (46,620 elements) with an error remaining below 1% achieved an optimal balance between computational cost and accuracy. It was therefore selected as the final mesh scheme. The resulting mesh has a minimum element size of 9.01 × 10⁻⁷ m, a maximum element size of 0.00562 m, and a first-layer boundary thickness of 0.00178 m at the PCM-fin interfaces, and the average time for each calculation is approximately 2.5 h.

4.2. Model Validation

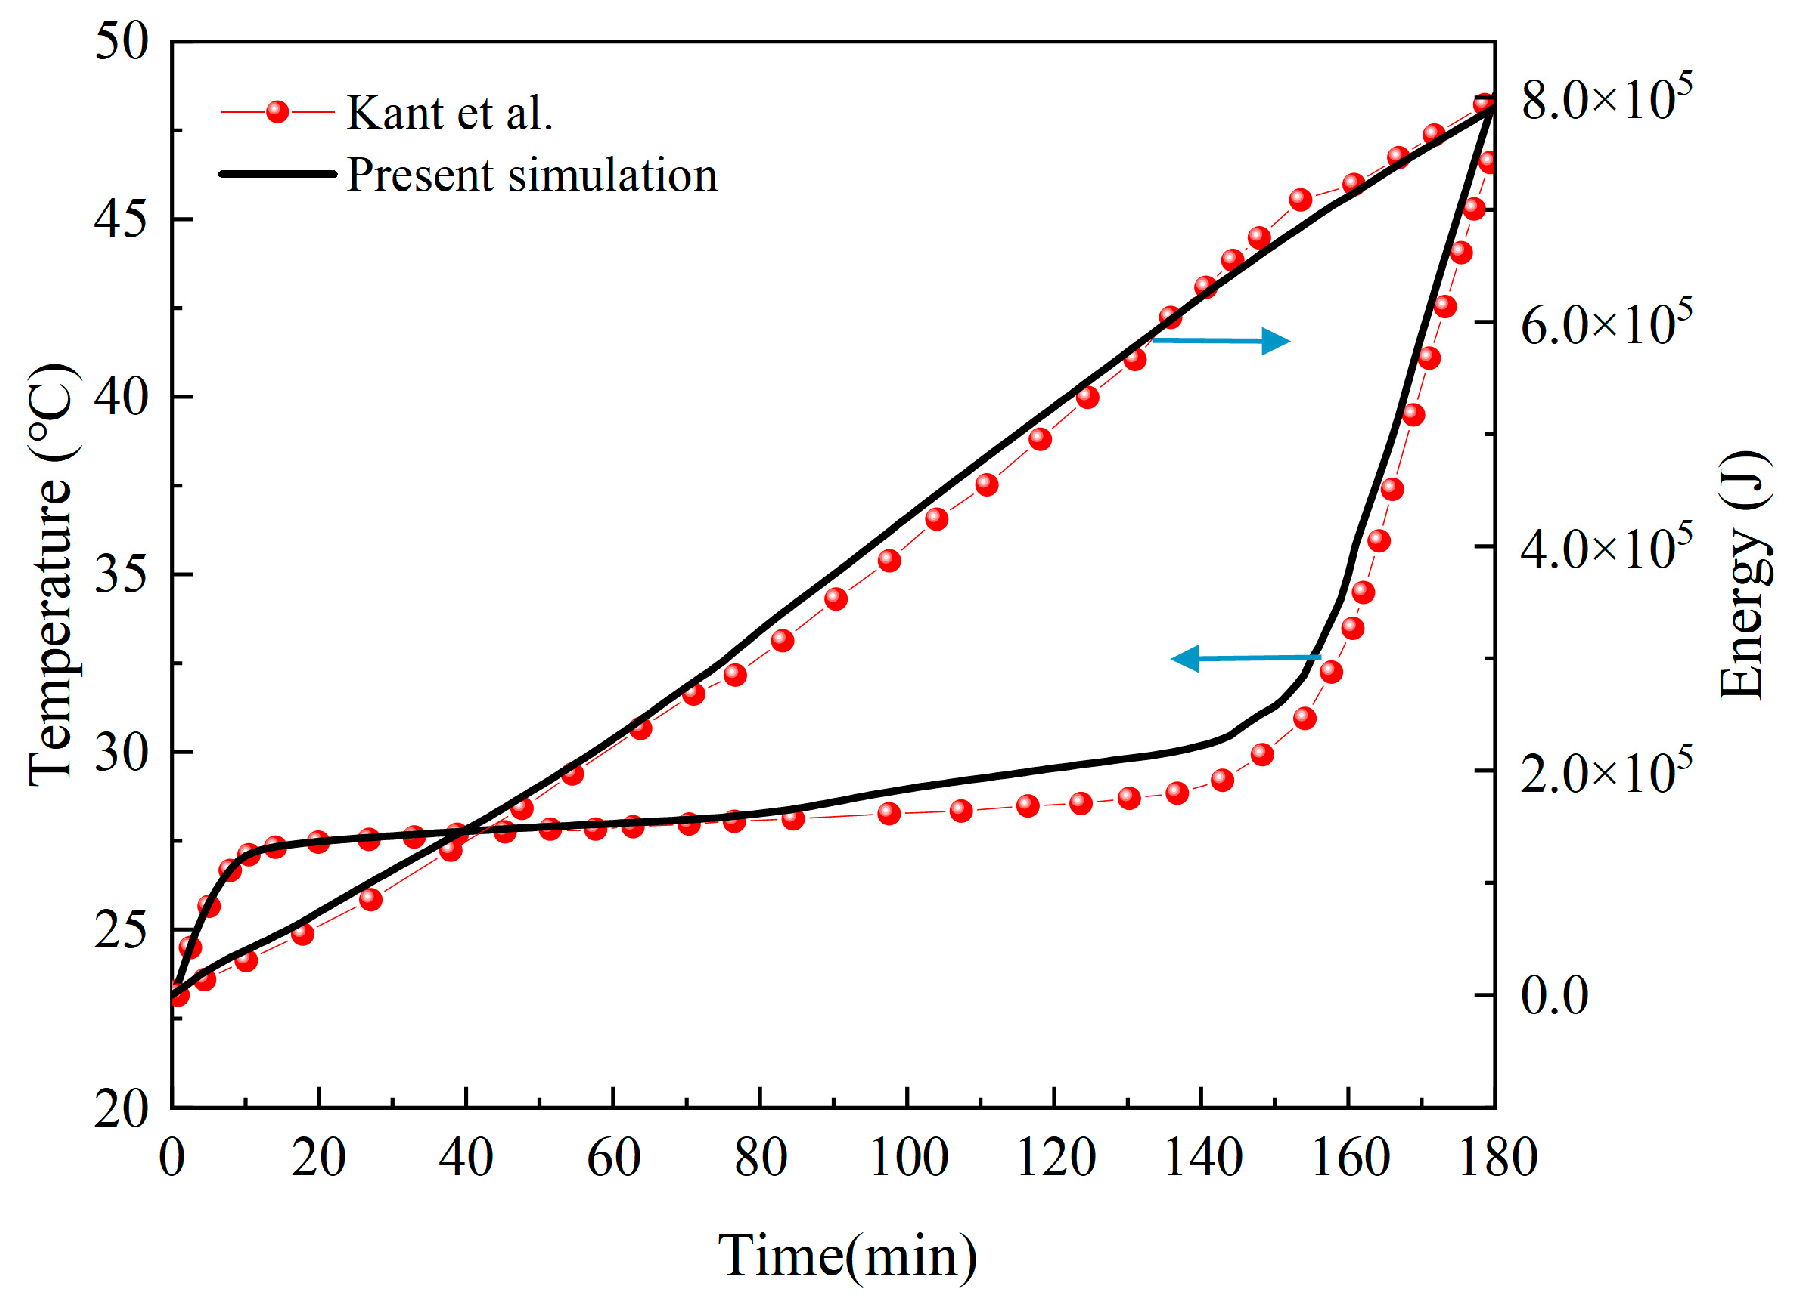
The developed numerical model was verified with the previous research of the heat transfer in honeycomb structure containing PCM, proposed by Kant et al. [50]. The model was subjected to external heat flux and convective heat transfer as boundary conditions. As shown in Figure 6, the simulated temperature and energy results agree well with data reported in the literature, thereby validating the numerical approach.
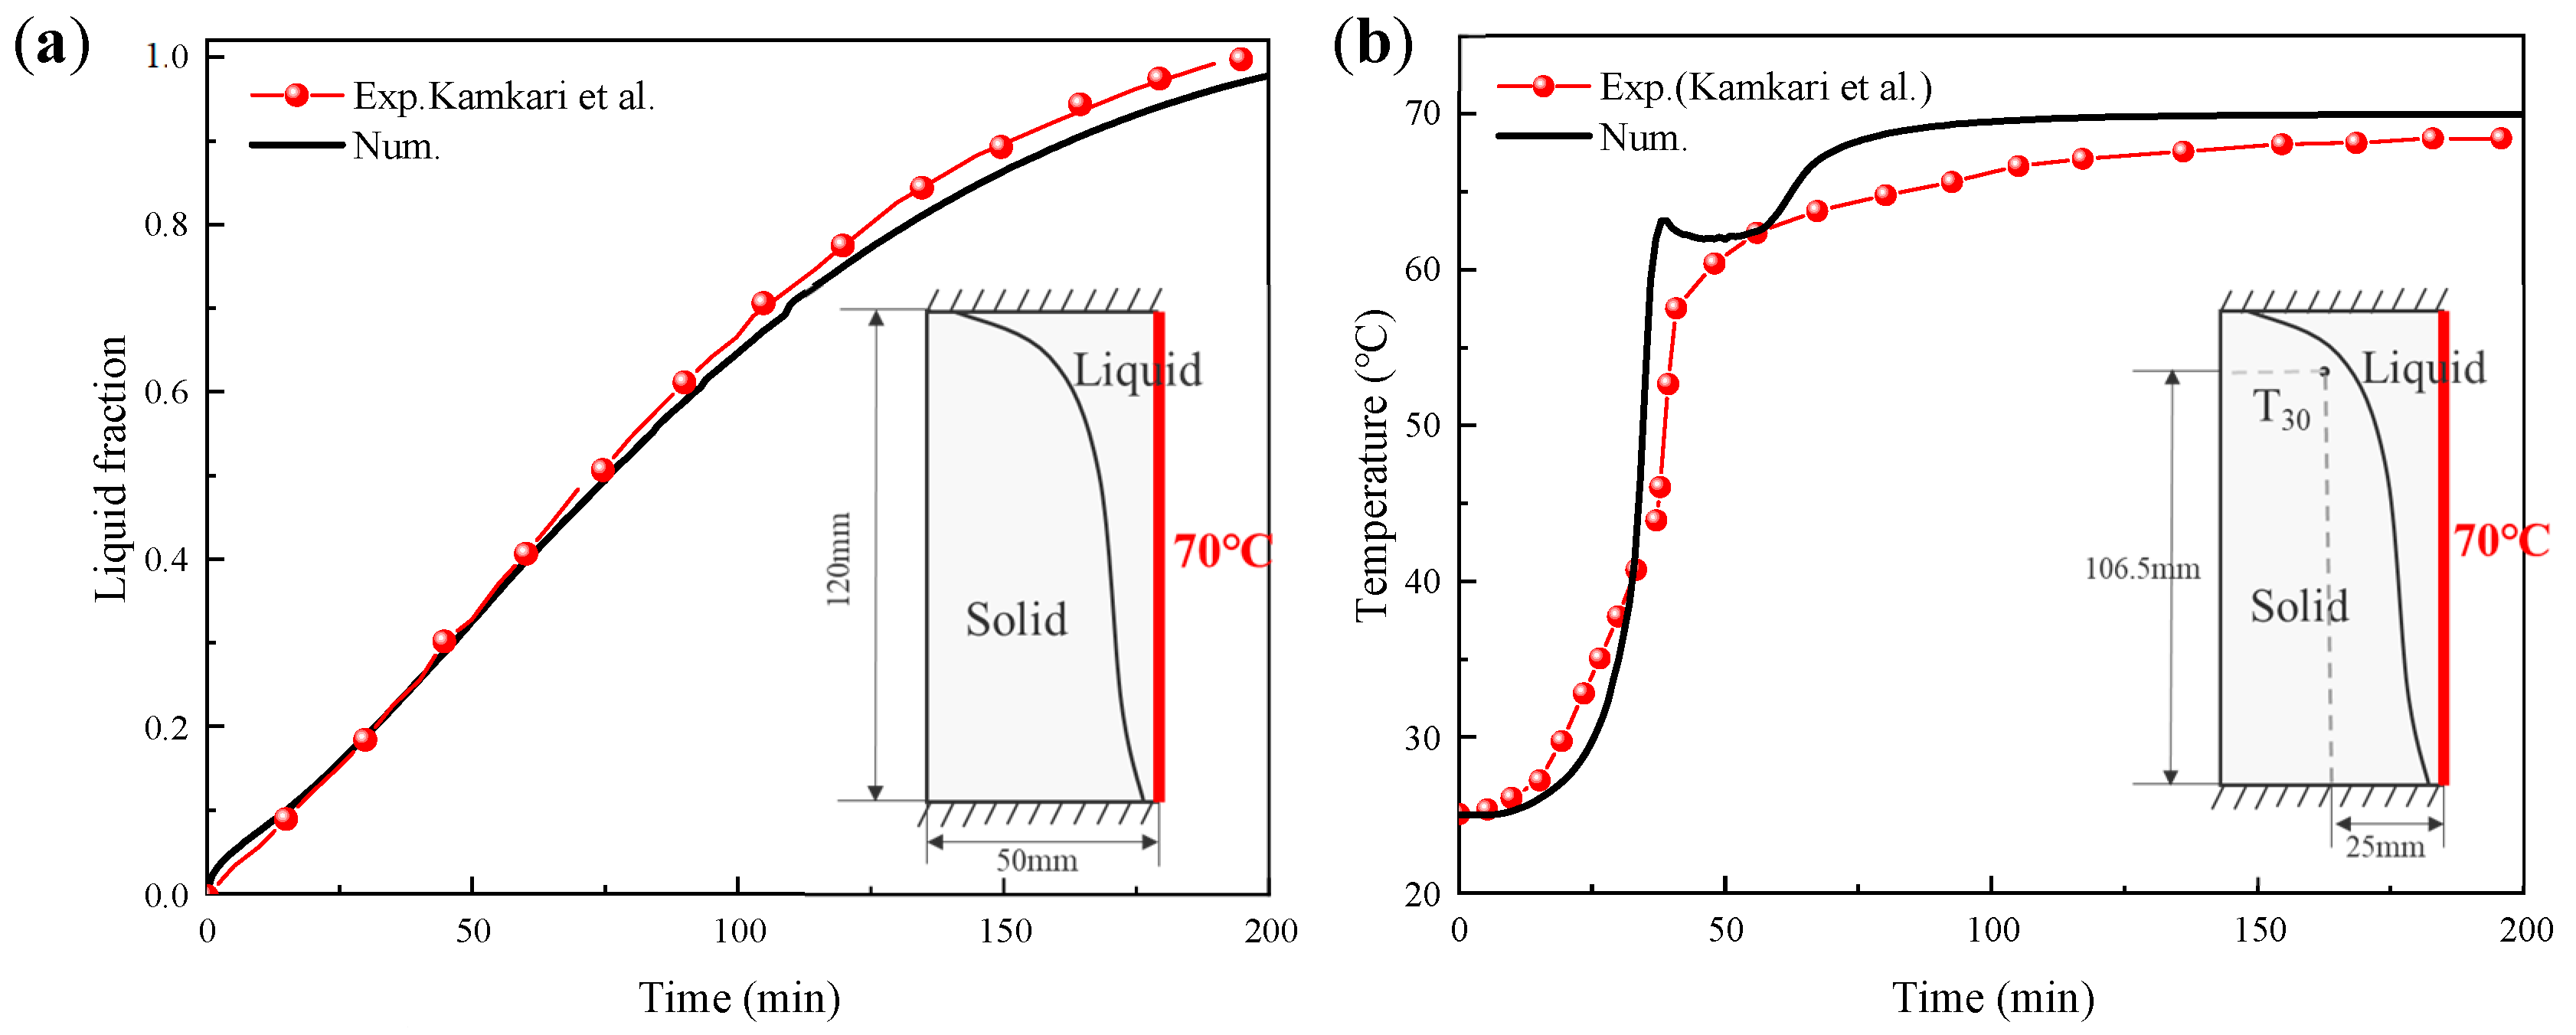
The experimental results obtained by Kamkari et al. [51] were also employed to validate the reliability of the established numerical model. Kamkari et al. [51] carried out the experiment to investigate the thermodynamic melting behavior of lauric acid in a rectangular enclosure at constant temperature. The simulation was performed using ΔT = 2.5 °C, and the results were compared to the experiment as shown in Figure 7, which represents the liquid phase fraction, temperature measurement point, and transient shape of the solid–liquid interface, respectively.
The presented numerical method, which simulates the thermomechanical behavior of PCMs with temperature-dependent properties, has been validated against established models in the literature. This analysis rigorously confirms the model’s credibility and precision, providing a robust foundation for further research.

5. Results and Discussion

5.1. Evaluation of Energy Storage Efficiency Among Diverse Structures

Preliminary to our investigation of the thermal performance of honeycomb-structured buildings, a comparative analysis was conducted to evaluate the energy storage efficiency of four different structures. Drawing inspiration from the battery field, we employed two physical quantities, specific energy (SE) and specific power (SP), to characterize the energy storage performance of the structures, which can be obtained using the following equations [52]:
S E = E m
S P = E m × t c u t o f f
where m is the mass of the system, tcutoff is the time when the structure reaches the cutoff temperature (i.e., Tcutoff = 35 °C), E is the stored energy in the system. And the stored energy in PCM is calculated according to Equation (20) as follows:
m C p s ( T T i n i ) T < T m m C p s ( T m T i n i ) + m L f T = T m m C p s ( T m T i n i ) + m L f + m C p l ( T T m ) T > T m
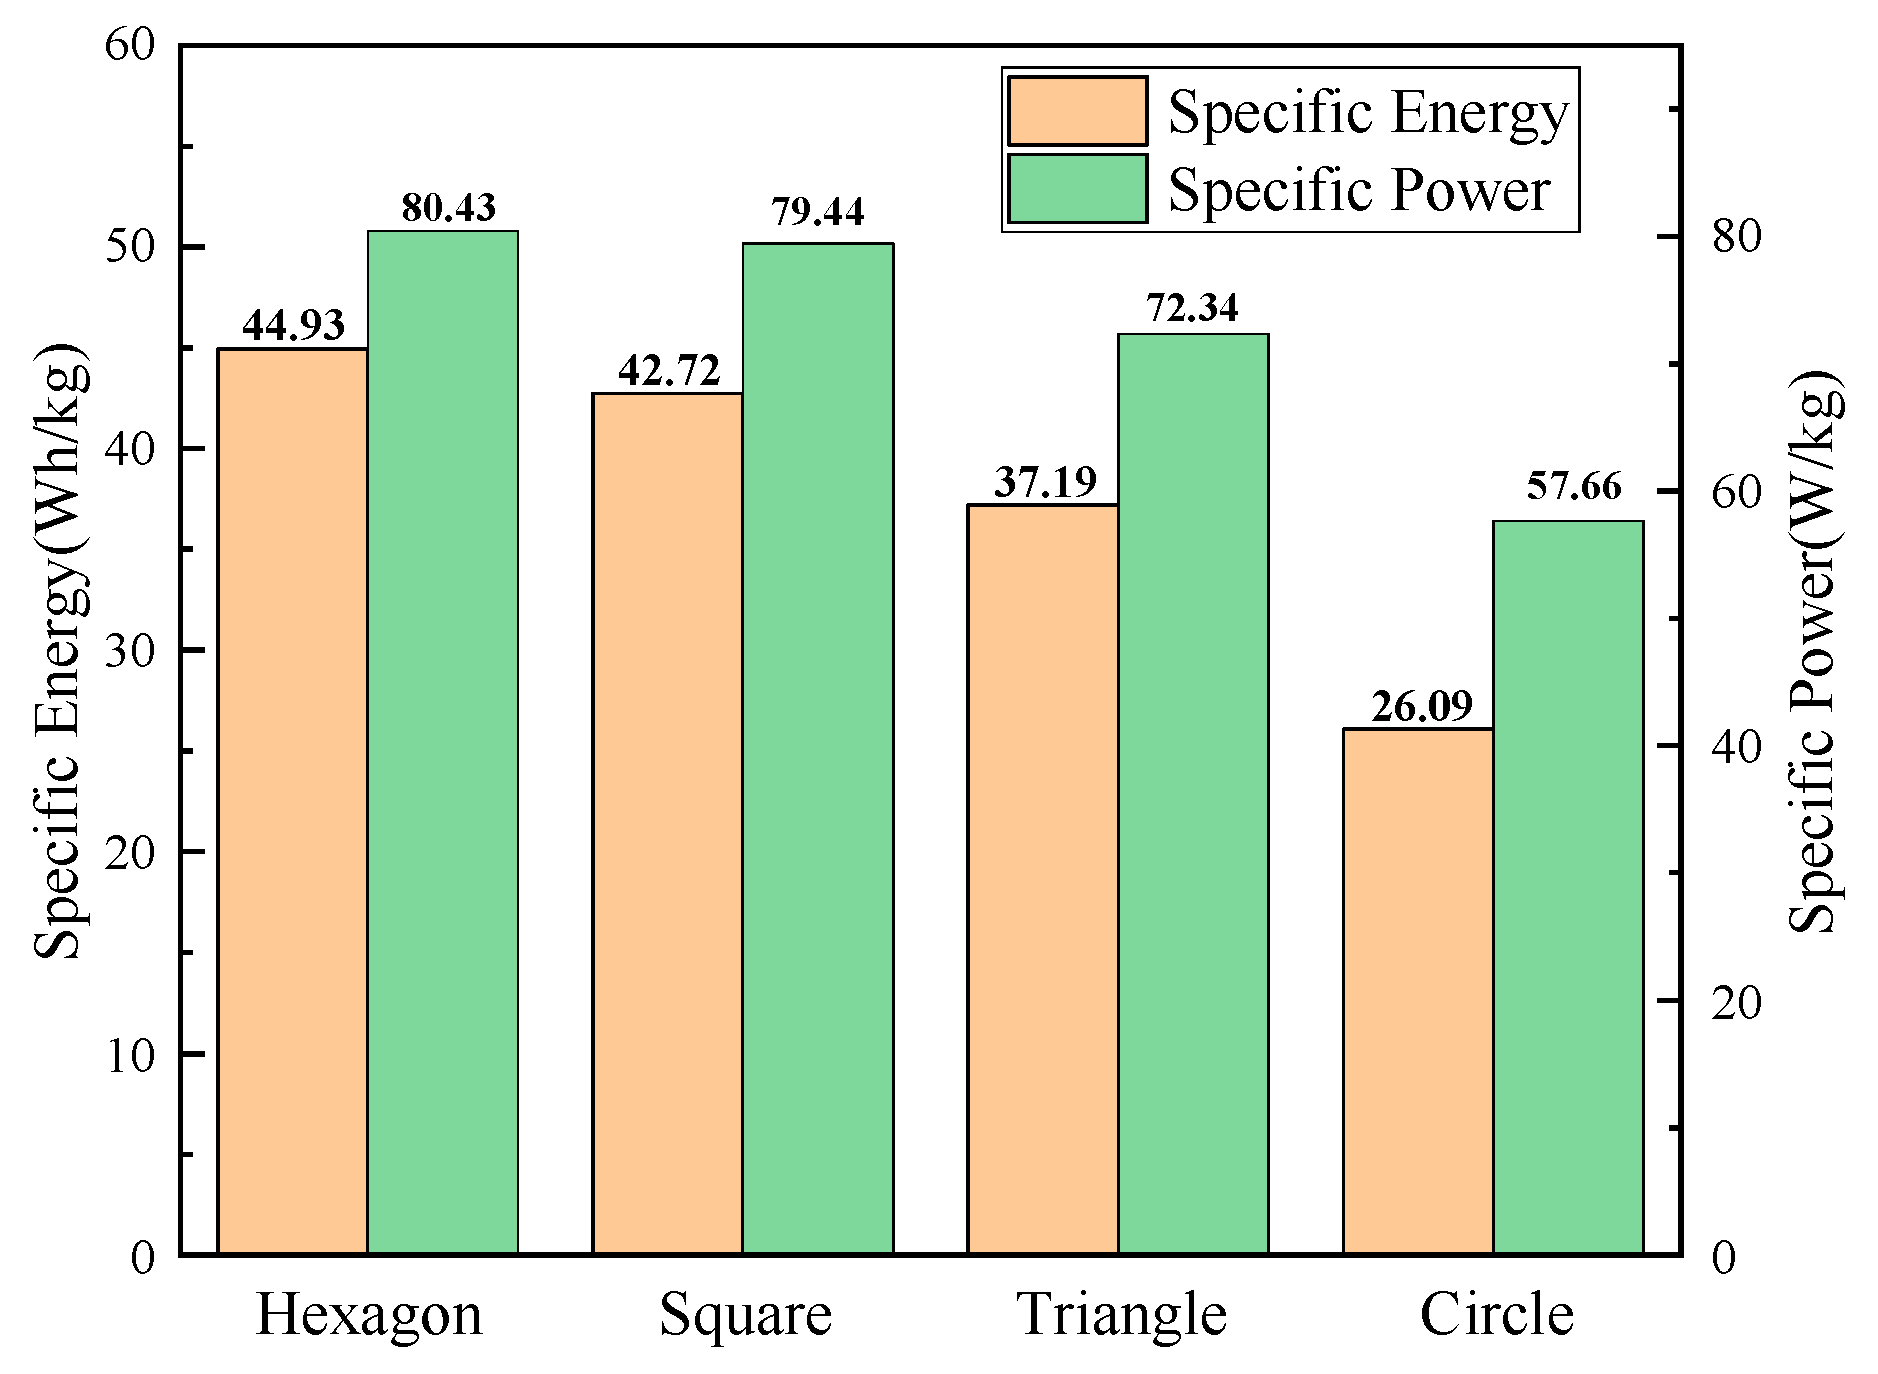
We evaluated the thermal performance of various shapes, including hexagon, square, triangle, and circle, all with dimensions of 1.5 cm by 1.05 cm and fin thickness of 0.025 cm, as shown in Figure 8. Each structure contained hollow regions filled with PCM, represented by the gray area, and fins made of aluminum alloy, represented by the purple area. Here we apply a heat flux q = 1000 W/m2 to the left side of the structure, set Tcutoff = 35 °C on the right side. Through numerical simulation, SE and SP of structures are calculated and presented in Figure 9. The result reveals that the SE and SP of the honeycomb structure are the largest, slightly higher than the square, whereas the circle is the lowest. It suggests that honeycomb structure has high energy density and better energy storage efficiency as it stores energy. The superior performance of the hexagonal structure is attributed to its optimal geometry. Its 120° angles promote uniform heat distribution from the fins to the PCM, preventing localized hotspots and enabling simultaneous phase change for higher SE and SP. Compared to a circle, it offers a larger fin-PCM contact area for efficient heat injection (high SP). Unlike the triangle, its geometry avoids flow-restricting acute angles, ensuring full PCM utilization. Thus, the hexagon optimally balances heat injection efficiency with distribution uniformity.
This design effectively stores heat energy during external heat intrusion and promptly releases it when the surrounding temperature drops, thus enhancing optimal thermal comfort. In conclusion, our study demonstrates the favorable thermal properties of the hexagonal structure and its potential for building cooling. Further research is to investigate the long-term performance of this design for achieving energy savings and thermal comfort in building thermal management systems.

5.2. Energy Prediction of Honeycomb-like Wallboard Under Different Climates

In practical building applications, a concrete wall is subject to convection on indoor and outdoor surfaces, as well as heat conduction and solar radiation with the environment. The energy-efficient design of buildings aims to reduce energy consumption to maintain the comfortable indoor temperature. We compared the energy saving effects of three models under the different weather conditions: a whole year, three-day periods each for hot and cold weather.

5.2.1. Three Days Results in Winter

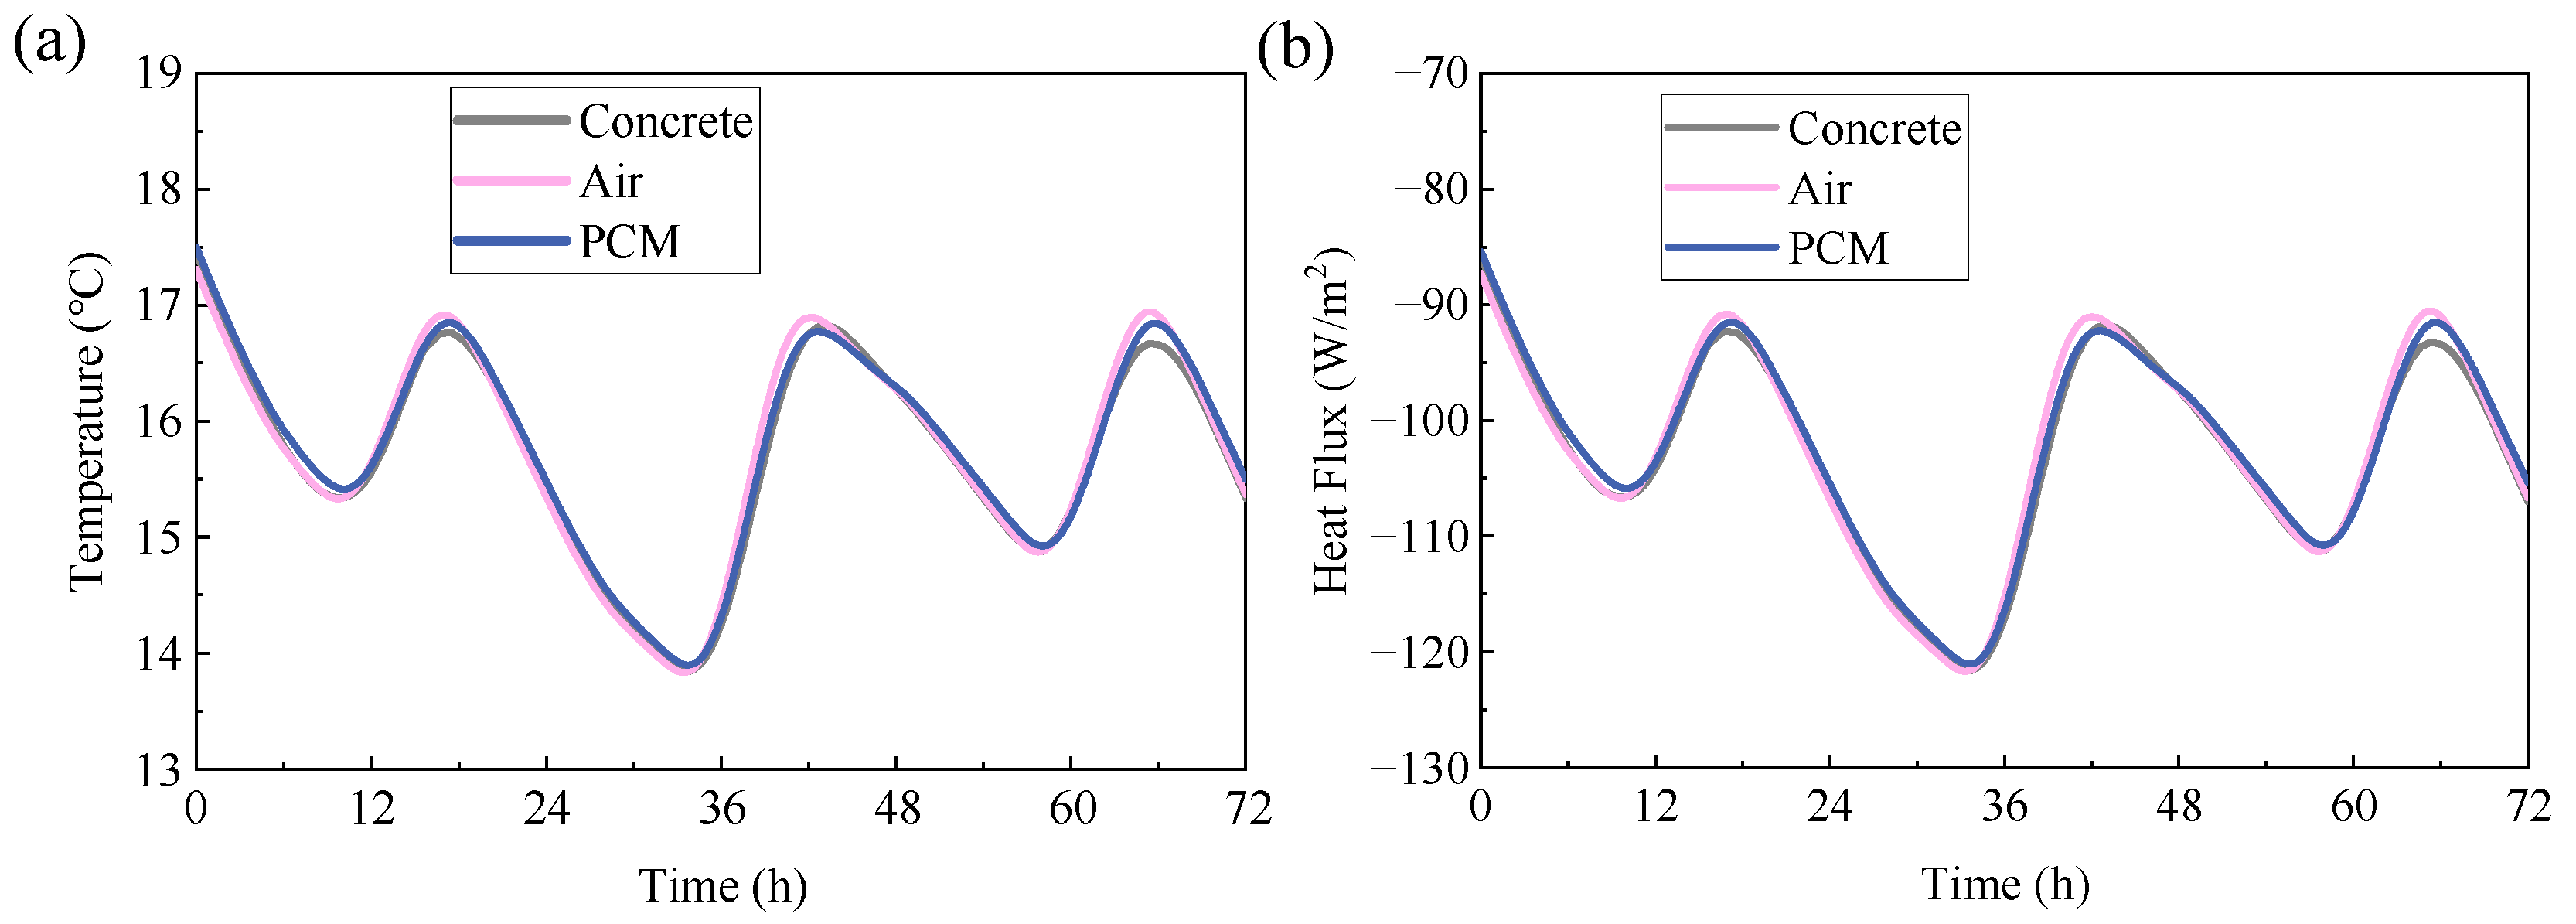
In Figure 10, we present the simulation results for the inner wall temperature, heat flux, and energy consumption over a three-day period in December. Ignoring the inner wall heat flux in the y-direction, it is obtained by averaging the boundary temperature gradient in the x-direction multiplied by the thermal conductivity. Energy consumption is calculated by integrating the average heat flux over time. Upon comparing the three models, it is found that the peak load of temperature and heat flux are slightly lower for the PCM-containing model compared to model filled with air but significantly higher than plain concrete. In terms of total energy consumption, the PCM-containing model exhibits the least energy consumption, but with only 0.14% and 0.67% reduction compared to the models of air-filled and plain concrete, respectively (Figure 11b).
Several factors contribute to these results, with the primary reason being that the cold conditions prevent the PCM from reaching its phase change temperature, thereby limiting its latent heat storage capability. As illustrated in (Figure 11a), the average liquid phase fraction of the PCM remains virtually zero during the cold days, as the PCM essentially remains in its solid state. Moreover, the lower solar radiation absorption coefficient of the aluminum alloy surface slows indoor heating due to reduced heat gain. However, the internal hexagonal metal fins enhance the PCM’s energy storage efficiency, leading to slightly lower energy consumption compared to air-filled and plain concrete models. It should be noted that in cold climates, the efficiency advantage of the PCM-containing model may be limited in energy consumption.

5.2.2. Three Days Results in Summer

In Figure 11b and Figure 12, the advantages of PCM are pronounced when the ambient temperature rises in summer, and the PCM reaches its melting temperature. This results in a liquid phase fraction greater than zero, which occurs cyclically (see Figure 11a). The peak load of temperature and heat flux of PCM is significantly lower, leading to energy savings of up to 17.14% and 28.01% compared to air and concrete, respectively. The small temperature difference within the PCM also suggests a lowered risk of thermal cracking in concrete. Furthermore, the phase change lag hinders heat transfer, thereby delaying the peak load arrival. This thermal buffering effect helps offset peak energy consumption and alleviates the power burden. Therefore, implementing honeycomb wallboard containing PCM as building envelope can effectively reduce energy consumption during hot weather.

5.2.3. Energy Prediction of a Whole Year

In order to obtain the energy consumption for an entire year, we have derived 12 design days that represent the average climate conditions for each hour of the month. Figure 13 illustrates the inner wall temperature and heat flux for the 12 months. When exposed to hotter weather (from March to September), the advantages of concrete covered by honeycomb-like wallboard containing PCM become evident, as indicated by the following points:
(i)
The temperature and heat flux are notably lower than that of air and concrete;
(ii)
The presence of phase change lags in PCM hinders the transfer of heat flow;
(iii)
The risk of thermal cracking can be reduced due to the small temperature difference within the PCM.
Despite exhibiting performance similar to air and concrete in cool weather, with minimal delay and temperature differences, the PCM model achieves lower annual energy consumption at 12.26 KWh/m2. This represents reductions of 5.76% and 6.27% compared to air and concrete, demonstrating its definitive energy-saving value in building management.
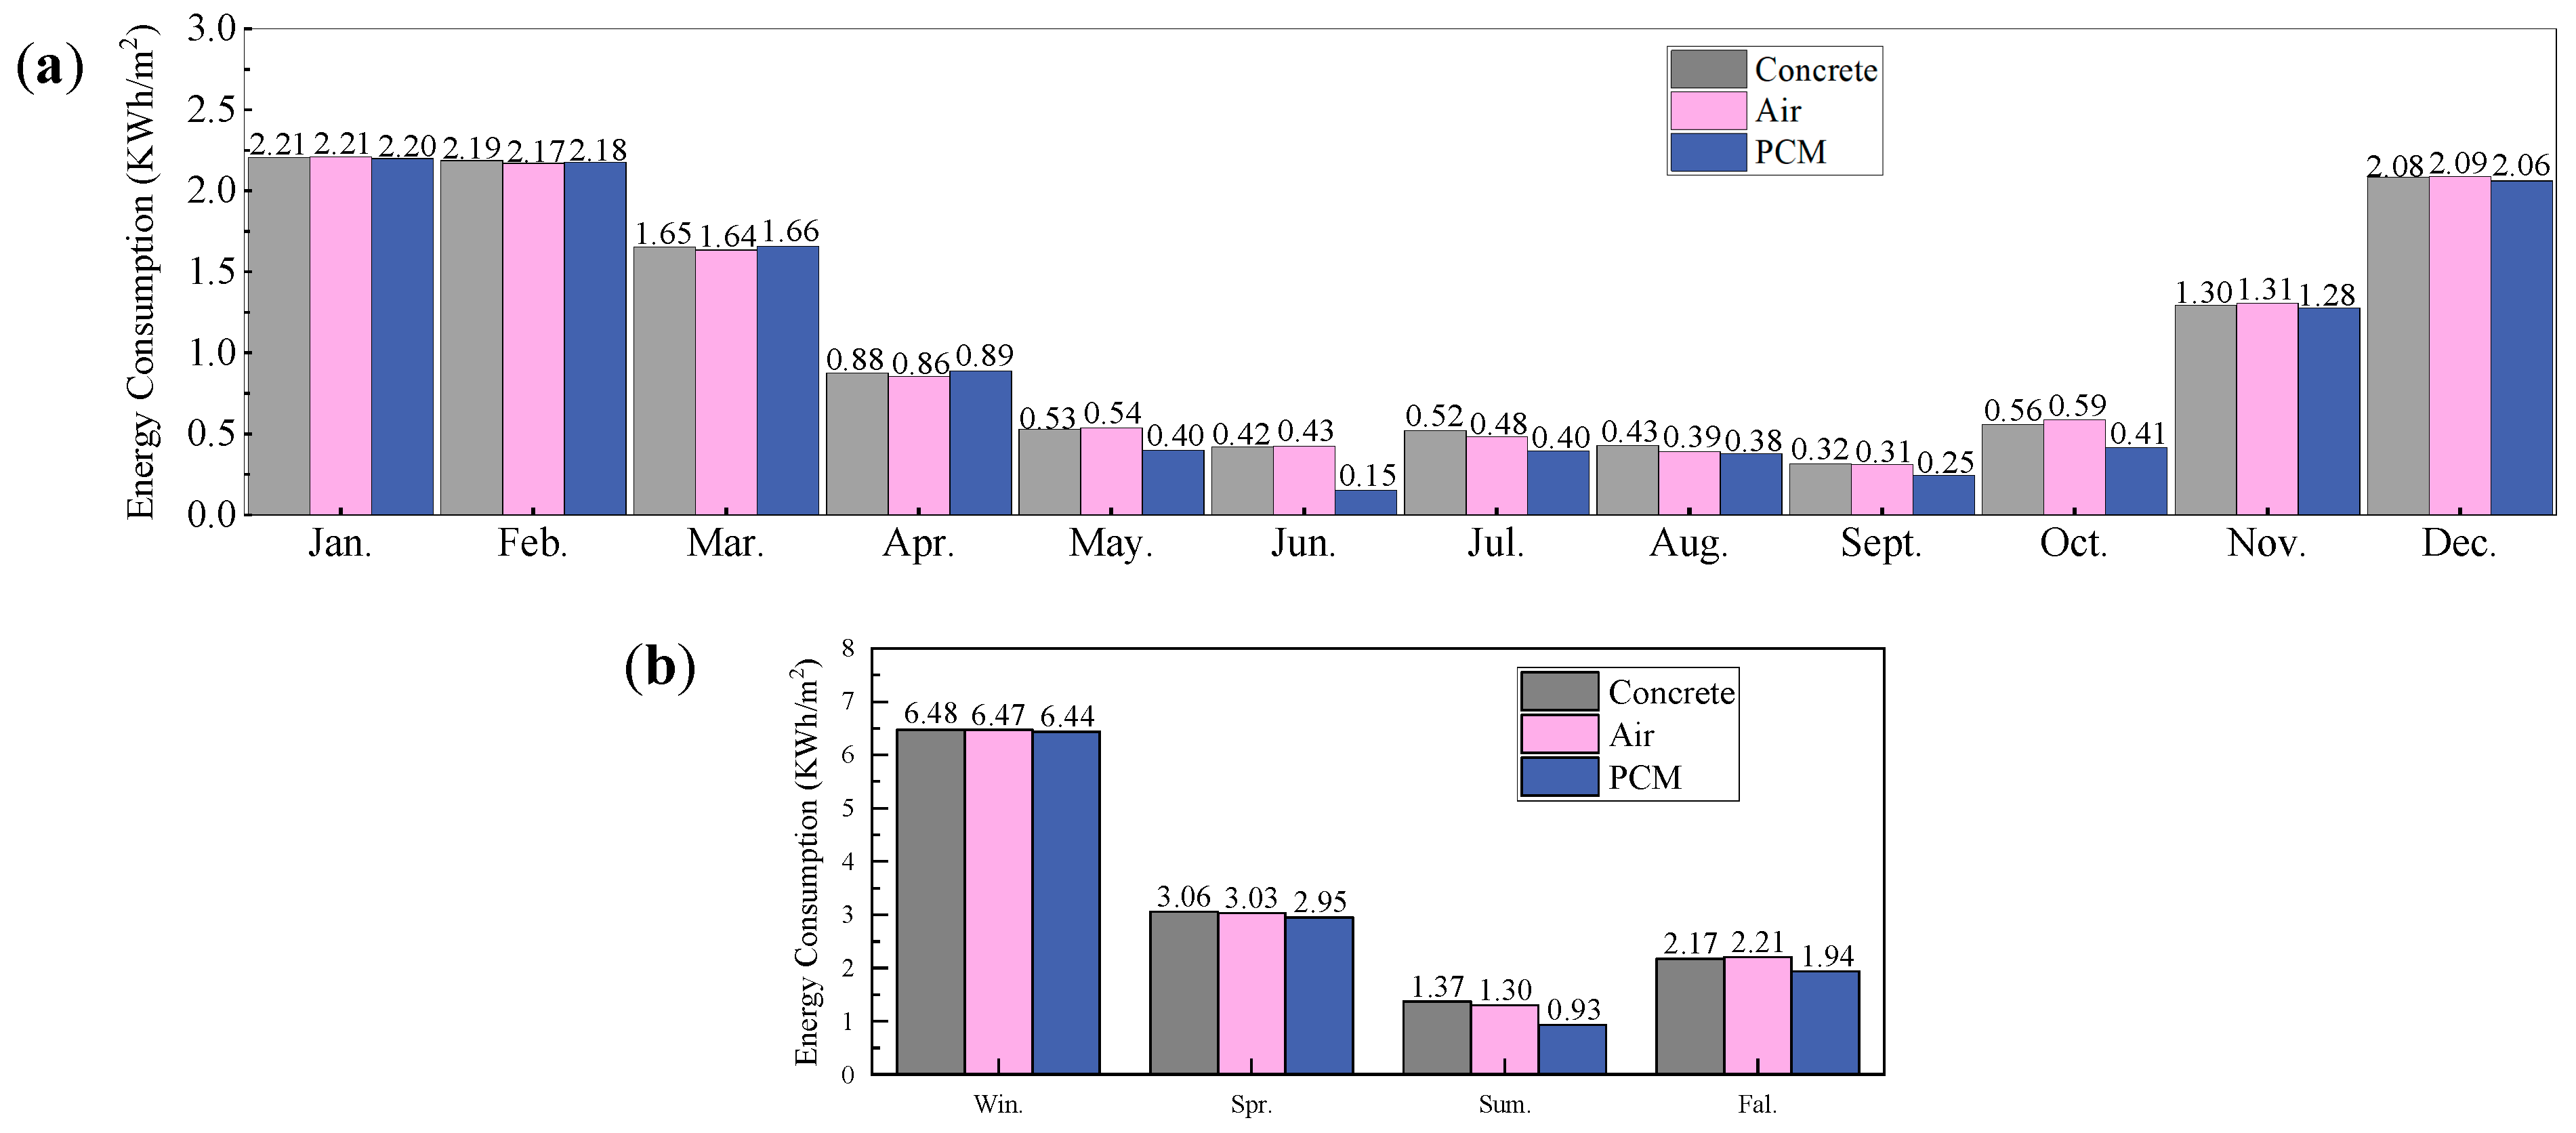
Figure 14 shows the monthly and seasonal energy consumption. With exceptions in February, March, and April, the energy consumption of PCM is slightly higher than air or concrete. In June, PCM achieves minimal energy consumption and the greatest reduction, with 65.12% and 64.29%. According to the Northern Hemisphere seasons, we divide these months into four seasons, including winter (December to February), spring (March to May), summer (June to August), and autumn (September to November). According to Figure 14b and Table 2, the PCM model demonstrates significant energy savings in summer, consuming only 0.93 kWh/m2, which is 28.46% and 32.12% less than air and concrete, respectively. In contrast, its winter energy consumption reductions are mere (0.46% and 0.62%) when consumption peaks for all models, as ambient temperatures in Beijing can drop far below the PCM’s phase change temperature. Consequently, the PCM is unable to leverage the energy storage benefits associated with the phase transition process. During the cool and warm seasons, spring and autumn remain relatively lower in energy consumption, with a reduction of 0.11 KWh/m2 (3.59%) and 0.23 KWh/m2 (10.60%) compared to concrete. As concluded in preceding chapters, the Paraffin exhibits limited performance in winter, but saves energy significantly in summer and ultimately results in reducing annual energy consumption.

5.3. Effect on Energy Prediction of Different PCMs

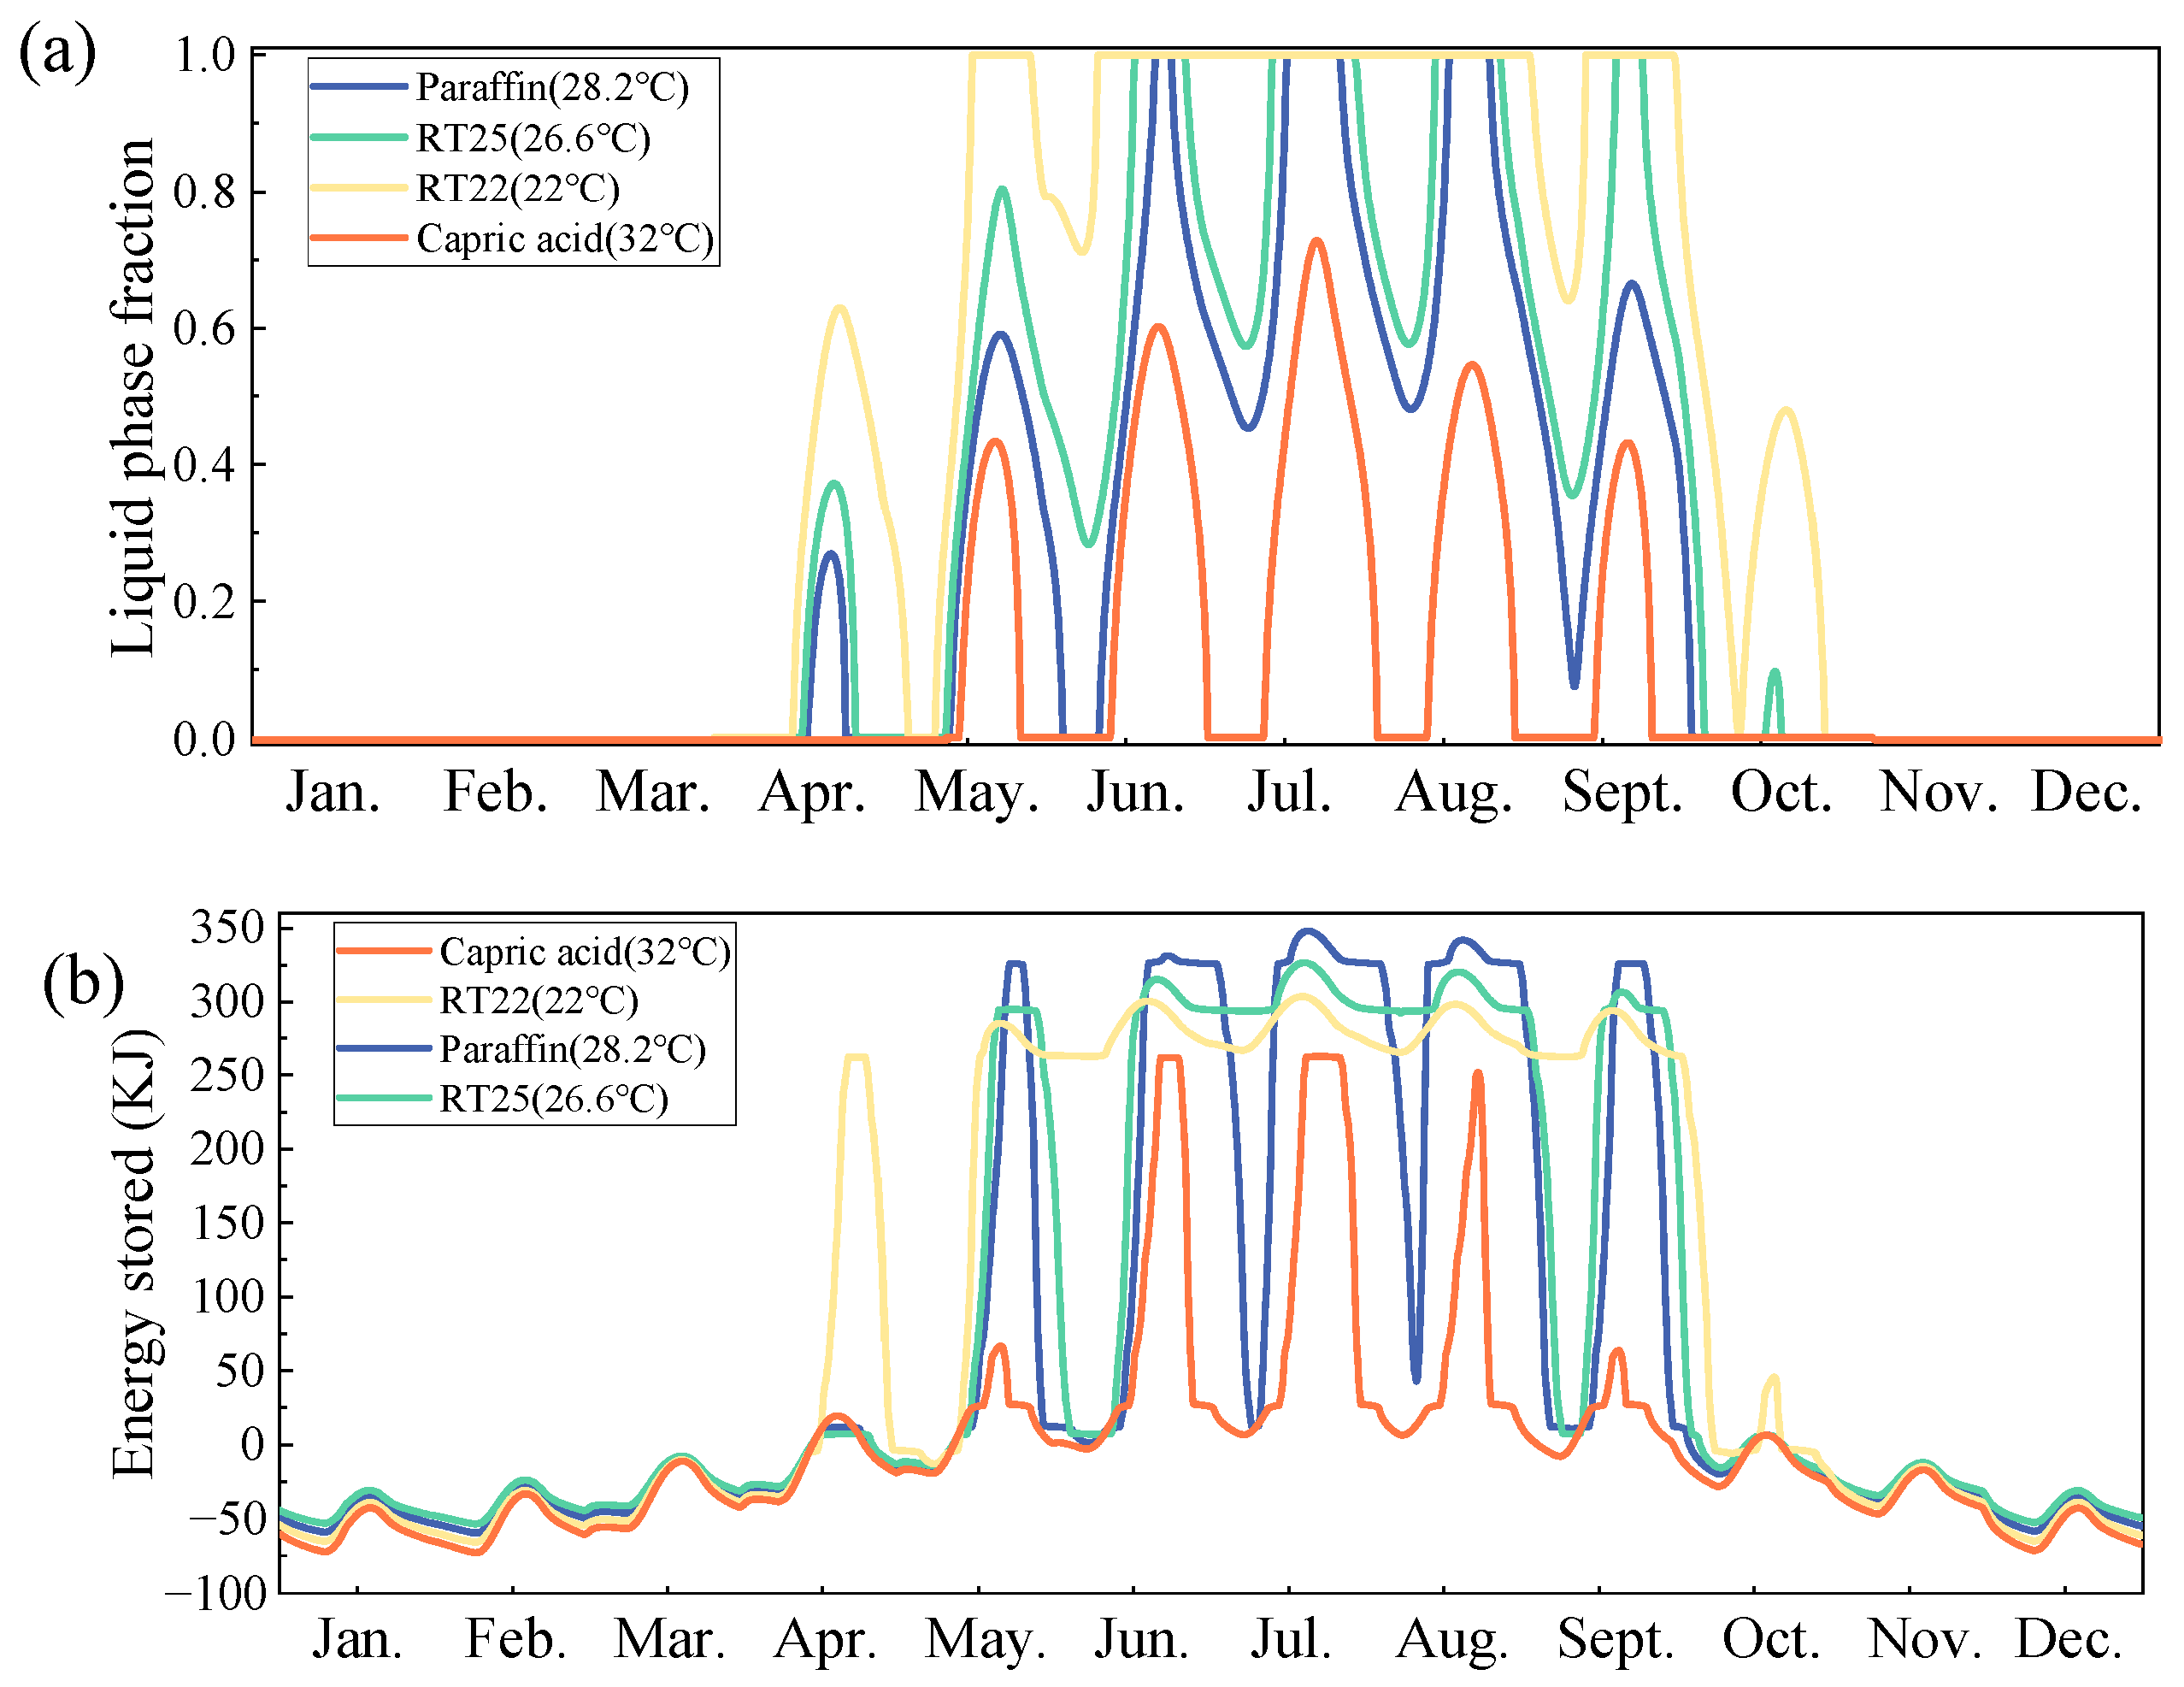
To evaluate the impact of PCMs on building thermal management, we assessed the performance of PCMs with distinct phase change temperatures. In Figure 15a, the liquid phase fractions of all PCMs maintain zero from January to March, indicating no phase change occurs during these periods due to ambient temperatures being below their phase change range. Under increasing ambient temperatures, PCMs behave according to their specific phase change points. RT22, with the lowest transition temperature at 22 °C, shows the earliest response. However, the indoor temperature of 26 °C is significantly higher, causing RT22 to absorb heat and slow the temperature rise. During hot weather, RT22 remains liquid and heat-saturated, unable to effectively release its stored latent heat at night, thus diminishing its thermal regulation effect. Capric acid, having a high phase change temperature, is only activated at elevated ambient temperatures and remains largely in a non-phase change state under normal indoor conditions, placing a continuous electrical load on the active system. Even during the peak summer months, it only partially melts, limiting latent heat utilization. RT25 and paraffin can initiate phase changes in spring and autumn, effectively buffering temperature fluctuations in summer. When outdoor temperatures exceed 26.6 °C, RT25 absorbs heat to block heat flow and releases latent heat below 26.6 °C to stabilize indoor temperature. Although paraffin possesses a higher latent heat capacity, resulting in greater total heat absorption (Figure 15b), its phase change initiation lags behind RT25, and it achieves only a small liquid phase fraction, thereby limiting its overall effectiveness. Its heat release often occurs when ambient temperature is already below 28.2 °C, increasing the energy burden on the active system to maintain a room temperature of 26 °C.
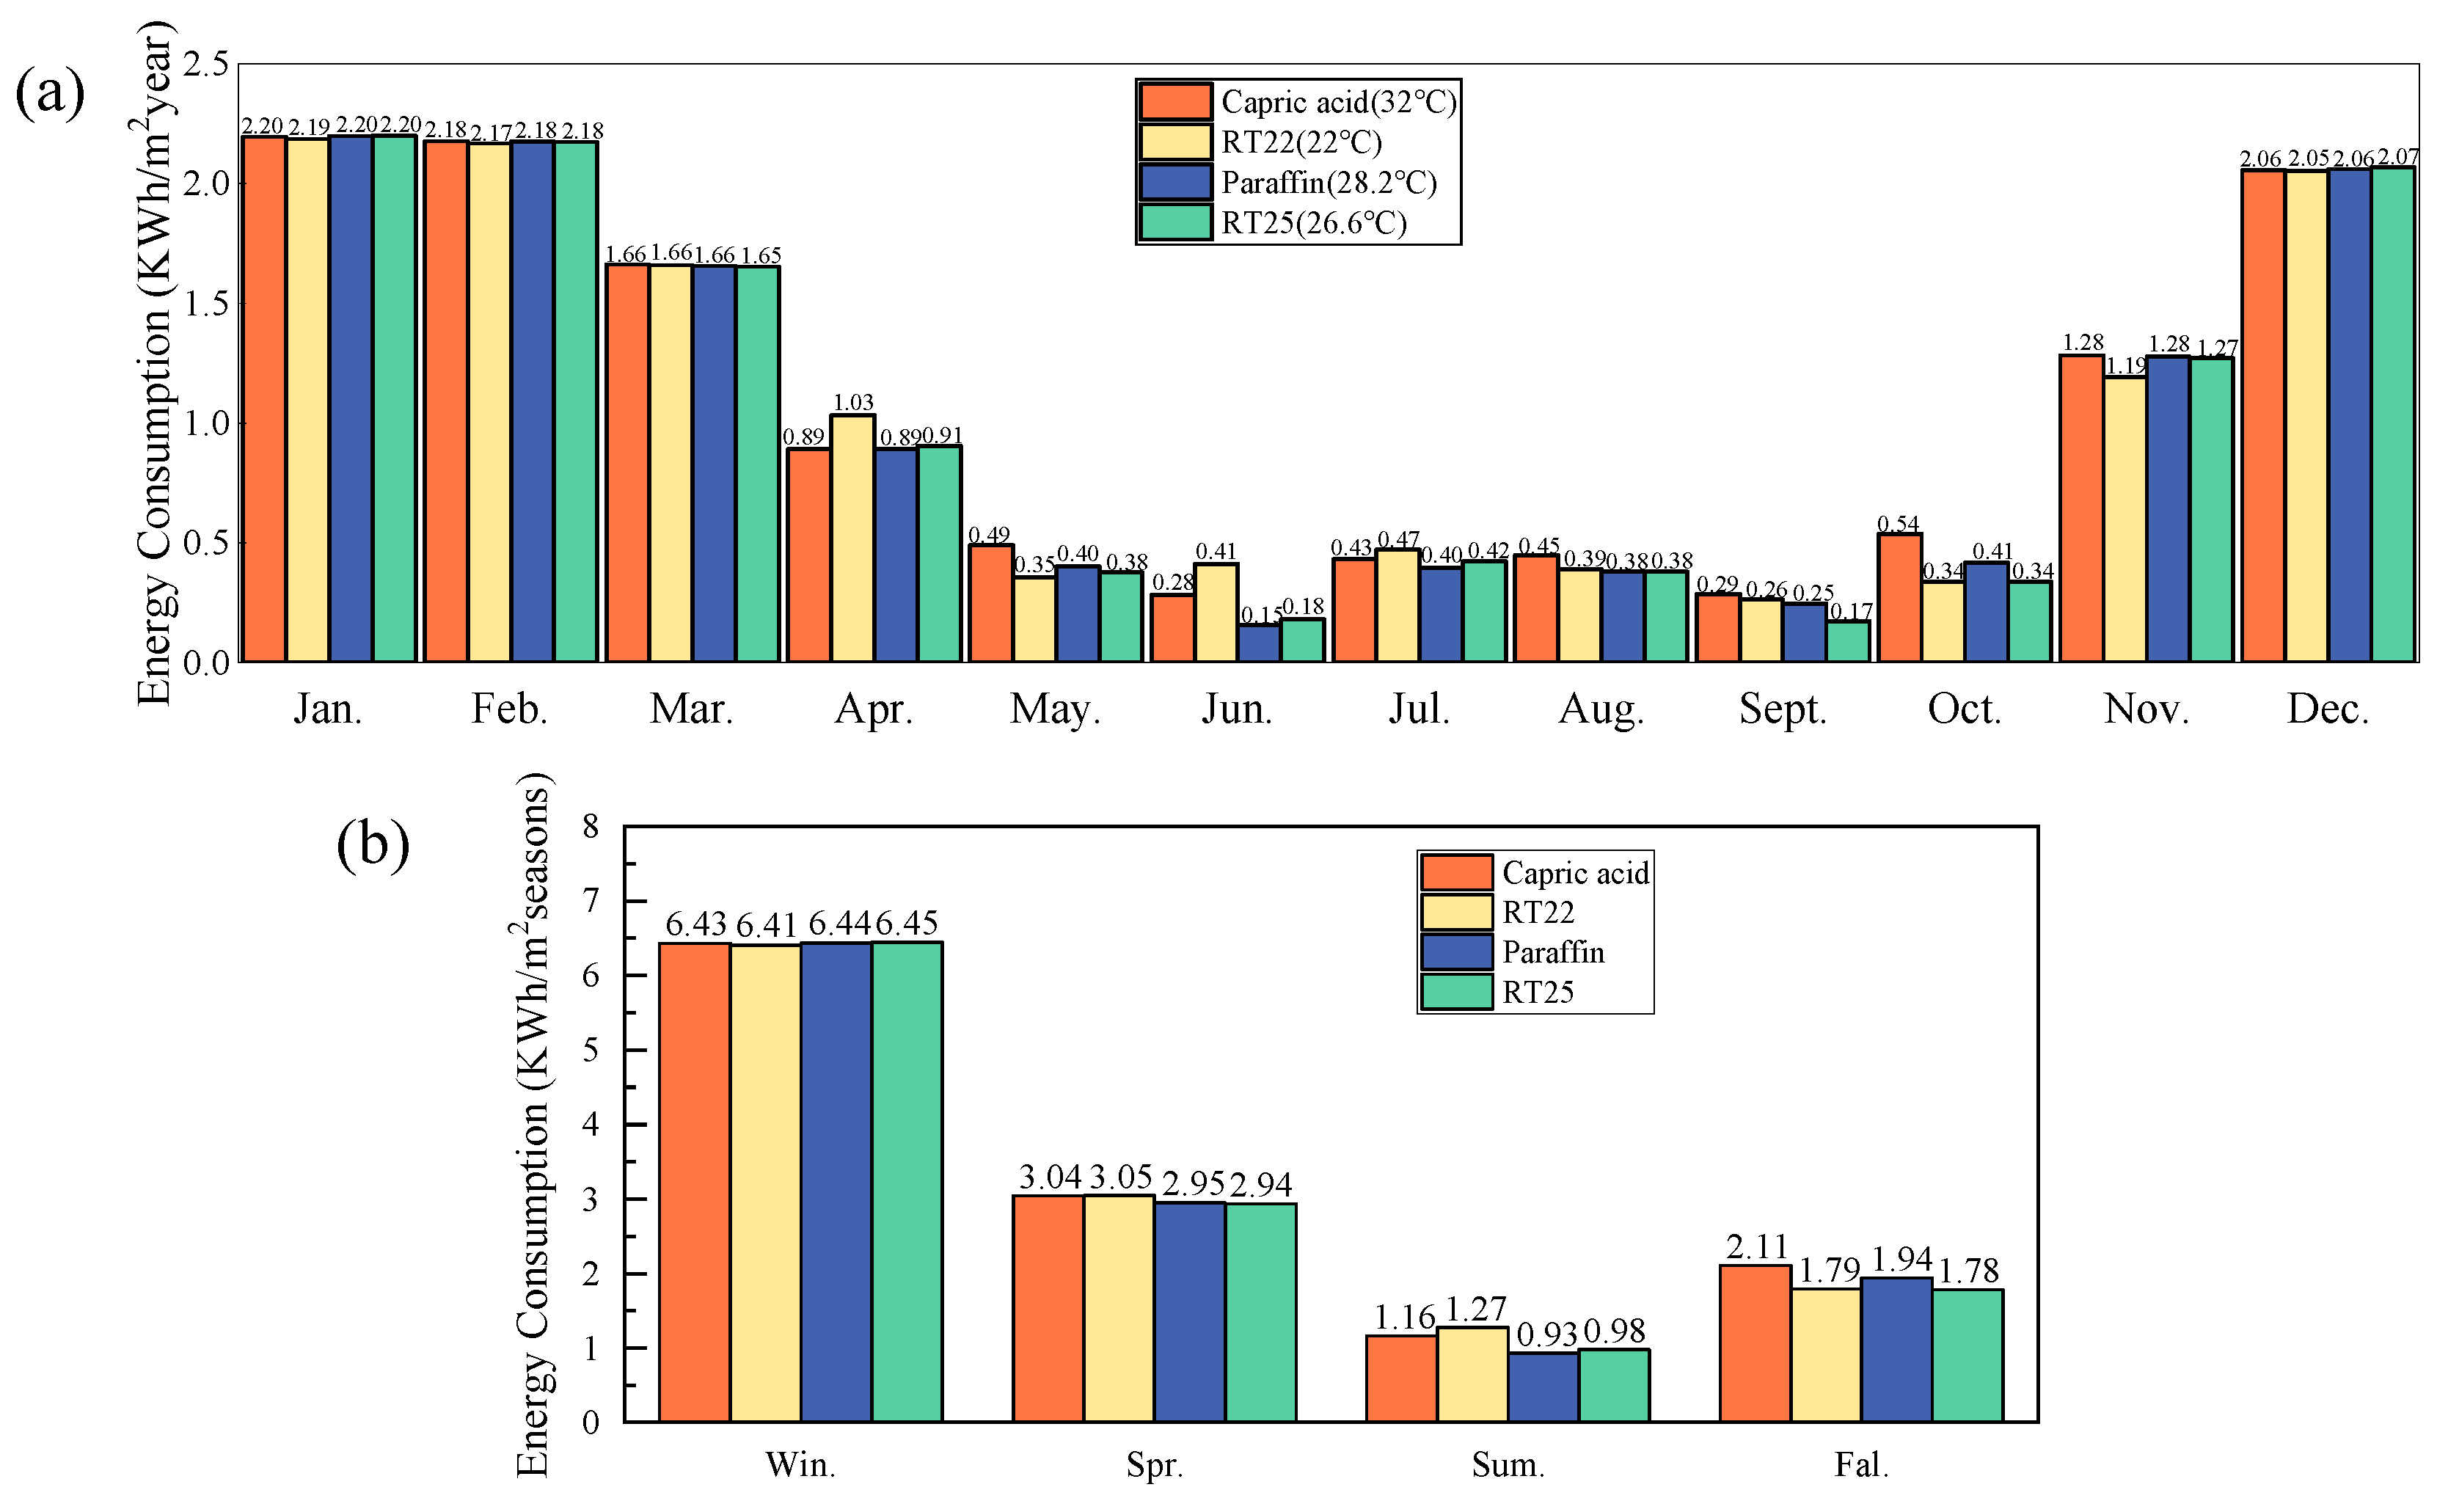
In Figure 16c, we have analyzed the energy consumption of buildings applying different phase change materials. Our findings suggest that RT25 has the lowest energy consumption, resulting in 0.87 KWh/m2 (6.69%), 0.94 KWh/m2 (7.19%), and 0.12 KWh/m2 (0.98%) less energy consumption compared to air, concrete, and the paraffin studied previously. Interestingly, in Figure 16a,b, the peak temperature and heat flux decreased under hotter climates (i.e., in summer) as the phase change temperature increased, which is consistent with Kant et al. [19]. Consequently, despite higher annual energy consumption, Paraffin outperforms RT25 in summer with 5.10% lower usage (Figure 17), particularly during June and July. The energy consumption of RT22 and capric acid throughout the year are 3.04% and 4.71% higher than RT25. As a result, the PCM with a phase change temperature closest to indoor temperature exhibits the optimized energy-saving effect. Conversely, a phase change temperature that is either higher or lower may not necessarily reduce energy consumption.

6. Conclusions

This study demonstrates that concrete walls integrated with PCM-filled honeycomb wallboards provide an effective passive solution for indoor temperature stabilization and energy savings. The hexagonal honeycomb structure proves particularly efficient for energy storage. Through the comparative analysis of the three envelopes, key findings are summarized as follows:
(i)
Annual energy consumption projections reveal a significant reduction of 5.76% and 6.27% when utilizing PCM-infused systems compared to air-filled and concrete-based building envelopes, respectively.
(ii)
The system exhibits strong climate-adaptive performance. While its effect is limited in cold seasons, it manifests a noteworthy potential for energy savings during scorching summers, reducing consumption by 28.46% and 32.12% compared to its air-filled counterpart and plain concrete, respectively.
(iii)
PCM performance is highly dependent on phase transition temperature. RT25 (26.6 °C) shows optimal annual performance due to its proximity to the comfort range. Seasonally, PCMs with lower phase transition temperatures could utilize latent heat storage effectively in winter, while capric acid (32 °C) proves most effective in summer by suppressing peak heat flow and blocking heat ingress. Thus, PCM selection must be tailored to specific climatic conditions for optimal energy efficiency.
The proposed model offers flexibility in optimizing building envelopes and PCM type based on seasonal and climatic demands, providing an effective means of achieving year-round passive temperature control and energy savings in buildings. However, this work has certain limitations. For example, it adopts a two-dimensional geometry and empirical convection correlations, which simplify the actual three-dimensional and localized heat transfer behavior. Furthermore, several critical gaps persist in practical applications. The discussion on structural integration is confined to basic compatibility with conventional composite concrete walls, neglecting adaptive designs for diverse building typologies. Durability lacks validation from long-term field tests, and leakage risks are not experimentally verified under extreme scenarios. Moreover, the cost–benefit analysis remains incomplete, as it overlooks the potential for large-scale production optimization and fails to conduct a comprehensive life-cycle assessment that accounts for long-term operational expenses and energy-saving benefits. To advance these findings, future efforts should prioritize experimental validation using lab-scale prototypes, along with the development of a high-fidelity 3D model capable of accurately resolving complex fluid flow and phase transition processes. Further research into integrating this PCM-composite system with active building energy systems is also recommended.

Author Contributions

Conceptualization, L.Z. (Lei Zhou), Z.W. and L.Z. (Liangliang Zhang); Methodology, Y.Z., L.Z. (Lei Zhou) and Z.W.; Software, Y.Z. and L.Z. (Lei Zhou); Validation, Y.Z. and L.Z. (Lei Zhou); Formal analysis, Y.Z., L.Z. (Lei Zhou) and L.Z. (Liangliang Zhang); Investigation, Y.Z. and L.Z. (Liangliang Zhang); Resources, Y.Y.; Data curation, Y.Z. and Y.Y.; Writing—original draft, Y.Z.; Writing—review & editing, Y.Y., L.Z. (Lei Zhou), G.L., Z.W. and L.Z. (Liangliang Zhang); Visualization, L.Z. (Lei Zhou); Supervision, Y.Y., G.L., Z.W. and L.Z. (Liangliang Zhang); Project administration, Y.Y., G.L. and L.Z. (Liangliang Zhang); Funding acquisition, Z.W. and L.Z. (Liangliang Zhang). All authors have read and agreed to the published version of the manuscript.

Funding

The authors acknowledge the financial support for this work provided by the National Natural Science Foundation of China (Grant Nos. 12102458, 52471288), the Chinese Universities Scientific Fund 2025TC014, the Guangdong Basic and Applied Basic Research Foundation (Grant No. 2024A1515011026), the Shenzhen Science and Technology Program (Grant Nos. JCYJ20220530115407016, KQTD20240729102052065), the SUSTech Higher Education Teaching Reform Project (Grant No. SJZLGC202439), and the Innovation Fund of China Ship Development and Design Center (Grant No. 2023701-10).

Data Availability Statement

The original contributions presented in this study are included in the article. Further inquiries can be directed to the corresponding authors.

Conflicts of Interest

The authors declare no conflict of interest.

Nomenclature

Abbreviation
u velocity vector[m/s]
Ttemperature°C
ttime[s]
ppressure[Pa]
mmass[kg]
Cmushy zone constant[kg/(m3·s)]
ρdensity[kg/m3]
kthermal conductivity[W/m·k)]
Cpspecific heat capacity[J/(kg·K)]
ggravitational acceleration[m/s2]
Tmmelting temperature[°C]
Lflatent heat of fusion[kJ/kg]
Tiniinitial temperature[°C]
Lclength of honeycomb cell[mm]
hconvective heat transfer coefficient[W/(m2·K)]
B(T)liquid phase fraction
Etotal energy stored[J]
Tamboutdoor ambient temperature
I(t)solar radiation.
ΔTtransition temperature[°C]
vwind velocity[m/s]
SEspecific energy[Wh/kg]
SPspecific power [W/kg]
Greek symbol
β thermal expansion coefficient[1/K]
α solar absorptivity
δ thickness of honeycomb cell [mm]
μ dynamic viscosity[Pa·s]
Subscript
ssolid phase of PCM
lliquid phase of PCM
eexternal surface
iinner surface
ambambient
platealuminum alloy plate
concreteconcrete

References

  1. Cao, Z.; Zhang, G.; Shi, Y.; Xu, C.; Sun, Y. Thermal behavior of phase change plates using tunnel lining GHEs for cool storage: Effect of pipe design parameters and PCM latent heat. Energy Build. 2023, 301, 113737. [Google Scholar] [CrossRef]
  2. Han, X.X.; Tian, Y.; Zhao, C.Y. An effectiveness study of enhanced heat transfer in phase change materials (PCMs). Int. J. Heat Mass Transf. 2013, 60, 459–468. [Google Scholar] [CrossRef]
  3. Liu, L.; Wang, Y.; Wang, Z.; Li, S.; Li, J.; He, G.; Li, Y.; Liu, Y.; Piao, S.; Gao, Z.; et al. Potential contributions of wind and solar power to China’s carbon neutrality. Resour. Conserv. Recycl. 2022, 180, 106155. [Google Scholar] [CrossRef]
  4. Jayathunga, D.S.; Karunathilake, H.P.; Narayana, M.; Witharana, S. Phase change material (PCM) candidates for latent heat thermal energy storage (LHTES) in concentrated solar power (CSP) based thermal applications—A review. Renew. Sustain. Energy Rev. 2024, 189, 113904. [Google Scholar] [CrossRef]
  5. Abdulateef, A.M.; Jaszczur, M.; Hassan, Q.; Anish, R.; Niyas, H.; Sopian, K.; Abdulateef, J. Enhancing the melting of phase change material using a fins–nanoparticle combination in a triplex tube heat exchanger. J. Energy Storage 2021, 35, 102227. [Google Scholar] [CrossRef]
  6. Pielichowska, K.; Szatkowska, M.; Pielichowski, K. Thermal Energy Storage in Bio-Inspired PCM-Based Systems. Energies 2025, 18, 3548. [Google Scholar] [CrossRef]
  7. Ni, S.; Zhu, N.; Hou, Y.; Zhang, Z. Research on indoor thermal comfort and energy consumption of zero energy wooden structure buildings in severe cold zone. J. Build. Eng. 2023, 67, 105965. [Google Scholar] [CrossRef]
  8. Li, Q.; Zhang, L.; Zhang, L.; Wu, X. Optimizing energy efficiency and thermal comfort in building green retrofit. Energy 2021, 237, 121509. [Google Scholar] [CrossRef]
  9. Lin, Q.; Chen, Y.-C.; Chen, F.; DeGanyar, T.; Yin, H. Design and experiments of a thermoelectric-powered wireless sensor network platform for smart building envelope. Appl. Energy 2022, 305, 117791. [Google Scholar] [CrossRef]
  10. Lin, Q.; Zhang, Y.; Van Mieghem, A.; Chen, Y.C.; Yu, N.; Yang, Y.; Yin, H. Design and experiment of a sun-powered smart building envelope with automatic control. Energy Build. 2020, 223, 110173. [Google Scholar] [CrossRef]
  11. Lin, Q.; Chen, F.; Yin, H. Experimental and theoretical investigation of the thermo-mechanical deformation of a functionally graded panel. Eng. Struct. 2017, 138, 17–26. [Google Scholar] [CrossRef]
  12. Zhang, G.; Zhang, Y.; Wang, T.; Zhang, L.; Gao, Y. Thermoelastic behavior analysis of finite composites embedded in ellipsoidal inhomogeneities with inclusion-based boundary element method. Int. J. Solids Struct. 2025, 309, 113172. [Google Scholar] [CrossRef]
  13. Bayram, M.; Ustaoglu, A.; Kursuncu, B.; Hekimoglu, G.; Sari, A.; Ugur, L.O.; Subasi, S.; Gencel, O.; Ozbakkaloglu, T. 3D-printed polylactic acid-microencapsulated phase change material composites for building thermal management. Renew. Sustain. Energy Rev. 2024, 191, 114150. [Google Scholar] [CrossRef]
  14. Alshammari, T.O.; Ahmad, S.F.; Houran, M.A.; Agrawal, M.K.; Pulla, S.F.; Nutakki, T.U.K.; Albani, A.; Youshanlouei, H.M. Thermal energy simulation of the building with heating tube embedded in the wall in the presence of different PCM materials. J. Energy Storage 2023, 73, 109134. [Google Scholar] [CrossRef]
  15. Wang, Z.; Wang, M.; Qin, H. The energy storage characteristic analysis and optimization of latent heat energy storage component with finned tubes in building envelope. Case Stud. Therm. Eng. 2022, 33, 101946. [Google Scholar] [CrossRef]
  16. Krasoń, J.; Miąsik, P.; Starakiewicz, A.; Lichołai, L. Thermal Energy Storage Possibilities in the Composite Trombe Wall Modified with a Phase Change Material. Energies 2025, 18, 1433. [Google Scholar] [CrossRef]
  17. Anter, A.G.; Sultan, A.A.; Hegazi, A.A.; El Bouz, M.A. Thermal performance and energy saving using phase change materials (PCM) integrated in building walls. J. Energy Storage 2023, 67, 107568. [Google Scholar] [CrossRef]
  18. Alawadhi, E.M. Thermal analysis of a building brick containing phase change material. Energy Build. 2008, 40, 351–357. [Google Scholar] [CrossRef]
  19. Kant, K.; Shukla, A.; Sharma, A. Heat transfer studies of building brick containing phase change materials. Sol. Energy 2017, 155, 1233–1242. [Google Scholar] [CrossRef]
  20. Silva, T.; Vicente, R.; Soares, N.; Ferreira, V. Experimental testing and numerical modelling of masonry wall solution with PCM incorporation: A passive construction solution. Energy Build. 2012, 49, 235–245. [Google Scholar] [CrossRef]
  21. Wang, Q.; Wu, R.; Wu, Y.; Zhao, C.Y. Parametric analysis of using PCM walls for heating loads reduction. Energy Build. 2018, 172, 328–336. [Google Scholar] [CrossRef]
  22. Fateh, A.; Borelli, D.; Devia, F.; Weinläder, H. Summer thermal performances of PCM-integrated insulation layers for light-weight building walls: Effect of orientation and melting point temperature. Therm. Sci. Eng. Prog. 2018, 6, 361–369. [Google Scholar] [CrossRef]
  23. Hosseinzadeh Kh Montazer, E.; Shafii, M.B.; Ganji, A.R.D. Solidification enhancement in triplex thermal energy storage system via triplets fins configuration and hybrid nanoparticles. J. Energy Storage 2021, 34, 102177. [Google Scholar] [CrossRef]
  24. Sathyamurthy, R. Silver (Ag) based nanoparticles in paraffin wax as thermal energy storage for stepped solar still—An experimental approach. Sol. Energy 2023, 262, 111808. [Google Scholar] [CrossRef]
  25. Kant, K.; Shukla, A.; Sharma, A.; Biwole, P.H. Heat transfer study of phase change materials with graphene nano particle for thermal energy storage. Sol. Energy 2017, 146, 453–463. [Google Scholar] [CrossRef]
  26. Deng, Z.; Liu, X.; Zhang, C.; Huang, Y.; Chen, Y. Melting behaviors of PCM in porous metal foam characterized by fractal geometry. Int. J. Heat Mass Transf. 2017, 113, 1031–1042. [Google Scholar] [CrossRef]
  27. Chen, Z.; Gao, D.; Shi, J. Experimental and numerical study on melting of phase change materials in metal foams at pore scale. Int. J. Heat Mass Transf. 2014, 72, 646–655. [Google Scholar] [CrossRef]
  28. Ji, C.; Qin, Z.; Dubey, S.; Choo, F.H.; Duan, F. Simulation on PCM melting enhancement with double-fin length arrangements in a rectangular enclosure induced by natural convection. Int. J. Heat Mass Transf. 2018, 127, 255–265. [Google Scholar] [CrossRef]
  29. Biwole, P.H.; Groulx, D.; Souayfane, F.; Chiu, T. Influence of fin size and distribution on solid-liquid phase change in a rectangular enclosure. Int. J. Therm. Sci. 2018, 124, 433–446. [Google Scholar] [CrossRef]
  30. Mortazavi, A.; Morciano, M.; Asinari, P.; Chiavazzo, E. Topology-Optimized Latent Heat Battery: Benchmarking Against a High-Performance Geometry. Energies 2025, 18, 4054. [Google Scholar] [CrossRef]
  31. Liu, F.; Wang, J.; Liu, Y.; Wang, F.; Yang, N.; Liu, X.; Liu, H.; Li, W.; Liu, H.; Huang, B. Performance analysis of phase change material in battery thermal management with biomimetic honeycomb fin. Appl. Therm. Eng. 2021, 196, 117296. [Google Scholar] [CrossRef]
  32. Corgnale, C.; Hardy, B.; Chahine, R.; Cossement, D. Hydrogen desorption using honeycomb finned heat exchangers integrated in adsorbent storage systems. Appl. Energy 2018, 213, 426–434. [Google Scholar] [CrossRef]
  33. Zhang, G.; Zhang, L.; Lei, G.; Gao, Y. Estimation of heat transfer and thermal conductivity of particle-reinforced hollow cylinder composites. Mech. Adv. Mater. Struct. 2024, 31, 13195–13209. [Google Scholar] [CrossRef]
  34. Lai, C.; Hokoi, S. Thermal performance of an aluminum honeycomb wallboard incorporating microencapsulated PCM. Energy Build. 2014, 73, 37–47. [Google Scholar] [CrossRef]
  35. Wang, S.-M.; Matiašovský, P.; Mihálka, P.; Lai, C.-M. Experimental investigation of the daily thermal performance of a mPCM honeycomb wallboard. Energy Build. 2018, 159, 419–425. [Google Scholar] [CrossRef]
  36. Hasse, C.; Grenet, M.; Bontemps, A.; Dendievel, R.; Sallée, H. Realization, test and modelling of honeycomb wallboards containing a Phase Change Material. Energy Build. 2011, 43, 232–238. [Google Scholar] [CrossRef]
  37. Kočí, J.; Fořt, J.; Černý, R. Energy efficiency of latent heat storage systems in residential buildings: Coupled effects of wall assembly and climatic conditions. Renew. Sustain. Energy Rev. 2020, 132, 110097. [Google Scholar] [CrossRef]
  38. Thiele, A.M.; Sant, G.; Pilon, L. Diurnal thermal analysis of microencapsulated PCM-concrete composite walls. Energy Convers. Manag. 2015, 93, 215–227. [Google Scholar] [CrossRef]
  39. Liu, C.; Zhou, Y.; Li, D.; Meng, F.; Zheng, Y.; Liu, X. Numerical analysis on thermal performance of a PCM-filled double glazing roof. Energy Build. 2016, 125, 267–275. [Google Scholar] [CrossRef]
  40. Xihe Energy Big Data Platform. Available online: http://xihe-energy.com (accessed on 4 June 2023).
  41. Groulx, D.; Biwole, P.H.; Bhouri, M. Phase change heat transfer in a rectangular enclosure as a function of inclination and fin placement. Int. J. Therm. Sci. 2020, 151, 106260. [Google Scholar] [CrossRef]
  42. Zhao, D.; Tan, G. Numerical analysis of a shell-and-tube latent heat storage unit with fins for air-conditioning application. Appl. Energy 2015, 138, 381–392. [Google Scholar] [CrossRef]
  43. Liu, H.; Chen, Z.; Han, Q.; Chen, B.; Bu, Y. Study on the thermal behavior of aluminum reticulated shell structures considering solar radiation. Thin-Walled Struct. 2014, 85, 15–24. [Google Scholar] [CrossRef]
  44. Jennings, B. Environmental Engineering; International Textbook Company: Scranton, PA, USA, 1970. [Google Scholar]
  45. Test, F.L.; Lessmann, R.C.; Johary, A. Heat Transfer During Wind Flow over Rectangular Bodies in the Natural Environment. J. Heat Transf. 1981, 103, 262–267. [Google Scholar] [CrossRef]
  46. Kant, K.; Shukla, A.; Sharma, A.; Biwole, P.H. Melting and solidification behaviour of phase change materials with cyclic heating and cooling. J. Energy Storage 2018, 15, 274–282. [Google Scholar] [CrossRef]
  47. Karami, R.; Kamkari, B. Investigation of the effect of inclination angle on the melting enhancement of phase change material in finned latent heat thermal storage units. Appl. Therm. Eng. 2019, 146, 45–60. [Google Scholar] [CrossRef]
  48. Voller, V.R.; Prakash, C. A fixed grid numerical modelling methodology for convection-diffusion mushy region phase-change problems. Int. J. Heat Mass Transf. 1987, 30, 1709–1719. [Google Scholar] [CrossRef]
  49. Moench, S.; Dittrich, R. Influence of Natural Convection and Volume Change on Numerical Simulation of Phase Change Materials for Latent Heat Storage. Energies 2022, 15, 2746. [Google Scholar] [CrossRef]
  50. Kant, K.; Biwole, P.H.; Shukla, A.; Sharma, A.; Gorjian, S. Heat transfer and energy storage performances of phase change materials encapsulated in honeycomb cells. J. Energy Storage 2021, 38, 102507. [Google Scholar] [CrossRef]
  51. Kamkari, B.; Shokouhmand, H. Experimental investigation of phase change material melting in rectangular enclosures with horizontal partial fins. Int. J. Heat Mass Transf. 2014, 78, 839–851. [Google Scholar] [CrossRef]
  52. Zhao, W.; Yu, G.; Li, S.; Liu, Z.; Wu, L. Rate capability and Ragone plots for thermal management multifunctional structure designing. Int. J. Mech. Sci. 2023, 252, 108367. [Google Scholar] [CrossRef]
Figure 1. Operation of honeycomb-like wallboard incorporating PCM for building cooling during day and night: (a) PCM absorbs heat during the day and (b) releases heat at night.
Energies 18 05720 g001
Figure 2. Honeycomb-like wallboard containing PCM and internal structure.
Energies 18 05720 g002
Figure 3. A prototype model that serves as a passive thermoregulating system in houses to enhance thermal comfort and three computational models for comparative analysis: (a) the prototype of honeycomb wallboard covered as building envelope materials on concrete and (bd) three models: concrete, concrete covered by honeycomb wallboard, and concrete covered by honeycomb wallboard containing PCM.
Energies 18 05720 g003
Figure 4. Variations in ambient temperature, solar radiation, and wind speed for three typical days in summer and winter, respectively, and 12 design days for Beijing. (ad). Hourly variations for summer and winter. (e,f) 12 design days based on the hourly averaged data from each month.
Energies 18 05720 g004
Figure 5. Sensitivity test for different grids.
Energies 18 05720 g005
Figure 6. Verification of the temperature and stored energy results with Kant et al. [50].
Energies 18 05720 g006
Figure 7. Validation of numerical model with experiment of Kamkari et al. [51]: (a) the liquid fraction (b) point temperature.
Energies 18 05720 g007
Figure 8. Schematic diagrams of the different structures evaluated for energy storage efficiency: (a) hexagon, (b) square, (c) triangle, and (d) circle.
Energies 18 05720 g008
Figure 9. Results for SE and SP across different shapes.
Energies 18 05720 g009
Figure 10. The inner wall temperature and heat flux over a three-day period in winter: (a) inner wall temperature (b) inner wall heat flux.
Energies 18 05720 g010
Figure 11. Liquid phase fraction within the PCM and corresponding energy consumption for each of the three days in winter and summer: (a) liquid phase fraction within the PCM and (b) energy consumption for each of the three days in winter and summer.
Energies 18 05720 g011
Figure 12. The inner wall temperature and heat flux over a three-day period in summer: (a) inner wall temperature (b) inner wall heat flux.
Energies 18 05720 g012
Figure 13. The inner wall temperature, heat flux and energy consumption over a whole year: (a) inner wall temperature (b) inner wall heat flux (c) energy consumption.
Energies 18 05720 g013
Figure 14. The energy consumption monthly and seasonal: (a) monthly energy consumption (b) energy consumption in every season.
Energies 18 05720 g014
Figure 15. Liquid phase fraction and energy stored in PCMs: (a) liquid phase fraction, and (b) energy stored in PCMs.
Energies 18 05720 g015
Figure 16. The inner wall temperature, heat flux and energy consumption of PCMs over a whole year: (a) inner wall temperature, (b) inner wall heat flux, (c) energy consumption.
Energies 18 05720 g016
Figure 17. Monthly and seasonal energy consumption of PCMs: (a) monthly energy consumption (b) energy consumption in every season.
Energies 18 05720 g017
Table 1. Thermophysical properties of metal fin and concrete and PCMs [19,25,41,42].
PropertiesParaffin [19]RT25 [41]RT22 [42]Capric Acid [25]Aluminum AlloyConcrete
Specific
[J/(kg·K)]
1934 (s)1800 (s)20001900 (s)900880
2196 (l)2400 (l)2400 (l)
Density
[kg/m3]
814 (s)785 (s)880 (s)1018 (s)27002300
775 (l)749 (l)770 (l)888 (l)
Thermal conductivity
[W/(m·K)]
0.350 (s)0.19 (s)0.20.372 (s)2011.8
0.149 (l)0.18 (l)0.153 (l)
Melting temperature [°C]28.226.62232NANA
Latent heat
[kJ/kg]
245232200152.7NANA
Thermal expansion coefficient
[1/K]
9.1 × 10−410−310−310−3NANA
Kinematic viscosity
[m2/s]
5 × 10⁻⁶NANA3 × 10−6NANA
Dynamic Viscosity [Pa·s]NA1.798 × 10−33.2 × 10⁻³NANANA
l (liquid), s (solid), NA (not applicable).
Table 2. The energy consumption in different seasons and models.
SeasonsConcreteAirPCM
Win.6.486.476.44Energy Consumption (KWh/m2)
0.620.150.46Reduction (%)
Spr.3.063.032.95Energy Consumption (KWh/m2)
3.590.982.64Reduction (%)
Sum.1.371.300.93Energy Consumption (KWh/m2)
32.125.1128.46Reduction (%)
Fal.2.172.211.94Energy Consumption (KWh/m2)
10.60−1.8412.22Reduction (%)
Covered by honeycomb wallboard containing PCMs
VS
Concrete
Covered by honeycomb wallboard
VS
Concrete
Covered by honeycomb wallboard containing PCMs
VS
Covered by honeycomb wallboard
Disclaimer/Publisher’s Note: The statements, opinions and data contained in all publications are solely those of the individual author(s) and contributor(s) and not of MDPI and/or the editor(s). MDPI and/or the editor(s) disclaim responsibility for any injury to people or property resulting from any ideas, methods, instructions or products referred to in the content.