Abstract
The evaluation of the fracturing effect of coalbed methane (CBM) wells is crucial for the efficient development of CBM reservoirs. Currently, studies focusing on the evaluation of the hydraulic fracture stimulation effect of coal seams and the integrated analysis of “drilling-fracturing-monitoring” are relatively insufficient. Therefore, this paper takes three drainage and production wells in the coalbed methane block on the northwest wing of the Xiangxia anticline in the Bijie Experimental Zone of Guizhou Province as the research objects. In view of the complex geological characteristics of this area, such as multiple and thin coal seams, high gas content, and high stress and low permeability, the paper systematically summarizes the results of drilling and fracturing engineering practices of the three drainage and production wells in the area, including the application of key technologies such as a two-stage wellbore structure and the “bentonite slurry + low-solid-phase polymer drilling fluid” system to ensure wellbore stability, low-solid-phase polymer drilling fluid for wellbore protection, and staged temporary plugging fracturing. On this basis, a study on microseismic signal acquisition and tomographic energy inversion based on a ground dense array was carried out, achieving four-dimensional dynamic imaging and quantitative interpretation of the fracturing fractures. The results show that the fracturing fractures of the three drainage and production wells all extend along the direction of the maximum horizontal principal stress, with azimuths concentrated between 88° and 91°, which is highly consistent with the results of the in situ stress calculation from the previous drilling engineering. The overall heterogeneity of the reservoir leads to the asymmetric distribution of fractures, with the transformation intensity on the east side generally higher than that on the west side, and the maximum stress deformation influence radius reaching 150 m. The overall transformation effect of each well is good, with the effective transformation volume ratio of fracturing all exceeding 75%, and most of the target coal seams are covered by the fracture network, significantly improving the fracture connectivity. From the perspective of the transformed planar area per unit fluid volume, although there are numerical differences among the three wells, they are all within the effective transformation range. This study shows that microseismic fracture monitoring technology can provide a key basis for the optimization of fracturing technology and the evaluation of the production increase effect, and offers a solution to the problem of evaluating the hydraulic fracture stimulation effect of coal seams.
1. Introduction
Coalbed methane (CBM) refers to hydrocarbon gas existing in coal seams, whose main component is methane. Most of it is adsorbed on the surface of coal matrix, while a small part exists freely in coal pores or is dissolved in coalbed methane water [1]. This gas has a calorific value comparable to that of conventional natural gas; using it for power generation or as a fuel can reduce emissions of pollutants such as sulfur dioxide and nitrogen oxides. Meanwhile, the risk of coal gas outburst can be reduced through advanced extraction [2,3], thus bearing dual strategic significance for ensuring safe coal mine production, supplementing clean energy supply, and advancing the realization of the “dual carbon” goals [4,5,6].
China is rich in CBM resources, with total geological reserves exceeding 35 × 1012 m3, boasting great development potential [7]. In recent years, with the advancement of development technologies, multiple breakthroughs have been achieved domestically. In 2021, the Jishen 6-7 Ping 01 horizontal well in Daning Jixian County, Eastern Hubei, with a coal seam vertical depth of 2200 m and a horizontal section length of 1000 m, tested ultra-large-scale extreme fracturing technology. After being put into production, its daily gas production successfully exceeded 100,000 m3, making it China’s first CBM well with a daily gas production of over 100,000 m3 [8]. The NY1 ultra-deep CBM vertical well constructed in southeastern Chongqing by Sinopec involves two coal seams with a burial depth ranging from 1873 m to 1903 m and a cumulative thickness of 6 m. After fracturing and combined production, the well maintained a stable daily output of 2800–3000 m3, achieving the first breakthrough in the development of deep CBM wells in southern China [9]. These achievements confirm the development value of China’s CBM resources, yet complex geological conditions remain a core constraint to large-scale development.
In actual CBM production operations, due to multiple tectonic movements experienced by coal seams during their formation, folds and faults are widespread in major CBM-bearing basins in China [10], resulting in coal reservoirs exhibiting characteristics such as strong heterogeneity, high in situ stress, and low permeability. Geological conditions of coal seams—including coal reservoir characteristics, coal seam gas content, reservoir pressure, and reservoir permeability—exert a critical impact on CBM productivity. Parameters must be optimized based on specific geological conditions; otherwise, it is difficult to adapt to the complex reservoir characteristics. The aforementioned geological complexity and technical challenges are particularly prominent in CBM development in southern China. As one of the core areas and important development bases for CBM resources in southern China [11], Guizhou Province’s development practices hold exemplary significance for solving CBM production problems under complex geological conditions in southern regions. Bijie City, located in northwestern Guizhou, is rich in CBM resources, with a gas-bearing area of over 10,000 km2 at a burial depth of less than 2000 m and a predicted resource volume exceeding 1 trillion m3. Among them, Zhijin County has a CBM geological resource volume of over 200 billion m3 and high resource abundance, demonstrating significant development potential [12]. The CBM block in the northwest limb of the Santang syncline in Zhijin County is a key area for CBM resource exploration in Zhijin County. The CBM reservoirs and resources in this block are characterized by a large number of thin coal seams, high coal seam gas content, complex coal structure, and a high proportion of deep resources [13]; the proportion of deep CBM resources in some key synclines exceeds 50%, further increasing the technical difficulty of CBM production and development. Affected by multiple tectonic movements, the coal reservoirs in this block generally exhibit high in situ stress, low permeability, and strong heterogeneity, leading to high CBM development difficulty and restricted productivity release.
Permeability controls the migration of CBM in reservoirs and is closely related to the gas production of CBM wells [14,15]. To improve CBM production efficiency, hydraulic fracturing technology is widely used to increase the permeability of coal reservoirs during CBM production [16,17], so as to economically and effectively enhance reservoir permeability [18,19] and thereby improve the production of CBM wells. However, the evaluation of the influence range of traditional fracturing relies on parameters such as water cut, drill cuttings volume, and gas drainage effect [20], which can only infer the overall situation through parameters from local sampling points. This method is greatly affected by sampling bias and cannot realize continuous monitoring of the dynamic propagation and spatial morphology of hydraulic fractures.
To address this issue, microseismic fracture monitoring technology—commonly used in hydraulic fracturing effect evaluation in the oil and gas industry—has been introduced. It is a method that maps the spatial image of fractures by observing and analyzing underground stress field changes caused by hydraulic fracturing operations and seismic events generated by rock fractures or displacements, thereby studying the causes of hydraulic fracturing fractures or monitoring reservoir fluid movement [21]. In existing coal mine research, microseismic monitoring technology is mainly applied to the early warning of disasters such as rock bursts and water inrushes in mines [22,23,24], and has achieved good application results. Additionally, some scholars have used this technology to study the dynamic response of natural fractures in coal seams, the fracturing and instability laws of the top of coal seam bases [25], and the fracture development characteristics of overlying strata [26,27]. However, due to the properties of coal seams and complex stress states, there are few studies on the localization of hydraulic fractures in coal seams and the evaluation of stimulation effects, and systematic analysis of the “drilling-fracturing-monitoring” integration is lacking.
Therefore, this study takes the CBM block in the northwest limb of the Santang syncline as the research object, comprehensively analyzes its geological conditions and reservoir characteristics, and summarizes the drilling, well completion, fracturing, and implementation results of 3 CBM production wells in the block. Meanwhile, it addresses key technical issues such as efficient fracturing and fracture monitoring under complex geological conditions in the CBM block of the northwest limb of the Santang syncline in the Bijie Experimental Area. Based on the staged fracturing process, microseismic fracture monitoring technology is introduced: microseismic signals during fracturing are collected through a dense surface array, and four-dimensional dynamic imaging of hydraulic fractures is realized by combining tomographic imaging energy scanning inversion. This enables the identification of fracture propagation direction, morphological characteristics, and effective stimulated volume, thereby verifying the adaptability and stimulation effect of the staged fracturing process and providing technical reference for the verification of development engineering effects in similar complex-structured, low-permeability coalbed methane reservoirs.
2. Geological Overview and Coal Reservoir Characteristics of the Coalbed Methane Block on the Northwest Wing of the Santang Synclines
2.1. Geology Overview
This block is located in the Zhijin wide and gentle Fold area of the Qiannan Depression of the Yangtze Plateau, on the northwest wing of the Santang syncline. The main structural line of the Santang syncline is in the NE-SW direction, extending 42 km. It is an asymmetric syncline (with the dip angle of the strata on both wings ranging from 10° to 50°) and has continuous coal bearing. The block presents a monoclinic structure with developed faults and secondary folds. The block is located in the tributary area of the Wujiang River system in the Yangtze River Basin. It features large undulations, high mountains and deep valleys, mainly karst peak clusters and depressions, which are conducive to water drainage but not to storage. The regional rock strata are mainly carbonate rocks and clastic rocks. Atmospheric precipitation is prone to seep into karst fissures to form highly water-rich karst water, which is eventually discharged into the river valley through karst springs or underground rivers. The dynamics of surface water and groundwater are both affected by precipitation, and the seasonal variations are obvious.
2.2. Characteristics of Coal Seam Reservoirs
2.2.1. Division of Exploitable Coal Seams
The Longtan Formation of the Upper Permian is the main coal-bearing stratum in the area. The formation thickness ranges from 266.54 to 340.90 m, with an average of 309.66 m. It contains 21 to 46 layers of coal, usually around 30 layers. The total coal thickness is 20.68 to 30.47 m, with an average of 23.10 m. The coal bearing coefficient is 7.46%. The recoverable coal seams are mainly 10 layers, numbered 5−2, 5−3, 6, 7, 14, 16, 21, 30, 32 and 35. The total thickness of the recoverable coal seams ranges from 13.88 to 26.39 m, with an average of 15.63 m, and the recoverable coefficient is 5.06%. Among them, coal seam nos. 6, 7, 16 and 35 are all minable coal seams in the entire area, while coal seam nos. 5−2, 14, 21, 30 and 32 are mostly minable coal seams, and coal seam no. 5−3 is a partially minable coal seam.
2.2.2. Characteristics of Coalbed Methane
The gas composition of block coalbed methane is dominated by methane, mostly over 70%. For recoverable coal seams, the air-free basis methane concentration ranges from 51.35% to 99.87%, with an average of 84.2%. Among them, the air-free basis carbon dioxide (CO2) concentration ranges from 0.1% to 28.79%, with an average of 6.41%. In addition, the air-free basis nitrogen (N2) concentration ranges from 0% to 24.74%, with an average of 7.36%.
The concentration and content of coalbed methane in each coal seam are as shown in Table 1. It can be seen that all coal seams are methane-rich coal seams, and CH4 is the main combustible gas in coalbed methane.

Table 1.
Coalbed Methane Concentration and Content.
2.2.3. Reservoir Pressure and In Situ Stress
Two parameter wells, namely Parameter Well 1 and Parameter Well 2, were, respectively, set up in the Santang engineering area. Their well test results collectively reveal the characteristics and differences of the coal reservoirs in this area regarding pressure and in situ stress. In terms of the reservoir pressure system, the two wells present different distribution patterns: Parameter Well 1 shows that Coal Seam 6 and Coal Seam 16 belong to the normal pressure system, while Coal Seam 14, Coal Seam 30, and Coal Seam 35 are part of the abnormal low-pressure system; Parameter Well 2 indicates that only Coal Seam 6 is an abnormal high-pressure system, and the rest of the coal seams are normal pressure systems.
In terms of in situ stress characteristics, the minimum horizontal principal stress (closure pressure) of coal seams measured by Parameter Well 2 (7.33–10.92 MPa) and its gradient (1.7372–3.1593 MPa/100 m) are significantly higher than those of Parameter Well 1 (minimum horizontal principal stress: 2.26–7.65 MPa; gradient: 0.9270–2.5255 MPa/100 m). This indicates a strong heterogeneity in the regional stress field, and such differences are related to the sealing property of coal seams and burial depth.
The differentiation of reservoir pressure and in situ stress directly determines the differentiated design of fracturing technology: for low-pressure coal seams, it is necessary to avoid massive fluid loss caused by excessively low reservoir pressure during fracturing; for high-pressure coal seams, the fracturing construction pressure needs to be increased to ensure the formation of effective fractures.
2.2.4. Reservoir Porosity and Permeability
The reservoir porosity ranges measured by the two wells are basically comparable, but there is a significant difference in permeability. The permeability range of the main target coal seams in Parameter Well 1 is 0.056–0.79 mD, among which Coal Seam 6, Coal Seam 14, Coal Seam 16, and Coal Seam 35 are medium-permeability reservoirs, and only Coal Seam 30 is a low-permeability reservoir. In contrast, the permeability range of the main target coal seams in Parameter Well 2 is lower (0.0271–0.215 mD), and the reservoirs are dominated by low permeability (Coal Seam 6 and Coal Seam 7); only Coal Seam 14, Coal Seam 21, and Coal Seam 32 can meet the medium-permeability standard. This decrease in permeability may be due to the fact that Parameter Well 2 is located close to faults or fold cores; the coal seams undergo fracture closure caused by tectonic compression, thus reducing permeability. For low-permeability coal seams, it is necessary to optimize the proppant ratio or adopt temporary plugging ball fracturing technology to force fractures to extend to low-permeability areas, so as to achieve effective gas production.
3. Drilling Engineering Implementation and Results Before Fracturing
3.1. Division of the Construction Area for Production Wells
Based on the analysis of the requirements for the coalbed methane production engineering in Zhangjiawan District, it was decided to conduct the fracturing construction design for 3 wells and 12 intervals. Meanwhile, according to the relevant exploration and implementation plan for the Zhangjiawan coalbed methane block, there are a total of 10 minable coal seams in the area, with the total minable thickness ranging from 13.88 m to 26.39 m and an average of 15.63 m. Among them, Coal 6, Coal 7, Coal 16 and Coal 35 are minable coal seams throughout the whole area; Coal 5−2, Coal 14, Coal 21, Coal 30 and Coal 32 are mostly minable coal seams; and Coal 5−3 is a locally minable coal seam. In light of the need to enhance the storage of coalbed methane in the Zhangjiawan block of the Bijie Experimental Region, the selection of the target layers for fracturing coal seams mainly involves Coal 6, Coal 7, Coal 14, Coal 16, Coal 21, Coal 30, Coal 32 and Coal 35. The construction area is divided into the construction area in Zhangjiawan Town, Nayong County (Well A) and the construction area in Santang Town, Zhijin County (Well B, Well C).
3.2. Technical Design and Implementation Results of Drilling Engineering
3.2.1. Drilling Engineering
The TSJ2000 drilling rig and its supporting equipment were used in the construction. This drilling machine is produced by hebei yongming geological project machinery Co., Ltd. in Xingtai City, China. The drilling construction of the three production wells was carried out with a two-stage wellbore structure, and the drilling depths of each well vary only slightly. In the first stage, a Φ311.1 mm drill bit was used to drill through the topsoil layer and the fractured zone, and the drilling depth was controlled at about 60 m for each well. Subsequently, steel casings and cement slurry were used for casing cementing. The wellbore structures of the three production wells are shown in Figure 1. After the cementing in the first stage was completed, in the second stage, a Φ215.9 mm drill bit was used to drill to a position 60 m below the target coal seam floor of each drilling and production well, and then steel casings and cement slurry were run in for cementing. After the cementing in the second stage was completed, the overall cementing quality inspection was carried out.
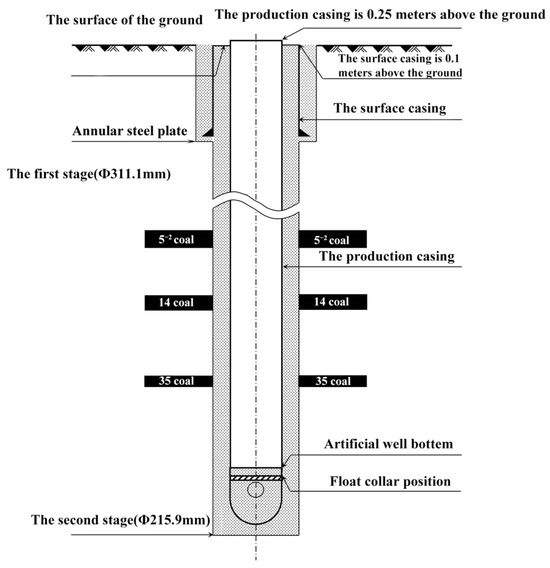
Figure 1.
Schematic diagram of the wellbore structure of production wells.
The drilling fluids used in the two-stage drilling process were different. In the first stage, bentonite slurry was used as the drilling fluid, and its main components were clear water, bentonite, caustic soda and high-viscosity cellulose. The purpose of adding a large amount of bentonite was to increase the viscosity and shear strength of the mud, better protect the wellbore, and prevent the wellbore from collapsing and the drilling fluid from leaking. In the second-stage drilling, low-solid-phase polymer is used as the drilling fluid, and its main components include clear water, high-viscosity cellulose, potassium polyacrylate, lost circulation material while drilling, soil powder, fluid loss additive, and caustic soda. The core of the low-solid-phase property is to reduce the blockage of solid particles to coal seam reservoirs; a small amount of soil powder is only used to assist in increasing the viscosity of the drilling fluid, so as to avoid permanent reservoir damage caused by excessive solid content. High-viscosity cellulose improves the viscosity of the drilling fluid through molecular chain entanglement, thereby enhancing the cuttings-carrying capacity. Potassium polyacrylate can adsorb on the surface of clay particles to form a protective film, which prevents the intrusion of water molecules and inhibits clay swelling. The fluid loss additive can further reduce the filtration loss of the drilling fluid into the reservoir by forming a thin and tough mud cake on the wellbore wall. The role of caustic soda is to improve the solubility of various polymers. During the drilling process, the proportion of the drilling fluid was adjusted in a timely manner according to the formation conditions to ensure smooth drilling. The usage of the drilling fluid for the production wells is shown in Table 2.
Table 2.
Statistical table of the segmented usage of drilling fluid in Santang production wells.
After the drilling of the three production wells, it was found that well shut-in, lost circulation control during the first stage of drilling and frequent replacement of drilling tools (reaming) were the main factors affecting the drilling time efficiency. When leakage occurred in the well, methods such as using mud, clear water and thick mud (lost circulation materials) for exploration were needed to determine the location of the leakage points and conduct multiple lost circulation control operations. When a screw was added to the conventional drilling assembly (excluding coring), if a large deviation in well inclination was found during the drilling process, directional deviation correction could be carried out without pulling out the drill string, which was beneficial to improving the drilling efficiency.
3.2.2. Well Logging Engineering
The comprehensive logging operation utilizes the CPLog intelligent imaging system. This system integrates core technologies such as multi-dimensional high-precision imaging, adaptability to ultra-high temperature and high-pressure environments, and intelligent data processing, enabling high-speed networking and high-precision imaging during logging. The system supports comprehensive logging capabilities, including conventional logs (natural gamma ray, spontaneous potential, caliper, dual laterolog resistivity, compensated acoustic wave, compensated neutron, compensated density, temperature, and deviation) and specialized logs (cross-dipole acoustic wave, micro-resistivity imaging, natural gamma ray spectroscopy, nuclear magnetic resonance, etc.).
Based on the logging data of three coalbed methane (CBM) production wells, the coal seam distribution in the study area exhibits significant differentiation characteristics. In terms of coal seam burial depth of the three CBM production wells, Well C has the shallowest coal seam burial depth, followed by Well A, and Well B has the deepest. Regarding coal seam thickness, Well A has the largest cumulative coal seam thickness (reaching 20.3 m), followed by Well C (with a cumulative thickness of 16.9 m), and Well B is the thinnest (with a cumulative thickness of 10.78 m).
As shown in Figure 2, the wellbore trajectory parameters show an obvious positive correlation with coal seam burial depth. Well B, with the deepest burial depth, exhibits the highest trajectory complexity: it has a well deviation angle of 3.9°, a full-angle change rate of 4.4°, and a maximum horizontal displacement of 10.8 m, with the well deviation concentrated in the middle well section. Well A has a medium burial depth and moderate trajectory complexity, with a well deviation angle of 2.4°, a full-angle change rate of 1.6°, a horizontal displacement of 6.2 m, and the well deviation occurring in the deep well section. Due to its shallowest burial depth, Well C has the most optimized trajectory, with a well deviation angle of only 1.7°, a full-angle change rate of 0.4°, a horizontal displacement of 4.1 m, and the well deviation limited to the shallow well section. This correlation reveals the direct impact of coal seam burial depth on the difficulty of wellbore trajectory control.
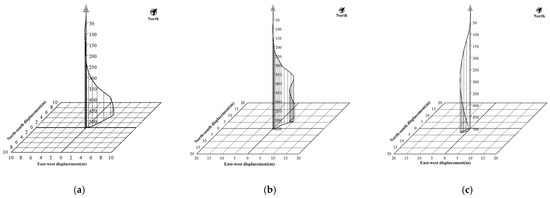
Figure 2.
Three-dimensional wellbore condition diagram of production wells: (a) Well A; (b) Well B; (c) Well C.
The synergistic characteristics of coal seam parameters and wellbore trajectory provide a key basis for subsequent development engineering design. For the Well B area, which features large coal seam burial depth, small thickness, and high wellbore trajectory complexity, it is necessary to optimize fracturing design to reduce the impact of complex trajectory sections on construction. The Well A area has a significant advantage in coal seam thickness; although it has a moderately complex trajectory, staged fracturing can be implemented focusing on high-thickness coal seams such as Coal 16. The Well C area has the comprehensive advantages of shallow burial depth, medium thickness, and low trajectory complexity, featuring favorable conditions for efficient development and allowing priority in fracturing.
In addition, as shown in Figure 3, Figure 4 and Figure 5, for Well B, the density logging and array acoustic logging data were comprehensively utilized to extract the parameters of the delta t shear fast (DTSF) and delta t shear slow (DTSS), and then the rock mechanical parameters were calculated, which provided an important reference basis for the fracturing engineering of the coalbed methane reservoir. The geostress calculation results show that the maximum horizontal principal stress of the target coal seam section in the region has an average value of 10.35 MPa, and its direction is generally near-east–west. The minimum horizontal principal stress has an average value of 7.86 MPa, while the overburden pressure has an average value of 10.03 MPa. All three types of stress parameters show a regular increasing trend with the increase in coal seam burial depth, and the overburden pressure is always between the maximum horizontal principal stress and the minimum horizontal principal stress. It can be seen from this that the direction of the maximum principal stress of shallow coal seams is usually horizontal.
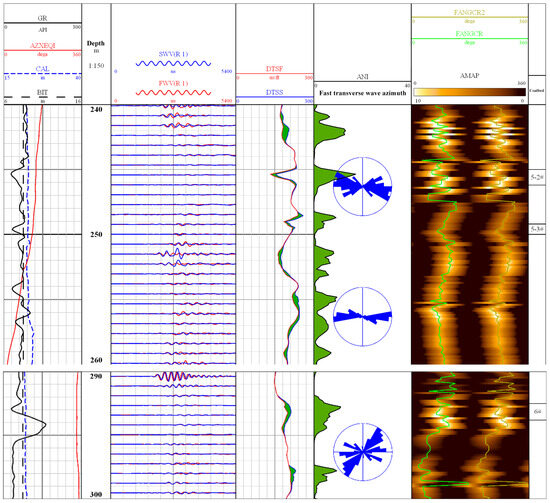
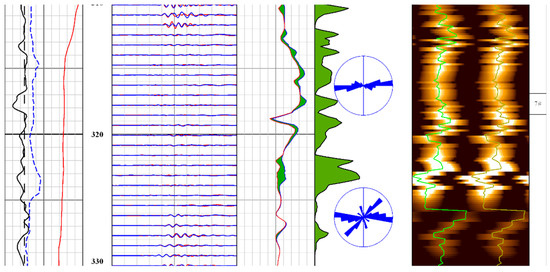
Figure 3.
Anisotropic feature diagram of coal 5−2, Coal 5−3, Coal 6 and Coal 7.
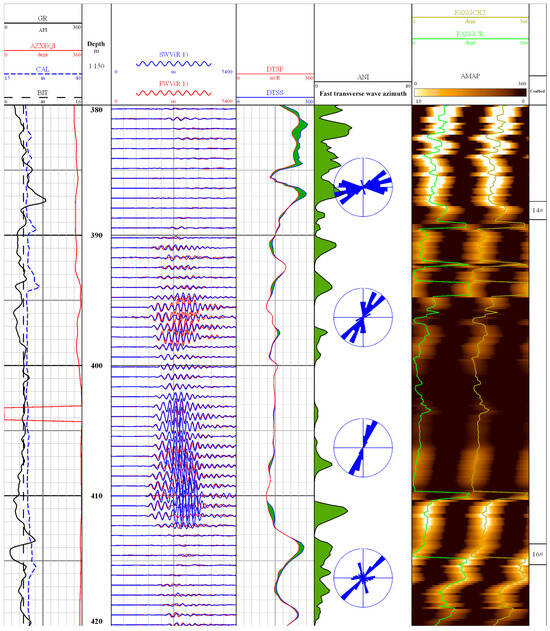
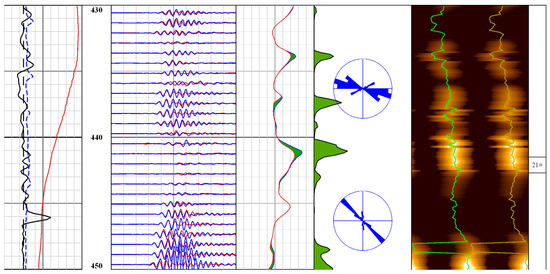
Figure 4.
Anisotropic feature diagram of Coal 14, Coal 16 and Coal 21.
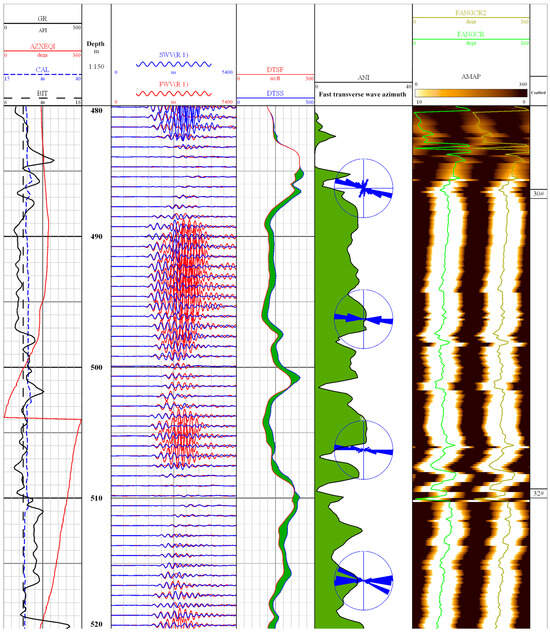
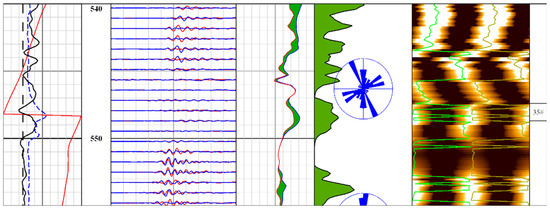
Figure 5.
Anisotropic feature diagram of Coal 30, Coal 32 and Coal 35.
4. Technical Design of Fracturing Engineering
4.1. Geological Layer Selection Conditions for Fracturing
The optimization of the target layer section is mainly carried out from two levels, namely single coal seam and coal seam combination. The optimization indicators mainly include evaluation indicators in two aspects: resources and development. Among them, the resource evaluation indicators include gas content in the coal seam, coal seam thickness and its stability, etc., while the development evaluation indicators mainly include coal body structure, permeability, pressure coefficient, critical desorption pressure, coal seam spacing and burial depth of the coal seam and other indicators.
The optimization indicators for a single coal seam mainly include gas content and thickness of the coal seam, coal seam stability and coal body structure. The larger the thickness of the coal seam, the more stable the coal seam is. The higher the gas content, the greater the amount of coalbed methane resources and the more guaranteed the coalbed methane production capacity will be. A coal body structure of primary structure and cataclastic structure is beneficial to reservoir reconstruction.
The optimization indicators for the coal seam combination mainly include permeability, difference in pressure coefficient, ratio of critical desorption pressure to reservoir pressure, coal seam spacing, etc. The greater the permeability, the easier it is for gas and water to be produced. The closer the permeabilities are, the smaller the difference in the output of gas and water will be, and the interlayer interference will be reduced. When the difference in pressure coefficient is relatively small, the coal seam sections belong to the same gas-bearing system, and the interlayer interference is relatively small. The closer the ratio of critical desorption pressure to reservoir pressure is, the easier it is for the coal seams to desorb simultaneously and for the production capacity to be released simultaneously. The smaller the coal seam spacing is, the easier it is for different coal seams to produce water and gas simultaneously, reducing the pollution of fracturing fluid. The specific parameters of relevant optimization indicators are shown in Table 3.
Table 3.
Parameter of optimization indicators for the target coal seam.
The following are the fracturing-related indicators of the coal seams in the Zhangjiawan coalbed methane block. The geological layer selection for fracturing is carried out by analyzing the specific parameters and characteristics of various fracturing indicators.
- Coal seam thickness and gas content:
The mineable coal seams in the study area exhibit a vertical distribution feature of “thin to medium-thick layered superimposition”. Their cumulative thickness meets a certain development scale, while the thickness of individual coal seams shows a differentiation characteristic from thin to medium. Vertically, the coal seams can be divided into three groups: upper, middle, and lower. The inter-seam spacing within each group follows a top-to-bottom decreasing pattern, and the overall distribution stability is good. This dense and stable distribution pattern provides favorable geological conditions for the implementation of combined layer stimulation or staged fracturing. From the perspective of inter-layer configuration of key production wells, the spacing of main target coal seams is within a reasonable range conducive to fracturing stimulation.
The coalbed methane (CBM) in the block is dominated by CH4, with the content of CH4 accounting for more than 90%. In terms of vertical gas-enriched horizons, the high-gas-content coal seams of the three production wells show obvious dislocation characteristics: Well A takes Coal 16 as the dominant gas-enriched layer, Well B has the highest gas content in Coal 6, and Well C forms a gas content peak in Coal 14. The gas content of the same coal seam varies significantly among the three wells. This variation reflects the coupled control of local coal rock properties and reservoir conditions on gas content. Therefore, it is necessary to conduct targeted layer selection based on accurate interlayer gas content difference evaluation, and prioritize the stimulation of high-gas-content coal seams to improve development efficiency and single-well production.
- 2.
- Coal body structure:
Table 4 shows the observation results of the coal body structure of the cored coal seams in the adjacent Parameter Well-2. Coals 5−2, 5−3, 6, 7, 14, 16, 21, 30, 32, and 35 are mainly in block form. Coal 6 is mainly in powder and block forms, and the overall coal body structure is relatively good.
Table 4.
Main coal core logging results table of parameter Well-2.
The results of the electrical imaging logging implemented in Well B show that fractures are not well developed in the Longtan Formation, while high-angle fractures are developed in the Feixianguan Formation, but the overall number is not large. The electrical imaging of the coal seams in the Longtan Formation appears in a high-brightness color, and there are a small number of joint features in the section with a relatively small diameter expansion in the upper part of the coal seams; the bedding in the lower mudstone section is obviously developed, as shown in Figure 6.
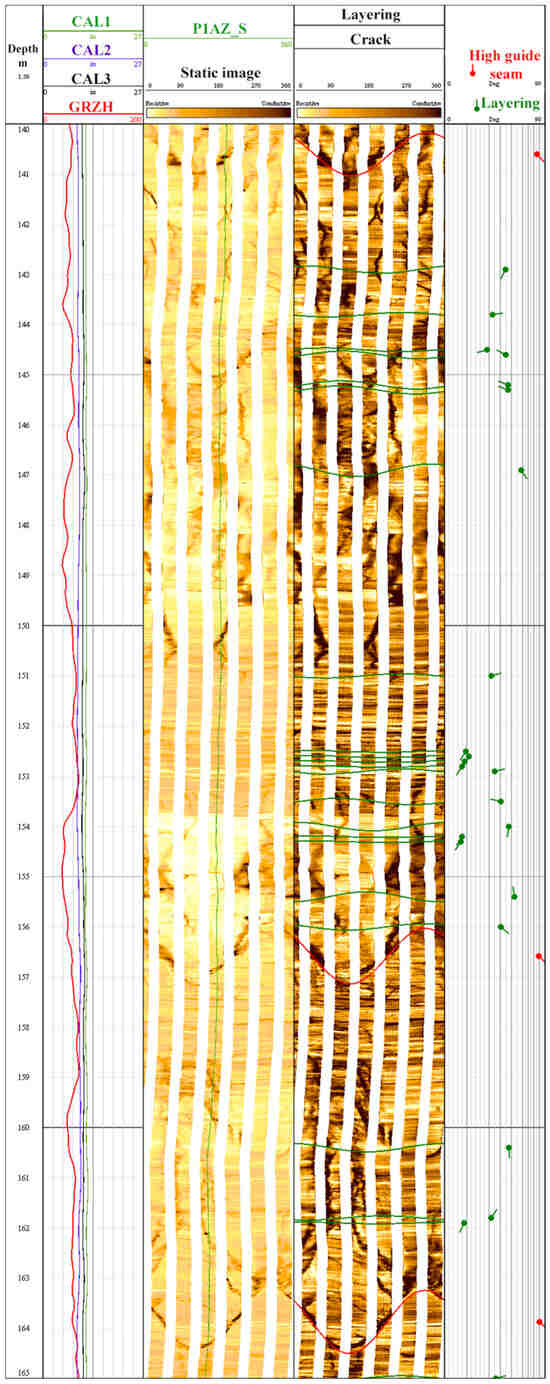
Figure 6.
Electrical imaging fracture analysis chart of Well B.
- 3.
- Permeability;
The well testing results of Parameter Well-1 indicate that the permeability of the main target coal seams is 0.056–0.79 mD. Among them, Coal Seams 6, 14, 16 and 35 are medium-permeability reservoirs, and Coal Seam 30 is a low-permeability reservoir. The well testing results of Parameter Well-2 indicate that the permeability of the main target coal seams is 0.0271–0.215 mD. Among them, Coal Seams 14, 21 and 32 are medium-permeability reservoirs, and Coal Seams 6 and 7 are low-permeability reservoirs, requiring large-scale fracturing to improve the flow conductivity.
- 4.
- Pressure coefficient difference and pressure/drainage volume ratio.
The reservoir pressure of the main target coal seams in Parameter Well-1 is 1.3585–2.6774 MPa, and the pressure coefficient is 0.4488–0.9368. Among them, Coal Seams 6 and 16 are reservoirs of the normal-pressure system; Coal Seams 14, 30 and 35 have relatively low-pressure coefficients and are reservoirs of the abnormal low-pressure system. The pressure/drainage volume ratio of the main target coal seams is in the range of 0.71–2.86. Among them, Coal Seam 30 has the largest pressure/drainage volume ratio and thus desorbs first.
The reservoir pressure of the main target coal seams in Parameter Well-2 is 2.3777–4.3633 MPa, and the pressure coefficient is 0.9006–1.2959. The pressure coefficients of each reservoir differ slightly and belong to the same gas-bearing system. Among them, Coal Seam 6 is a reservoir of the abnormal high-pressure system, and the rest of the coal seams are reservoirs of the normal pressure system. The pressure/drainage volume ratio of the main target coal seams is in the range of 0.31–2.66, with a difference in the pressure/drainage volume ratio of about 2.35. Among them, Coal Seam 7 has the largest pressure/drainage volume ratio and should desorb first. The pressure/drainage volume ratios of Coal Seams 6 and 14 are close, and it is speculated that they desorb almost simultaneously.
4.2. Results of the Geological Layer Selection for Fracturing
Through comprehensive comparative analysis, for Well A, it is preferred to conduct combined layer fracturing for Coal Seams 6 and 7 in the upper coal group, single-layer fracturing for Coal Seam 14 in the middle coal group, combined layer fracturing for Coal Seams 16 and 21, and combined layer fracturing for Coal Seams 30, 32 and 35 in the lower coal group. For Well B, it is preferred to conduct combined layer fracturing for Coal Seams 6 and 7 in the upper coal group, single-layer fracturing for Coal Seam 14 in the middle coal group, combined layer fracturing for Coal Seams 16 and 21, and combined layer fracturing for Coal Seams 32 and 35 in the lower coal group. For Well C, it is preferred to conduct single-layer fracturing for Coal Seam 6 in the upper coal group, single-layer fracturing for Coal Seam 7, single-layer fracturing for Coal Seam 14 in the middle coal group, and combined layer fracturing for Coal Seams 16 and 21. Since the pressure coefficient of the lower coal group is too low, it will have an adverse impact on the later production after fracturing, so fracturing of the lower coal group is not considered.
4.3. Design of the Fracturing Engineering Construction
4.3.1. Perforation Operation Design
The perforating operation adopts the Type 102 perforating gun, loaded with the Type 127 deep-penetration perforating charge, with a standard hole density of 16 holes/m, and the holes are arranged helically according to the initial phase angle of 60°. For Well A, the target pay zones for perforating are Coal Seams 6, 7, 14, 16, 21, 30, 32 and 35. For Well B, the target pay zones for perforating are Coal Seams 5−2 and 5−3 (only for supplementary perforating without fracturing), Coal Seams 6, 7, 14 and the coal line above Coal Seam 14, as well as Coal Seams 16, 21, 32 and 35. For Well C, the target pay zones for perforating are Coal Seams 6, 7, 14, 16 and 21. The perforating operation all adopts the technological process of combined operation of cable-transported bridge plugs and perforating. The cable-transported drillable bridge plugs and the perforating gun are sent to the setting position of the bridge plugs, and then the bridge plugs are set by ignition. After lifting the perforating gun, the pressure test is carried out. If the pressure drop is less than 0.50 MPa within 5 min when the test pressure is 20 MPa, it is considered qualified. After the pressure test is qualified, the perforating operation is carried out.
4.3.2. Overview of Fracturing
All three production wells were subjected to four-stage fracturing and three-times bridge plug isolation. To meet the requirements of fracturing, the production wells were perforated in sequence from bottom to top. After the perforation and fracturing of the upper section were completed, the subsequent construction operations were carried out in turn. Among them, the perforation of the first layer (section) of each production well was carried out by the conventional wireline transmission perforation method, and the subsequent layers (sections) were all operations under pressure; that is, the perforation method of wireline transmission + combined bridge plug and perforation was adopted. For multi-layer fracturing of vertical wells, by adopting the fracturing method of bridge plug isolation with wireline conveyed bridge plugs + combined perforation and fracturing, construction can be carried out under pressure conditions. The four-stage fracturing of the target coal seams can achieve continuous fracturing, and the overflow can be released simultaneously after fracturing, effectively shortening the fracturing operation cycle.
The fracturing was carried out by using the construction method of open casing and large displacement injection. Under the conditions of not causing engineering risks and ensuring smooth construction, the fracturing scale was appropriately increased. The stepped sand addition method was adopted, and the construction was carried out with variable displacement, gradually increasing the sand ratio. During the construction, timely adjustments were made according to the actual thickness and characteristics of the reservoir. Active water fracturing fluid was selected as the fracturing fluid. The proportion of the fracturing fluid for the No. 6, No. 7, and No. 21 coal seams and the No. 30, No. 32, and No. 35 coal seams was: clear water + 1.0% KCl + 0.05% bactericide + 0.1% flowback aid. The proportion of the fracturing fluid for the No. 14 and No. 16 coal seams was: clear water + 1.5% KCl + 0.05% bactericide + 0.1% flowback aid. Quartz sand and low-density ceramsite were selected as the proppants for this fracturing. The main proppants were 40/70 mesh quartz sand, 20/40 mesh quartz sand, 40/70 mesh low-density ceramsite and 20/40 mesh low-density ceramsite. The 70/140 mesh quartz sand was used as a slug to polish the perforations and fracture surfaces, reduce resistance and prevent fluid loss. The 40/70 mesh low-density ceramsite and 20/40 mesh quartz sand were used to improve the conductivity of the fractures and prevent the proppants from embedding. The 20/40 mesh low-density ceramsite tail plug was used to increase the near-well conductivity.
As shown in Figure 7, Well A was divided into 4 sections for fracturing. The fractured coal seams were divided into 6 + 7 coal, 14 + 16 coal, 21 coal and 30 + 32 + 35 coal. The total fracturing fluid volume was 6501.56 m3, the total sand volume was 260.89 m3, the construction displacement was 5.01–10.17 m3/min, and the maximum sand ratio was 12%.
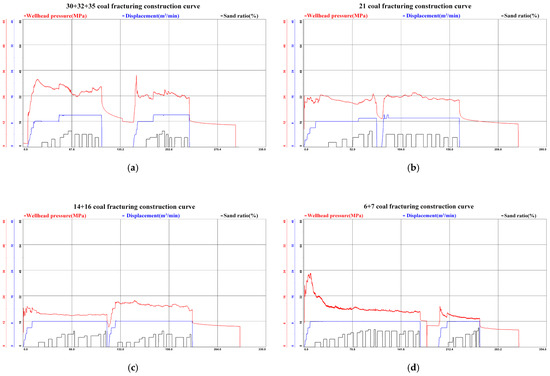
Figure 7.
Fracturing construction curve of Well A: (a) Coal 30 + 32 + 35; (b) Coal 21; (c) Coal 14 + 16; (d) Coal 6 + 7.
As shown in Figure 8, Well B was divided into four sections for fracturing. According to the fractured coal seams, they were divided into Coal Seams 6 + 7, the upper coal line of Coal Seam 14 + 14, Coal Seams 16 + 21 and Coal Seams 32 + 35. The total fracturing fluid volume was 5291.93 m3, the total sand volume was 215.87 m3, the construction displacement was 7.88–9.13 m3/min, and the maximum sand ratio was 10%.
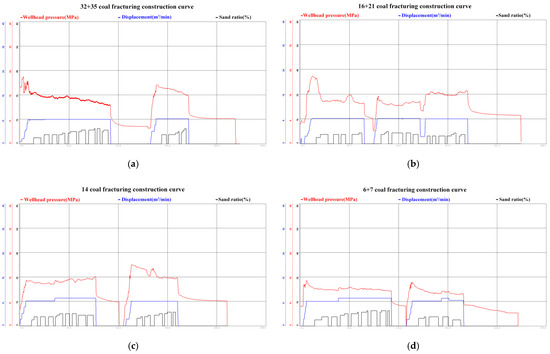
Figure 8.
Fracturing construction curve of Well B: (a) Coal 32 + 35; (b) Coal 16 + 21; (c) Coal 14; (d) Coal 6 + 7.
As shown in Figure 9, Well C was also divided into four sections for fracturing. According to the fractured coal seams, they were divided into Coal Seam 6, Coal Seam 7, Coal Seam 14 and Coal Seams 16 + 21. The total fracturing fluid volume was 5308.64 m3, the total sand volume was 248.71 m3, the construction displacement was 8.15–9.11 m3/min, and the maximum sand ratio was 10%.
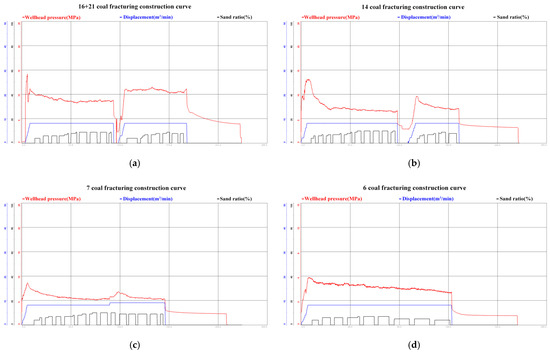
Figure 9.
Fracturing construction curve of Well C: (a) Coal 16 + 21; (b) Coal 14; (c) Coal 7; (d) Coal 6.
Among them, in the fracturing projects of the first section (Coal Seams 30 + 32 + 35) and the third section (Coal Seams 14 + 16) of Well A, the first section (Coal Seams 32 + 35) of Well B, and the first section (Coal Seams 16 + 21) and the second section (Coal Seam 14) of Well C, temporary blocking balls were put into use. The method of putting balls and combined pressure was adopted to increase the construction pressure and promote the formation fracturing.
5. Verification of Fracturing Effect of Production Wells Based on Microseismic Fracture Monitoring Technology
5.1. Monitoring Principle
Microseismic fracture monitoring provides a basis for fracturing effect evaluation and subsequent production optimization by collecting microseismic signals generated from rock fracturing during the fracturing process, and analyzing the morphology, extension direction, and scale of fractures.
In this study, the ground dense array energy scanning four-dimensional imaging technology for fracturing fracture monitoring was adopted, with the specific process as follows: First, under field surface conditions, an array of geophone observation systems was deployed in accordance with specific design criteria to conduct data acquisition of multi-wave and multi-component microseismic compressional waves and shear waves (P-waves and S-waves). Second, considering the low signal-to-noise ratio (SNR) characteristic of microseismic signals collected on the ground, the amplitude characteristics of seismic waves and tomographic imaging technology were applied to perform spatial energy scanning near the fractured interval, thereby realizing the “imaging” and localization of reservoir fracturing caused by fracturing operations. Finally, by calculating the “four-dimensional imaging” parameters of the 3D spatial morphology of each fracturing event at different time periods in the time domain during fracturing, the spatial morphology and evolutionary development process of the fracturing fracture network were visually interpreted. This further enables scientific, reasonable, and objective evaluation of the fracturing effect. The main procedures are as follows:
- 1.
- Field microseismic data collection by ground dense arrays;
A ground dense array refers to an array group of microseismic acquisition stations composed of several sub-stations generally arranged within a small aperture (less than 3 km) or a medium-small aperture (3–5 km). It is mainly used for urban underground space detection (0–500 m depth), natural resource exploration (0–5 km depth), and high-precision detection of the 3D structure of the deep Earth (upper-middle crust).
Fracturing operations cause two types of rock micro-fracturing in reservoirs: tensile fracturing of reservoir rocks and shear fracturing of far-field rocks. Most rock fracturing is mixed fracturing that is shear-dominated with additional tension. Therefore, by deploying an array of acquisition station observation systems under field surface conditions, three-component geophones are used to collect multi-wave and multi-component microseismic compressional wave and shear wave (P-wave and S-wave) data after local micro-fracturing occurs in the reservoir. The microseismic data stored in each acquisition station are merged with all three-component signals using time elements from satellite timing to form microseismic trace gathers in standard format. This serves as the raw field microseismic full body wave (P-wave and S-wave) data volume with time parameters, which is applied to subsequent fracturing fracture localization processing and interpretation.
- 2.
- Tomographic energy scanning inversion calculation;
Due to factors such as high-frequency filtering in the formation, signal attenuation, and strong background noise, the field-collected microseismic wave signals exhibit the characteristic of low signal-to-noise ratio (SNR) (see Figure 10). This results in the fact that the effective signals in ground microseismic records cannot be directly identified from the raw records.
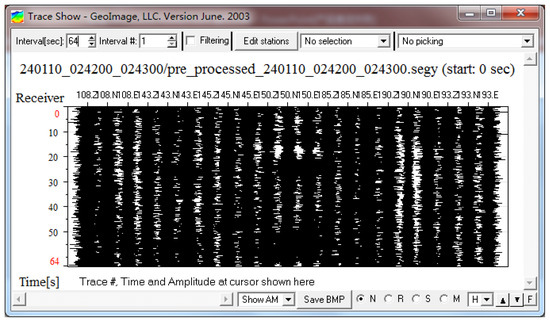
Figure 10.
Waveform diagram of raw microseismic signal records.
- 3.
- Interpretation of fracturing fractures by four-dimensional images.
“Energy” is a dimensionless unit, referring to the correlation differences among grid cells in the data volume. The magnitude of the energy value is proportional to the amplitude of seismic waves generated by underground micro-fractures and is related to the properties of tensile and shear fracturing of rocks. The four-dimensional energy data volume is obtained through the processing of tomographic imaging energy scanning inversion calculations using raw microseismic data, and it consists of the amplitude energy values of grid intersection points in each scanning unit at different times, representing the 3D amplitude energy data of underground reservoirs. During the actual fracturing fracture interpretation process, it is first necessary to convert the four-dimensional energy data volume into a four-dimensional energy ratio coherence volume—specifically, by subtracting the minimum energy value from the energy value of each grid intersection point in the entire four-dimensional energy data volume to form amplitude energy difference values of grid intersection points in each scanning unit at different times, which represent the similarity or abrupt change attributes of the 3D amplitude energy of underground reservoirs.
In this study, first, the energy data volume during fracturing was loaded, with focus placed, respectively, on the vertical depth of the fracturing interval and the area around the wellbore for fracture interpretation; 2D planar time slice maps of the energy scanning data volume at the vertical depth of the fracturing interval during the monitoring period were then output at 1 min intervals, including 2D horizontal energy time slices (2D horizontal planar images at a specific vertical depth within the 3D data volume during a certain time period) and 2D vertical energy time slices (2D vertical cross-sectional images at a specific planar position within the 3D data volume during a certain time period). Next, on these two types of energy time slices, the energy scanning data volume was displayed in a normalized manner based on the maximum energy value, generating time slices with consistent energy values throughout the fracturing process. Finally, energy gradient calculation and display were performed on the energy data volume with high energy intensity to generate an energy gradient data volume; through its vertical and horizontal 2D slices, the fracture strike and 3D morphology were judged, the interpretation and combination of fracturing fractures were completed, and information on fracture development was obtained along with the calculation of parameters such as length, width, height, and stimulated volume.
5.2. Microseismic Fracture Monitoring Results
Due to the influence that there must be a certain difference in the ray tracing paths between each acquisition station and each intersection point of the underground tomographic imaging grid during the process of energy vector superposition by microseismic gather amplitude inversion, it can be known from the simulation calculation by the microseismic gather amplitude energy inversion superposition formula (Equation (1)) that the interval distance between any two sets of acquisition station units should be at least more than 10 times the monitoring resolution, that is, the spacing between acquisition stations in the acquisition station array should be at least more than 100 m. However, affected by the frequency range of microseismic signals received on the ground, the design of the spacing between acquisition stations in the dense acquisition station array should be calculated based on half-wavelength resolution. For example, under normal circumstances, the main frequency range of microseismic signals received on the ground is between (3, 20) HZ. Calculated with an S-wave velocity of 2500 m/s, the wavelength is approximately 800–850 m. If calculated based on half-wavelength resolution, the spacing between acquisition stations should be dense within 400 m.
where is the stacked amplitude energy of the k-th microseismic gather, is the time window, is the number of participating stations, is the amplitude value of the i-th seismic trace at the j-th sampling point, and is the normalization factor.
Therefore, it was determined that the acquisition stations for microseismic fracture monitoring of the three coalbed methane production wells were arranged in a ring with the wellhead as the center, and the spacing between the acquisition stations was set at 300 m to cover the ground projection area of the fracturing section. The monitoring system supports continuous acquisition for more than 120 h, and records microseismic signals in real time with a sampling interval of 0.25–1 ms through Global Positioning System (GPS) synchronous timing.
Through microseismic fracture monitoring, the 3D morphology and orientation of fracturing fractures were systematically analyzed, the fracture length and azimuth angles were clarified, and it was found that the fractures extend in the nearly east–west direction along the direction of the maximum horizontal principal stress. As shown in Figure 11, taking the monitoring results of Well B as an example, microseismic fracturing activities were recorded in all four monitored stages of Well B, with the number of activities ranging from 31 to 39. The arrows in the figure are used to measure the maximum length, maximum width, and aspect ratio of the fracture network, while the spheres represent the distribution of fracture initiation time points of the fracturing network, in the order of event occurrence: blue, green, yellow, and red. There were certain differences in the fracture network parameters among different stages: the fracture network length was 205–251 m, the maximum width was 73–124 m, the height was 20–60 m, and the azimuth angles were concentrated around 88–91°. The distribution of fracturing scales on the east and west sides of the wellbore was different: only in Stage 1 was the fracture network on the east side of the wellbore longer and the fracturing scale larger; in the other three stages, the fracture network on the west side was longer and the fracturing scale was larger. The fracturing construction stage showed different characteristics: in the early stage of fracturing, in some stages, fractures first fractured near the wellbore and then extended to the east and west sides, while in other stages, fractures were directly generated on both the east and west sides of the wellbore; in the middle stage of fracturing, fractures either extended alternately to the east and west sides (with more significant fracturing scale on the west side in some cases and on the east side in others) or the main fracturing area was concentrated on the east side of the wellbore with a larger scale on the east side.
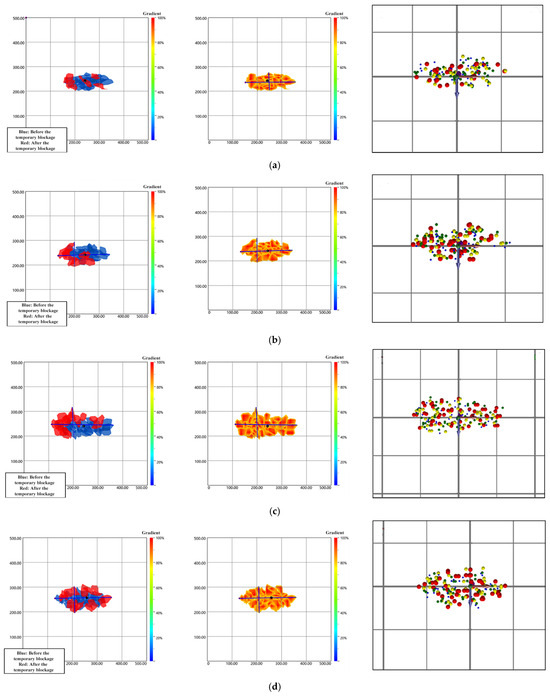
Figure 11.
Top view distribution map of fracture network rupture boundary and event points of fracturing in Well B: (a) Coal 32 + 35; (b) Coal 16 + 21; (c) Coal 14; (d) Coal 6 + 7.
After temporary plugging, as shown in Figure 12, fractures in most stages mainly extended to the west side, and only Stage 4 showed expansion in all directions. The overall fracture network length of each stage increased, and the fracture network width of some stages also increased simultaneously. From the perspective of the boundary morphology of the fracturing fracture network in each stage, most fracture networks had a good morphology, high density, and good connectivity. The fracturing fracture network in Stage 1 had obvious branch fractures on the southeast side; the overall fracture network morphologies of Stage 3 and Stage 4 showed strong asymmetry, indicating strong heterogeneity in reservoir physical properties.
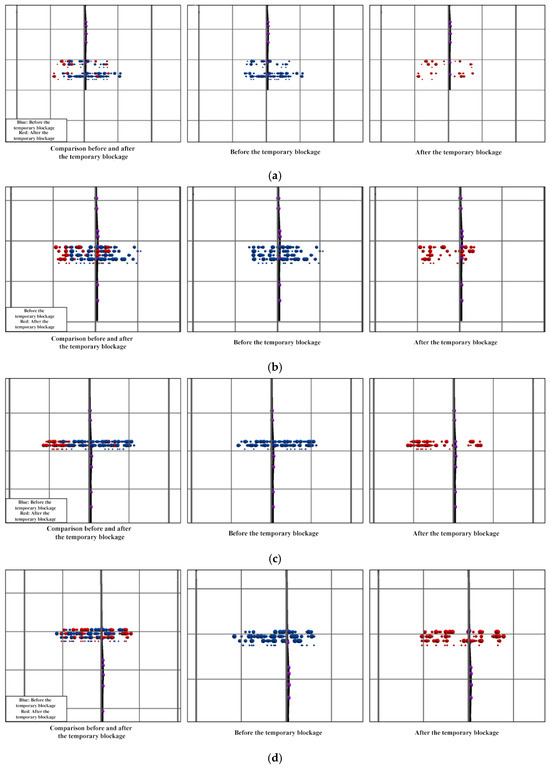
Figure 12.
Side view distribution map of event points before and after temporary plugging in Well B: (a) Coal 32 + 35; (b) Coal 16 + 21; (c) Coal 14; (d) Coal 6 + 7.
Table 5 presents the fracture-related parameters of the production wells at each stage. For Well A, the overall extension direction of the fracturing fractures is nearly east–west (around 90°), with a fracture length ranging from 135 m to 231 m, showing a good overall extension length. For Well B, the overall extension direction of the fracturing fractures is also nearly east–west (around 90°), with a fracture length of 205–251 m, and its overall extension length is better. For Well C, the overall extension direction of the fracturing fractures is nearly east–west (around 90°) as well, with a fracture length of 230–296 m, achieving the best overall extension length among the three wells. The azimuth angles of the fracturing fractures in the three drainage and production wells are highly concentrated within the range of 88–91°, that is, extending in the near-east–west direction. As a structure spreading in the NE-SW direction, the Santang skew’s current stress field may inherit the characteristics of regional tectonic movement, with the maximum horizontal principal stress direction being in the near-east–west direction. Extending the fractures along the maximum principal stress direction is an ideal fracturing effect. It has proved the mechanical rationality of this fracturing design. From the perspective of the fracture network boundary morphology of each stage in each well, most fracture networks have a good morphology, high density, and good connectivity, and the reservoir stimulation is relatively uniform. It is shown that the expected fracturing stimulation goal has been achieved.
Table 5.
Fracture-related parameter table for each section of the production wells.
In addition, the planar area stimulated per unit liquid volume can reflect the fracturing stimulation effect to a certain extent. In terms of calculation, the planar area stimulated per unit liquid volume is calculated by the formula: planar area stimulated per unit liquid volume = fractured stimulation volume/total liquid volume/fracture height. A larger planar area stimulated per unit liquid volume indicates less friction loss of fluid in the formation, meaning more energy is used for creating new fractures. The planar areas stimulated per unit liquid volume of the three production wells are 11.31 m2, 15.28 m2, and 20.93 m2, respectively. It can be seen that Well C has the best fracturing stimulation effect, followed by Well B.
Owing to the microseismic amplitude energy inversion and localization method adopted in fracture monitoring technology, the amplitude energy of each fracture event is related to the fracturing characteristics of rocks. These fracturing characteristics are categorized into three types: tensile fracturing, shear fracturing, and mixed fracturing. Tensile fracturing generates microseismic compressional waves (P-waves), while shear fracturing generates microseismic shear waves (S-waves). Typically, the S-wave amplitude produced by shear fracturing is 3–5 times that of the P-wave amplitude produced by tensile fracturing. According to the statistics on the number of fractures with different characteristics, Well A and Well B are dominated by tensile fracturing, followed by mixed fracturing and shear fracturing; Well C is mainly characterized by mixed fracturing, followed by tensile fracturing, with the fewest shear fracturing events.
From the amplitude energy data of each fracture event during fracturing of the entire well interval, it can be observed that the overall fracture energy exhibits periodicity: after frequent high-energy fracture events, there are continuous low-energy fracture events. This phenomenon is related to the fracturing construction progress of each stage, the alternation process of tensile and shear fracturing in the formation, as well as the physical properties of rocks and the heterogeneous fracturing characteristics of the reservoir. In addition, by combining the temporal changes in construction parameters, it is found that the fracturing fluid displacement is positively correlated with the fracture propagation rate, which verifies the differences in the sensitivity of the rock fracture pressure of the target formation to the proppant concentration. Furthermore, the asymmetric distribution of fractures caused by reservoir heterogeneity is further identified: the stimulation intensity on the east side is generally higher than that on the west side, the maximum influence radius of stress deformation reaches 150 m, and the proportion of effective stimulated volume exceeds 75%. This provides a quantitative basis for optimizing the proppant combination and production system.
6. Discussion
Controlling Factors for the Differences in the Effects of Fracturing and Modification of Drainage and Production Wells
Based on the ground-based dense array microseismic monitoring technology, we successfully achieved four-dimensional dynamic imaging and quantitative evaluation of the fracturing fractures in the north-western wing of the Santang anticline coal gas block in the Bijie Experimental Area of Guizhou Province. The monitoring results clearly revealed the extension patterns and improvement effects of the fracturing fractures, but the differences in the fracturing effects among them need to be further explored in combination with the geological background and engineering practice.
From the perspective of the modified plane area per unit fluid volume (11.31 m2 for Well A, 15.28 m2 for Well B, and 20.93 m2 for Well C), Well C showed the best fracturing effect. This was attributed to several factors. Firstly, Well C had the shallowest coal layer burial depth and a medium cumulative thickness, with relatively lower in situ stress, making the rock more susceptible to fracturing. Secondly, the fracturing section combination of Well C was more simplified (such as using single-layer fracturing for the upper coal group 6 and 7), reducing inter-layer interference and facilitating the concentrated action of liquid energy on a single coal layer, forming a more complex fracture network. In contrast, Well A and Well B had more combined-layer fracturing sections, which, while communicating multiple coal layers, might also suffer from some loss of liquid efficiency due to inter-layer stress differences or property variations. Moreover, when multiple coal layers were combined for fracturing, the fracturing fluid would preferentially enter the coal layers with lower fracture pressure and higher permeability, resulting in “under-fracturing” of the low-permeability coal layers. This is the key reason why the modified area per unit fluid volume of Well C was higher than that of Well A and Well B.
Concerning the well trajectory, the trajectories of the three wells differed. Well C had a well deviation angle of only 1.7°, with a full-angle variation rate of 0.4°, and a maximum horizontal displacement of 4.1 m, making the well trajectory the most vertical; Well A had a well deviation angle of 2.4°, with a full-angle variation rate of 1.6°, and a maximum horizontal displacement of 6.2 m; Well B had a well deviation angle of 3.9°, with a full-angle variation rate of 4.4°, and the maximum horizontal displacement of 10.8 m, making the well trajectory the most complex. Too large a well deviation angle would cause the fracturing fluid to deviate from the target layer: for Well B, due to its high well deviation angle, some fracturing fluid might seep into non-target mudstone layers, resulting in a reduction in the effective fluid volume for creating fractures, while Well C, with a vertical well trajectory, could ensure that the perforations more precisely hit the target coal layer, reducing the ineffective loss of the fracturing fluid and thereby improving the fracturing modification effect.
Regarding the fracture mechanism, Well A and Well B mainly had tensile fractures, with a relatively low proportion of shear fractures; Well C mainly had mixed fractures (tensile + shear), with the shear fracture proportion reaching 35–40%. Tensile fractures only formed a single-directional “main fracture”, with few branch fractures, mainly due to the pressure of the fracturing fluid breaking through the rock’s tensile strength, controlling the fractures to extend along the in situ stress direction, while shear fractures were generated due to the heterogeneity of the reservoir and pressure differences driving the rock to shear slide, forming multi-directional “branch fractures”, significantly enhancing the complexity and connectivity of the fracture network. The higher proportion of mixed fractures in Well C, with a fracture area (such as 28,603.55 m2 for the 14th coal seam) significantly larger than that of the same layer section in Well A (13,208.63 m2), and the higher connectivity between fractures and natural fractures, made the fracture network connectivity and modification volume of Well C higher than those of the other two wells.
7. Conclusions
Aiming at the complex geological characteristics of the coalbed methane (CBM) block on the northwest limb of the Santang Syncline—such as “multiple thin coal seams, high stress, and low permeability”—this study, based on the practices of drilling and fracturing engineering, evaluated the fracturing stimulation effect of the CBM reservoir in the block using microseismic fracture monitoring technology.
The drilling engineering adopted a two-stage wellbore structure (1st stage: Φ311.1 mm, 2nd stage: Φ215.9 mm) and a fluid system consisting of bentonite slurry (for the 1st stage) and low-solid-phase polymer drilling fluid (for the 2nd stage). This solved the problems of wellbore instability in fractured formations and reservoir contamination, providing high-quality wellbore conditions for subsequent fracturing. The parameters obtained from mud logging and well logging engineering, including coal seam depth, thickness, and gas content, showed high consistency with the geological model, which accurately located the target fracturing layers and laid a preliminary foundation for subsequent fracturing stimulation and microseismic fracture monitoring.
In response to the characteristics of the block’s coal reservoirs—strong heterogeneity (permeability of 0.0271–0.79 mD), significant differences in reservoir pressure systems (coexistence of normal, low, and abnormal high pressures), and coal structure dominated by massive type with strong heterogeneity—the fracturing interval combination was optimized (combining commingled layers and single layers). The active water fracturing fluid system and temporary plugging ball staged fracturing technology were used to achieve differentiated interval stimulation, and the staged fracturing process showed good adaptability to reservoir conditions. The total fracturing fluid volume per well ranged from 5291.93 m3 to 6501.56 m3, and the total proppant volume ranged from 215.87 m3 to 260.89 m3.
By applying microseismic fracture monitoring technologies such as the ground dense array (annular layout with 300 m spacing) and tomographic imaging energy scanning inversion, dynamic four-dimensional imaging of fractures was realized and the fracturing effect was quantitatively evaluated. The results show that the overall fracture energy during fracturing exhibits periodicity, with tensile fracturing and shear fracturing occurring alternately. The fracturing fracture length of the production wells ranges from 205 m to 296 m, and the proportion of effective stimulated volume for each well exceeds 75%. The fracture network morphology is mainly asymmetrically distributed, and the fractures extend along the direction of the maximum horizontal principal stress (nearly east–west, with azimuth angles of 85–95°), which is highly consistent with the in situ stress direction. This reveals the controlling effect of reservoir heterogeneity on fracture propagation.
The planar areas stimulated per unit liquid volume of the three production wells (Well A, Well B, and Well C) are 11.31 m2, 15.28 m2, and 20.93 m2 respectively, all falling within the effective stimulation range. The differences in the planar area stimulated per unit liquid volume are consistent with the differences in fracturing parameters of each well, indicating that Well C has the optimal fracturing stimulation effect, followed by Well B and Well A.
In the technical system established in this study, the microseismic fracture monitoring technology not only realizes the “visual” evaluation of the fracturing effect but also provides reverse guidance for the adjustment of fracturing parameters and optimization of production systems, thereby improving the actual fracturing effect and holding practical guiding significance.
Author Contributions
Conceptualization, S.W.; methodology, C.W.; software, P.Z.; validation, J.Z.; investigation, L.Z.; writing—original draft preparation, Y.F.; writing—review and editing, X.L. All authors have read and agreed to the published version of the manuscript.
Funding
This research was supported by the following projects: the Guizhou Provincial Basic Research Program titled “Research on Cross-Interface Propagation Laws and Dominant Control Mechanisms of Supercritical Carbon Dioxide Fracturing in the Coal Seam Group of Longtan Formation, Guizhou” (No. QianKeHeJiChu-ZK[2024]YiBan688); the Guizhou Provincial Geological Exploration Funding Project (No. 52000024P0048BH101732); the Guizhou Provincial Geological Exploration Funding Project (No. 52000021MGQSE7S7K6PRP); and the Guizhou Province Science and Technology Innovation Talent Team: Construction of the Science and Technology Innovation Talent Team for the Evaluation and Development of Unconventional Natural Gas Resources in Complex Structural Areas (No. Qian Ke He Platform Talent-CXTD[2023]013).
Data Availability Statement
The original contributions presented in this study are included in the article. Further inquiries can be directed to the corresponding author.
Acknowledgments
We wish to thank the key laboratory of unconventional natural gas evaluation and development in complex tectonic areas, ministry of natural resources and the laboratory of guizhou province of intelligent development and efficient utilization of energy for providing the experimental conditions support.
Conflicts of Interest
Authors Shaolei Wang, Chuanjie Wu, Pengyu Zheng, Jian Zheng, Lingyun Zhao, and Yinlan Fu were employed by the company Key Laboratory of Unconventional Natural Gas Evaluation and Development in Complex Tectonic Areas Ministry of Natural Resources, Guizhou Engineering Research Institute of Oil & Gas Exploration And Development, The Laboratory of Guizhou Province of Intelligent Development and Efficient Utilization of Energy. The remaining authors declare that the research was conducted in the absence of any commercial or financial relationships that could be construed as a potential conflict of interest.
References
- Li, H.; Liu, Y.; Wang, W.; Liu, M.; Liu, J.; Ma, J.; Gao, H. A Method of Quick and Safe Coal Uncovering by Hydraulic Fracturing in a Multibranch Radial Hole with a Coalbed Methane Well. ACS Omega 2020, 5, 23672–23686. [Google Scholar] [CrossRef]
- Li, S.; Qin, Y.; Tang, D.; Shen, J.; Wang, J.; Chen, S. A comprehensive review of deep coalbed methane and recent developments in China. Int. J. Coal Geol. 2023, 279, 104369. [Google Scholar] [CrossRef]
- Li, G.; Zhang, S.; Ji, C.; Li, J.; Wang, C. Mechanism and technical system of ground and underground combined drainage of CBM in “four region linkage” in coal mining area. Coal Sci. Technol. 2022, 50, 14–25. [Google Scholar] [CrossRef]
- Zhang, L.S.; Shan, Y.F. Quantitative Analysis of Fracture Roughness and Multi-Field Effects for CO2-ECBM Projects. Energies 2024, 17, 2851. [Google Scholar] [CrossRef]
- Fan, L.; Xu, J. Authority–enterprise equilibrium based mixed subsidy mechanism for carbon reduction and energy utilization in the coalbed methane industry. Energy Policy 2020, 147, 111828. [Google Scholar] [CrossRef]
- He, Y.; Li, X.; Cai, J.; Chen, S.; Li, X. Study of Key Factors for Efficient Coalbed Methane Extraction: Pore Structure, Desorption Rate and Seepage Characteristics. Langmuir 2025, 41, 6020–6036. [Google Scholar] [CrossRef]
- Wu, X.; Sun, Z.; Yang, T.; Wang, S.; Zhang, W. Global Progress in Exploration and Development of Unconvetional Hydrocarbons and Assessment of Resources Potential. Mar. Geol. Front. 2020, 36, 1–17. [Google Scholar]
- Xiong, X.; Yan, X.; Xu, F.; Li, S.; Nie, Z.; Feng, Y.; Liu, Y.; Chen, M.; Sun, J.; Zhou, K.; et al. Analysis of multi-factor coupling control mechanism, desorption law and development effect of deep coalbed methane. Acta Pet. Sin. 2023, 44, 1812–1826, 1853. [Google Scholar] [CrossRef]
- Fang, D.; Cheng, Z.; Li, J. Eefficient fracturing technology and fine drainage system of ultra-deep coalbed methane in southeast Chongqing: A case study of NY1 well. Coal Geol. Explor. 2022, 50, 50–56. [Google Scholar]
- Jiang, B.; Wang, L. Evaluation and prediction method of tectonodynamics in fracture development law of coal reservoir. Coal Sci. Technol. 2015, 43, 16–20. [Google Scholar] [CrossRef]
- Zhao, F.; Sun, Z.; Sang, S.; Zhou, X.; Han, Z.; Zhao, L. Progress of Coalbed Methane Exploration and Development in Guizhou Province and the “14th Five-Year Plan” Development Strategy. Nat. Gas Ind. 2022, 42, 65–75. [Google Scholar] [CrossRef]
- Zhou, P.; Gao, W.; Deng, L.; Fu, W. Regional distribution and geotectonic control of Late Permian tectonically deformed coal in Zhina coalfield. Coal Geol. Explor. 2020, 48, 29–34. [Google Scholar] [CrossRef]
- Qiu, W.; Sang, S.; Guo, Z.; Han, S.; Zhou, X.; Zhou, P.; Wu, Z.; Sang, G.; Zhang, B.; Gao, W. Characteristics of stratified coal reservoirs in Liupanshui coalfield of Guizhou Province and exploration and development direction of coalbed methane. Pet. Reserv. Eval. Dev. 2024, 14, 959–966. [Google Scholar]
- Zhou, A.; Li, J.; Gong, W.; Wang, K.; Du, C. Theoretical and numerical study on the contribution of multi-hole arrangement to coalbed methane extraction. Energy 2023, 284, 128598. [Google Scholar] [CrossRef]
- Wang, L.; Zhu, L.; Xue, Y.; Cao, X.; Liu, G. Multiphysics modeling of thermal–fluid–solid interactions in coalbed methane reservoirs: Simulations and optimization strategies. Phys. Fluids 2025, 37, 076649. [Google Scholar] [CrossRef]
- Liu, Y.; Xu, H.; Tang, D.; Mathews, J.P.; Zhai, Y.; Hou, W.; Li, S.; Tao, S.; Xiong, X.; Wang, W. The impact of the coal macrolithotype on reservoir productivity, hydraulic fracture initiation and propagation. Fuel 2019, 239, 471–483. [Google Scholar] [CrossRef]
- Liu, J.; Su, Y.; Sun, L.; Li, C.; Wang, L.; Meng, Y.; Li, Y. Research on Fracturing Optimization of Coalbed Methane Wells Aiming at Economic Benefit-A Case Study of Liulin Block. Energies 2024, 17, 1829. [Google Scholar] [CrossRef]
- Wang, L.; Zhu, L.; Cao, Z.; Liu, J.; Xue, Y.; Wang, P.; Cao, X.; Liu, Y. Thermo-mechanical degradation and fracture evolution in low-permeability coal subjected to cyclic heating–cryogenic cooling. Phys. Fluids 2025, 37, 086617. [Google Scholar] [CrossRef]
- Li, X.; Tian, Y.; Li, Z.; Heng, S.; Zhang, X.; Liu, B. A new technical approach for real-time tensile strength testing of high-temperature granite based on micro-tensile testing technology. Int. J. Min. Sci. Technol. 2025, 35, 1323–1339. [Google Scholar] [CrossRef]
- Wang, Y.F.; He, X.Q.; Wang, E.-Y.; Li, Y.-Z. Research progress and development tendency of the hydraulic technology for increasing the permeability of coal seams. J. China Coal Soc. 2014, 39, 1945–1955. [Google Scholar]
- Sun, J.; Gamboa, E.S.; Schechter, D.; Rui, Z. An integrated workflow for characterization and simulation of complex fracture networks utilizing microseismic and horizontal core data. J. Nat. Gas Sci. Eng. 2016, 34, 1347–1360. [Google Scholar] [CrossRef]
- Zhu, Q.; Feng, Y.; Cai, M.; Liu, J.; Wang, H. Interpretation of the extent of hydraulic fracturing for rockburst prevention using microseismic monitoring data. J. Nat. Gas Sci. Eng. 2017, 38, 107–119. [Google Scholar] [CrossRef]
- Yu, R.; Qian, J.; Liu, L.; Zha, H.; Li, N. Microseismic Precursors of Coal Mine Water Inrush Characterized by Different Waveforms Manifest as Dry to Wet Fracturing. Int. J. Environ. Res. Public Health 2022, 19, 14291. [Google Scholar] [PubMed]
- Shu, L.; Liu, Z.; Wang, K.; Zhu, N.; Yang, J. Characteristics and Classification of Microseismic Signals in Heading Face of Coal Mine: Implication for Coal and Gas Outburst Warning. Rock Mech. Rock Eng. 2022, 55, 6905–6919. [Google Scholar] [CrossRef]
- Cui, F.; Dong, S.; Lai, X.; Chen, J.; Cao, J.; Shan, P. Study on Rule of Overburden Failure and Rock Burst Hazard under Repeated Mining in Fully Mechanized Top-Coal Caving Face with Hard Roof. Energies 2019, 12, 4780. [Google Scholar] [CrossRef]
- Zhang, E.; Zhu, H.; Liu, J.; Gao, L. Microseismic response characteristics of overlying strata failure and unusual gas emissions in deep mining. Eng. Fract. Mech. 2025, 327, 111498. [Google Scholar] [CrossRef]
- Zhang, E.; Zhou, B.; Yang, L.; Li, C.; Li, P. Experimental study on the microseismic response characteristics of coal and gas outbursts. Process Saf. Environ. Prot. 2023, 172, 1058–1071. [Google Scholar] [CrossRef]


Disclaimer/Publisher’s Note: The statements, opinions and data contained in all publications are solely those of the individual author(s) and contributor(s) and not of MDPI and/or the editor(s). MDPI and/or the editor(s) disclaim responsibility for any injury to people or property resulting from any ideas, methods, instructions or products referred to in the content. |
© 2025 by the authors. Licensee MDPI, Basel, Switzerland. This article is an open access article distributed under the terms and conditions of the Creative Commons Attribution (CC BY) license (https://creativecommons.org/licenses/by/4.0/).