Abstract
The parameter optimization design of a power-cycling hydrodynamic mechanical transmission (PCHMT) is an important approach to improving the fuel economy of wheel loaders. First, the output capacity characteristics of the PCHMT were analyzed, revealing the qualitative relationships among structural parameters, efficiency, and the output capacity coefficient. Second, 400 sets of V-cycle operation condition tests were conducted on loaders using five different materials, and a representative loading–hauling cycle was synthesized with the K-means clustering algorithm. Third, a parameter optimization model for the PCHMT was developed based on its output capacity characteristics, and the optimal structural parameters were determined using a genetic algorithm. Finally, a simulation model of the loader powertrain was established to compare fuel consumption under optimal and non-optimal parameters. The results show that although transmission efficiency at the same speed ratio is higher with non-optimal parameters, fuel consumption with optimal parameters is 2.6% lower, confirming the effectiveness of this optimization design method.
1. Introduction
Hydrodynamic transmission has been widely adopted in the construction machinery industry due to its strong self-adaptive capability to external loads and its vibration-damping performance [1]. However, the energy conversion process in hydrodynamic transmission is indirect: mechanical energy is first converted into fluid kinetic energy and then back into mechanical energy, resulting in relatively low transmission efficiency. With increasingly stringent requirements for energy conservation and emissions reduction, these drawbacks have become more pronounced [2]. A power-cycling hydrodynamic mechanical transmission (PCHMT) places the torque converter on a branch of the overall power transmission path, thereby combining the advantages of flexible hydrodynamic transmission with those of high-efficiency mechanical transmission [3,4]. In addition, the capacity adjustment device within the PCHMT allows the engine to achieve effective matching with the transmission in both loading and hauling modes, further reducing vehicle fuel consumption. As a result, the PCHMT represents a promising transmission technology with significant application potential.
Transmission efficiency is a critical factor influencing vehicle fuel economy [5,6]. Investigating hydrodynamic transmission characteristics—including efficiency, torque ratio, and capacity coefficient—provides important guidance for parameter optimization design. In recent years, numerous studies have explored these characteristics. Banerjee et al. [7] applied symbolic sensitivity analysis to identify the five most significant factors affecting torque converter efficiency and conducted parameter design to minimize energy loss. Kawashima et al. [8] developed a compact, high-performance torque converter to replace traditional converters in passenger vehicles. By optimizing torque ratio and efficiency through parameter sensitivity mapping, they revealed the quantitative relationships between profile area and annular dimensions. Kesy et al. [9] established a parametric model of energy transfer in torque converters and used a genetic algorithm to optimize the stall torque ratio, efficiency, and torque permeability, significantly improving torque conversion performance and efficiency compared with pre-optimization designs. Xiong et al. [10], considering the effect of cavitation on torque converter efficiency, proposed modifying the stator blade shape to a Joukowski airfoil, thereby simultaneously enhancing flow-field stability and transmission efficiency.
The input torque of the PCHMT is a function of the input speed. The matching performance of the transmission and the engine also affects the vehicle’s fuel efficiency [11,12]. You et al. [13] developed an analytical model of PCHMT characteristics to minimize shifting shock in loaders. They examined the impact of the number of gears in a constant-ratio speed regulation device and the transmission ratio of each gear on the system’s speed ratio range and torque ratio, thereby identifying the optimal structural parameters. Wang et al. [14] carried out a matching optimization design for the engine and a PCHMT, in which the geared transmission had one gear and a speed ratio of 1. Seven evaluation indicators of matching performance were defined, and all indicators of the optimized system showed improvement compared with those of the pre-optimization joint system. To address the limitation of the traditional static power matching method in fully leveraging all performance advantages of hydrodynamic transmission, Kan et al. [15] proposed a dynamic power matching design method based on typical loader cycle data. Compared with conventional matching approaches, the dynamic method can significantly improve the dynamic performance and fuel economy of loaders. Kan et al. [16] conducted a matching optimization design for a PCHMT with two gears and an engine, based on loader loading and hauling conditions. Compared with traditional automatic transmissions, the PCHMT exhibited a wider high-efficiency zone, as well as higher average efficiency and average output power within that zone.
From the above literature, it can be concluded that current research mainly follows the direction of power flow in transmission to optimize the performances of hydrodynamic transmissions, focusing primarily on the relationships among speed ratio, efficiency, and structural parameters. A PCHMT, however, is a self-adaptive transmission device. Under identical external load conditions, systems with different parameters may operate at different speed ratios. As a result, traditional forward design approaches cannot guarantee optimal structural parameters. To address this limitation, this study first investigates the output capacity characteristics of the PCHMT, revealing the qualitative relationships among efficiency, speed ratio, and output capacity coefficient. A representative loading–hauling cycle for a loader is then constructed. Based on this cycle, a parameter optimization design of the transmission is performed. Finally, simulation analysis is carried out to validate the rationality of the proposed design method.
2. Analysis of Output Capacity Characteristics of PCHMT
The PCHMT primarily comprises a capacity adjustment device, planetary gear set, torque converter, fixed-ratio gear mechanism, and range transmission. A schematic of the PCHMT is shown in Figure 1. Power from the engine is transmitted through the capacity adjustment device and delivered to the planetary carrier. The planetary gear set then divides this power: one portion is transmitted to the range transmission to drive the vehicle, while the other passes through the torque converter. The recirculated power from the torque converter combines with the engine input to form the input power of the capacity adjustment device. The device operates in two modes, and switching between them allows different matching patterns with the engine, ensuring that the powertrain consistently functions within high-efficiency ranges.
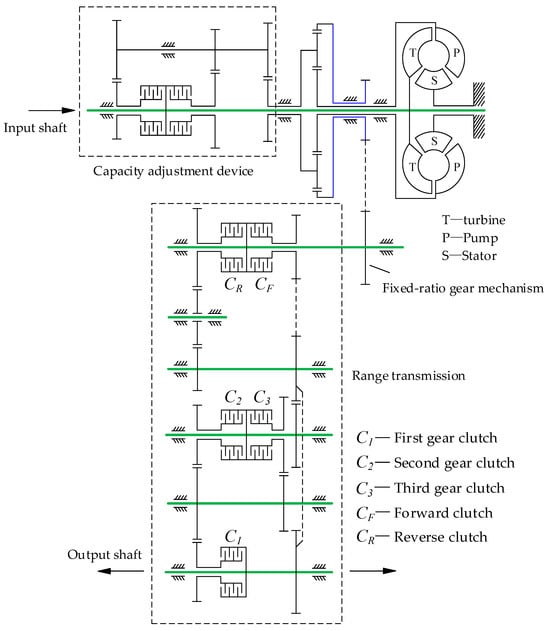
Figure 1.
Schematic configuration of the PCHMT.
Based on the mechanical relationships and power flow directions between the adjacent components of the PCHMT, the expressions for the transmission speed ratio iPCHMT, torque ratio KPCHMT, efficiency ηPCHMT, and input capacity coefficient λPCHMT,in are derived as follows:
In Equations (1)–(5), i, K, η, T, and n denote the speed ratio, torque ratio, efficiency, torque, and rotational speed, respectively. The subscripts TC, cad, and pgs represent the torque converter, capacity adjustment device, and planetary gear set, respectively. Subscripts frgm, rt, fd, and wr denote the fixed-ratio gear mechanism, gearbox (range transmission), final drive, and wheel reducer, respectively. The subscripts in and out indicate input and output, respectively. The parameter α is the speed ratio of the planetary gear set, D is the diameter of the torque converter, and λp is the input torque coefficient of the torque converter.
From Equations (1)–(5), it follows that, under constant structural parameters of the transmission, the input torque TPCHMT,in and the torque ratio KPCHMT are functions of the transmission speed ratio iPCHMT and the input speed nPCHMT,in.
The speed ratio iPCHMT is expressed as a function of the output torque TPCHMT,out and the output speed nPCHMT,out to reveal the self-adaptive characteristics of the PCHMT under varying external load conditions.
As shown in Equation (8), the load on the transmission (TPCHMT,out, nPCHMT,out) is closely related to its structural parameters. By analogy with the input capacity coefficient of torque converters [17], nPCHMT,out/ is defined as the output capacity coefficient of the PCHMT, denoted as CPCHMT,out.
The output capacity coefficient, structural parameters, and efficiency of the PCHMT have a coupling relationship. The qualitative relationships among these factors can be obtained by analyzing the transmission’s output capacity characteristics. Table 1 lists the main parameters related to the longitudinal dynamics of a medium-sized loader, and Figure 2 illustrates the speed ratio–efficiency curves and output capacity characteristic curves of the transmission under different speed ratios of the capacity adjustment device.

Table 1.
Key parameters associated with longitudinal dynamics of the wheel loader.
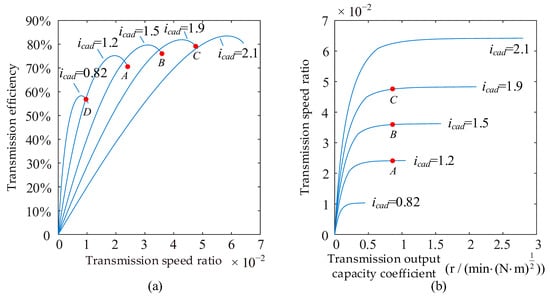
Figure 2.
(a) Speed ratio–efficiency curves and (b) output capacity characteristic curves of the PCHMT.
As shown in Figure 2a, when the transmission speed ratio lies to the left of the intersection point of the two curves (iPCHMT < iD), a smaller speed ratio icad of the capacity adjustment device results in higher transmission efficiency. From the perspective of conventional forward design, selecting a smaller icad would therefore appear beneficial for improving the loader’s fuel economy. However, Figure 2b shows that under identical load conditions, the operating speed ratio of the transmission varies with different capacity adjustment speed ratios. A larger icad leads to a higher transmission speed ratio, which in turn produces higher transmission efficiency. Based on this observation, a larger speed ratio icad of the capacity adjustment device should be selected. Consequently, the design of the PCHMT should be optimized with reference to its output capacity characteristics rather than conventional forward design logic.
3. Construction of Typical Loading–Hauling Cycle for the Loader
Unlike the methodology used to establish typical driving cycles for passenger vehicles, sensors of construction machinery such as wheel loaders require capturing not only speed and torque signals from the powertrain but also hydraulic signals from non-powertrain systems, including the working implements and steering system. These signals are strongly influenced by factors such as material density, shape, and pile size, leading to substantial variation and randomness. The K-means clustering algorithm is well suited for processing such raw operational data because of its low computational complexity and good scalability [18]. Therefore, this study employs K-means clustering to construct typical loading–hauling cycle for the loader.
3.1. Data Acquisition
During operation, part of the engine power is transmitted to the driveline to propel the vehicle, while the remainder is supplied to the working implements, steering system, and braking system. The physical quantities that characterize vehicle energy consumption behavior include vehicle speed, travel resistance, and hydraulic resistance torque. For this study, a 5-ton loader equipped with sensors on both the powertrain and hydraulic systems was used as the test vehicle (Figure 3). Tests were carried out in a flat, open suburban area (Figure 4).
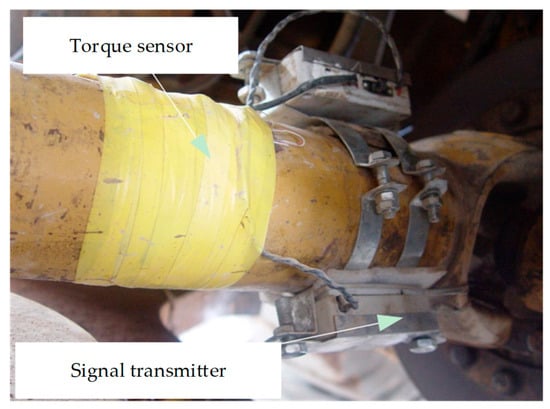
Figure 3.
Installation location of loader sensors.
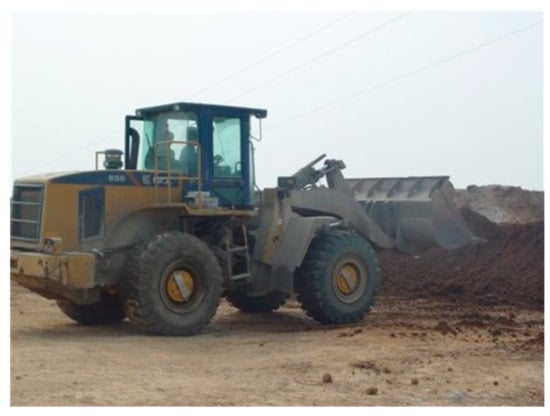
Figure 4.
Loader worksite.
To address the poor robustness of the designed structural parameter that could result from testing with only a single material, an experienced operator performed complete digging and hauling operations following a V-shaped loading method. Eighty buckets were used across five material types: sandy soil, clay, fine sand, crushed stone, and large rocks. Table 2 lists the densities of the five materials. Table 3 lists the types and configurations of sensors employed in the tests.
Table 2.
Material densities.
Table 3.
Sensor types and locations.
3.2. Processing and Transformation of Experimental Data
During the process of acquiring operational data, measurement devices record the interference signals generated by external systems. This study employed a pulse noise filter to remove singularities from the operational data curves and a high-frequency noise filter to eliminate high-frequency noise signals [19]. The pulse noise filter has the following form:
where x (t) represents the operational data at time t.
The high-frequency noise filter is defined as [20]:
where K(y) is the weight of the signal around time t; in this study, h is set to 4 s. K(y) is calculated as follows [21]:
A portion of the engine power is transmitted through the components of the transmission and ultimately delivered to the wheels. The relationship between the vehicle speed vveh and output shaft speed of the transmission nrt,out is given by
where rwh is the wheel radius.
The travel resistance Ftra of a loader comprises the rolling resistance and penetration resistance. The rolling resistance can be readily calculated, whereas the penetration resistance is influenced by factors such as bucket shape, penetration depth, and material type. Its calculation relies heavily on empirical methods, and often yields results with significant errors. Therefore, travel resistance was determined indirectly in this study using the loader’s travel equation.
where m is the loader mass, δ is the rotational mass conversion factor, Tb is the braking torque, which can be determined based on the extension/retraction displacement of the brake cylinder [22].
where μb is the friction coefficient of the friction plate, ηb is the performance factor, rb is the effective braking radius, kp and cp represent the stiffness and viscous damping coefficient of the brake, respectively, and xp is the displacement of the wheel cylinder piston.
The input torque Tpu of the hydraulic pump can be expressed as:
where Ppu, qpu, and ηpu are the outlet pressure, displacement, and efficiency of the hydraulic pump, respectively.
The total hydraulic resistance torque Tp,tot during vehicle operation is given by [23]:
where Twp, Ttp, and Tbp represent the input torques of the hydraulic pumps for the implement system, steering system, and braking system, respectively.
The signals acquired by the sensors were converted according to Equations (10)–(17) to obtain the loading–hauling operational data of the loader, as shown in Figure 5.
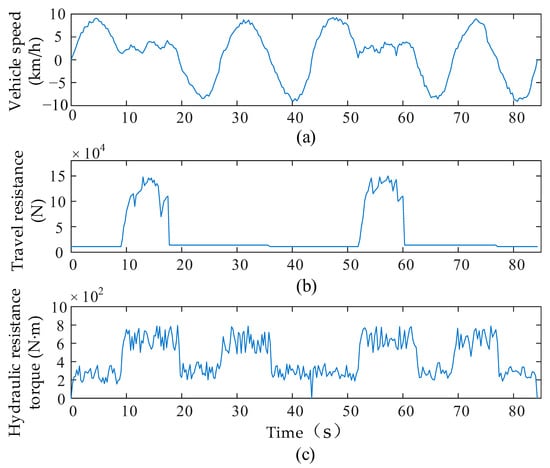
Figure 5.
A segment of the loader’s loading–hauling operational data: (a) vehicle speed, (b) travel resistance, and (c) hydraulic resistance torque.
3.3. K-Means Clustering of Operational Data
The basic procedure of the K-means clustering algorithm is as follows. First, K clusters are selected from n samples, and the initial cluster centers are determined. The distance between each sample and all cluster centers is then calculated, and each sample is assigned to its nearest cluster center. Next, the cluster centers are recalculated, and the cluster assignments are readjusted to maximize intra-cluster similarity and minimize inter-cluster similarity. This process is iterated until a predefined termination condition is satisfied.
Following the methodology for constructing typical driving cycles of vehicles [24,25], an operational block (i.e., a sample) is defined as the time history of operational parameters between two consecutive zero-speed points of the loader. As described in the previous section, three types of operational blocks are identified for the loader: speed, travel resistance, and hydraulic resistance torque blocks. To comprehensively characterize the mathematical properties of the speed blocks, the following feature parameters (initial individuals of the speed samples) are selected: average speed vmean, maximum speed vmax, average acceleration amean, average positive acceleration ameanp, average negative acceleration ameann, digging time ratio ted, hauling time ratio tht, maximum acceleration amax, minimum acceleration amin, travel distance s, speed variance vvar, acceleration variance avar, sum of squared speeds vspa, and sum of squared accelerations aspa. Similarly, 14 feature parameters—including average travel resistance, maximum travel resistance, and the mean value of travel resistance change rate—are selected for the travel resistance blocks. For the hydraulic resistance torque blocks, 14 feature parameters are also defined, such as average hydraulic resistance torque, maximum hydraulic resistance torque, and the mean value of change rate of hydraulic resistance torque.
When clustering operational blocks, computational complexity must be considered, and the resulting operational conditions should provide meaningful guidance for new transmission design. Therefore, for each block type, the three feature parameters with the strongest correlation to fuel consumption are selected as representative features for clustering. The correlation coefficient rty between a feature parameter and fuel consumption is calculated as:
where and represent the mean values of the feature parameters and fuel consumption across all operational blocks, respectively, and n = 400.
The feature parameter and fuel consumption values of the known speed, travel resistance, and hydraulic resistance torque blocks are substituted into Equation (18). The calculation results are shown in Figure 6. For the same type of operational block, the correlation coefficients vary within a range of −0.2 to 1, and the differences between them are significant. This indicates weak correlations among the feature parameters, underscoring the necessity of selecting representative parameters. Based on the classification standard for the correlation strength, feature parameters with moderate or high correlations were selected as representative features for each type of operational block:
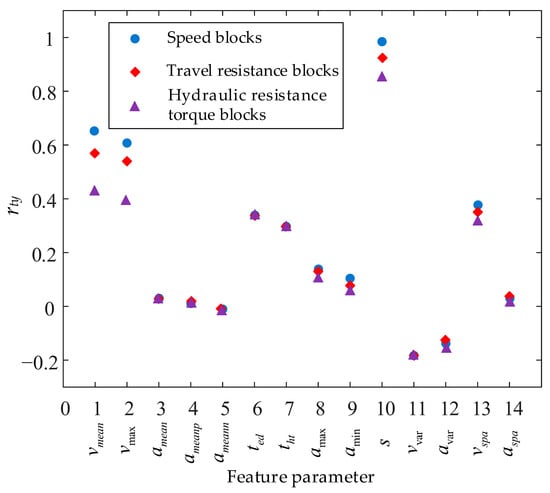
Figure 6.
Correlation coefficients between feature parameters of operational blocks and fuel consumption.
- For the speed blocks, average speed vmean, maximum speed vmax, and travel distance s.
- For the travel resistance blocks, the average travel resistance Ftramean, maximum travel resistance Ftramax, and integral sum of the travel resistance Ftraint.
- For the hydraulic resistance torque blocks, the average hydraulic resistance torque Thrtmean, the maximum hydraulic resistance torque Thrtmax, and the integral sum of the hydraulic resistance torque Thrtint.
The 400 operational blocks of each loader operation condition were divided into four clusters and classified using the K-means clustering algorithm. The Euclidean distance was used to measure the distance between the samples and cluster centers. The iteration termination conditions were as follows:
- (1)
- The sum of the distances between all cluster centers was less than or equal to the difference Dk between the maximum and minimum values of the sample data;
- (2)
- The distance between any two cluster centers was greater than or equal to a predefined threshold dt, where the product of dt and the number of clusters was less than or equal to Dk.
The clustering results are shown in Figure 7. The algorithm achieved excellent convergence: the 400 operational blocks for each operation condition were successfully classified into four categories (clusters). Clusters 1, 2, 3, and 4 represent the following operational phases of the loader, respectively:
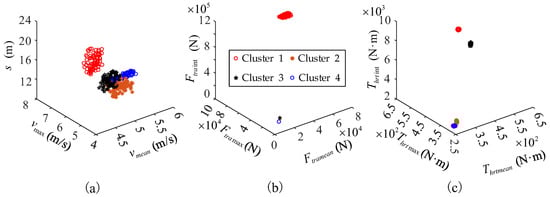
Figure 7.
Computational results of the K-means clustering algorithm: (a) speed block, (b) travel resistance block, and (c) hydraulic resistance torque block.
- Forward digging operation;
- Loaded reverse operation;
- Loaded travel to truck operation;
- Empty return operation.
Based on these results, representative samples were selected from each cluster. By fitting and splicing these samples, a typical loading–hauling cycle of the loader can be constructed.
3.4. Synthesis of the Typical Loading–Hauling Cycle
The total duration ttot of the typical loading–hauling cycle of the loader is calculated as the ratio of the effective signal acquisition time tsa to the number of effective working cycles Nwc as follows:
The proportion of the total time tcl,i for each cluster under the speed condition relative to the effective signal acquisition time is computed and used as the time proportion ttyc,i that the four phases of the typical loading–hauling cycle should occupy:
where
i represents the operational phase of the loader, i = 1,2,3,4.
The operational block closest to the cluster center was selected as the representative block for each cluster. The final typical loading–hauling cycle of the loader is reconstructed by fitting and splicing the representative operational blocks according to the durations ttyc,i of each phase, as shown in Figure 8.
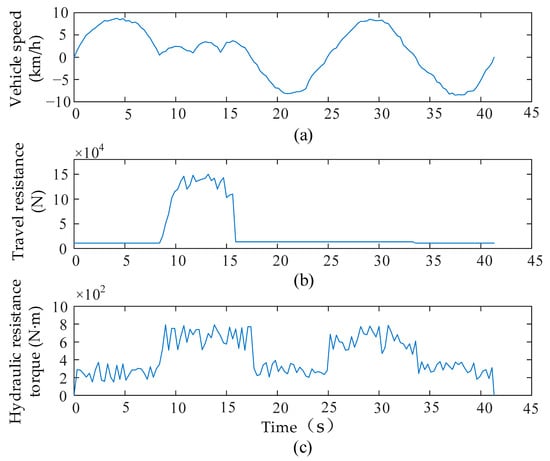
Figure 8.
Typical loading–hauling cycle of the loader: (a) vehicle speed, (b) travel resistance, and (c) hydraulic resistance torque.
4. Parameter Optimization Design for the PCHMT
4.1. Definition of the Optimization Problem
As outlined in Section 1, the efficiency of a hydromechanical transmission depends not only on its structural parameters but also on the external load. For a PCHMT, efficiency is strongly influenced by the loader’s operating load, resulting in substantial variation. Traditional design methods that optimize transmission efficiency over a specific speed ratio range are therefore unable to consistently minimize loader fuel consumption. To address this limitation, this study performs parameter optimization design for a PCHMT based on the constructed typical loading–hauling cycle of the loader, with the objective of minimizing vehicle fuel consumption. The optimization objective function is defined as
where represents the instantaneous fuel consumption rate of the engine, and x denotes the design variables. The engine’s universal characteristic map is shown in Figure 9.
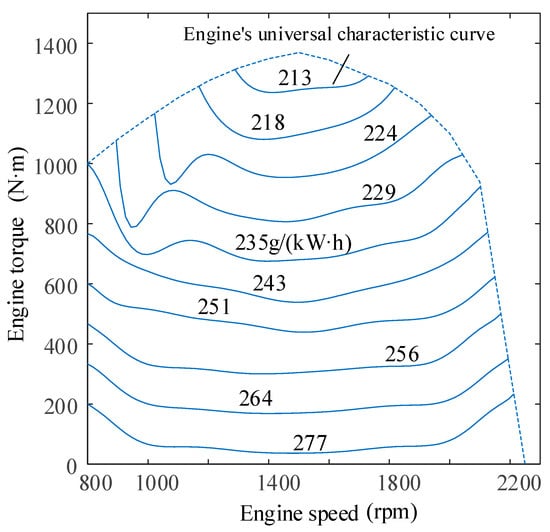
Figure 9.
Engine’s universal characteristic map.
Power loss in the transmission arises primarily from hydraulic losses. Among the many torque converter blade parameters, the impeller exit angle and stator exit angle exert the greatest influence on efficiency. The loader’s transmission control strategy is relatively simple: first gear is used for digging, and second gear is used for material transport. The effects of control strategy and gearbox speed ratio on instantaneous fuel consumption rate are negligible. Consequently, only the structural parameters of the PCHMT are selected as design variables for the optimization problem. These include the first-stage speed ratio icad,1 of the capacity regulation device, the second-stage speed ratio icad,2, the PGS speed ratio α, the torque converter diameter D, the impeller exit angle βp, and the stator exit angle βs. The blade angles of the torque converter are defined with respect to the circumferential direction. Design variables are constrained by practical considerations such as component installation space, manufacturing complexity, and reliability. The corresponding constraints are defined as follows [26].
4.2. Implicit Constraints on Design Variables
Unlike pure mechanical transmissions, the input torque and transmissible power of a hydromechanical transmission are strongly influenced by its structural parameters. This study focuses on optimizing the transmission design for medium-sized loaders. Accordingly, the external characteristic curve of the engine, along with the loader’s maximum speed and traction force, imposes implicit constraints on these parameters. Based on the engine power transmission path and the vehicle’s longitudinal power balance equation [27], these implicit constraints can be expressed as
where Teng is the torque on the engine external characteristic curve; neng,min and neng,max are the minimum and maximum engine speeds under normal operation, obtainable from the external characteristic curve; Ftrc,max is the maximum traction force of the loader; φ is the ground adhesion coefficient; fr is the rolling resistance coefficient; CD represents the aerodynamic drag coefficient; Af is the loader’s frontal area; and vmax is the loader’s maximum speed.
4.3. Optimization Problem Solving Method
Before calculating the instantaneous fuel consumption rate of the loader, a steady-state mechanical model of the torque converter must be established. Due to space limitations, this section is omitted; the detailed modeling process and key structural parameters are available in [26]. The calculation procedure for the instantaneous fuel consumption rate is illustrated in Figure 10. First, the wheel speed and driving torque are obtained by inputting the vehicle speed and driving resistance into the vehicle dynamics equations. The input torque and speed of the PCHMT are then determined by tracing backward along the driveline power transmission path. Finally, by combining these with the known hydraulic resistance torque, the instantaneous fuel consumption rate is obtained through interpolation of the engine’s universal characteristic map.
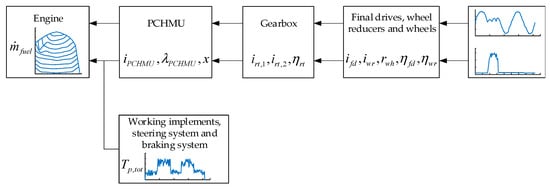
Figure 10.
Calculation process for instantaneous fuel consumption rate.
The optimization problem described above is a single-objective, multi-variable problem with nonlinear constraints. The genetic algorithm is an intelligent optimization algorithm that identifies the optimal parameter combination by continuously performing selection, crossover, and mutation on the individuals (a single solution) within a population (multiple solutions) [28]. Moreover, its global search capability helps avoid convergence to local optima, making it particularly well suited to this optimization task.
4.4. Analysis of Optimization Results
The optimization design program for the PCHMT was implemented in MATLAB (2024a). The main parameters of the genetic algorithm were set as follows: population size of 300, maximum iterations of 400, crossover probability of 0.9, and mutation probability of 0.1. The evolution of the average and minimum fitness values across generations is shown in Figure 11. When the iteration count was below 128, the minimum fuel consumption decreased continuously due to thorough crossover of the design variables over their entire range. As the number of iterations increased, the effect of individual mutations on the fitness became more pronounced, leading to step-like changes in minimum fuel consumption. Beyond 235 iterations, mutation and crossover no longer affected the trend of the minimum fuel consumption curve, and the fitness value stabilized. The evolution of the average fuel consumption also showed a gradual decrease, consistent with the trend observed for the minimum fuel consumption. These results confirm that the optimization design of the PCHMT achieved global convergence. The minimum fuel consumption obtained was 292.3 mL, and the corresponding optimal design variable values were icad,1 = 0.87, icad,2 = 1.25, α = 2.61, D = 0.366 m, βp = −22.3°, and βs = 65.5°, respectively.
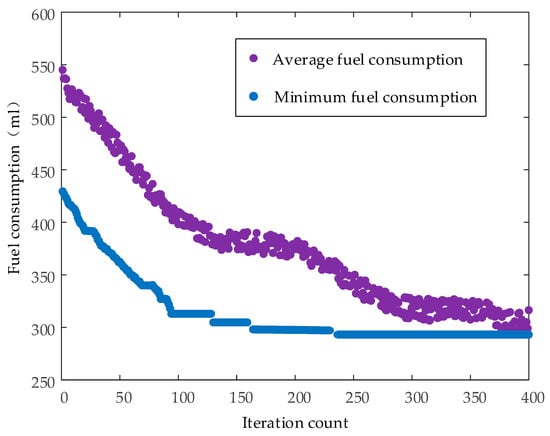
Figure 11.
Optimization iteration results of the genetic algorithm.
5. Simulation Verification
The optimal and non-optimal parameter values of the design variables—icad,1 = 0.83, icad,2 = 1.3, α = 2.87, D = 0.358 m, βp = −24.6°, and βs = 63.2°—were selected from the iteration results of the genetic algorithm. Backward simulations of the loader corresponding to these two parameter sets were performed in MATLAB (2024a). Figure 12 presents the variation in fuel consumption of the loader over time. To investigate the cause of the fuel consumption difference between the two parameter sets, the efficiency differences in both the PCHMT and the powertrain were calculated, as shown in Figure 13 and Figure 14, respectively.
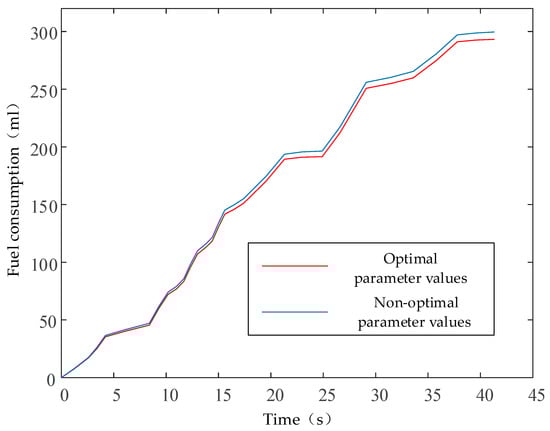
Figure 12.
Comparison of loader fuel consumption under optimal vs. non-optimal parameters.
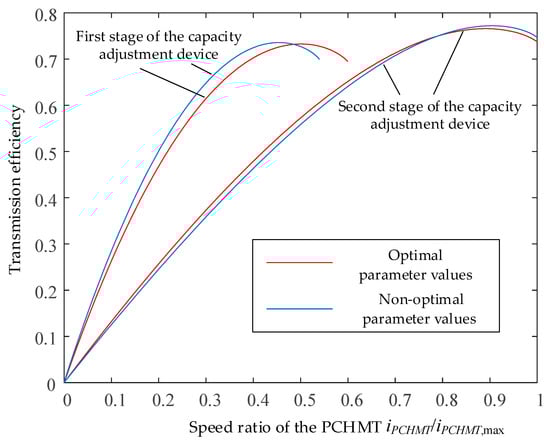
Figure 13.
Efficiency comparison of the reflux hydro-mechanical transmission system under optimal vs. non-optimal parameters.
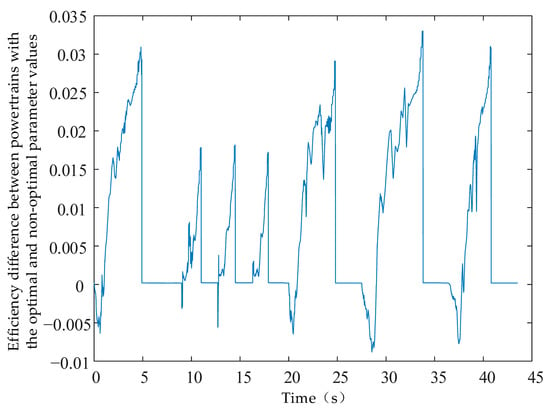
Figure 14.
Efficiency difference between powertrains with the optimal and non-optimal parameter values.
During the material-digging phase, the capacity adjustment device operates in the first stage. Across the entire speed ratio range, the average efficiency of the transmission with non-optimal parameters was 6.16% higher than that with optimal parameters. However, because the PCHMT is adaptive, the transmission with optimal parameters operated at a higher speed ratio under the same load, resulting in 2.6% lower fuel consumption compared with the non-optimal case.
During the material handling and unloading phases, the capacity adjustment device operates in the second stage. In this phase, the transmission efficiency and capacity characteristics of the two parameter sets were similar. Nevertheless, as shown in Figure 13, the powertrain with optimal parameters maintained a notable efficiency advantage by enabling the engine to operate in a more efficient range. Consequently, as operating time increased, the energy-saving benefits of the optimal transmission system became more pronounced, ultimately reducing fuel consumption by 2.6% relative to the non-optimal transmission. These results demonstrate the effectiveness of the proposed design method for a PCHMT based on output capacity characteristics.
6. Conclusions
This study investigated the coupling relationship among efficiency, structural parameters, and the output capacity coefficient of a PCHMT. A parameter optimization design method based on output capacity characteristics was proposed, and a simulation model of a loader powertrain system was developed to verify its effectiveness.
- (1)
- The traditional forward parameter design method, which proceeds sequentially from the engine to the transmission and then to the wheels, determines the structural parameters based solely on the speed ratio–efficiency relationship. However, this approach cannot ensure higher transmission efficiency under identical load conditions, thereby underscoring the necessity of a design methodology based on output capacity characteristics.
- (2)
- Using the K-means clustering algorithm, a typical loading–hauling cycle was constructed for the loader. This representative cycle captures the essential operating characteristics of the machine and provides a reliable basis for parameter and control system design.
- (3)
- A comparative analysis of fuel consumption and transmission efficiency under optimal and non-optimal parameter conditions revealed that, although the transmission efficiency of the optimal parameters was lower, fuel economy improved by 2.6%. This demonstrates that the optimized parameters effectively enhance overall loader performance and can be applied to guide future transmission design.
Finally, it is important to note that for the calculation of the loader’s fuel consumption, this paper simplifies the mechanical models of various components in the PCHMT. Specifically, the efficiency of the working hydraulic system is assumed constant, and the effects of rotational speed and load on gear pair efficiency are not considered. In practice, hydraulic system efficiency depends on both flow rate and displacement. Additionally, the lower the load on a gear pair, the lower its efficiency. A 2.6% fuel saving rate is a relatively low figure and is inevitably susceptible to interference from these factors. Therefore, multiple sets of experiments are required in the future to eliminate the effects of interfering factors and model errors. Only in this way can the proposed optimization design method possess practical engineering value.
Author Contributions
Conceptualization, X.L. and C.L.; methodology, C.P.; software, C.L.; validation, C.L.; formal analysis, C.P.; investigation, X.L.; resources, X.L.; writing—original draft preparation, X.L.; writing—review and editing, C.L.; funding acquisition, C.L. All authors have read and agreed to the published version of the manuscript.
Funding
This research was funded by National Key Research and Development Plan, grant number 2023YFB3406204.
Data Availability Statement
The original contributions presented in this study are included in the article. Further inquiries can be directed to the corresponding author.
Acknowledgments
The author gratefully acknowledges the assistance of Sun Dongye in MATLAB (2024a). modeling.
Conflicts of Interest
The authors declare no conflicts of interest.
Abbreviations
The following abbreviations are used in this manuscript:
| i | Speed ratio |
| K | Torque ratio |
| η | Efficiency |
| T | Torque |
| n | Rotational speed |
| λp | Input torque coefficient of the torque converter |
| α | Speed ratio of the planetary gear set |
| D | Diameter of the torque converter |
| ρ | Density of the working fluid |
| in | Input |
| out | Output |
| λPCHMT,in | Input torque coefficient of the PCHMT |
| CPCHMT,out | Output capacity coefficient of the PCHMT |
| Ftra | Travel resistance of the wheel loader |
| Tb | Braking torque of the wheel loader |
| vveh | Vehicle speed |
| rwh | Wheel radius |
| m | Loader mass |
| Tpu | Input torque of the hydraulic pump |
| Ppu | Outlet pressure the hydraulic pump |
| qpu | Displacement the hydraulic pump |
| ηpu | Efficiency the hydraulic pump |
| Tp,tot | Total hydraulic resistance torque |
| Twp | Input torque of the hydraulic pump for the implement system |
| Ttp, | Input torque of the hydraulic pump for the steering system |
| Tbp | Input torque of the hydraulic pump for the braking system |
| rty | Correlation coefficient between a feature parameter and fuel consumption |
| ttot | Total duration of the typical loading–hauling cycle |
| tsa | Ratio of the effective signal acquisition time |
| Nwc | The number of effective working cycles |
| icad,1 | First-stage speed ratio of the capacity regulation device |
| βp | Impeller exit angle |
| βs | Stator exit angle |
| Teng | The torque on the engine external characteristic curve |
| neng | Engine speed |
| Ftrc,max | Maximum traction force of the loader |
| φ | Ground adhesion coefficient |
| fr | Rolling resistance coefficient |
| PCHMT | Power-cycling hydrodynamic mechanical transmission |
| TC | Torque converter |
| cad | Capacity adjustment device |
| pgs/PGS | Planetary gear set |
| frgm | Fixed-ratio gear mechanism |
| rt | Range transmission |
| fd | Final drive |
| wr | Wheel reducer |
References
- Ma, W.; Xie, D.; Wang, Z.; Ran, Z.; Liu, C.; Wang, S. Modeling, calculation, and analysis of torsional vibration characteristics of the hydrodynamic transmission system in engineering vehicle. Proc. Inst. Mech. Eng. Part D J. Automob. Eng. 2022, 236, 1824–1839. [Google Scholar] [CrossRef]
- Xia, G.; Gao, J.; Tang, X.; Wang, S.; Sun, B. Control strategy for shift schedule correction based on driving habits for vehicles with automatic transmission. Int. J. Automot. Technol. 2020, 21, 407–418. [Google Scholar] [CrossRef]
- Wang, H.; Sun, D.; Qin, D. A new continuously variable transmission system applied to transmission system of the roadheader’s cutting unit. Proc. Inst. Mech. Eng. Part C J. Mech. Eng. Sci. 2017, 231, 3590–3600. [Google Scholar] [CrossRef]
- Zhang, Z.; Wang, H.; Ge, S.; Li, M. Torsional vibration analysis of a powertrain with a power reflux hydraulic transmission system. J. Vibroeng. 2022, 24, 405–415. [Google Scholar] [CrossRef]
- Yu, J.; Song, Y.; Zhang, H.; Dong, X. Novel design of compound coupled hydro-mechanical transmission on heavy-duty vehicle for energy recycling. Energy 2022, 239, 122291. [Google Scholar] [CrossRef]
- Kwon, K.; Lee, J.; Lim, S. Optimization of multi-speed transmission for electric vehicles based on electrical and mechanical efficiency analysis. Appl. Energy 2023, 342, 121203. [Google Scholar] [CrossRef]
- Banerjee, J.; Adibi asl, H.; Lashgarian, A.N.; McPhee, J. Parametric importance analysis and design optimization of a torque con verter model using sensitivity information. SAE Int. J. Passeng. Cars Mech. Syst. 2012, 5, 621–638. [Google Scholar] [CrossRef]
- Kawashima, K.; Endo, M. Development of a Compact and High-Performance Torque Converter Based on a New Parameter Sensitivity Mapping; Search Technical Paper; SAE International: Detroit, MI, USA, 2019. [Google Scholar]
- Kesy, A.; Kadziela, A. Construction optimization of hydrodynamic torque converter with application of genetic algorithm. Arch. Civ. Mech. Eng. 2011, 11, 905–920. [Google Scholar] [CrossRef]
- Xiong, P.; Chen, X.; Sun, H.; Zhong, J.; Wu, L.; Gao, H. Effect of the blade shaped by Joukowsky airfoil transformation on the characteristics of the torque converter. Proc. Inst. Mech. Eng. Part D J. Automob. Eng. 2021, 235, 3314–3321. [Google Scholar] [CrossRef]
- Li, C.; Meng, F.; Xi, J.; Zhai, Y. Starting shift control of heavy-duty automatic transmissions based on the optimal trajectory of turbine speed. Mech. Syst. Signal Process. 2019, 126, 490–504. [Google Scholar] [CrossRef]
- Yang, W.; Xiao, X. Design and analysis of mechanisms of 7-, 8- and 9-speed automatic transmissions for vehicle powertrains. Energies 2023, 16, 7402. [Google Scholar] [CrossRef]
- You, Y.; Sun, D.; Qin, D. Research on vehicle starting control based on reflux power condition. Mech. Mach. Theory 2019, 134, 289–307. [Google Scholar] [CrossRef]
- Wang, H.; Sun, D. Optimal matching between a diesel engine and a PRHTS transmission. J. Braz. Soc. Mech. Sci. Eng. 2017, 39, 3375–3387. [Google Scholar] [CrossRef]
- Kan, Y.; Xie, S.; Yin, Q.; Jiang, W.; Yang, M.; Qian, R. Dynamic power matching for wheel loader based on power reflux hydrodynamic transmission system. Proc. Inst. Mech. Eng. Part D J. Automob. Eng. 2025, 239, 4403–4417. [Google Scholar] [CrossRef]
- Kan, Y.; Sun, D.; Luo, Y.; Ma, K.; Shi, J. Optimal design of power matching for wheel loader based on power reflux hydraulic transmission system. Mech. Mach. Theory 2019, 142, 103600. [Google Scholar] [CrossRef]
- Naunheimer, H.; Bertsche, B.; Ryborz, J.; Novak, W.; Fietkau, P. Automotive Transmissions: Fundamentals, Selection, Design and Application; Springer: Berlin/Heidelberg, Germany, 2011. [Google Scholar]
- Molokomme, D.N.; Chabalala, C.S.; Bokoro, P.N. Enhancement of advanced metering infrastructure performance using unsupervised k-means clustering algorithm. Energies 2021, 14, 2732. [Google Scholar] [CrossRef]
- Gabana, P.; Giménez, B.; Melgar, A.; Horrillo, A. Adaptive polynomial filter applied to in-cylinder pressure signal in internal combustion engines. Mech. Syst. Signal Process. 2025, 235, 112871. [Google Scholar] [CrossRef]
- Xu, S.; Su, Z.; Hao, J.; Liu, Z. High-frequency noise suppression method for active magnetic bearings using the steady state Kalman filter. J. Mech. Sci. Technol. 2025, 39, 2519–2530. [Google Scholar] [CrossRef]
- Qin, D.; Zhan, S.; Qi, Z.; Chen, S. Driving cycle construction using K-means clustering method. J. Jilin Univ. 2016, 46, 384–389. [Google Scholar] [CrossRef]
- Meng, F.; Tao, G.; Chen, H. Smooth shift control of an automatic transmission for heavy-duty vehicles. Neurocomputing 2015, 39, 197–206. [Google Scholar] [CrossRef]
- Wang, F.; Wu, Z.; Xu, B.; Fiebig, W. A mode-driven control strategy to reduce electric drive peak power of hybrid wheel loader propulsion system. IEEE Trans. Veh. Technol. 2023, 72, 5948–5961. [Google Scholar] [CrossRef]
- Shi, Q.; Qiu, D.; Zhou, J. Driving cycle construction and accuracy analysis based on combined clustering technique. Automot. Eng. 2012, 34, 164–169+158. (In Chinese) [Google Scholar]
- Lei, J.; Yang, C.; Ren, C.; Li, W.; Liu, C.; Sun, A.; Liu, Y.; Chen, Z.; Yu, T. Development and validation of a deep learning-based model for predicting burnup nuclide density. Int. J. Energ. Res. 2022, 46, 21257–21265. [Google Scholar] [CrossRef]
- Liu, X.; Sun, D. An improved design of power-cycling hydrodynamic mechanical transmission. J. Mech. Sci. Technol. 2020, 34, 3165–3179. [Google Scholar] [CrossRef]
- Yu, Z. Automobile Theory, 6th ed.; China Machine Press: Beijing, China, 2024. (In Chinese) [Google Scholar]
- Xu, Y.; Zhang, H.; Yang, Y.; Zhang, J.; Yang, F.; Yan, D.; Yang, H.; Wang, Y. Optimization of energy management strategy for extended range electric vehicles using multi-island genetic algorithm. J. Energy Storage 2023, 61, 106802. [Google Scholar] [CrossRef]


Disclaimer/Publisher’s Note: The statements, opinions and data contained in all publications are solely those of the individual author(s) and contributor(s) and not of MDPI and/or the editor(s). MDPI and/or the editor(s) disclaim responsibility for any injury to people or property resulting from any ideas, methods, instructions or products referred to in the content. |
© 2025 by the authors. Licensee MDPI, Basel, Switzerland. This article is an open access article distributed under the terms and conditions of the Creative Commons Attribution (CC BY) license (https://creativecommons.org/licenses/by/4.0/).