Article

Quantitative Assessment of Free and Adsorbed Shale Oil in Kerogen Pores Using Molecular Dynamics Simulations and Experiment Characterization

1
School of Geoscience and Technology, Southwest Petroleum University, Chengdu 610500, China
2
College of Energy, Chengdu University of Technology, Chengdu 610051, China
3
Petro China Southwest Oil & Gasfield Company, Chengdu 629000, China
4
Sinopec Petroleum Exploration and Production Research Institute, Beijing 100089, China
*
Author to whom correspondence should be addressed.
Energies 2025, 18(21), 5695; https://doi.org/10.3390/en18215695
Submission received: 21 July 2025 / Revised: 13 September 2025 / Accepted: 28 October 2025 / Published: 29 October 2025

Abstract

Understanding the microscopic occurrence states of shale oil—particularly the distribution between adsorbed and free phases—is essential for optimizing the development of unconventional reservoirs. In this study, we propose an integrated methodology that combines experimental techniques with molecular dynamics simulations to investigate shale oil behavior within kerogen nanopores. Specifically, pyrolysis–gas chromatography–mass spectrometry (PY-GC-MS), solid-state 13C nuclear magnetic resonance (13C NMR), Fourier transform infrared spectroscopy (FTIR), and X-ray photoelectron spectroscopy (XPS) were performed to construct a representative kerogen molecular model based on shale samples from the Lianggaoshan Formation in the Sichuan Basin. Grand Canonical Monte Carlo (GCMC) simulations and a theoretical occurrence model were applied to quantify the adsorption characteristics of n-dodecane under varying pore sizes, temperatures, and pressure. The results show that temperature exerts a stronger influence than pore diameter on adsorption capacity, with adsorption decreasing by over 50% at higher temperatures, and pressure has a limited effect on the adsorption amount of dodecane molecules. This study offers a robust workflow for evaluating shale oil occurrence states in complex pore systems and provides guidance for thermal stimulation strategies in tight oil reservoirs.

1. Introduction

Global oil and gas exploration and development have started to allow for stable production of conventional oil and gas and rapid development of unconventional oil and gas. Shale oil, as a key component of unconventional oil and gas, has become a focal point for future exploration and development [1,2,3,4]. In this study, the term “shale oil” refers to liquid hydrocarbons occurring naturally within low-permeability shale formations, rather than synthetic shale oil obtained by pyrolysis of oil shale. China possesses abundant and widely distributed shale oil resources, with estimates suggesting recoverable reserves of 4.32 × 10⁹ tons, accounting for 7% of the global total [5].
In China, the exploration and research of shale oil are primarily focused on the Luchagou Formation of the Junggar Basin, the Chang 7 Member of the Ordos Basin, the Qing Shankou Formation of the Songliao Basin, and the Kong 2 Member of the Bohai Bay Basin [6,7,8], with relatively less attention given to the shale oil in the Jurassic Lianggaoshan Formation of the Sichuan Basin. In 2021, Sinopec deployed the first shale oil exploration well—the TY 1 well—in the Lianggaoshan Formation, achieving a major breakthrough with a daily oil production of 9.8 m3 [9]. In recent years, among the 101 wells drilled in the Lianggaoshan Formation, industrial oil flow has been detected in 87, with recoverable reserves reaching 1.29 × 10⁶ tons, demonstrating significant exploration potential. During the deposition of the Lianggaoshan Formation, the lake basin center experienced multiple migrations, leading to the deposition of several organic-rich lacustrine shale layers. The shale reservoir of the Lianggaoshan Formation exhibits a typical “source-reservoir integrated” characteristic, with shale oil mainly occurring in the form of adsorbed or free oil in shale pores, and only a small fraction existing in dissolved form [10,11,12]. Dissolved shale oil, which is immiscible with organic matter, is almost non-movable and difficult to extract; however, adsorbed and free shale oil are movable and extractable, with free shale oil being the easiest to exploit [13]. Therefore, understanding the occurrence state of shale oil in pores and characterizing the contents of free and adsorbed oil is crucial for the efficient development of shale oil. However, evaluating shale oil occurrence states in the Lianggaoshan Formation is challenging due to geological factors such as the diverse mineral composition of rocks, strong reservoir heterogeneity, rapid lithofacies changes, and complex pore structures [14,15,16,17]. In addition to these complex geological conditions, the mobility of shale oil also controls its occurrence state [18]. Due to the high viscosity and large molecular size of shale oil, and because some shale oil is adsorbed onto organic matter or mineral surfaces, the flow behavior of shale oil remains unclear, making it more difficult to determine the quantities of free and adsorbed oil.
Unlike shale gas, shale oil is a complex mixture composed of hydrocarbons (saturated and aromatic hydrocarbons) and “NSO” compounds (resins, asphaltenes), with various interactions occurring between different oil molecules [19,20]. This makes it challenging to distinguish between adsorbed and free shale oil, as there is no clear boundary between the two states. As a result, it is difficult to experimentally determine shale oil adsorption and free oil content. Current methods for quantitatively evaluating shale oil occurrence states primarily involve solvent extraction and heating release methods [21,22,23]. Solvent extraction utilizes the polarity differences between adsorbed and free oil components to gradually extract and separate them using various organic solvent combinations. For instance, Qian et al. [24] used a weakly polar dichloromethane–methanol solvent combination to separate free, soluble organic matter, while a more polar tetrahydrofuran–acetone–methanol solvent combination was employed to extract non-hydrocarbon and asphaltene components adsorbed on mineral surfaces. Jiang et al. [21] measured S1-1, S1-2, S2-1, and S2-2 contents at temperatures of 200, 350, 450, and 600 °C, concluding that S1-1 and S1-2 represent non- or weakly polar free compounds, S2-1 mainly consists of heavy hydrocarbons and more polar resins and asphaltenes in adsorbed form, and S2-2 represents the pyrolysis products of kerogen. Both the solvent extraction and heating release methods assume that free shale oil resides in large pores and consists of small, weakly polar hydrocarbons or non-hydrocarbon compounds, while adsorbed shale oil occurs in small pores and is composed of large, strongly polar (NSO-containing) or non-hydrocarbon compounds. However, compounds of varying molecular weights and polarities can exist in both adsorbed and free states. During heating or extraction, both adsorbed and free shale oil are released, making it difficult to quantitatively evaluate the amounts of each state using only physical experiments [25,26,27,28].
In recent years, molecular dynamics simulations have been widely used in the study of shale oil occurrence states, providing a quantitative assessment of the adsorption and free oil content of single-component or mixed hydrocarbons in different types of pores (e.g., pore type, size, morphology, wettability) and under various environmental conditions (e.g., temperature and pressure) [29]. Molecular dynamics simulations rely on atomic interactions to simulate the microscopic dynamic and static states of systems under specified environmental conditions, and use statistical distributions of microscopic data to describe macroscopic thermodynamic phenomena [30,31,32,33]. Due to the challenges in reaching extreme conditions through physical experiments and the difficulty in conducting directional or qualitative experiments across different observation scales, molecular simulations have an advantage over experimental methods in explaining atomic- and molecular-level microscopic mechanisms [34,35]. Many scholars worldwide have applied molecular-level simulations to evaluate the occurrence states of fluids in micro-nanoscale porous media [36]. However, studies on shale oil occurrence states based on molecular dynamics simulations still face several challenges: (1) Previous studies have often used graphene to represent kerogen, but organic matter components and maturity levels vary significantly across different depositional environments, necessitating the construction of kerogen molecular models that accurately represent the organic matter in the study area. (2) Molecular dynamics simulations are performed at relatively small scales, making it difficult to macroscopically characterize the occurrence state of shale fluid in larger pore sizes [37,38]. Additionally, to accurately describe the occurrence state of shale oil in pores, scholars have attempted to construct theoretical models for calculating the contents of adsorbed and free shale oil using mathematical models [39,40,41]. However, key parameters such as pore size, specific surface area, and the density and thickness of adsorbed/free phases are difficult to obtain, resulting in lower accuracy for quantifying adsorbed and free oil contents.
To address these challenges, this study combines molecular dynamics simulations with an adsorption-free oil theoretical model to quantitatively characterize the occurrence state of shale oil under different pore sizes and temperatures. First, the methodology involves conducting rock physics experiments to characterize the microstructure of shale kerogen samples from the Lianggaoshan Formation in the Sichuan Basin, and constructing a realistic kerogen molecular model based on the experimental data; second, using molecular dynamics simulations to model the adsorption process of shale oil in the narrow slit pores of kerogen and calculating the thermodynamic data at equilibrium; and finally, determining the key parameters in the free-adsorbed oil theoretical model to quantitatively evaluate the shale oil content in different occurrence states within kerogen pores.

2. Materials and Methods

2.1. Sample and Experimental Methods

The experimental core samples were sourced from the Lianggaoshan Formation shale in the Sichuan Basin (Figure 1). The TOC content is generally greater than 1.5%, with the organic matter classified as a mixed type. The organic maturity, indicated by Ro, exceeds 1.2%, placing it within the mature to highly mature stage. The shale’s ability to adsorb hydrocarbon fluids follows the sequence organic matter > clay minerals > inorganic minerals, with kerogen being the core component of organic matter [42,43]. Thus, this study focuses on the occurrence state of shale oil within kerogen pores. Different organic matter types, compositions, and maturities significantly affect the chemical structure of kerogen [10,44], making it essential to construct a molecular model to represent the kerogen in the Lianggaoshan Formation.
Kerogen was isolated from shale core samples via standard acid demineralization. Samples were dried (40–60 °C), ground (<150 μm), and sequentially treated with 10–15% HCl (12–24 h) to remove carbonates and 10–20% HF (48–72 h) to dissolve silicates and clays. After thorough rinsing to neutrality, the organic residue was vacuum-dried (40–60 °C), filtered, and stored in airtight, light-protected containers at low temperature for subsequent analyses (PY-GC-MS, 13C NMR, FTIR, XPS).

2.1.1. Pyrolysis-GC-MS

PY-GC-MS is a widely used analytical technique for the qualitative and quantitative identification of small molecular fragments generated during the thermal decomposition of organic matter. In this study, the pyrolysis furnace model EGA/PY-3030D was employed, with the furnace temperature set to 600 °C. The gas chromatography–mass spectrometry analysis was conducted using an SQ8 GC-MS system, with the following parameters: the injection port, transfer line, and ion source temperatures were all maintained at 250 °C; the mass spectrometer scanning range was set between 50 and 450 Da; and the chromatographic column specifications were 30.0 m × 250 μm × 0.25 μm. Since the sample was insoluble in solvents, the solvent delay time was set to zero.

2.1.2. Solid-State 13C NMR

Solid-state nuclear magnetic resonance (NMR) carbon spectroscopy provides critical insights into the carbon skeletal structure of kerogen. The analysis was conducted using a Bruker AV II-600 MHz NMR spectrometer, operating at a magnetic field strength of 14.1 Tesla. A broadband probe in phase-positive mode was utilized for detection. The spectra were acquired using the cross-polarization magic angle spinning (CP-MAS) technique, with a recycle delay time of 4 s and a contact time of 2 milliseconds during the cross-polarization process.

2.1.3. FTIR

Fourier transform infrared spectroscopy (FTIR) was employed to characterize the functional groups present in kerogen. The analysis was conducted using a Nicolet iS50 FTIR spectrometer. During testing, kerogen powder was mixed with dried KBr powder, and the attenuated total reflection (ATR) mode was selected. The sample was scanned 16 times with a spectral resolution of 4 cm−1.

2.1.4. XPS

X-ray photoelectron spectroscopy (XPS) was utilized to characterize the elemental composition and chemical states on the surface of kerogen molecules. The analysis was conducted using an AXIS Ultra DLD spectrometer. The energy scale was calibrated by referencing the C1s peak to 284.8 eV. The kerogen samples from the study area were scanned to obtain XPS spectra for C1s, O1s, N1s, S2p, and F1s, providing detailed insights into the surface chemistry of the kerogen.

2.2. Molecular Simulation Methods

2.2.1. Construction of Kerogen Molecular Structure

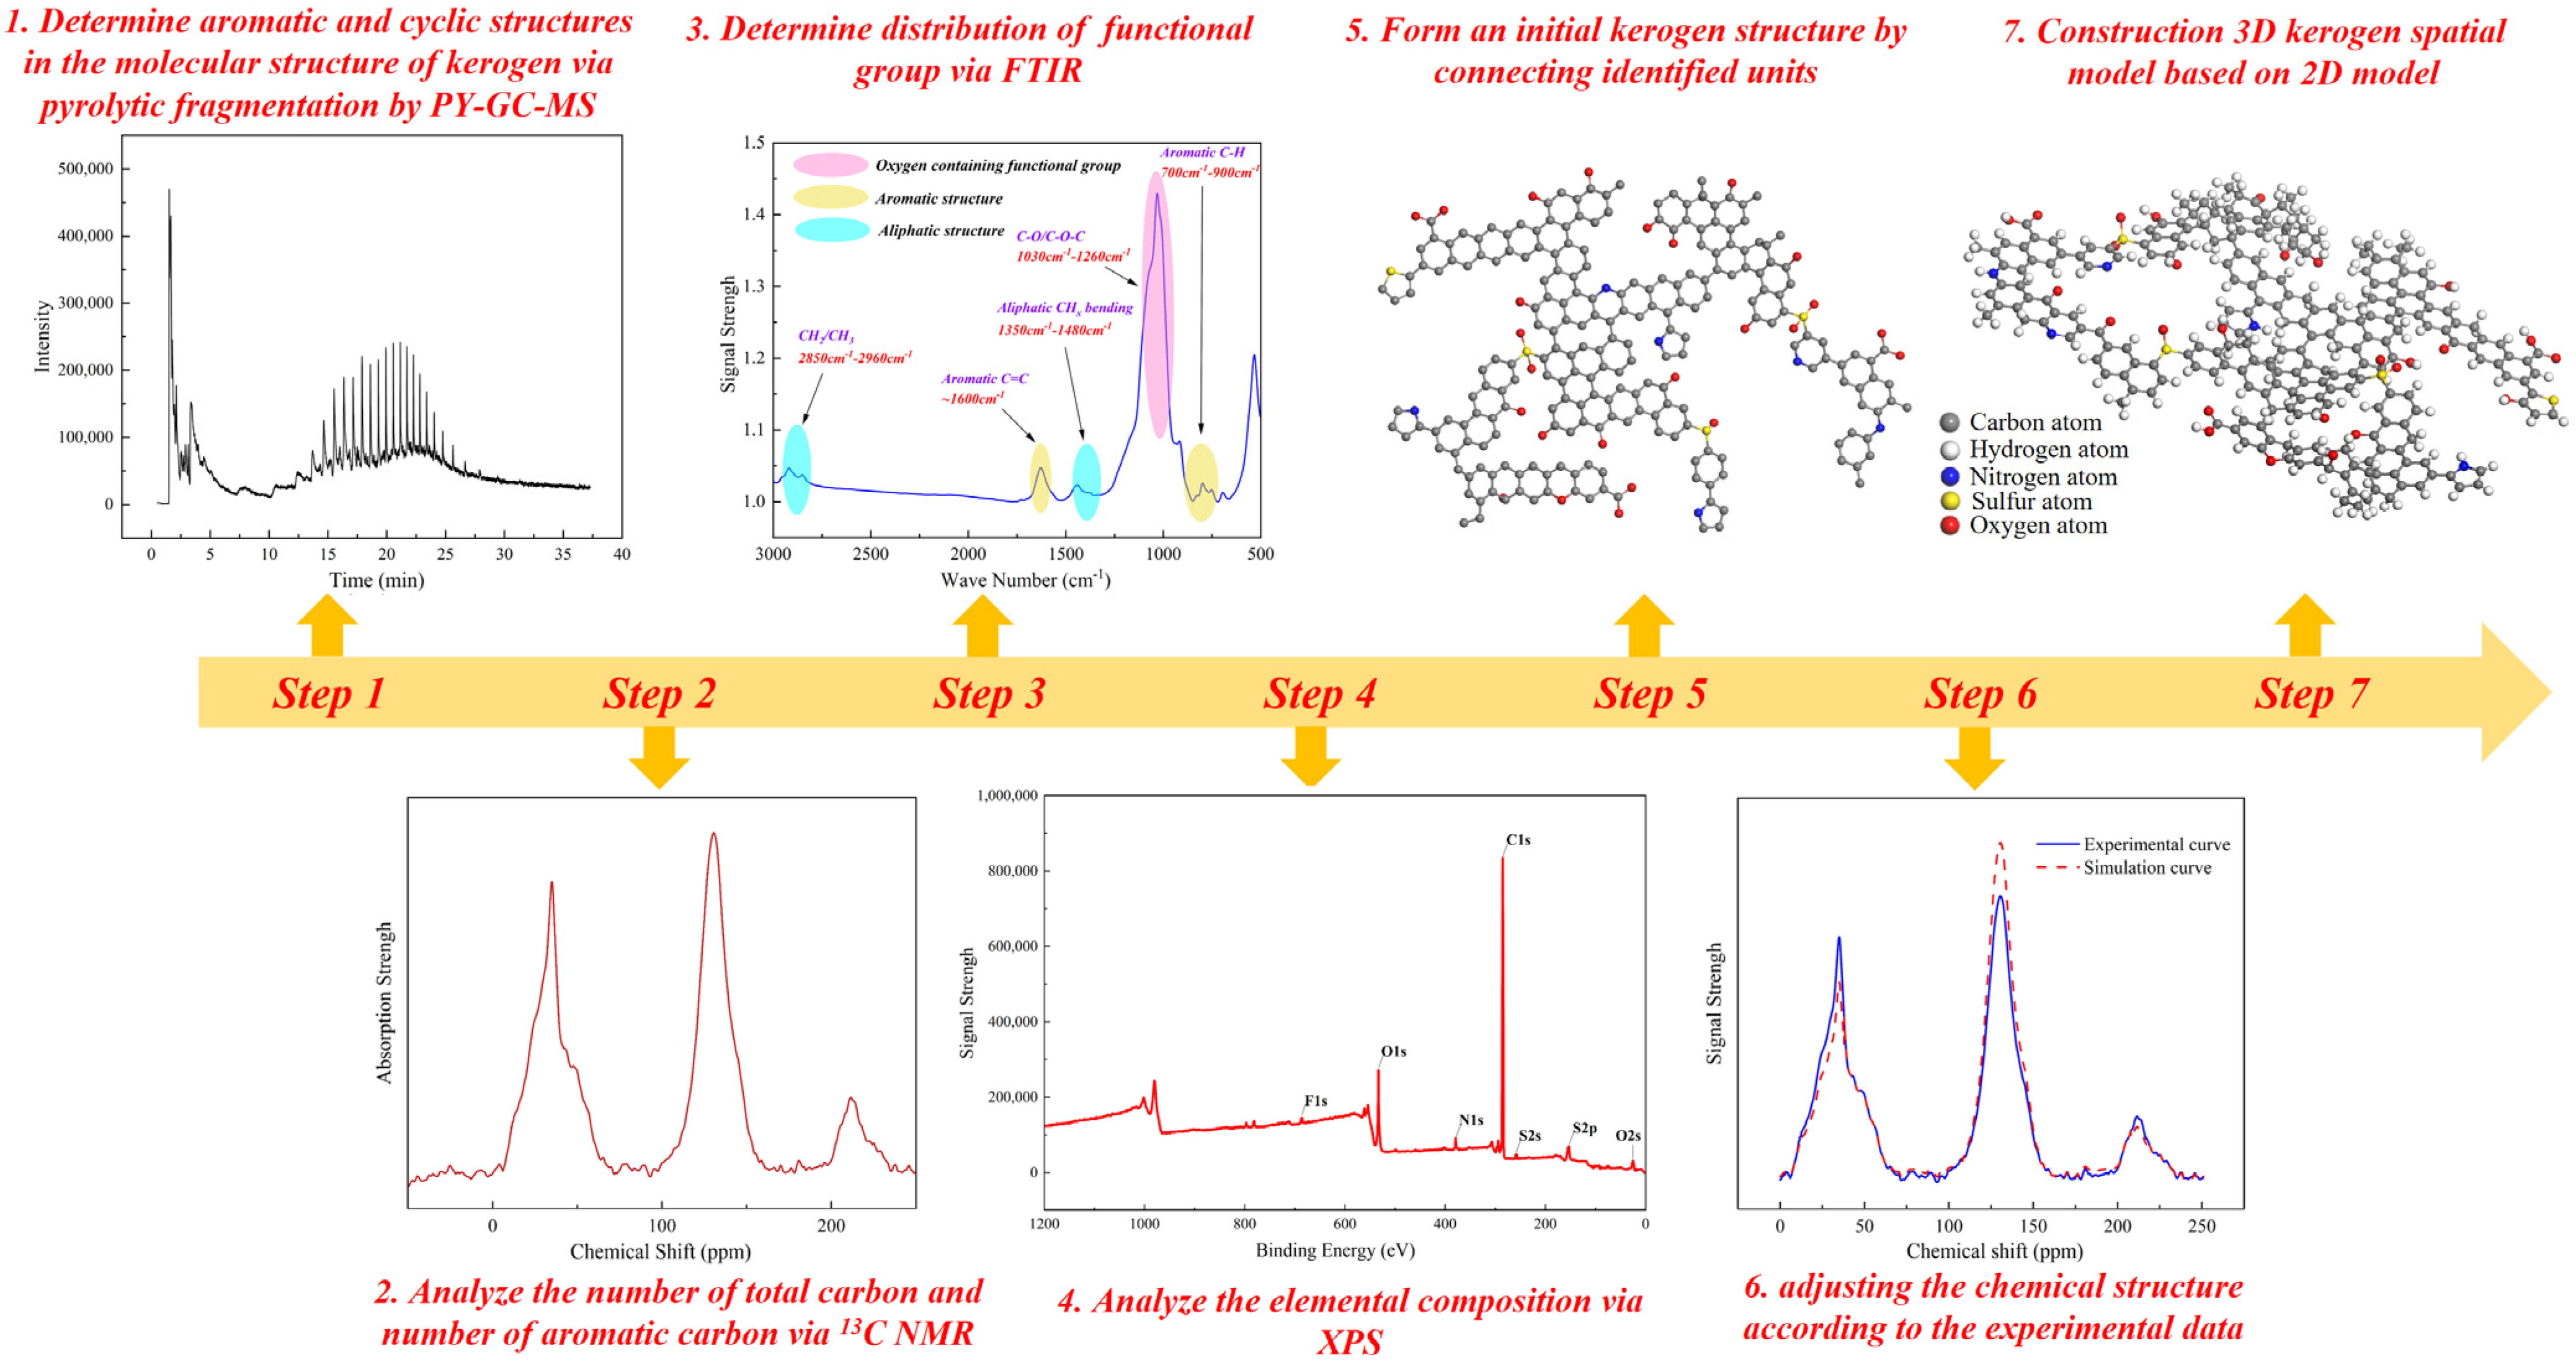
The construction of the kerogen chemical structure was primarily based on the analysis of experimental data from PY-GC-MS, 13C NMR, FTIR, and XPS. The specific steps are as follows [45,46,47]:
(1)
Determining the aromatic and cyclic structures within the kerogen molecular framework based on pyrolysis fragment analysis from PY-GC-MS.
(2)
Extracting molecular skeletal parameters from 13C NMR data, including protonated aromatic carbon (faH), esterification degree (far), aromaticity (fal), aromatic substitution degree (δ), and branched aromatic carbon (farC).
(3)
Identifying the distribution of characteristic functional groups through FTIR analysis.
(4)
Analyzing the occurrence states of O, N, S, and F elements using XPS data.
(5)
Connecting the identified molecular units to construct an initial kerogen structure.
(6)
Refining the chemical structure to match experimental observations, yielding a final two-dimensional kerogen model.
(7)
Constructing the three-dimensional spatial kerogen structure based on the established two-dimensional chemical and physical framework (Figure 2).

2.2.2. Construction of Kerogen Slit Structure

In this study, the kerogen slit nanopores were constructed using the Materials Studio 24.1 software [48]. First, the Amorphous Cell module was utilized to generate the kerogen matrix, then the Cleave Surface method was applied to extract the surface of the kerogen matrix, and finally the Build Layers approach was used to stack two kerogen matrix layers, forming a framework of kerogen slit nanopores. Each kerogen matrix comprised ten kerogen units derived from the previously established molecular model. The simulation box had a periodic boundary condition in all directions, with x and y dimensions set to 9.5 nm. The pore width, defined as the distance between the upper and lower kerogen matrix layers, ranged from 2 nm to 10 nm with a 2 nm interval for analysis. To optimize the nanopore structure, the Geometric Optimization module was employed, followed by annealing using the Anneal algorithm. Each model underwent 20 annealing cycles, with each cycle consisting of 10 heating and 10 cooling steps. The temperature was ramped from 300 to 800 K and then reduced back to 300 K. The total simulated annealing time was 1500 ps, with a 1 fs time step.

2.2.3. GCMC Simulation

Shale oil is a complex mixture, and based on the composition analysis of crude oil from the Lianggaoshan Formation, n-dodecane is identified as one of the primary components of shale oil in the study area. The use of n-dodecane as a single-component surrogate is supported by its prevalence among medium-chain alkanes (C12–C16), which are dominant in the studied formation. Although shale oil comprises a wide variety of hydrocarbons, prior studies have successfully employed n-dodecane to simulate adsorption and diffusion behavior of shale oil components due to its representative molecular size, chain flexibility, and computational tractability [49,50]. This simplification is widely accepted for enabling molecular-level insights with feasible resource costs. Therefore, n-dodecane was chosen to represent shale oil, and adsorption simulations of n-dodecane in kerogen pores were conducted using LAMMPS 2023 software [51]. The simulation process adopted the Grand Canonical Monte Carlo (GCMC) method and the OPLS all-atom force field, which has been widely used to calculate the structure and dynamics of organic, biological, and main group inorganic molecules. This force field has also been validated in prior studies involving kerogen-like macromolecules containing heteroatoms such as oxygen, nitrogen, and sulfur. It reliably captures non-bonded interactions (van der Waals and electrostatic) relevant to adsorption phenomena in organic-rich shale systems [52]. Non-bonded interactions between molecules were described using van der Waals forces and electrostatic potential, with the Lennard-Jones (LJ) 9-6 potential used to model van der Waals interactions, and the Coulomb formula applied to calculate electrostatic interactions. For short-range pairwise interactions, the simulation accuracy typically increases with the cutoff distance. However, the cutoff distance cannot exceed half the minimum size of the simulation box. Therefore, a cutoff distance of 15 Å was set to calculate the short-range LJ interactions. The chemical potential in the GCMC simulations was set to correspond to standard atmospheric pressure for all temperatures. This allowed us to isolate the effects of pore size and temperature without introducing additional pressure variables. The system was first equilibrated under the NVT ensemble for 200 ps at 298 K to stabilize temperature distribution, followed by NPT equilibration at 1 atm for 500 ps to ensure pressure convergence and realistic packing. Production simulations were conducted in the NVT ensemble, with trajectory data collected after reaching thermal equilibrium.

2.3. Theoretical Model of Adsorbed and Free Oil

Previous studies have shown that the microscopic occurrence state of shale oil is influenced by multiple factors, including pore characteristics (such as pore diameter, morphology, and surface properties), temperature, pressure, and hydrocarbon type. Shale oil is adsorbed in multiple layers on the shale pore surfaces and is distributed in a free state at the center of the pores. From the pore surface to the center, the density of the shale oil adsorption layers gradually decreases, and its mobility increases [53,54,55]. These assumptions form the basis for the development of the shale oil adsorption-free theory model. Under certain temperature and relative pressure conditions, the adsorbed hydrocarbons in the pore system (including pores, throats, and micro-fractures) are simplified as rigid, ellipsoidal long molecules, which are stacked parallel on the pore surface. The heterogeneous differences in the pore surface will affect the number of hydrocarbon adsorption layers at different positions, causing the thickness of the adsorbed hydrocarbons to vary across the surface (Figure 3a). Free-state hydrocarbons, on the other hand, are randomly distributed in the center of the pores. Assuming the hydrocarbon molecule length is d0, the shale pore system is theoretically divided into three regions based on the occurrence state of hydrocarbons in pores of different scales: zones A (d0 < dh), where the pore diameter (d0) is smaller than the hydrocarbon molecule diameter (dh), and hydrocarbons cannot aggregate within the pores, making them effectively non-contributing; Region B (dhd1da), where the pore is completely filled with adsorbed hydrocarbons; and Region C (da < d2dmax), where both adsorbed and free-state hydrocarbons coexist within the pores (Figure 3b):
Q a = k d m ( V 1 + S 2 h n ) ρ 1
Q f = ( V 2 k d m S 2 h n ) ρ 2
where Qa represents the adsorbed quantity (g/g), Qf the free quantity (g/g), and k a coefficient (nm−1) reflecting hydrocarbon–rock interactions and pore structure. Theoretically, k is given by λ/Fhn, where λ is the volumetric ratio of adsorbed hydrocarbons to pores (dimensionless), F is the pore shape factor (dimensionless), n is the average number of adsorption layers (dimensionless), and h is the average adsorption thickness (nm). Meanwhile, dm denotes the average pore diameter (nm); S2 is the specific surface area of pores within the range da pore diameter ≤ dmax (m2/g); ρ1 and ρ2 represent the densities of the adsorbed and free phases (g/cm3), respectively; and V1 and V2 denote the total amount of adsorbed hydrocarbons in zones B and C, respectively. The parameter V1 is akin to hydrocarbons absorbed or dissolved within the kerogen structure (i.e., the absorbed state hydrocarbons), which are effectively immobile due to confinement in small pores. Given the relatively low V1 value in lacustrine shale, it can be considered negligible. Consequently, in Equation (1), S2St, and in Equation (2), V2Vt, where Vt and St represent the total pore volume and total specific surface area of oil-bearing pores, respectively.
Thus, the equations can be rewritten as
Q a = k d m S t h n ρ 1
Q f = ( V t k d m S t h n ) ρ 2
where St represents the total specific surface area of oil-bearing pores (m2/g) and Vt is the total volume of oil-bearing pores (cm3/g).
This model primarily applies to cases where shale oil exists in both adsorbed and free states within shale pores. Based on this framework, the model can be further extended to other forms. First, considering the intrinsic relationship between pore volume, specific surface area, and average pore diameter in oil-bearing shale:
F 1 V t = S t d m
where F1 is a coefficient reflecting pore shape, with values of 6000, 4000, and 2000 for spherical, cylindrical, and parallel-plate pores, respectively.
By defining H = hn, Equations (3) and (4) can be transformed into
Q a = k F 1 V t H ρ 1
Q f = ( V 2 k F 1 H ) V t ρ 2
Thus, the mass fraction of adsorbed oil relative to the total oil content (Ra) is given by
R a = 1 1 + ρ 2 ρ 1 ( 1 k F 1 H 1 )
Since the sum of the mass or volume ratios of adsorbed and free oil equals 1, the contents of adsorbed and free oil can be computed as follows:
Q a = Q t R a
Q f = Q t ( 1 R a )
If all parameters in Equations (6)–(8) can be determined, the contents of adsorbed and free shale oil can be directly calculated. However, parameters such as average pore diameter (dm), adsorption layer number (h), adsorption thickness (n), adsorbed phase density (ρ1), and free phase density (ρ2) are challenging to obtain through direct experimental measurements. Instead, molecular dynamics adsorption simulations, coupled with thermodynamic data analysis at equilibrium, can be employed to derive these parameters. Specifically, the wall-normal mass-density profile is obtained by binning (Δx). The adsorbed-phase density ρ1(T, R) is computed as the average of ρm(x) over the first adsorption layer adjacent to each wall; the free-phase density ρ2(T, R) is taken from the center plateau ρcenter(T, R); and the adsorption-layer thickness h(T, R) is defined as the total thickness where ρm(x) ≥ 0.95 ρ2(T, R) near each wall, delimited by local minima of ρm(x).
For a slit pore of half-width R (two walls), the mass per unit area is
M = ρ 1 ( 2 H ) + ρ 2 ( 2 R 2 H )
R a ( T , R ) = ρ 1 ( H ) ρ 1 ( H ) + ρ 2 ( R H )
The MD-derived quantities ρ1, ρ2 and H are substituted directly into Equations (3), (4) and (8) to predict Ra(T, R) and related observables.

3. Results and Discussions

3.1. Characterization of Kerogen Chemical Structure

3.1.1. PY-GC-MS Data Analysis

By analyzing the total ion chromatograms (TIC) of kerogen samples obtained from PY-GC-MS, the distribution characteristics of kerogen pyrolysis products can be determined. The relative contents of the identified compounds are quantified using the area normalization method.
Experimental results reveal that the pyrolysis products of kerogen samples primarily consist of hydrocarbons, nitrogen-containing heteroatomic compounds, aromatic compounds with benzene ring structures, and oxygen-containing alcohols. Among these, aromatic compounds, n-alkanes, and heteroatomic compounds dominate the total pyrolysis product composition. Cyclic hydrocarbons and aromatic hydrocarbons exhibit the highest abundance, followed by chain hydrocarbons. The presence of predominantly n-alkanes among aliphatic compounds indicates a relatively high maturity of the kerogen. Additionally, the detection of cyclic hydrocarbons with varying degrees of saturation suggests a tendency toward aromatization during organic matter evolution. Furthermore, benzene and its derivatives, with varying degrees of branching were identified across all samples.

3.1.2. FTIR Data Analysis

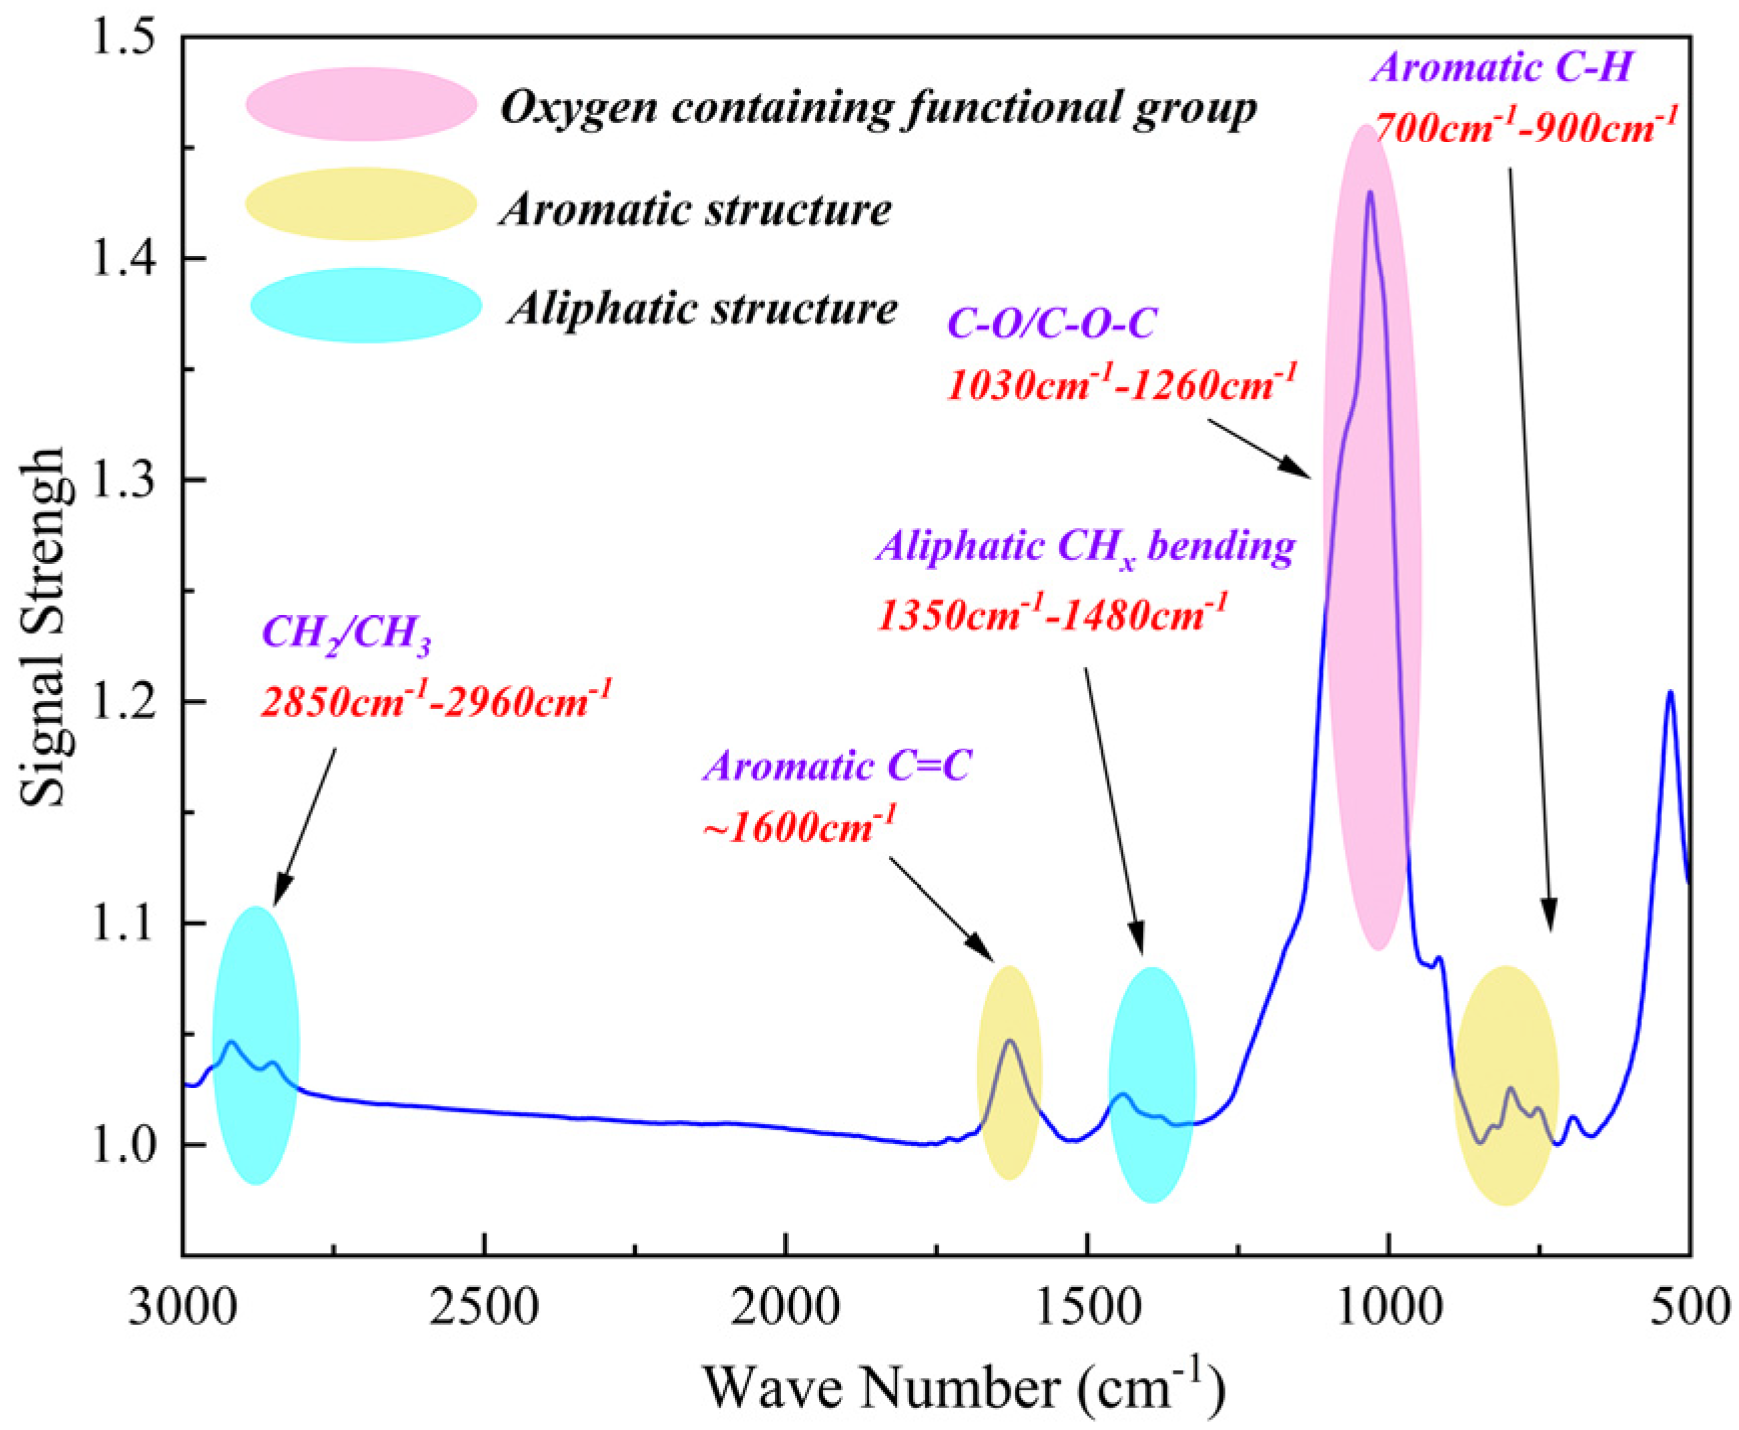
FTIR spectroscopy characterizes kerogen functional groups based on distinct absorption peaks in the spectrum. Figure 4 presents the Fourier transform infrared (FTIR) spectra of kerogen samples from the study area, along with the corresponding absorption peak positions. Notable peaks are observed in the ranges of 700–900 cm−1 and 1000–1800 cm−1 (Figure 4).
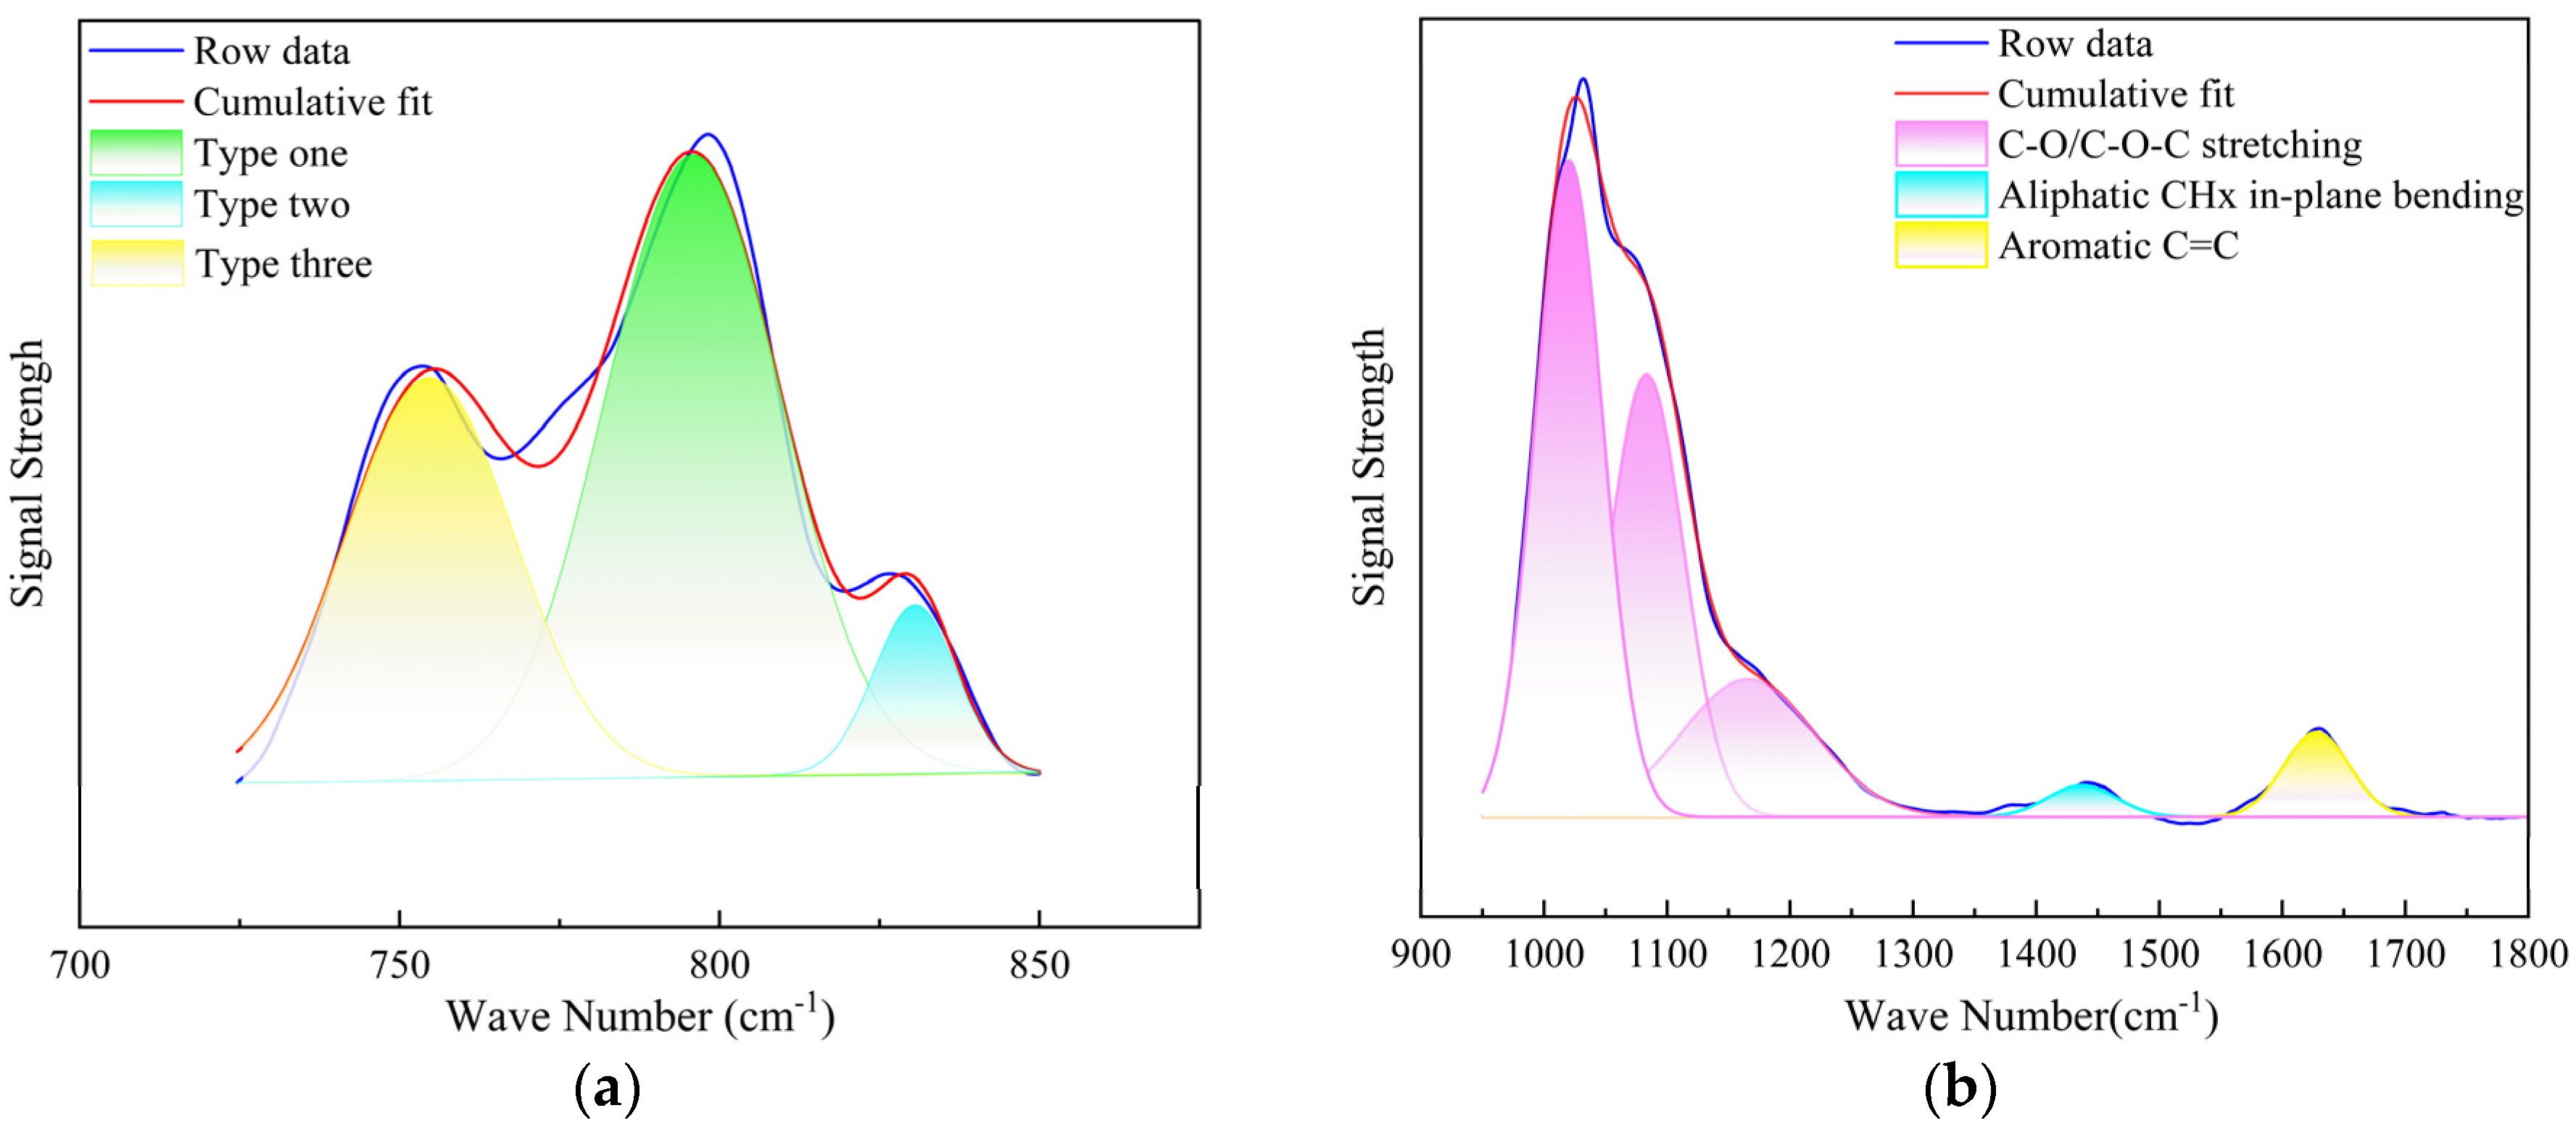
The 700–900 cm−1 region corresponds to aromatic C–H out-of-plane bending and is diagnostic of ring substitution patterns. Peak deconvolution of this window (Figure 5a) resolves three components centered near ~740, ~795, and ~835 cm−1, which we assign to para- (1,4-), meta- (1,3-), and ortho- (1,2-) substituted aromatic rings, respectively. The area fractions indicate that meta/ortho substitutions dominate in these samples.
Within 1000–1800 cm−1, the spectrum is dominated by C–O/C–O–C stretching at 1030–1260 cm−1 and aliphatic CHx bending at 1350–1480 cm−1, together with a prominent aromatic C=C skeletal band at ~1600 cm−1 (Figure 5b). This suggests that oxygenated functionalities are mainly ethers/phenolics rather than carbonyl groups at the investigated maturity level.

3.1.3. Solid-State 13C NMR Data Analysis

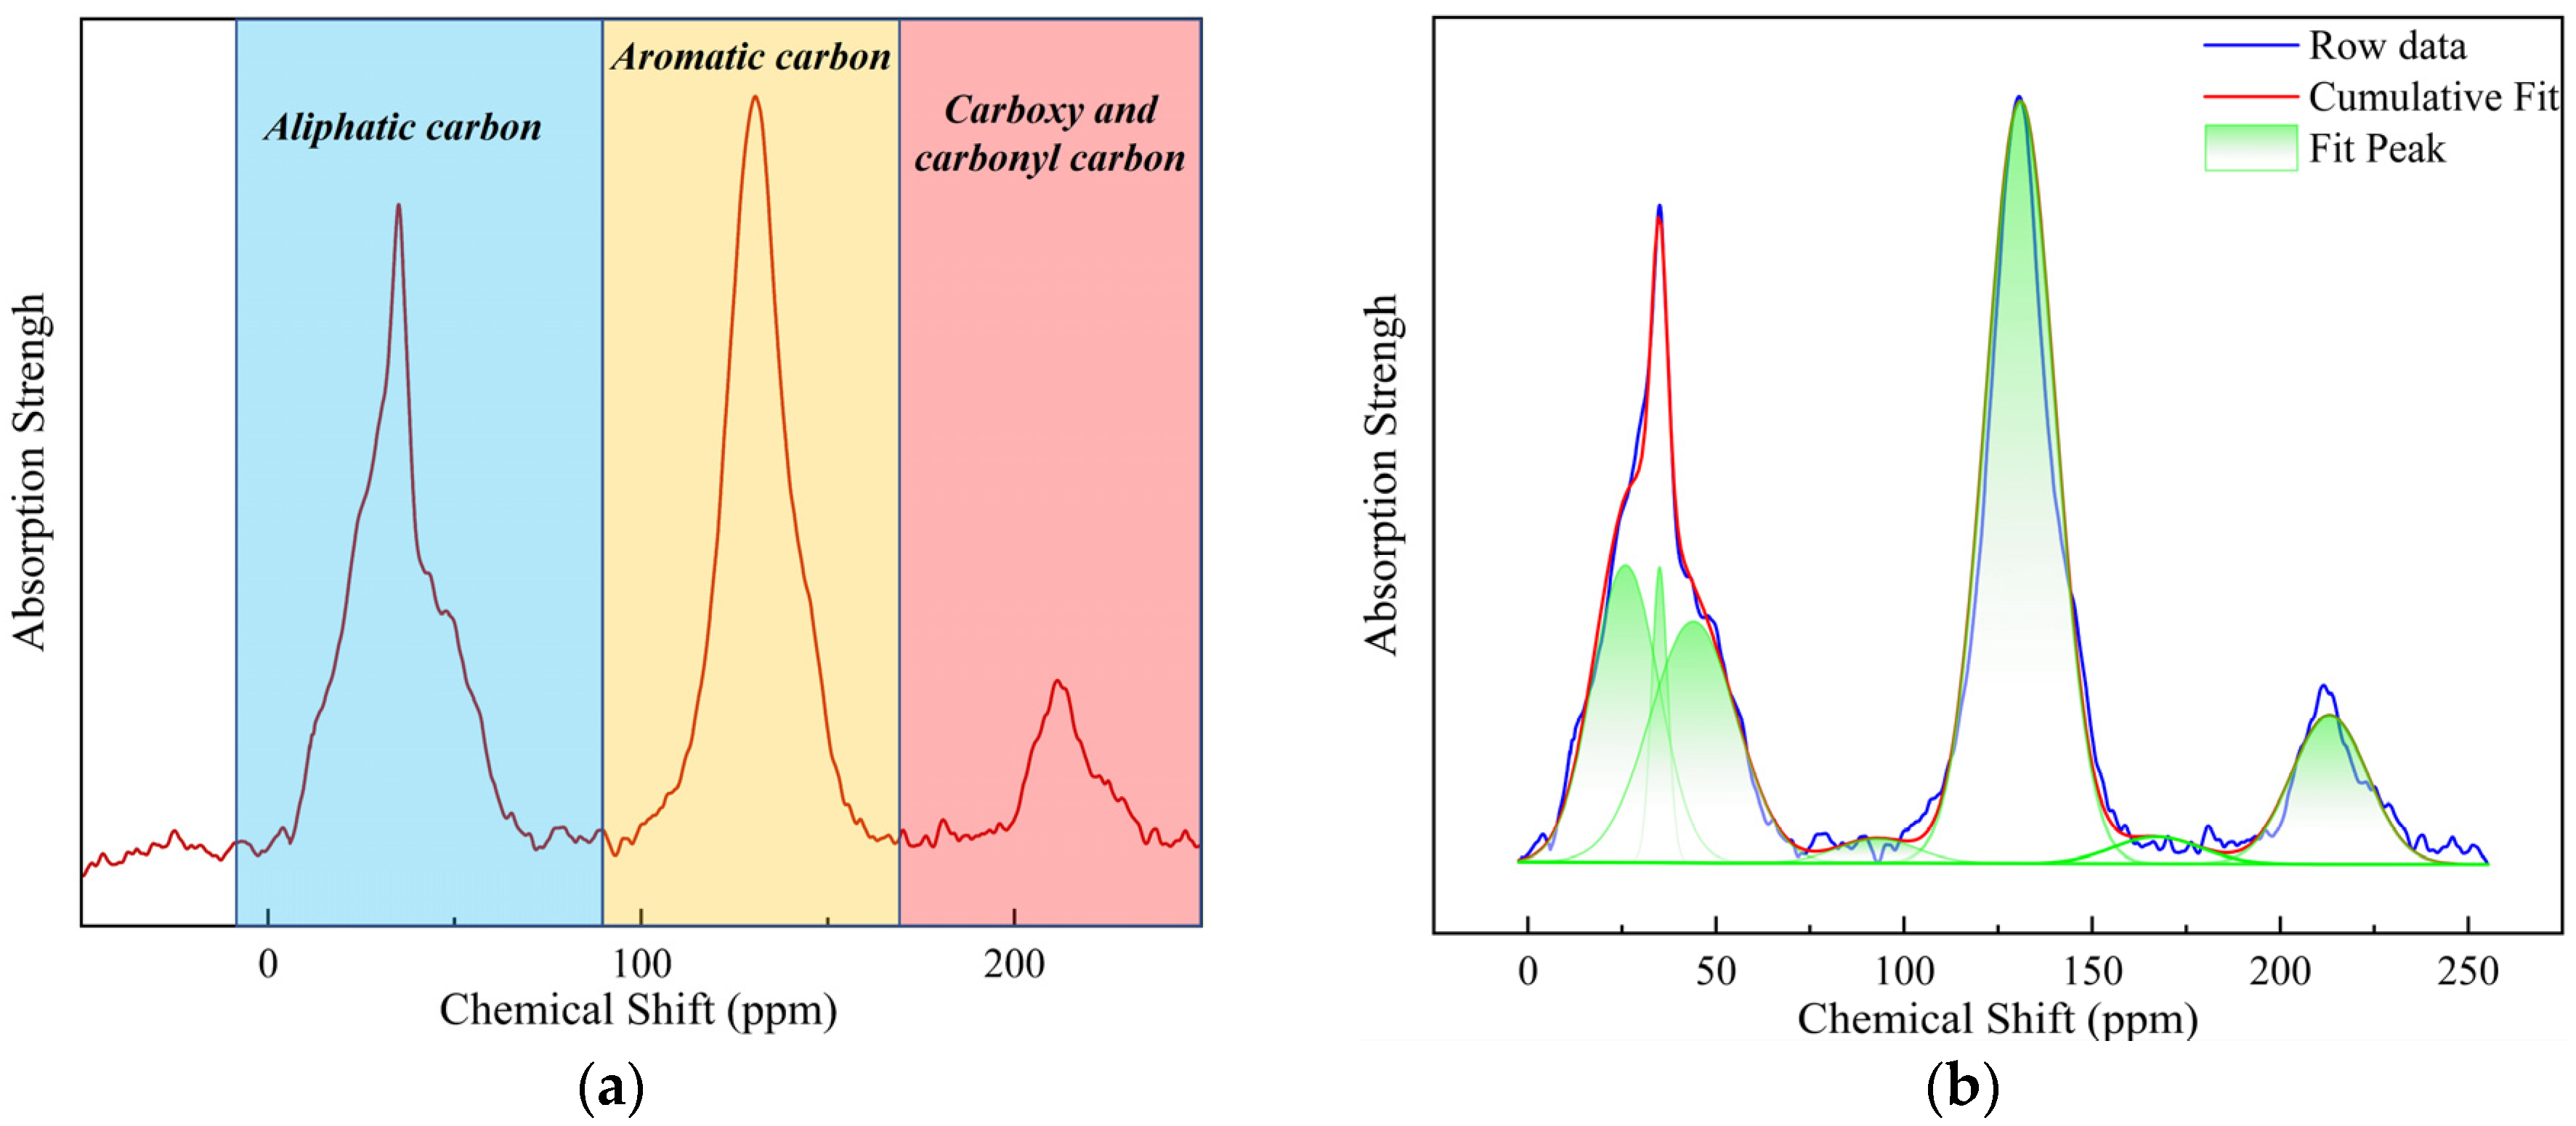
The solid-state nuclear magnetic resonance (NMR) spectrum of kerogen can be broadly categorized into three regions. The chemical shift range of 0–90 ppm corresponds to the aliphatic carbon region, comprising methyl, aromatic methyl, aliphatic C(2) carbon, methylene, methine, and quaternary sp3 carbon. The 90–165 ppm range represents the aromatic carbon region, which includes oxygenated methylene, oxygenated methine, protonated aromatic carbon, inter-ring bridged aromatic acids, side-chain aromatic carbon, and oxygenated aromatic carbon. The 165–220 ppm range corresponds to the carboxyl and carbonyl carbon region.
Figure 6a presents the 13C NMR spectrum of the Lianggaoshan Formation kerogen. The spectrum reveals that the peak intensity of aromatic carbon is significantly higher than that of other carbon types, indicating that aromatic carbon constitutes the primary structural component of the kerogen.
By performing peak deconvolution on the NMR carbon spectrum of the kerogen samples (Figure 6b), the relative percentage content of various carbon functional groups within the kerogen can be determined (Table 1). Using structural parameter formulas, key skeletal parameters of the kerogen were obtained (Table 2). The data in the table indicate that the aromaticity of the kerogen exceeds 60%, further confirming that aromatic carbon is the predominant structural component of the Lianggaoshan Formation kerogen.

3.1.4. XPS Data Analysis

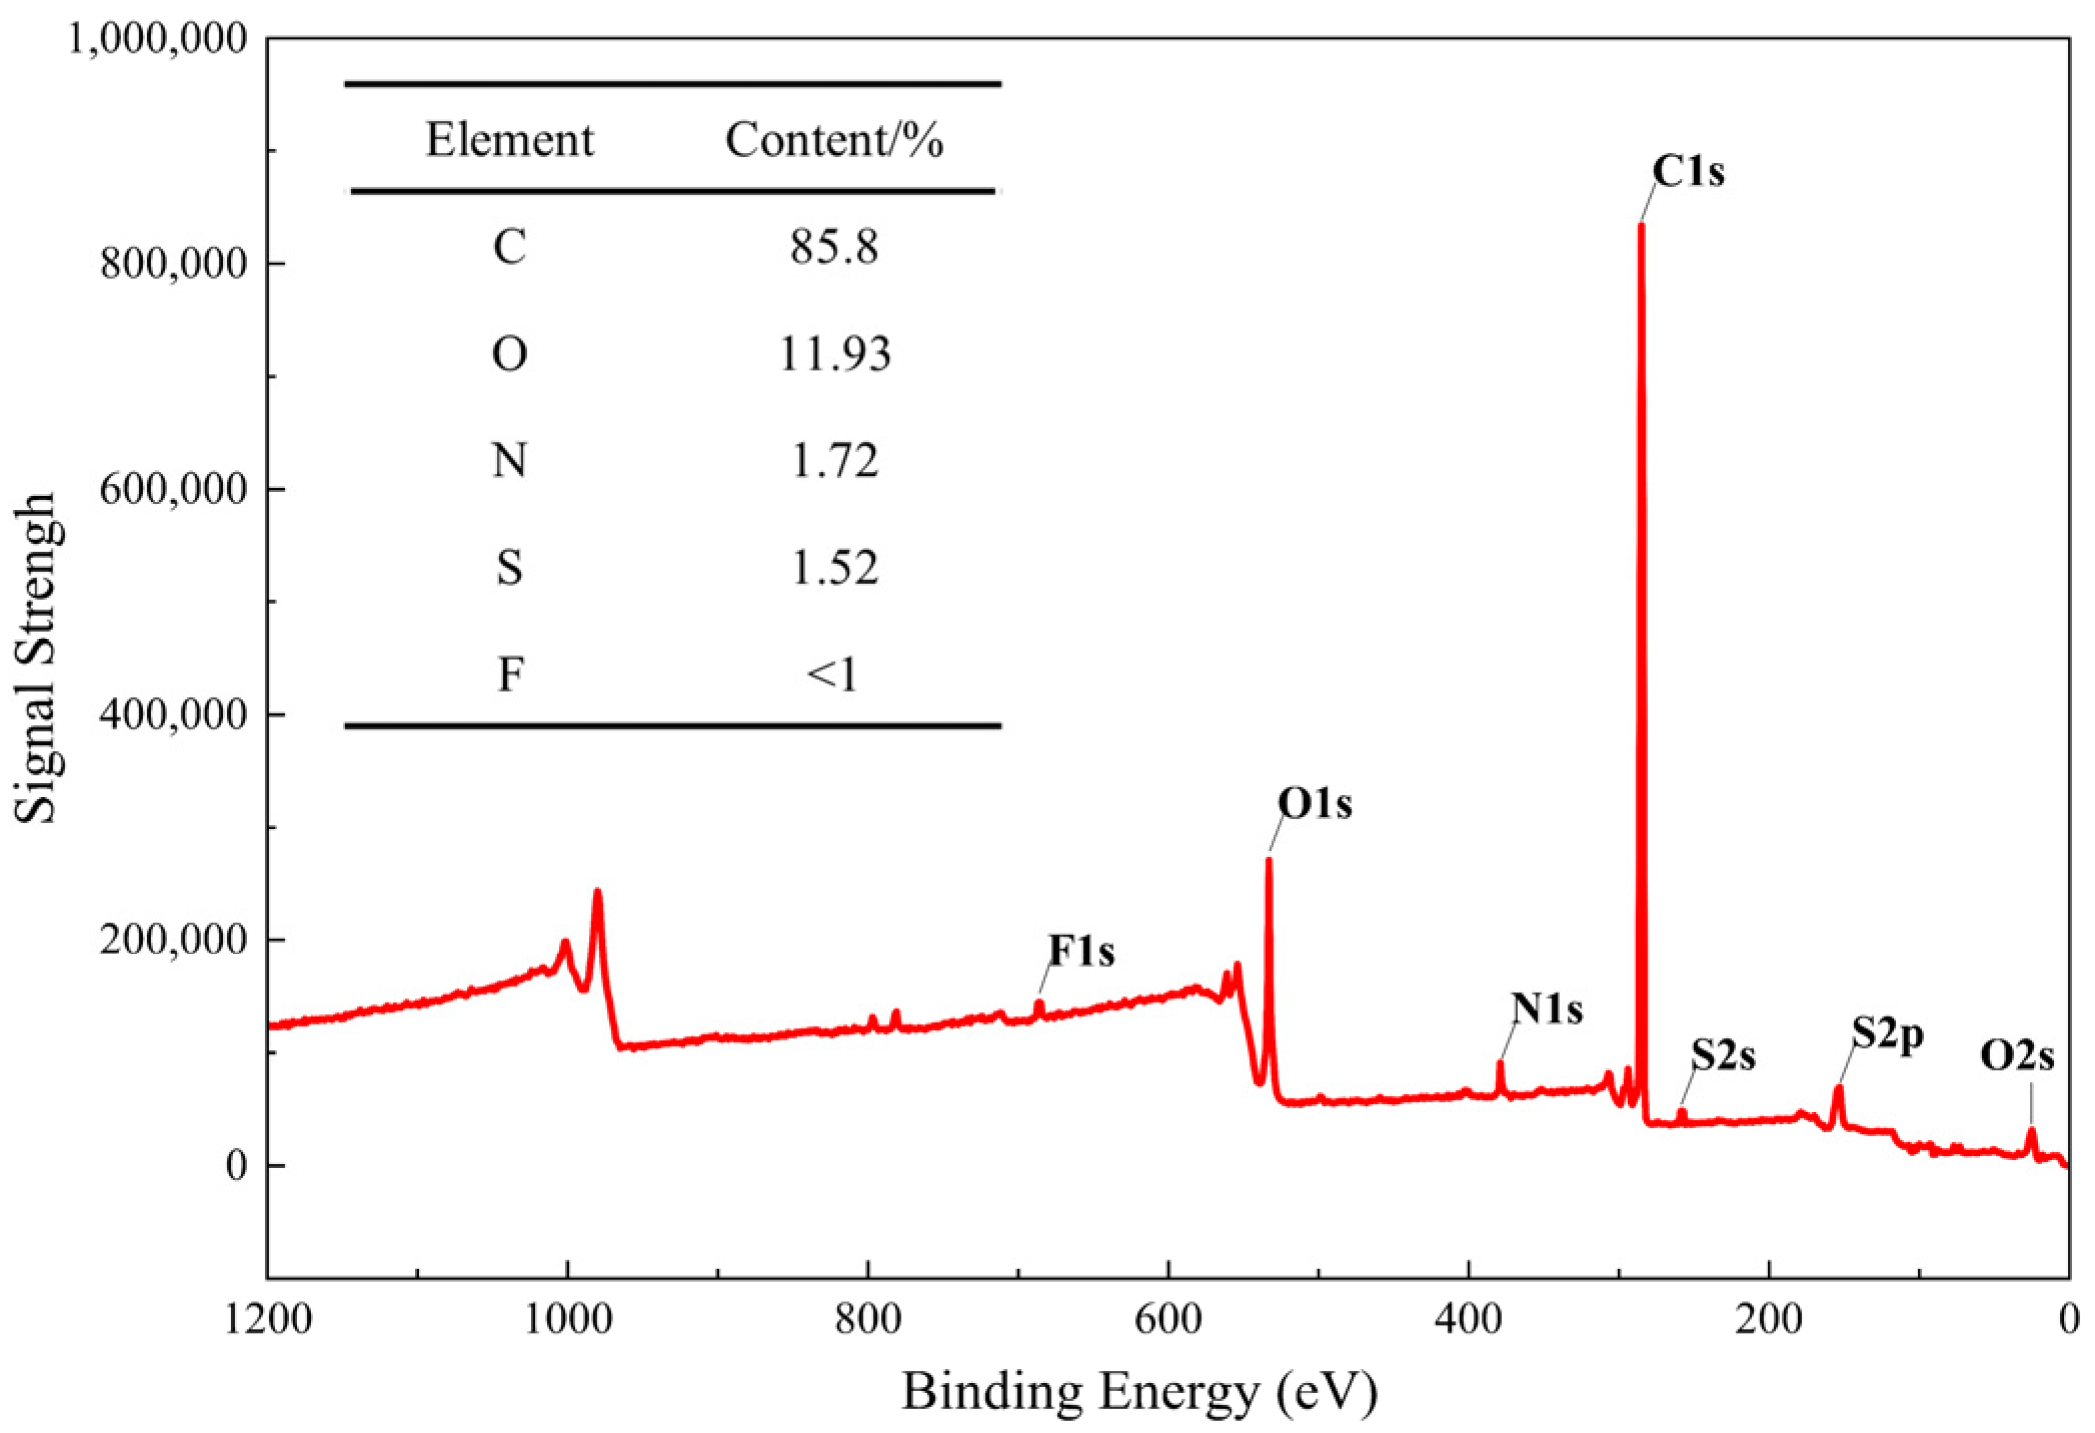
XPS analysis provides elemental composition information on carbon, oxygen, nitrogen, and sulfur functional groups present on the surface of kerogen, while also determining the relative abundance of different atomic species (Figure 7).
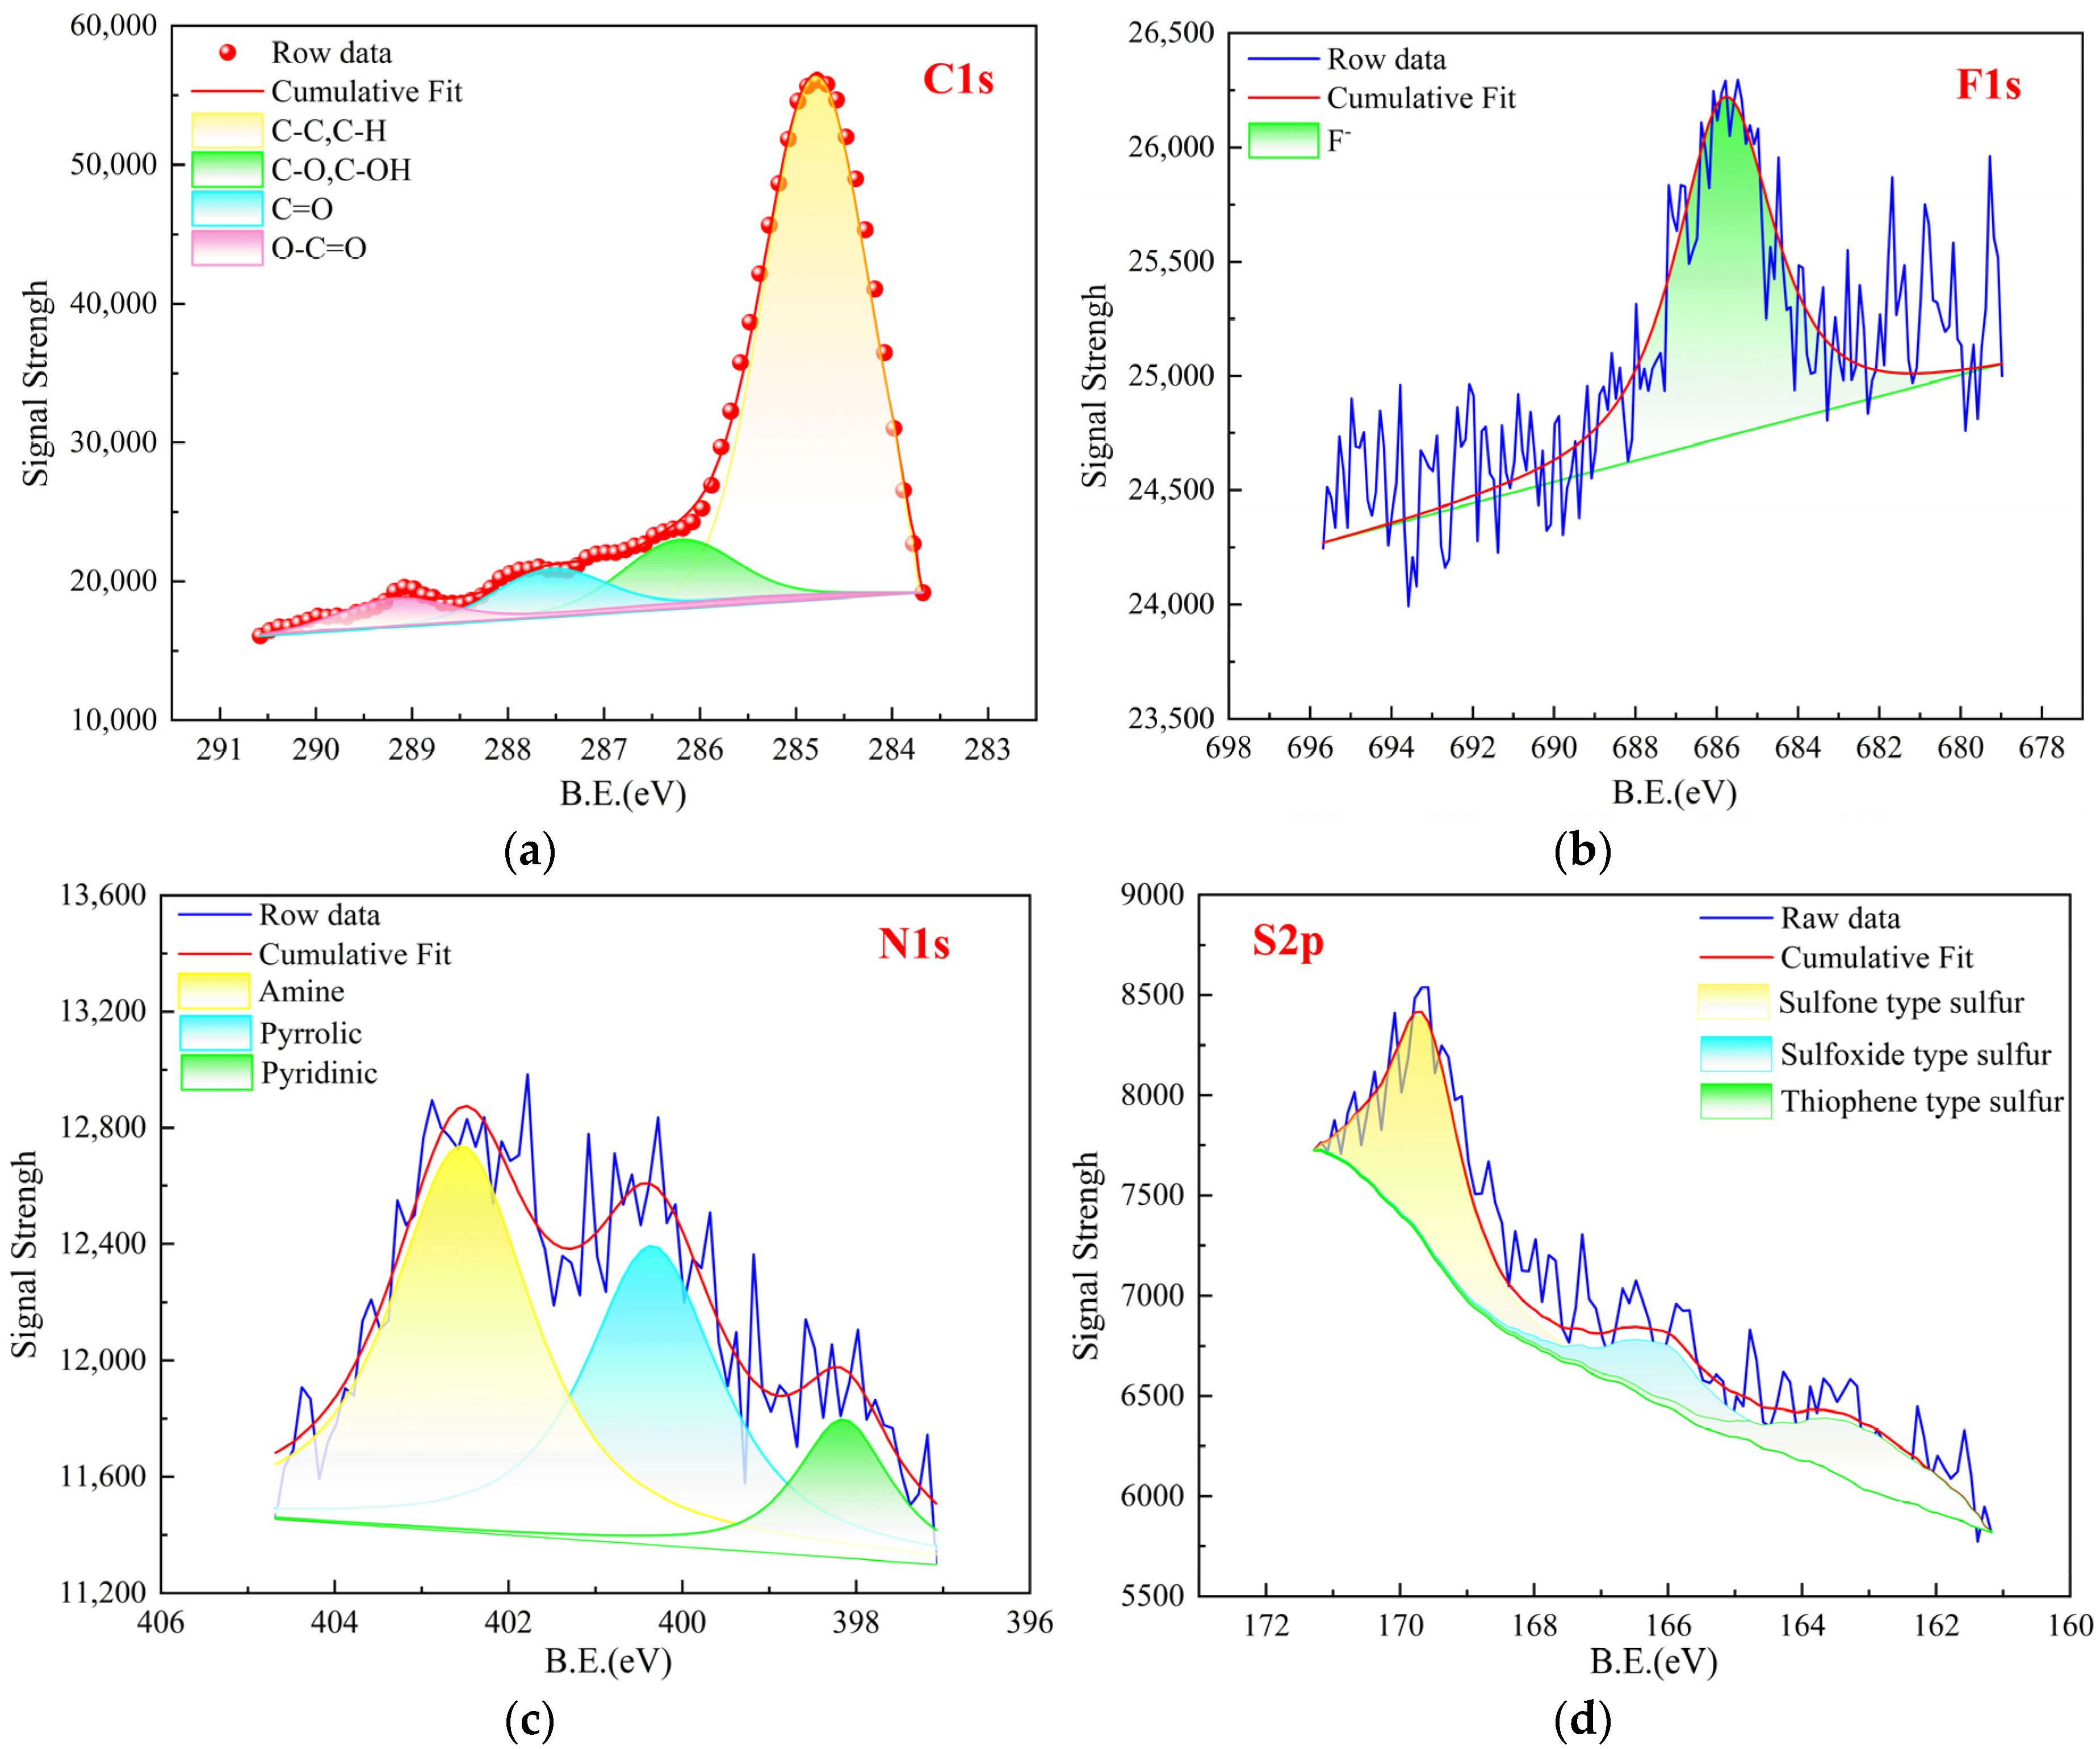
To elucidate the forms of carbon in kerogen, the C1s signal curve from the X-ray photoelectron spectroscopy (XPS) analysis was subjected to peak fitting (Figure 8a). The oxygen-containing functional groups were quantified by deconvoluting the C1s signal, which characterizes the bonding states between oxygen and carbon atoms. Similarly, to determine the presence of fluorine, the F1s signal curve was fitted (Figure 8b). The F1s peak appears as a single peak around 684.3 eV, indicating that fluorine in kerogen exists predominantly in the form of fluoride ions. This suggests that fluorine originates from residuals of acid treatment and does not affect the analytical results. To identify the nitrogen species in kerogen, the N1s signal curve was deconvoluted (Figure 8c). The nitrogen in the kerogen exists primarily in the forms of pyridine, pyrrole, amine, and nitrogen oxides, with pyrrole being the most dominant. Similarly, to clarify the sulfur speciation, the S2p signal curve was fitted (Figure 8d). The sulfur species in the kerogen samples include thiophenic sulfur, sulfoxide sulfur, and sulfone sulfur.

3.2. Molecular Modeling of Kerogen Structure

3.2.1. Molecular Structure of Kerogen Unit and Validation

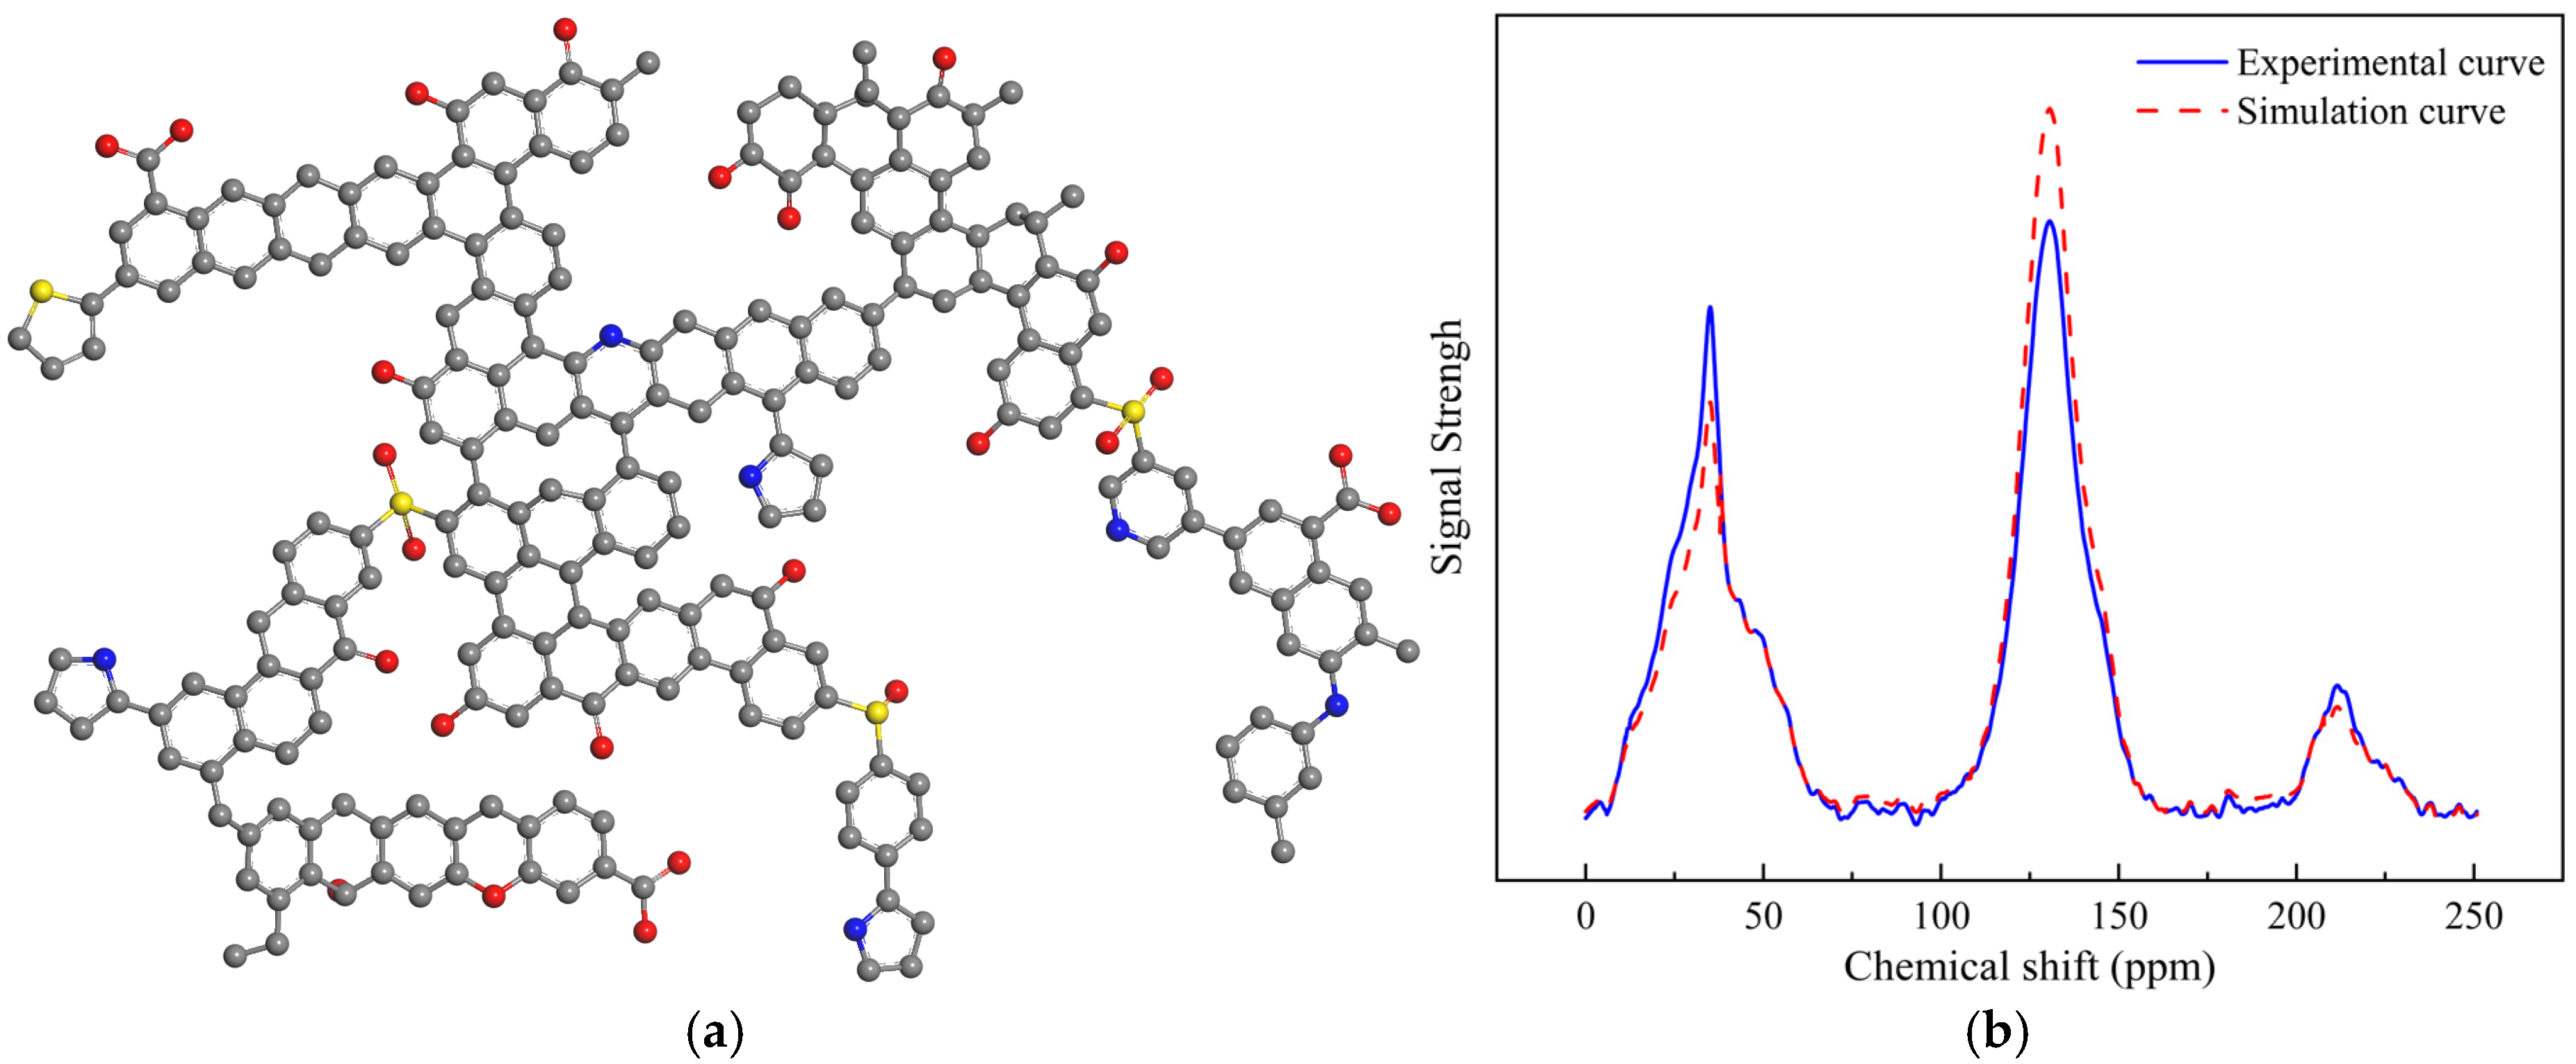
The resulting kerogen model captures the key chemical features of the Lianggaoshan Formation.Figure 9a presents the two-dimensional molecular structure of the kerogen sample, with a molecular formula of C224H160O25N6S4. Subsequently, we compared the kerogen molecular model constructed for the Lianggaoshan Formation with the marine shale kerogen model proposed by Philippe [56]. The results show that low-maturity kerogen model is primarily composed of long aliphatic chains and saturated hydrocarbons, with a high abundance of oxygen-containing functional groups such as hydroxyl and carbonyl groups. Accordingly, both the hydrogen-to-carbon (H/C > 1) and oxygen-to-carbon (O/C ≈ 0.09) atomic ratios are relatively high. In contrast, the lacustrine shale of the Lianggaoshan Formation exhibits a higher level of organic matter maturity and falls within the main oil-generation window. As a result, oxygen-containing functional groups have decomposed, and both H/C and O/C ratios have significantly decreased. The degree of aromaticity has begun to increase, and aliphatic chains gradually break down into liquid hydrocarbons, leading to a molecular structure characterized by a coexistence of aromatic units and short-chain alkanes. Compared with existing kerogen molecular models, the model developed in this study more accurately represents the geological characteristics of the lacustrine shale in the Lianggaoshan Formation and thus offers distinct advantages for characterizing its organic matter.
The constructed 2D kerogen structure was imported into gNMR software for computational analysis, generating a simulated NMR spectrum [57]. The high degree of fit between the simulated solid-state NMR spectrum and the experimental NMR spectrum (Figure 9b) confirms that the developed molecular model accurately represents the chemical structure of the kerogen samples from the core.

3.2.2. Construction of Kerogen Slit Nanopore

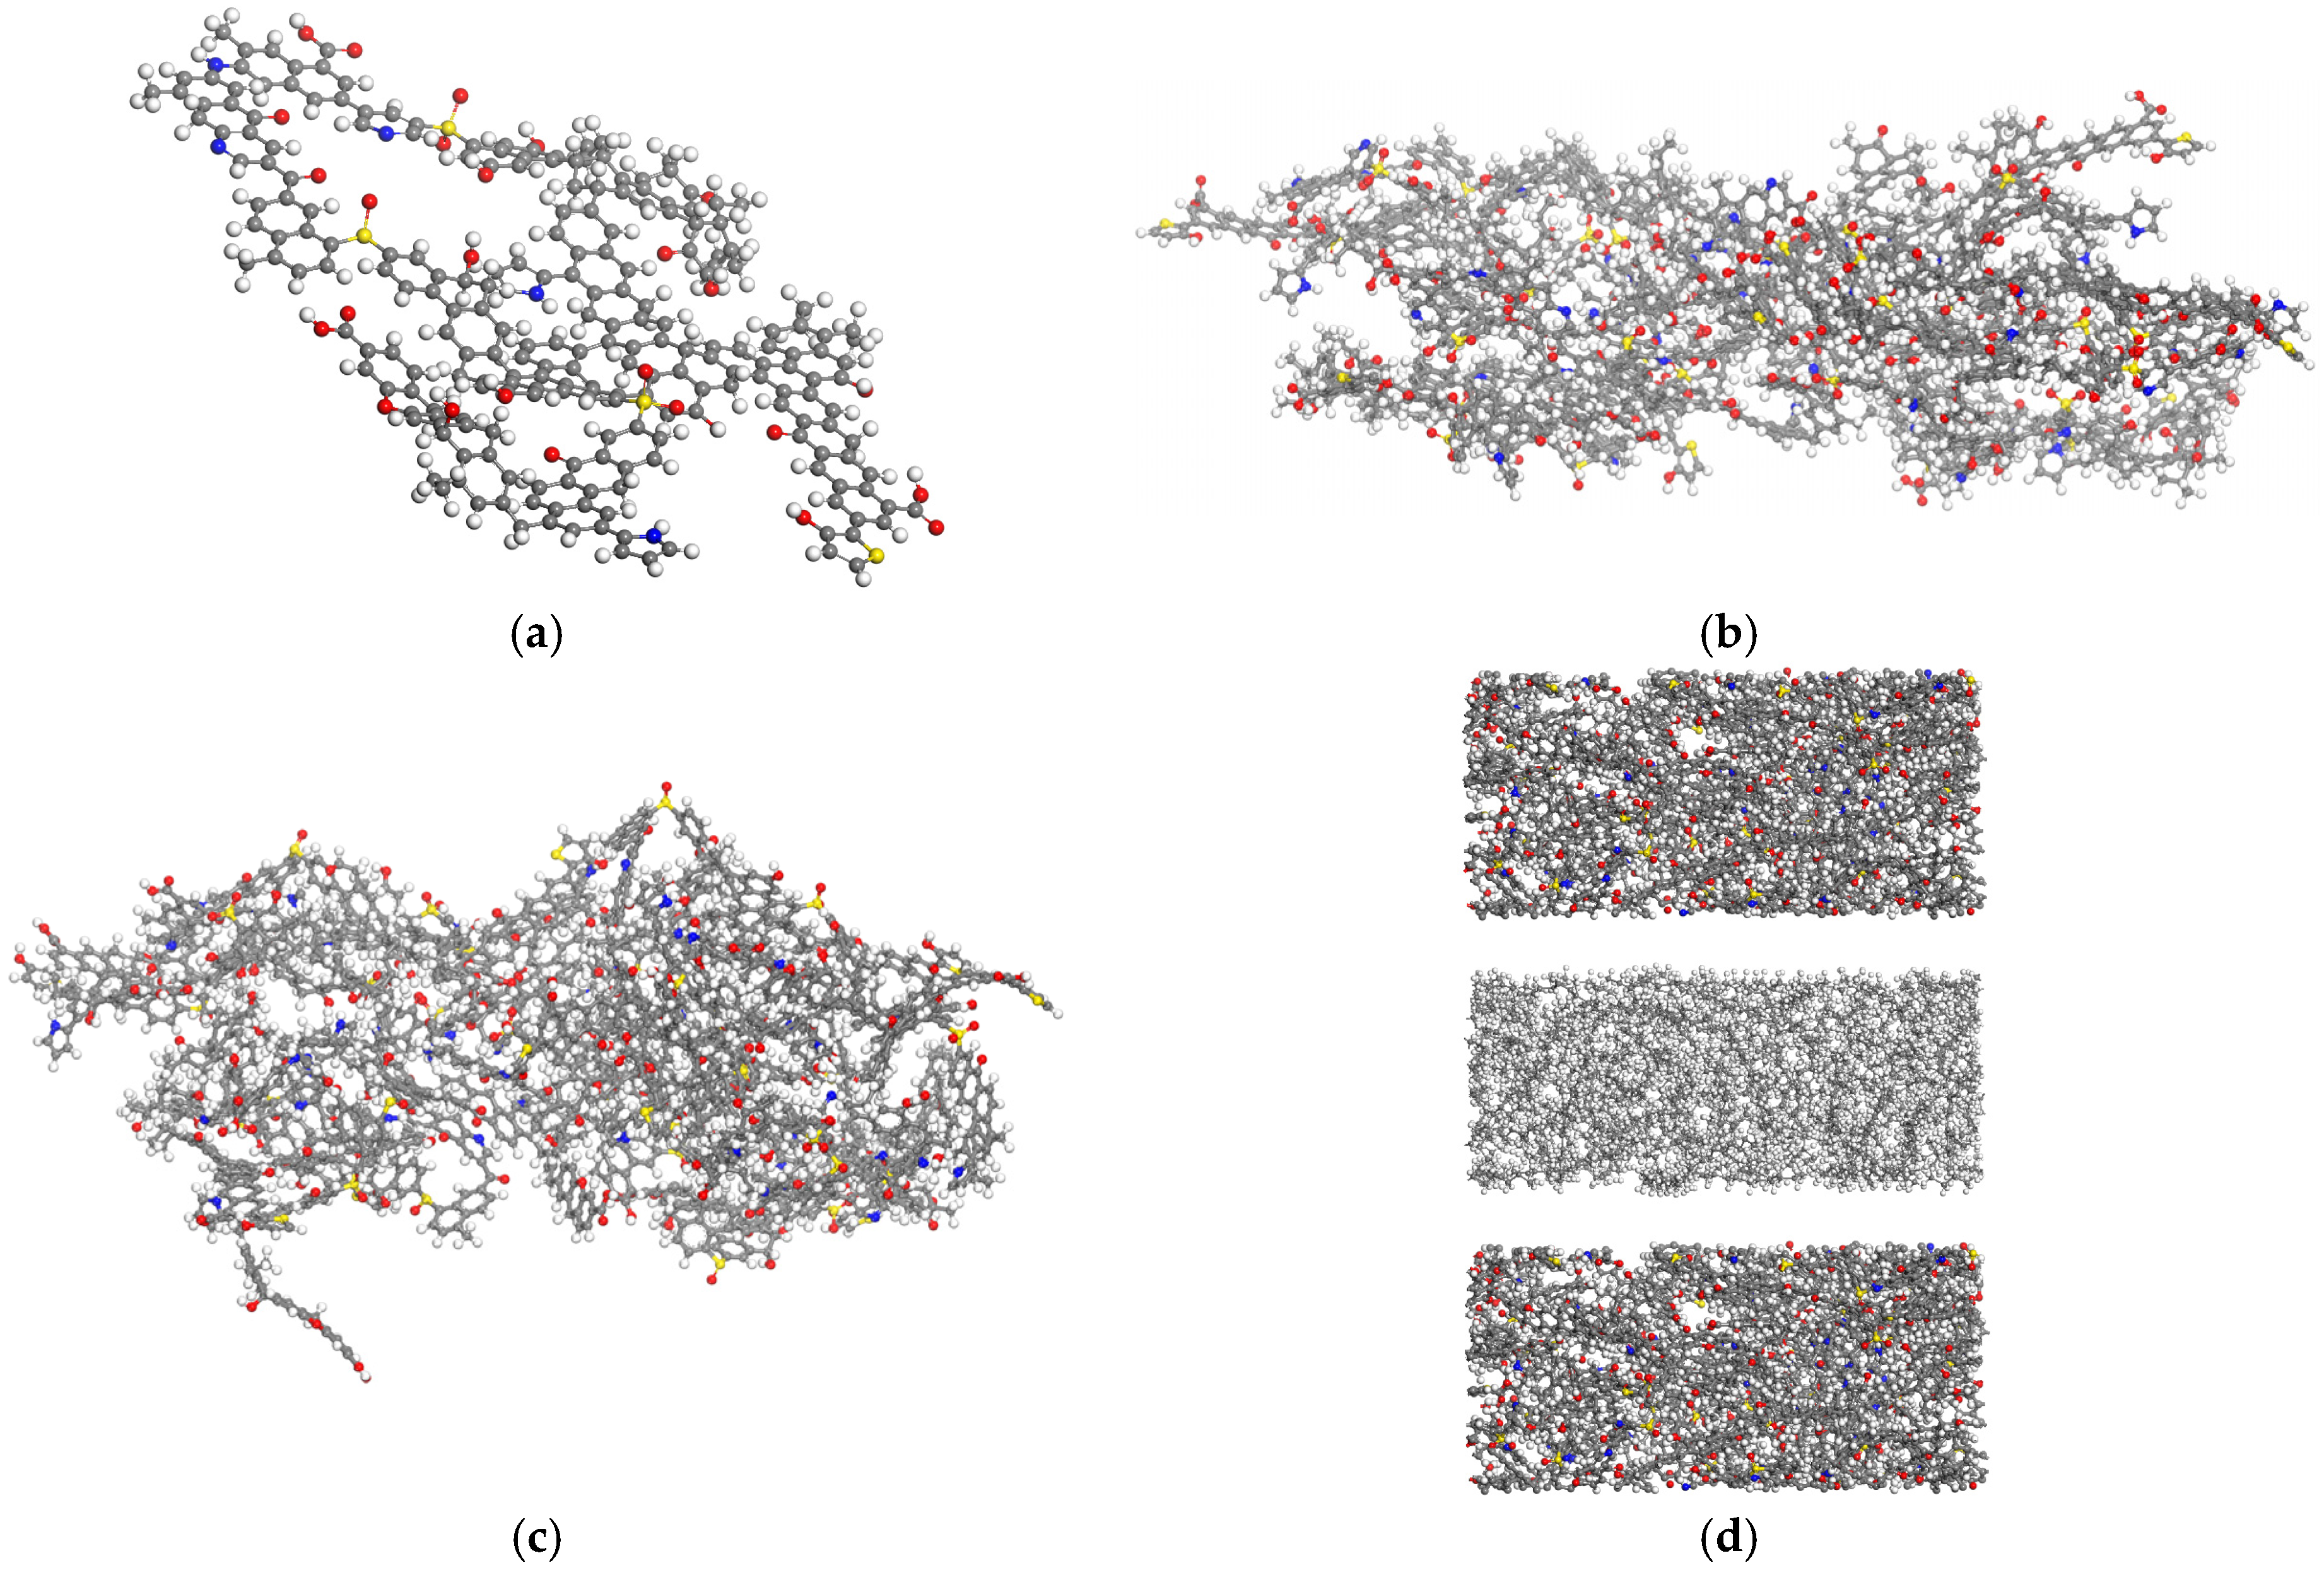
After obtaining the initial 2D configuration of the kerogen molecule in the study area, and considering that the minimum size requirement for the kerogen matrix is 1700 atoms, 10 three-dimensional kerogen units were combined to construct the initial kerogen matrix (Figure 10a). The initial structural units of the kerogen are dispersed, with no interactions between them. Geometry optimization was then performed to reposition the atoms to their reasonable initial positions (Figure 10b). The annealing process enhances the molecular flexibility and toughness, bringing the kerogen system to its lowest energy equilibrium state (Figure 10c). During the first simulation in the NPT ensemble, the density of the kerogen matrix gradually increased and converged. After equilibrium, the kerogen density was 1.31 g/cm3, while the density range for highly mature organic matter kerogen was between 1.18 and 1.25 g/cm3 [42], further validating the reasonableness of the constructed kerogen model. The kerogen slit model was obtained by combining two matrix layers, where dm represents the pore diameter of the slit. n-Dodecane molecules were inserted into the pore region using the Packmol algorithm, with the number of molecules adjusted to achieve near-liquid density (0.75 g/cm3) at room temperature (Figure 10d).

3.3. The Effect on n-Dodecane Adsorption

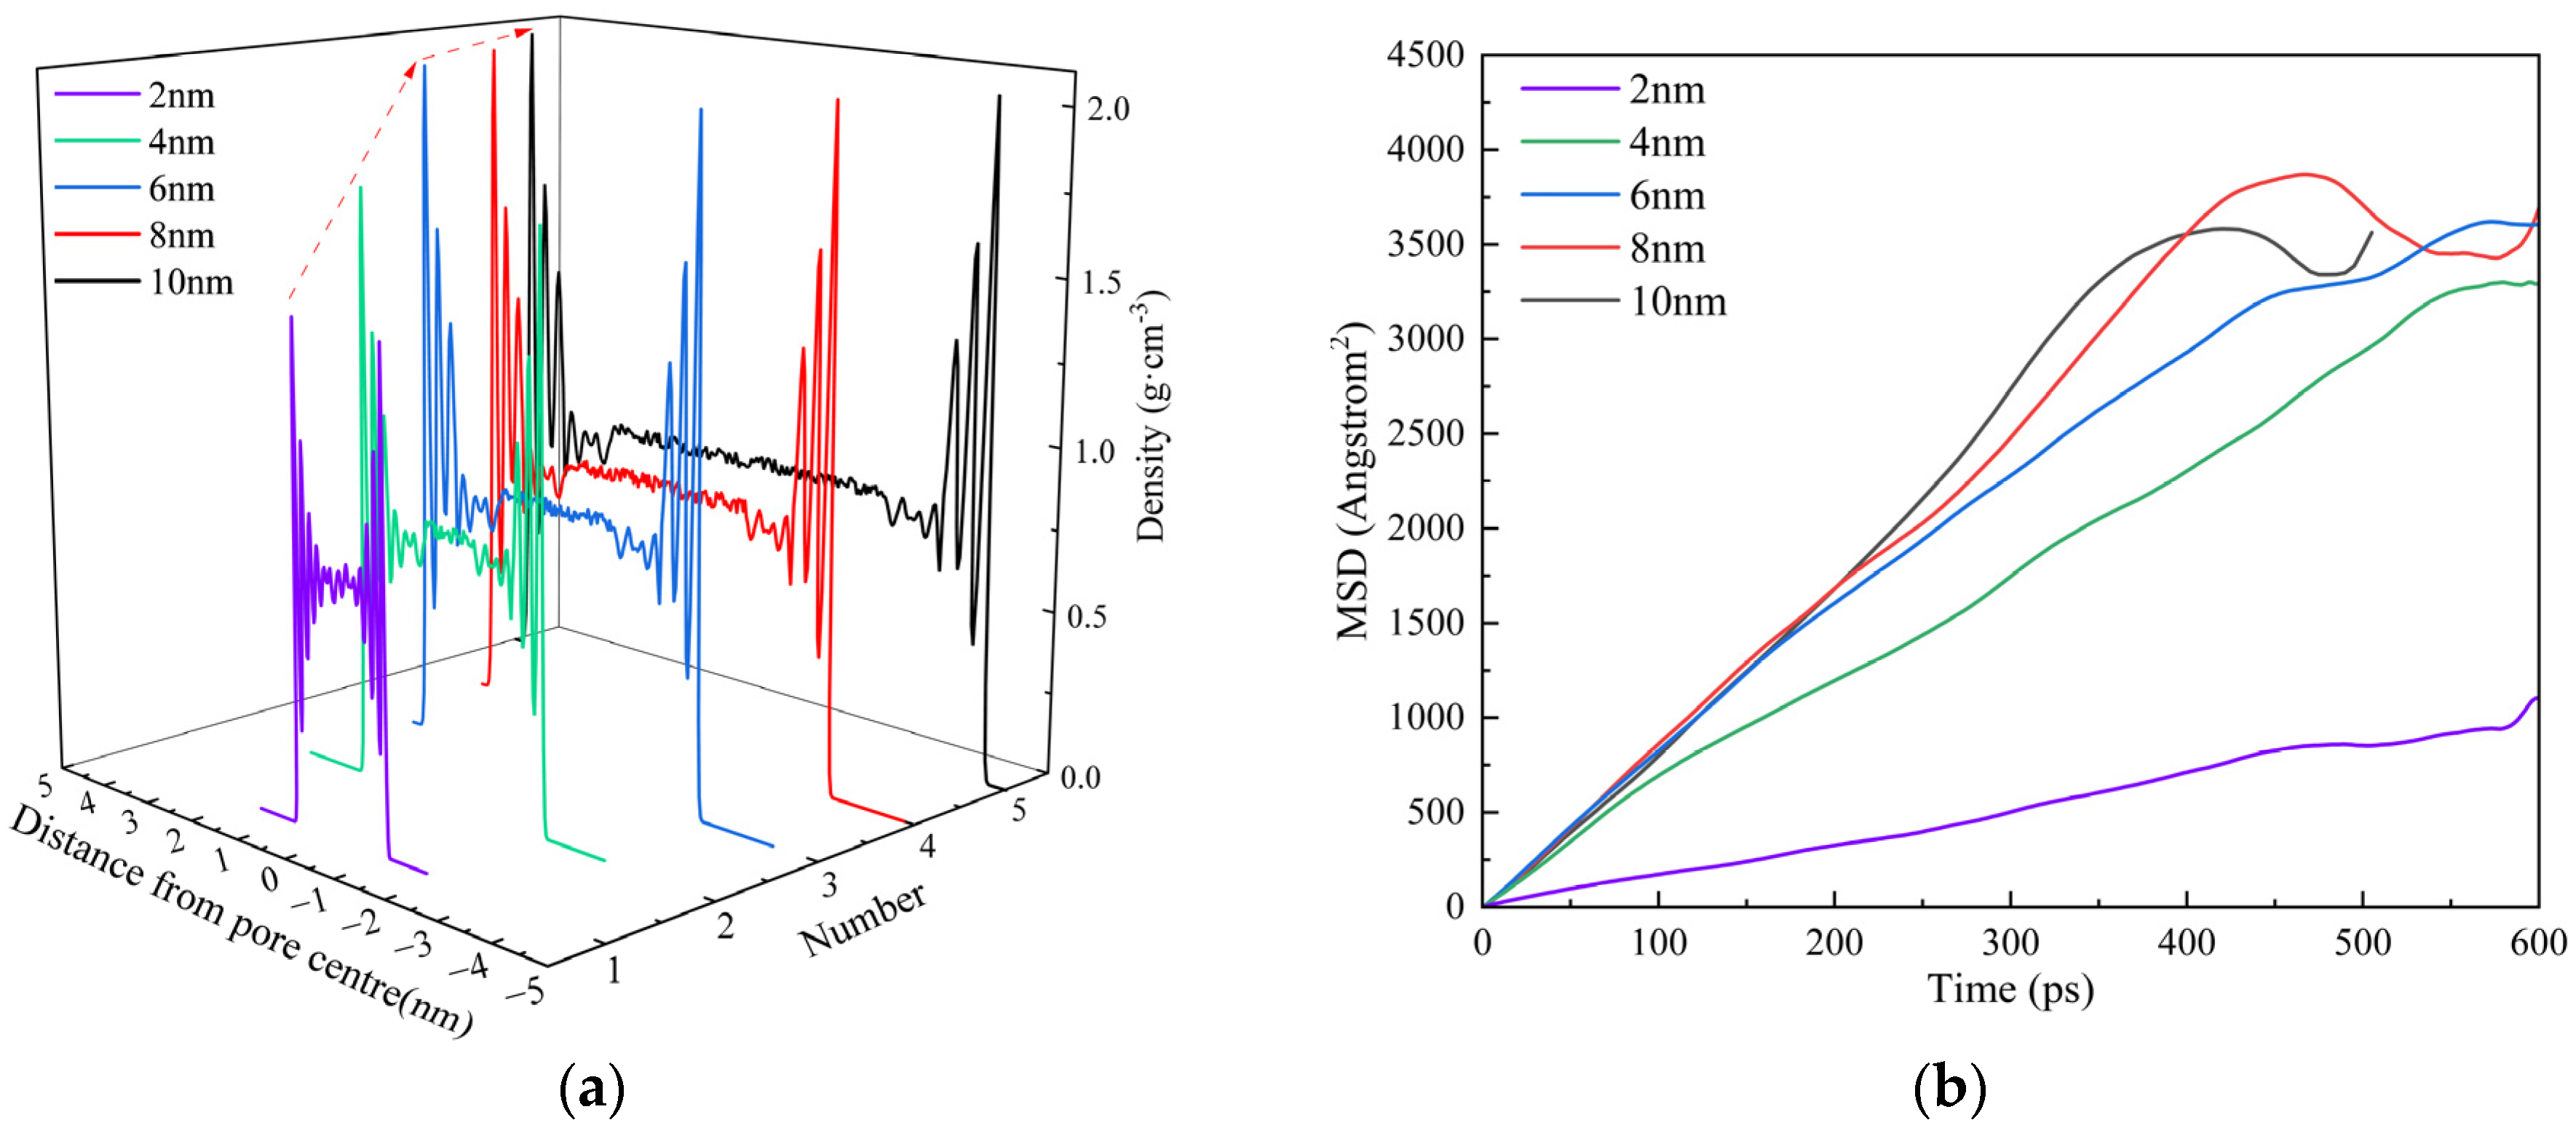
To connect pore-scale structure with occurrence states, the mass-density profile ρm(x) and mean-square displacement (MSD) were used together to relate molecular structure to the adsorbed ratio Ra and its dependence on pore size and temperature.
The local density distribution of n-dodecane molecules was computed along the direction normal to the kerogen wall by dividing the simulation box into bins of 0.5 Å thickness. The mass density in each bin was calculated by summing the atomic masses within the bin and dividing by the bin volume. The adsorption layers were identified by locating peaks in the density profile, with local minima used as boundaries between adjacent layers. This method enables the quantification of adsorption structure and packing behavior near the pore walls. The mass-density profile obtained by binning the simulation box (bin thickness Δx) along the direction perpendicular to the kerogen wall can be obtained as follows:
ρ m ( x i ) = 1 A Δ x j = 1 N a t o m s m j I ( x j [ x i Δ x 2 , x i + Δ x 2 ] )
ρ ¯ m , k 1 x k min x k 1 min i k ρ m ( x i ) Δ x
The slope of the time versus mean square displacement function fitting curve can, to some extent, characterize the diffusion coefficient. The diffusion analysis was conducted by tracking the center-of-mass positions of all n-dodecane molecules confined within the kerogen slit pores. No chemical reactions or molecular exchange between adsorbed and free states were considered, as the system was modeled as a single-component ensemble. The initial deviation from linearity in the MSD curves is attributed to thermal equilibration in the early stages of the simulation, which is a common observation in confined molecular systems.

3.3.1. Pore Radius

Figure 11a illustrates the density distribution of n-dodecane molecules in the kerogen slit pores with varying pore sizes (2, 4, 6, 8, and 10 nm). As the pore size increases under constant temperature, the number of adsorption layers gradually increases. Before reaching a stable number of adsorption layers, the peak density of the formed adsorption layers is lower than the peak density observed when the formed and forming layers coexist. With the increase in pore scale, adsorption layers are preferentially formed, indicating that only adsorbed hydrocarbons exist within certain pore size ranges. As the pore size further increases, the peak density of the first adsorption layer steadily rises, while the number of adsorption layers gradually increases to five prominent layers and two to three fewer significant layers, ultimately stabilizing. The thickness of the adsorption layers remains unchanged with varying pore sizes. Furthermore, when the pore diameter exceeds 6 nm, the peak density of the adsorption layers shows no significant variation. Comparing the peak density of the first adsorption layer in pores of varying widths reveals that in 6 nm pores, the first adsorption layer density is approximately 3.61 times the free hydrocarbon density in the pore center, further suggesting the presence of a “solid-like layer” of polymeric hydrocarbons within the pore. Figure 11b indicates that as the pore size increases, the diffusion ability of n-dodecane molecules within the kerogen slit pores follows a trend of first increasing and then stabilizing.

3.3.2. Temperature

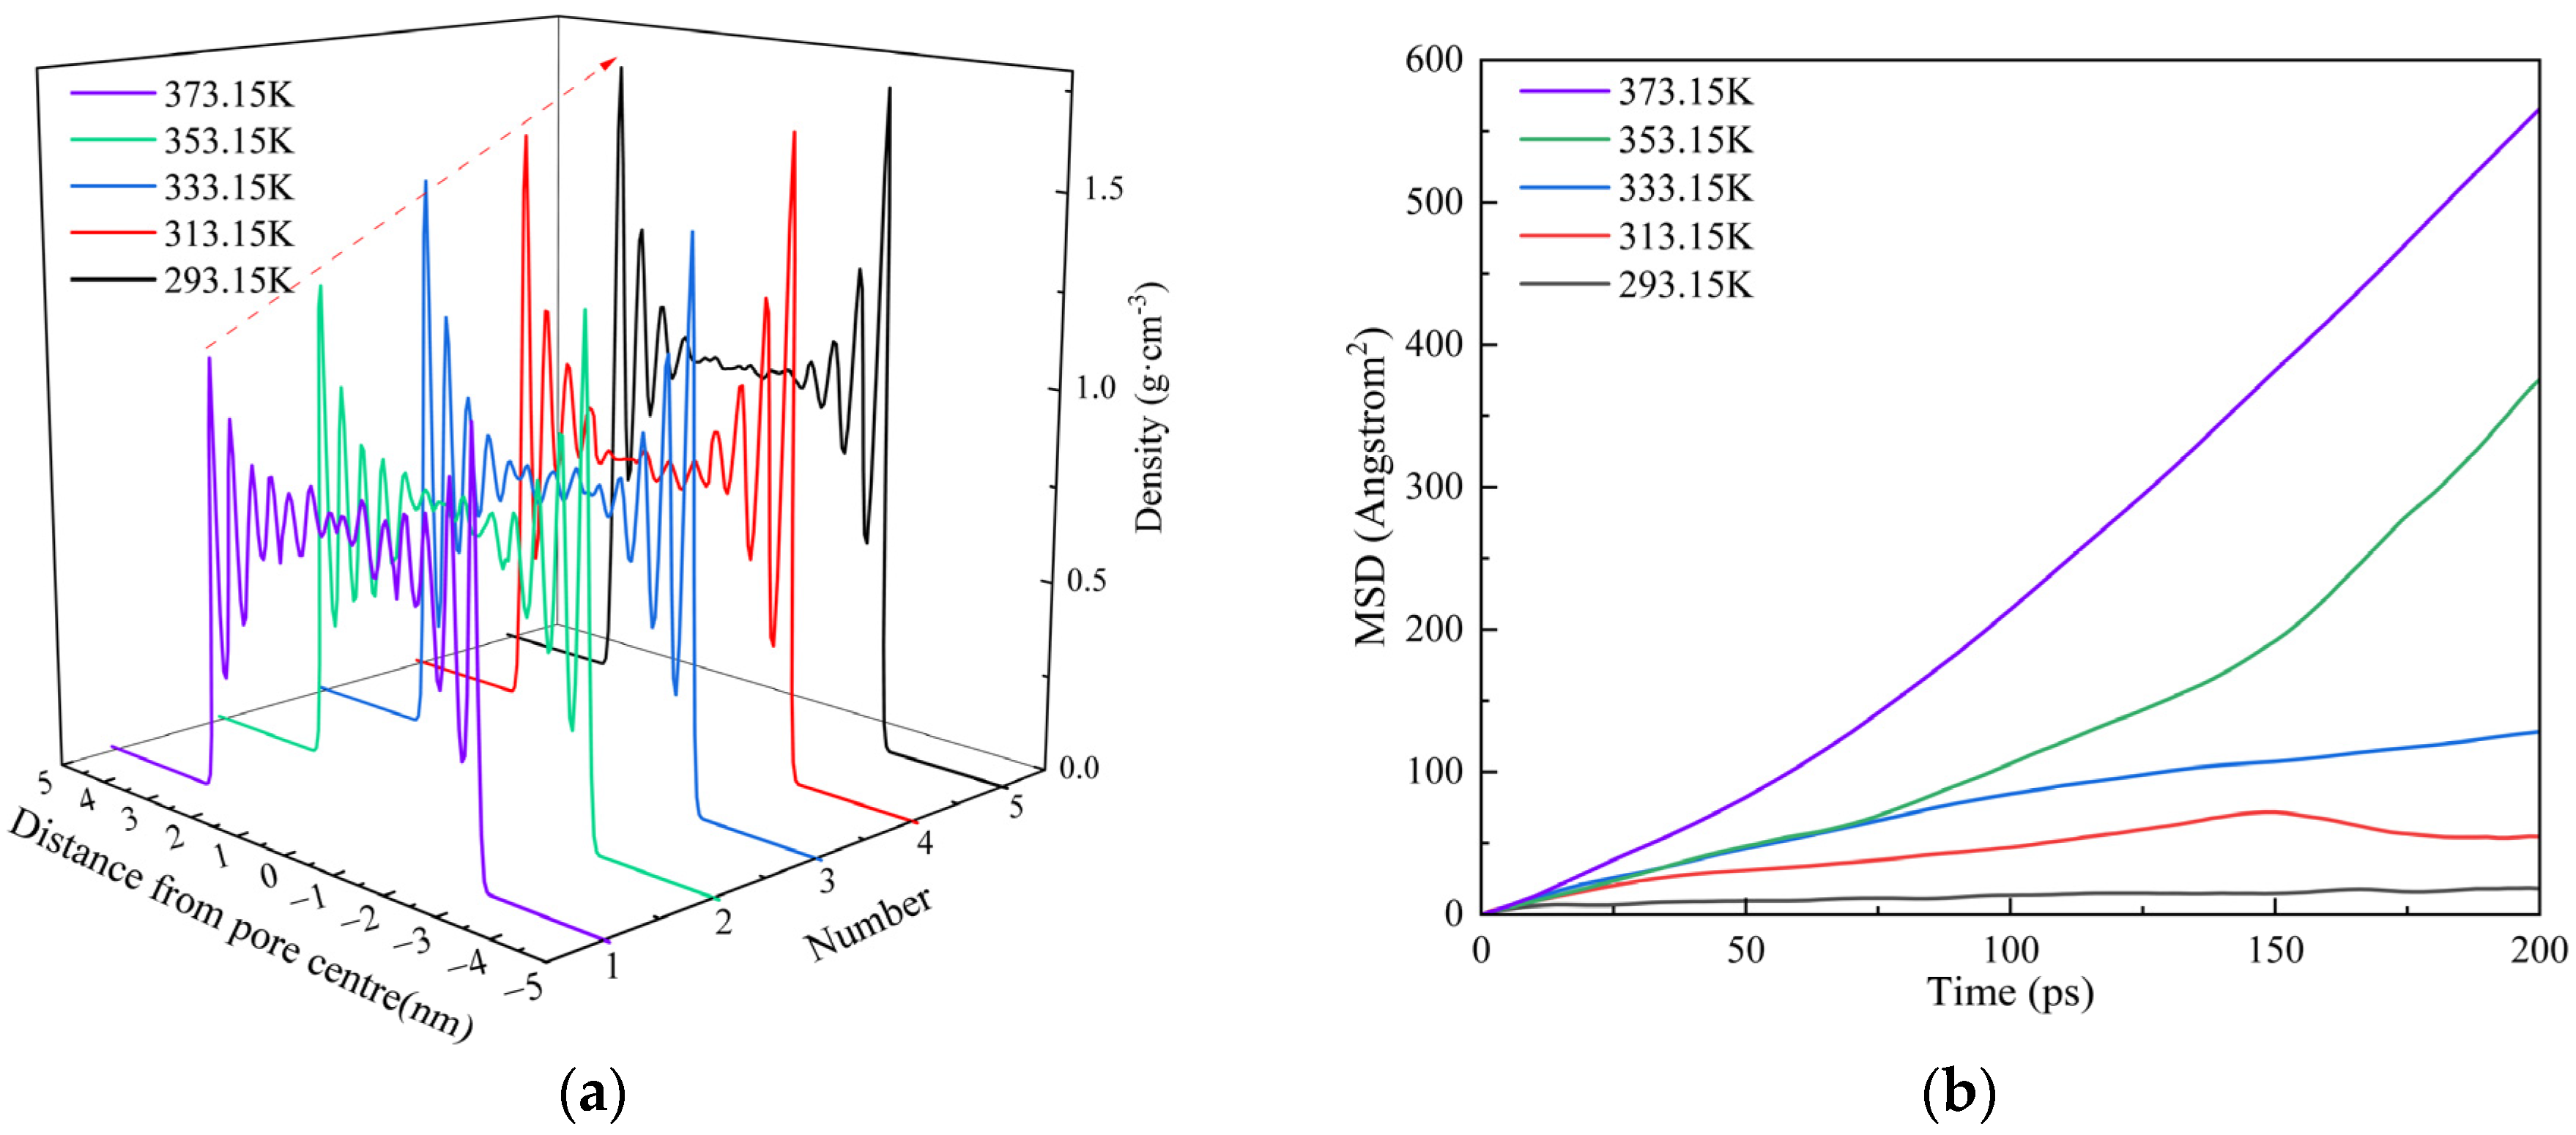
Figure 12a illustrates the density distribution of n-dodecane within kerogen slit pores at different temperatures (293.15, 313.15, 333.15, 353.15, and 373.15 K). At temperatures exceeding 373 K, shale oil components may undergo thermal cracking, phase transitions, or volatilization, which are beyond the assumptions of the current confined adsorption model. Therefore, simulations at higher temperatures were not pursued. The results show that n-dodecane molecules form four adsorption layers within the kerogen pores, with the density profile gradually decreasing as the distance from the pore wall increases. The adsorption layer thickness remains between 0.4 and 0.5 nm.
As the temperature rises, the peak densities of the first and second adsorption layers decrease significantly, whereas the third and fourth layers exhibit only minor reductions. Meanwhile, the density of n-dodecane molecules at the center of the pore remains nearly unchanged. Additionally, it is observed that the reduction in the first adsorption layer’s peak density decreases progressively with increasing temperature.
Furthermore, as temperature increases, the diffusion capability of n-dodecane molecules within the pores also rises (Figure 12b). The reduction in adsorption density with increasing temperature can be attributed to the increase in system internal energy, which enhances molecular kinetic energy and facilitates desorption from the organic matter surface.

3.3.3. Pressure

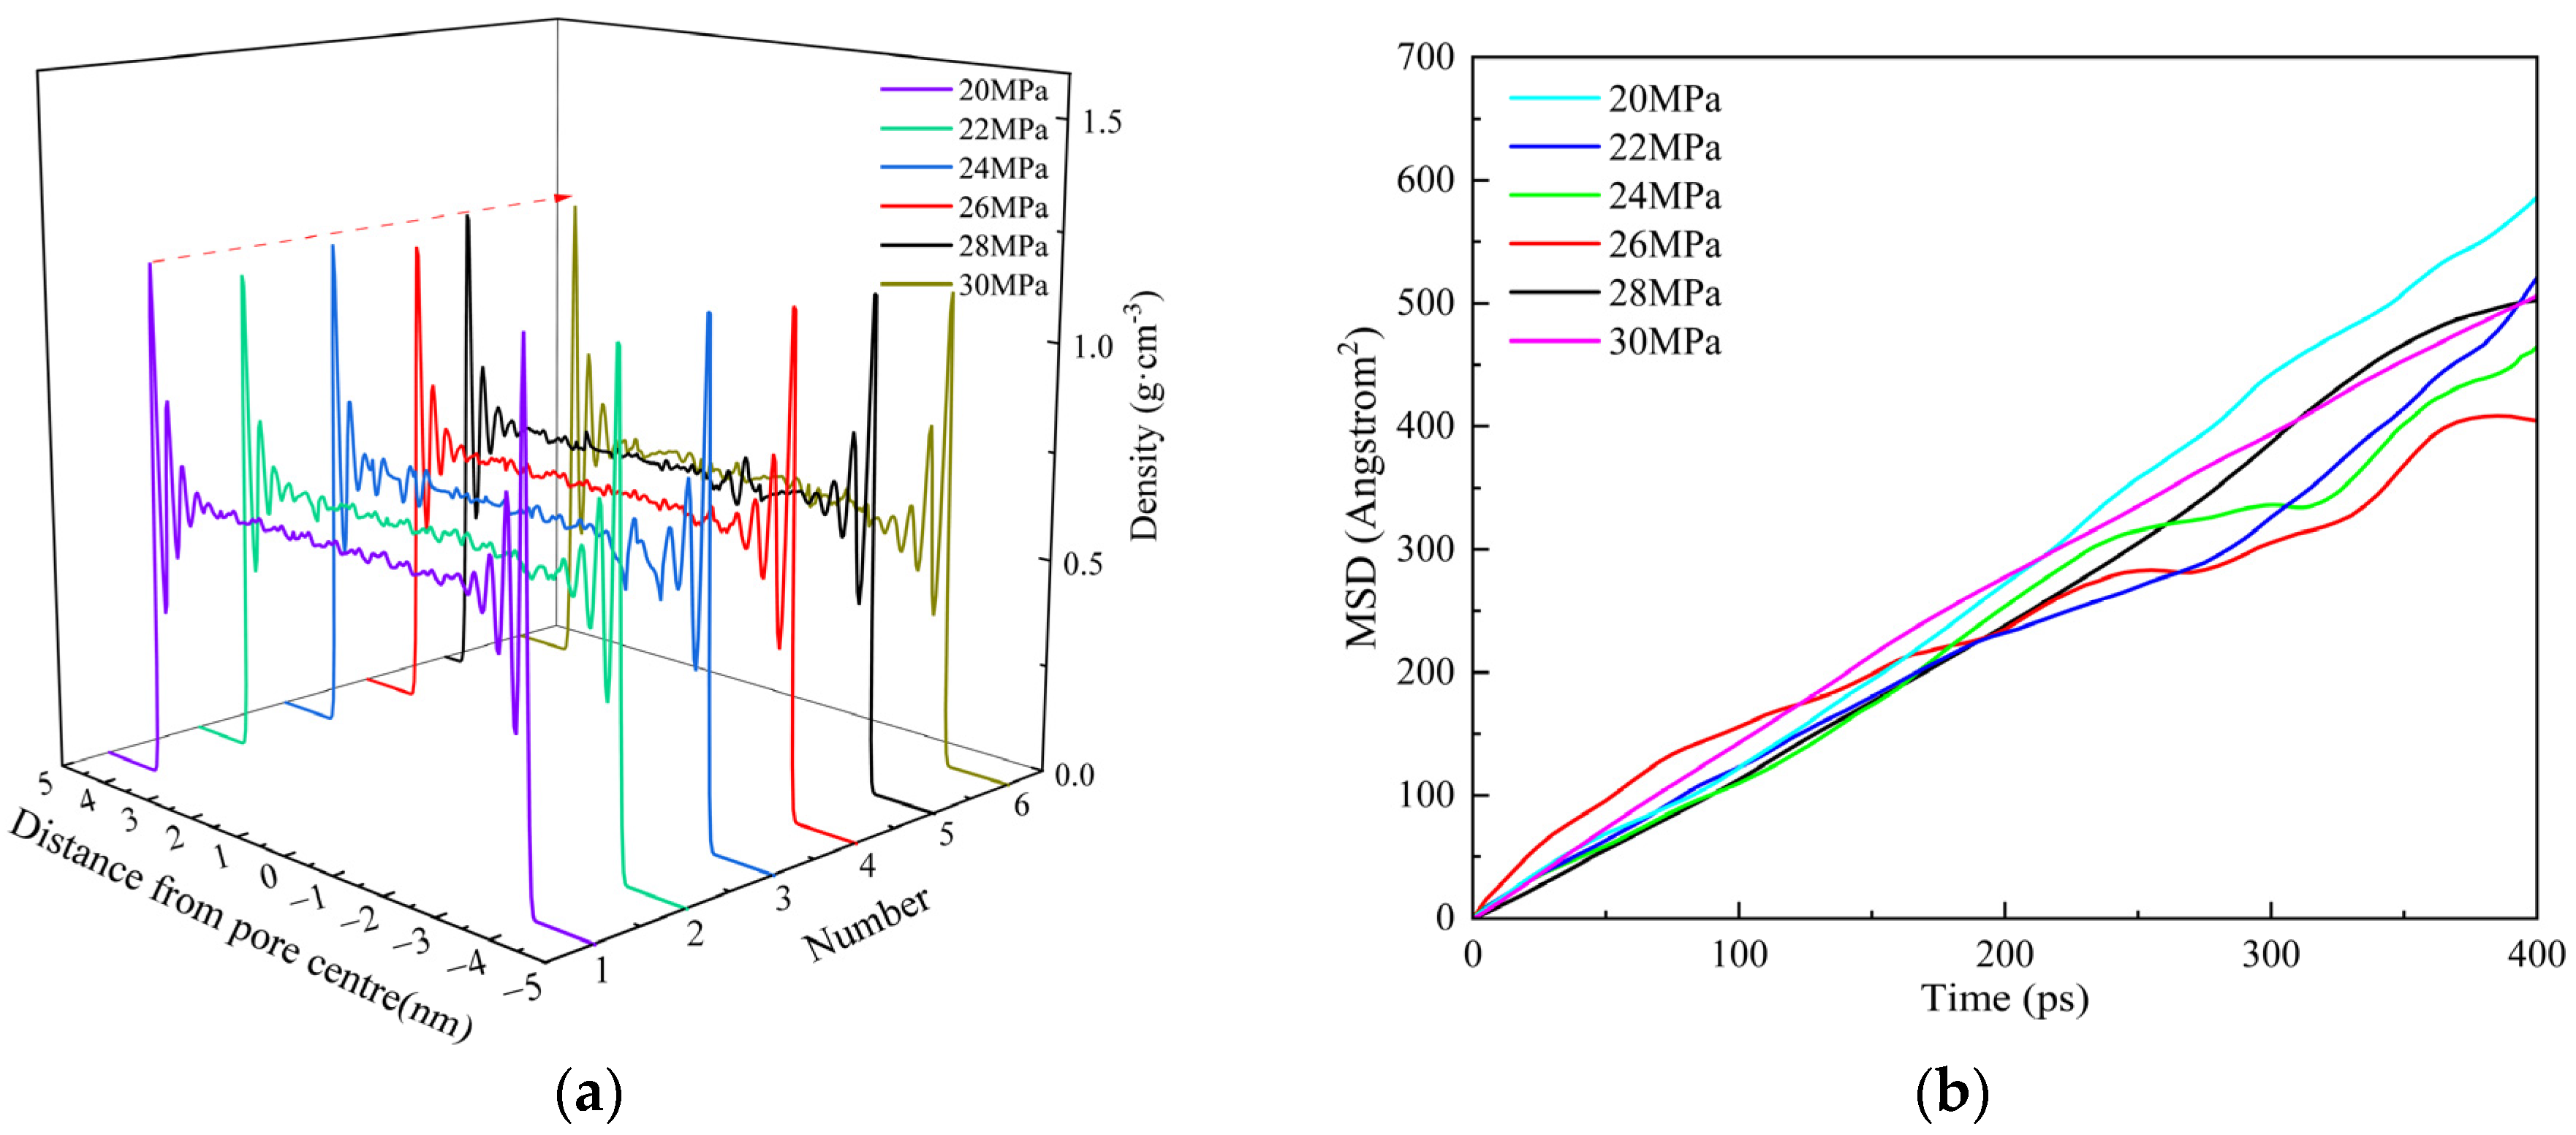
To evaluate the influence of pressure on the occurrence states of alkane molecules, we conducted molecular simulations of n-eicosane within kerogen slit pores under a pressure range of 20–30 MPa.
As shown in Figure 13a, the density profiles of n-eicosane exhibit negligible variation across the entire pressure range, indicating that the total adsorption amount remains nearly constant. Figure 13b further shows that the mean square displacement (MSD) curves under different pressures are closely aligned, suggesting that the diffusion capacity of n-eicosane molecules is not significantly affected by pressure.
This phenomenon is attributed to the capillary condensation of liquid alkanes within the nanopores. Unlike gases, which show pronounced adsorption variability with pressure, liquid-phase hydrocarbons tend to exhibit saturated adsorption behavior due to strong van der Waals interactions with the pore walls. Once adsorption layers form near the surface, additional pressure has limited impact on their molecular arrangement or mobility. These results indicate that pressure plays a minimal role in controlling the behavior of confined liquid hydrocarbons under the conditions studied.

3.3.4. Sensitivity Analysis

To assess the robustness of the theoretical occurrence model, we conducted a sensitivity analysis of three key parameters: average pore diameter (dm), adsorbed-phase density (ρ1), and free-phase density (ρ2). Each parameter was independently perturbed by ±10% from its baseline value while keeping the others constant. The resulting changes in the calculated adsorbed ratio (Ra) were evaluated.
The results show that Ra is particularly sensitive to variations in ρ1 and dm, with deviations up to 18% observed for a 10% increase in adsorbed-phase density in smaller pore systems (<5 nm). In contrast, variations in ρ2 have a comparatively minor effect on Ra, especially in mesoporous systems. These findings suggest that accurate estimation of ρ1 and dm is critical for reliable model predictions. A summary of the sensitivity analysis is provided in Table 3.

3.3.5. Microscopic Mechanism of Shale Oil Occurrence

Previous analyses have shown that the micro-scale adsorption of shale oil is controlled by factors such as the oil-bearing pore surface area, the density of the adsorbed phase, and the adsorption thickness. The free phase is influenced by the oil-bearing pore volume and the density of the free phase. However, the surface area of oil-bearing pores correlates with pore size, shape, and volume, while pore volume is further related to oil saturation, porosity, and shale density. On a macroscopic scale, shale oil adsorption is affected by pore diameter and temperature. By combining molecular dynamics simulations with adsorption-free oil theoretical models, we can quantitatively assess the shale oil storage state under various pore diameters and temperatures.
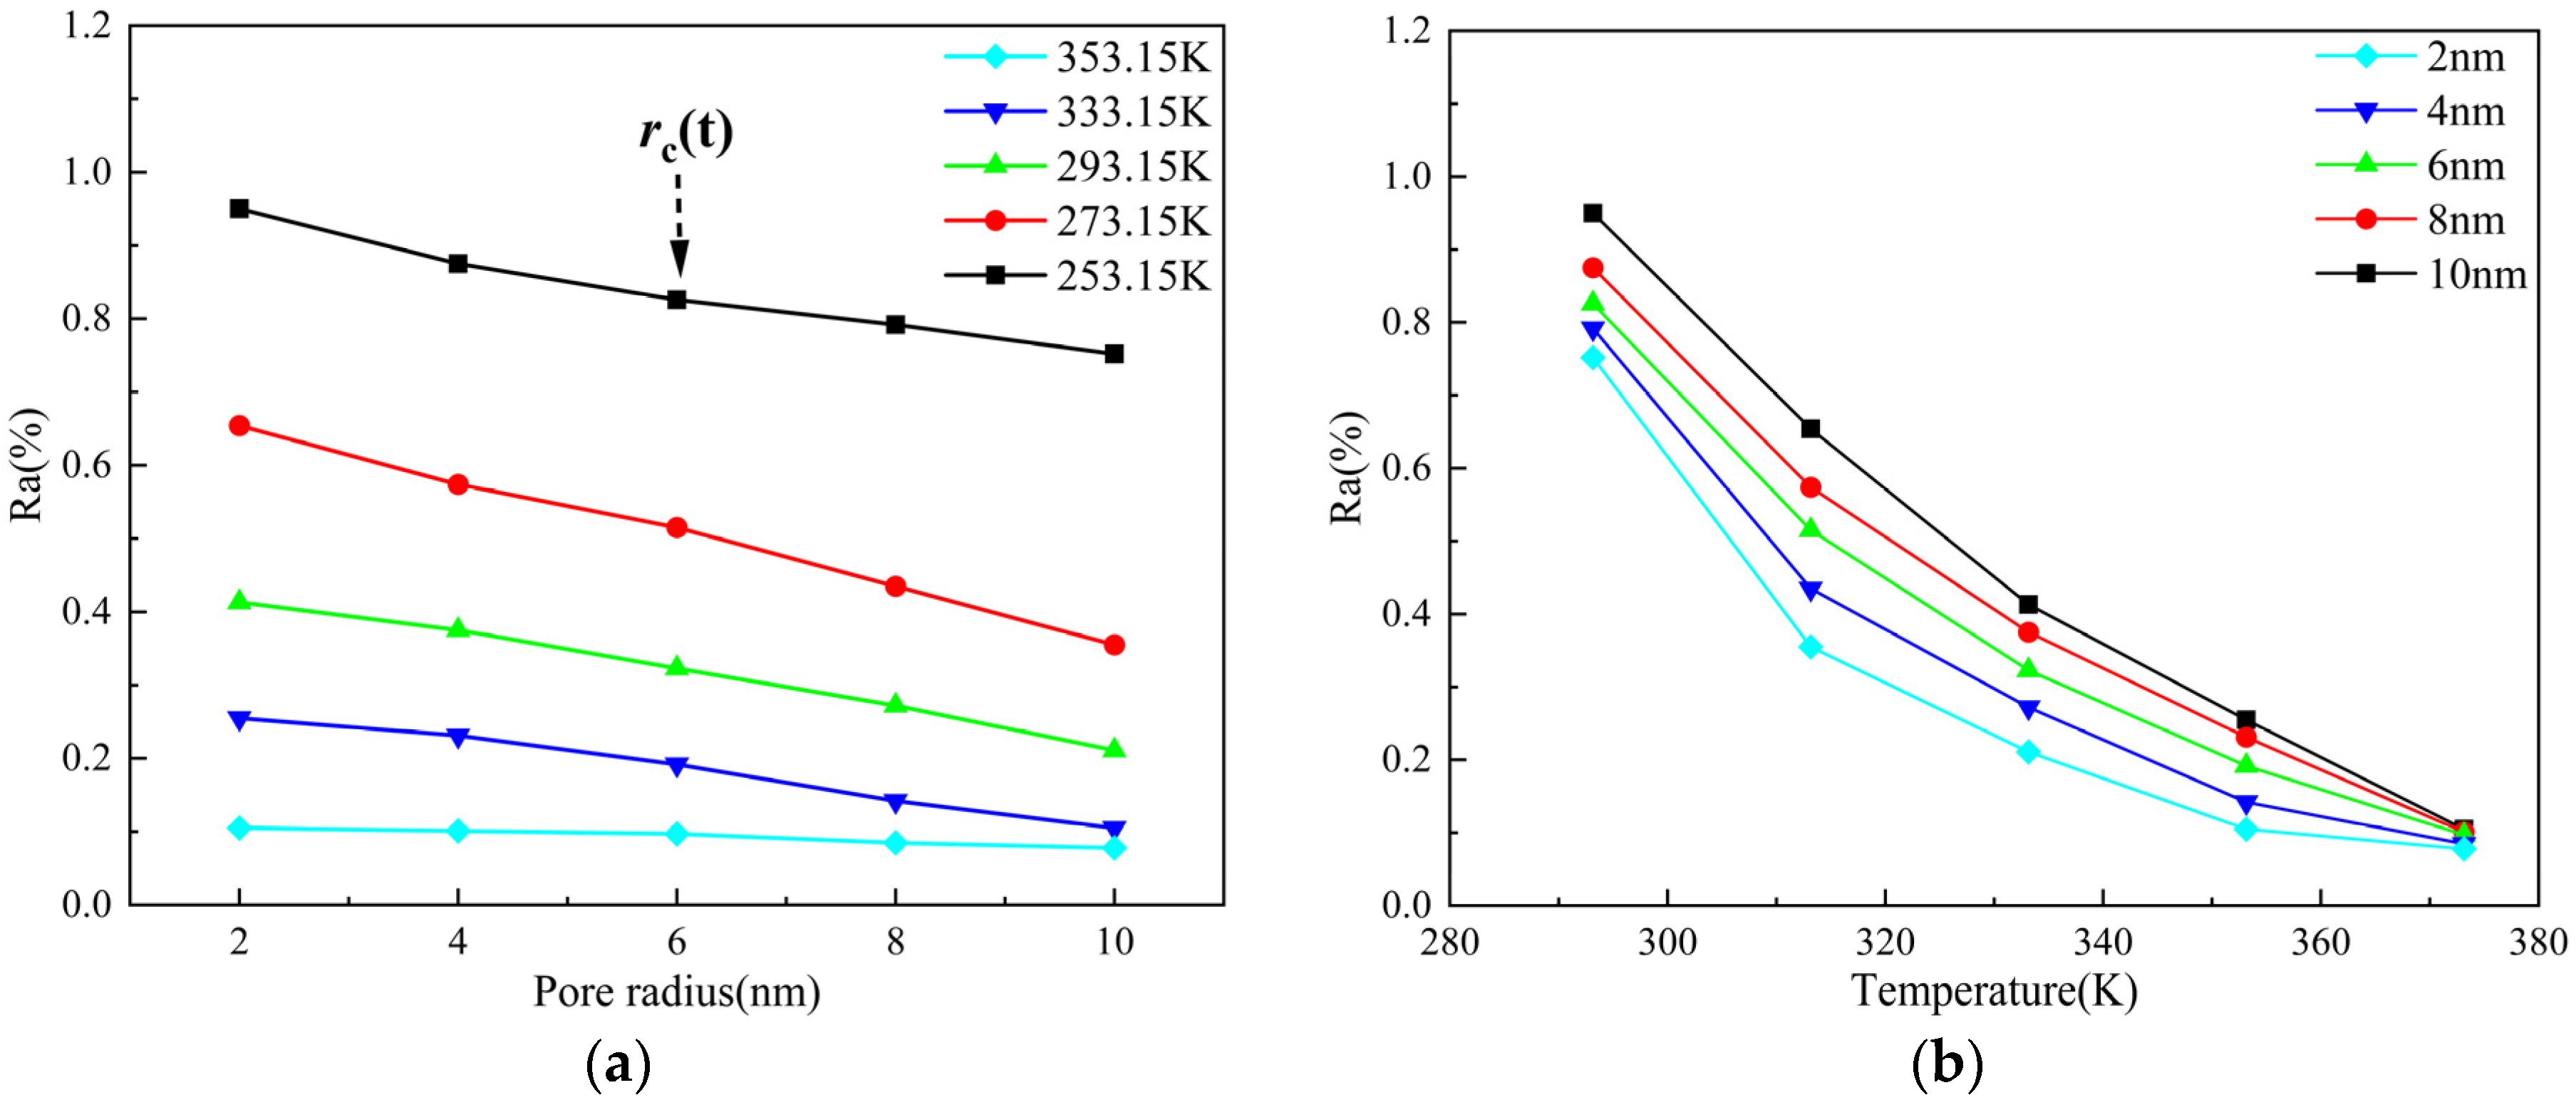
The proportion of adsorbed oil (Ra) was quantitatively calculated using Equation (8), with the proportion of free shale oil defined as 1 − Ra. Molecular dynamics simulation results reveal that the density distribution of hydrocarbon molecules exhibits a clear layered structure. In this context, the high-density layers located near the kerogen pore walls are defined as adsorbed shale oil, while the low-density layers in the center of the pores are classified as free shale oil. By statistically analyzing the density values of the adsorbed and free oil layers, the key parameters ρ1 and ρ2 in the equation can be determined. Furthermore, we define a characteristic pore radius rc(T) as the pore size at which the center density first reaches 0.95 ρbulk(T) (i.e., the adsorption layers near the two walls no longer overlap), consistent with the density profiles in Figure 12a. Equivalently, beyond rc(T), the dRa/dR slope falls below a small threshold, indicating a transition from strong-confinement to weak-confinement scaling. Because rc(T) is temperature dependent, the transition appears as a band rather than a single universal pore size when curves at different temperatures are overlaid (Figure 14a). On the other hand, shale oil adsorption decreases with an increase in temperature, with a significantly larger reduction of over 50% (Figure 14b). A comparative analysis of shale oil adsorption under different pore diameters and temperatures shows that, in contrast to pore diameter, temperature has a stronger effect on shale oil adsorption.

4. Conclusions

This study first establishes a molecular model of kerogen from the Lianggaoshan Formation shale using pyrolysis–gas chromatography–mass spectrometry (PY-GC-MS), Fourier transform infrared spectroscopy (FTIR), solid-state 13C nuclear magnetic resonance (13C NMR), and X-ray photoelectron spectroscopy (XPS). Furthermore, the storage state of shale oil in kerogen nanopores is analyzed from the perspectives of regularized Monte Carlo (GCMC) molecular simulations and the free oil–adsorbed oil evaluation model. The main conclusions are summarized as follows:
(1)
The pyrolysis products of kerogen samples primarily consist of hydrocarbons, nitrogen-containing heteroatom compounds, aromatic compounds with benzene ring structures, and oxygen-containing alcohol compounds. FTIR results indicate that the chemical structure of kerogen is mainly composed of aromatic groups, aliphatic groups, and oxygen-containing groups. 13C NMR results suggest that aromatic carbon forms the main framework of the kerogen structure. XPS experimental results show that fluorine exists in the form of ions in kerogen, while nitrogen exists in the forms of pyridine, pyrrole, amines, and nitrogen oxides, and sulfur exists in three forms: thiophene-type, sulfone-type, and sulfoxide-type sulfur.
(2)
Shale oil molecules preferentially form an adsorption layer in kerogen pores. As pore size increases, the number of adsorption layers gradually increases. When the pore diameter exceeds 8 nm, the density profile of the adsorption layer no longer changes. As the temperature increases, the peak of the adsorption layer near the wall decreases with temperature, while the peak of the adsorption layer farther from the wall shows minimal reduction. Pressure has a limiting effect on the adsorption amount of dodecane molecules.
(3)
With an increase in pore size, the adsorbed oil content gradually decreases, but the overall reduction is less than 20%. After the pore diameter exceeds a certain threshold, the change in shale oil adsorption becomes negligible. Meanwhile, the amount of shale oil adsorbed decreases significantly with increasing temperature, with a total reduction exceeding 50%. This suggests that in comparison with pore size, temperature has a stronger effect on shale oil adsorption.

Author Contributions

Conceptualization, Y.G.; methodology, L.S.; writing—original draft preparation, Y.G.; writing—review and editing, Y.G.; project administration, L.S. and L.W.; supervision, S.T.; investigation, L.S.; formal analysis, J.L.; funding acquisition, L.W.; visualization, W.J.; validation, B.L. (Bowen Liu); software, W.J. and J.L.; data curation, B.L. (Bojie Li). All authors have read and agreed to the published version of the manuscript.

Funding

This research was funded by National Natural Science Foundation of China grant number [41504108] And the APC was funded by Yuhao Guo.

Data Availability Statement

Data will be made available on request.

Acknowledgments

The authors would like to acknowledge the School of Geoscience and Technology, Southwest Petroleum University, for all support in the research.

Conflicts of Interest

The authors declare that they have no known competing financial interests or personal relationships that could have appeared to influence the work reported in this paper.

Abbreviations

The following abbreviations are used in this manuscript:
PY-GC-MSPyrolysis–gas chromatography–mass spectrometry
13C NMRSolid-state 13C nuclear magnetic resonance
FTIRFourier transform infrared spectroscopy
XPSX-ray photoelectron spectroscopy
GCMCGrand Canonical Monte Carlo

References

  1. Du, J.H.; Hu, S.Y.; Pang, Z.L.; Du, S.H.; Hou, L.H.; Zhu, R.K. The types, potentials and prospects of continental shale oil in China. China Pet. Explor. 2019, 24, 560–568. [Google Scholar]
  2. Mănesu, C.B.; Nuño, G. Quantitative effects of the shale oil revolution. Energy Policy 2015, 86, 855–866. [Google Scholar] [CrossRef]
  3. Douglas, B.; Umekwe, M.P. Shale-oil development prospects: The role of shale-gas in developing shale-oil. Energies 2019, 12, 3331. [Google Scholar]
  4. Zhou, C.N.; Pan, S.Q.; Jing, Z.H.; Gao, J.L.; Yang, Z.; Wu, S.T. Shale oil and gas revolution and its impact. Acta Pet. Sin. 2020, 41, 1–12. [Google Scholar]
  5. Temoor, M.; Ahmed, H.; Fahad, S.; Hassan, A.; Amaar, S. Unconventional hydrocarbon resources: Geological statistics, petrophysical characterization, and field development strategies. Pet. Explor. Prod. Technol. 2022, 12, 1463–1488. [Google Scholar]
  6. Katz, B.; Lin, F. Lacustrine basin unconventional resource plays: Key differences. Mar. Pet. Geol. 2014, 56, 255–265. [Google Scholar] [CrossRef]
  7. Zhou, C.N.; Yang, Z.; Cui, J.W.; Zhu, R.K.; Hou, L.H.; Tao, S.Z. Formation mechanism, geological characteristics and development strategy of nonmarine shale oil in China. Pet. Explor. Dev. 2013, 40, 14–26. [Google Scholar] [CrossRef]
  8. Zhang, J.C.; Lin, L.M.; Li, Y.X.; Tang, X.; Zhu, L.L. Classification and evaluation of shale oil. Earth Sci. Front. 2012, 19, 322–331. [Google Scholar] [CrossRef]
  9. Hu, D.F.; Wei, Z.H.; Wei, X.F.; Shi, W.B.; Wang, D.J.; Liu, X.J. Breakthrough in the exploration of continental shale oil/gas of Jurassic Lianggaoshan Formation in the Fuxing area of the Sichuan Basin and its inspiration. Nat. Gas Ind. 2025, 45, 1–13. [Google Scholar]
  10. Clementz, D.M. Effect of oil and bitumen saturation on source-rock pyrolysis. AAPG Bull. 1978, 63, 2227–2232. [Google Scholar]
  11. Xu, Y.; Lun, Z.M.; Pan, Z.J.; Wang, H.T.; Xia, Z.; Zhao, C.P. Occurrence space and state of shale oil: A Review. J. Pet. Sci. Eng. 2022, 211, 110183. [Google Scholar] [CrossRef]
  12. Kuang, L.C.; Hou, L.H.; Wu, S.T.; Cui, J.W.; Tian, H.; Zhang, L.J. Organic matter occurrence and pore-forming mechanisms in lacustrine shales in China. Pet. Sci. 2022, 19, 1460–1472. [Google Scholar] [CrossRef]
  13. Dordzie, G.; Balhoff, M. A review of chemical methods and testing techniques for enhanced oil recovery in shale reservoirs. Fuel 2025, 394, 135060. [Google Scholar] [CrossRef]
  14. Ghanizadeh, A.; Gasparik, M.; Amann-Hildenbrand, A.; Gensterblum, Y.; Krooss, B.M. Experimental study of fluid transport processes in the matrix system of the European organic-rich shales: I. Scandinavian Alum Shale. Mar. Pet. Geol. 2014, 51, 79–99. [Google Scholar] [CrossRef]
  15. Zhang, Y.; Jiang, S.; He, Z.; Li, Y.; Xiao, D.; Chen, G. Coupling between Source Rock and Reservoir of Shale Gas in Wufeng-Longmaxi Formation in Sichuan Basin, South China. Energies 2021, 14, 2679. [Google Scholar] [CrossRef]
  16. Fathi, E.; Akkutlu, I.Y. Multi-component gas transport and adsorption effects during CO injection and enhanced shale gas recovery. Int. J. Coal. Geol. 2014, 123, 52–61. [Google Scholar] [CrossRef]
  17. Akkutlu, I.Y.; Fathi, E. Multiscale gas transport in shales with local kerogen heterogeneities. SPE J. 2012, 17, 1002–1011. [Google Scholar] [CrossRef]
  18. Nikolaev, M.Y.; Kazak, A.V. Liquid saturation evaluation in organic-rich unconventional reservoirs: A Comprehensive Review. Earth Sci. Rev. 2019, 194, 327–349. [Google Scholar] [CrossRef]
  19. Pan, S.; Zhang, Y.; Wang, Q.; Bo, J.R.; Xu, X.M.; Wang, Q. DFT and thermodynamic analysis of pyrolysis mechanism of sulfur-containing compounds in shale oil. J. China Coal Soc. 2024, 42, 572–586. [Google Scholar]
  20. Félix, G.; Djimasbe, R.; Tirado, A.; Varfolomeev, M.A. Detailed kinetic modeling for the organic-rich oil shale upgrading using supercritical water. Int. J. Hydrogen Energy 2025, 136, 126–138. [Google Scholar] [CrossRef]
  21. Jiang, Q.G.; Li, M.K.; Qian, M.H.; Li, Z.M.; Li, Z. Quantitative characterization of shale oil in different occurrence states and its application. Pet. Geol. Exp. 2016, 38, 843–849. [Google Scholar]
  22. Qian, M.H.; Jiang, Q.G.; Li, M.W.; Li, Z.M.; Liu, P. Quantitative characterization of extractable organic matter in lacustrine shale with different occurrence. Pet. Geol. Exp. 2017, 39, 278–286. [Google Scholar]
  23. Li, J.Q.; Lu, S.F.; Xie, L.J.; Zhang, J.; Xue, H.T. Modeling of hydrocarbon adsorption on continental oil shale: A case study on n-alkane. Fuel 2017, 206, 603–613. [Google Scholar] [CrossRef]
  24. Qian, M.H.; Wang, X.L.; Li, M.K.; Li, Z.M.; Leng, J.Y.; Kong, Z.L. Oil-bearing properties and hydrocarbon occurrence states of Fengcheng formation shale in Well Maye-1, Mahu Sag. Xinjiang Pet. Geol. 2022, 43, 693–703. [Google Scholar]
  25. Jarvie, D.M. Unconventional oil petroleum systems: Shales and shale hybrids. In Proceedings of the AAPG International Conference and Exhibition, Calgary, AB, Canada, 12–15 September 2010; pp. 12–15. [Google Scholar]
  26. Jarvie, D.M. Shale resource systems for oil and gas: Part 2−shale-oil resource systems. AAPG Mem. 2012, 97, 89–119. [Google Scholar]
  27. Jarvie, D.M. Components and processes affecting producibility and commerciality of shale resource systems. Geol. Acta 2014, 12, 307–325. [Google Scholar]
  28. Ertas, D.; Kelemen, S.R.; Halsey, T.C. Petroleum expulsion part 1. Theory of kerogen swelling in multicomponent solvents. Energy Fuels 2006, 20, 295–300. [Google Scholar] [CrossRef]
  29. Zhu, X.; Zhao, Y. Atomic mechanisms and equation of state of methane adsorption in carbon nanopores. J. Phys. Chem. C 2014, 118, 17737–17744. [Google Scholar] [CrossRef]
  30. Yuan, Q.; Zhu, X.; Lin, K.; Zhao, Y. Molecular dynamics simulations of the enhanced recovery of confined methane with carbon dioxide. Phys. Chem. Chem. Phys. 2015, 17, 31887–31893. [Google Scholar] [CrossRef] [PubMed]
  31. Kurniawan, Y.; Bhatia, S.K.; Rudolph, V. Simulation of binary mixture adsorption of methane and CO2 at supercritical conditions in carbons. AIChE J. 2006, 52, 957–967. [Google Scholar] [CrossRef]
  32. Czerwinski, F. Current trends in automotive lightweighting strategies and materials. Materials 2021, 14, 6631. [Google Scholar] [CrossRef]
  33. Qing, W.; Xinmin, W.; Shuo, P. The three-dimensional molecular structure model of Fushun oil shale kerogen, China. J. Mol. Struct. 2022, 1255, 132380. [Google Scholar] [CrossRef]
  34. Sun, Q.; Liu, W.; Zhang, N. Molecular insights into recovery of shale gas by CO2 injection in kerogen slit nanopores. J. Nat. Gas Sci. Eng. 2021, 90, 103903. [Google Scholar] [CrossRef]
  35. Daw, M.S.; Baskes, M.I. Embedded-atom method: Derivation and application to impurities, surfaces, and other defects in metals. Phys. Rev. B 1984, 29, 6443. [Google Scholar] [CrossRef]
  36. Wang, Y.; Jin, Z. Hydrocarbon mixture and CO2 adsorptions in a nanopore-bulk multiscale system in relation to CO2 enhanced shale gas recovery. Chem. Eng. J. 2021, 415, 128398. [Google Scholar] [CrossRef]
  37. Wang, S.; Yao, X.; Feng, Q.; Javadpour, F.; Yang, Y.; Xue, Q. Molecular insights into carbon dioxide enhanced multi-component shale gas recovery and its sequestration in realistic kerogen. Chem. Eng. J. 2021, 425, 130292. [Google Scholar] [CrossRef]
  38. Adewumi, K.; Babatunde, B.; Mamo, N.; Rashik, M.; Ahmed, T.Y.; Regassa, J.S. Molecular simulation study of CO2/CH4 adsorption on realistic heterogeneous shale surfaces. Appl. Surf. Sci. 2021, 543, 148789. [Google Scholar] [CrossRef]
  39. Li, J.Q.; Lu, S.F.; Cai, J.C.; Zhang, P.F.; Xue, H.T.; Zhao, X.B. Adsorbed and Free Oil in Lacustrine Nanoporous Shale: A Theoretical Model and a Case Study. Energy Fuels 2018, 32, 12247–12258. [Google Scholar] [CrossRef]
  40. Kirsanov, A.M.; Komkov, I.K.; Paizanskaya, I.L. Geochemical methods for prediction and assessment of shale oil resources: Case study of the bazhenov formation. Russ. Geol. Geophys. 2017, 58, 403–409. [Google Scholar] [CrossRef]
  41. Isaksen, G.H. Central North Sea hydrocarbon systems: Generation, migration, entrapment, and thermal degradation of oil and gas. AAPG Bull. 2004, 88, 1545–1572. [Google Scholar] [CrossRef]
  42. Cao, H.; Zou, Y.; Lei, Y.; Xi, D.; Wan, X. Shale oil assessment for the Songliao basin, northeastern China, using oil generation-sorption method. Energy Fuels 2017, 31, 4826–4842. [Google Scholar] [CrossRef]
  43. Fang, R.; Jiang, Y.Q.; Yang, C.C.; Wang, Z.L.; Sun, S.S. Geological characteristics of shale oil in the Jurassic Lianggaoshan Formation in Sichuan Basin. China Pet. Explor. 2023, 28, 66–78. [Google Scholar]
  44. Huang, S.; Ma, X.; Yang, H.; Wu, J.; Zhang, J. Experimental characterization and molecular modeling of kerogen in Silurian deep gas shale from southern Sichuan Basin, China. Energy Rep. 2022, 8, 1497–1507. [Google Scholar] [CrossRef]
  45. Wang, X.H.; Huang, X.F.; Lin, K.; Zhao, Y.P. The constructions and pyrolysis of 3D kerogen macromolecular models: Experiments and simulations. Glob. Chall. 2019, 3, 1900006. [Google Scholar] [CrossRef]
  46. Wang, X.H.; Huang, X.F.; Gao, M.N.; Zhao, Y.P. Mechanical response of kerogen at high strain rates. Int. J. Impact Eng. 2021, 155, 103905. [Google Scholar] [CrossRef]
  47. Hou, D.L.; Qiu, X.D.; Gong, F.M.; Dejam, M.; Nasrabadi, H. Characterization of kerogen molecular structure and its effect on methane adsorption behavior: A comparative study on outcrop and core samples from Longmaxi shale. Chem. Eng. J. 2023, 466, 143293. [Google Scholar] [CrossRef]
  48. Meunier, M.; Robertson, S. Materials Studio 20th anniversary. Mol. Simul. 2021, 47, 537–539. [Google Scholar] [CrossRef]
  49. Dou, X.J.; Dai, J.J.; Peng, M.G.; He, Y.F.; Zhu, P.F. Study on the adsorption and deformation laws of multi-components in shale oil with nanopores—Insights from the molecular simulation. J. Pet. Explor. Prod. Technol. 2024, 14, 3091–3109. [Google Scholar] [CrossRef]
  50. Cui, S.T.; McCabe, C.; Cummings, P.T.; Cochran, H.D. Molecular dynamics study of the nano-rheology of n-dodecane confined between planar surfaces. J. Chem. Phys. 2003, 118, 8941–8944. [Google Scholar] [CrossRef]
  51. Plimpton, S. Fast Parallel Algorithms for Short-Range Molecular Dynamics. Comput. Phys. 1995, 117, 1–19. [Google Scholar] [CrossRef]
  52. Zhang, Y.N.; Li, R.C.; Yu, S.C.; Guo, M.Z.; Yan, Y.G. Screening and verification of molecular force field based on physical property simulation of deep oil. J. China Univ. Pet. 2020, 44, 163–169. [Google Scholar]
  53. Curtis, M.E.; Sondergeld, C.H.; Rai, C.S. Relationship between organic shale microstructure and hydrocarbon generation. In Proceedings of the SPE Unconventional Resources Conference/Gas Technology Symposium, The Woodlands, TX, USA, 10–12 April 2013; p. SPE-164540-MS. [Google Scholar]
  54. Liu, W.D.; Liu, J.; Sun, L.H.; Li, Y.; Lan, X.Y. Influence of fluid boundary layer on fluid flow in low permeability oil fields. Sci. Technol. 2011, 29, 42–44. [Google Scholar]
  55. Ling, H.C.; Yang, Z.M.; Xiao, Q.H.; Xu, Q.Y. Study on new porous flow model in tight oil formation. Sci. Technol. Eng. 2013, 13, 7624–7628. [Google Scholar]
  56. Philippe, U.; Julien, C.; Marianna, Y. Molecular Modeling of the Volumetric and Thermodynamic Properties of Kerogen: Influence of Organic Type and Maturity. Energy Fuels 2015, 29, 91–105. [Google Scholar]
  57. Katritzky, A.R.; Akhmedov, N.G.; Güven, A. gNMR simulated 1H and proton-coupled 13C NMR spectra of substituted 3-nitropyridines. GIAO/DFT calculated values of proton and carbon chemical shifts and coupling constants. J. Mol. Struct. 2006, 787, 131–147. [Google Scholar] [CrossRef]
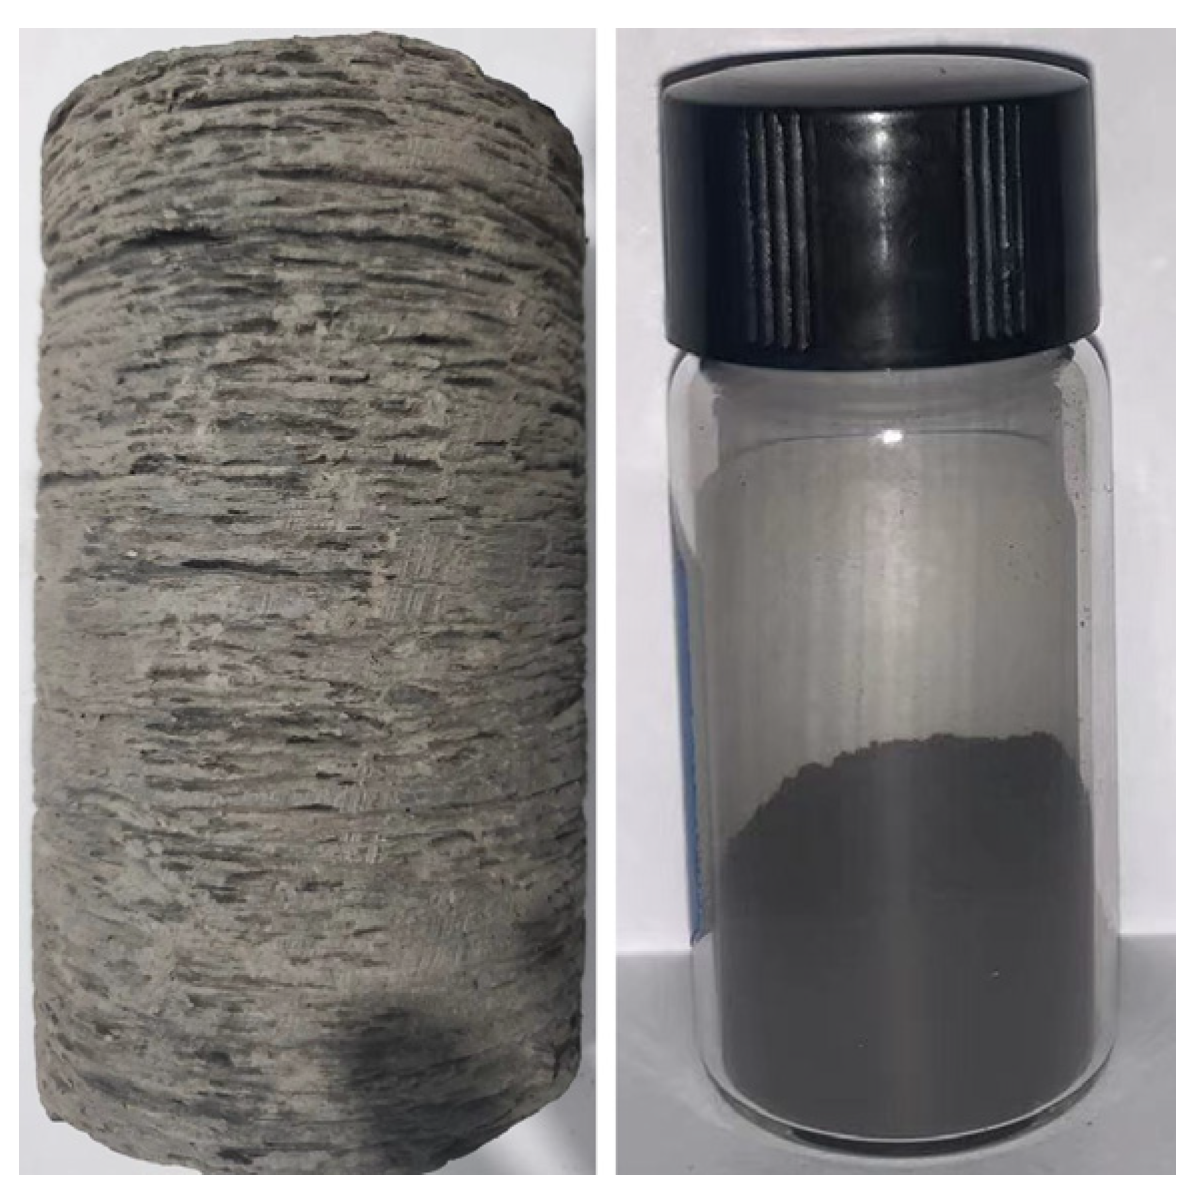
Figure 1. Shale cores and kerogen powder from Lianggaoshan Formation.
Energies 18 05695 g001
Figure 2. Flowchart of the molecular construction process of kerogen. PY-GC-MS provided constraints on the molecular fragment combinations; the formation of aromatic clusters was primarily guided by 13C NMR data, utilizing lattice parameters such as aromaticity (far), condensation degree (XBP), and aromatic substitution degree (δ). The aliphatic structure was determined mainly from FTIR and 13C NMR data, while heteroatom (O, N, and S) information was derived from XPS data. The aromatic backbone, aliphatic chains, and heteroatoms were iteratively adjusted to ensure that the constructed model exhibited strong consistency with experimental results.
Energies 18 05695 g002
Figure 3. Diagram illustrating the adsorption (a), For a pore of radius R (slit half-width or cylinder radius), an adsorption film of thickness H forms at the wall, reducing the free core to the Kelvin radius r k R H (per wall), which governs capillary condensation at a given T and ρ / ρ 0 . and occurrence (b), the bracketed widths d1 and d2 indicate the adsorption-dominated and coexistence ranges, respectively. d a 2 H ( T ) is the characteristic diameter at which adsorption layers cease to overlap, and dmax is the upper bound of the measured pore sizes of hydrocarbons within pores.
Energies 18 05695 g003
Figure 4. FTIR profiles of kerogen from Lianggaoshan shale. FTIR spectrum and assignments: 2850–2960 cm−1 (aliphatic CH2/CH3 stretching), 1350–1480 cm−1 (aliphatic CHx bending), ~1600 cm−1 (aromatic C=C stretching), 1030–1260 cm−1 (C–O/C–O–C stretching), and 700–900 cm−1 (aromatic C–H out-of-plane). pink = oxygenated, yellow = aromatic, cyan = aliphatic.
Energies 18 05695 g004
Figure 5. Wavenumber range of 700–900 cm−1 (a), Components near ~740, ~795, and ~835 cm−1 indicate para-, meta-, and ortho- substitution patterns, respectively. and (b) 1000–1800 cm−1 C-O/C-O-C stretching (1030–1260 cm−1, pink), aliphatic CHx bending (1350–1480 cm−1, cyan), and aromatic C=C (~1600 cm−1, yellow).
Energies 18 05695 g005
Figure 6. Solid-state 13C NMR spectrum (a), and peak fitting diagram (b) of the kerogen from Lianggaoshan shale. Shaded regions mark the conventional chemical-shift domains: 0–90 ppm (aliphatic sp3 C; CH3/CH2 and O-alkyl), 90–165 ppm (aromatic/olefinic sp2 C; protonated ~110–130 ppm and bridge/condensed ~130–160 ppm), and 165–220 ppm (carboxyl/carbonyl C; COO ~165–185 ppm and C=O ~190–220 ppm).
Energies 18 05695 g006
Figure 7. X-ray photoelectron spectra of kerogen from Lianggaoshan Formation. Labeled core levels confirm the surface composition: C 1s (~285 eV), O 1s (~532 eV), N 1s (~400 eV), S 2s (~227 eV), S 2p (~164 eV), F 1s (~685 eV), and O 2s (~20–25 eV). The inset table reports atomic percentages from the survey: C 85.18 at%, O 11.93 at%, N 1.72 at%, S 1.52 at%, F < 1 at%.
Energies 18 05695 g007
Figure 8. X-ray photoelectron spectroscopy of kerogen in C1s (a), F1s (b) N1s (c), and S2p (d), respectively. Peak positions: C–C/C–H (~284.8 eV), C–O/C–N (~286.2 eV), C=O (~287.6 eV), O–C=O (~288.8–289.2 eV); N species at ~398.6 (pyridinic), ~400.0–400.5 (pyrrolic), ~401.0–401.5 eV (Amine); S2p split into 163.8 (thiophene), 166.1 (sulfoxide), 169.8 (sulfone).
Energies 18 05695 g008
Figure 9. The molecular configuration of kerogen (a), color code for elements: C = grey, O = red, N = blue, S = yellow; H omitted for clarity and (b) comparison between the experimental spectrum and the simulated profile based on the constructed 2D kerogen structure.
Energies 18 05695 g009
Figure 10. (a) Single kerogen unit (3D) constructed from the chemically constrained 2D formula and hydrogenated for stability; (b) Multiple units were packed into a periodic box and energy-minimized to remove bad contacts and obtain a mechanically stable configuration at the target density; (c) The slab was thermally annealed and relaxed (periodic boundary conditions) to release residual stress and generate an amorphous surface topology and free volume representative of natural kerogen; (d) Two annealed slabs were duplicated and separated to form a slit pore (gap 2R), then the pore was then filled with n-dodecane. In the above molecular configuration, gray represents carbon atom, white represents hydrogen atom, blue represents nitrogen atom, yellow represents sulfur atom, and red represents oxygen atom.
Energies 18 05695 g010
Figure 11. Effect of pore size on (a) density distribution, the arrows indicate that as the pore size increases, the peak density of the adsorption layer first increases and then remains stable, and (b) diffusion velocity of shale oil.
Energies 18 05695 g011
Figure 12. Effect of temperature on (a) density distribution, the arrows indicate that the peak density of the adsorption layer continuously increases with increasing temperature, and (b) diffusion velocity of shale oil.
Energies 18 05695 g012
Figure 13. Effect of pressure on (a) density distribution, the arrow indicates that the peak density of the adsorption layer does not change significantly with pressure, and (b) diffusion velocity of shale oil.
Energies 18 05695 g013
Figure 14. Quantitative evaluation of shale oil under (a) pore size and (b) temperature conditions.
Energies 18 05695 g014
Table 1. Structural parameters of kerogen from Lianggaoshan Formation.
Structural ParameterCarbon FunctionalityPositionChemical Shift/ppmArea Fraction (%)
falmAliphatic methylCal-C*H316\
falAAromatic methylCar-C*H320\
falBAliphatic C(2) carbonC*H2-CH32517.34
falHMethyleneC*H233\
falDMethine, Quaternary sp3 carbonC*, C*H35–504.14
Oxygen-methyleneC*H2-O5518.26
falOOxygen-methineC*H-O62,691.69
Oxygen-aliphatic ringCal*-O83,89\
farAOxygen-aromatic ringCar*-Car-O99,1052.10
farHProtonated aromatic carbonCar-H100–129\
farBBridged aromatic carbonCar*-Car129–13946.51
farCBranched aromatic carbonCar*-Cal139–152\
farOOxygen-aromatic carbonCar*-O152–165\
faOCarboxyl, carbonylRC*=OR165–2209.94
* indicates the carbon atom whose 13C NMR chemical shift is reported; A backslash (\) denotes values not quantified separately.
Table 2. Lattice parameters derived from 13C NMR spectra of kerogen from Lianggaoshan Formation.
Lattice ParametersDescriptionDefinitionArea Fraction (%)
falAliphaticityfalm + falA + falB + falH + falD + falO19.46
farAromaticityfarA + farH + farB + farC + farO70.61
XBPDegree of condensationfarB/(farA + farH + farC + farO)22.11
BIAliphatic branch(falD + falO)/fal14.10
δAromatic substitution 1 − farH/far4.32
Table 3. Sensitivity analysis of average pore diameter (dm), adsorbed-phase density (ρ1), and free-phase density (ρ2).
ParametersPerturbationRa (3 nm Pore)Ra (5 nm Pore)
ρ1+10%+18%+12%
ρ1−10%−15%−10%
ρ2+10%−5%−2%
ρ2−10%+4%+1%
dm+10%−14%−8%
dm−10%+16%+10%
Disclaimer/Publisher’s Note: The statements, opinions and data contained in all publications are solely those of the individual author(s) and contributor(s) and not of MDPI and/or the editor(s). MDPI and/or the editor(s) disclaim responsibility for any injury to people or property resulting from any ideas, methods, instructions or products referred to in the content.