Abstract
Impedance methods are gaining importance each year and have recently become an essential tool for diagnosing batteries, capacitors, and fuel cells. In this article we present the results of validating the digital impedance bridge developed by the National Metrology Institute (GUM) in Warsaw, Poland. The comparison involved new impedance standards recently developed by GUM and the Silesian University of Technology (SUT), as well as standards developed by the Swiss National Metrology Institute (METAS). The comparison of the standard resistors and capacitors demonstrated agreement between the measurement results obtained with the Polish and Swiss sampling bridges, with a deviation of 5 µΩ/Ω in the frequency range from 500 Hz to 5 kHz.
1. Introduction
Impedance methods are playing an increasingly important role in electrical engineering [1,2]. One of the most promising and rapidly developing areas is the impedance diagnostics of batteries [3,4,5,6], driven by the large number of batteries entering the market. Lithium-ion batteries, for example, can have useful applications even after their initial use in electric vehicles, such as serving as low-cost energy storage media in conjunction with photovoltaic systems. However, this requires detailed diagnostics of their condition using non-destructive methods, where impedance diagnostic techniques prove to be invaluable.
To meet the growing demand for advanced impedance diagnostic methods, a dynamic development of reference impedance systems has been observed worldwide in recent years [7,8,9,10,11,12,13,14,15,16,17]. These systems, typically structured as balanced AC bridges, can utilize quantum Josephson voltage sources [7,8,9,10,11] to power the bridge arms and quantum Hall resistance standards [11] as reference impedances. Most of the systems mentioned above are adapted to four-terminal pair (4TP) connection, achieving the highest accuracy in impedance measurements [18,19,20].
An undeniable advantage of bridges powered by digital voltage sources (e.g., quantum sources or sources using direct digital synthesizers [21]) is their ability to compare impedances in the whole complex plane. Additionally, unlike transformer bridges, these systems can measure an unlimited number of points, allowing for full automation of the comparison process.
Although quantum voltage sources have become the foundation for a new generation of digital impedance bridges (such as those utilizing Josephson Arbitrary Waveform Synthesizers, JAWS, or Programmable Josephson Voltage Sources, PJVS [22]), the significant investment and maintenance costs mean that only the largest National Metrology Institutes (NMIs) can establish a quantum bridge. Therefore, smaller countries are developing non-quantum standards employing digital voltage sources as an alternative solution, leading to accuracy typically two orders of magnitude worse than quantum Josephson bridges.
There are two types of non-quantum impedance bridges, depending on the method used to determine the reference voltage ratio:
- (1)
- Generating bridges, where the reference voltage ratio is determined by the settings of the digital AC voltage generator [7,8,9,10,11];
- (2)
- Sampling (digitizing) bridges, where the impedance ratio is determined based on the voltage ratio measured by the analog-to-digital converter [14,15,23].
Generating bridges are more suitable for high-value impedance comparisons, while sampling bridges are better suited for low-value impedance comparisons [24].
Unfortunately, commercial sources of AC voltage typically do not meet the relevant metrological requirements, such as output voltage stability [25,26,27], and are rarely used as sources in impedance bridges requiring the aforementioned accuracy. As shown in [28], the standard deviation of the voltage ratio for the digital-to-analog converters used in the commercial NI PXI-4461 module is 2.3 μV/V. Consequently, some national metrology institutes have attempted to develop their own non-commercial solutions in collaboration with universities or electronic equipment manufacturers [29,30,31].
In the last decade, generating and sampling-based bridges have been implemented at national metrology institutes in Denmark (Trescal, sampling bridge [24,32]), Switzerland (METAS, sampling bridge [15]), Estonia (Metrosert, sampling bridge [32]), Ireland (NSAI, generating bridge [24,32]), and Italy (INRIM, generating bridge [14]). Moreover, metrology institutes in countries such as the USA (NIST) and Germany (PTB) are focusing on the development of quantum impedance bridges [8,9]. The latest solutions presented by scientists from NIST and PTB involve a bridge powered by a quantum Josephson source, using the quantum Hall standard based on graphene as a reference standard [11].
In this article, we present a solution being implemented at the Central Office of Measures (GUM, Warsaw, Poland). We focus on the bridge validation process, which is crucial for approving the new measurement system and integrating it into Poland’s national measurement system. This process is directly related to improving the calibration and measurement capability (CMC) in impedance measurement.
2. The 4TP Bridge
New digital technologies dedicated to digital bridges (such as direct frequency synthesis), developed as part of EURAMET research projects (specifically SIB53 AIM QuTE [29,31] and 17RPT04 VersICaL [32]), have demonstrated the potential to establish impedance scale at NMIs at a reduced cost. Following the presented research results, it was decided to develop a sampling-based impedance bridge system for GUM using an innovative digital source with extremally high stability. Figure 1 illustrates the schematic of the sampling bridge being developed at GUM. At equilibrium state (VL1 = VL2 = 0), attained by adjusting magnitude and phase of E2 and E0, the impedance ratio is related to the voltage ratio by the equation:
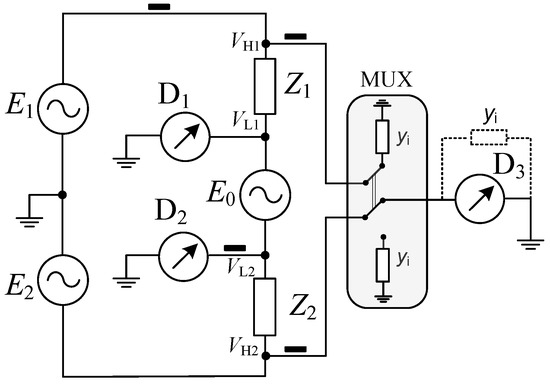
Figure 1.
Principle schematic of the 4TP bridge developed at GUM. Four black rectangles mark the current equalizers.
The measurement of the VH1 and VH2 is made by sampling the voltages using the D3 digitizer (NI PXI-4461), which is switched via the multiplexer MUX designed at SUT. The dual-output coaxial multiplexer utilizes high-quality latching relays with gold-plated contacts. Measurements made at SUT showed that contact resistance measured at 100 mA is at the level of 2 mΩ and switching time does not exceed 0.6 ms. The construction provides small crosstalk between the channels and switching for both inner and outer of the coaxial path. Furthermore, tuned dummy impedance elements (yi in Figure 1) avoid current redistribution when the MUX position changes.
The voltage E0 is injected into the circuit by DAC PXI-4461 using bespoke injection transformer with double electromagnetic shield between windings to avoid leakage between the DAC and the bridge circuit.
The most significant advantage and novelty of this system, compared to the alternative solutions presented in [14,15], is its use of a two-channel, precise, digitally synthesized AC voltage source. This source, described in detail in [30], was developed at the SUT as part of the AIM QuTE project [29,31]. The unique design of the AC voltage source with precisely stabilized temperature of the analog part shows the short-term stability of the output voltage amplitude ratio and phase difference at 1 kHz equal to 3 × 10⁻⁷ and 0.5 μrad, respectively.
The implementation of nanocrystal toroidal chokes at each mesh of the bridge was instrumental in ensuring the equalization of current within the coaxial cables. The system is computerized in its entirety. The management of data acquisition is overseen by a LabVIEW program. The transmission of data between PXI modules and a computer is facilitated by an optical link, thereby ensuring effective electrical insulation. The software utilizes a Quasi-Newton method [12] for the purpose of balancing the bridge.
Further details regarding the construction, synchronization, and balancing of the GUM bridge are given in [23].
3. The 4TP Impedance Standards
Manufacturers of capacitance and resistance standards very rarely include four coaxial connectors in their products. Capacitance standards are typically equipped with two BNC coaxial connectors; however, these connectors do not provide the reliability required for high-precision impedance measurements. This often forces NMIs to modify existing standards or even to construct new solutions with MUSA connectors that meet 4TP definition [33,34]. In recent years, the Polish NMI, GUM, has also started developing new 4TP standards and a 4TP comparator bridge. From 2018 to 2021, three sets of thermoregulated capacitors were successively built at GUM (see Figure 2). Two identical sets (bottom left) consist of five standards having nominal values from 1 nF to 10 μF, while the third set (in the upper row) contains a single 10 nF capacitor. All three sets use C0G SMD capacitors from Murata, Japan (series 1206 GMR31). Additionally, in 2021, two sets of standard resistors using Vishay H and HZ series elements (from 10 Ω to 100 kΩ) were developed at GUM (see Vishay-1XΩ in Figure 2) and SUT (see Figure 3). All the standards fabricated at GUM and SUT are equipped with coaxial MUSA silver-plated delivered by Canford, UK.
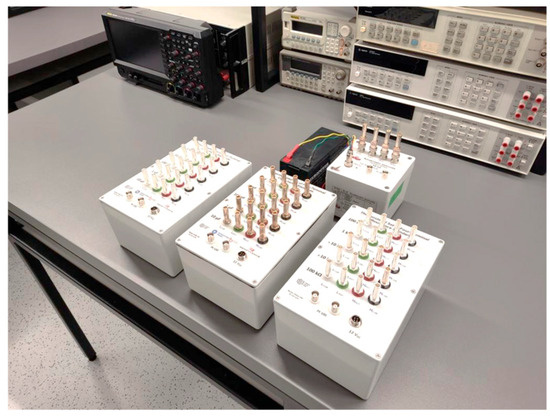
Figure 2.
The 4TP capacitance and resistance standards developed at GUM include two sets of thermoregulated capacitors and one set of thermoregulated Vishay resistors—located at the bottom from the left—and a 10 nF thermoregulated capacitor with a battery at the top.
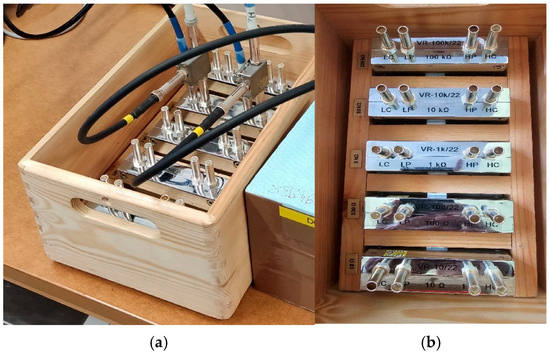
Figure 3.
Standard resistors manufactured at SUT: (a) fabricated in 2021, used by SUT, (b) fabricated in 2022, used at GUM. Both sets use Vishay resistors in brass body, terminated with BPO MUSA coaxial connectors.
The target uncertainty for the GUM bridge is at the level of a few μΩ/Ω. Therefore, considering the temperature coefficients of the Vishay and Murata components (with maximum values reaching 30 ppm/°C), thermoregulation of these components is necessary. Therefore, PID controlled thermostats with heating foils were designed and implemented to the resistance and capacitance standards. Assuming ambient temperature within the range 18–25 °C, the fabricated thermostats stabilize the internal temperature within 0.01 °C [35]. Maintaining temperature stability to within hundredths of a degree Celsius ensures that the influence of standard value changes caused by temperature drift can be neglected in the uncertainty calculation (30 ppm/°C × 0.01 °C = 0.3 ppm). The assumed operating frequency range of the standards spans from 20 Hz to 20 kHz.
Technical details (including construction stages) and results of temperature stability for the recently developed thermoregulated impedance standards are presented in [35].
Manufacturers of inductance standards generally do not equip their devices with four-terminal pair connectors; instead, they use binding post terminals with a standard spacing of ¾ inch (see Figure 4). This prompted GUM and SUT to develop and fabricate two-terminal binding post to four-terminal pair adapters (2T-4TP, see Figure 5a). At GUM, two different sizes of adapters were created to match the ¾-inch (US type) and 1-inch (Ukrainian type) connector spacings. Special attention was given to minimizing the capacitance of the adapters during the design process. This consideration is particularly important when comparing standards with large inductances (e.g., 1 H or 10 H), as the parallel capacitance of just a few fractions of a picofarad can cause significant changes in the inductance value. Capacitance measurements of the constructed adapters, performed at GUM using the high-performance AH2700A bridge, showed maximum capacitance values of 5 fF. Such a low capacitance allows us to neglect the influence of adapter capacitance on the calibration results, even for standards with values of 10 H.
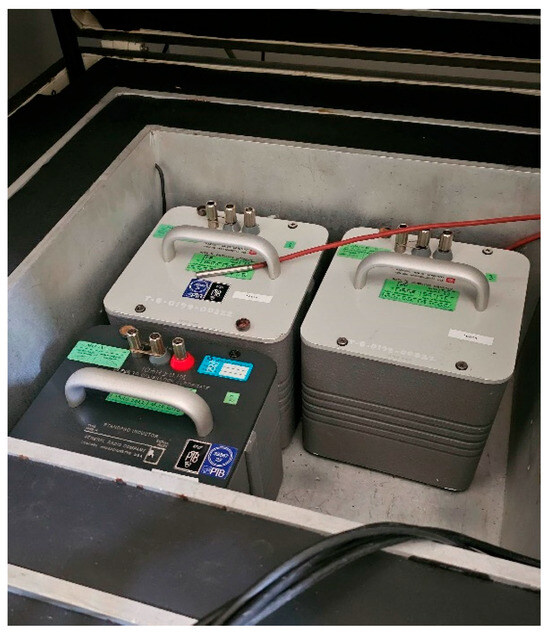
Figure 4.
Standard inductors type GR1482-x (1 mH, 10 mH, and 1 H), placed in thermostatic chamber. Property of GUM.
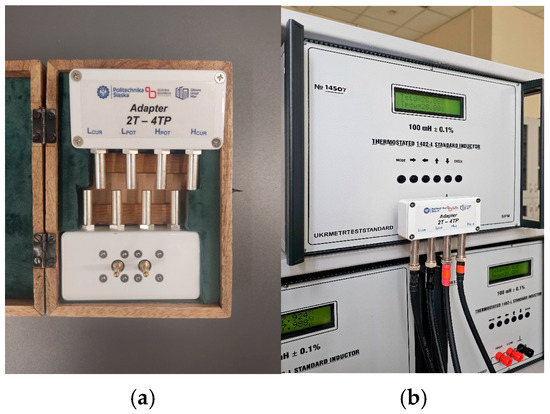
Figure 5.
The 2T-4TP adapters (a) and standard inductors GR1482-L in individual thermostats (b). Adapter connected to the upper standard. Property of GUM.
4. Validation of the Bridge
4.1. Methods
The validation of the GUM bridge commenced in 2020. The initial validation method employed was based on consistency checks and is referred to as the “triangle method” [36]. The primary benefit of this approach is that the reference value of each standard does not require prior knowledge; the standards merely need to maintain stability during the requisite three comparisons (typically R-C, C-L, and L-R). For the GUM impedance bridge, the duration is approximately 15 min. Initial comparison results obtained using the triangle method during the early stages of the bridge’s implementation at 1 kHz and 1592 Hz (reported in [37]) demonstrated that the uncertainty of the GUM bridge did not exceed 5 μΩ/Ω. Although the closing of triangles of impedance ratios is imperative for substantiating the accuracy of bridge measurements, it is insufficient for comprehensive validation of the bridge. It is due to the fact, that potential errors in voltage ratios may cancel each other out and thus remain undetected [10]. Therefore, additional experiments must be conducted using calibrated standards in order to demonstrate consistency between the results obtained with the tested system and the previously validated system.
Comparison of the bridge being currently implemented at GUM with the validated system was conducted at the Swiss Federal Institute of Metrology (METAS). METAS has extensive experience and the appropriate infrastructure for impedance comparison at the highest metrological level [7,10,13,14]. This infrastructure includes a sampling-based bridge that has been developed over several years and is well validated against many standards, including quantum standards. During a research stay, two comparison systems—the reference METAS sampling-based bridge and the GUM sampling-based bridge under test—were operated simultaneously in the same laboratory for three weeks. Several experiments were carried out during this time to fully validate the GUM bridge. Both the METAS impedance standards (4TP Haddad type [20] and the 4TP box with Vishay resistors, hereinafter referred to as the METAS “R” box) and the recently constructed GUM impedance standards (see Section 3) were used for the validation measurements.
As part of the GUM bridge validation, the following comparisons were made:
- Calibration of the METAS Haddad 1 kΩ No. 1202 by comparing it with the reference Haddad 1 kΩ No. 1201 at frequencies of 500 Hz, 1000 Hz, 1233 Hz, 1592 Hz, 2 kHz, 3 kHz, 4 kHz, and 5 kHz.
- Calibration of three SUT Vishay HZ-foil resistors (100 Ω, 1 kΩ, 10 kΩ) by comparing them with the reference METAS “R” box at frequencies of 500 Hz, 1000 Hz, 1233 Hz, 1592 Hz, 2 kHz, 3 kHz, 4 kHz, and 5 kHz.
- Calibration of four GUM standard capacitors (1 nF, 10 nF, 100 nF, and 1 µF from KC0G-1XF L-52-2/21) by comparing them with the reference METAS “R” box at frequencies of 1000 Hz, 1233 Hz, and 1592 Hz.
All of the aforementioned comparisons were conducted within a stabilized laboratory environment, where the temperature was maintained at (23.0 ± 0.2) °C.
4.2. Results
The comparison results are presented in Figure 6 and Figure 7. From the graphs, it can be concluded that the consistency of the results obtained with both bridges is below 5 μΩ/Ω. Additionally, when comparing resistances (Figure 6a–d) at frequencies below 3 kHz, the results agree within 1 μΩ/Ω. For frequencies 3 kHz, 4 kHz, and 5 kHz, larger differences in the results were observed between the two bridges, but they still did not exceed the target uncertainty of the bridge of 5 μΩ/Ω. Considering the uncertainty limits, only in four measurements (at 5 kHz, 3 kHz, 5 kHz, and 4 kHz in Figure 6a, 6b, 6c, and 6d, respectively) did the results obtained with the GUM bridge differ from those obtained with the METAS bridge by more than the uncertainty values derived from the standard deviations. The reason for some discrepancies between the METAS and GUM bridge results for frequencies from 3 kHz to 5 kHz may be the greater instability of the amplitude ratio and phase difference of the AC voltage source for higher frequencies, as well as the effect of the decreasing number of samples per period when measuring the complex voltage ratio.
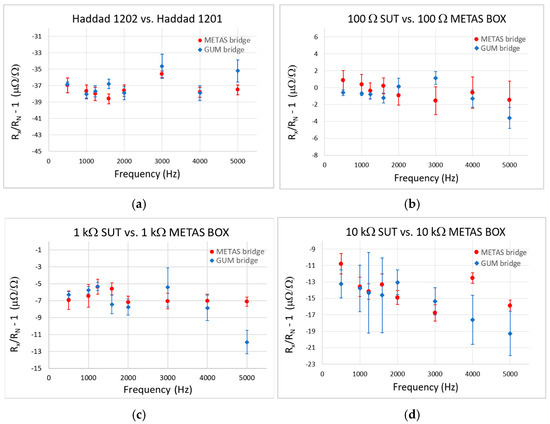
Figure 6.
Comparison results for calibration of standard resistors: (a) calibration of Haddad 1 kΩ No. 1202, (b) calibration of 100 Ω SUT Vishay resistor, (c) calibration of 1 kΩ SUT Vishay resistor, (d) calibration of 10 kΩ SUT Vishay resistor. The uncertainty bars represent the type-A uncertainty.
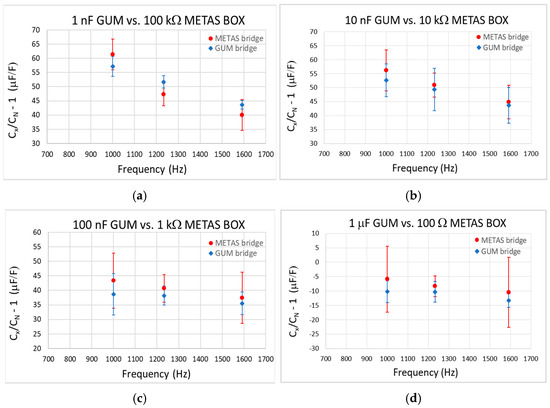
Figure 7.
Comparison results for calibration of GUM capacitance standard from KC0G-1XF L-52-2/21 set.: (a) calibration of 1 nF capacitor, (b) calibration of 10 nF capacitor, (c) calibration of 100 nF capacitor, (d) calibration of 1 mF capacitor. The uncertainty bars represent the type-A uncertainty.
As part of the comparison, the reactive components of the impedance, specifically the time constants of the resistors and the dielectric loss factors, were also analyzed. The results showed an agreement within 0.2 ns (for the time constants τ) and 3 × 10⁻⁶ for tgδ.
In addition to the comparative studies presented above, a repeatability test was also performed. Repeatability measurements were taken at two-day intervals for one pair of SUT standards (100 nF and 1 kΩ) for two frequencies: 1 kHz and 1592 Hz. The measurement results are presented in Table 1. The obtained results indicate that the GUM bridge has a repeatability of better than 1 µΩ/Ω.
Validation tests of the 4TP sampling GUM bridge continued using a new set of Vishay resistors (Figure 3b), a set of thermoregulated capacitors KC0G-1XF L-52-2/21 (Figure 2), and a set of inductance standards (Figure 4 and Figure 5). Both the resistance and capacitance standards were calibrated at METAS. The resistors were calibrated in terms of the quantized Hall resistance using a potentiometric measurement bridge with an uncertainty of 0.3 μΩ/Ω, while the capacitors were calibrated by comparison to a reference resistor using a sampling technique, with uncertainty ranging from 1 μF/F to 200 μF/F, depending on frequency and capacitance value. The standard inductors were calibrated at the PTB (Germany) using a Maxwell–Wien bridge, with uncertainty ranging from 5 μH/H to 40 μH/H, depending on the inductance value. Using these calibrated standards, validation tests of the GUM bridge were performed. R-L and R-C comparisons were made in the frequency range from 159 Hz to 10 kHz, using the Vishay resistors as reference standards. The results are presented in Figure 8, Figure 9, Figure 10, Figure 11, Figure 12 and Figure 13, showing the relative deviations of the GUM results from the reference results obtained at PTB or METAS.
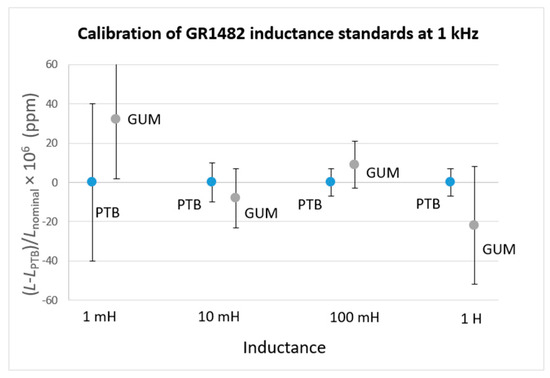
Figure 8.
Calibration results of GR1482 GUM inductance standards.
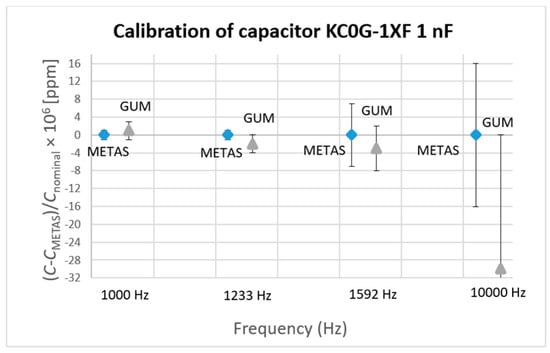
Figure 9.
Calibration results of 1 nF capacitor KC0G-1XF.
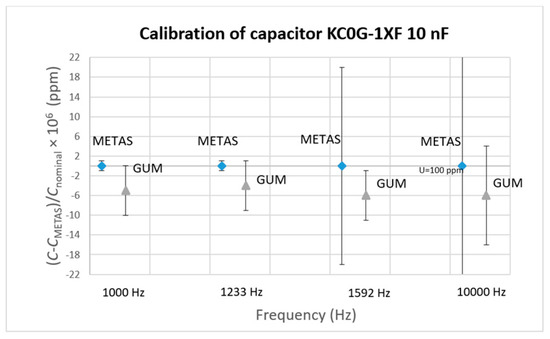
Figure 10.
Calibration results of 10 nF capacitor KC0G-1XF.
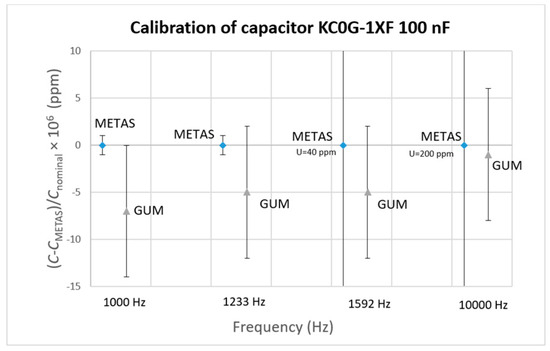
Figure 11.
Calibration results of 100 nF capacitor KC0G-1XF.
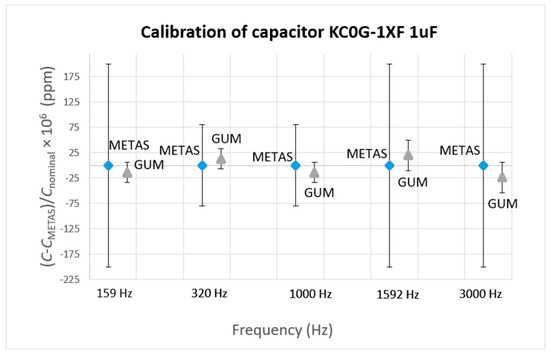
Figure 12.
Calibration results of 1 μF capacitor KC0G-1XF.
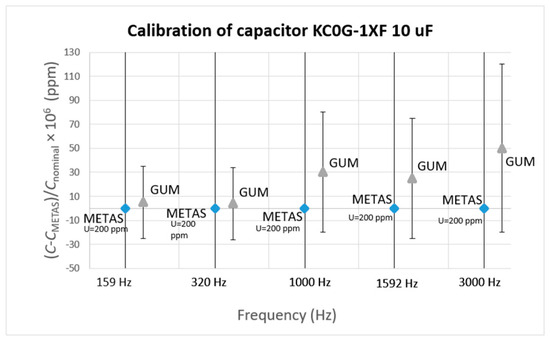
Figure 13.
Calibration results of 10 μF capacitor KC0G-1XF.
4.3. Uncertainty Budget
The uncertainty budget of the developed sampling-based bridge is closely related to the types and values of the measured impedance. Analyzing all comparison cases is beyond the scope of this paper. Below, the R-L comparison case is analyzed, and the relevant equations are given. Subsequently, the uncertainty calculation for calibrating a 100 mH inductance standard at 1 kHz is presented. The choice of this standard is dictated by the high popularity of this type of calibration.
Assuming that the top reference impedance is a resistance given by Z1 = R1 (1 + jwt) and the bottom inductive element is given by Z2 = Rs + jw Ls, considering Equation (1) the series components Ls and Rs of the UUT can be expressed by the following:
Since the residual parameters of impedance standards are not subject to uncertainty assessment, in further considerations we will focus only on the main impedance component of the standard. The use of the general law of uncertainty propagation yields:
where for simplification we used and .
In addition to these five components of (4), a digitizer nonlinearity has to be considered. Uncertainty budget is given in Table 2 with appropriate explanation in the text after the table.

Table 2.
Relative uncertainty components in μH/H for calibration of 100 mH standard inductor.
- 1 & 2. Reference resistor
- A set of reference resistors with values from 10 Ω to 100 kΩ is typically used for the calibration of inductance and capacitance standards. Vishay HZ-foil resistors (see Figure 3) referred at METAS to the QHR shown in Figure 3 have been applied. The uncertainty of the determination of the value for 1 kΩ resistor used as reference for 100 mH is estimated at 1.5 × 10⁻⁶. The uncertainty of the time constant is 5 ns.
- 3. Measuring frequency
- The signal source is synchronized with the PXI system equipped with timing and synchronization module PXI-6653. An extremely stable and accurate Oven Controlled Crystal Oscillator (OCXO) replaces the native 10 MHz oscillator on the PXI backplane. The relative accuracy of the signal frequency has been measured to be better than 1.2 μHz/Hz.
- 4 & 5. Measured voltage ratio
- Voltage ratio is measured by the digitizer AI0 of PXI-4461 switched between VH1 and VH2 ports. The ratio of coefficients of the Discretre Fourier Transform (DFT) gives the magnitude and the phase of the ratio of the fundamental components of VH1 and VH2. In order to evaluate the type-A uncertainty of the voltage ratio, the measurement sequence (balancing and measuring the voltages) is always repeated 10 times. Uncertainty components u(a) and u(b) are always determined separately for each comparison and displayed in the program window. The convergence threshold is always declared by the user before starting the measurement to be well below the expected measurement uncertainty. Furthermore, repeating the measurement 10 times removes the influence of this threshold, as the unbalance voltage vector moves in the complex plane. Therefore, the threshold was assessed to be negligible small compared to others uncertainty components.
- 6. Digitizer nonlinearity
- Nonlinearity of PXI digitizers used to measure voltage ratio is analyzed in Section 4.1. of [38]. According to the results obtained for digitizer AI0 at 1 kHz and 2.5 V, the nonlinearity error does not exceed 2 × 10⁻⁶.
5. Conclusions
The R-R and R-C comparisons conducted using the 4TP sampling-based bridges developed at METAS and SUT have demonstrated a high level of consistency in the results obtained. The agreement between both systems did not exceed the uncertainty values of the systems, with the A-type component—related to the uncertainty of the voltage ratio measurement—dominating. The results of the R-L and R-C comparisons performed using a new set of Vishay resistors showed very good alignment (within the range of 10−6 to 10−5) with the reference results obtained by renowned metrological institutes (PTB and METAS). Therefore, validation tests confirmed the GUM bridge’s capability to achieve the targeted uncertainty of 5 μΩ/Ω. The results presented in this article, which represent only a subset of the tests conducted to validate the new Polish 4TP digital bridge, demonstrate its high accuracy and suitability for standard comparisons at GUM. Currently, SUT and GUM are working on integrating the new bridge into the national measurement system, which involves developing an uncertainty budget for R-L and R-C comparisons and declaring a new CMC.
Author Contributions
Conceptualization, K.M.; methodology, M.K. (Marian Kampik) and K.M.; software, K.M.; investigation, K.M., A.Z., M.K. (Maciej Koszarny) and J.J.; resources, K.M., M.K. (Marian Kampik), M.K. (Maciej Koszarny), A.Z., and J.J.; data curation, K.M.; writing—original draft preparation, K.M.; writing—review and editing, M.K. (Marian Kampik), A.Z., M.K. (Maciej Koszarny), and J.J.; supervision, M.K. (Marian Kampik); funding acquisition, K.M. All authors have read and agreed to the published version of the manuscript.
Funding
Scientific work financed from the state budget under the program of the Minister of Education and Science called Polish Metrology (project number PM/SP/0029/2021).
Data Availability Statement
Measurement results are available on local disks and can be made available following an individual request by an interested person.
Acknowledgments
The authors would like to thank Frédéric Overney, METAS, Switzerland for fruitful discussions, providing access to the METAS infrastructure, and Krzysztof Kubiczek, SUT, Poland for the development of the sampling bridge software.
Conflicts of Interest
The authors declare no conflict of interest.
Abbreviations
The following abbreviations are used in the article:
| GUM | Central Office of Measures, Warsaw, Poland |
| SUT | Silesian University of Technology, Gliwice, Poland |
| METAS | Federal Institute of Metrology, Bern, Switzerland |
| PTB | Physikalisch-Technische Bundesanstalt, Brunswick, Germany |
| NMI | National Metrology Institute |
| CMC | Calibration and Measurement Capability |
| 4TP | Four-terminal pair, type of terminals |
| MUSA | Coaxial connectors for audio and metrology applications |
| QHR | Quantum Hall Resistor |
| PXI | PCI Extensions for Instrumentation |
| NI | National Instruments, manufacturer of automated equipment, Austin, USA |
References
- Barsoukov, E.; Macdonald, J.R. Impedance Spectroscopy: Theory, Experiment, and Applications; Wiley: Hoboken, NJ, USA, 2018. [Google Scholar]
- Kanoun, O. (Ed.) Impedance Spectroscopy/Advanced Applications: Battery Research, Bioimpedance, System Design; Springer: Berlin/Heidelberg, Germany, 2021. [Google Scholar]
- Moškon, J.; Žuntar, J.; Talian, S.D.; Dominko, R.; Gaberšček, M. A Powerful Transmission Line Model for Analysis of Impedance of Insertion Battery Cells: A Case Study on the NMC-Li System. J. Electrochem. Soc. 2020, 167, 140539. [Google Scholar] [CrossRef]
- Mašlán, S.; He, H.; Bergsten, T.; Seitz, S.; Heins, T.P. Interlaboratory comparison of battery impedance analyzers calibration. Measurement 2023, 218, 113176. [Google Scholar] [CrossRef]
- Meddings, N.; Heinrich, M.; Overney, F.; Lee, J.S.; Ruiz, V.; Napolitano, E.; Seitz, S.; Hinds, G.; Raccichini, R.; Gaberšček, M.; et al. Application of electrochemical impedance spectroscopy to commercial Li-ion cells: A review. J. Power Sources 2020, 480, 228742. [Google Scholar] [CrossRef]
- Xiao, Y.; Huang, X.; Meng, J.; Zhang, Y.; Knap, V.; Stroe, D.-I. Electrochemical Impedance Spectroscopy-Based Characterization and Modeling of Lithium-Ion Batteries Based on Frequency Selection. Batteries 2025, 11, 11. [Google Scholar] [CrossRef]
- Ortolano, M.; Marzano, M.; Overney, F.; Eichenberger, A.L.; Kucera, J.; D’Elia, V. An International Trilateral Comparison Among the Newest Generations of Digital and Josephson Impedance Bridges. IEEE Trans. Instrum. Meas. 2025, 74, 1501009. [Google Scholar] [CrossRef]
- Pimsut, Y.; Bauer, S.; Karus, M.; Behr, R.; Kruskopf, M.; Kieler, O.; Palafox, L. Development and implementation of an automated four terminal-pair Josephson impedance bridge. Metrologia 2024, 61, 025007. [Google Scholar] [CrossRef]
- Bauer, S.; Behr, R.; Hagen, T.; Kieler, O.; Lee, J.; Palafox, L.; Schurr, J. A novel two-terminal-pair pulse-driven Josephson impedance bridge linking a 10 nF capacitance standard to the quantized Hall resistance. Metrologia 2017, 54, 152–160. [Google Scholar] [CrossRef]
- Overney, F.; Flowers-Jacobs, N.E.; Jeanneret, B.; Rufenacht, A.; Fox, A.E.; Underwood, J.M.; Koffman, A.D.; Benz, S.P. Josephson-based full digital bridge for high-accuracy impedance comparison. Metrologia 2016, 53, 1045–1053. [Google Scholar] [CrossRef]
- Bauer, S.; Behr, R.; Elmquist, R.E.; Götz, M.; Herick, J.; Kieler, O.; Kruskop, M.; Lee, J.; Palafox, L.; Pimsut, Y. A Four-terminal-pair Josephson impedance bridge combined with a graphene-quantized Hall resistance. Meas. Sci. Technol. 2021, 32, 065007. [Google Scholar] [CrossRef]
- Mašláň, S.; Šíra, M.; Skalická, T.; Bergsten, T. Four-Terminal Pair Digital Sampling Impedance Bridge up to 1MHz. IEEE Trans. Instrum. Meas. 2019, 68, 1860–1869. [Google Scholar] [CrossRef]
- Overney, F.; Jeanneret, B. Impedance bridges: From Wheatstone to Josephson. Metrologia 2018, 55, 119–134. [Google Scholar] [CrossRef]
- Ortolano, M.; Palafox, L.; Kučera, J.; Callegaro, L.; D’Elia, V.; Marzano, M.; Overney, F.; Gülmez, G. An international comparison of phase angle standards between the novel impedance bridges of CMI, INRIM and METAS. Metrologia 2018, 55, 499–512. [Google Scholar] [CrossRef]
- Overney, F.; Jeanneret, B. RLC Bridge Based on an Automated Synchronous Sampling System. IEEE Trans. Instrum. Meas. 2011, 60, 2393–2398. [Google Scholar] [CrossRef]
- Kim, D.B.; Shin, S.S.; Kim, W.-S.; Kucera, J. A Digital Bridge Evaluation up to 100 kHz for Precision Impedance Measurements. IEEE Trans. Instrum. Meas. 2023, 72, 1004805. [Google Scholar] [CrossRef]
- Kim, D.B.; Kim, W.-S. Performance Study of a Digital Impedance Bridge on the basis of Capacitance Measurements in Audio Frequency. In Proceedings of the 2020 Conference on Precision Electromagnetic Measurements (CPEM), Denver, CO, USA, 24–28 August 2020; pp. 1–2. [Google Scholar]
- Awan, S.; Kibble, B.; Schurr, J. Coaxial Electrical Circuits for Interference-Free Measurements (Electrical Measurement); IET: Edison, NJ, USA, 2010. [Google Scholar]
- Callegaro, L. Electrical Impedance: Principles, Measurement and Applications, 1st ed.; CRC Press: Boca Raton, FL, USA, 2012. [Google Scholar]
- Kibble, B.P. Four terminal-pair to anything else! In Proceedings of the IEE Colloquium Interconnections from DC Microwaves (Ref. No. 1999/019), London, UK, 18 February 1999; pp. 6/1–6/6. [Google Scholar]
- Kampik, M. High Performance Digitally Synthesized Source for Very Low-Frequency AC Voltage Calibrator. In Proceedings of the IEEE Instrumentation & Measurement Technology Conference IMTC, Warsaw, Poland, 1–3 May 2007; pp. 1–6. [Google Scholar]
- Lee, J.; Schurr, J.; Nissila, J.; Palafox, L.; Behr, R.; Kibble, B.P. Programmable Josephson Arrays for Impedance Measurements. IEEE Trans. Instrum. Meas. 2011, 60, 2596–2601. [Google Scholar] [CrossRef]
- Musioł, K.; Kampik, M.; Ziółek, A.; Jursza, J. Experiences with a new sampling-based four-terminal-pair digital impedance bridge. Measurement 2022, 205, 112159. [Google Scholar] [CrossRef]
- Ortolano, M.; Marzano, M.; D’Elia, V.; Tran, N.T.M.; Rybski, R.; Kaczmarek, J.; Kozioł, M.K.; Christensen, A.E.; Callegaro, L.; Kučera, J.; et al. A Comprehensive Analysis of Error Sources in Electronic Fully Digital Impedance Bridges. IEEE Trans. Instrum. Meas. 2021, 70, 1500914. [Google Scholar] [CrossRef]
- Kozioł, M.; Kaczmarek, J.; Rybski, R. Characterization of PXI-based generators for impedance measurement setups. IEEE Trans. Instrum. Meas. 2019, 68, 1806–1813. [Google Scholar]
- Overney, F.; Rufenacht, A.; Braun, J.; Jeanneret, B.; Wright, P.S. Characterization of Metrological Grade Analog-to-Digital Converters Using a Programmable Josephson Voltage Standard. IEEE Trans. Instrum. Meas. 2011, 60, 2172–2177. [Google Scholar] [CrossRef]
- Kučera, J.; Kováč, J.; Palafox, L.; Behr, R.; Vojáčková, L. Characterization of a precision modular sinewave generator. Meas. Sci. Technol. 2020, 31, 064002. [Google Scholar] [CrossRef]
- Rybski, R.; Kaczmarek, J.; Kozioł, M. A High-Resolution PXI Digitizer for a Low-Value-Resistor Calibration System. IEEE Trans. Instrum. Meas. 2013, 62, 1783–1788. [Google Scholar] [CrossRef]
- SIB 53 AIM QuTE Final Publishable JRP Report. Automated Impedance Metrology Extending the Quantum Toolbox for Electricity. Euramet, June 2017. Available online: https://www.euramet.org/research-innovation/search-research-projects/details/project/automated-impedance-metrology-extending-the-quantum-toolbox-for-electricity (accessed on 1 June 2023).
- Kampik, M.; Musioł, K. Investigations of the high-performance source of digitally synthesized sinusoidal voltage for primary impedance metrology. Measurement 2021, 168, 108308. [Google Scholar] [CrossRef]
- Palafox, L.; Raso, F.; Kučera, J.; Overney, F.; Callegaro, L.; Gournay, P.; Ziółek, A.; Nissilä, J. AIM QuTE: Automated Impedance Metrology extending the Quantum Toolbox for Electricity. In Proceedings of the 16th International Congress of Metrology, Paris, France, 7−10 October 2013. [Google Scholar]
- 17RPT04 VersICaL Final Publishable JRP Report. A Versatile Electrical Impedance Calibration Laboratory Based on Digital Impedance Bridges. Euramet, 2020. Available online: https://www.euramet.org/research-innovation/search-research-projects/details/project/a-versatile-electrical-impedance-calibration-laboratory-based-on-digital-impedance-bridges (accessed on 1 June 2023).
- Dierikx, E.; Melcher, J.; Callegaro, L. Final report on the supplementary comparison EURAMET.EMS26: Inductance measurements of 100 mH at 1 kHz (EURAMET project 816). Metrologia 2012, 49, 01002. [Google Scholar] [CrossRef]
- Callegaro, L.; D’Elia, V.; Bohacek, J. Four-Terminal-Pair Inductance Comparison Between INRIM and CTU. IEEE Trans. Instrum. Meas. 2009, 58, 87–93. [Google Scholar] [CrossRef]
- Musioł, K.; Koszarny, M.; Kampik, M.; Kubiczek, K.; Ziółek, A.; Jursza, J. A new impedance metrology infrastructure at GUM. In Proceedings of the 25th IMEKO TC-4 Symposium, Brescia, Italy, 12–14 September 2022. [Google Scholar]
- Musioł, K.; Kampik, M. Metrological triangles in impedance comparisons. Measurement 2019, 148, 106908. [Google Scholar] [CrossRef]
- Musioł, K.; Kampik, M.; Koszarny, M. A new sampling based four-terminal-pair digital impedance bridge. Meas. Sens. 2021, 18, 100307. [Google Scholar] [CrossRef]
- Kampik, M.; Musioł, K.; Rybski, R.; Kaczmarek, J.; Kozioł, M.; Augustyn, J.; Ziółek, A.; Jursza, J.; Koszarny, M. An Improved Sampling-Based Impedance Bridge. Energies 2025, 18, 4733. [Google Scholar] [CrossRef]
Disclaimer/Publisher’s Note: The statements, opinions and data contained in all publications are solely those of the individual author(s) and contributor(s) and not of MDPI and/or the editor(s). MDPI and/or the editor(s) disclaim responsibility for any injury to people or property resulting from any ideas, methods, instructions or products referred to in the content. |
© 2025 by the authors. Licensee MDPI, Basel, Switzerland. This article is an open access article distributed under the terms and conditions of the Creative Commons Attribution (CC BY) license (https://creativecommons.org/licenses/by/4.0/).