1. Introduction
In the overall structure of power cables, the outer sheath, serving as the outermost protective component, plays a crucial role in resisting external environmental factors such as mechanical stress, moisture ingress, chemical corrosion, and ultraviolet aging. High-quality sheath materials not only effectively extend the service life of cables but also ensure the safety and stability of power systems under complex operating conditions. With the continuous development of power grids toward higher voltage levels, larger transmission capacity, and longer service life [
1], the performance requirements for outer sheaths have also been significantly raised. However, during long-term operation, outer sheaths are still prone to defects such as scratches, indentations, moisture intrusion, thermal aging, and chemical corrosion. If these defects cannot be detected and repaired in a timely manner, they often lead to a decline in insulation performance and may even trigger serious power failures [
2,
3,
4].
At present, the detection methods for cable outer sheaths mainly include direct current voltage tests, sheath current measurements [
5,
6], sheath potential difference measurements, and infrared thermography [
7]. These methods can identify sheath breakdown, moisture ingress, or localized mechanical damage to a certain extent; however, they generally suffer from limitations such as insufficient sensitivity, low positioning accuracy, and the inability to achieve online monitoring. For example, although DC voltage tests can reveal the overall withstand capability of the sheath, they are ineffective in detecting early-stage and minor defects [
8,
9,
10]; infrared thermography is highly sensitive to environmental conditions and struggles to detect hidden damage [
11]; and sheath current and potential difference measurements depend on the balance and integrity of the grounding system, making them susceptible to external interference and thus less reliable [
12,
13,
14]. With the increasing complexity of power grid operating environments, traditional sheath detection techniques can no longer satisfy the requirements for high sensitivity, strong robustness, and online identification of early defects. Therefore, exploring novel approaches that integrate leakage current harmonic features with intelligent algorithms to achieve efficient defect identification and condition assessment of cable outer sheaths remains a critical challenge in this field.
In recent years, researchers have increasingly introduced intelligent approaches into cable outer sheath defect detection to overcome the limitations of traditional electrical testing in terms of sensitivity and real-time capability. Among these, detection methods based on leakage current and its harmonic characteristics have become a major research focus. By performing multi-scale decomposition and frequency-domain feature extraction on current signals, the distortion effects of early sheath defects on current waveforms can be revealed. Khamlichi et al. [
13] proposed a sheath current–based detection method, in which MATLAB-based theoretical modeling and ATP simulations were employed to analyze the impact of defects on sheath currents. This study verified the feasibility of using sheath currents for defect detection, but the approach was constrained by the limited range of defect types, insufficient fault localization accuracy, heavy reliance on simulations, and oversimplified decision criteria. Hao Wang et al. [
15] conducted experimental studies on thermal aging, metal shielding damage, and outer sheath damage, and applied an improved FFT algorithm to analyze the harmonic characteristics of grounding currents. Their results showed that different defects exhibit distinctive harmonic distributions and that the total harmonic distortion (THD) increases approximately linearly with defect severity. However, in practical applications, such methods are vulnerable to background harmonics, load fluctuations, and environmental noise, which reduces their stability and robustness. Moreover, they fail to fully exploit the multidimensional relationships among harmonic features for defect characterization. More recently, graph neural networks (GNNs), with their ability to jointly model spatial and temporal dependencies, have demonstrated strong potential in outer sheath defect detection, as they can capture intrinsic correlations among harmonic features while accounting for structural dependencies and dynamic evolution [
16,
17,
18]. Nevertheless, existing studies are still limited by insufficient data samples, weak model generalization, and the lack of standardized testing platforms. Therefore, developing detection methods that integrate the interpretability of physical mechanisms with the predictive power of data-driven approaches remains a critical challenge for the field of cable outer sheath condition monitoring.
This study employed finite element models to simulate the impact of outer sheath defects on cable leakage currents and proposed a harmonic feature recognition model based on a Graph Neural Network–Long Short-Term Memory (GNN-LSTM) architecture. The results demonstrate that the method can effectively identify cable outer sheath defects and achieve rapid and accurate detection of early-stage defects under complex operating conditions, significantly enhancing both sensitivity and practical applicability. By integrating harmonic spectral features with deep learning algorithms, the approach not only ensures high recognition accuracy but also reduces reliance on manual intervention, thereby providing a feasible technical pathway for intelligent and automated cable condition monitoring and laying a foundation for the development of online monitoring and intelligent operation and maintenance systems.
2. Electro–Thermal Coupled Modeling and the Mechanism of Leakage Current Response
When defects occur in the outer sheath of cables, local variations in geometry and material properties take place, which, in turn, alter the electric field distribution and leakage current characteristics. To quantitatively analyze these changes, an electro-thermal coupling model was developed in this study to simulate and explain the mechanisms by which defects influence leakage current.
Under a steady-state AC electric field, the current density in the outer sheath dielectric can be expressed as:
where
E is the electric field strength,
and
represent the temperature-dependent conductivity and permittivity, respectively, and
is the angular frequency. During cable operation, the Joule heat power density within the dielectric is given by:
The heat conduction process satisfies the energy conservation equation [
19]:
where
is the density,
is the specific heat capacity,
is the thermal conductivity,
is the convective heat transfer coefficient, and the
ambient temperature. The relationship between the electrical conductivity of the material and temperature can be approximated as linear:
where
is the temperature coefficient, and
represents the conductivity at the reference temperature.
When a voltage
V is applied to the cable and the metallic shield is grounded, the total leakage current can be expressed as:
The corresponding equivalent admittance is given by:
Under small perturbations induced by defects, the variations in equivalent conductance and susceptance can be approximated as:
where
is the electric field distribution in the intact outer sheath, and
and
represent the variations in conductivity and permittivity induced by defects, respectively. Equation (7) indicates that defects directly affect the equivalent admittance parameters by altering local material properties and the electric field energy density, thereby leading to changes in both the amplitude and phase of the leakage current.
From Equations (2)–(4), it can be seen that the electric field distortion in the defect region leads to local temperature rise, which in turn amplifies the variation in conductivity through the temperature coefficient, thereby forming an electro–thermal positive feedback. Under steady-state AC conditions, the equivalent conductance can be approximately expressed as:
where
is the equivalent thermal resistance, and
represents the conductivity at the reference temperature. When a sinusoidal voltage is applied, the leakage current from Equation (5):
where
Equation (9) demonstrates that electro–thermal nonlinearity introduces higher-order harmonic components into the leakage current, with their magnitudes being proportional to the degree of thermal feedback induced by defects. Consequently, the harmonic amplitudes and the total harmonic distortion can be employed as characteristic indicators to represent both the type and the severity of defects.
To reveal the mechanism by which outer sheath defects influence the characteristics of leakage current and to verify the above analysis, COMSOL (COMSOL Multiphysics 6.3) was employed to perform defect simulations. Finite element simulation enables the visualization of electric and thermal fields, as well as the model variations on defect morphology, material properties, and operating conditions. Based on this, an electro–thermal coupling model was established in COMSOL Multiphysics to systematically simulate the electric field distribution, temperature rise characteristics, and their effects on equivalent admittance and leakage current under different defect scenarios [
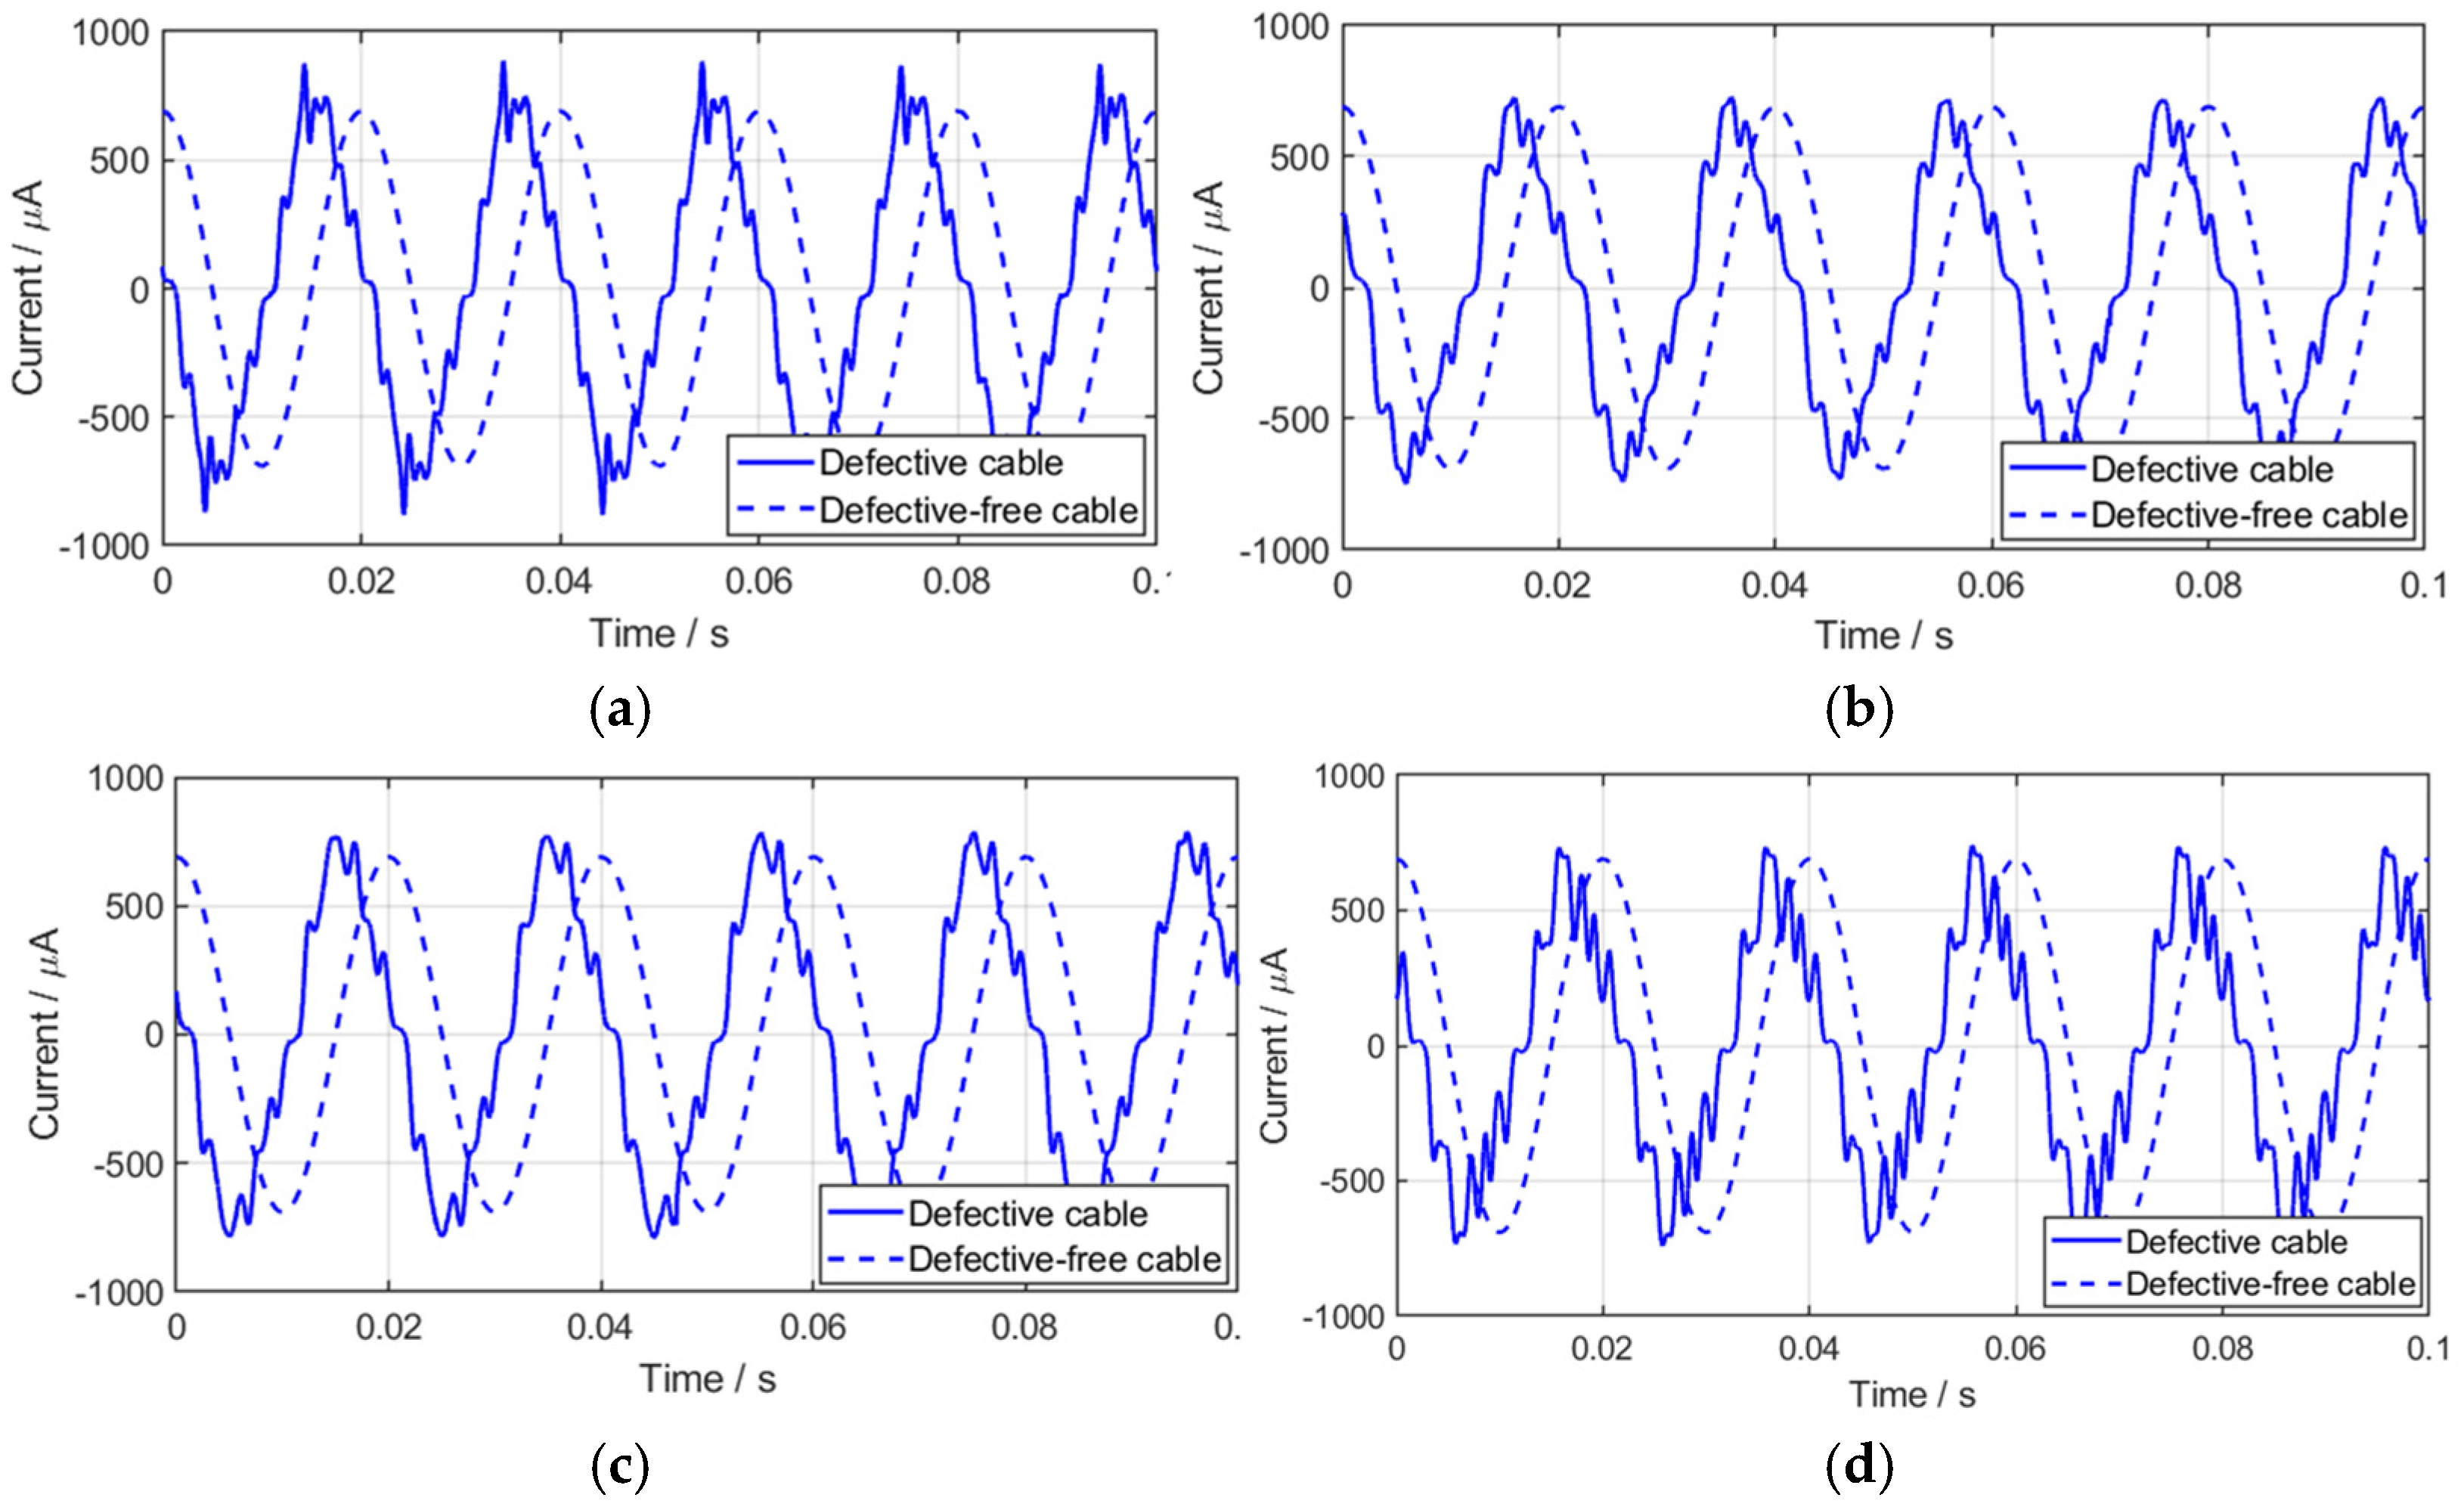
20]. The simulation conditions covered four typical defect cases: scratch-type defects, indentation-type defects, moisture-induced defects, and chemical corrosion defects.
Figure 1 illustrates four typical types of cable damage caused by external factors. Scratch-type defects occur when sharp objects cause grooves in the outer sheath, exposing the armor layer, which alters the electric field, accelerates insulation aging, and increases partial discharge risks. Indentation-type defects result from heavy loading or improper installation, causing permanent plastic deformation, stress concentration, and reduced bending tolerance and current-carrying capacity. Moisture-induced defects occur in high-humidity or submerged environments, where water penetrates micro-pores in the sheath, increasing conductivity and dielectric loss, thus shortening the cable’s lifespan. Chemical corrosion defects arise from corrosive agents infiltrating the sheath, causing polymer degradation and corrosion patches, which weaken the mechanical protection and waterproofing of the sheath, threatening the integrity of the metallic shielding and conductor [
21].
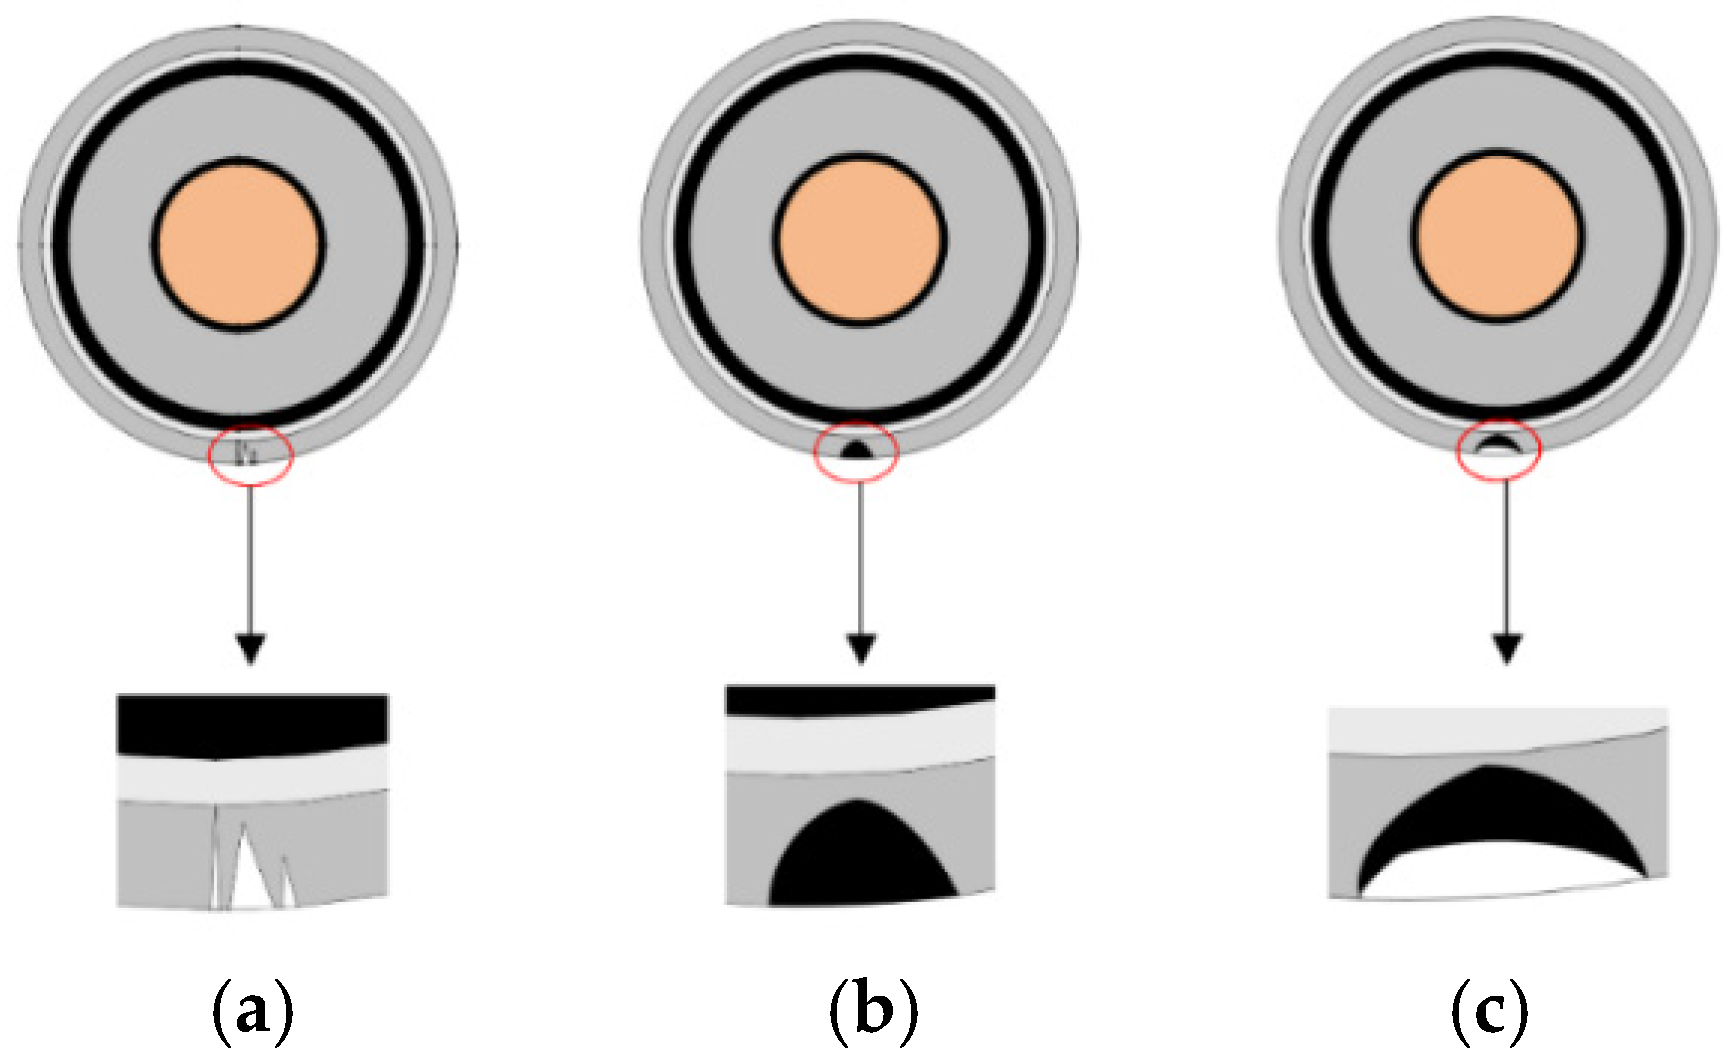
The cable consists of seven layers with varying materials and thicknesses, as shown in the table. From the innermost to the outermost, the structure includes: the copper conductor (external diameter of 30 mm), conductive shielding layer (thickness of 1.5 mm, external diameter of 33.4 mm), XLPE insulation layer (thickness of 16.5 mm, external diameter of 66.8 mm), insulation shielding layer (thickness of 1.2 mm, external diameter of 70.0 mm), semiconductor resistance-water buffer layer (thickness of 4.0 mm, external diameter of 73.8 mm), corrugated aluminum sheath (thickness of 2.0 mm, external diameter of 85.8 mm), and the outer cable sheath (thickness of 4.5 mm, external diameter of 95.2 mm). This multi-layer structure is designed to provide excellent conductivity, insulation, mechanical protection, and environmental resilience. Finite element simulation software (COMSOL Multiphysics 6.3) was used to model the four aforementioned defects, as illustrated in
Figure 2. In
Figure 2a, a triangular scratch defect was introduced in the outer sheath, with part of the groove extending deeply to contact the armor layer, simulating an extreme case of severe sheath damage and armor exposure. In
Figure 2b, an elliptical-arc–shaped corrosion defect was constructed to model the typical morphology of moisture ingress or chemical corrosion, enabling the evaluation of their effects on the protective performance of the sheath. In
Figure 2c, two elliptical-arc structures were modeled at an indentation site, where the white region indicates the air gap formed by compression, and the black region denotes the area of altered material properties, thereby reflecting the internal structural changes and performance degradation of the sheath under mechanical stress.
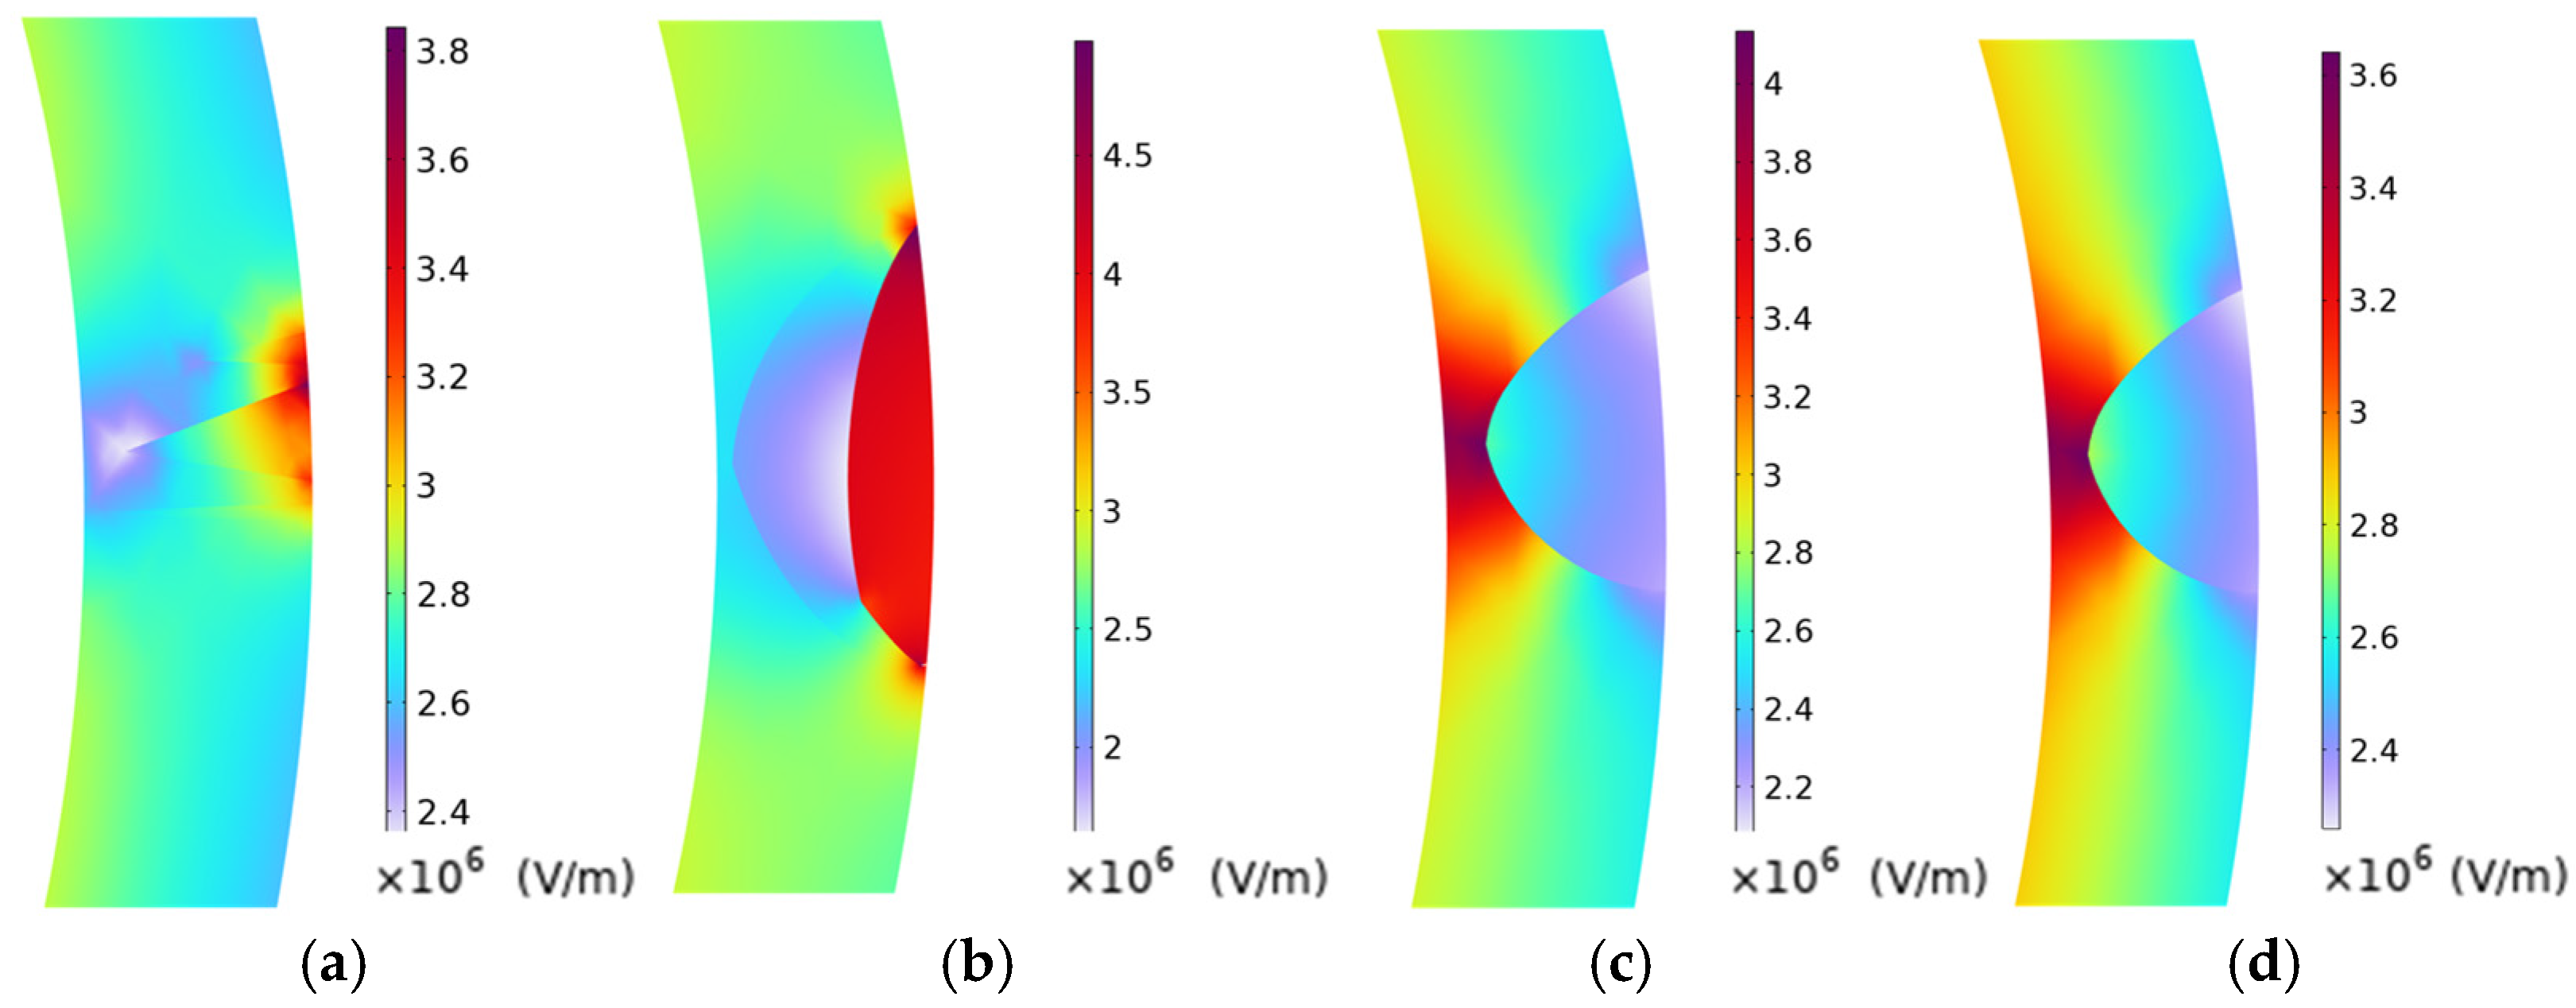
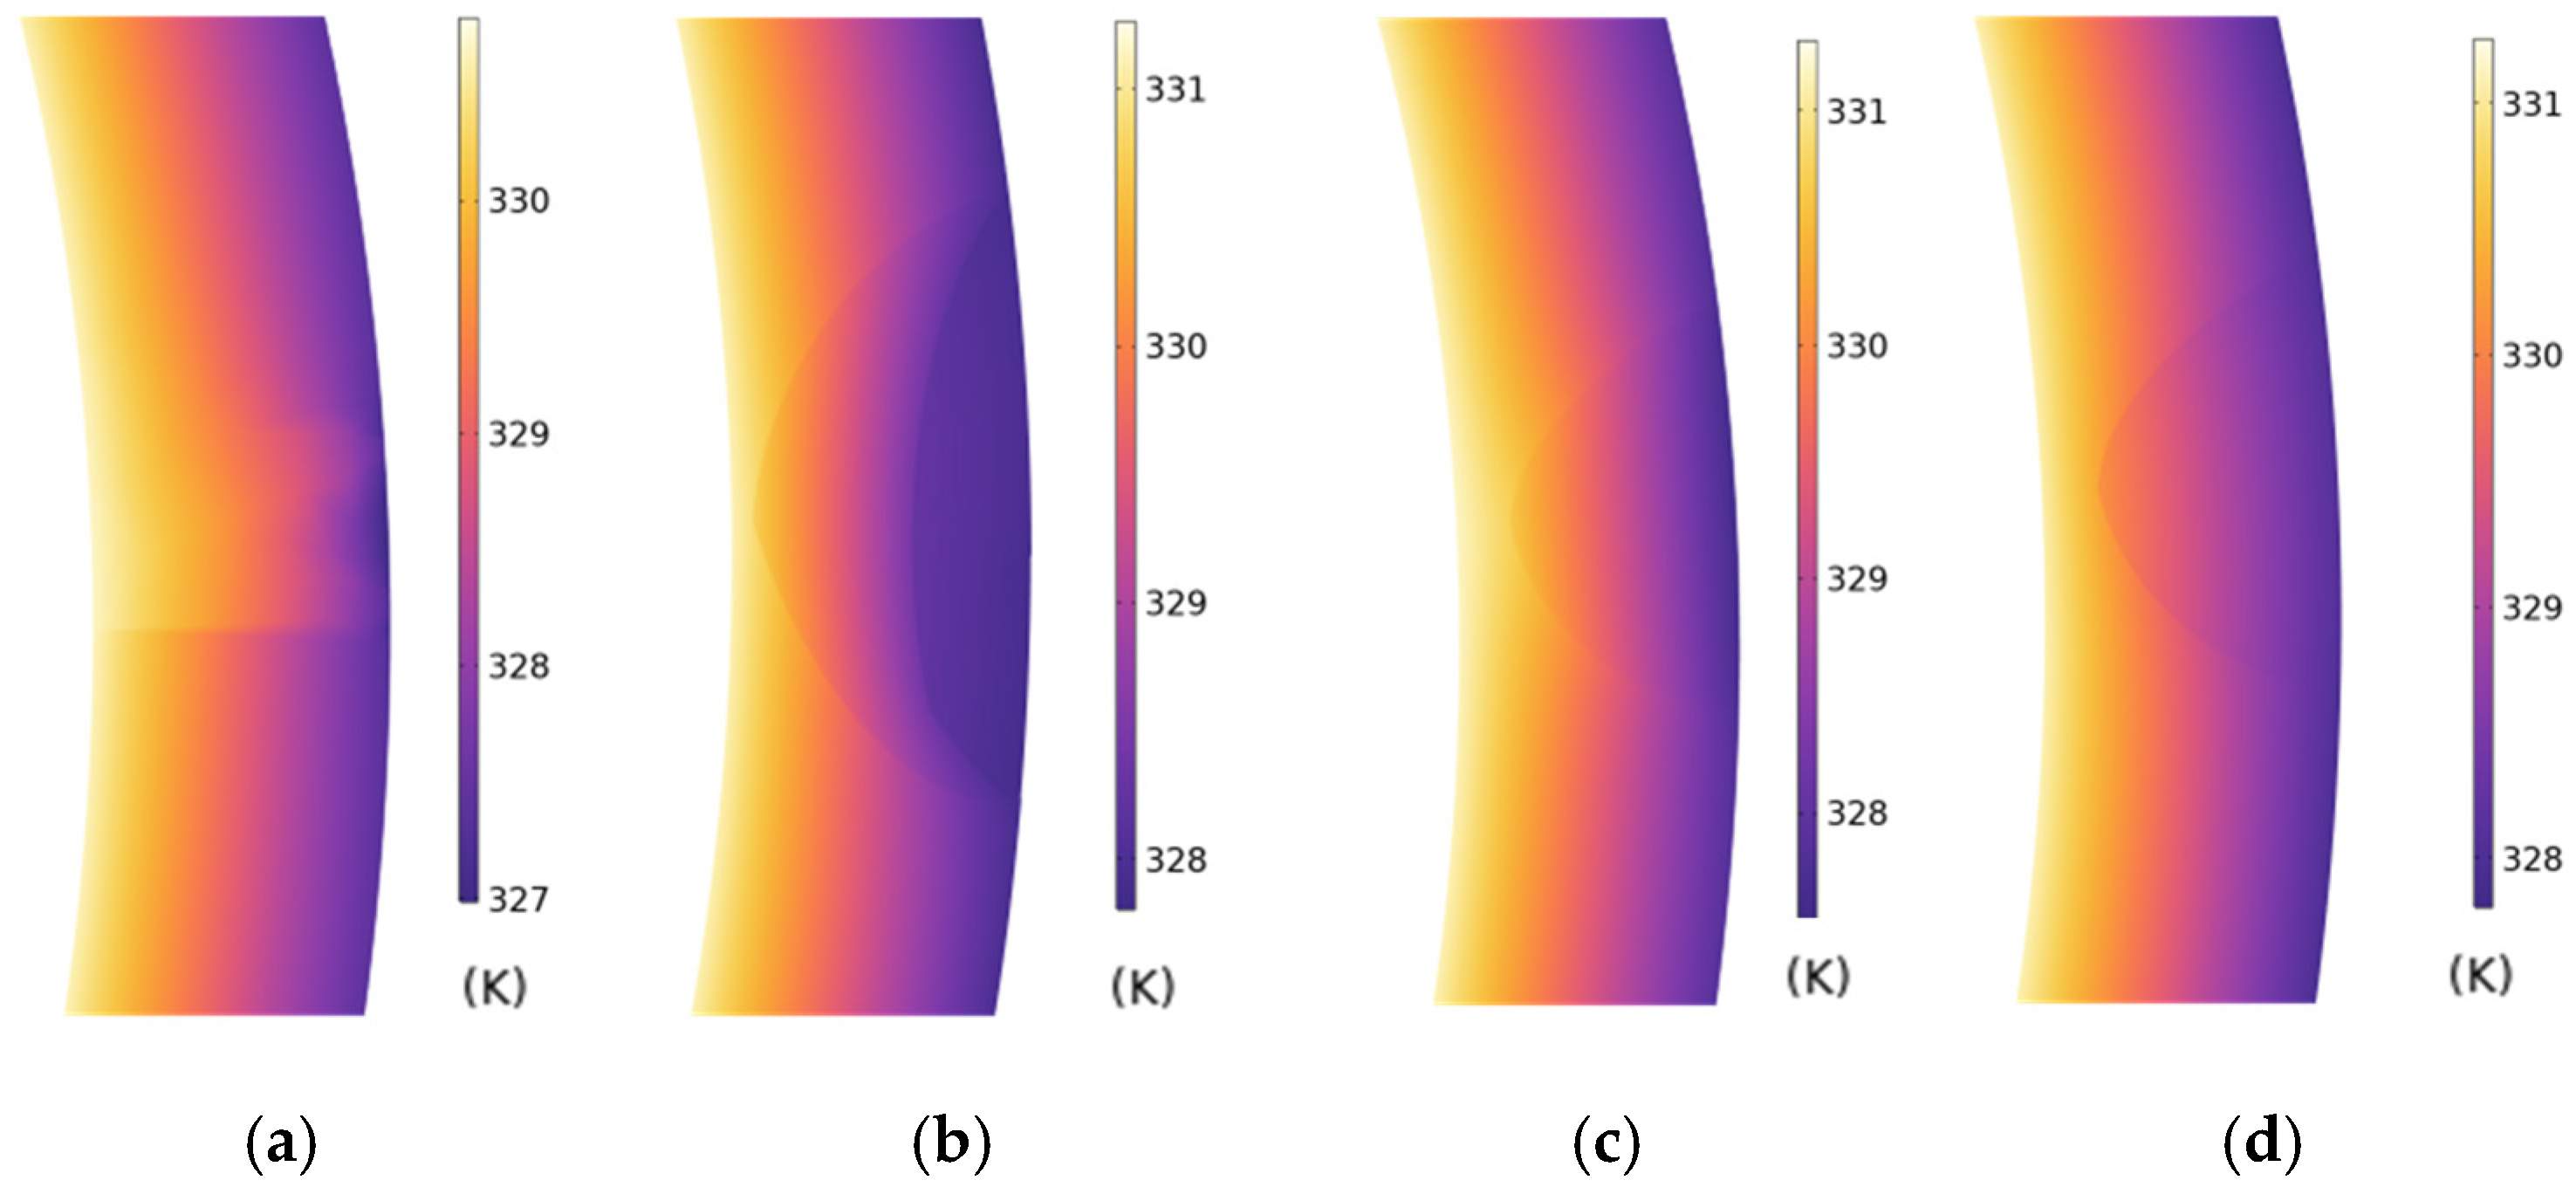
For clarity, local defect regions in the simulation results were magnified.
Figure 3 shows the local electric field distribution under four typical defect conditions: scratches, indentations, moisture ingress, and chemical corrosion. The results indicate that all defect types cause significant electric field distortion, though with distinct patterns. Scratch defects lead to strong field line convergence at the scratch tip, forming electric field peaks. Indentation defects create ring-shaped high-field concentrations at the edges, with a slight reduction in intensity at the center. Moisture-induced defects result in dielectric inhomogeneity as water infiltrates the sheath, bending and clustering field lines along the moisture boundary. Chemical corrosion defects cause field reconstruction at the degraded zones, creating strip-shaped high-field regions along the corrosion boundary, with a weakened electric field at the center. These phenomena emphasize the impact of geometric and dielectric property changes on local electric field distributions.
Figure 4 illustrates the temperature field distribution under the four typical defect scenarios. The simulation results reveal that all defects influence the temperature distribution within and near the defect regions; however, the overall magnitude of temperature variation remains relatively small. Scratch defects produce slight thermal perturbations at the defect tips, manifesting as a minor local temperature decrease. Indentation defects generate relatively lower temperature zones in the concave regions, while the temperature distribution along the edges shows little difference from the surrounding areas. Moisture-induced defects, due to changes in thermal conductivity, cause temperature reduction within the moisture-affected region, with high–low temperature interfaces coinciding with the moisture boundaries. Chemical corrosion defects exhibit a mild cooling trend inside the corroded regions, accompanied by smoother temperature gradients along the corrosion edges. Overall, temperature field variations under different defect conditions are mainly concentrated at the interfaces between defective and intact materials, with limited temperature differences, suggesting that the sensitivity of the thermal field to local morphological and material changes is lower than that of the electric field distribution.
4. Graph Neural Network–Based Identification of Cable Defects
4.1. Spectral Decomposition–Based Leakage Current Feature Extraction and Graph Node Modeling
In this study, a comprehensive processing framework was developed to tackle the complexity of leakage current signals in power cables, encompassing the stages from signal decomposition to intelligent defect identification. The procedure consists of the following steps: first, the raw signal is subjected to fine-grained full-band spectral partitioning using Wavelet Packet Decomposition (WPD) [
22,
23]; subsequently, multiple features—including amplitude, energy ratio, and spectral flatness—are extracted from the decomposed spectrogram to quantitatively characterize harmonic components and local distortions of the signal; finally, these features are mapped as input nodes of a Graph Neural Network (GNN), thereby constructing a graph structure capable of revealing inter-band correlations and defect patterns, which supports subsequent intelligent diagnosis and recognition [
24,
25,
26].
As a core time-frequency analysis tool, Wavelet Packet Decomposition (WPD) offers significant advantages over traditional wavelet decomposition, which recursively decomposes only low-frequency components. In contrast, WPD iteratively processes both low- and high-frequency parts at each level, using orthogonal filter banks to form a binary decomposition tree. This enables finer partitioning of the entire frequency spectrum and effectively separates harmonic components at different frequency levels, thereby capturing transient distortions and non-stationary features induced by defects. However, frequency components above 1000 Hz are typically influenced by the frequency response limitations of the current transformer and external interference, and therefore, these signals are considered noise and are excluded from further analysis. By calculating the energy distribution and feature coefficients of each frequency band, the time-frequency characteristics of the leakage current signal can be comprehensively represented, laying a solid foundation for subsequent feature extraction and pattern recognition.
Following feature extraction, the multidimensional indices obtained are mapped as node attributes in the GNN, with each node representing the feature description of a specific frequency band, while the edges capture the intrinsic correlations among different bands. Based on this graph structure, the GNN not only learns localized features of each band but also models inter-band interactions through its message-passing mechanism, thereby enhancing the capability to capture and recognize defect-related patterns. This method demonstrates the advantages of structured modeling in complex power signal analysis and provides a powerful approach for achieving high-accuracy fault diagnosis.
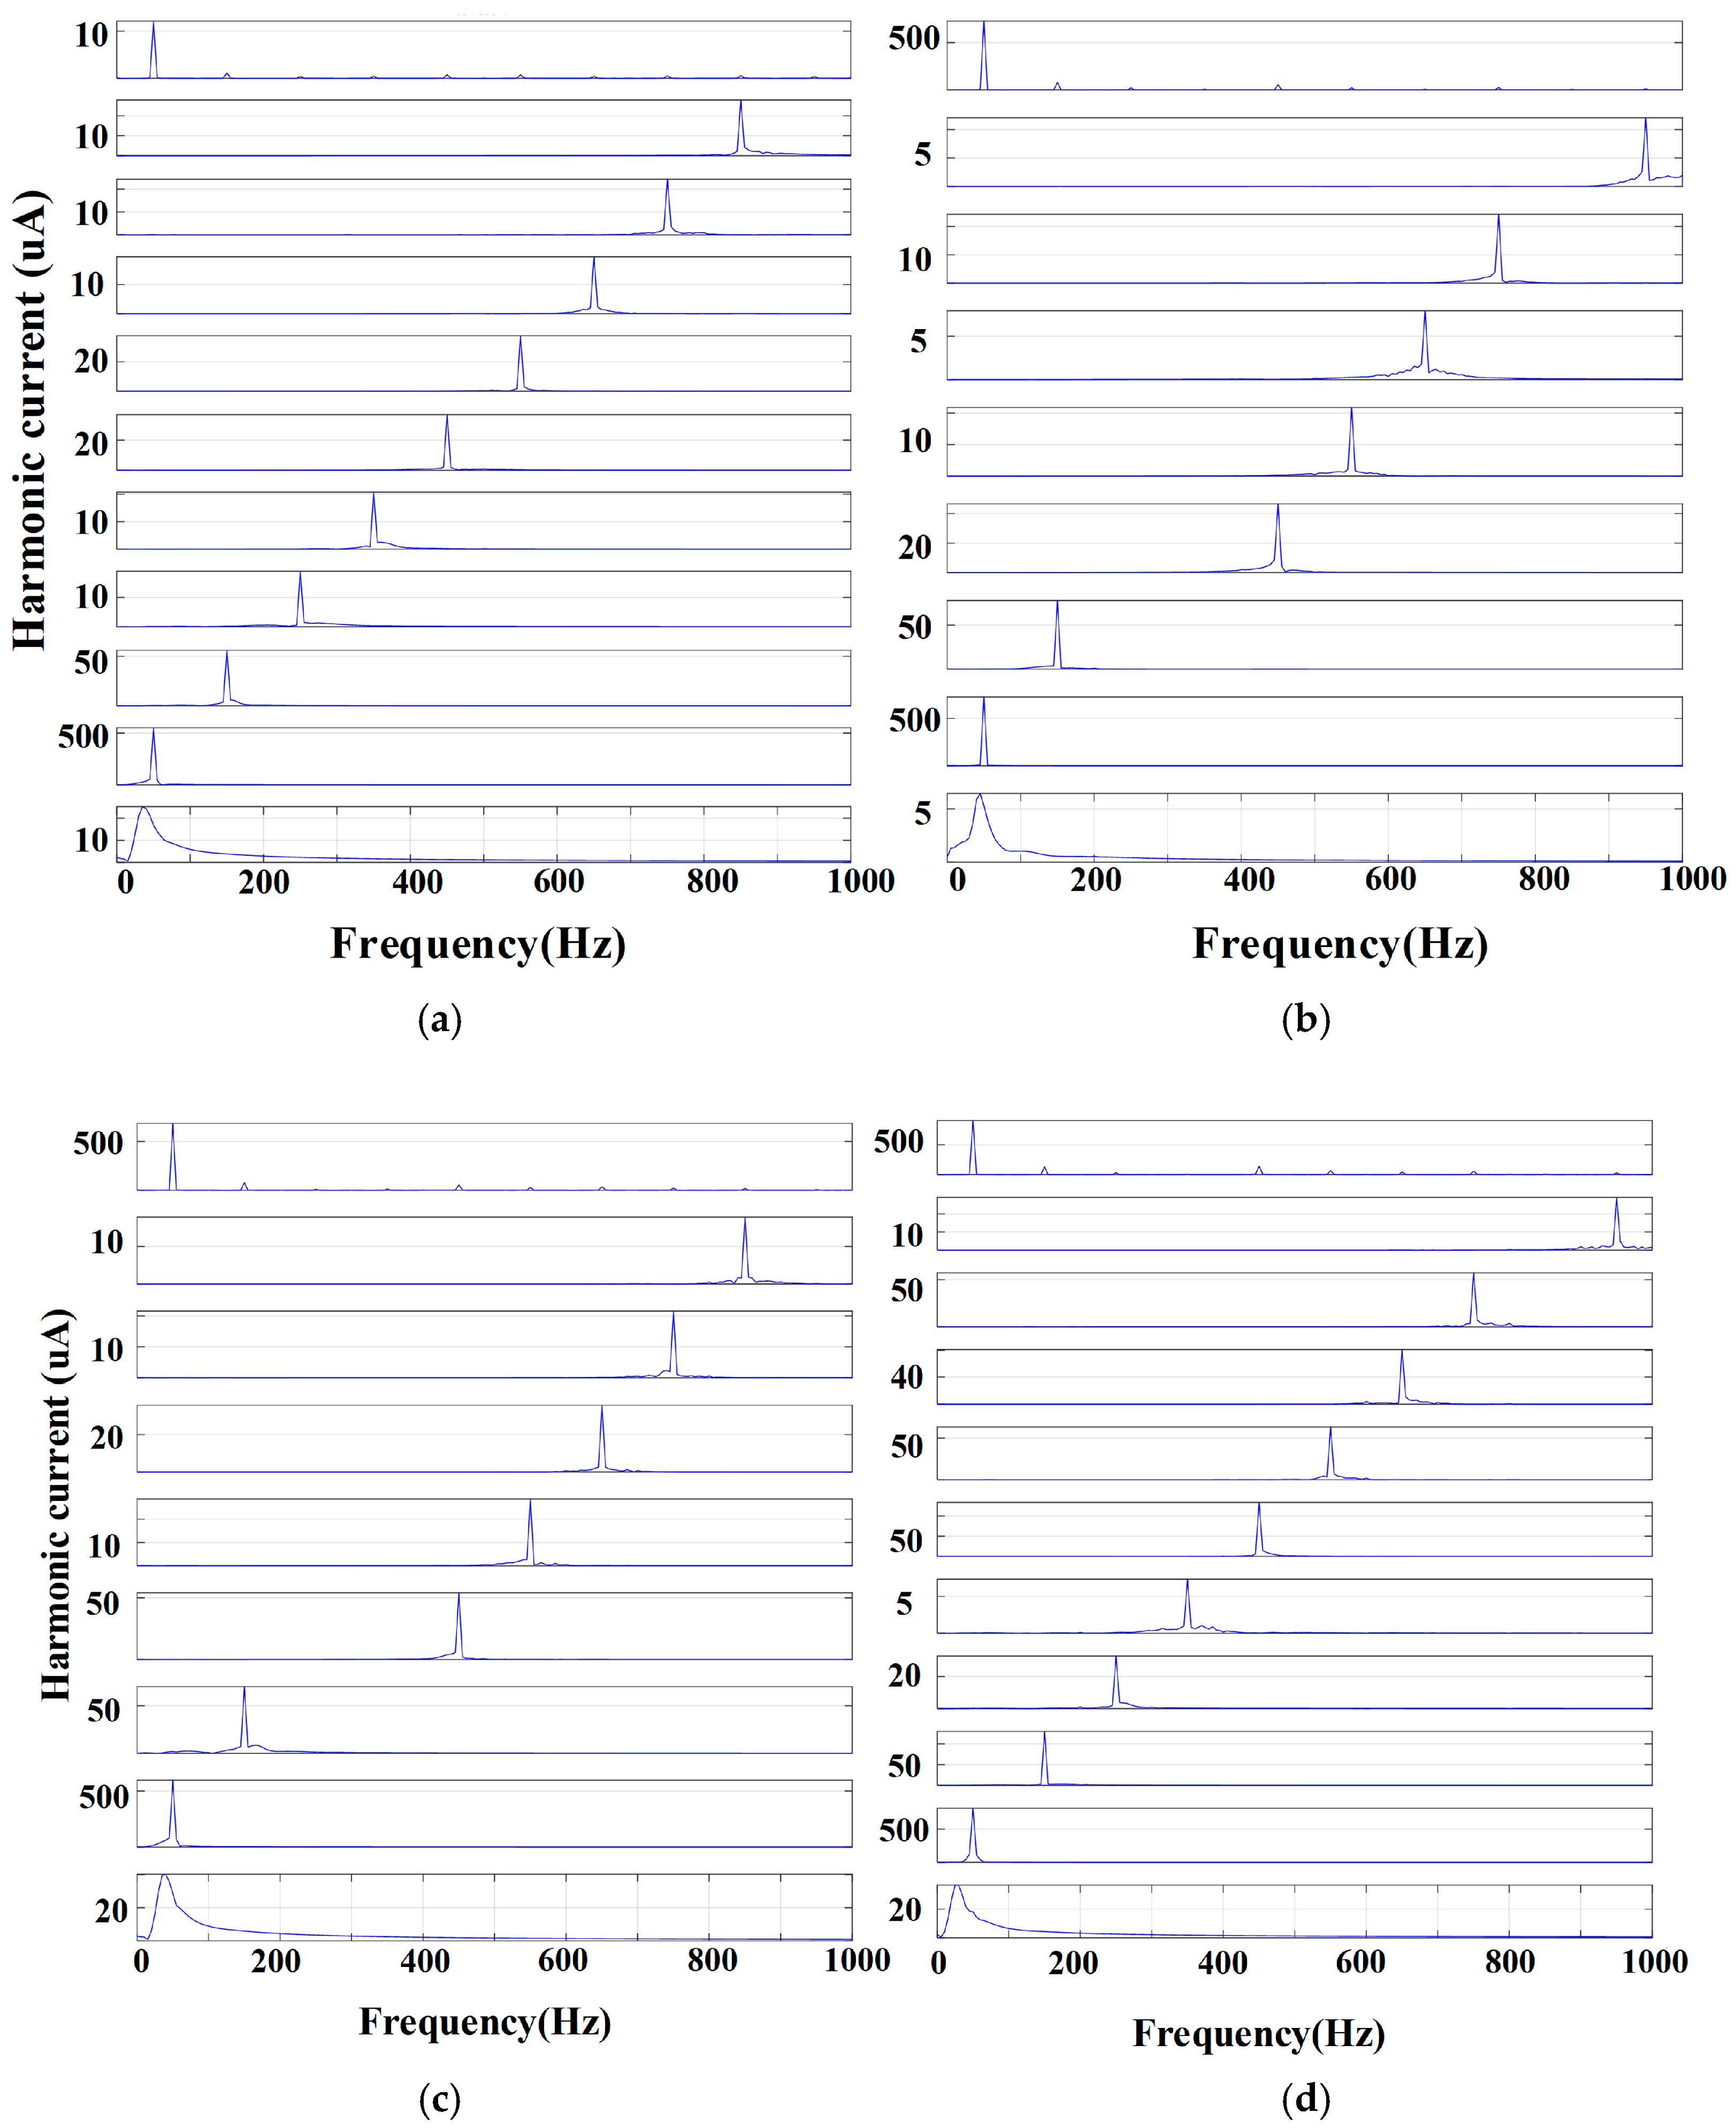
The spectrograms after WPD are presented in
Figure 8, which display the spectral distributions of leakage current signals following decomposition. Through fine partitioning of both high- and low-frequency components at different decomposition levels, the fundamental frequency and its harmonics can be clearly separated across the full spectrum. As shown in panels (a)–(d), significant differences in spectral energy distribution can be observed among different frequency bands, with certain bands exhibiting distinct local peaks and concentrated energy regions. These features reflect harmonic distortions and non-stationary behaviors in the signals caused by cable defects.
The leakage current signal
, after wavelet packet decomposition, yields the frequency-band energy distribution:
At a fixed set of frequency nodes, eight-dimensional spectral features are extracted, including amplitude, energy ratio, relative amplitude ratio with respect to the fundamental frequency, local contrast, local spectral slope, spectral flatness, and peak prominence, as summarized in
Table 1. These features were selected for their ability to capture key characteristics of leakage current signals. Specifically, amplitude measures signal strength, logarithmic amplitude enhances small-amplitude components, energy ratio identifies defect-related energy patterns, and fundamental amplitude ratio highlights high-frequency energy. Local contrast and spectral slope reflect local variations and frequency shifts, respectively, while spectral flatness distinguishes noise from defect signals. Peak prominence helps identify significant spectral peaks. These features are then used to construct the graph node structure, improving the accuracy and robustness of defect detection in power cables.
These features encompass key information on spectral amplitude, energy distribution, relative fundamental enhancement, and local variations. Subsequently, the construction of the graph-structured network is designed to capture the spatial relationships among these features.
In the graph structure, the node set is denoted as
, where N = 2
L represents the number of sub-bands obtained under an L-level WPD decomposition. Each node corresponds to a sub-band, and its feature vector
comprises the eight-dimensional features listed in
Table 1, thereby forming the node feature matrix
. The correlation between any two nodes i and j is quantified using the Pearson correlation coefficient:
Subsequently, the adjacency matrix
is established on this basis:
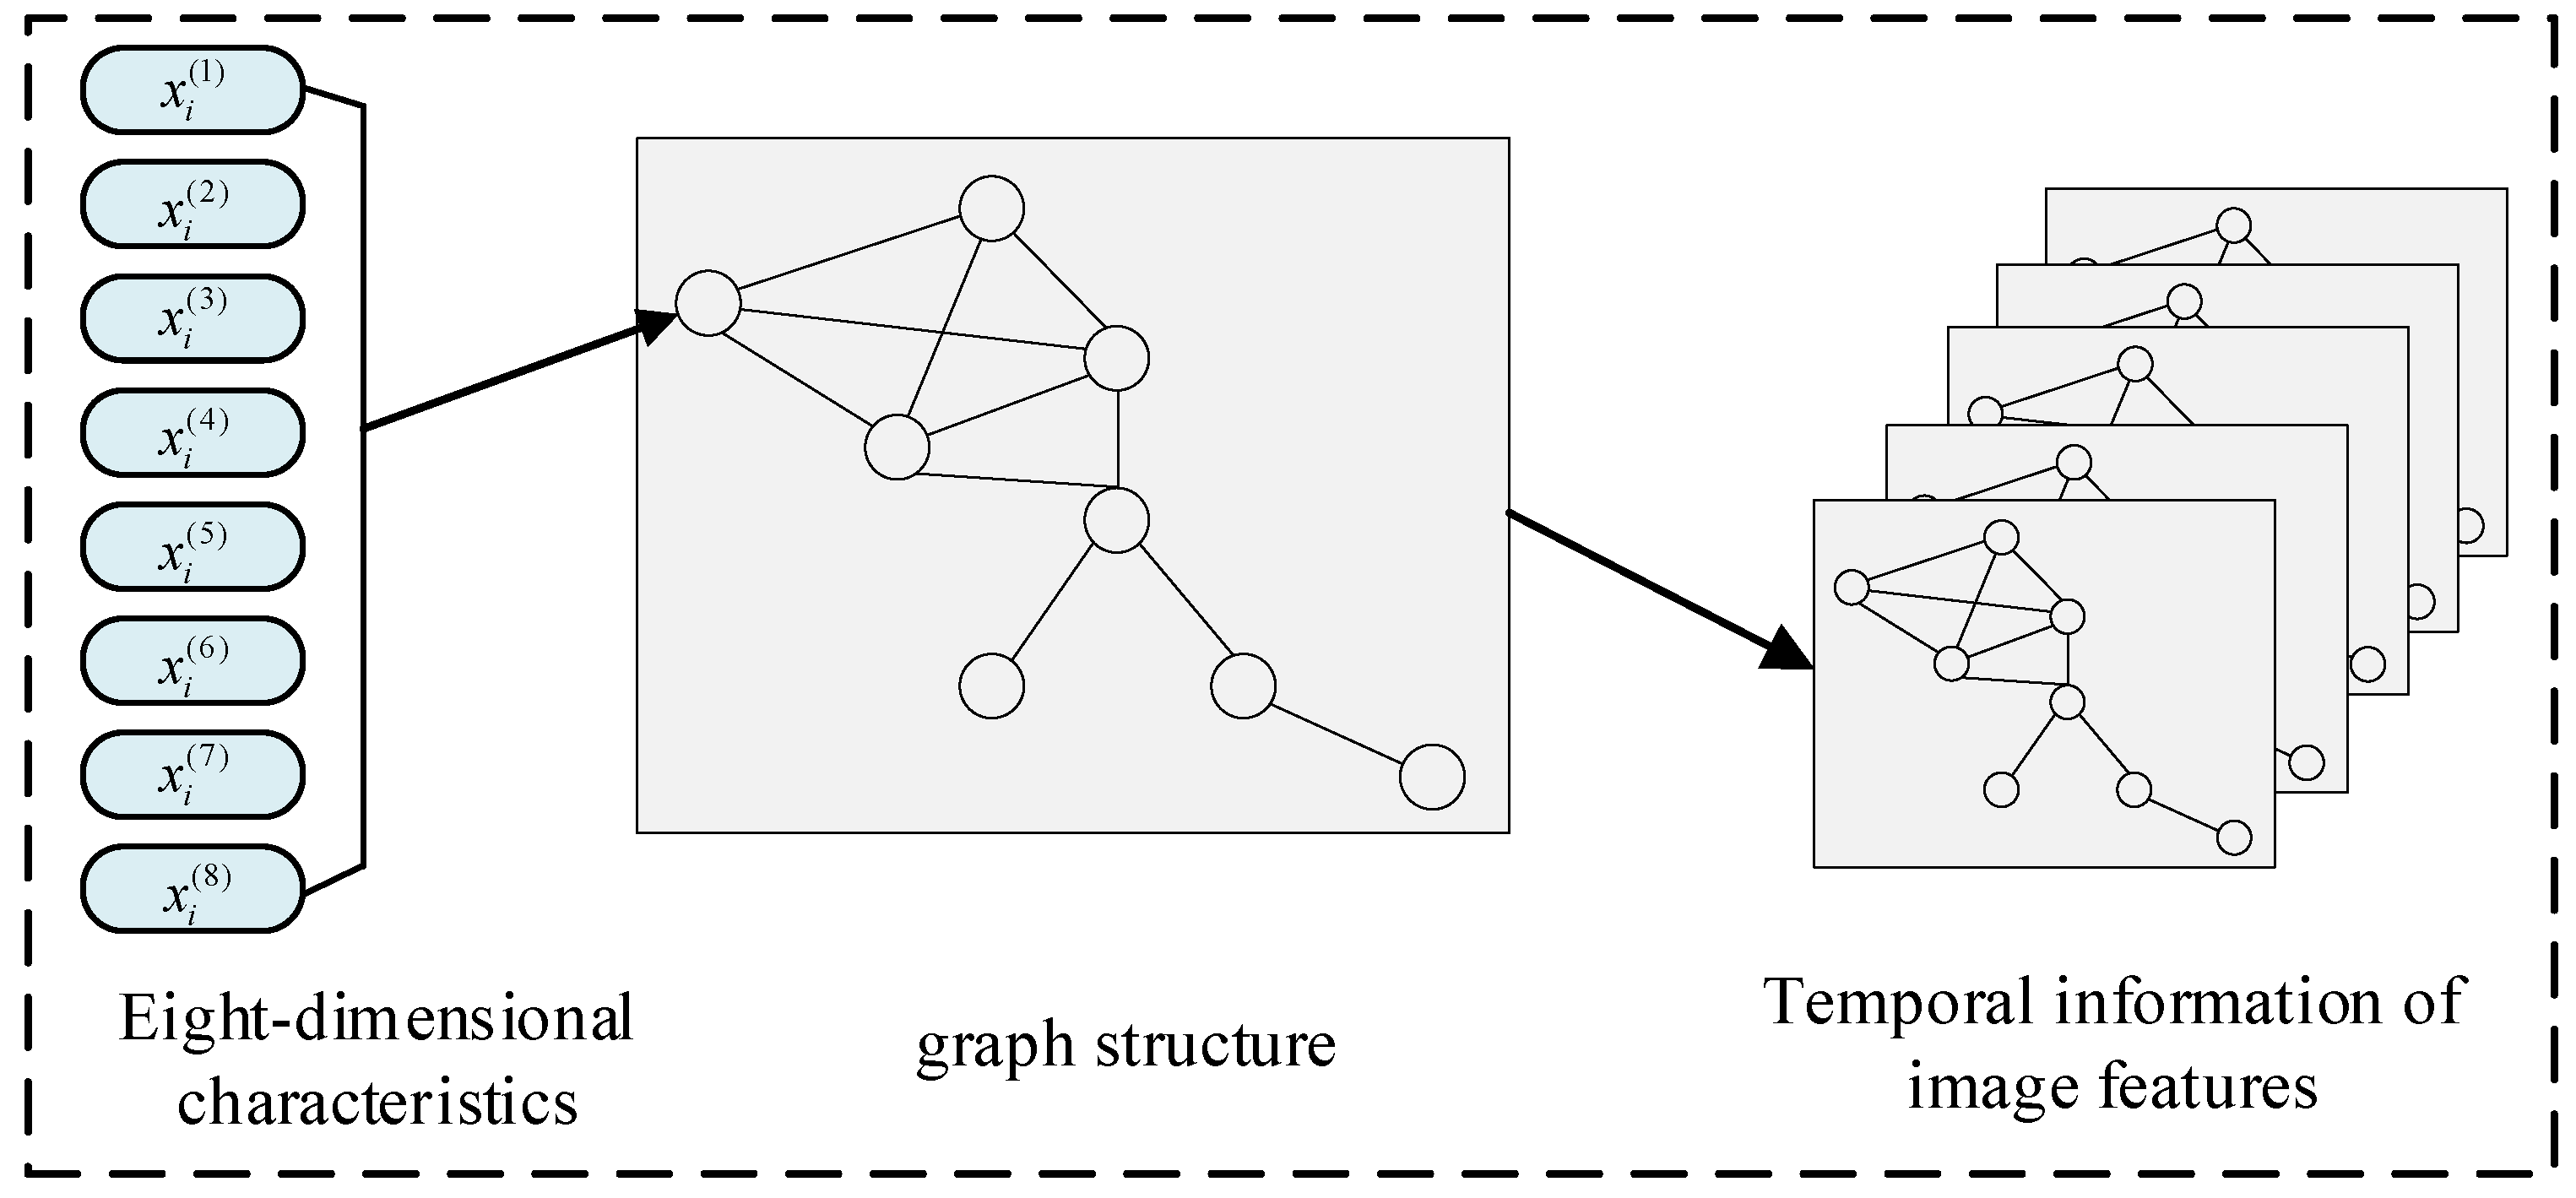
In this expression, τ = 0.28 is set as an empirical threshold, aiming to balance the correlation between features and the influence of noise. The generated graph structure is illustrated in
Figure 9, where each node corresponds to a specific frequency point in the spectrum, and its feature vector is composed of the aforementioned features. By establishing edges between nodes, a graph structure is formed, on which the Graph Neural Network (GNN) can perform feature aggregation and propagation, thereby capturing both global and local dependencies among different frequency points in the spectrum.
4.2. Defect Feature Recognition Using Graph Neural Networks
In the previous section, eight key spectral features of the leakage current were extracted using wavelet packet decomposition, and a graph-structured network was constructed. Building on this, the model employs a two-layer Graph Convolutional Network (GCN) to further perform convolutional computations on the graph structure, thereby capturing spatial dependencies among nodes and providing effective graph embeddings for subsequent defect identification.
The core objective of the graph convolution operation is to update each node representation by performing a weighted aggregation of the features of its neighboring nodes through the adjacency matrix. Specifically, in the GCN, each node i in the graph corresponds to a feature vector Xi in the spectrum, which is encoded based on the previously defined eight features. During the convolutional process, the features of each node are aggregated with those of its adjacent nodes, followed by feature extraction through two layers of graph convolution.
First Convolution Layer: In the initial stage of feature aggregation, the feature vector
Xi of node
i is updated by aggregating the features of its neighboring nodes. This process can be expressed as:
Here, denotes the node representation after the first graph convolution, is the normalized adjacency matrix, X represents the input node feature matrix, is the weight matrix of the first convolutional layer, and refers to the nonlinear activation function. Through this convolution operation, the representation of each node is influenced not only by its own features but also by the aggregated information from its neighboring nodes, thereby forming a more semantically enriched node representation.
In the second graph convolutional layer, the representation of each node is further aggregated with information from its neighboring nodes. The output of this layer, denoted as
, can be computed as:
In this expression, already represents the node embeddings obtained after the first convolutional layer. The second convolution layer further strengthens the inter-node relationships, resulting in richer and higher-order node features. Through these two layers of graph convolution, the model is able to capture the complex dependencies among spectral nodes, thereby achieving enhanced discriminative capability. After the convolutional operations of the Graph Neural Network, the resulting node representations are fed into a Long Short-Term Memory (LSTM) network to capture the temporal dynamics of the leakage current spectrum. As an improved variant of the Recurrent Neural Network (RNN), the LSTM effectively addresses the vanishing gradient problem encountered in processing long sequences, while also capturing long-term dependencies in the time series.
In this model, the node representation
at each time step t is regarded as the input of the LSTM at that moment. Through its gating mechanism, the LSTM selectively retains past node information and integrates it with the current input for state updating. In this way, the LSTM is capable of learning the temporal evolution of the leakage current spectrum, thereby enhancing the model’s ability to identify dynamic defects. Specifically, the input to the LSTM network is the sequence of node feature representations output by the graph neural network, where each
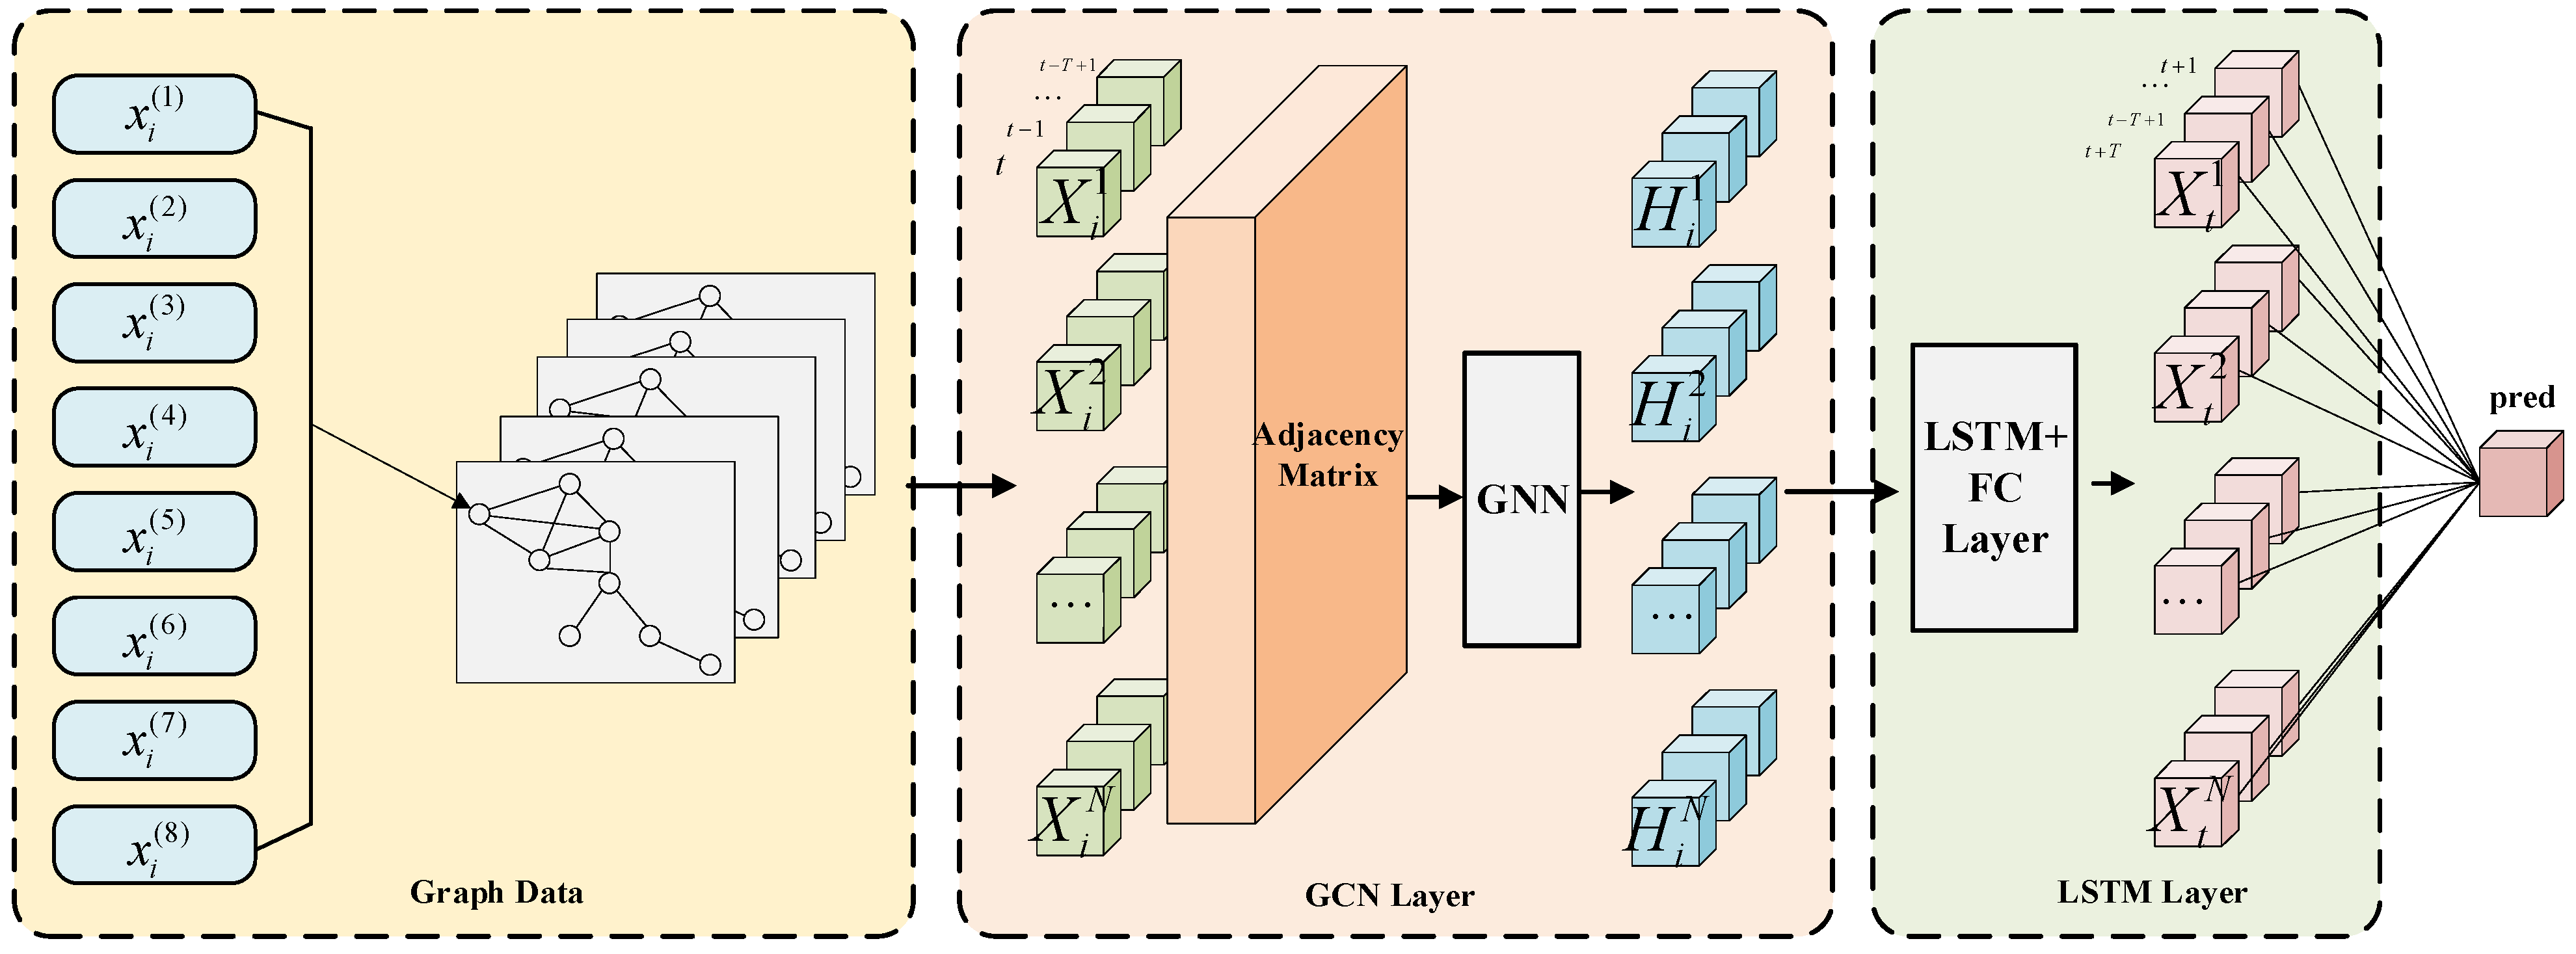
denotes the node embedding after graph convolution. The LSTM processes the entire temporal sequence and ultimately maps the output to defect category predictions through a fully connected (FC) layer. By leveraging contextual information within the sequence, the LSTM captures the temporal progression of defect characteristics and strengthens the model’s generalization ability in the time domain. Finally, the output of the LSTM layer is passed through the FC layer to perform defect classification, mapping the learned temporal features to the corresponding defect categories and producing the final prediction results. Through this combined approach, the GNN extracts spatial features from the spectral graph, while the LSTM learns the temporal variation patterns of these features, thereby achieving efficient defect recognition of leakage current spectra. The training parameters and model architecture of the GCN-LSTM are presented in
Table 2 and
Figure 10, respectively.
Figure 10 illustrates the data flow within the GNN-LSTM architecture. The process begins with the input of graph data, where each node’s features
are fed into the Graph Convolutional Network (GCN) layer, which uses the adjacency matrix to define the relationships between the nodes. The GCN layer processes the graph data and generates hidden state representations
, capturing the spatial dependencies within the graph. These hidden representations are then passed to the Long Short-Term Memory (LSTM) layer, which models the temporal dependencies by learning the sequential patterns in the data over time. Finally, the output from the LSTM layer is passed to a Fully Connected (FC) layer, which produces the final prediction, denoted as “pred”. The figure effectively demonstrates how the GNN-LSTM model learns both spatial and temporal features, starting from graph data processing with GCN to sequential learning with LSTM, ultimately generating the prediction.
Table 2 presents the hyperparameter settings for the GNN-LSTM model. In terms of input-output dimensions, the input dimension for the first GCN layer is 8, with an output dimension of 64, while the second GCN layer has an input dimension of 64 and an output dimension of 32. The output dimension of the LSTM layer is set to 32, representing the number of defect classes. To prevent overfitting, ReLU activation functions and dropout regularization are applied, with a dropout rate of 0.3 for the first and second GCN layers, and a rate of 0.2 for the LSTM layer. The Adam-W optimizer is used with a learning rate of 0.001 and a weight decay of 0.0001 to further control overfitting. During training, the batch size is set to 64, and the number of epochs is 100, ensuring adequate learning. The random seed is set to 42 to guarantee the reproducibility of the experiment. The total number of parameters for the model is 4.5 M (4.5 million), reflecting the model’s complexity.
4.3. Comparative Analysis of Test Results
This study employs a deep learning model that integrates Graph Neural Networks (GNN) with Long Short-Term Memory (LSTM) networks (GNN-LSTM) for defect identification based on leakage current spectra. Unlike conventional deep learning models, the GNN-LSTM framework is capable of simultaneously capturing the spatial structural characteristics of the spectrum and its temporal dynamics. Specifically, the GNN leverages graph convolution to model the complex dependencies among spectral nodes, thereby learning both global and local structural relationships, while the LSTM models the temporal evolution of leakage current signals. By combining these two components, the model is able to capture both static and dynamic features of defects, thus enhancing recognition accuracy and robustness.
The experiments were conducted on a system equipped with a 12th Gen Intel® Core™ i7-12700H processor (2.30 GHz), 16 GB RAM, a 64-bit operating system (x64-based architecture), and Python 3.10 as the development environment. Prior to training, all data were normalized to ensure consistency across features. The dataset was randomly divided into 80% training and 20% testing subsets, with each sample labeled by both defect type (scratch, indentation, corrosion, and moisture ingress) and severity level (mild, moderate, severe). This partitioning ensured fair evaluation and provided a reliable benchmark for subsequent experiments. To further guarantee representativeness, both training and testing sets encompassed diverse defect types and severities. All experiments were repeated five times under identical data splits, with average values and standard deviations reported, confirming the stability of the results.
To validate the effectiveness of the GNN-LSTM model, a comparative analysis was conducted against three alternative hybrid frameworks: CNN-LSTM, SVM-LSTM, and MLP-LSTM, all evaluated under identical experimental conditions. The results, summarized in
Table 3, show that the GNN-LSTM achieved the highest defect identification accuracy of 95.6%, benefiting from its ability to capture spectral structural features via graph modeling and temporal dependencies via LSTM. In comparison, CNN-LSTM reached 92.1%, performing well in local feature extraction but lacking global structural modeling; SVM-LSTM attained 90.4%, limited by the linear nature of SVM in high-dimensional feature spaces; and MLP-LSTM achieved 91.3%, capable of handling high-dimensional features but without the advantages of graph-based structural learning.
Beyond accuracy, metrics such as training time, inference time, and parameter size were also evaluated. The GNN-LSTM required 180.45 s for training—longer than the other models—but its superior accuracy demonstrated that the computational cost is justified. For inference, the GNN-LSTM achieved the fastest performance at 10.12 ms, while its 4.5 M parameters allowed it to effectively capture rich spatiotemporal features. Nonetheless, despite its clear advantages in accuracy and inference efficiency, the model still faces limitations such as longer training times and larger parameter sizes, which may present challenges for large-scale applications. Future work may incorporate self-attention mechanisms to enhance temporal modeling capabilities and optimize GNN structures to reduce computational overhead, thereby improving efficiency and scalability.

