Article

Numerical Modelling of Biomethanation in UHS/UMR: The Role of Gas Solubility in Long-Term Dynamics

1
Oil and Gas Institute—National Research Institute, 25 A Lubicz Str., 31-503 Cracow, Poland
2
Faculty of Drilling, Oil and Gas, AGH University of Science and Technology, 30 al. Adama Mickiewicza, 30-059 Cracow, Poland
*
Author to whom correspondence should be addressed.
Energies 2025, 18(21), 5661; https://doi.org/10.3390/en18215661
Submission received: 18 September 2025 / Revised: 15 October 2025 / Accepted: 17 October 2025 / Published: 28 October 2025

Abstract

The European Green Deal aims for a gradual reduction in CO2 emissions while simultaneously increasing the share of renewable energy sources (RES). A key challenge is balancing the variable production of green energy with the seasonal demand for the energy. One way to balance the supply of energy with the demand for it is to store its surpluses, e.g., through underground hydrogen storage (UHS). Another gas that requires storage (CCUS) is carbon dioxide (CO2). Under certain reservoir conditions, H2 in contact with CO2 in the presence of methanogenic Archaea may undergo biomethanation, a process that under abiotic conditions would normally require very high temperatures. This process may become an alternative method of utilizing surplus CO2 production and converting H2 into CH4, which is easier to store, transport, and integrate into existing gas systems. This study presents a numerical workflow for modelling the biomethanation phenomenon in the commercial Eclipse reservoir simulator. The methodology was validated through both quantitative and qualitative analyses of results from modelling the operation of an underground biomethanation reactor (UMR). Particular attention was given to the role of gas solubility (H2, CO2, CH4) in long-term reservoir dynamics. The simulations assessed not only the total CH4 production but also the fraction of injected H2 converted into CH4, as well as the effects of varying compositions of injected gas. To the best of the authors‘ knowledge, this is the first study to explicitly link gas solubility with H2 utilization efficiency in UMR simulations, providing new insights into long-term underground biomethanation.

1. Introduction

The gradually implemented Green Deal policy assumes a progressive reduction in CO2 emissions while increasing the share of renewable energy sources [1,2]. One of the key challenges is to balance the variable production of green energy, i.e., its supply, with seasonal demand for the energy [3,4,5]. One of the ways to balance the supply of energy with the demand for it is to store its surpluses, e.g., through underground hydrogen storage (UHS) [6,7,8,9].
Hydrogen is known as a versatile energy carrier, due to its high gravimetric energy density [10] and its potential role in decarbonized energy systems [11]. However, its relatively low volumetric energy density compared to methane (CH4) presents challenges for its direct integration into existing natural gas storage and transport systems [12,13]. Underground gas storage (UGS) has been very well known in Europe and worldwide for decades, implemented usually in depleted hydrocarbon reservoirs represented by porous structures, and salt caverns as well [14,15,16].
Another gas requiring underground storage and management is CO2, for which CCUS technologies have been developed [17,18,19,20,21].
Under specific reservoir conditions, hydrogen can undergo biomethanation when it comes into contact with CO2 in the presence of methanogenic bacteria [22,23,24,25,26], opposite to abiotic conditions, where the methanation process requires very high temperatures [27]. Biological methanation, therefore, represents an alternative concept for utilizing surplus CO2 and renewable H2, producing CH4, which is easier to store, transport, and use in existing gas infrastructure as gas power plants. This concept is closely related to Power-to-Gas (PtG, P2G) technology, which couples renewable energy generation with underground storage of H2, utilization of CO2, and conversion of both of them into CH4 (Figure 1) [25,26,27,28,29].
Methanogenic microorganisms are part of the Archaea domain, which remains one of the least explored groups of microorganisms despite extensive research over decades [30]. These organisms are strict anaerobes that utilize H2 and CO2 to produce CH4 and are considered the most relevant in the context of underground biomethanation [25,26]. These organisms are widespread in subsurface environments, e.g., aquifers and hydrocarbon reservoirs, where their activity may have both beneficial effects, such as reducing hydrocarbon viscosity, and detrimental impacts, such as the corrosion of drilling and transport equipment [31]. Therefore, their abilities to live under high pressure, elevated reservoir temperature, and increased salinity of formation water make methanogens key biocatalysts for in situ PtG applications.
One of the first observed changes in the composition of stored town gas due to biomethanation of H2 and CO2 into CH4 was reported for Lobodice UGS, located in Slovakia [32]. This accidental biomethanation phenomenon resulting from underground gas storage operations rather than deliberately designed process provided some of the earliest evidence that the microbiological processes can directly influence gas composition in UGS. In addition, Strobel et al. [25] synthesized the concept of underground biomethanation and reviewed other examples, including Ketzin (Germany) and Beynes (France). On those observations, they outlined the concept and potential of underground biomethanation, emphasizing its potential for the PtG concept by coupling UHS with CCUS, consequently leading to the concept of an underground biomethanation reactor (UMR) [25,33,34].
The German H2Store project demonstrated the feasibility of UHS, focusing on geochemical, petrophysical, and microbiological interaction in porous media [35]. Subsequent studies and a pilot project called HyChico have been implemented in Argentina. In this project, the feasibility of in situ biomethanation in a depleted reservoir was investigated, combining renewable H2 from wind power with CO2 utilization [22]. More broadly, this concept has been demonstrated as a multi-stage project started in Austria with an initial name of Underground Sun Storage (2013–2017) [36], and continued in the following years as Underground Sun Conversion (2017–2021) [29], Underground Sun Conversion Flex Store (2021–2023), and is now being continued as Underground Sun Storage 2030 [37]. These projects confirmed the feasibility of biomethanation under reservoir conditions and highlighted a few open questions, particularly regarding long-term process dynamics and the impact of CO2, H2, and CH4 solubility in water on the distribution of gas composition within the reservoir.
The solubility of gases in formation water is crucial for the underground biomethanation process. The contrast between the high solubility of CO2 and the very low solubility of H2 makes H2 the limiting substrate for the biomethanation process and the rate-controlling factor of that process [17,38,39,40,41,42]. The solubility of CH4 is slightly higher than the solubility of H2; however, this may have a crucial impact on the composition of the withdrawn gas and its distribution in the water and gas phase, too.
Recent years show significant advancements in the analytical and numerical modelling of UHS and UMR. These developments focus on integrating microbial kinetics, multiphase flow, and geomechanical processes at the reservoir conditions [33,43,44,45,46,47,48]. Various simulation frameworks are utilized, ranging from TOUGHREACT-CO2Bio [45], which integrates biochemical reactions with multiphase flow, to bioreaction-coupled flow models that assess how biomethanation affects hydrogen storage performance [46,47,48]. More recently, new workflows were developed to implement underground biomethanation within commercial reservoir simulators. Notably, STARS by CMG enables the integration of microbial kinetics, gas solubility, and fluid dynamics [33].
Despite significant progress in modelling UHS and UMR, and to the best of the authors’ knowledge, no prior studies have integrated a detailed analysis of the role of gas components’ solubility with the efficiency of H2 utilization in UMR models, nor have they explored the effects of injected gas compositions. To address this gap, the authors developed a numerical workflow for modelling the biomethanation phenomenon using the commercial ECLIPSE reservoir simulator. The methodology was validated through a quantitative and qualitative analysis of a synthetic UMR model. In addition to quantifying total CH4 production, the fraction of injected H2 converted into CH4 was evaluated and the impact of varying CO2/H2 injection ratios was investigated. Therefore, this work provides new insights into the long-term behaviour and performance of UMR.

2. Object and Methods

2.1. Underground Biomethanation Reactor (UMR) Model

To analyse the process occurring during underground biomethanation in porous medium, a synthetic three-dimensional reservoir model in the shape of an anticline was constructed. The parameters for the model were derived from both domestic and international literature [39,40,41,49].
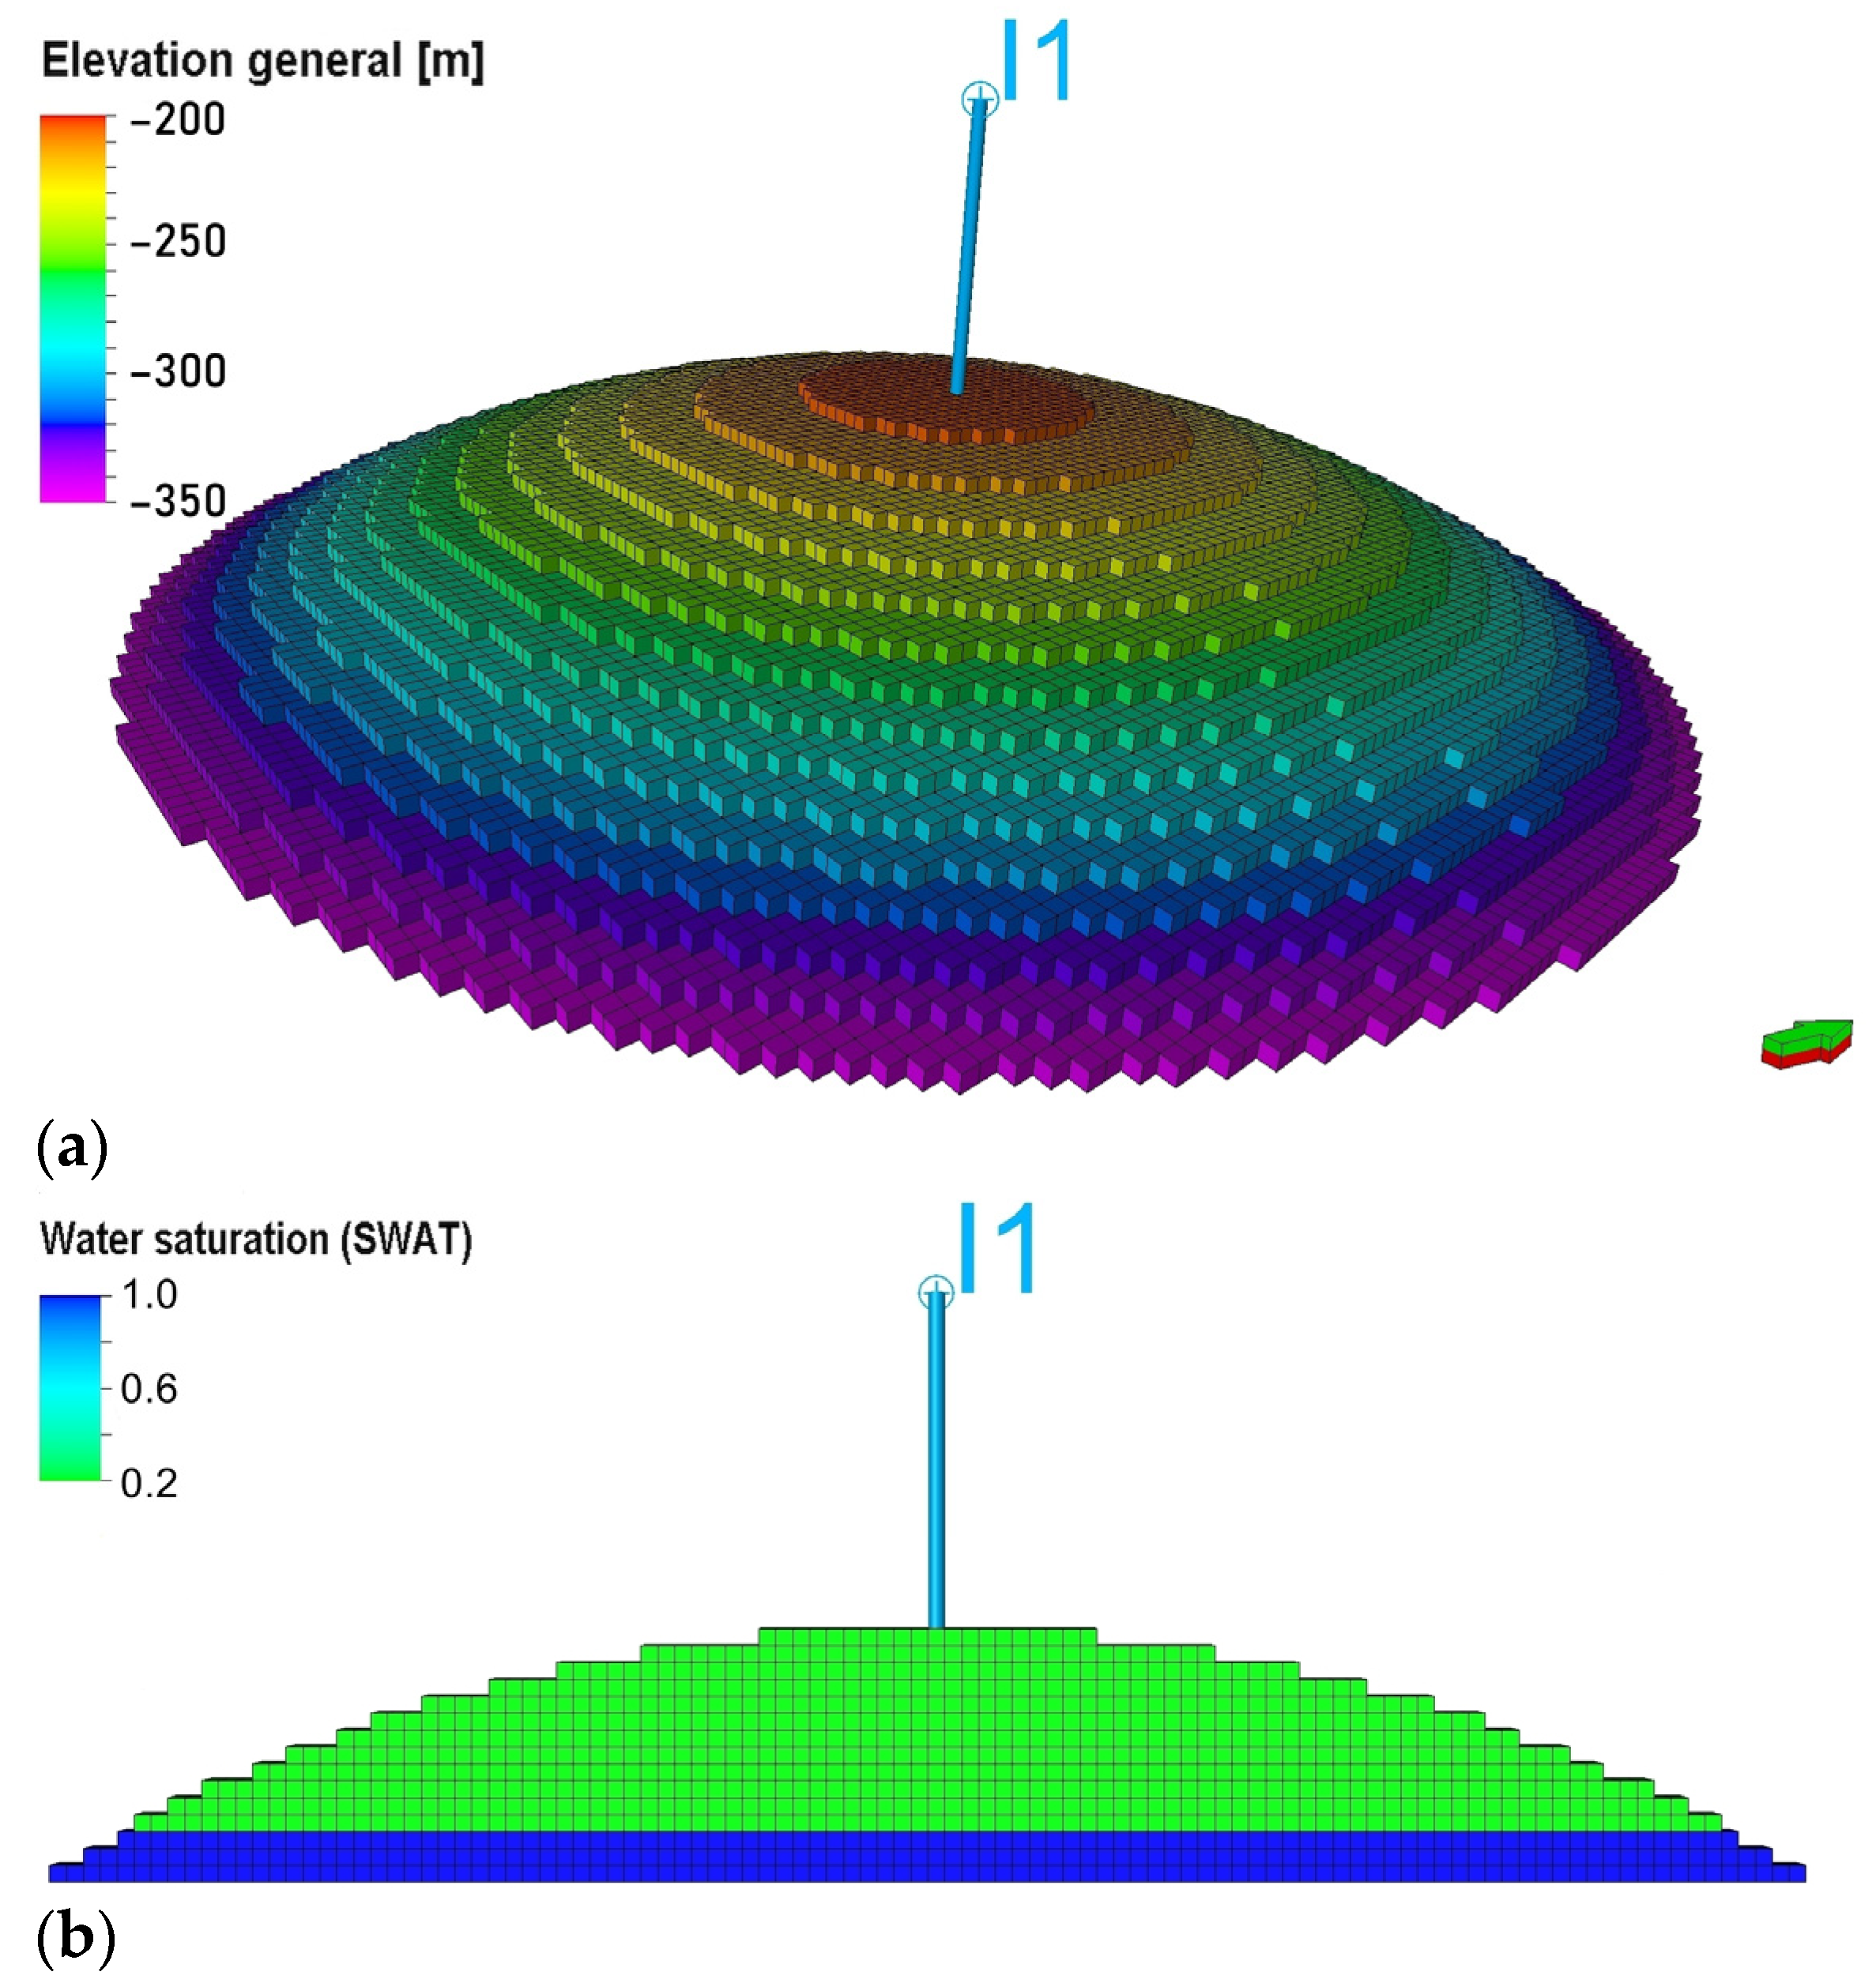
The base grid consisted of 200 × 200 × 100 blocks, with a total of 67,152 active cells representing anticline structure (Figure 2a). Each block had a lateral size of 10 m × 10 m, and the thickness of each block was also 10 m. A homogeneous porosity of 20% and permeability of 100 mD were assumed. The total pore volume of the structure was 13.45 million Rm3.
The model included immobile water (Swcr = 20%) and an underlying aquifer below the gas–water contact at 320 m below sea level. A vertical cross-section with initial water saturation distribution is shown in Figure 2b.

2.2. Methanation and Biomethanation

When H2 and CO2 are injected into porous medium, they can mix [37,49,50] and react. Their conversion into CH4 is possible through the following:
  • Abiotic methanation (Sabatier reaction): requires, using current technological conditions, nickel catalysis with temperature about 300° C [27].
  • Biomethanation: occurs under moderate reservoir conditions, and is catalysed by methanogenic Archaea without the need for elevated temperature [25,30,31]
Biomethanation cases:
  • Injection of H2 into structures previously used for CCUS.
  • Injection of green H2 (from surplus energy) together with CO2 (from industry) to generate CH4.
  • Enhancement of CH4 content in synthetic gas mixtures or in aquifers during underground storage operations.
A similar process may also occur unintentionally in H2 storage facilities due to dissolution of CO2 from carbonate rocks [34].

2.3. Physicochemical Model of Biomethanation in the Gas–Water System

To model the phenomenon of biomethanation, the following assumptions were adopted [34]:
  • Two-phase flow of water and gas;
  • Multicomponent model of the reservoir fluid;
  • Multicomponent formation water model;
  • Solubility of each component in formation water described by individual equilibrium constants, dependent on pressure, temperature;
  • Methanogenic microorganisms treated as an aqueous component catalysing methanation according to the Sabatier reactions [27] (Götz et al., 2016):
    4 H 2 + C O 2 C H 4 + 2 H 2 O 134   kJ/mol
Here, H2, CO2, CH4 are considered to dissolve in formation water (H2O is the base aqueous component). Substrates and products are not consumed by biomass, while the heat of reaction is assumed to be entirely dissipated by the microorganisms, thus maintaining a constant reservoir temperature [25]. The reaction occurs exclusively in the aqueous phase where microorganisms are present.
  • To implement biomethanation in the reservoir simulator, above assumption was expressed as [51]:
    4 H 2 , D S + C O 2 , D S + B a c t n B a c t + C H 4 , D S + 2 H 2 O
    where
    H 2 , D S —H2 dissolved in water;
    C O 2 , D S —CO2 dissolved in water;
    H 2 , D S —H2 dissolved in water;
    B a c t —bacteria;
    n —coefficient related to bacterial growth, n = 1.
In this study, microorganisms were treated as a mobile aqueous component in the simulator. Their growth, however, could be treated implicitly and was omitted (n = 1). This assumption was a strategic simplification, introduced to isolate and better understand the physicochemical controls related to gas solubility. Nevertheless, the microbial life cycle can be incorporated in future extensions of the model, for instance by applying the Monod model to account for microbial growth and substrate utilization dynamics.
2.
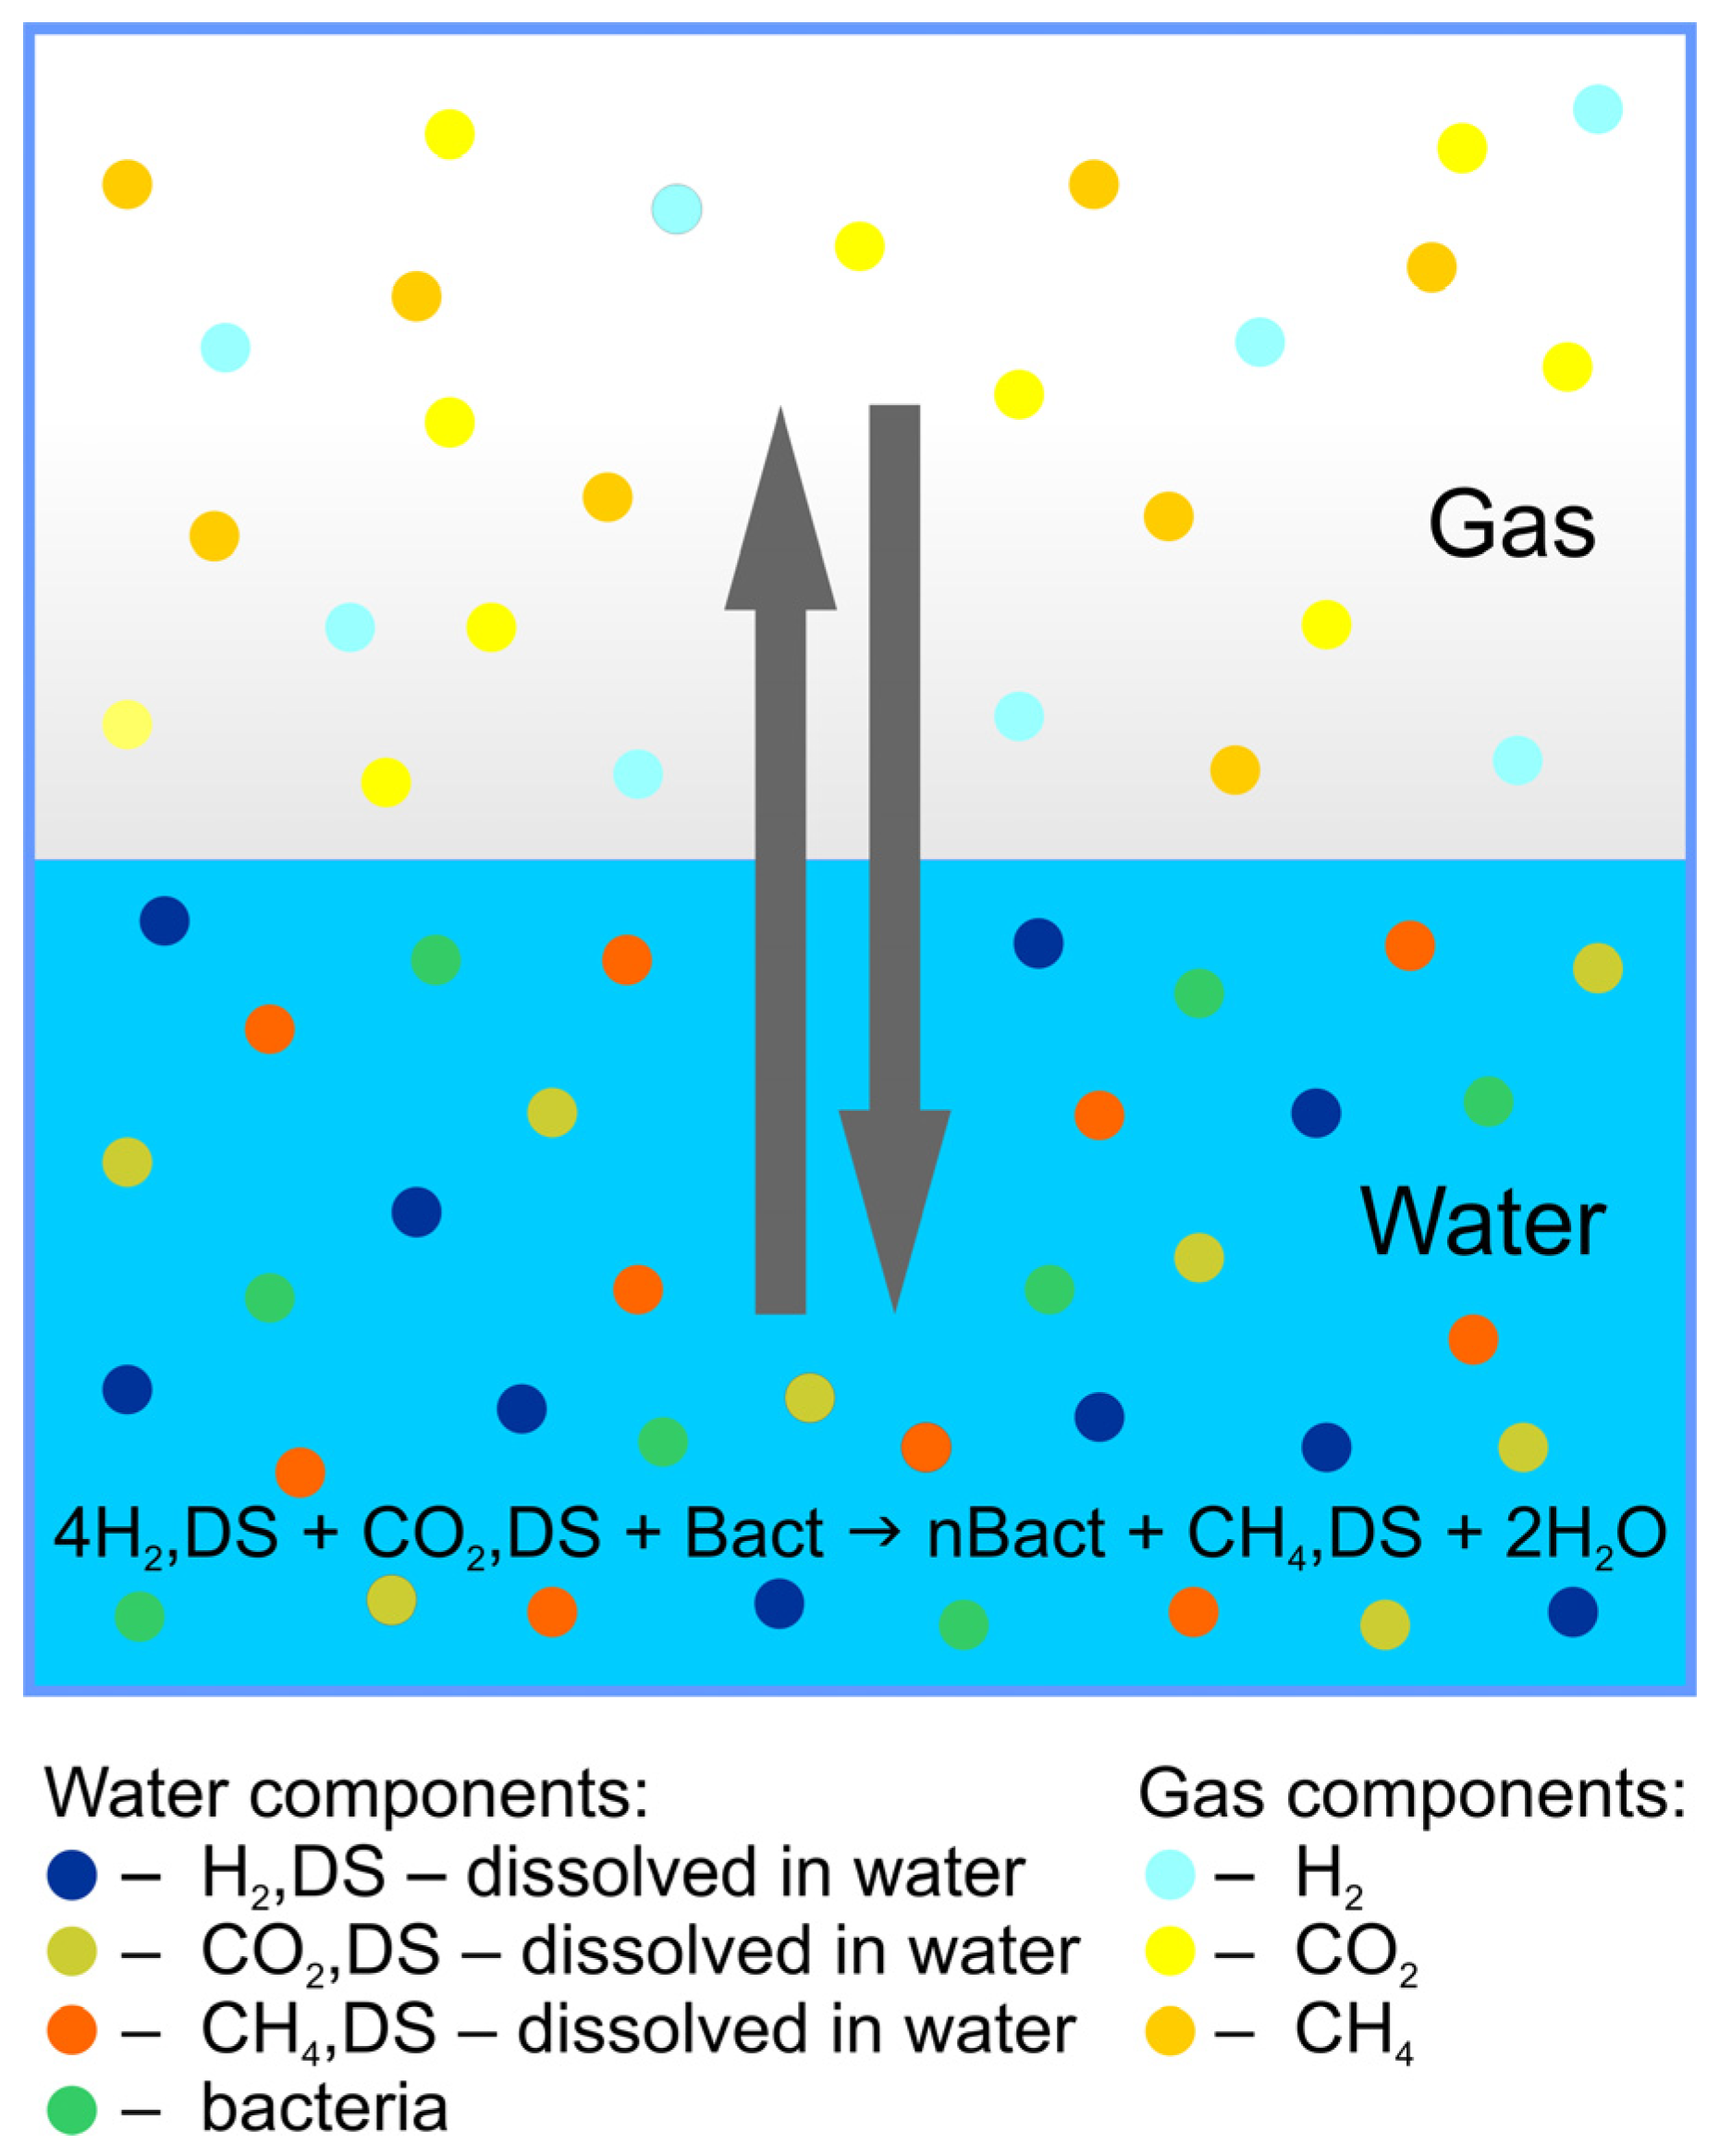
Gas dissolution was further described through equilibrium reactions (Figure 3) [51]:
H 2 H 2 , D S —dissolution of H2 in water along with the release of dissolved H2 into the gas phase;
C O 2 C O 2 , D S —dissolution of CO2 in water along with the release of dissolved CO2 into the gas phase;
C H 4 C H 4 , D S —dissolution of CH4 in water along with the release of dissolved CH4 into the gas phase.
In this study, the effects of physical dispersion and molecular diffusion [49,50] were not explicitly considered, since the primary objective was to investigate the biomethanation processes under solubility-controlled conditions. However, these phenomena may further influence the spatial distribution of dissolved gases and could be incorporated into the next investigations to provide a more comprehensive description of gas migration and reactivity in porous media. Similar aspects of multiphase gas migration and compositional interactions were discussed by Wu and Ansari [52] and by Wang and Kobina [53], who emphasized the coupled effects of fluid properties, molecular interactions, and reservoir conditions on subsurface transport processes.

2.4. Reservoir Fluid

The reservoir fluid was represented by a three-component fluid model described by the Soave–Redlich–Kwong (SRK) equation of state (EOS). The fluid parameters are given in Table 1 below.
The initial gas composition was mainly CH4, containing only trace amounts of CO2 and H2 (below 0.1%).
To account for the biomethanation in the aqueous phase, the above model was extended by introducing the five-component model of the aqueous phase (Table 2).
To simplify and focus on the biomethanation processes, the influence of dissolved components on water properties (compressibility, density) was omitted due to their low molar concentrations.

2.5. Solubility of Gases in Water

Since the biomethanation reaction can only occur in the aqueous phase, one of the key factors governing the change in the concentration of a given component in both phases is the solubility of substrates and products in formation water. This parameter can significantly affect the rate of the biomethanation reaction. In particular, the solubility of H2 and CO2 as the main substrates of the biomethanation process must be carefully considered in biomethanation modelling. One of the main limitations of the process is the very low solubility of hydrogen, which is significantly influenced by temperature, pressure, and salinity of the aqueous phase.
In the present model, mass exchange between the phases was assumed to occur instantaneously. Thus, the concentration of components in the aqueous phase was determined using Henry’s law, which states that the amount of gas dissolved in the liquid increases proportionally, as a function of pressure. In practice, the solubility of a gas can be affected by three main factors: (i) temperature, (ii) pressure, and (iii) the composition of water (salinity).
The equilibrium equation for phase composition can be formulated in the form of given constant values of K [51,54]:
K k = c g k c l k   k = 1 , 2 , , n
where
c g k —concentration of k component in the gas phase;
c l k —concentration of k component in the liquid phase.
In the Eclipse commercial reservoir simulator, assuming a constant temperature, the following equilibrium equation can be expressed as follows:
K P = A + B P + C   P
where
A ,   B ,   C —fitted constants;
P —pressure.
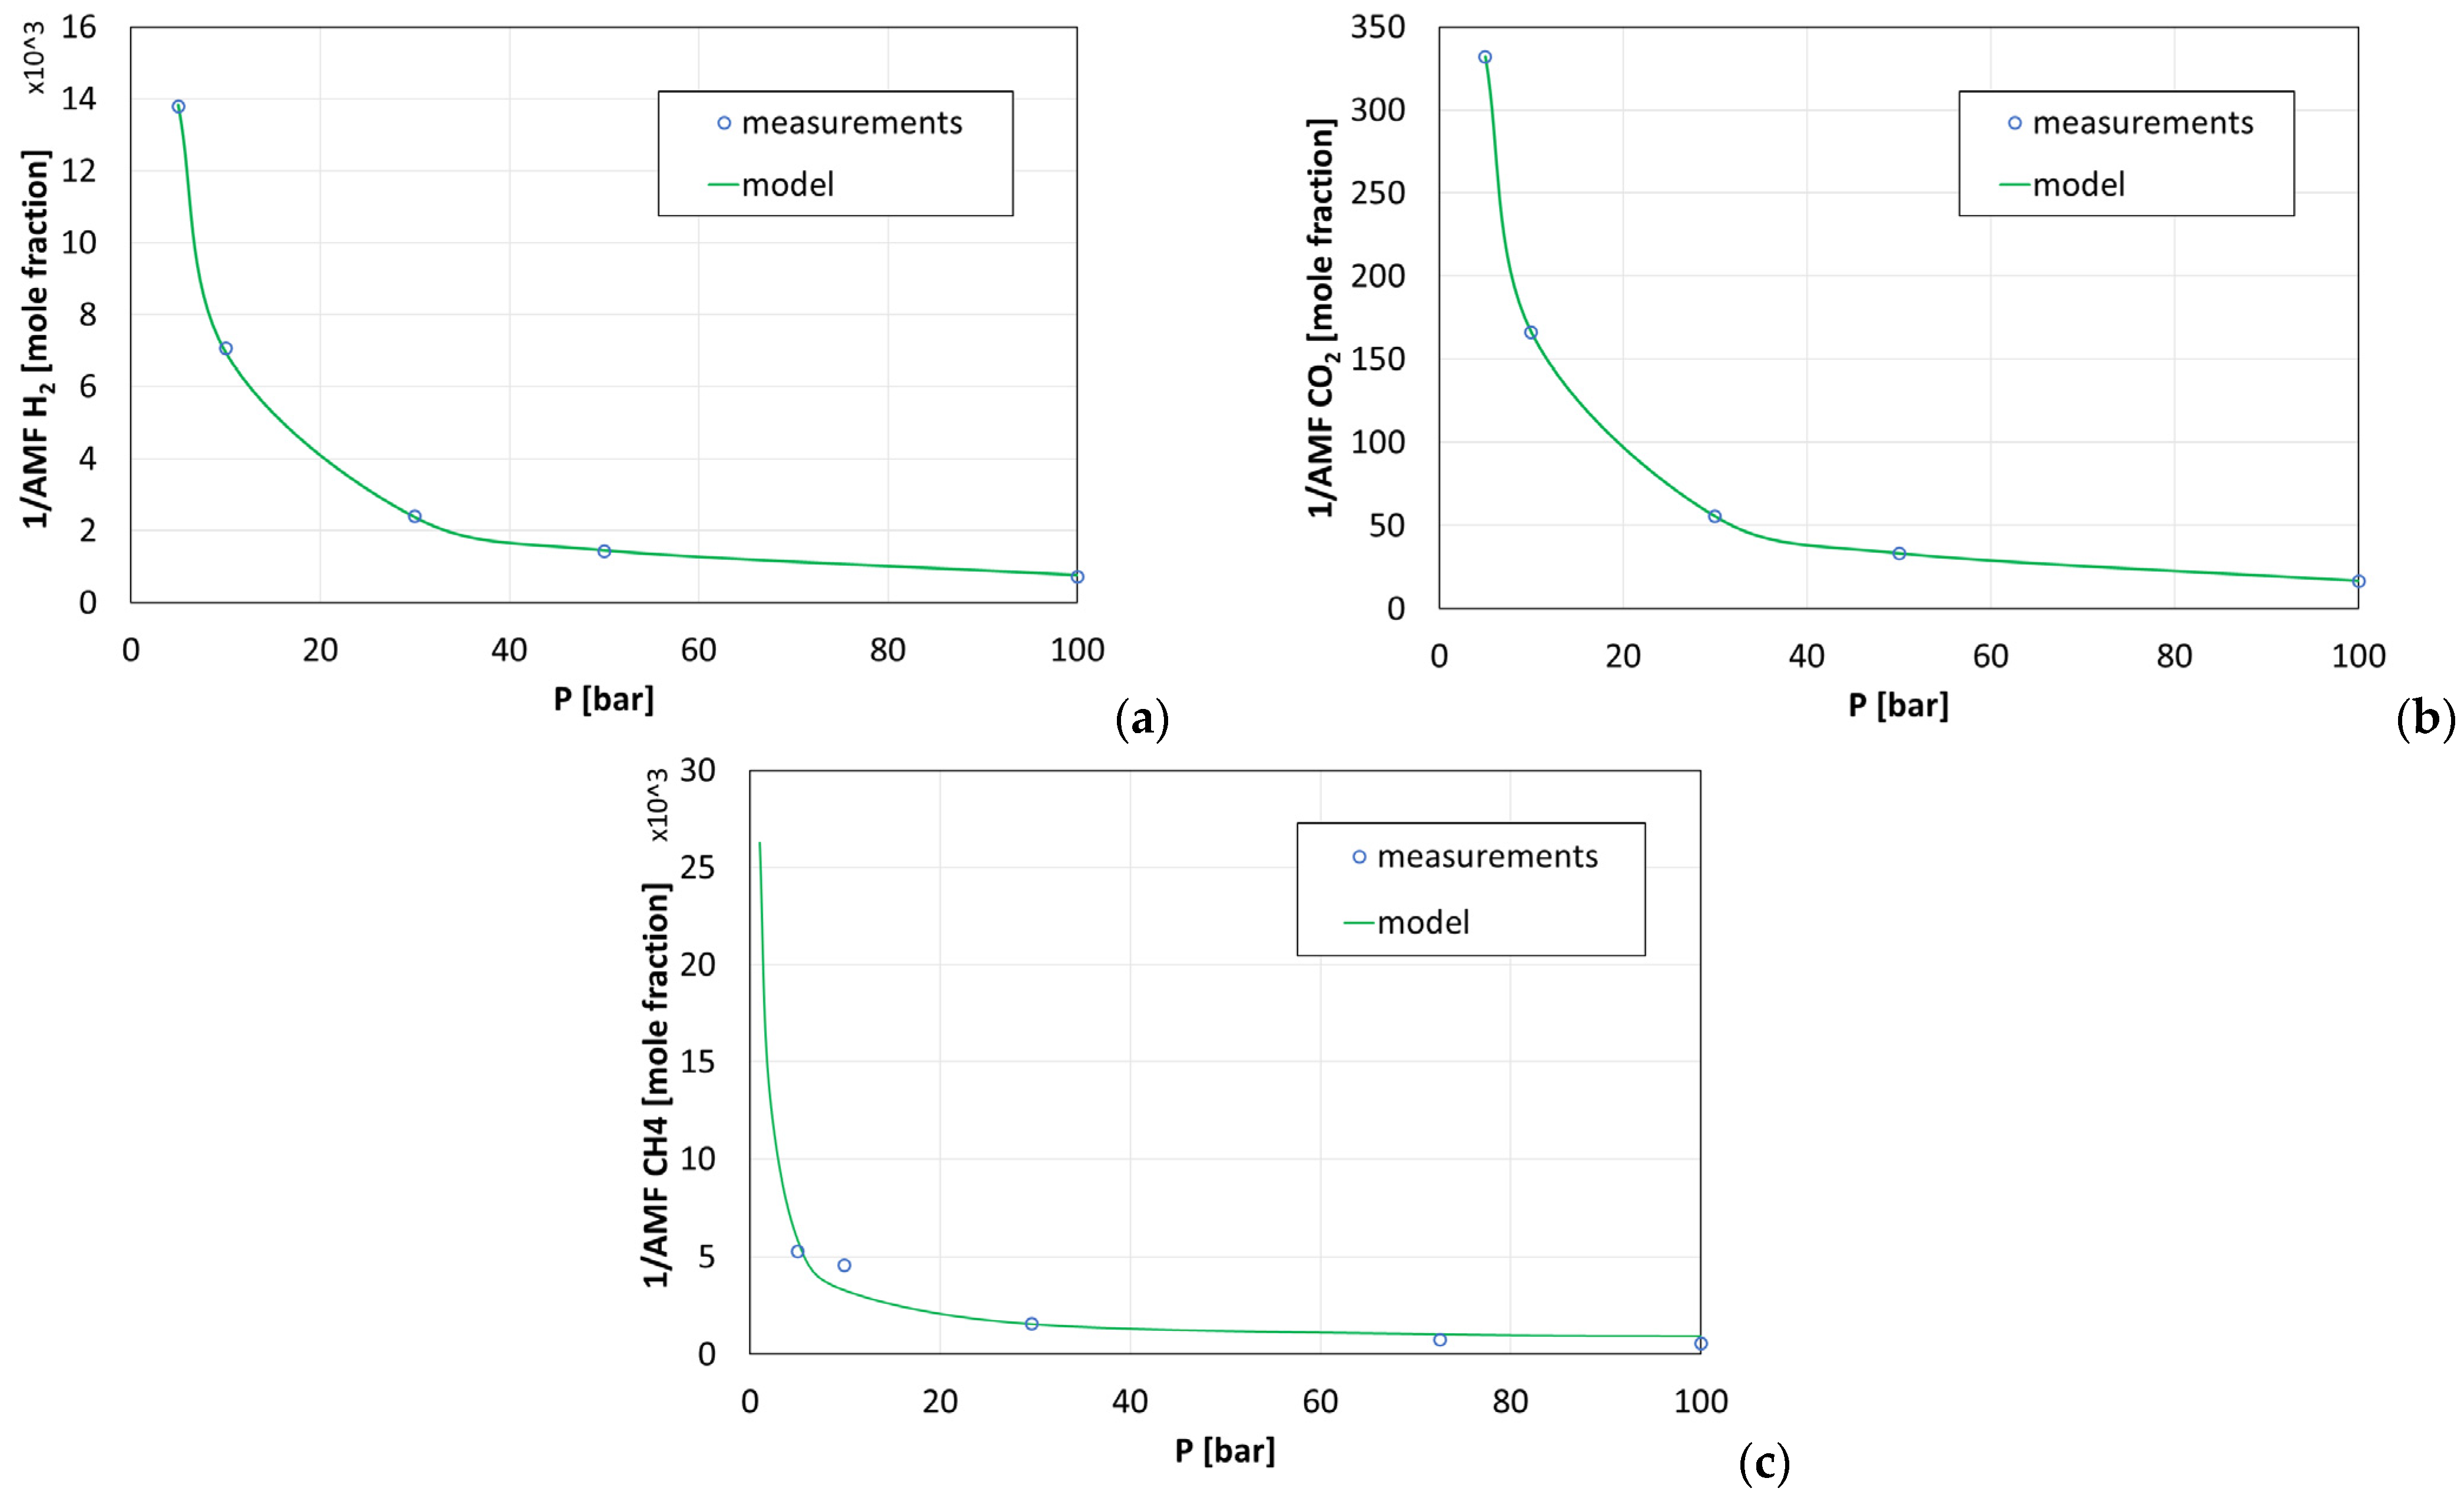
The solubility models were calibrated using literature data collected from various sources describing the relationship between pressure and gas solubility in water. Based on these datasets [39,40,41], the model was built and fitted individually for each of the gas components: H2, CO2, and CH4. The relative differences in solubility between these gases were of primary importance for evaluating the biomethanation dynamics. The results of the fitting are shown in Figure 4: (a) H2, (b) CO2, and (c) CH4.
Based on the above results, the molar composition of the aqueous phase was determined at the initial pressure, Pini = 30 bar, which is presented in Table 3.

2.6. Biomethanation Efficiency

The reaction efficiency, Rr for each reaction, r in a model block, is given by the Arrhenius equation:
R r = V b · A r · e E r / R T · c r i n r i
where
  • V b —bulk volume of the block (rock skeleton volume + pore volume);
  • A r —Arrhenius constant;
  • E r —molar activation energy of reaction;
  • R —universal gas constant;
  • T —temperature;
  • n r i —exponent of component i;
  • c r i —concentration of the i-th component in the phase where the reaction occurs, where for aqueous, the concentration of component I was expressed as follows:
c r i = Θ b w S w a i
  • Θ —porosity of the rock;
  • S w —water saturation;
  • a i —molar fraction of the i-th component in the aqueous phase;
  • b w —molar density of water.
The molar density of water was calculated as follows:
b w = 1 V w
  • V w —the specific volume given by
V w = c w c M W c ρ r e f c 1 + X c + 0.5 X c 2
  • w c —water component fraction in the aqueous phase;
  • ρ r e f c —reference density of component c;
  • M W c —molar mass of the water component c.
X c = P P r e f c
Based on the above formulas and the found biomethanation rate of 1.6559 × 10⁻⁹ [mol/(s × Sm3)] [25], the Arrhenius constant for this reaction was calculated:
Ar = 0.0653 [mol/(s × Sm3)]
These calculations ensured consistency between the implemented model reaction rates and the expected biomethanation efficiency reported in the literature.

2.7. Phase Permeability

Modelling multiphase flow in porous media requires the use of relative permeability functions to represent the effective mobility of each phase as a function of its saturation. In the present study, relative permeability functions for gas and aqueous phases were adopted based on standard correlations commonly used in modelling Polish UGS [49].

2.8. Model Initialization

The initialization of the UMR model was carried out to represent typical operating conditions of UGS facilities. The following assumptions were applied:
  • Initial reservoir pressure:
    The reference pressure at the gas–water contact depth (Hgwc = 320 m below sea level), Pini = 30 bar, based on values reported for storage operations in porous structure [49].
  • Initial saturation distribution:
    The model was initialized with irreducible water saturation of Swcr = 20% across the gas-bearing zone, while the remaining pore space was filled by gas. Below the gas–water contact, it was assumed that the formation was fully water-saturated.
  • Fluid composition:
    The initial gas phase consisted predominantly of CH4, as would be expected in a depleted natural gas reservoir. Trace amounts of dissolved components were calculated according to Henry’s law and the solubility correlations presented in Section 2.5.
  • Temperature and salinity:
    Reservoir temperature was fixed at the reference value adopted for the base case, Tres = 40 °C, and the salinity was incorporated implicitly through solubility constants (Section 2.5).
This model initialization provided a stable starting point for all the various scenarios of injection and relaxation simulations, while simultaneously considering the effects of gas solubility, the composition of the injected stream, and microbiological reactions.

3. Results

The commercial Eclipse reservoir simulator was originally developed to model flow in a porous medium based on Darcy’s law. Subsequent versions of this simulator were enriched with new capabilities such as gas diffusion, chemical reactions, and gas solubility modelled by equilibrium constants. As a result, it allowed the use of Eclipse to model hydrogen storage [49,55] and to model emerging processes such as biomethanation [51,56,57].

3.1. General Assumptions for the Forecast

In order to present the impact of the biomethanation effect on the composition of the fluid in the reservoir, a forecast was built consisting of two stages, i.e.:
Stage I—injection of a mixture of CO2 and H2 into the natural gas reservoir (injection period, tinj = 4 months;
Stage II—relaxation phase, trelax = 10 years.
Other basic assumptions of the UMR are as follows:
composition of the injected gas resulting from the stoichiometric equation, cH2 = 80%, cCO2 = 20%;
injection well I1 completed in the lower half of the gas-bearing zone;
gas injection rate (CO2 and H2 mixtures), qg,inj = 600,000 Sm3/d;
initial pressure in UMR, Pini = 30 bar;
maximum bottom hole pressure in the injection phase, Pbhp,inj,max = 100 bar.

3.2. Forecasts and Simulation Results of the UMR

Based on the above assumptions, a basic forecast of gas injection into the reservoir was made, along with an additional period without any injection and production during which dynamic flows disappear (reservoir relaxation). For this forecast, quantities were defined to verify the implemented algorithm that allows the biomethanation phenomenon to be taken into account in the analysed structure. The following are the markings used in the Eclipse and Petrel environments, which are used, among others, when generating drawings:
C1—H2 in gas phase;
C2—CO2 in the gas phase;
C3—CH4 in gas phase;
C4—H2O in the aqueous phase;
C5—bacteria in the aqueous phase;
C6—H2,DS in the aqueous phase;
C7—CO2,DS in the aqueous phase;
C8—CH4,DS in the aqueous phase;
R1—biomethanation reaction;
R2—the reaction of H2 dissolving in water and its release from water into the gas phase;
R3—the reaction of CO2 dissolving in water and its release from water into the gas phase;
R4—the reaction of dissolution of CH4 in water and its release from water into the gas phase.
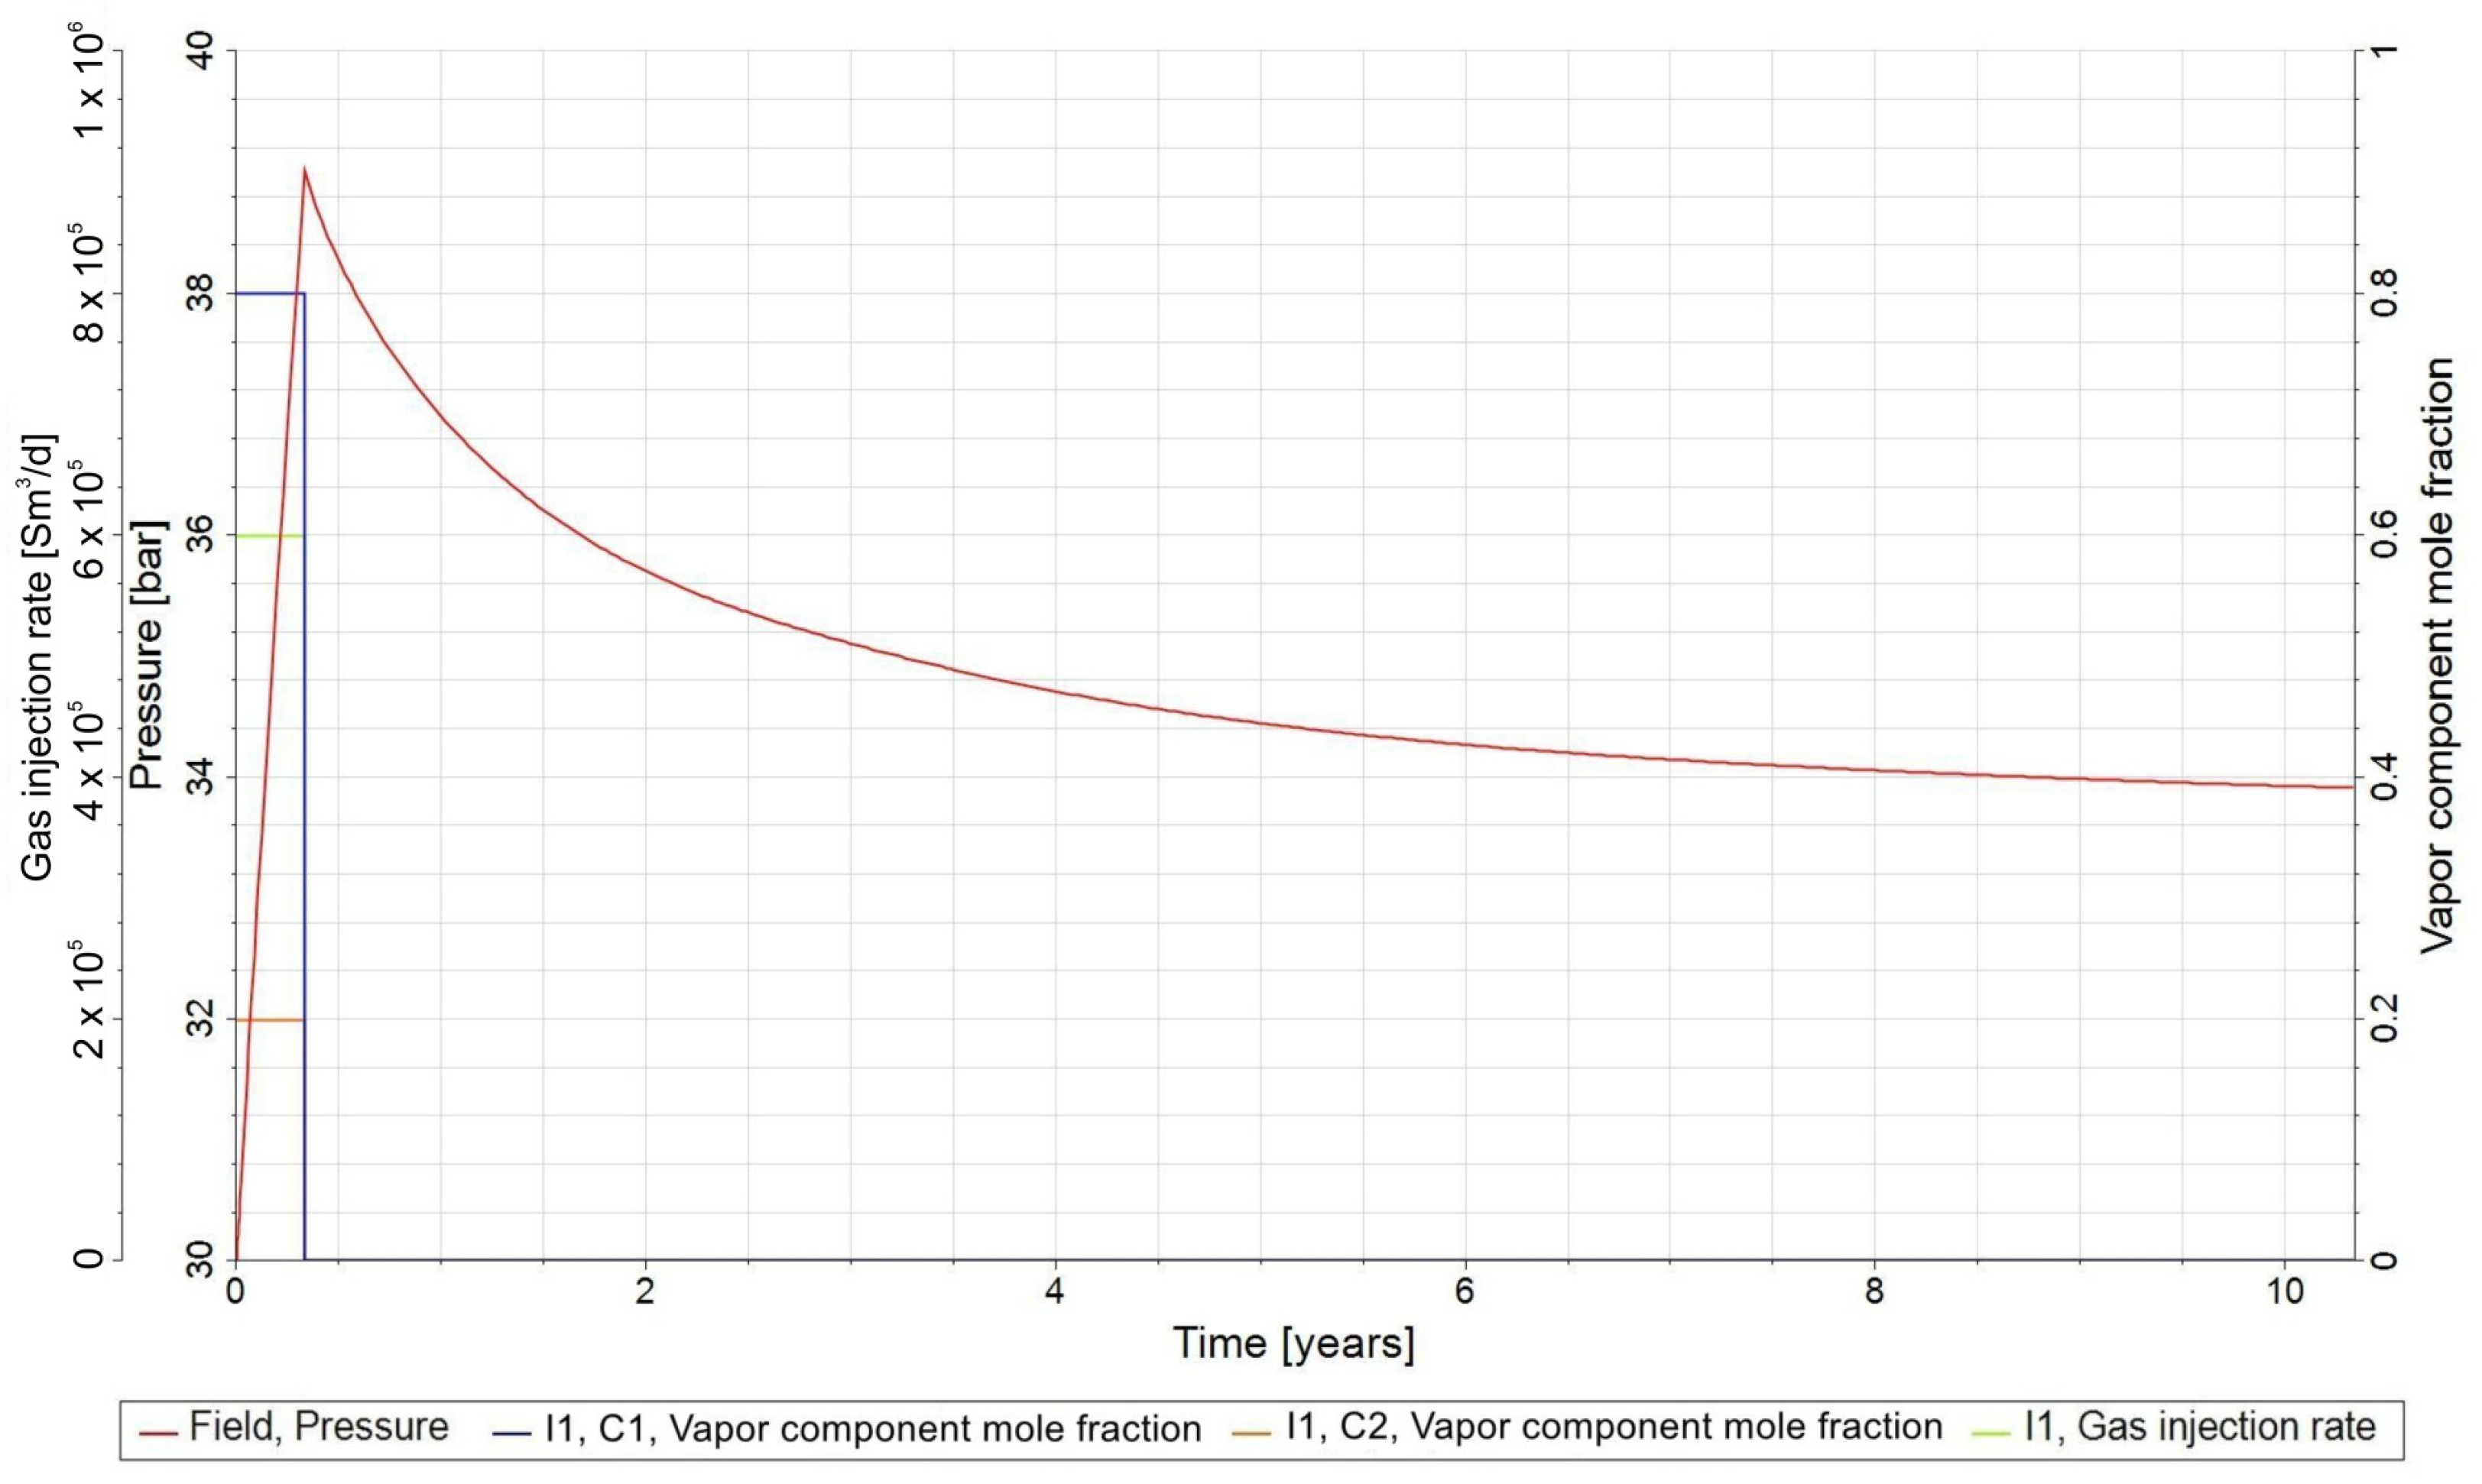
According to the assumptions, for the first 4 months, gas of a fixed composition (cH2 = 80%, cCO2 = 20%) was injected with the assumed rate (qg,inj = 600,000 Sm3/d), without being limited by the increasing reservoir pressure (Figure 5). After 4 months of injection, this process was stopped, and then changes in the reservoir were observed during the so-called reservoir relaxation, lasting the next 10 years.
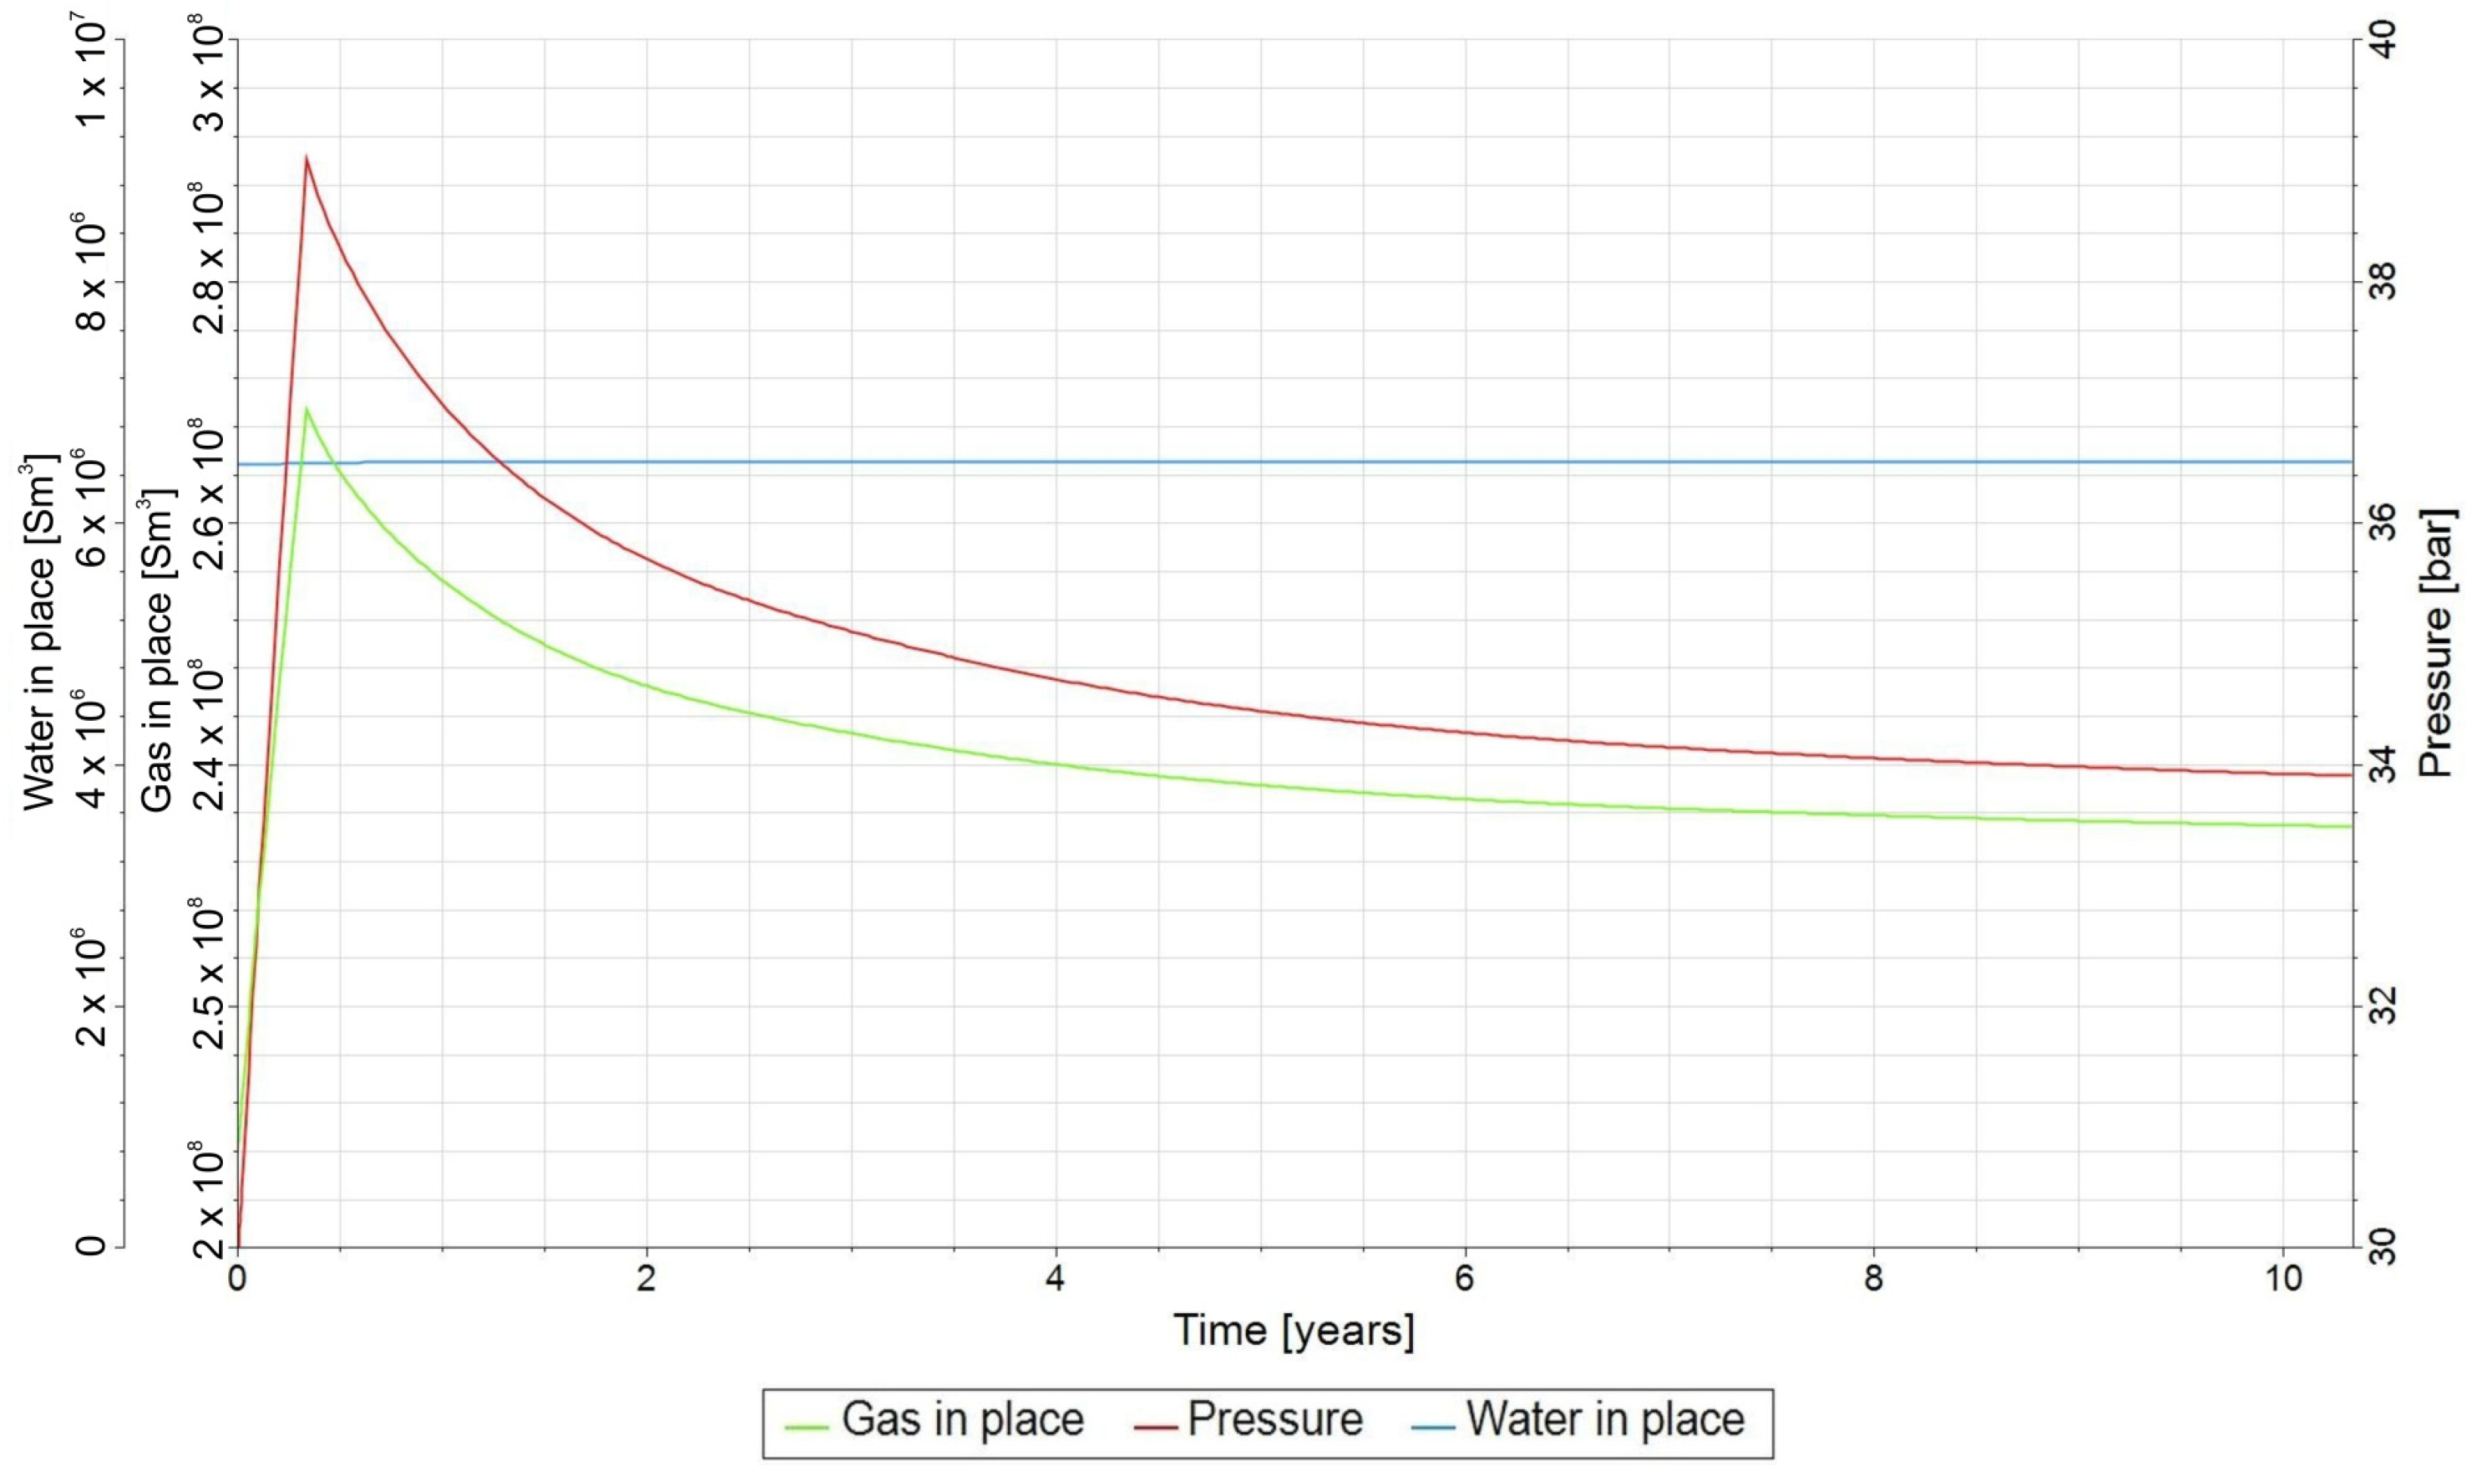
As a result of taking into account the phenomenon of the biomethanation and solubility of gases in formation water, the amount of gas in the gaseous state in the reservoir decreased, while the amount of water expressed in a unit volume increased, but remained negligible at the reservoir scale (Figure 6).
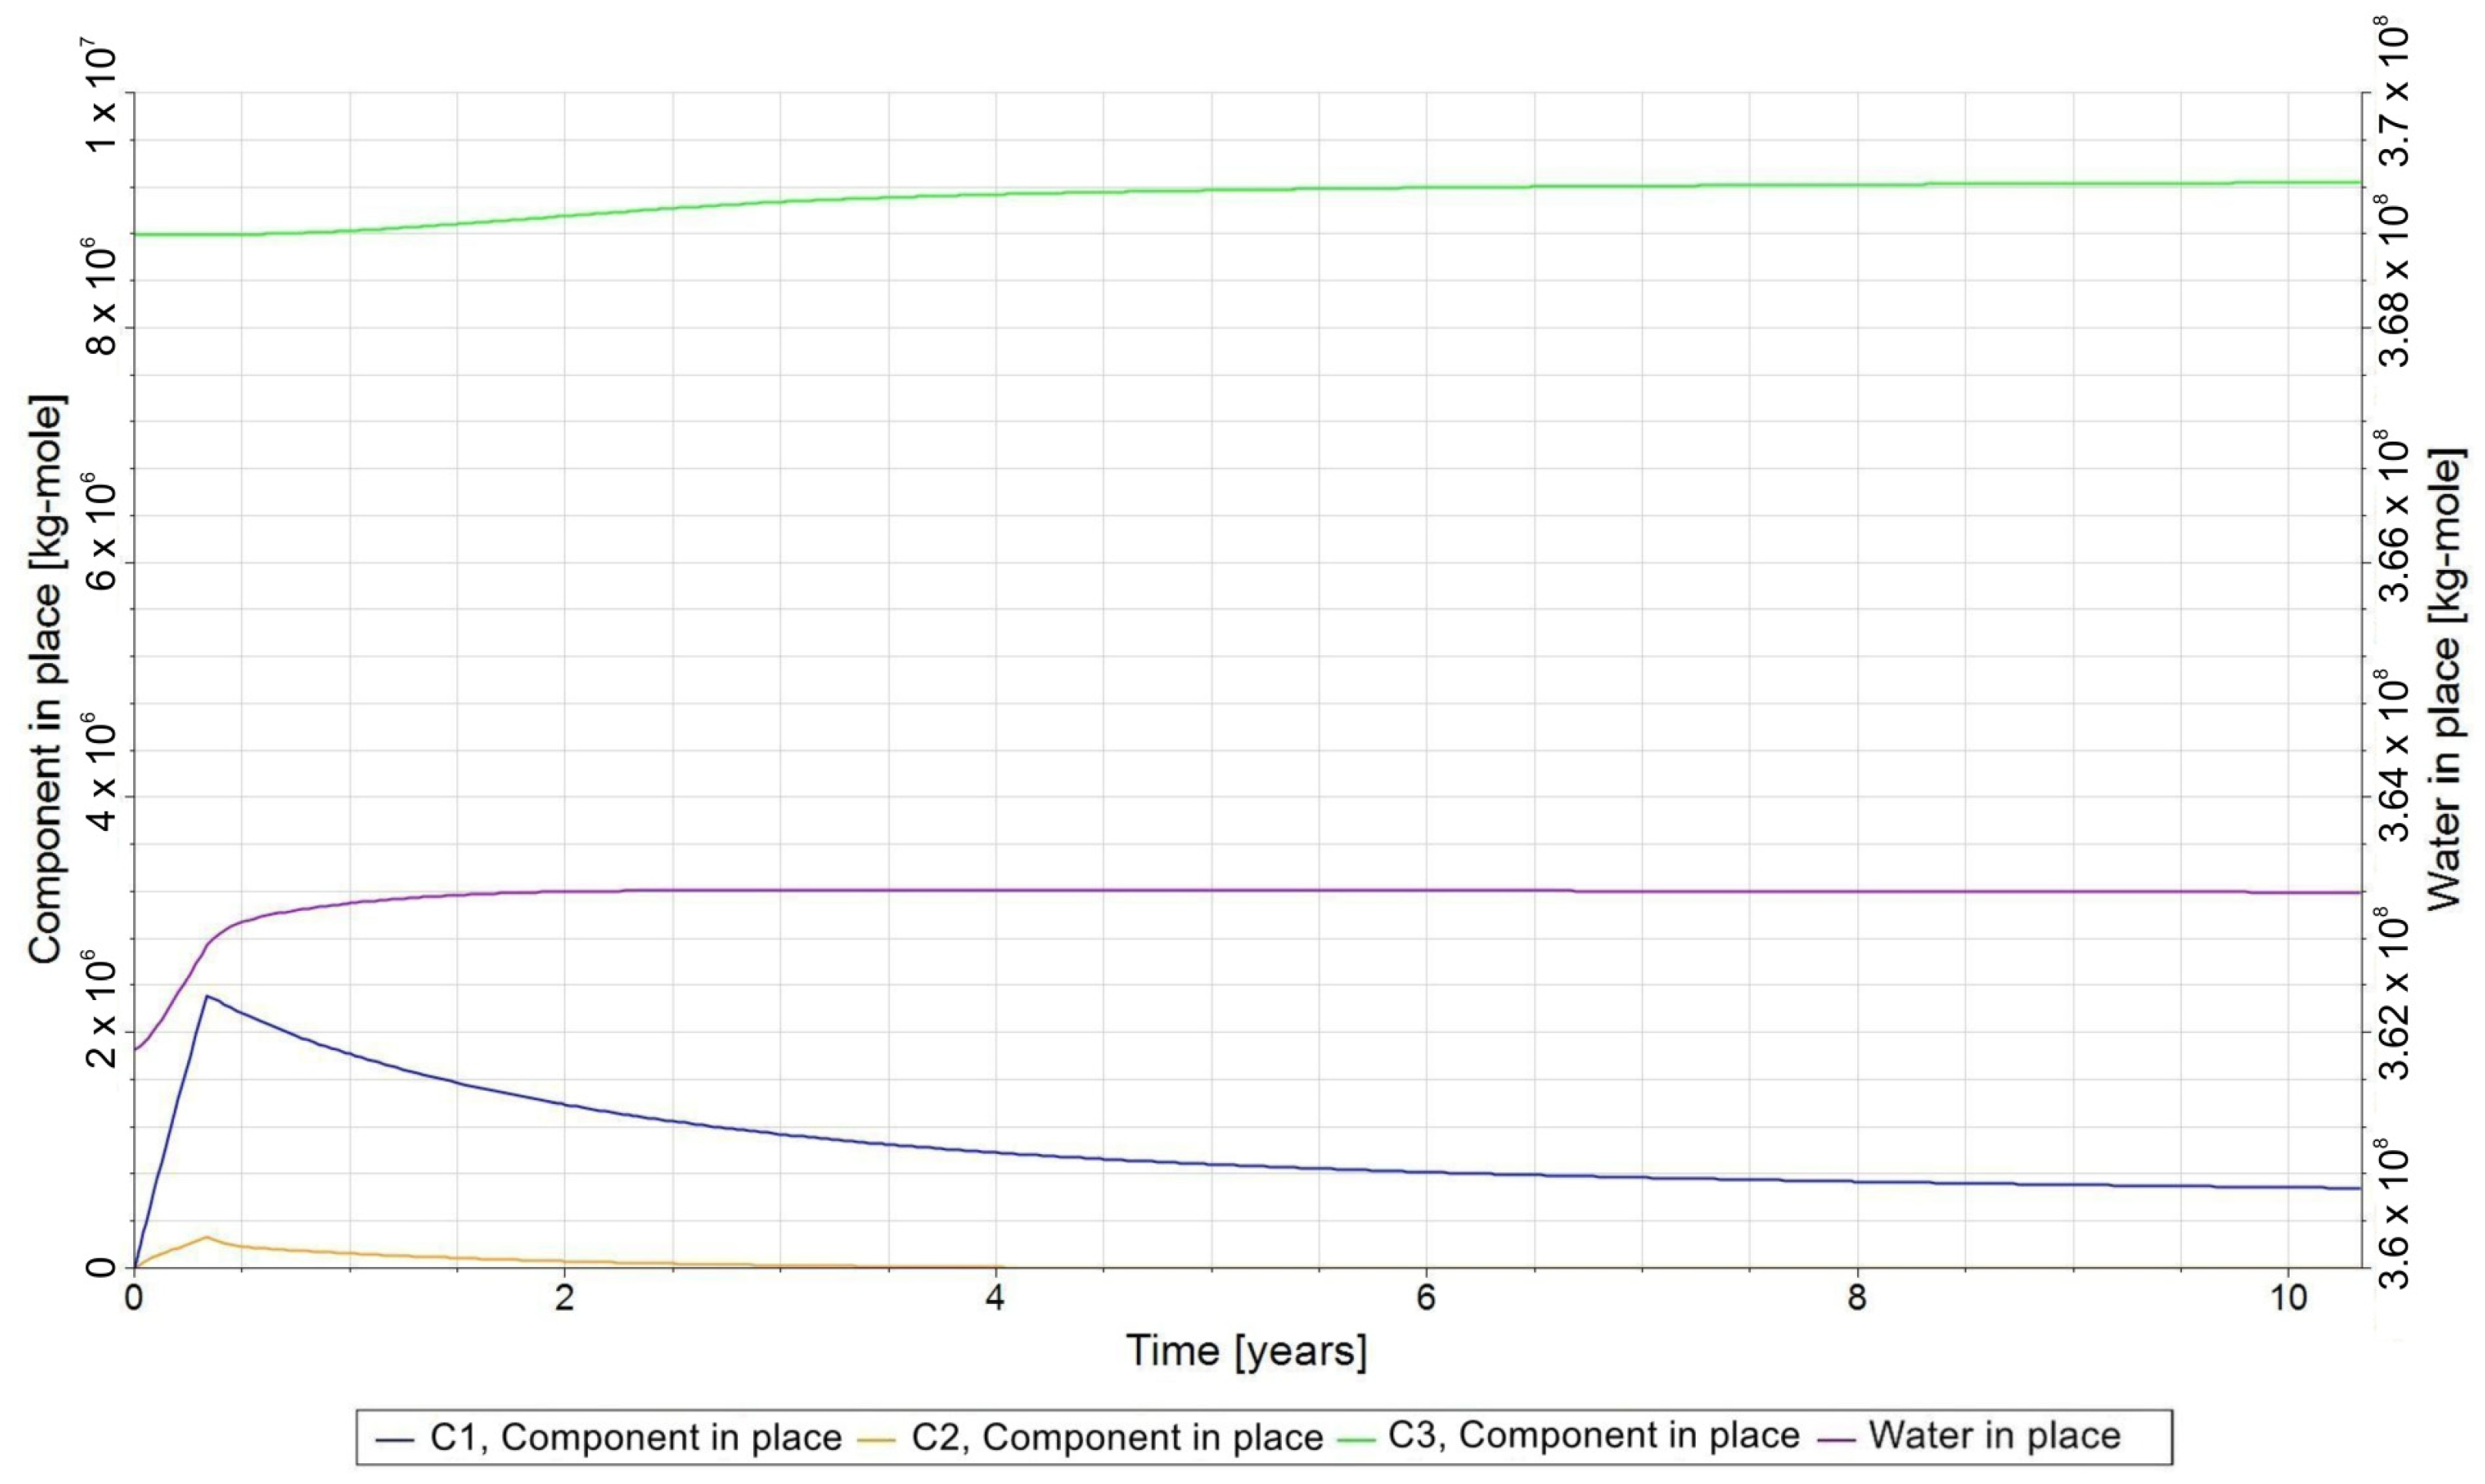
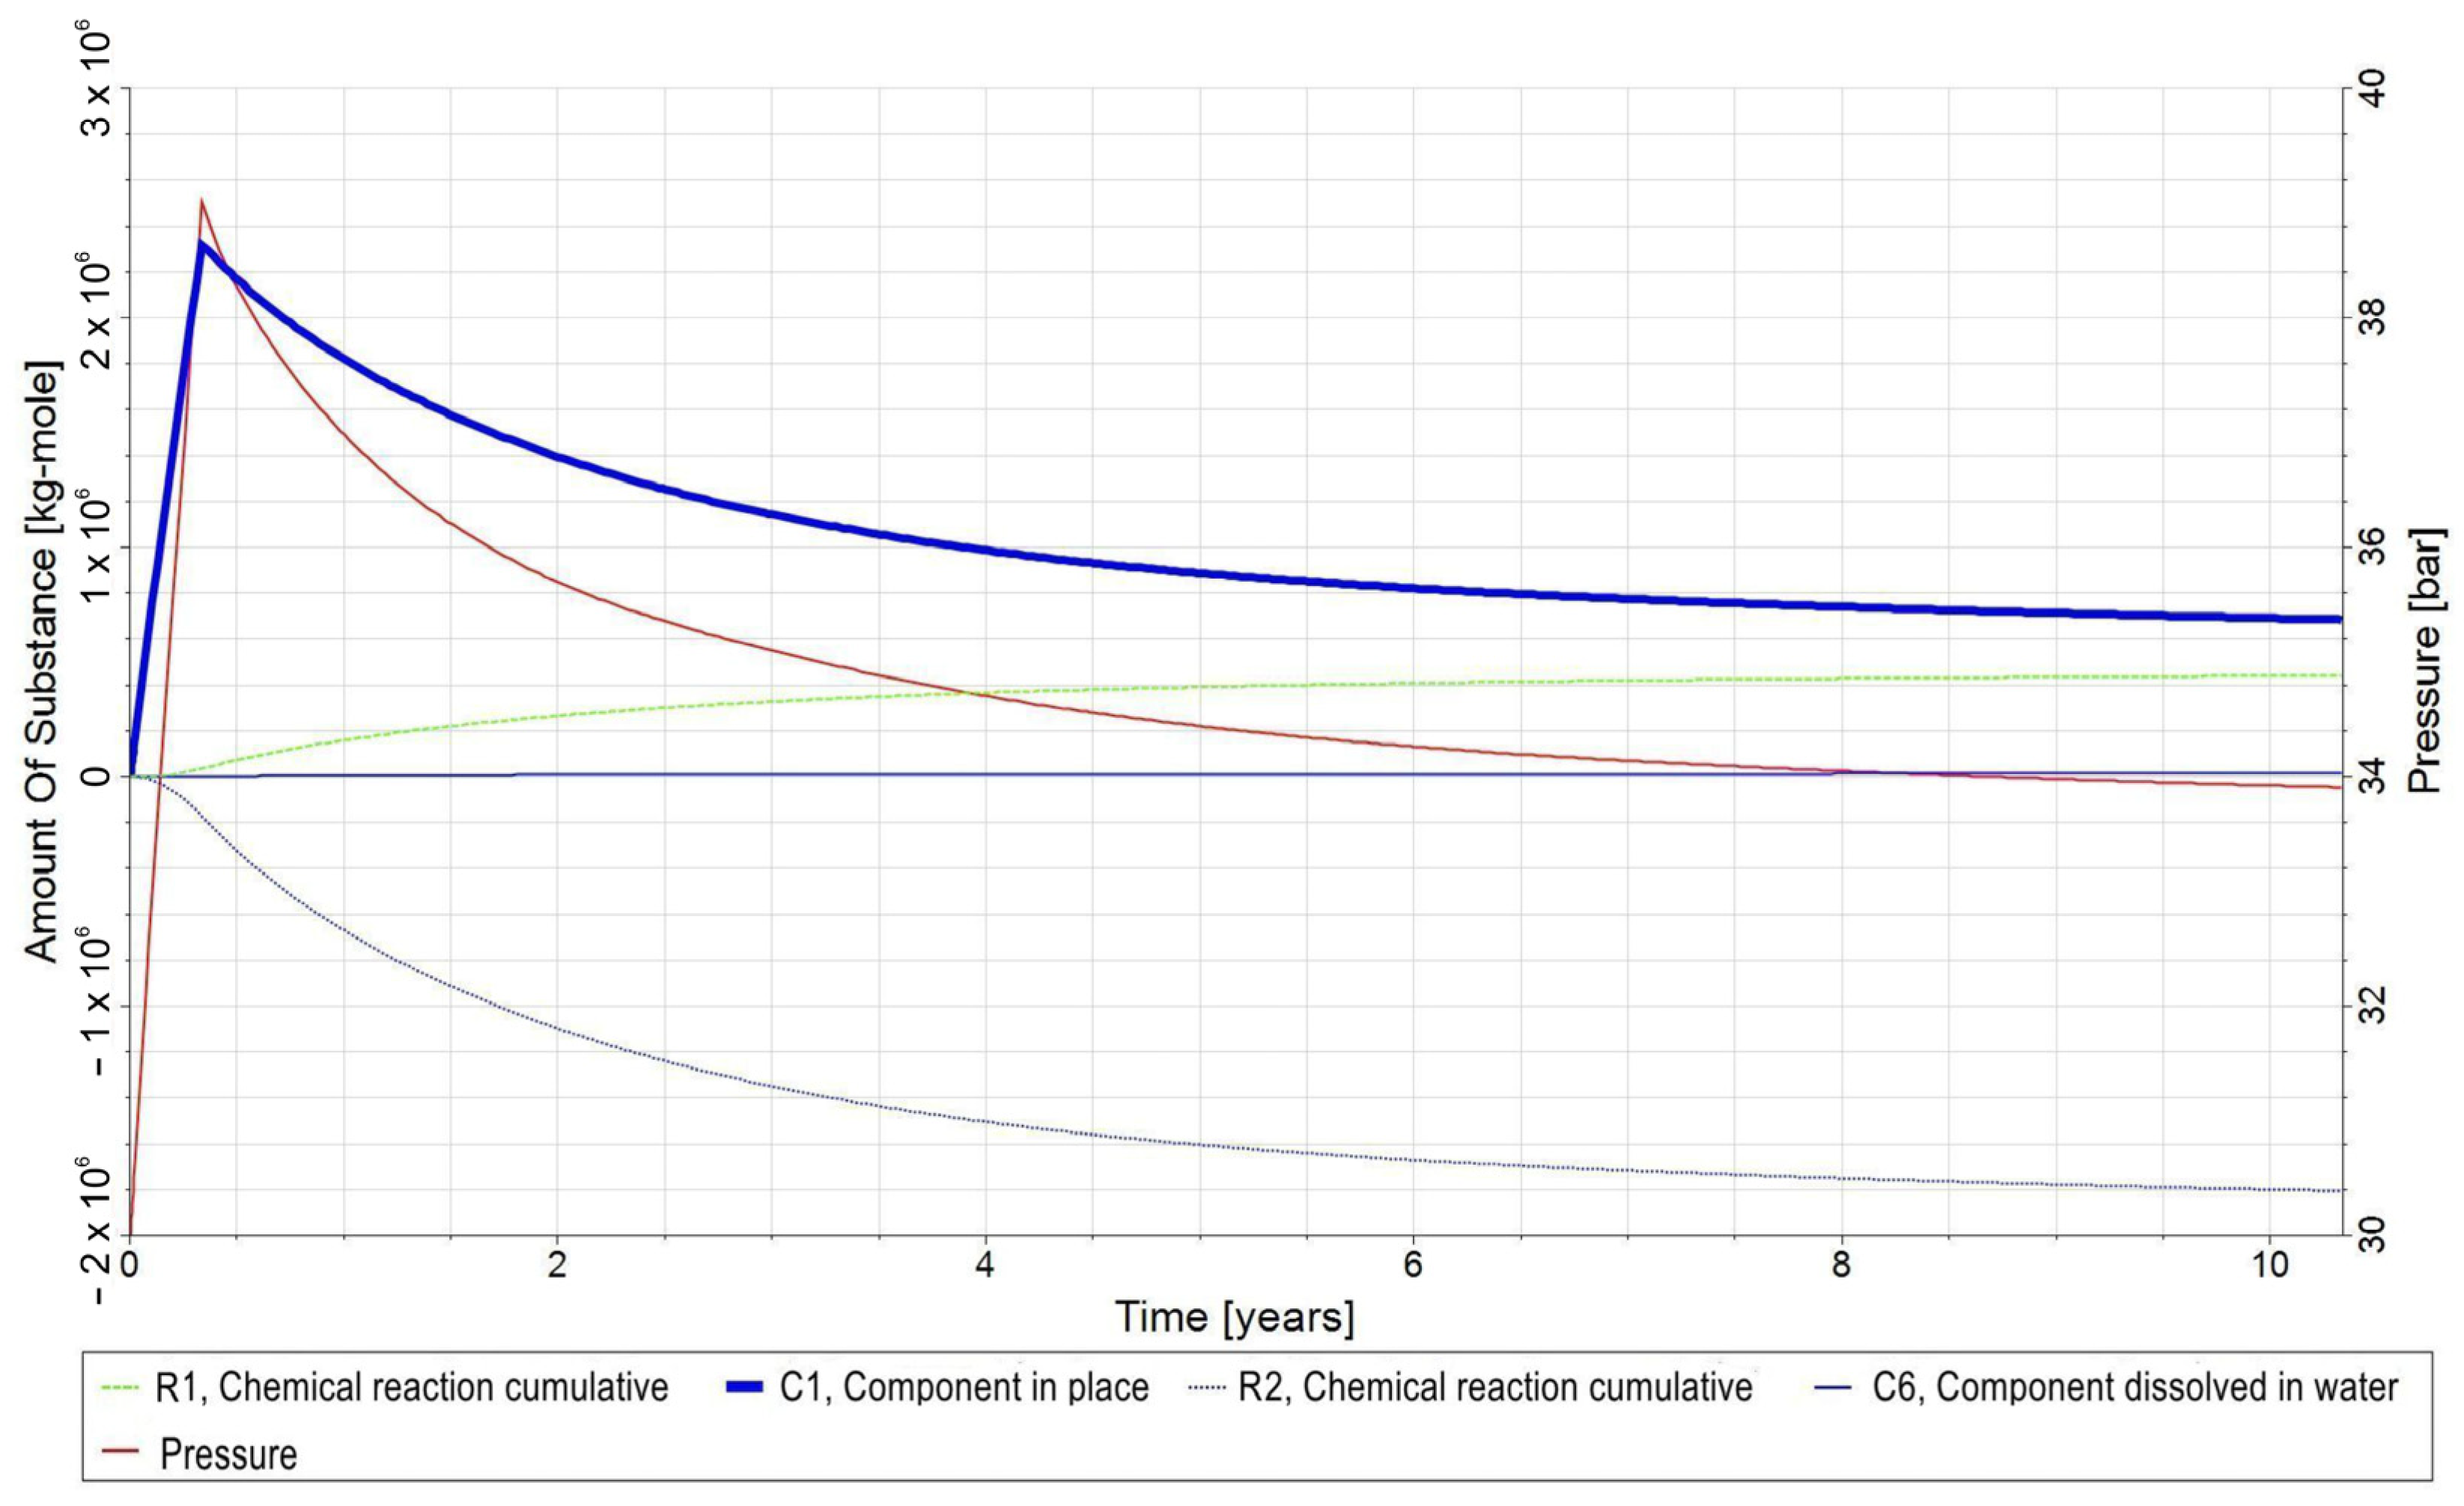
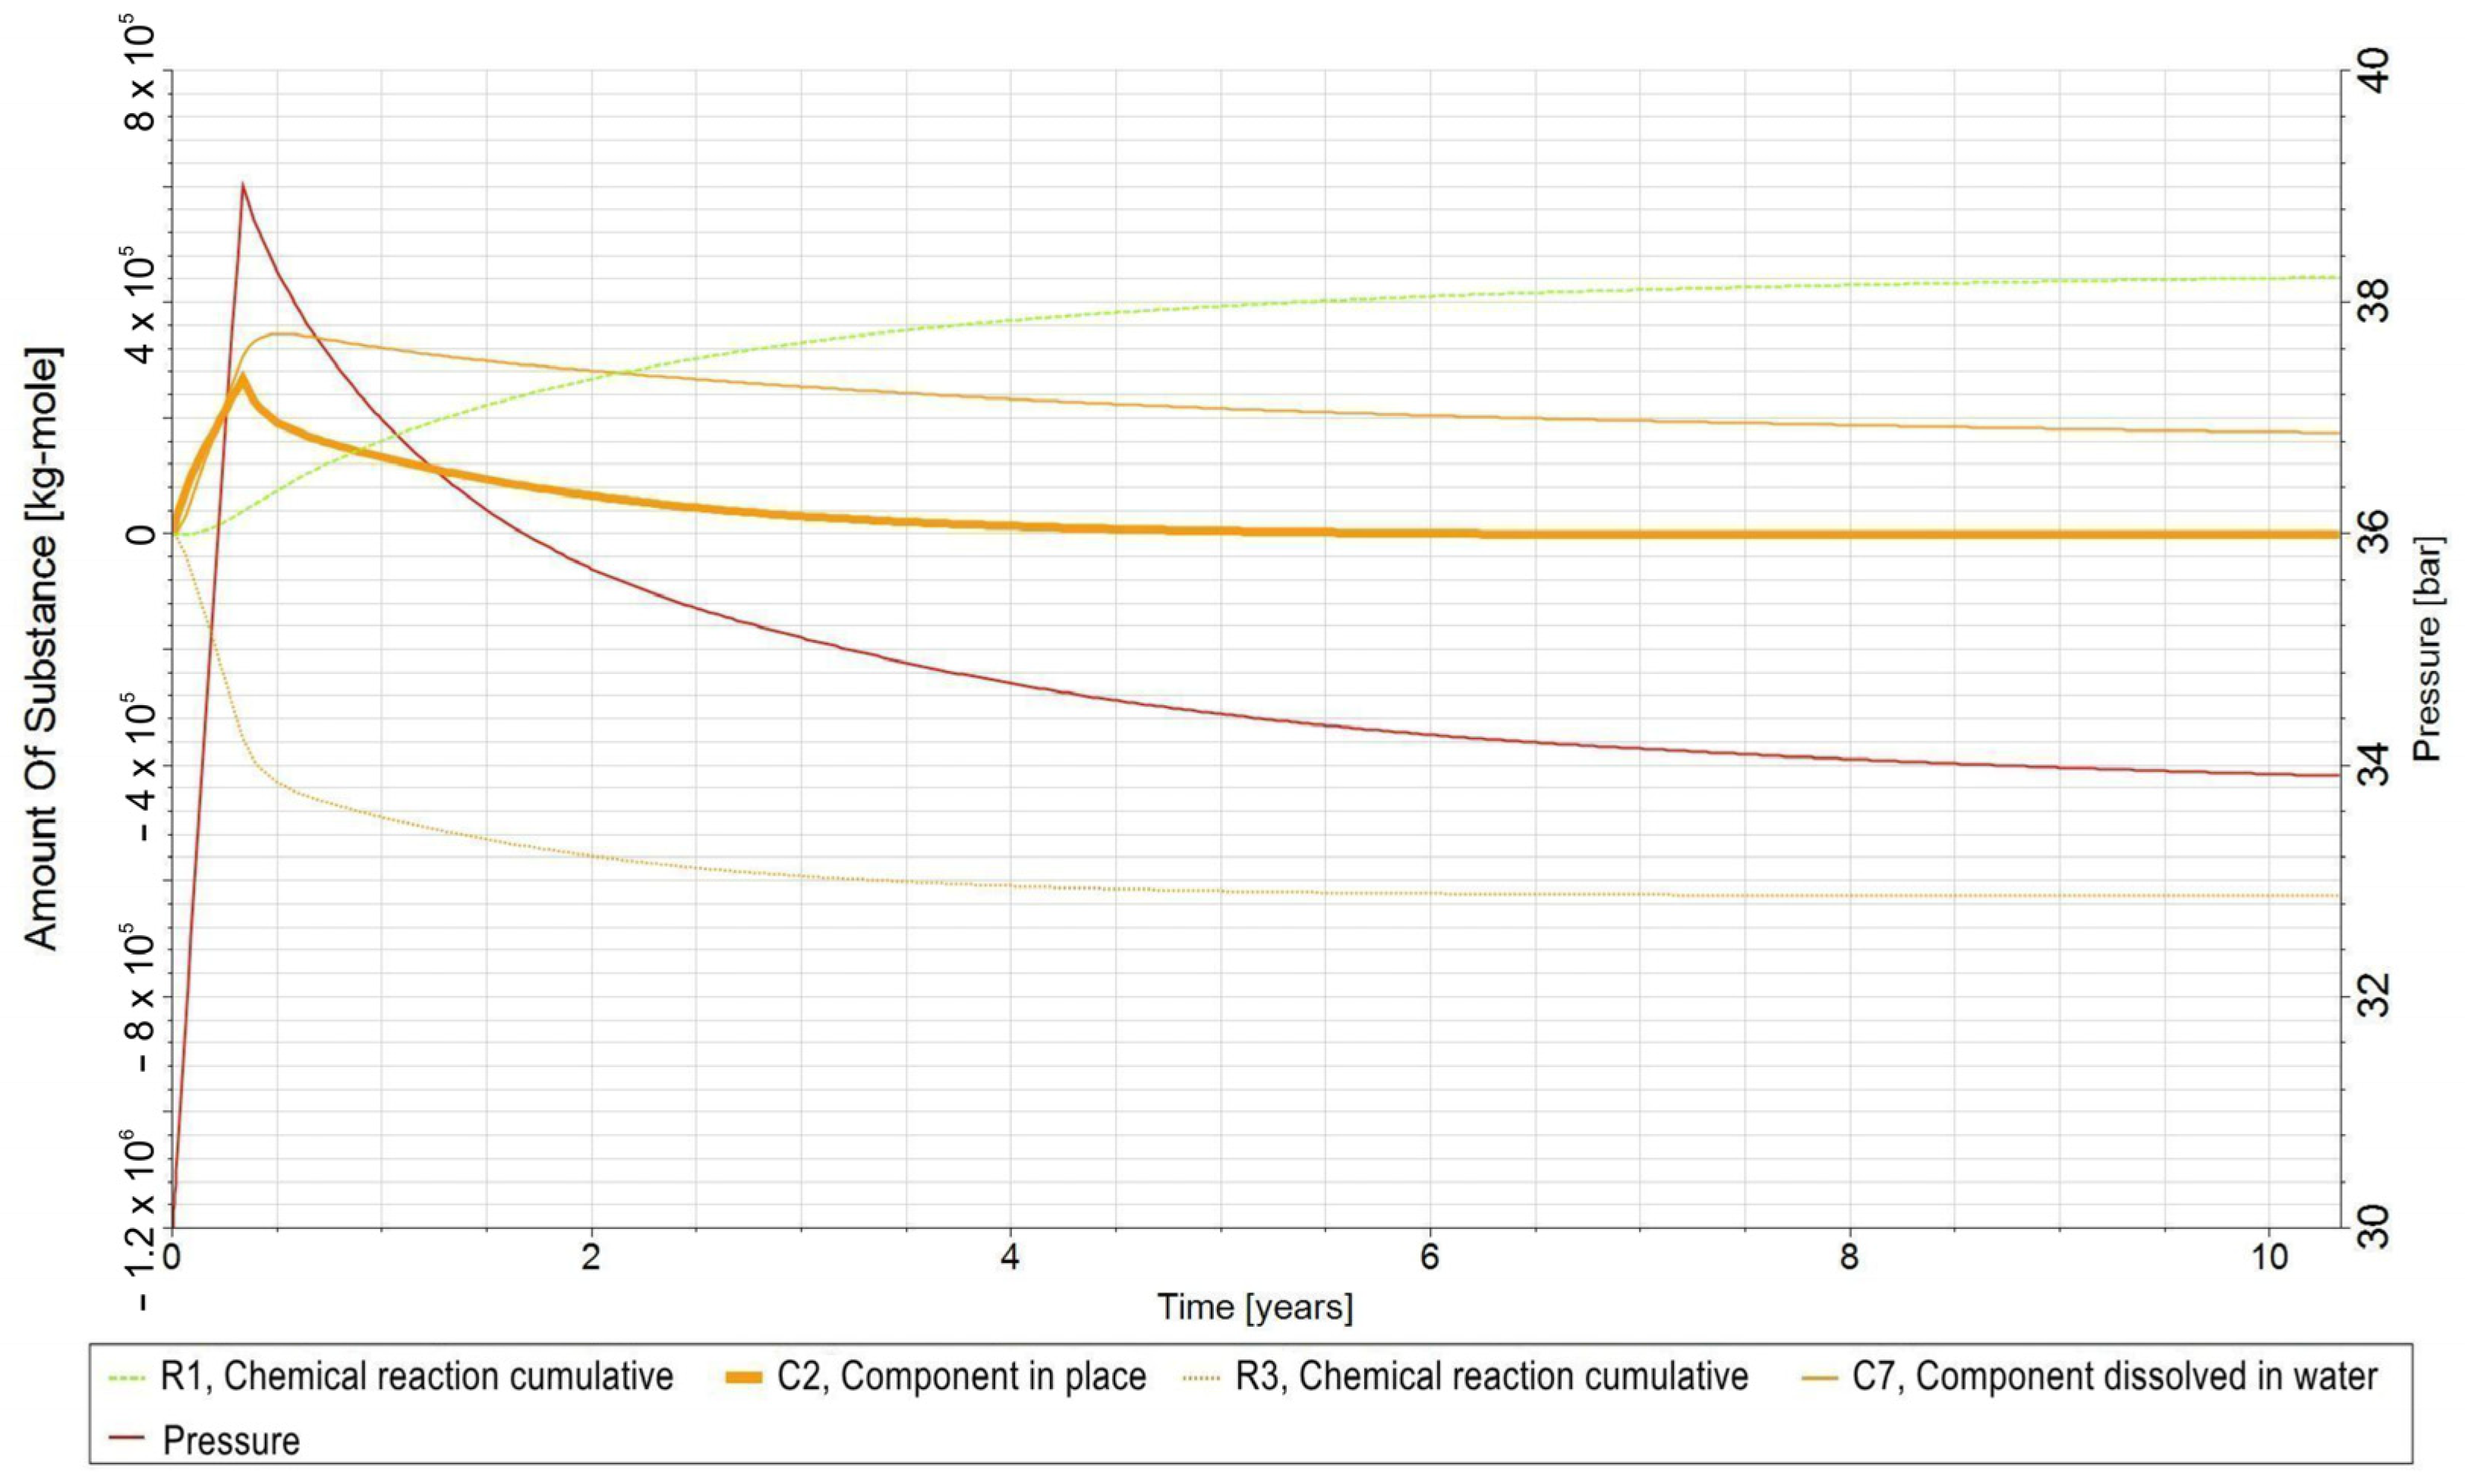
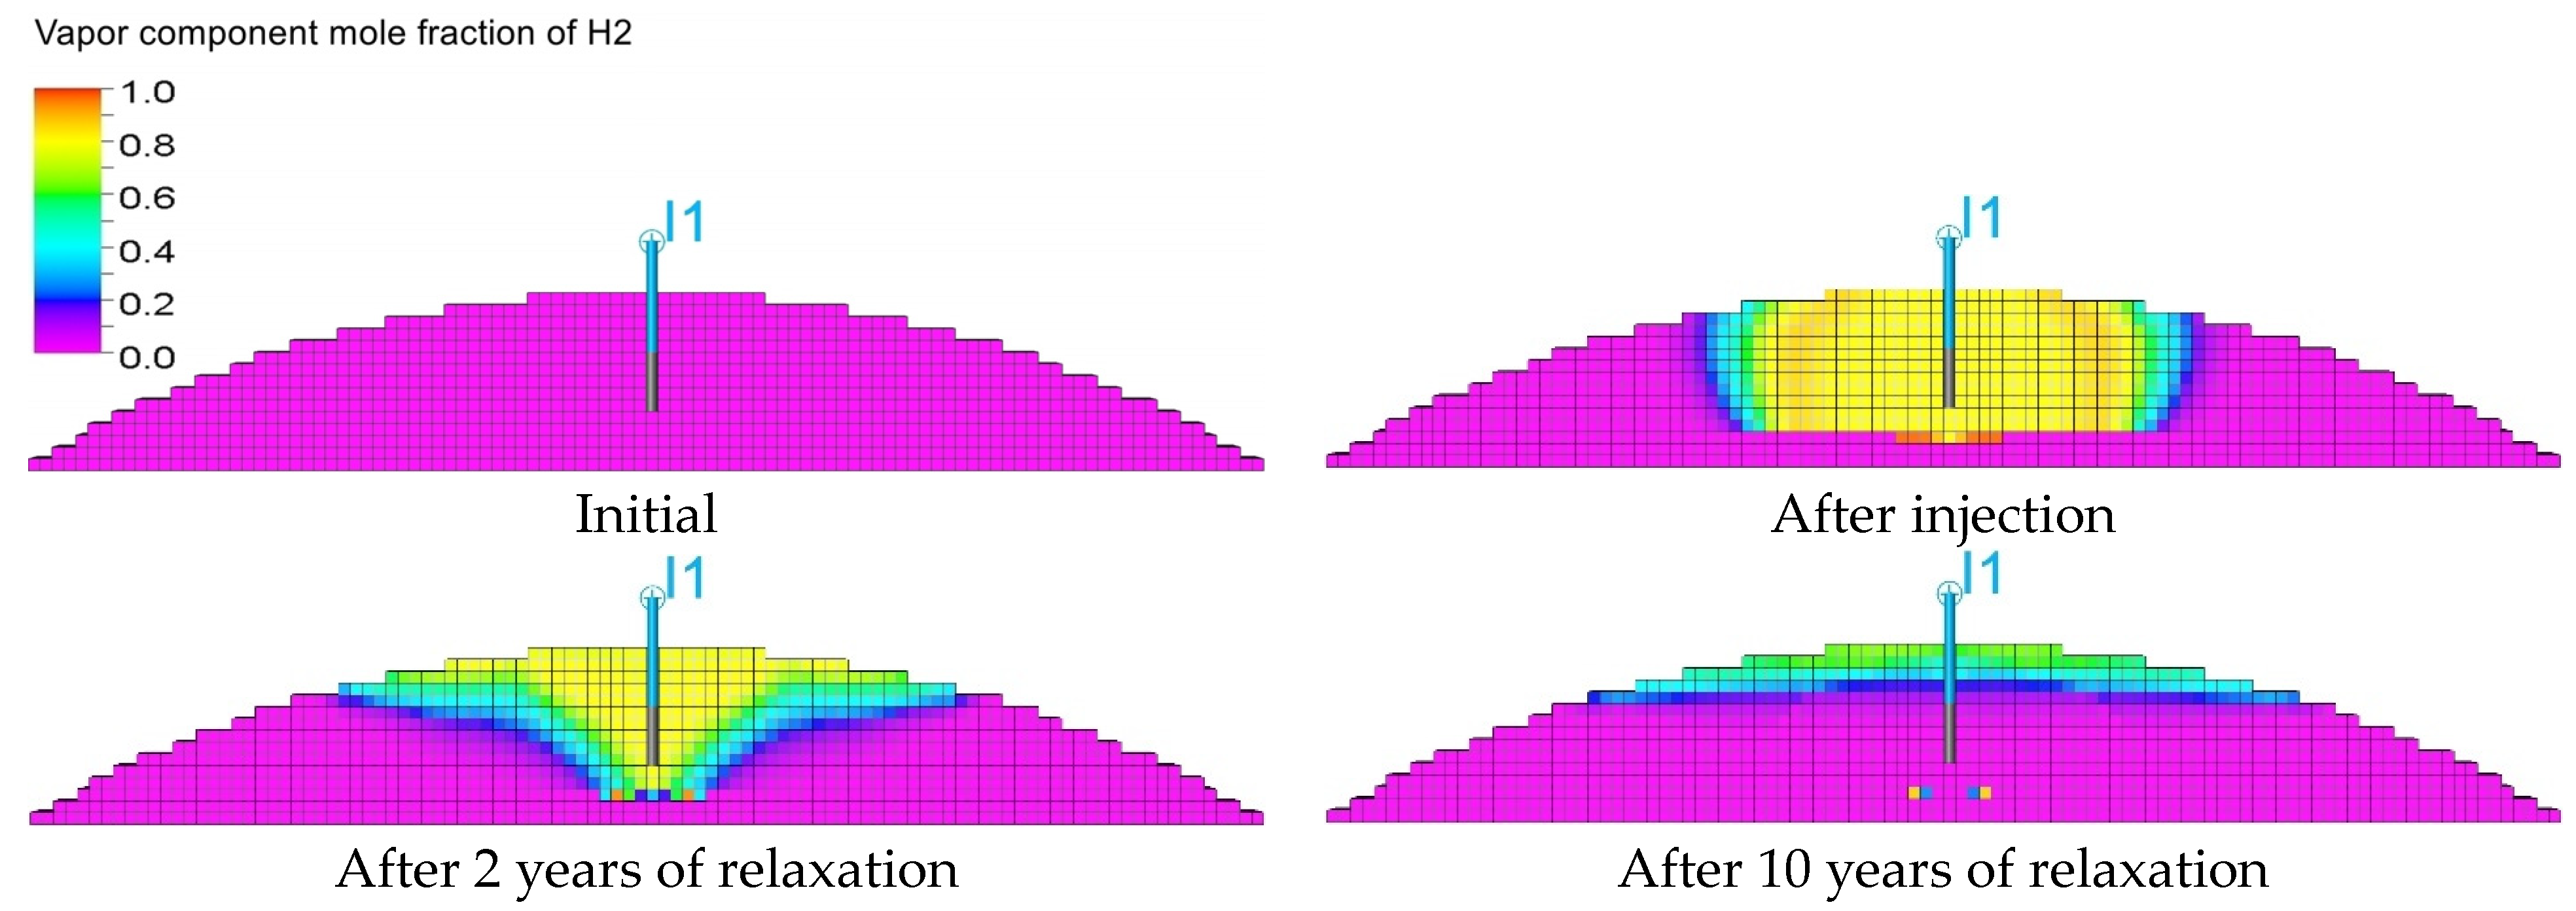
H2 (C1) as a gas that is very poorly soluble in water (Figure 4a) partially remains in the gas phase throughout the relaxation period, unlike CO2 (C2), i.e., a gas with high solubility in water (Figure 4b), which after 2 years of relaxation (counted from the end of the injection phase) completely dissolved in formation water (aqueous phase) (Figure 7). The increase in CH4 (C3) in the gas phase was observed one year after the start of the relaxation stage, which is related not only to the gradual biomethanation reaction, but also to the gradual decrease in reservoir pressure, and thus to the decrease in the solubility of methane, thanks to which it can be released from the aqueous phase to the gas phase faster.
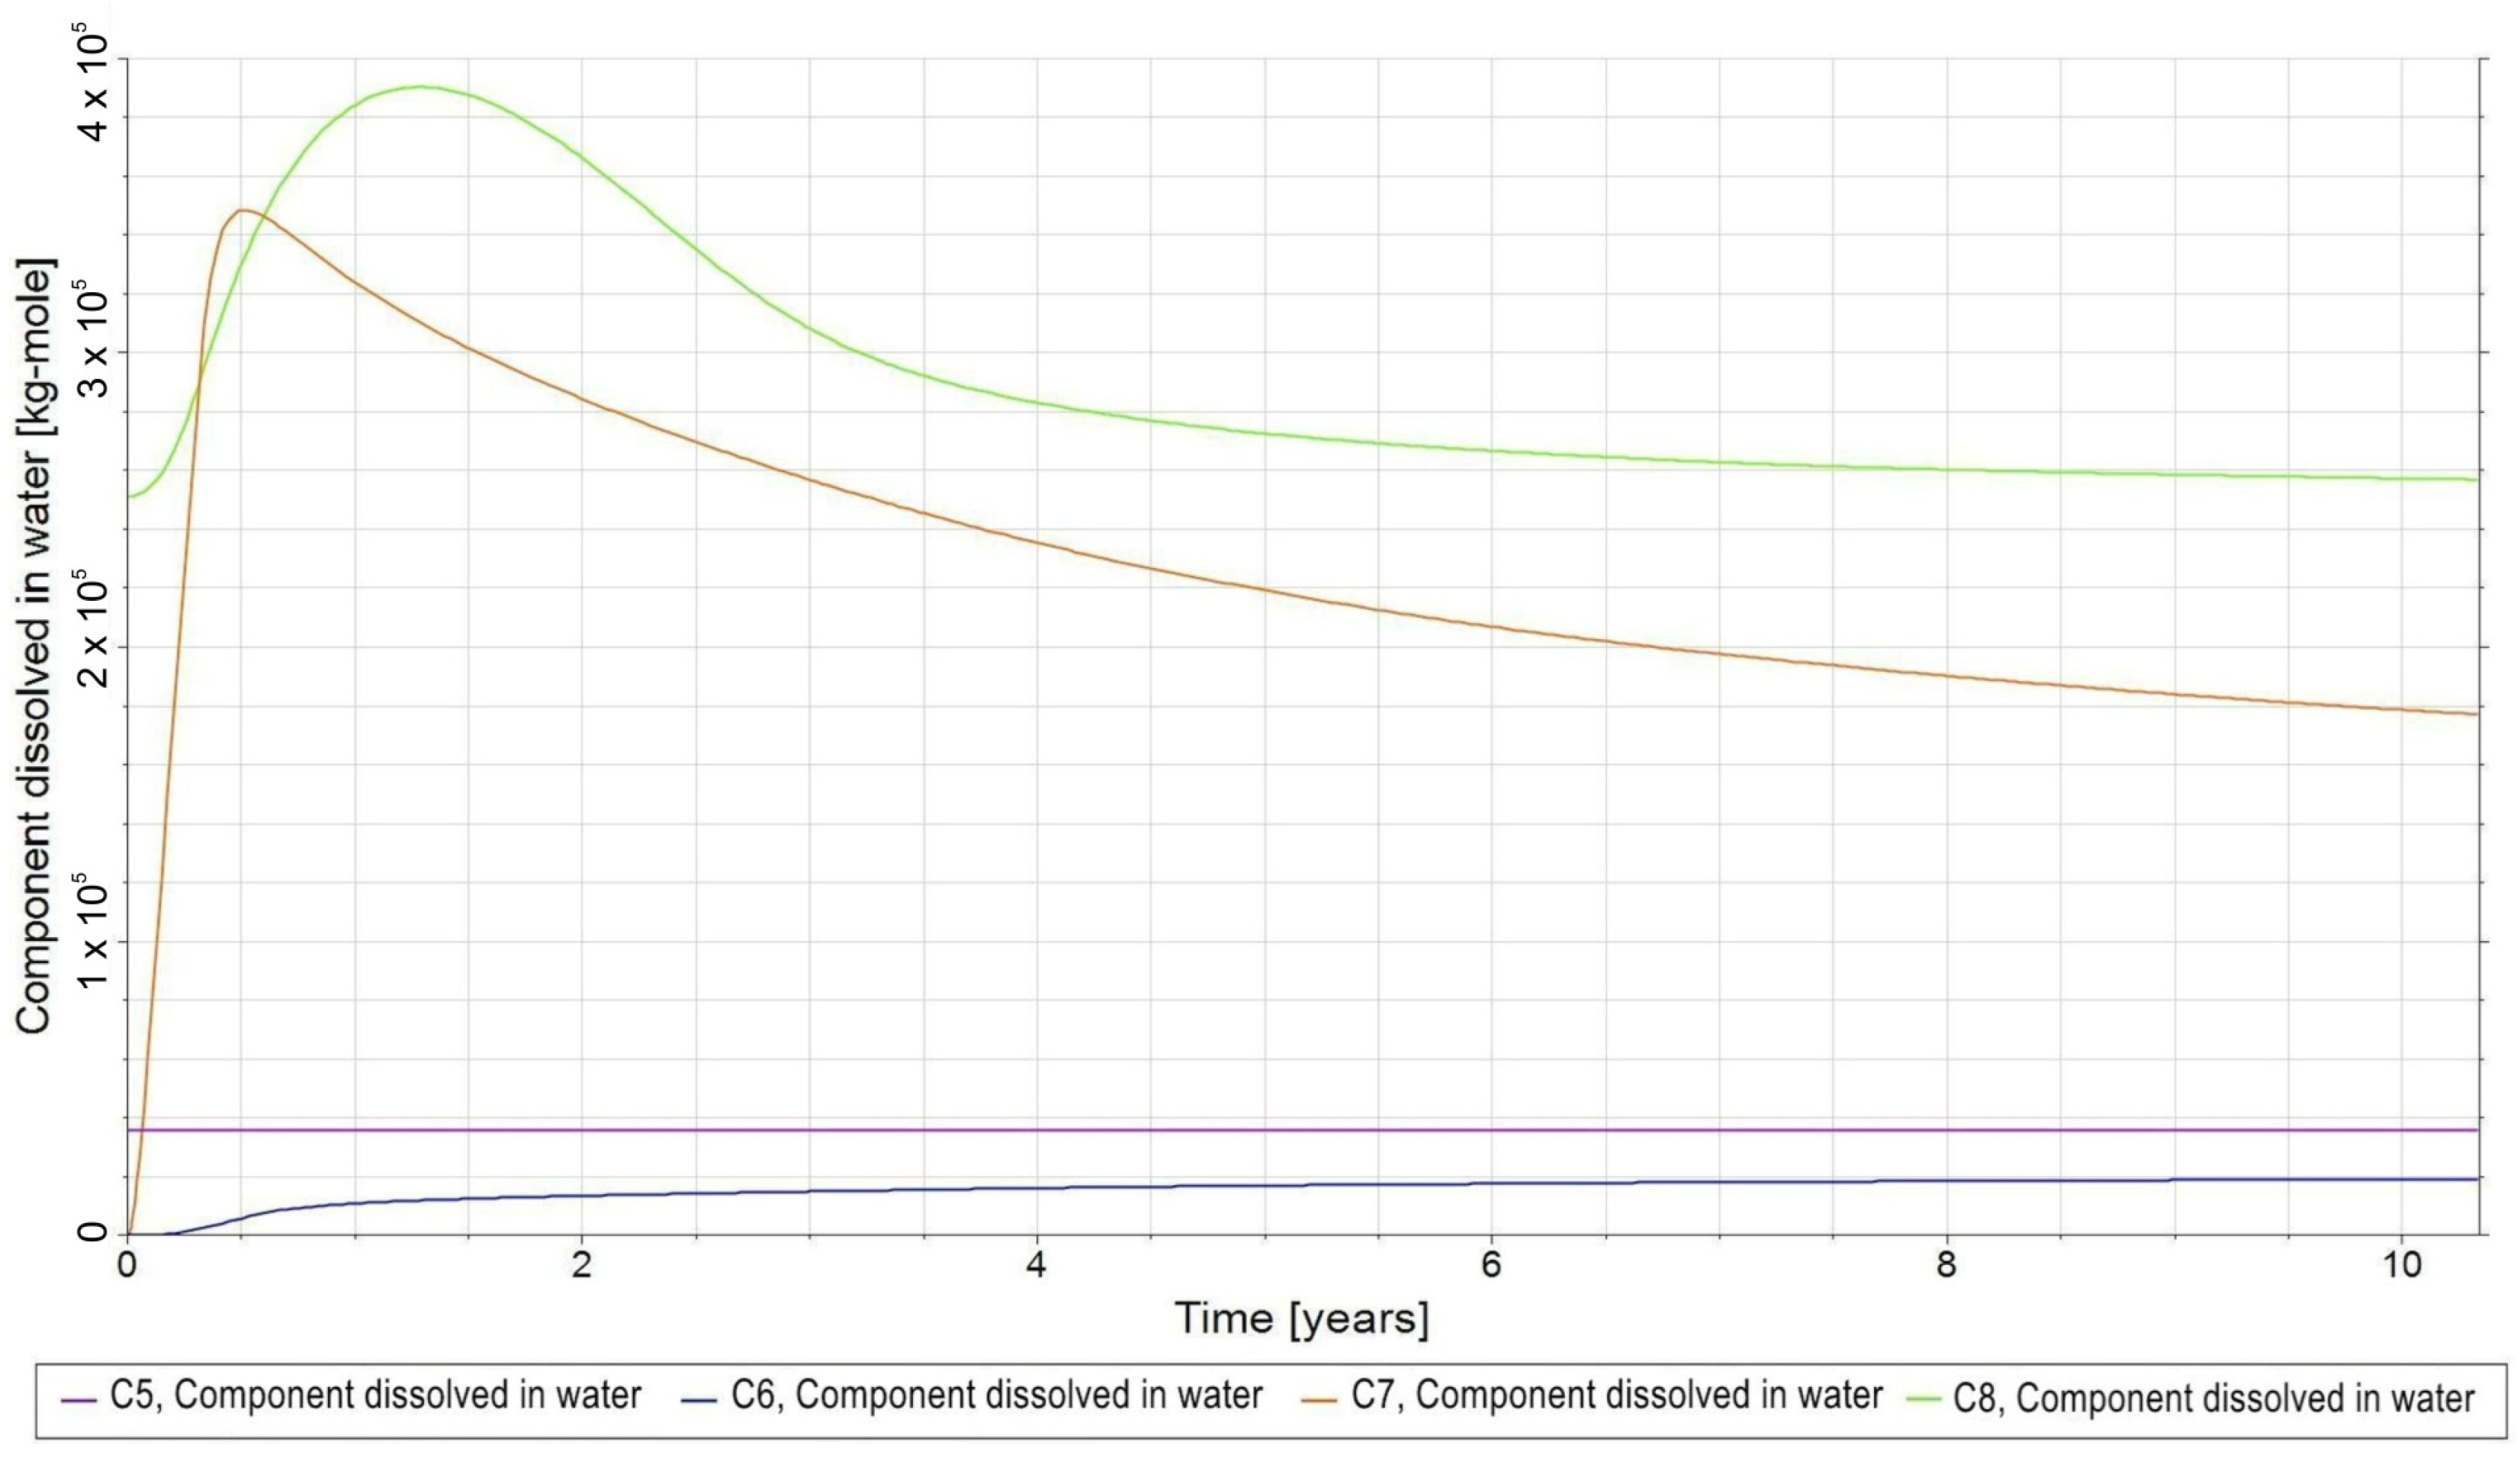
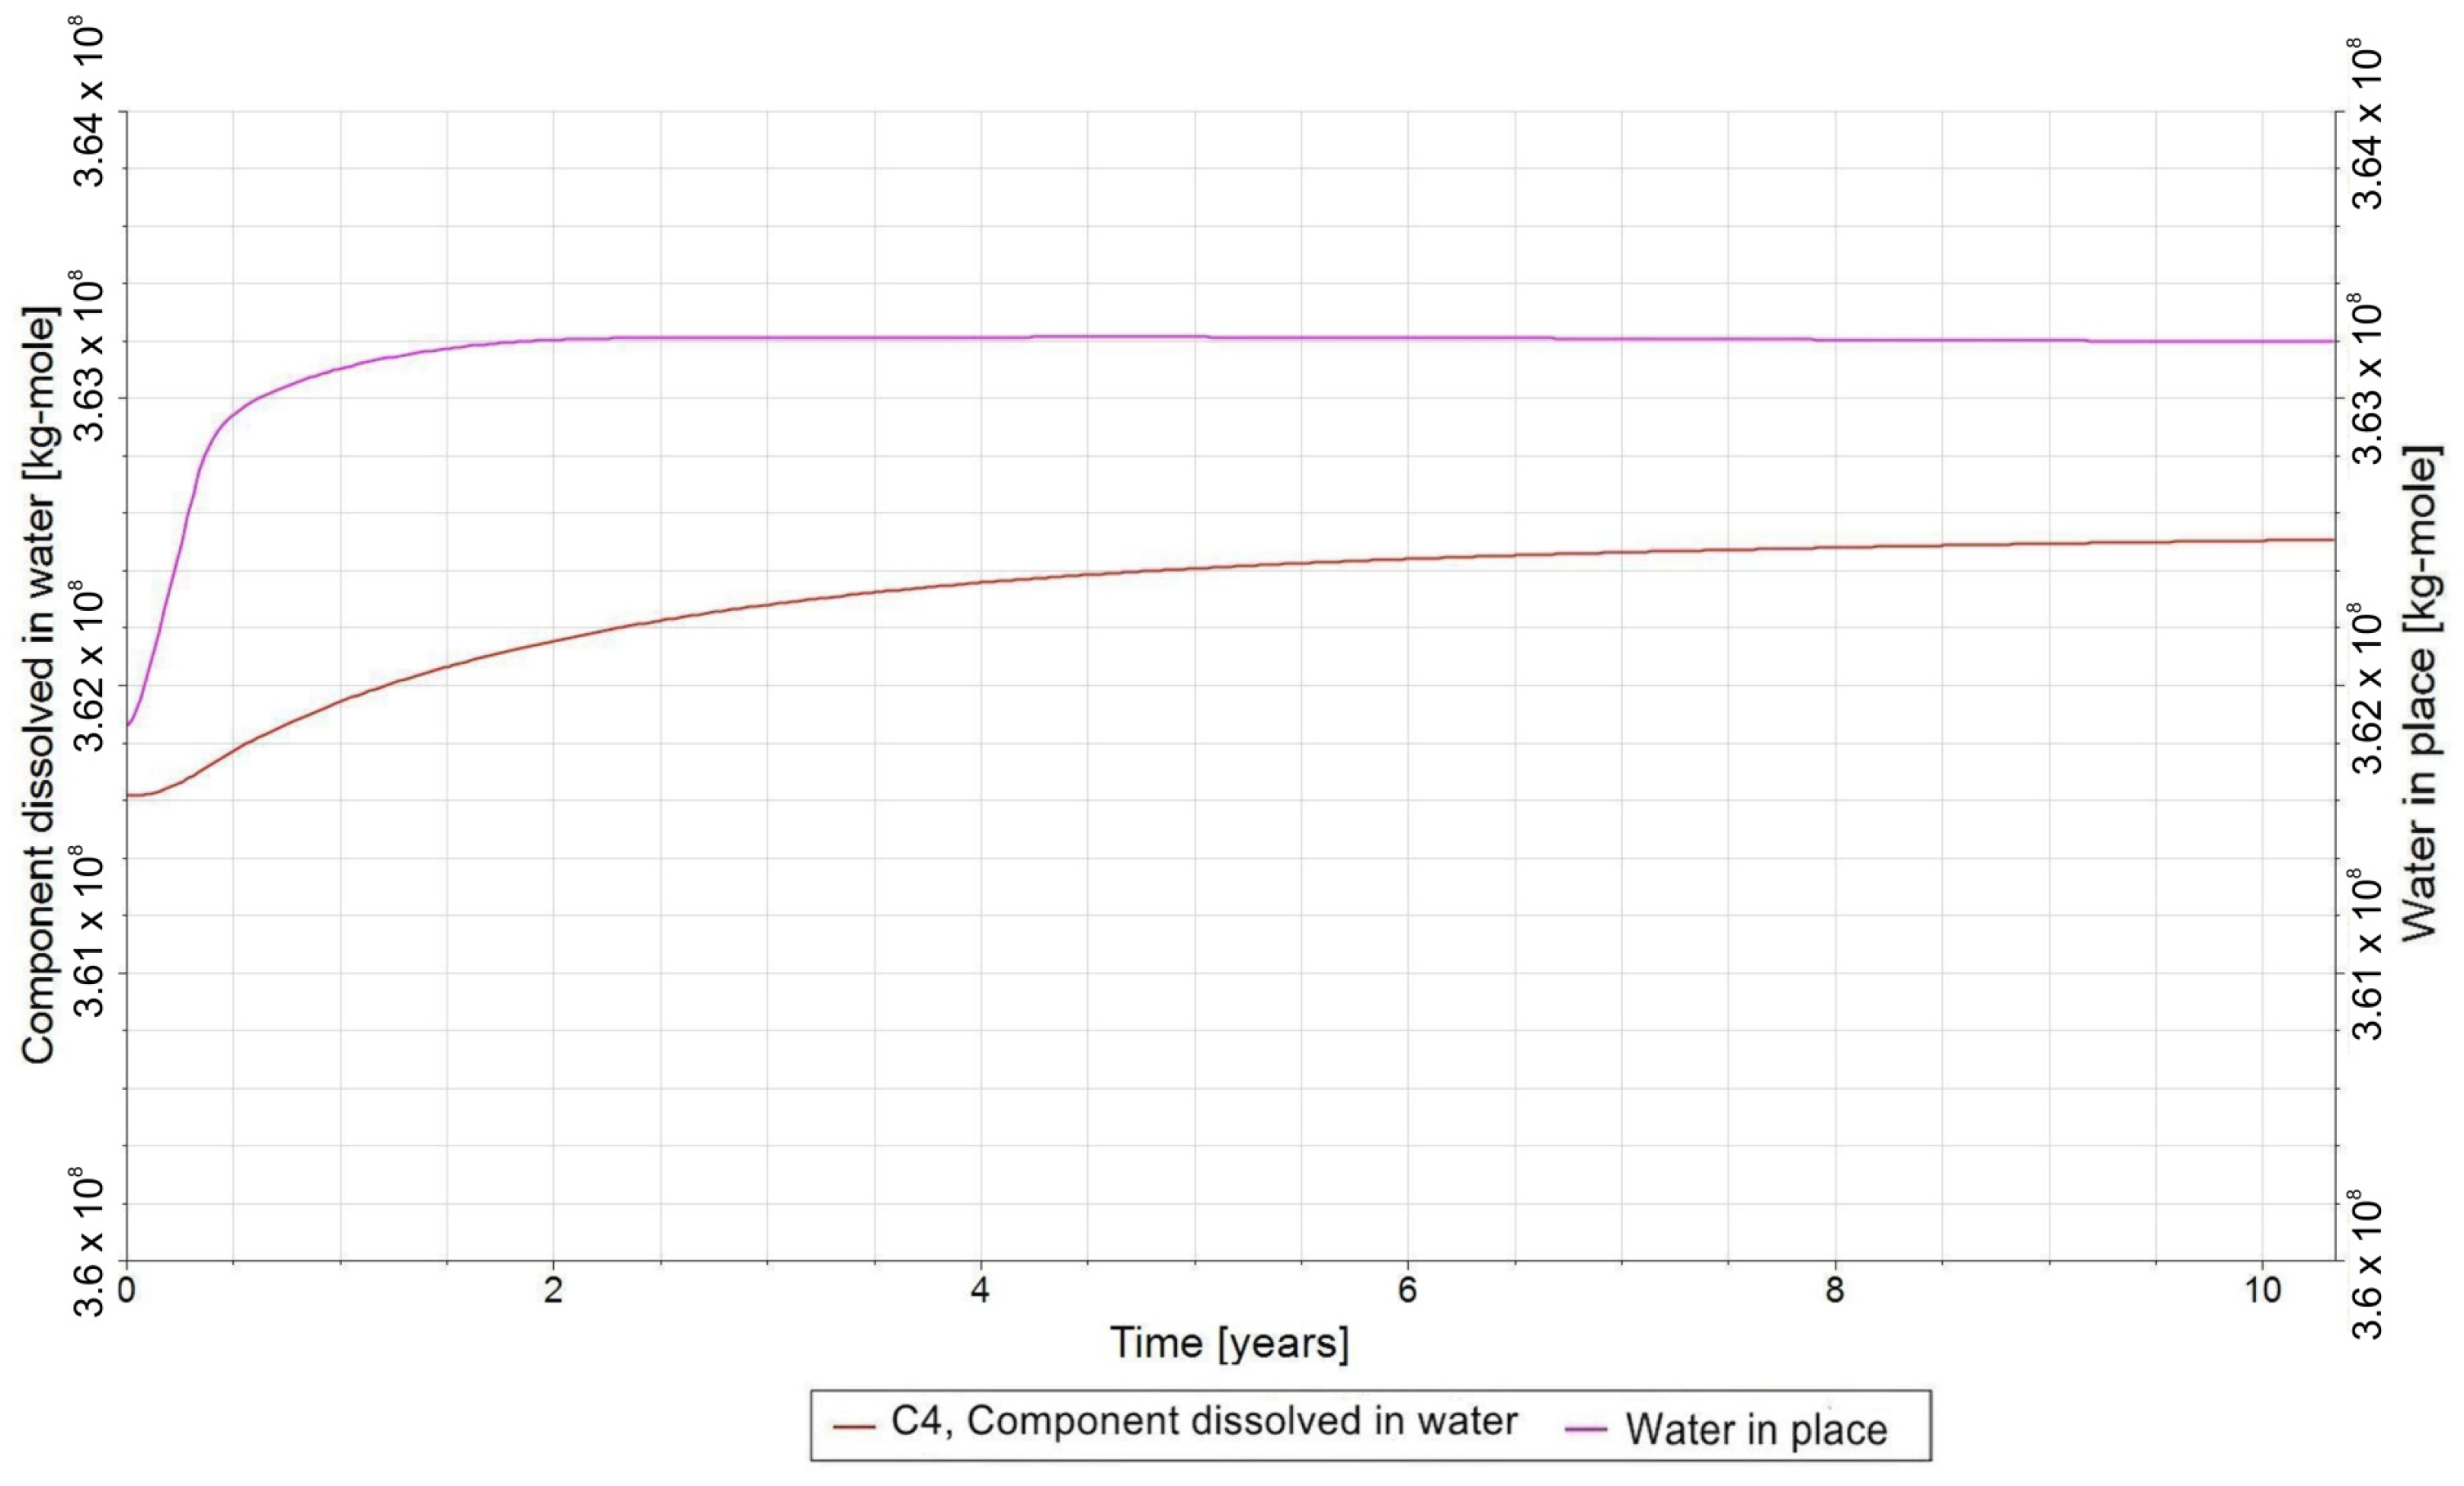
Figure 7 confirms that CO2 (C2), as the most soluble gas of all gases, is converted very quickly into CO2,DS (C7). On the other hand, the solubility of H2 (C1) is at least an order of magnitude lower, which results in the immediate use of the dissolving H2,DS (C6) in the biomethanation reaction, which in turn translates into the subsequent appearance of this component, i.e., H2,DS (C6) in the aqueous phase (Figure 8). In this case, the low solubility of H2 is a limiting factor in the biomethanation process. Due to the simplified assumption regarding the multiplication of bacteria, their amount in the reservoir is constant throughout the entire period of gas injection into the reservoir and relaxation (C5). Since the number of moles of original formation water in the whole pore volume is disproportionately greater than the number of moles of the aqueous phase being the product of the reaction (biomethanation), slight changes in this amount are observed (Figure 9).
Due to the low solubility of H2 (C1), this gas remains mainly in a free state throughout the relaxation period, and its amount dissolved in the formation water (C6) is negligible, because almost immediately after dissolution (R2) it undergoes the biomethanation reaction (R1), which is shown in Figure 10.
The next Figure 11 shows analogous quantities for CO2, which, as the gas with the highest solubility, dissolves in water (R3) from the beginning of injection, changing from the gaseous state (C2) to the aqueous phase (C7). This gas, due to its relatively high solubility with the simultaneous low solubility of the second component of biomethanation, i.e., H2,DS, remains dissolved in water until the end of relaxation, while it is absent in the gas phase.
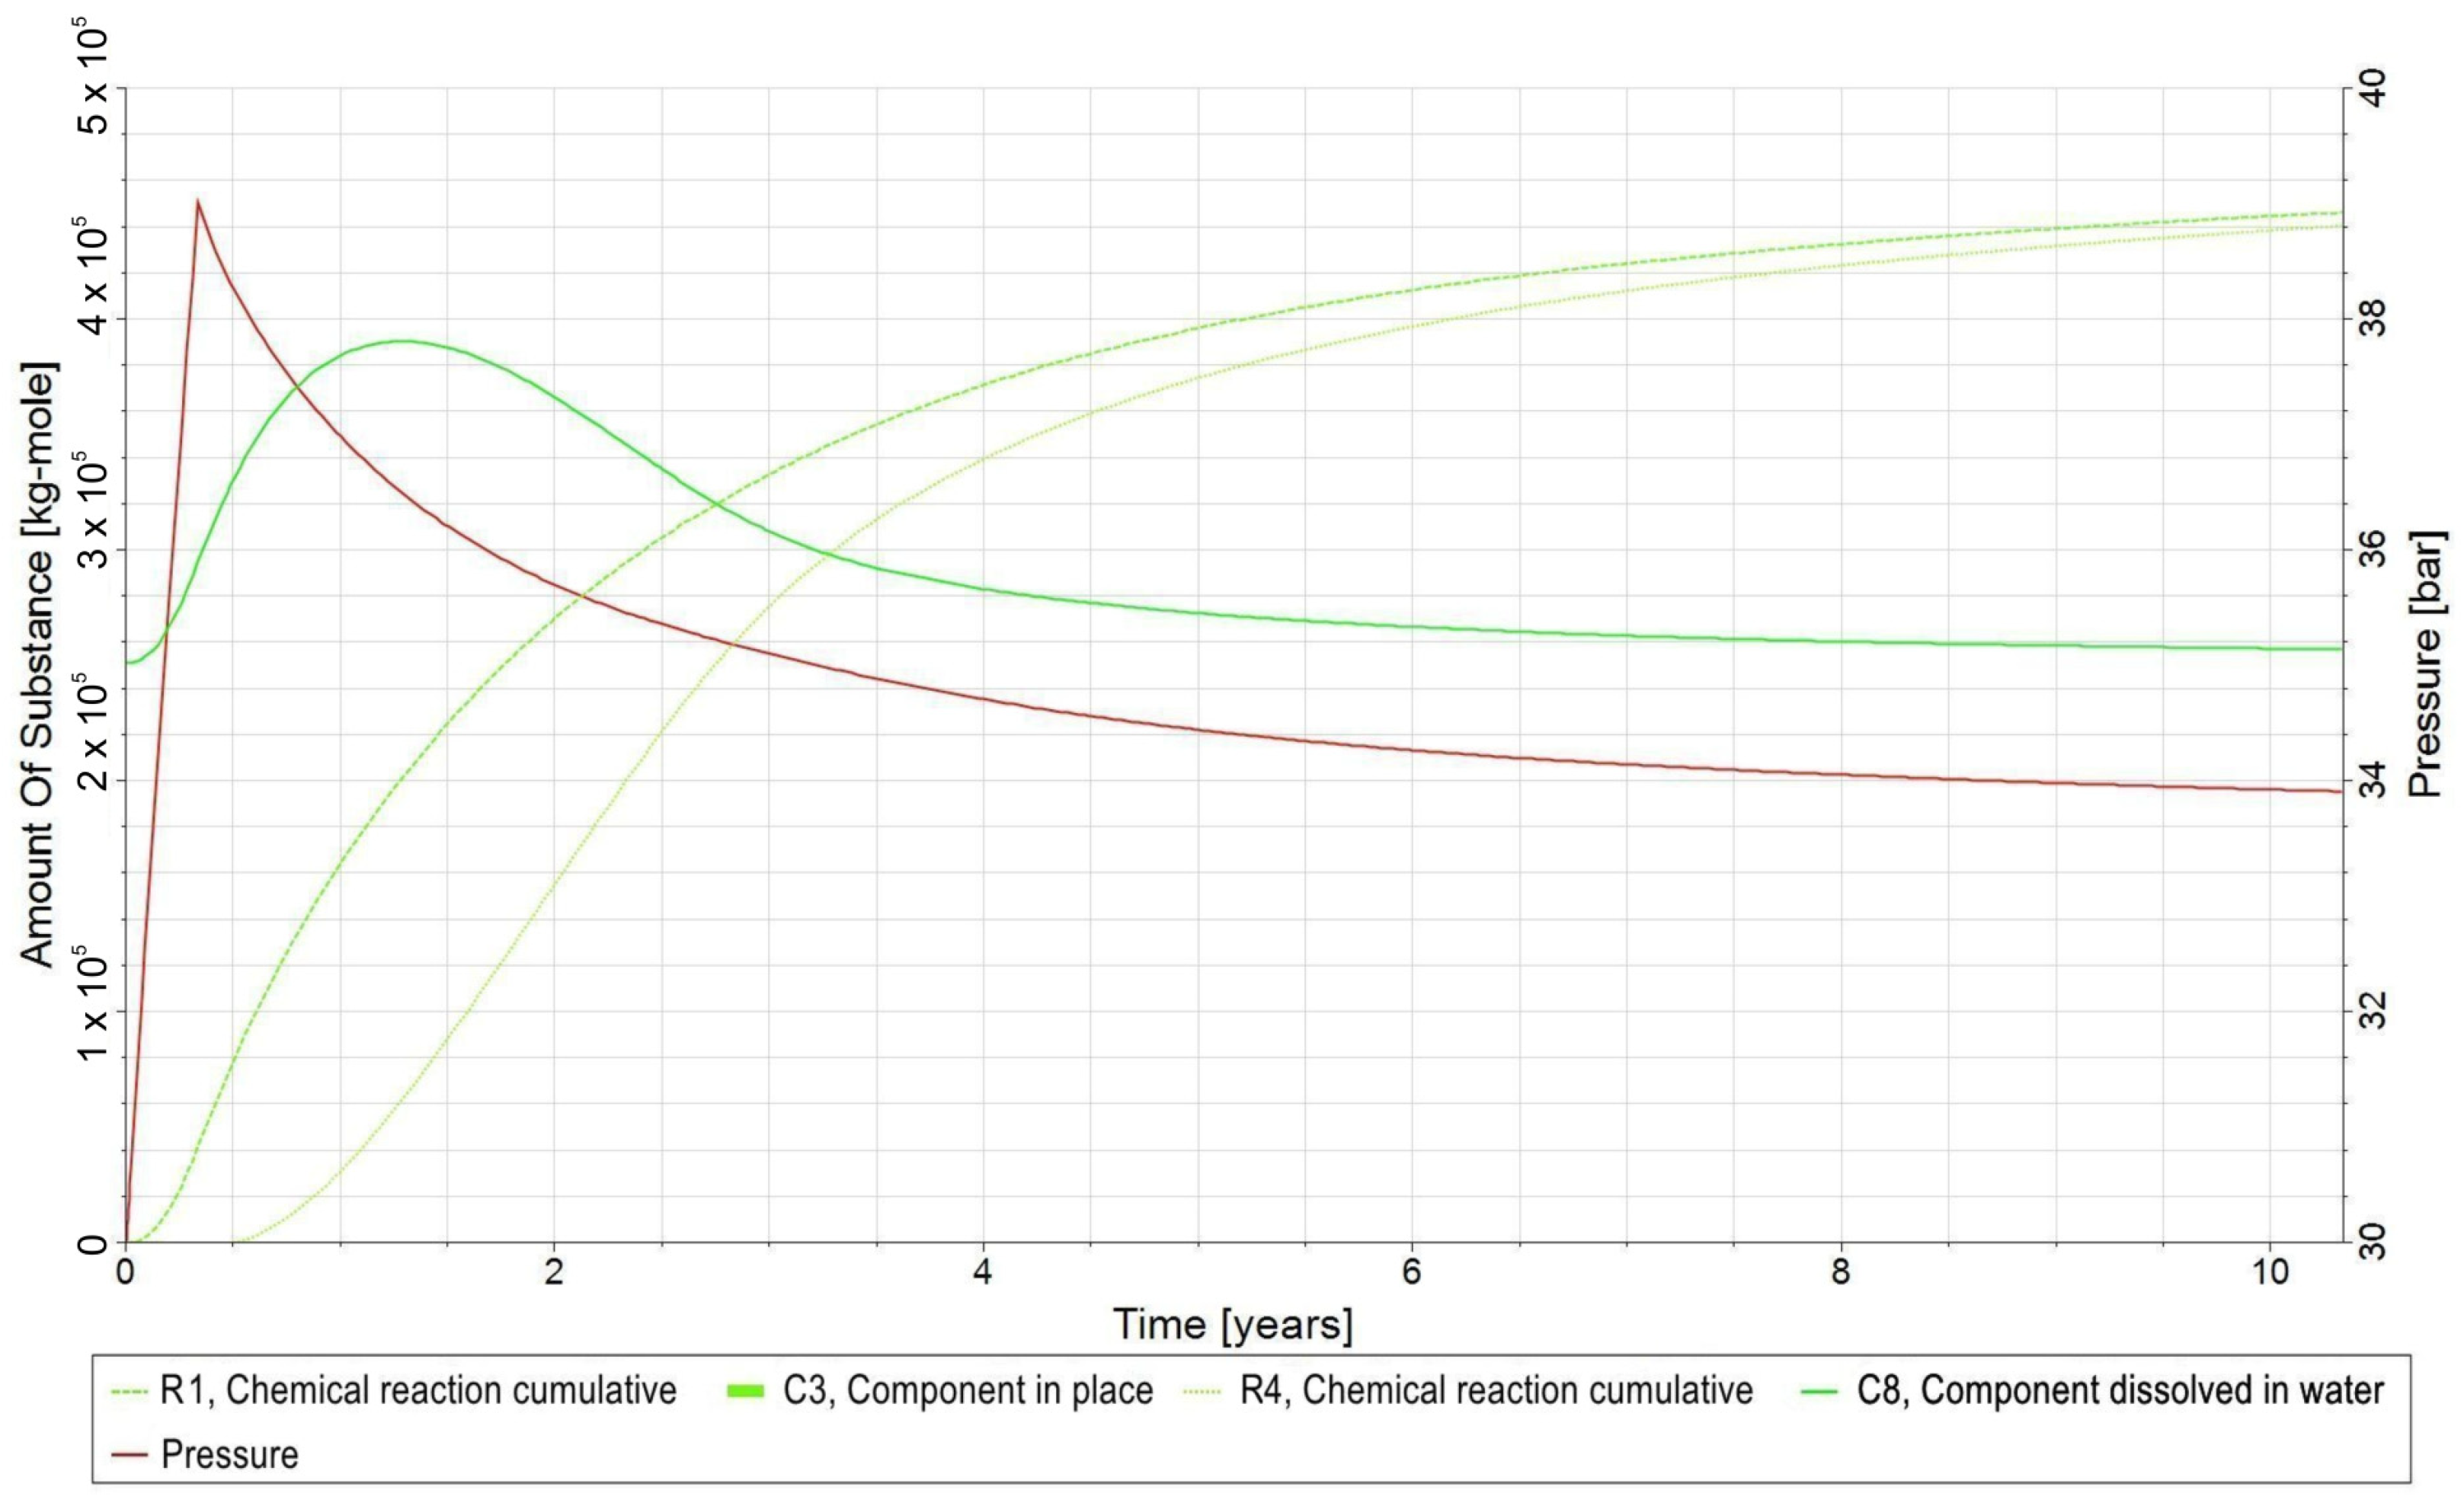
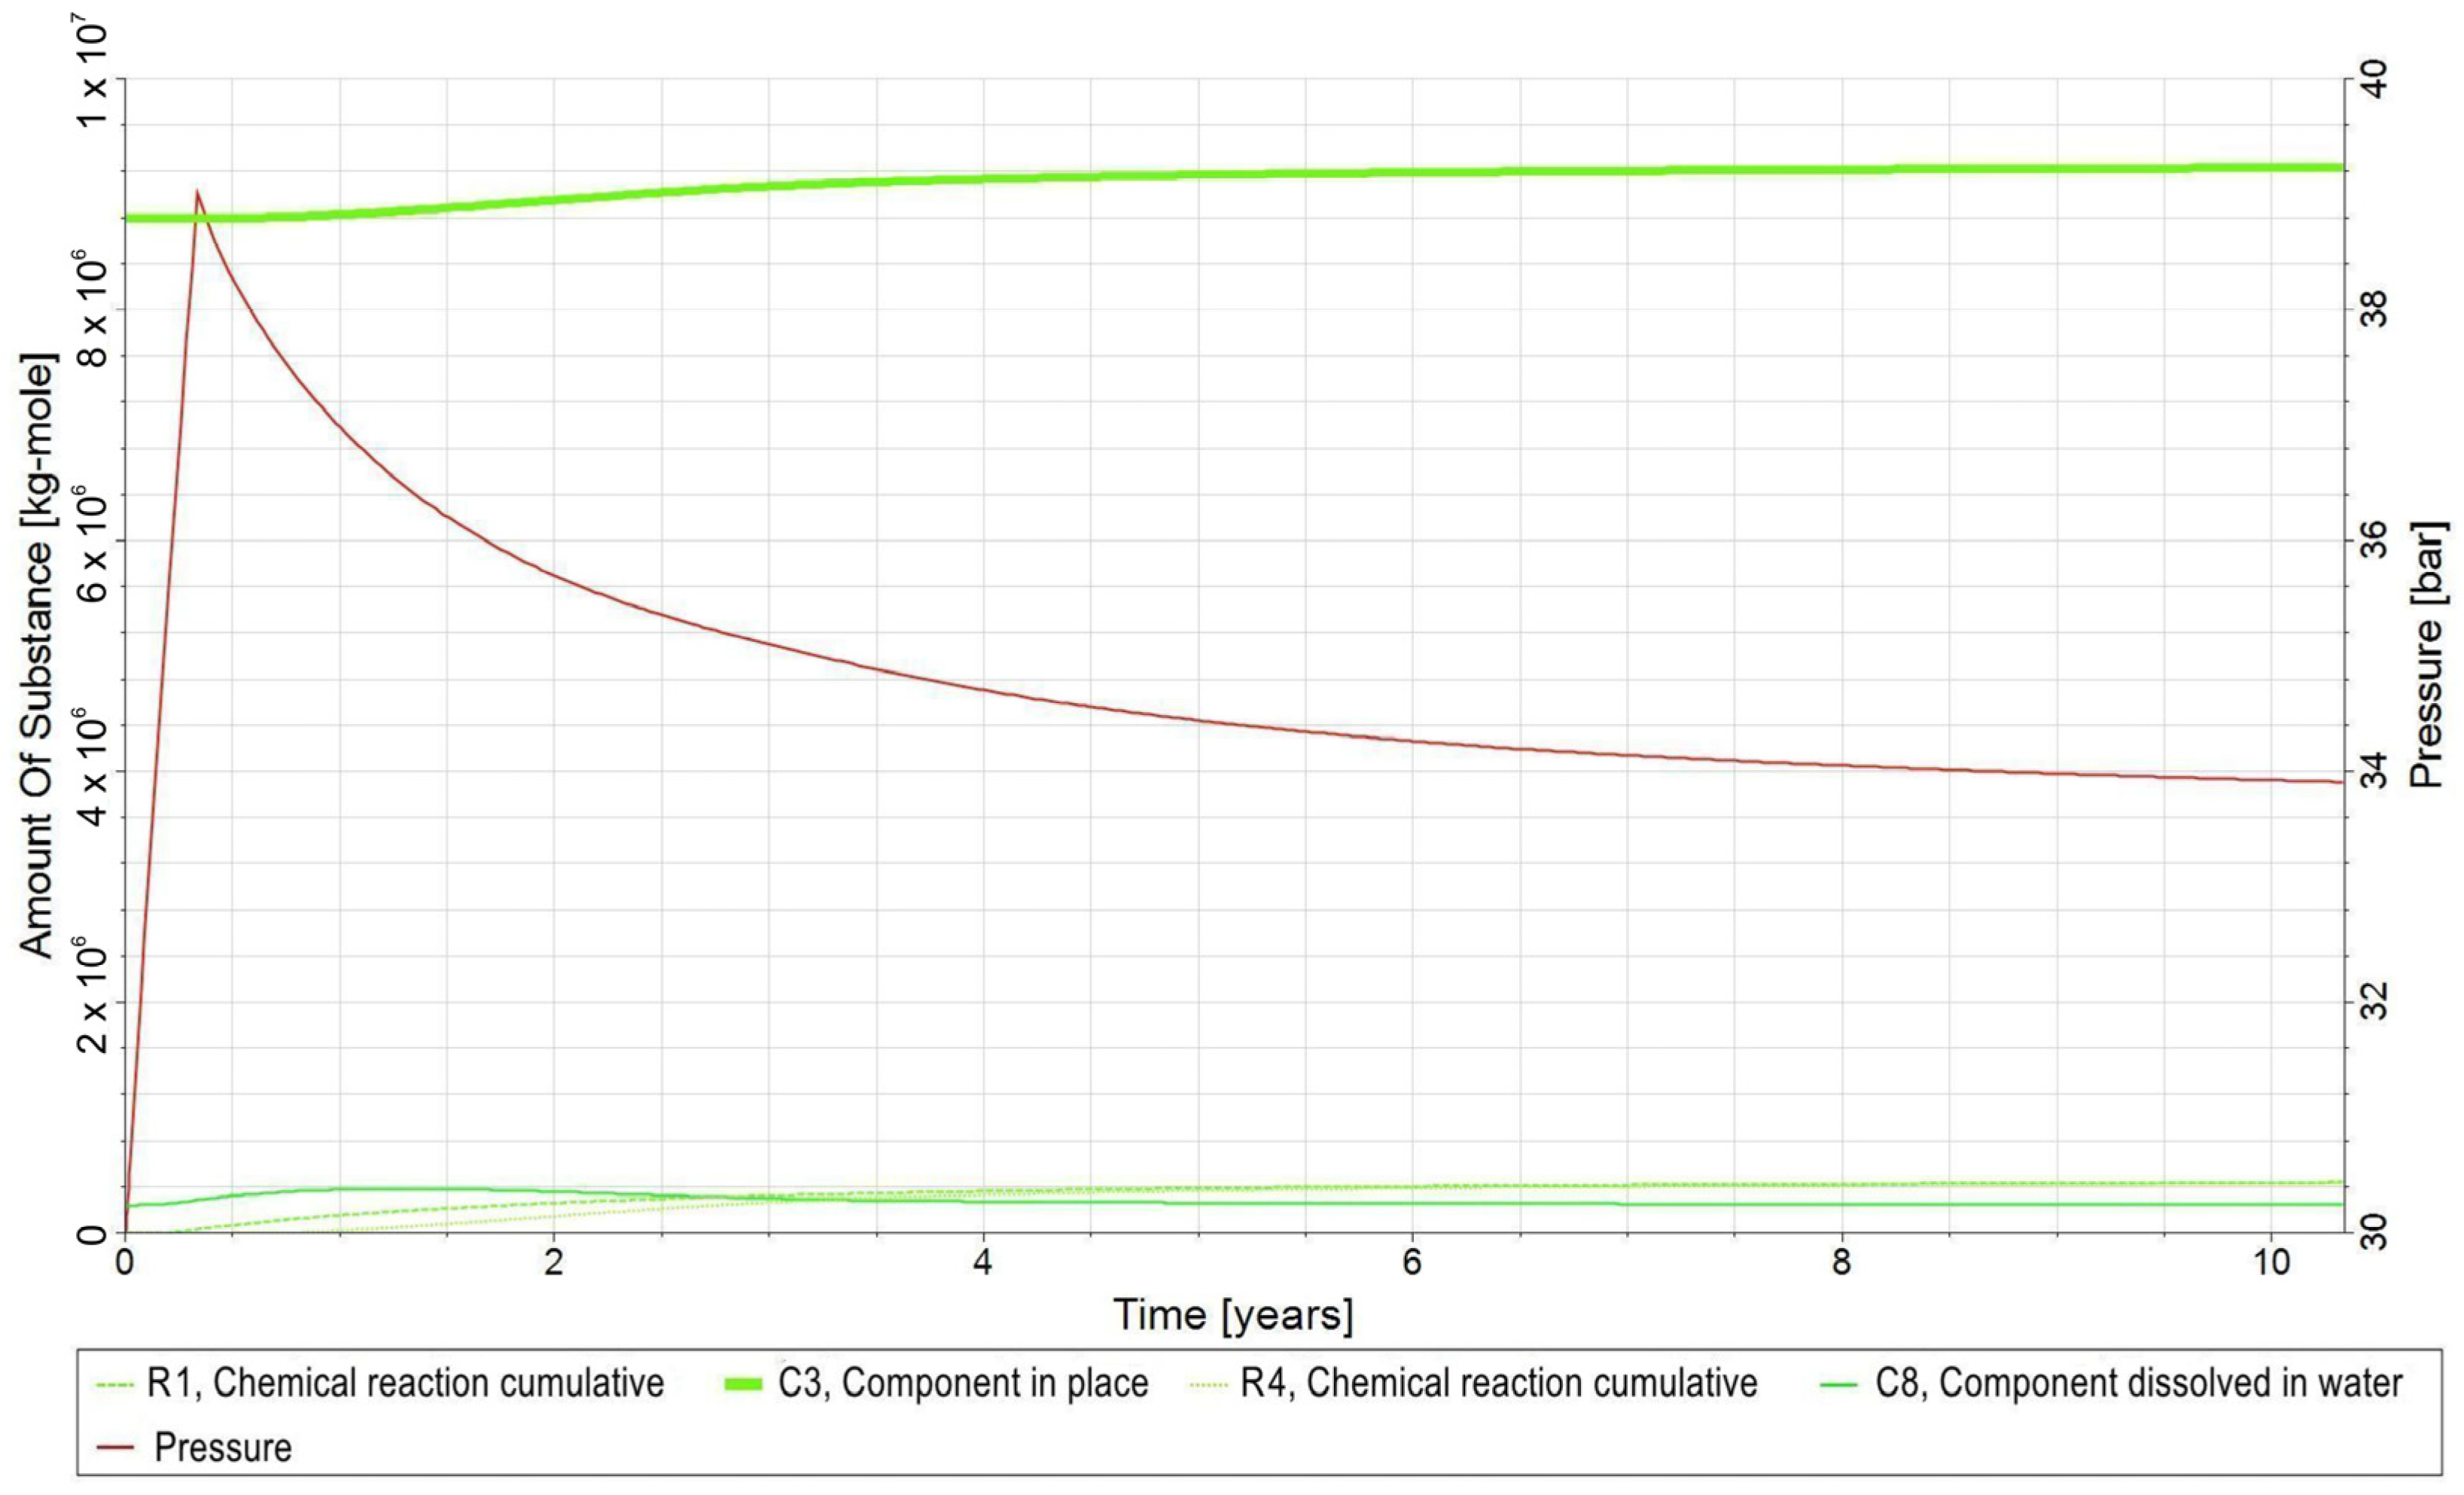
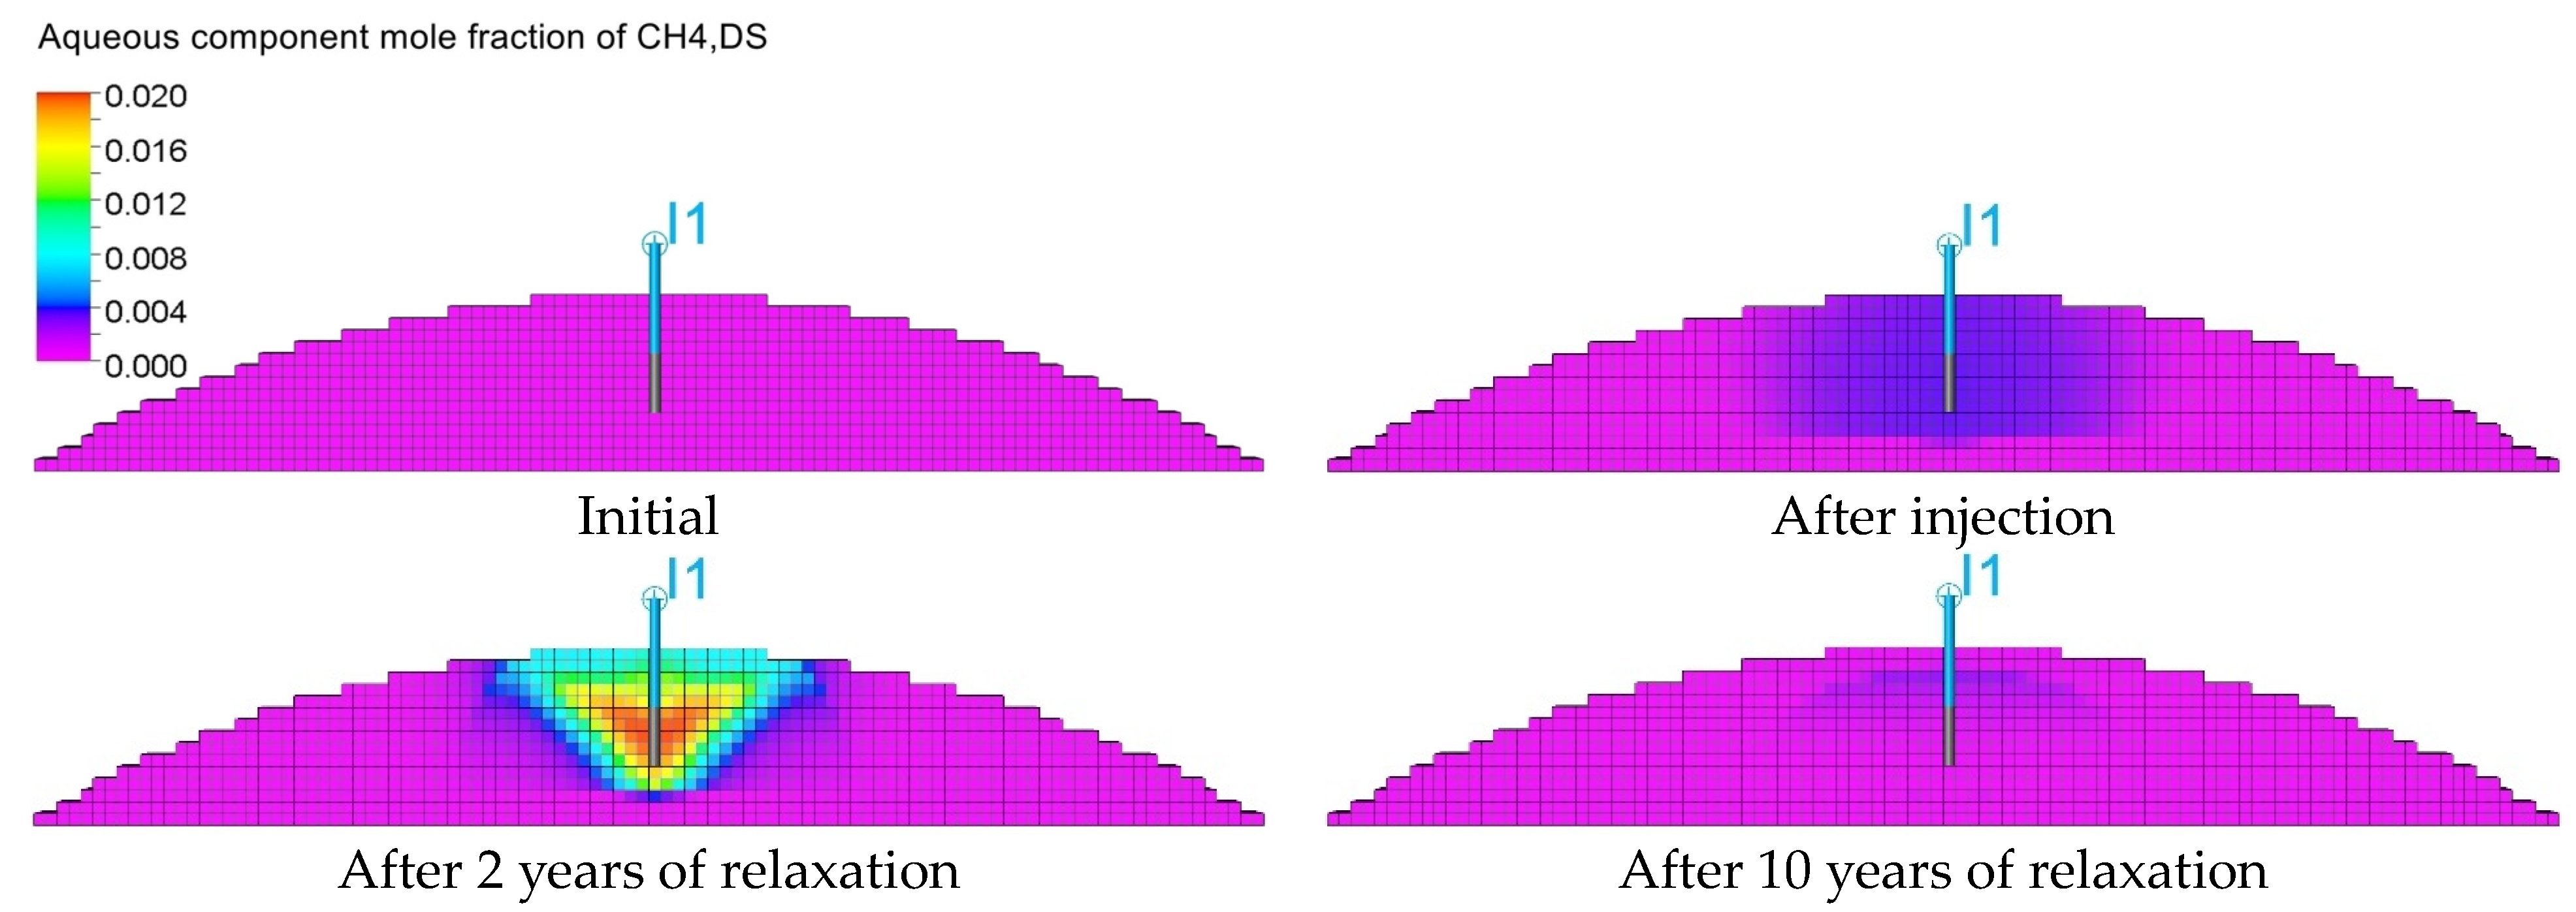
Methane, as a primary gas with relatively low solubility (Figure 4c), has been in the gas phase (C3) since the beginning of the injection. Its amount in the aqueous phase (CH4,DS) is denoted as C8. As a result of the increase in pressure caused by the injection of gases into the reservoir, its solubility in formation water increases, and at the same time its amount in the aqueous phase increases as a result of the biomethanation (R1) reaction observed from the beginning (Figure 12). It is only during relaxation that the pressure begins to drop, and the dissolved CH4, CH4,DS (C8), begins to be released from the aqueous phase into the gas phase (R4), so that the amount of CH4 released from the aqueous phase into the gas phase (R4) is very close to the amount of methane produced by the biomethanation reaction (R1) (Figure 12). The amount of CH4 produced and released into the gas phase (R4) is small in relation to the initial amount of this gas in the reservoir (C3) (Figure 13), which may be influenced by the volume of the reservoir, the local nature of biomethanation (only one injection well), the determined amount of gas injection into the reservoir, and the limitation of the dynamics of fluid flow into the reservoir (relaxation).

3.3. Qualitative Analysis of the Content Distributions of Selected Fluid Components

Due to its very low solubility, H2 propagates radially in the gas phase during injection (Figure 14). In the relaxation phase, it migrates upwards, which is caused by gravitational segregation.
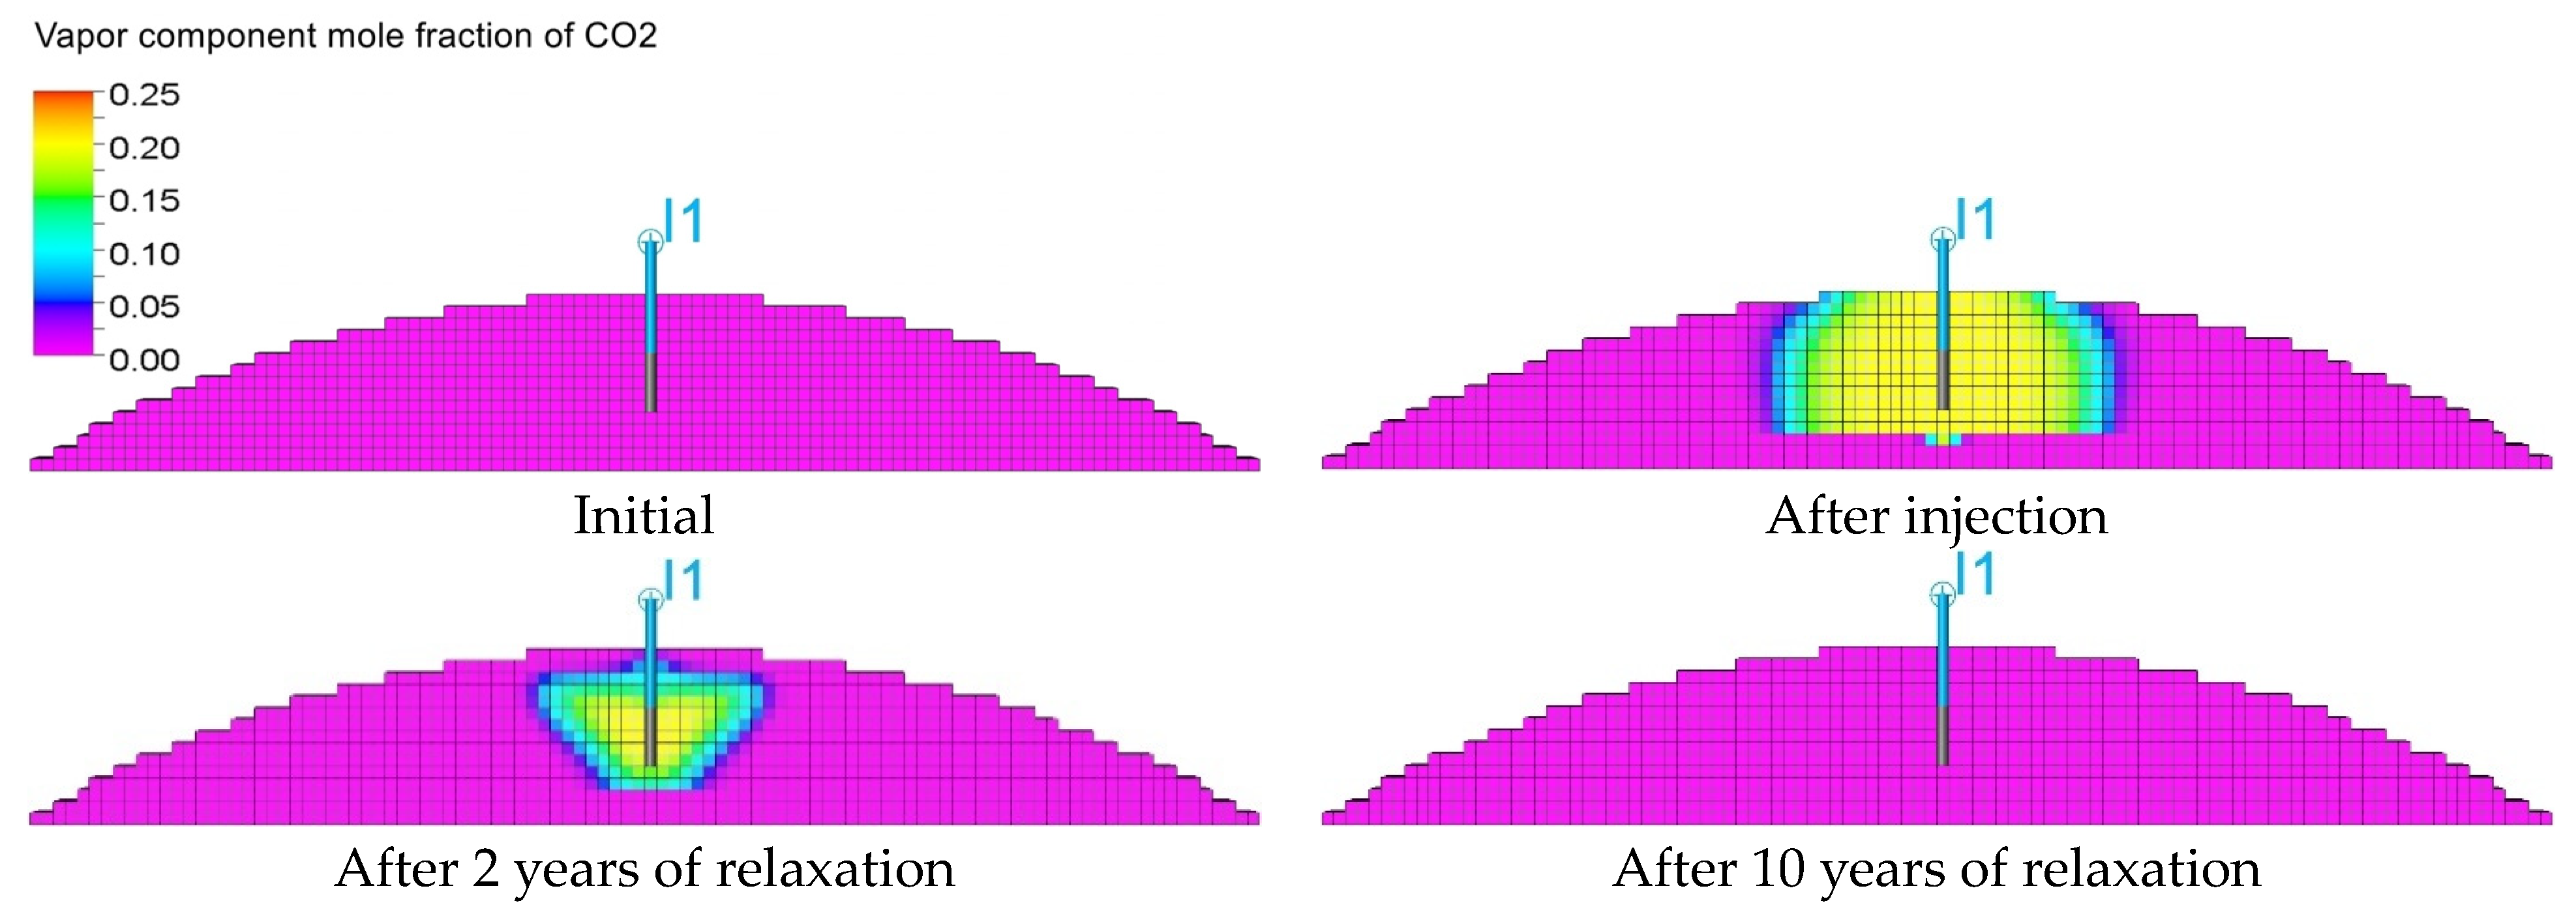
In contrast, CO2 has high solubility, allowing it to dissolve in water near the injection well. As a result, its concentration decreases relatively quickly with the distance from the injection well (Figure 15). Over time, its concentration in the gas decreases to 0 (after 10 years of relaxation), which is related to both its dissolution and the gradual process of biomethanation.
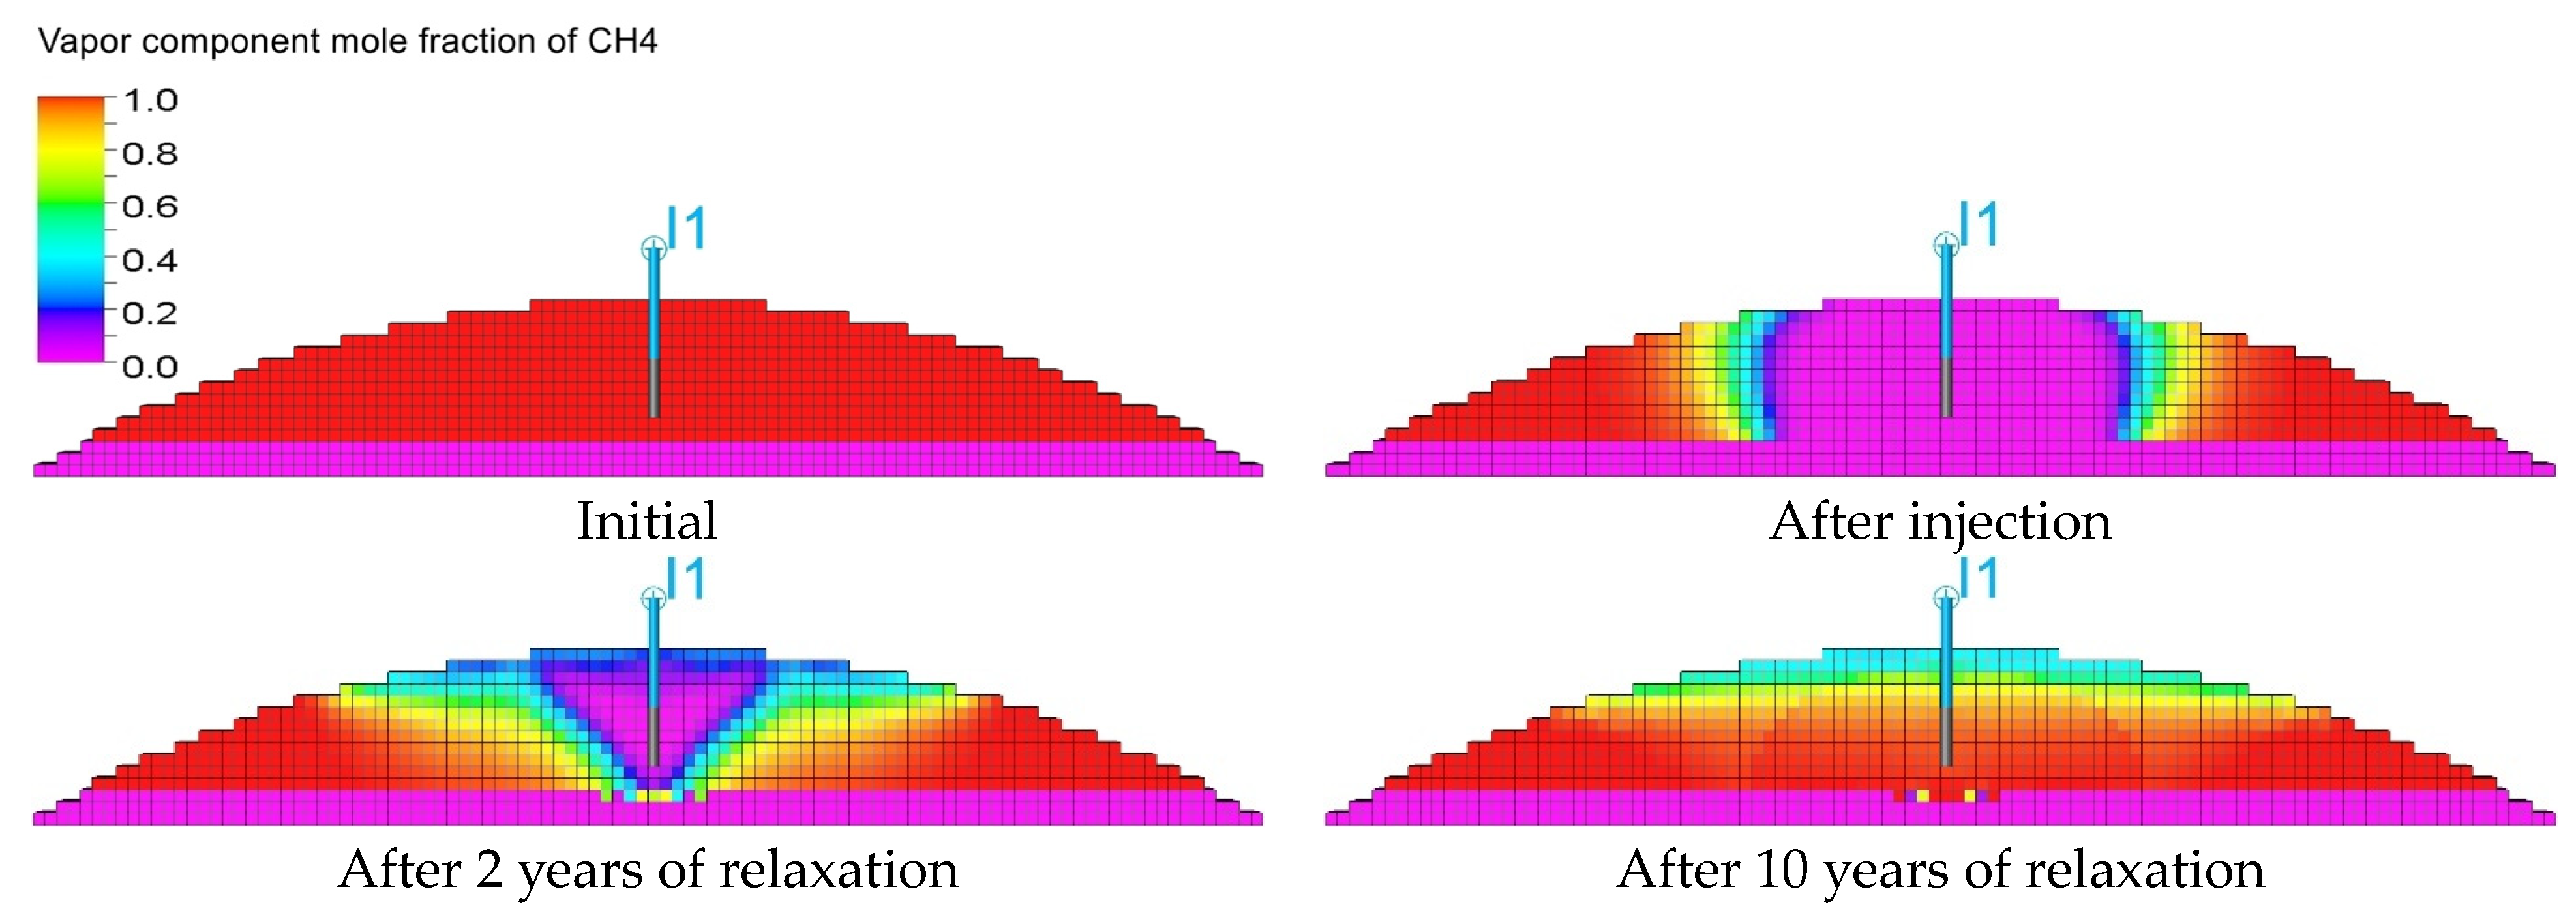
Figure 16 shows the distribution of CH4 concentration in the gas, which is the result of injection, i.e., the displacement of CH4 by gases injected into the reservoir. However, after 10 years of relaxation, the distribution of CH4 concentration (analogous to H2) results from gravitational segregation.
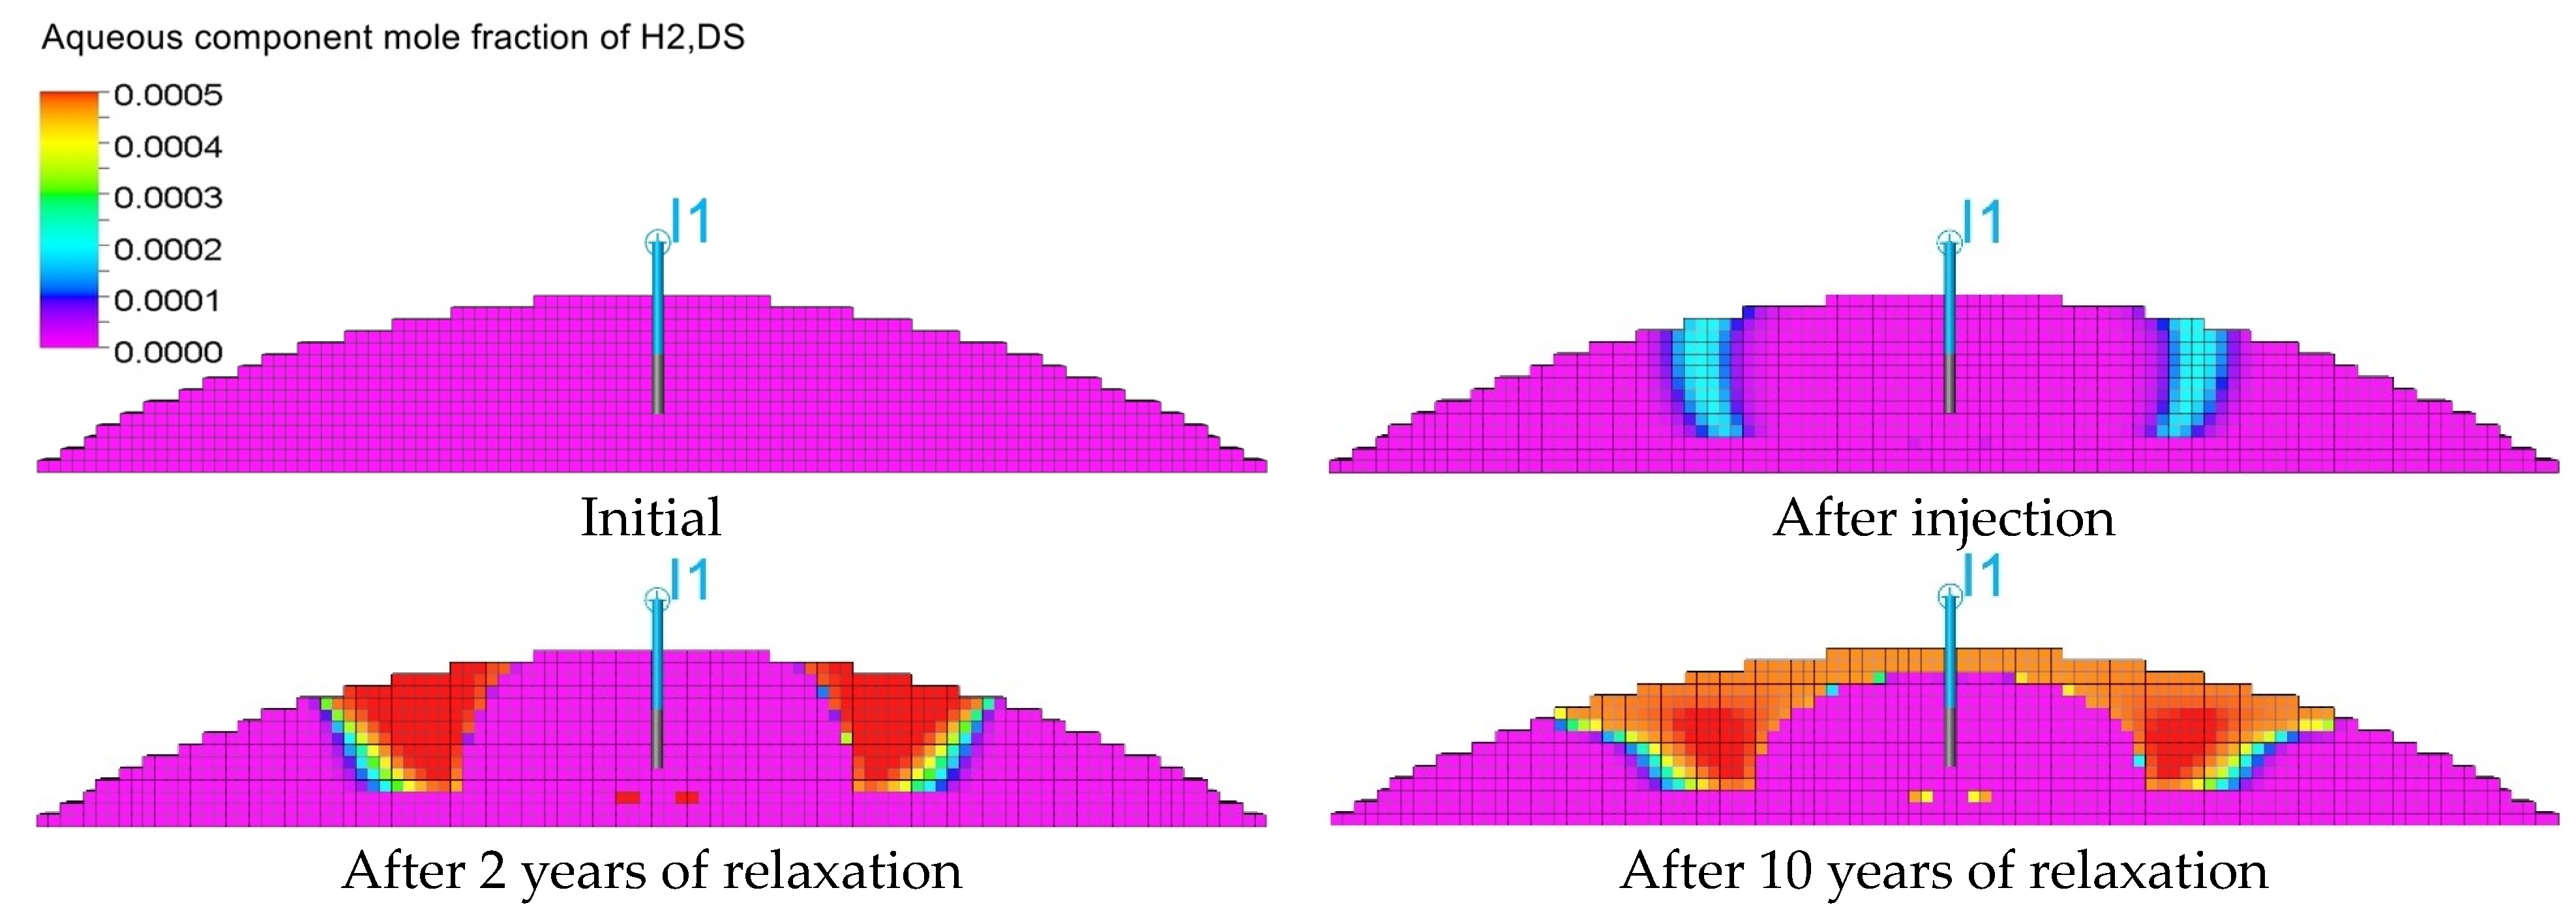
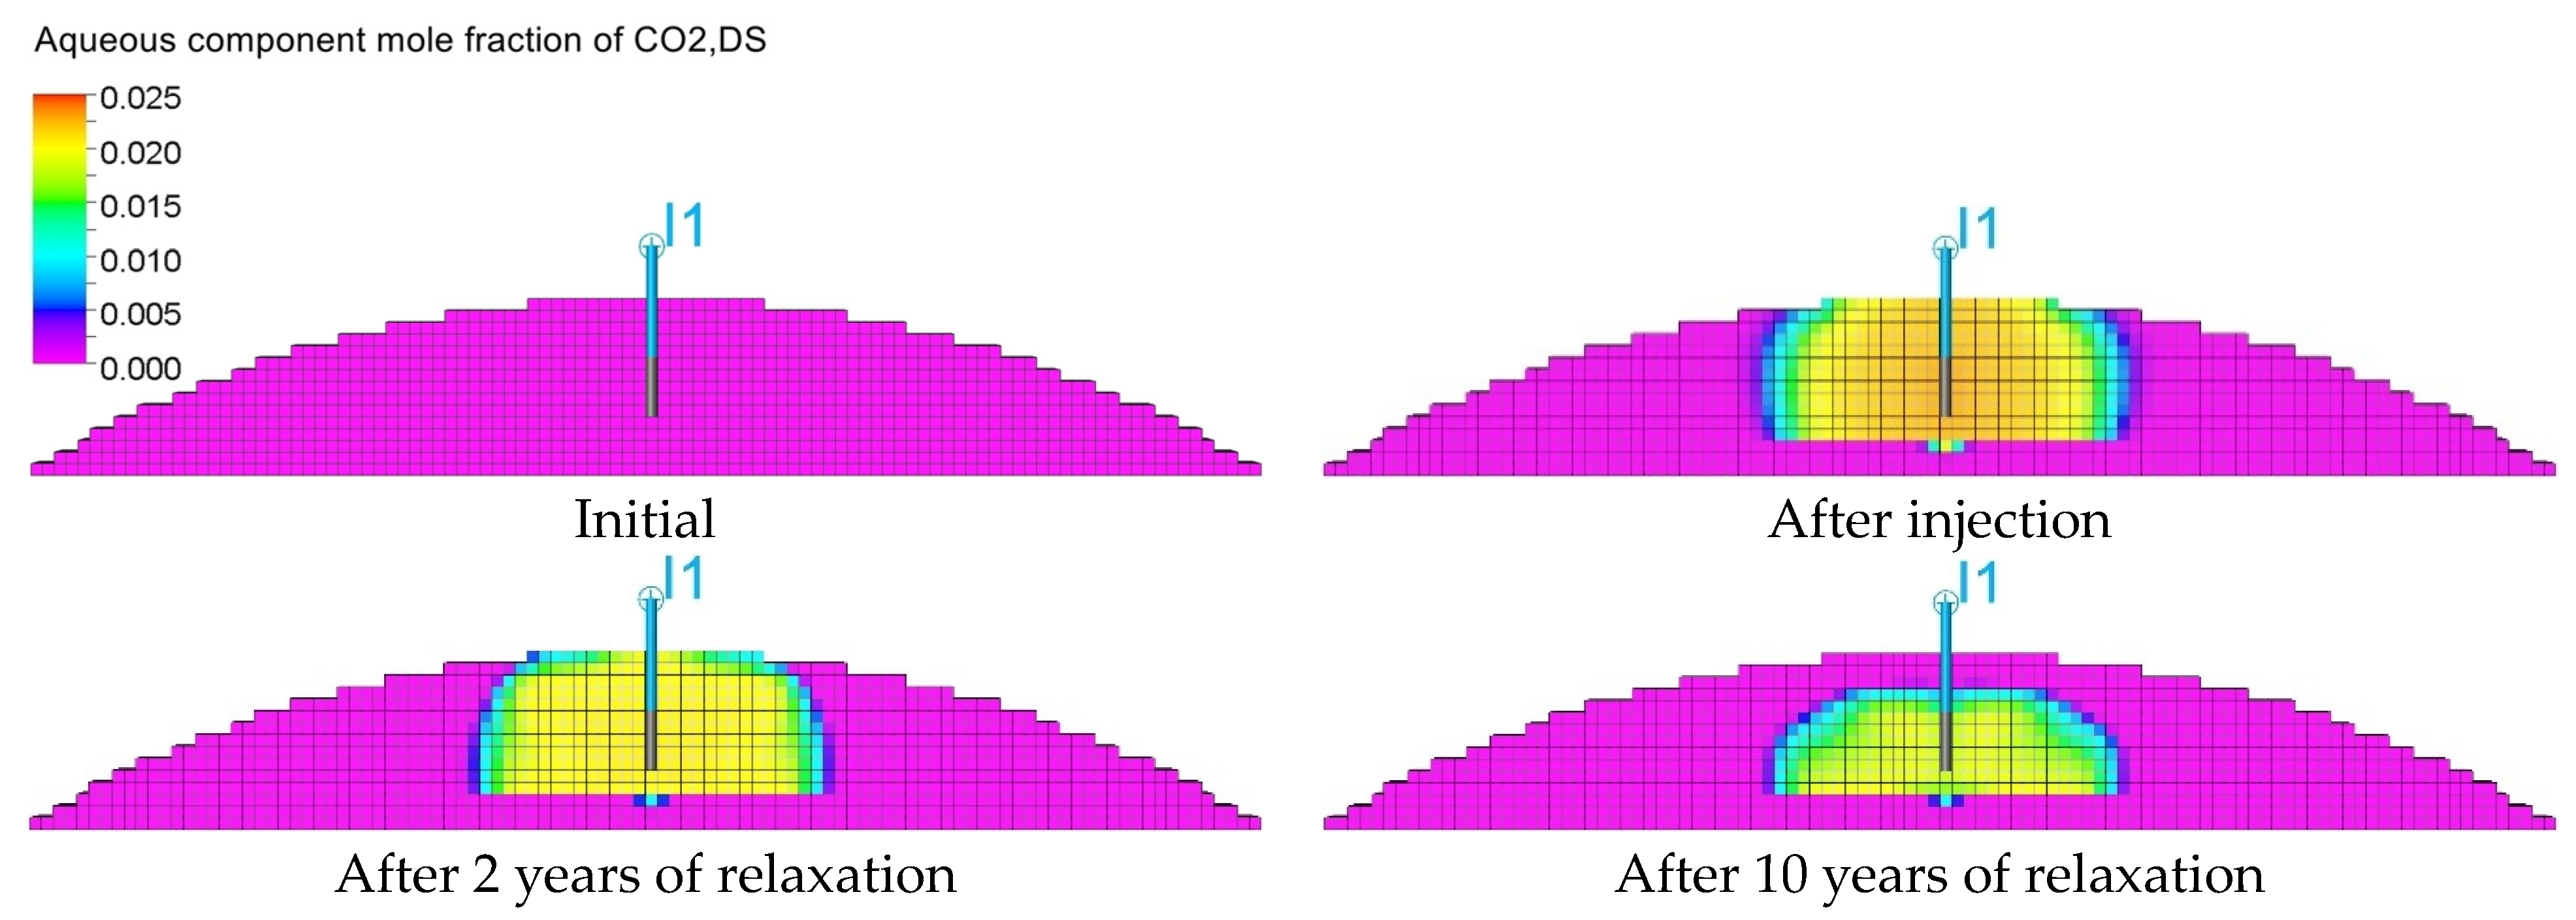
Figure 17 shows the distribution of H2 dissolved in water (C6), which very quickly underwent a biomethanation reaction in the area of dissolved carbon dioxide (C7, Figure 15). On the other hand, in the areas where CO2 did not reach, H2 dissolved in the aqueous phase (C6) remained.
The phenomenon of biomethanation occurs gradually with the participation of bacteria (C5) in the area of H2 (C6) and CO2 (C7) dissolved in the formation water (Figure 18), as shown in Figure 19. Then, the dissolved CH4 (C8), as a result of increasing its amount in the aqueous phase (above the solubility) with a simultaneous decrease in reservoir pressure, is released from the aqueous phase to the gas phase (R4).

3.4. Influence of the Composition of the Injected Gas on the Phenomenon of Biomethanation

The analysis of the basic quantities showed a significant effect of low H2 solubility on the biomethanation process, so in the next step additional forecast scenarios varying in the composition of the injected gas were carried out, i.e., the following scenarios. The CO2/H2 ratios refer to molar fractions in the injected gas mixture:
Scenario 0—CO2/H2 = 20:80;
Scenario 1—CO2/H2 = 25:75;
Scenario 2—CO2/H2 = 15:85.
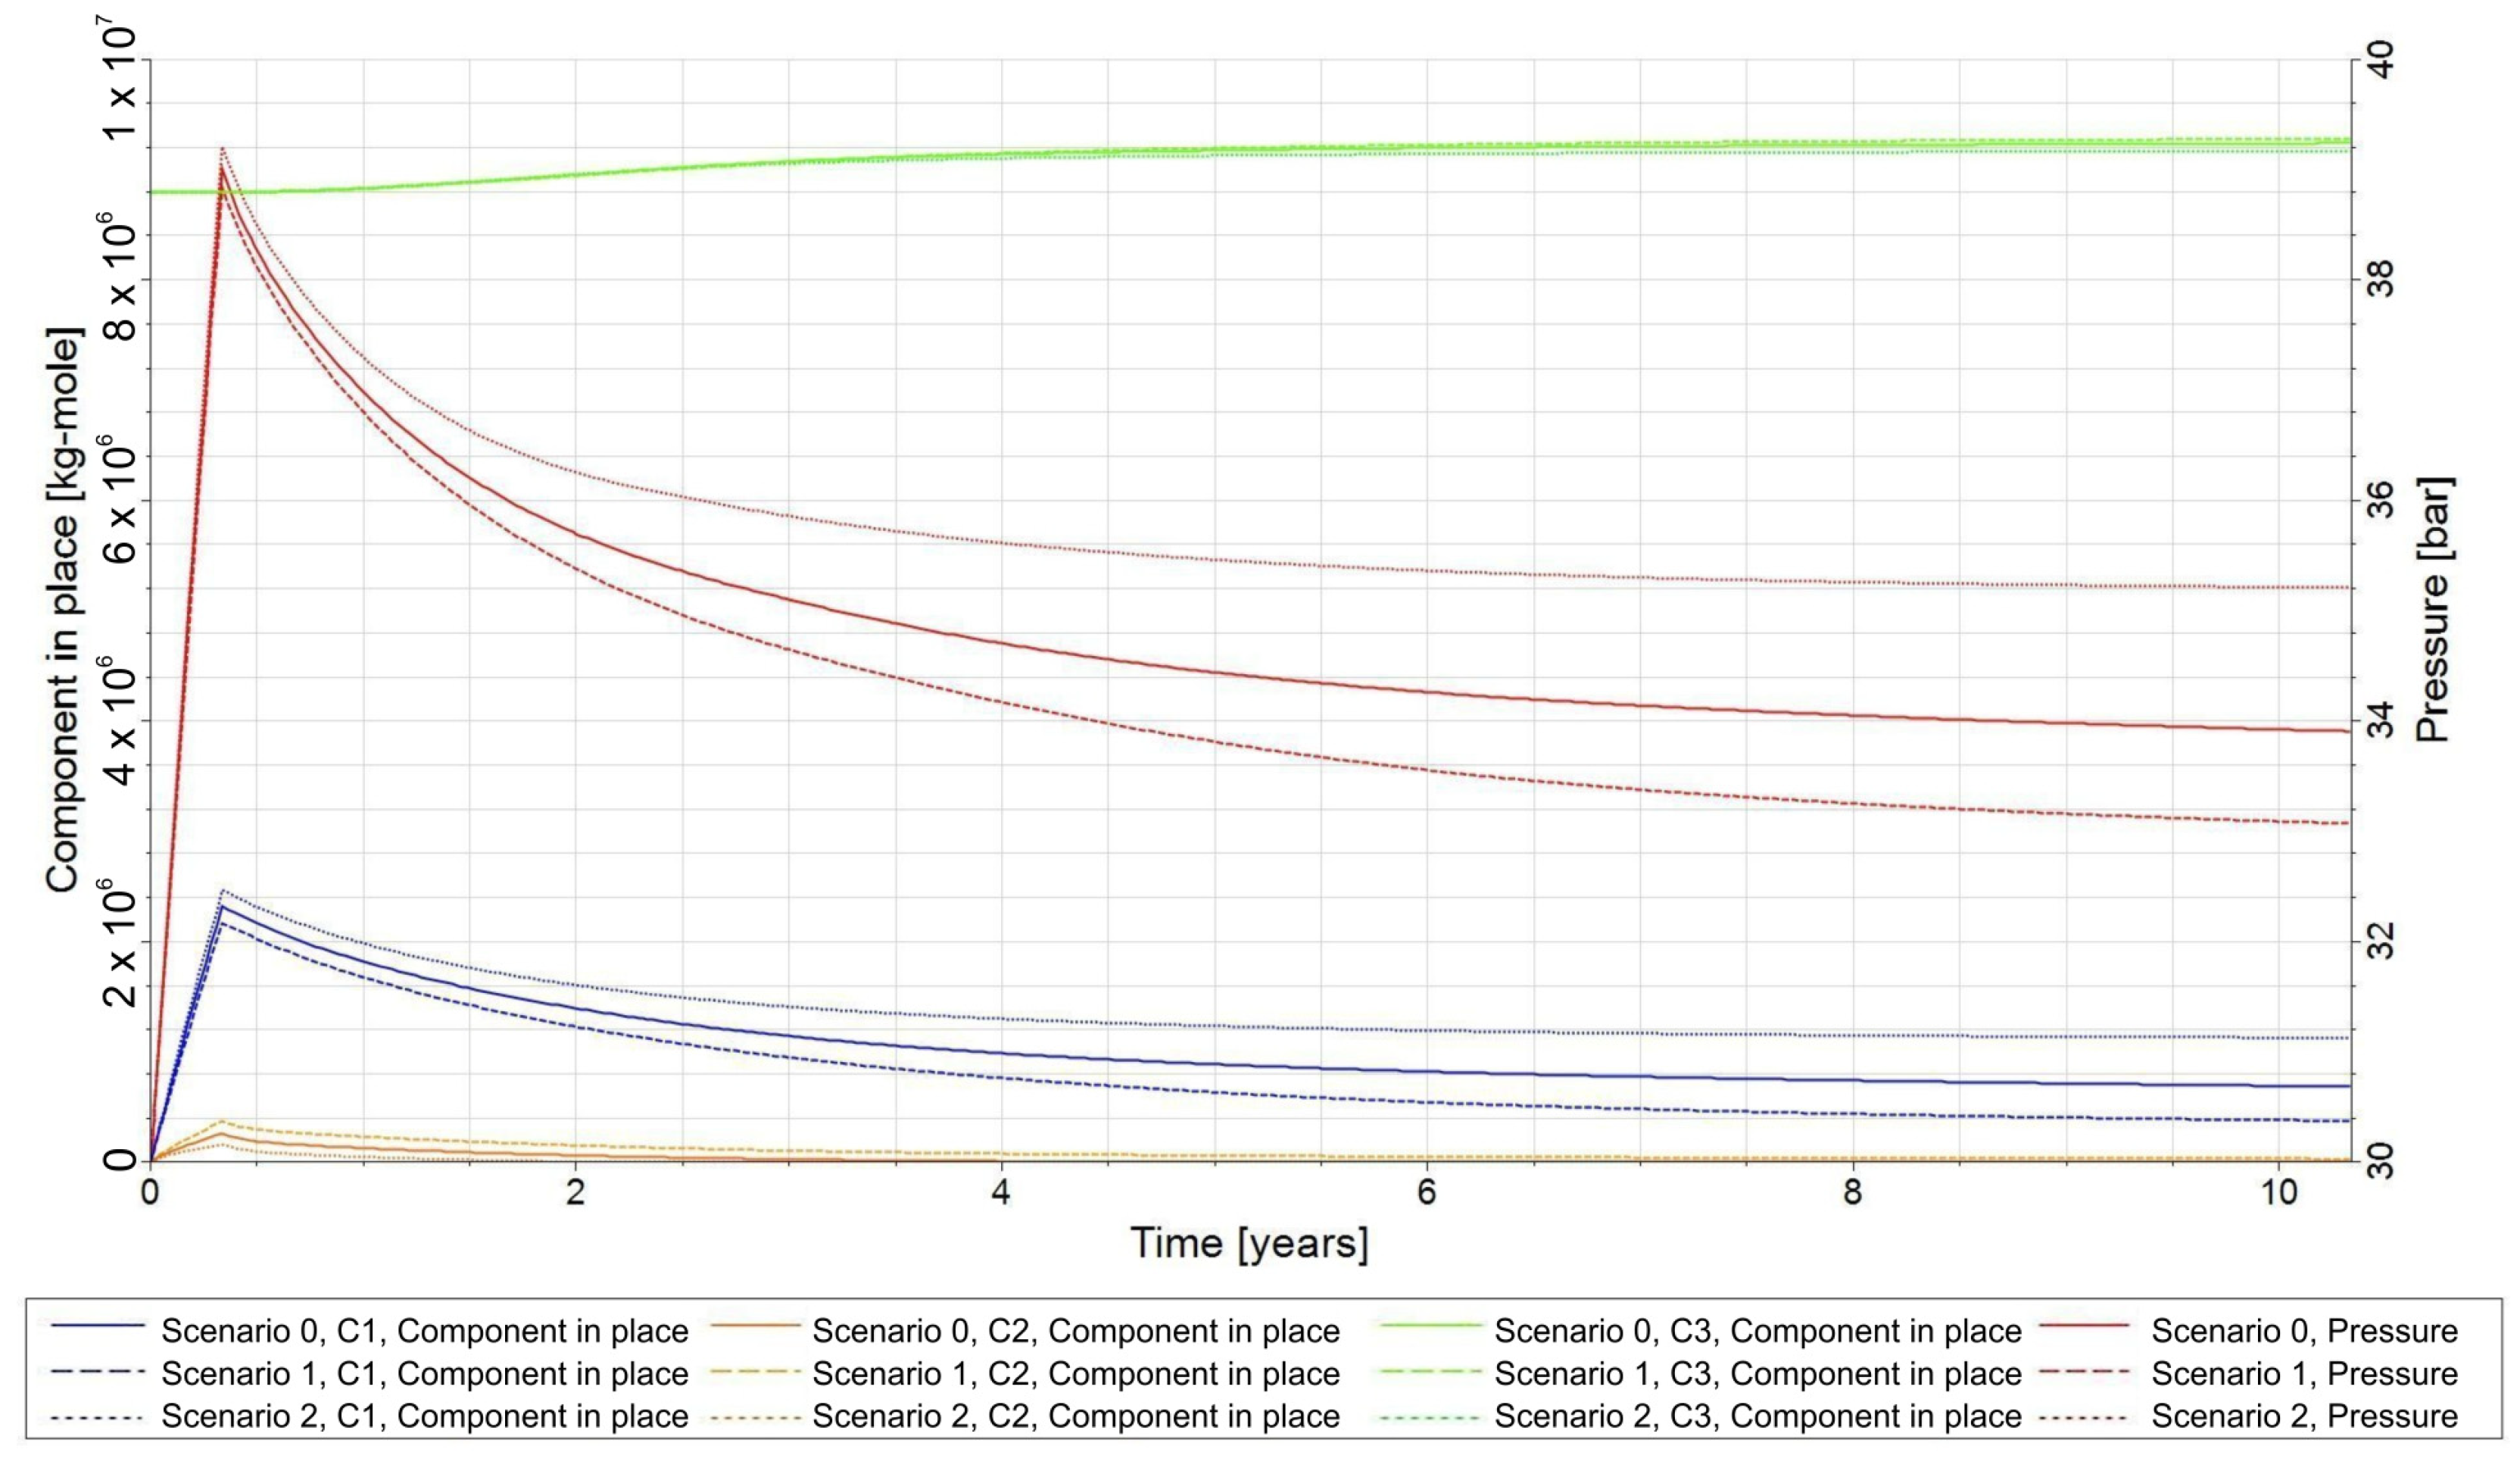
As a result of the increased CO2 content in the injected gas (Scenario 1, CO2/H2 = 25:75) compared to scenario 0 (CO2/H2 = 20:80), CO2 in the gas phase remained available throughout the relaxation period (Figure 20) with a simultaneous decrease in the amount of H2 in the gas phase and an increase in CH4 in the gas phase with a simultaneous decrease in the reservoir pressure. In Scenario 2 (CO2/H2 = 15:85), the reduction in the CO2 concentration in the injected gas had the opposite effect.
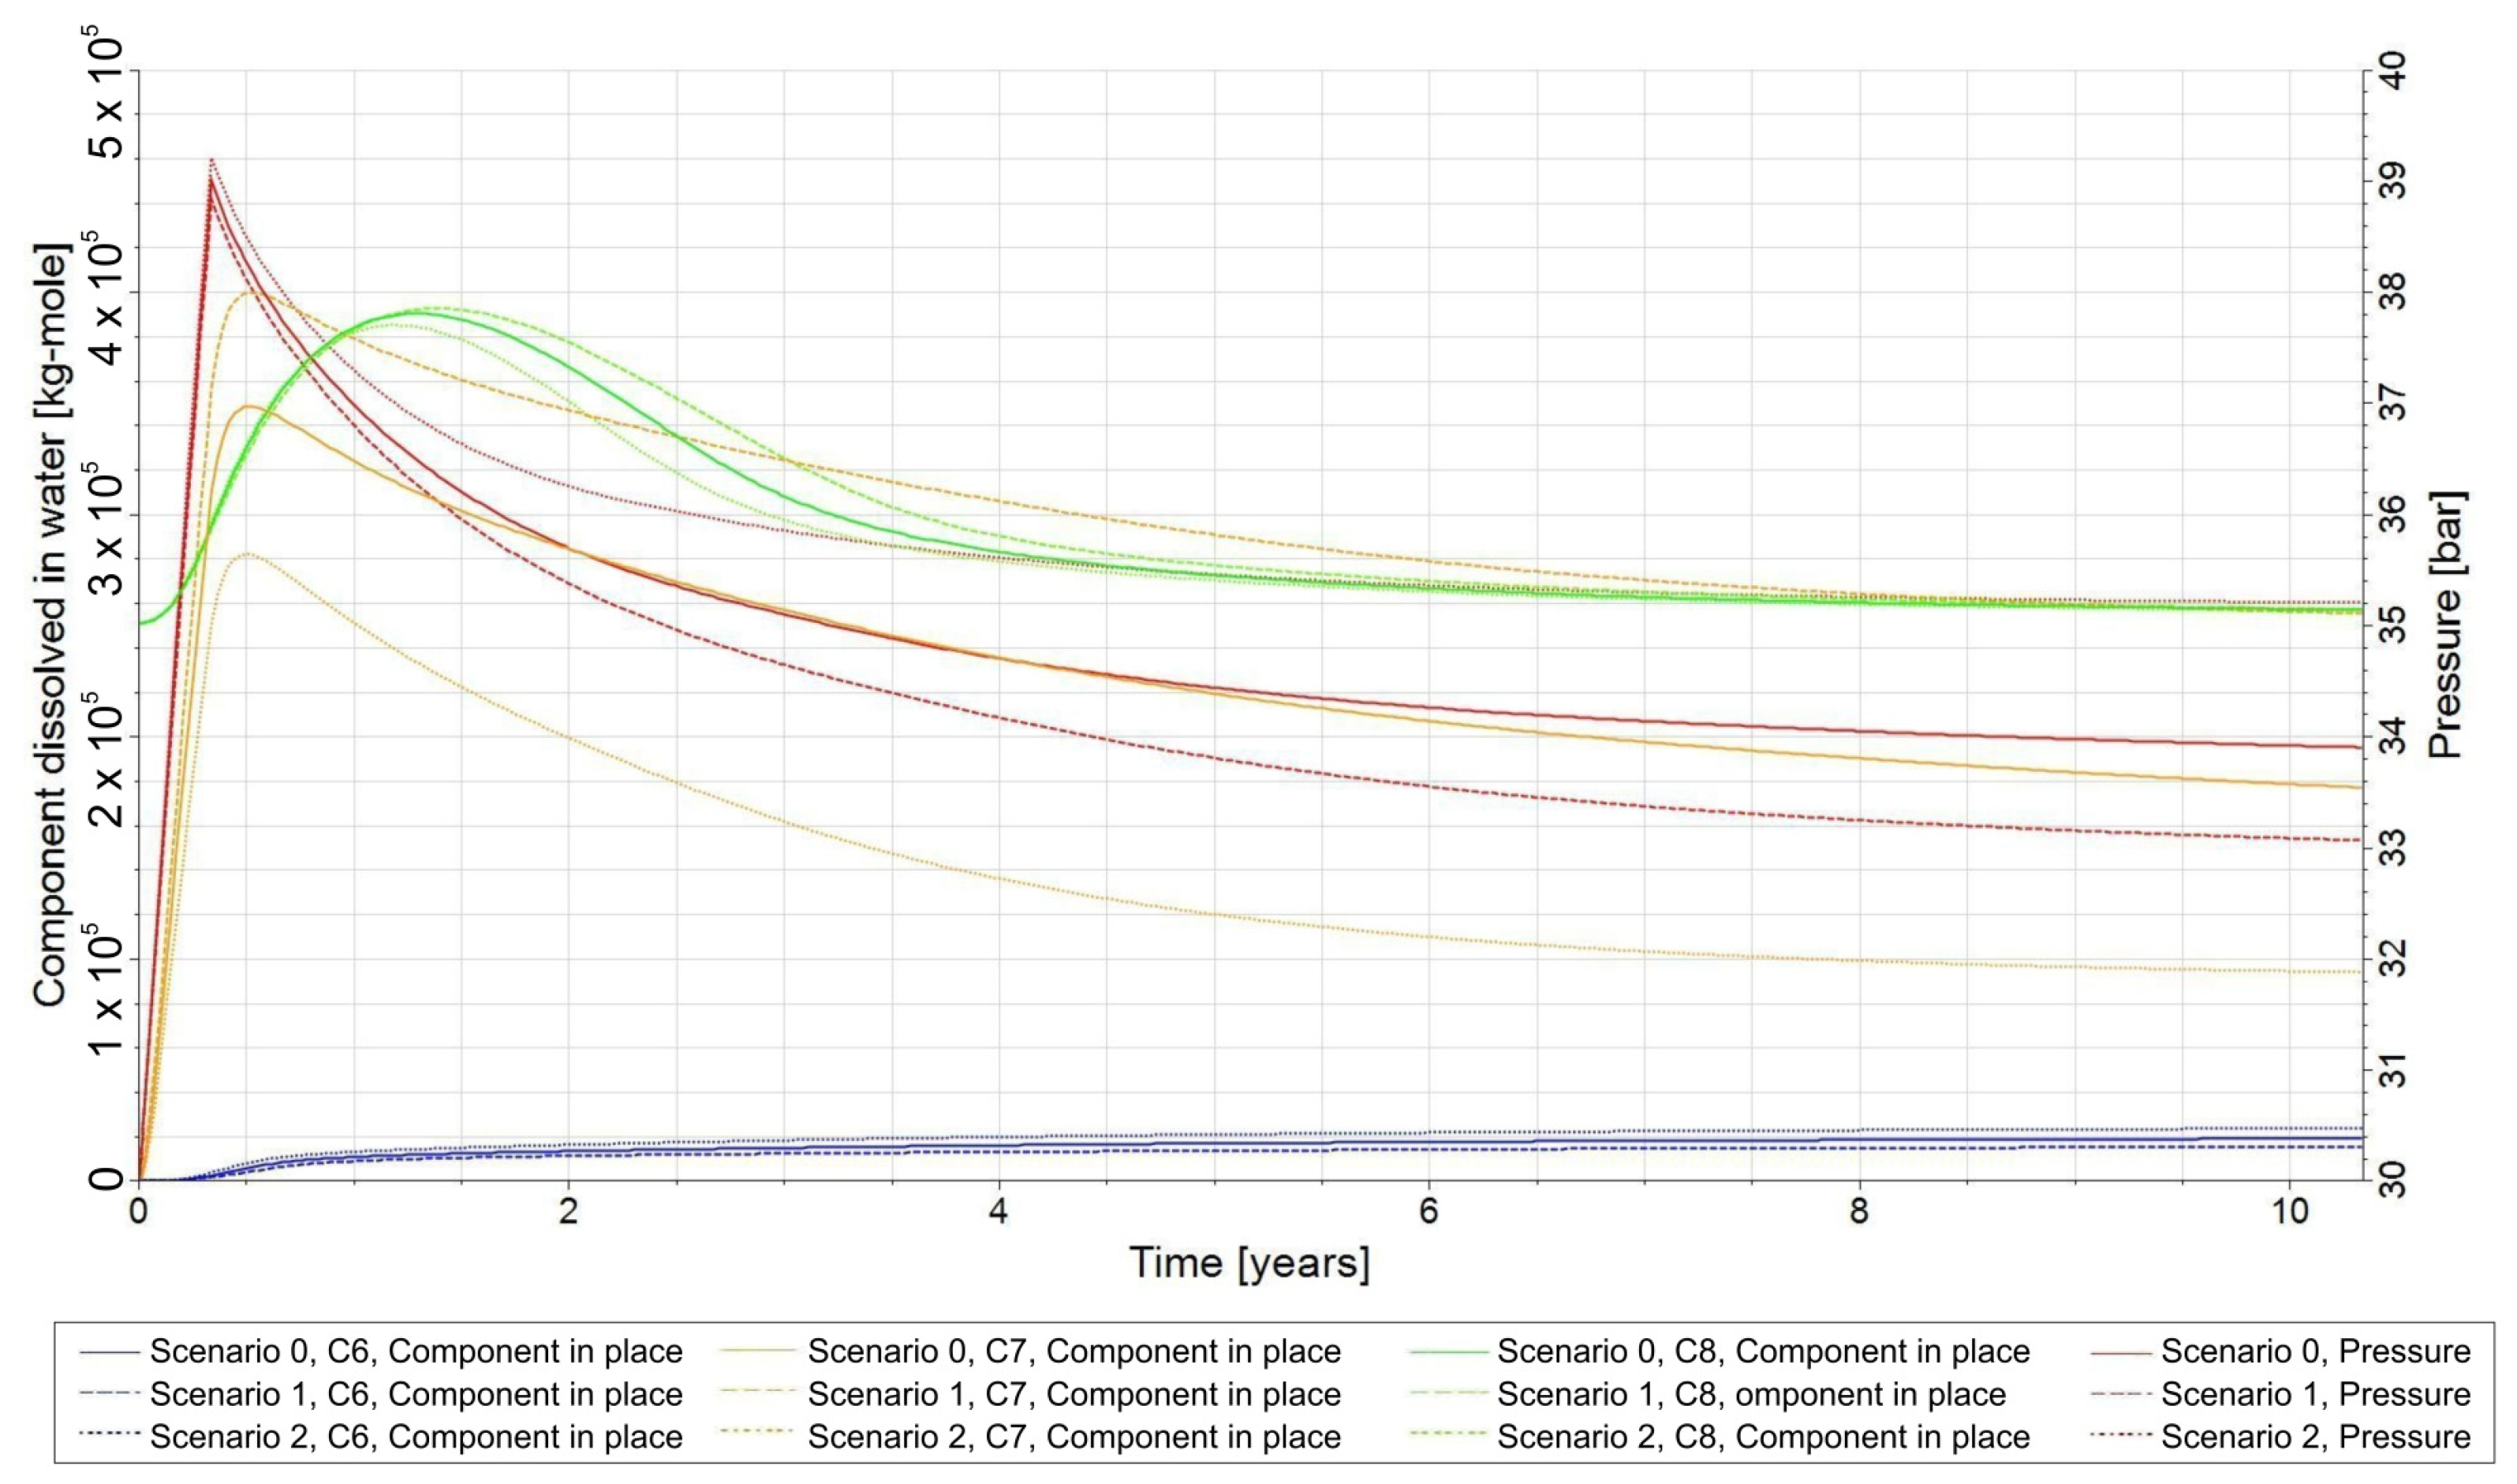
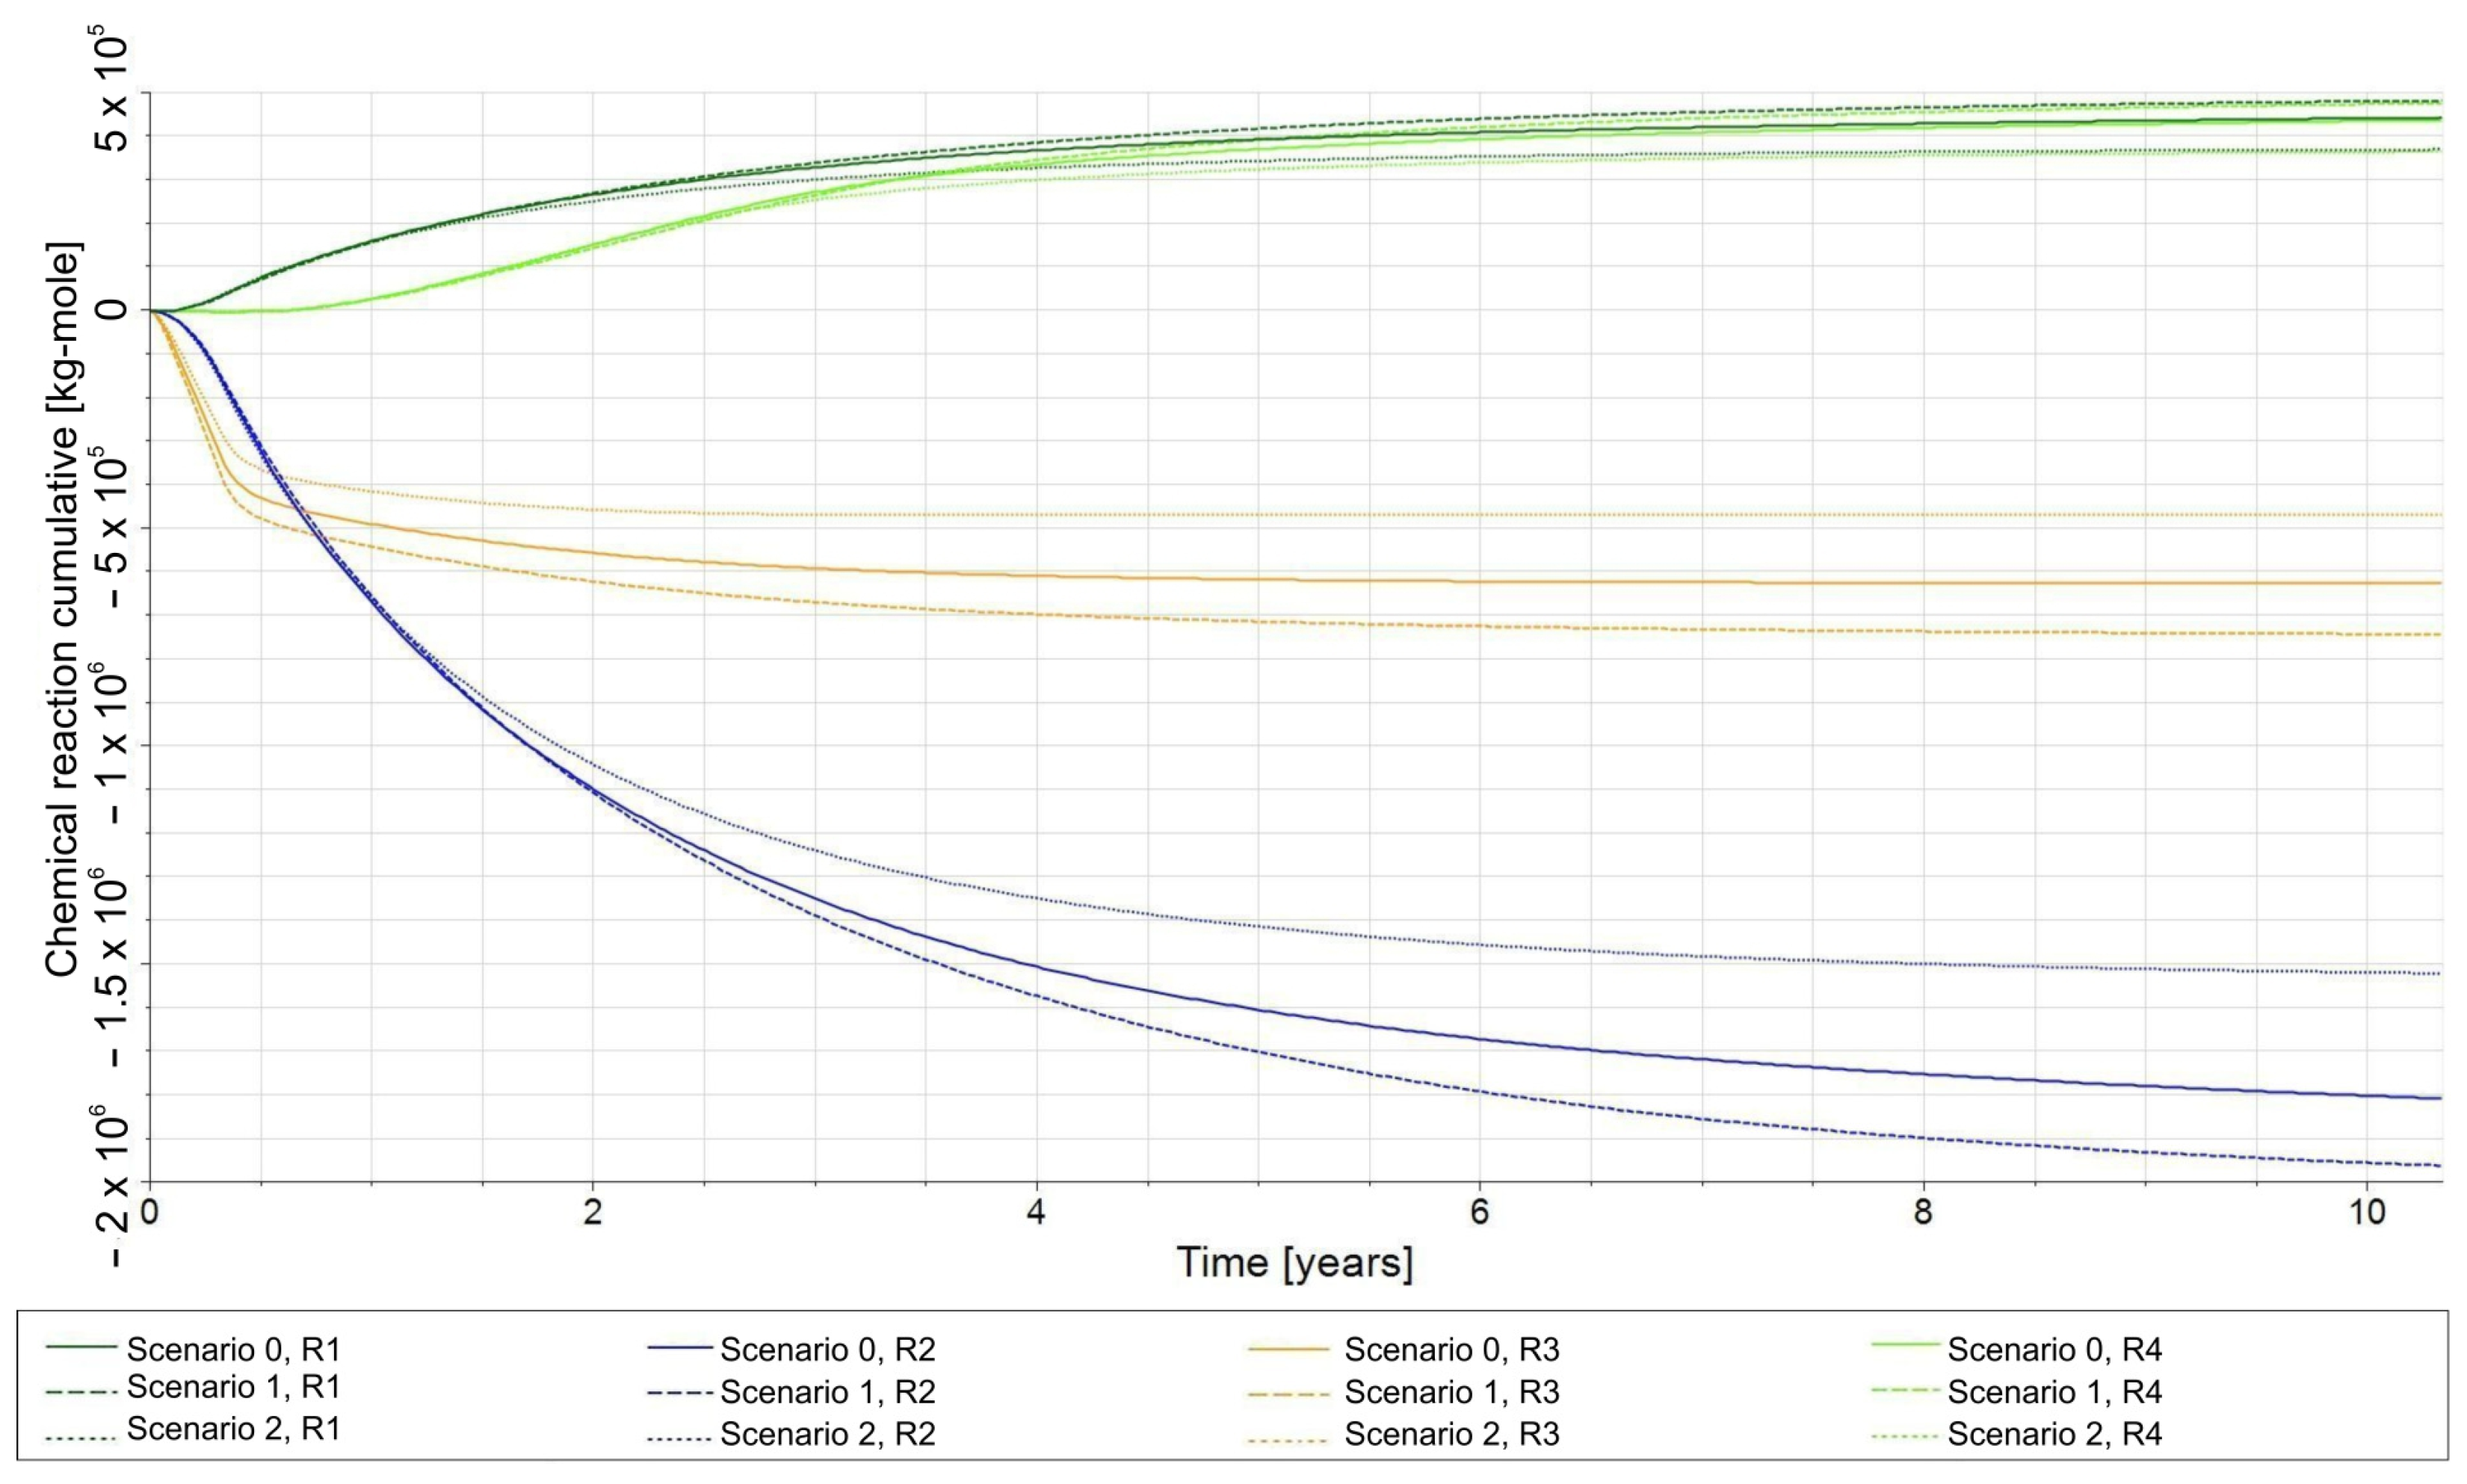
The increased amount (in Scenario 1, CO2/H2 = 25:75) of CO2 injected into the reservoir translated into an increase in its amount in water (C7) with a simultaneous decrease in the amount of hydrogen dissolved in the formation water (C6), (Figure 21). Despite the lower reservoir pressure at the end of the forecast in Scenario 1, the amount of CH4,DS (C8) did not differ significantly from the amount in Scenario 0. The above effects are associated with a higher amount of CH4,DS (C8) obtained as a result of the biomethanation (R1) reaction (Figure 22).
Detailed results for scenarios 0, 1, 2 are presented in Table 4, which presents, i.e., the amount of gases injected into the reservoir and the amount of these gases that dissolved in the water. Based on the simulation results, the conversion efficiency of injected H2 to CH4 was calculated. For the Scenario 0 (CO2/H2 = 20:80), the calculated H2 to CH4 conversion efficiency equals 71.55% (Table 4), while the highest value was obtained for the Scenario 1 (CO2/H2 = 25:75), where the share of CO2 in the injected gas was increased. This effect is related to its high solubility, and by increasing its injection, it was possible to cover the areas of the reservoir with the biomethanation process where CO2 did not reach in the basic scenario, leaving unused H2 in dissolved form on the edges of the reservoir (Figure 17). Because only one injection cycle was conducted, the reduction in dynamic flows led to a relatively small increase of approximately 5% in CH4 in the gas phase. Note that the dissolved CO2 totals include both injected CO2 and a small amount of CO2 initially present in the reservoir gas. The pressure increase during injection raises CO2 solubility, which explains the higher amounts of dissolved CO2 reported in Table 4.

4. Discussion

This study demonstrated that the commercial reservoir simulator Eclipse can be effectively applied to model the biomethanation process in the context of UHS and UMR conditions. The developed workflow successfully integrated microbial reactions, gas solubility effects, and two-phase fluid flow in porous media. The results confirmed that biomethanation significantly impacts reservoir pressure and the composition of gas in the reservoir, which underlines its importance for the long-term dynamics of UHS/UMR.
The simulations were conducted assuming an idealized homogeneous porous medium with constant porosity and permeability. This simplification allowed isolating the physicochemical effects related to gas solubility while neglecting geological heterogeneity. In real geological formations, spatial variations in porosity and permeability could alter the distribution of dissolved gases and the local efficiency of microbial conversion. Therefore, future work will include an investigation based on a model of a real underground reservoir to quantify these effects.
A key outcome is the critical role of gas solubility. While CO2 dissolves rapidly and to a high degree in formation water, H2 remains poorly soluble, and its availability in the aqueous phase becomes the limiting factor of the biomethanation process.
The analysis of the spatial distributions of CO2, H2, and CH4 revealed distinct reservoir zones: areas where dissolved H2 persisted without the presence of CO2, and areas where CO2 remained dissolved but lacked available H2. This spatial separation indicates that the efficiency of biomethanation strongly depends on the overlap of reactive zones, suggesting that process optimization could be achieved by optimizing well patterns and injection/withdrawal strategies, which will be the subject of future work.
However, the presented simulations are based on a single injection–relaxation phase of the process cycle. This partly explains the relatively small increase in CH4 concentration compared to the initial reservoir gas composition. In operational practice, any UHS/UMR undergoes multiple injection and withdrawal cycles, which could substantially increase CH4 production due to cumulative substrate supply and repeated peaks of the biomethanation process. It should also be emphasized that biomethanation is not an instantaneous process but requires time to develop. The limited amount of CH4 produced and converted from H2 in this single, long cycle is a natural consequence of the time-dependent character of microbial activity and the solubility-controlled availability of substrates. In real UMR operations with shorter, repeated cycles, the system dynamics may be substantially different. Repeated injections of fresh H2 and CO2 would stimulate microbial activity more frequently, while the overlap of dissolved substrate plumes would be enhanced, reducing the occurrence of unconverted reactants. As a result, the cumulative CH4 production over multiple operational cycles could be significantly higher than indicated in this first-cycle analysis, and the evaluation of such scenarios represents an important next step in modelling UMR systems. Therefore, our future work will extend this strategy of the biomethanation process to multi-cycle scenarios to better approximate realistic UHS/UMR operations and evaluate the feasibility of using biomethanation under long-term cyclic UMR operations.
The analysis of different scenarios demonstrated that the H2 conversion efficiency highly depends on the CO2/H2 injection ratio. While the overall CH4 production from a single cycle remained small, the conversion efficiency of injected H2 reached up to 83% under CO2-rich conditions. This observation can be directly attributed to the higher solubility of CO2, which forms a broader dissolved CO2 plume in the aqueous phase and enhances the spatial overlap between substrates, thereby improving the likelihood of microbial conversion before H2 becomes isolated in less reactive regions. This confirms that optimizing gas composition is critical for maximizing H2 conversion. However, such optimization should be carried out individually for each storage site, taking into account its specific geological characteristics, well pattern, and operational parameters. The overall efficiency of the biomethanation process will therefore depend on the combined optimization of gas composition, well layout, and cyclic operation strategy. Such optimization for a selected UMR case will be performed in our future work.
Finally, while the current model does not incorporate an explicit microbial life cycle (as described by Monod’s model), this simplification was intentional. The objective of the study reported was to develop a first-step framework focused on the interplay between solubility and conversion of H2 and CO2 into CH4. Future model developments will need to include microbial life cycle to fully capture the complexity of the in situ biomethanation process.

5. Conclusions

  • This study confirmed the practical applicability of the commercial Eclipse reservoir simulator for modelling underground biomethanation (UMR).
  • The solubility of gas components was identified as a key factor influencing the biomethanation process, particularly the low solubility of H2, which limits the efficiency of this process. Additionally, the biomethanation processes significantly affect the reservoir pressure, which in turn impacts the solubility of gases in formation water.
  • For long-term relaxation, gravitational segregation plays a crucial role in the distribution of selected gas components.
  • The analysis of CO2, H2, and CH4 distributions in both gaseous and aqueous phases indicates that process optimization could be achieved not only through the composition of injected gas but also by optimizing well placement and injection strategies.
  • The composition of injected gas significantly affects CH4 production and H2 conversion efficiency, which reached up to 83% for the analysed scenarios. However, after a single injection cycle, the CH4 yield remained low, underscoring the need for process optimization and multi-cycle studies.
  • The proposed workflow represents a methodological framework rather than a field-specific case study. However, it can be extended in future work for a real reservoir and coupled with a more advanced microbial growth model (e.g., Monod model).

Author Contributions

Conceptualization, K.M. and J.S.; methodology, K.M. and W.S.; software, K.M.; validation, K.M. and W.S.; formal analysis, K.M. and W.S.; investigation, K.M.; resources, K.M.; data curation, K.M.; writing—original draft preparation, K.M.; writing—review and editing, K.M., W.S. and J.S.; visualization, K.M.; supervision, K.M.; project administration, K.M. All authors have read and agreed to the published version of the manuscript.

Funding

This research was carried out as part of the project: “Analysis of the possibilities of modelling the methanation phenomenon in the hydrogen injection/storage process”, which is funded by the Polish Ministry of Science and Higher Education, Grant No. DK-4100-12/24. The authors would like to express their gratitude to the Polish Ministry of Science and Higher Education for funding this research.

Data Availability Statement

The original contributions presented in this study are included in the article. Further inquiries can be directed to the corresponding author.

Conflicts of Interest

The authors declare no conflicts of interest.

Nomenclature

C1H2 in gas phase
C2CO2 in the gas phase
C3CH4 in gas phase
C4H2O in the aqueous phase
C5bacteria in the aqueous phase
C6H2,DS in the aqueous phase
C7CO2,DS in the aqueous phase
C8CH4,DS in the aqueous phase
R1biomethanation reaction
R2the reaction of H2 dissolving in water and its release from water into the gas phase
R3the reaction of CO2 dissolving in water and its release from water into the gas phase
R4the reaction of dissolution of CH4 in water and its release from water into the gas phase

References

  1. Dorigoni, S.; Anzalone, G.A. Production of Energy from Renewable Sources and Financial Performance of European Utilities: A Panel-Data Analysis. Energy Policy 2024, 194, 114323. [Google Scholar] [CrossRef]
  2. Miłek, D.; Nowak, P.; Latosińska, J. The Development of Renewable Energy Sources in the European Union in the Light of the European Green Deal. Energies 2022, 15, 5576. [Google Scholar] [CrossRef]
  3. Miziołek, M.; Filar, B.; Kwilosz, T. Hydrogen Storage in Depleted Natural Gas Fields. Nafta-Gaz 2022, 2022, 219–239. [Google Scholar] [CrossRef]
  4. IEA. Global Hydrogen Review 2024; IEA: Paris, France, 2024. [Google Scholar]
  5. Filar, B.; Miziołek, M.; Kwilosz, T. Assessment of Hydrogen Production Costs with the Use of Energy from a Photovoltaic Installation Build in Poland. Nafta-Gaz 2022, 2022, 451–459. [Google Scholar] [CrossRef]
  6. Heinemann, N.; Alcalde, J.; Miocic, J.M.; Hangx, S.J.T.; Kallmeyer, J.; Ostertag-Henning, C.; Hassanpouryouzband, A.; Thaysen, E.M.; Strobel, G.J.; Schmidt-Hattenberger, C.; et al. Enabling Large-Scale Hydrogen Storage in Porous Media-the Scientific Challenges. Energy Environ. Sci. 2021, 14, 853–864. [Google Scholar] [CrossRef]
  7. Mouli-Castillo, J.; Heinemann, N.; Edlmann, K. Mapping Geological Hydrogen Storage Capacity and Regional Heating Demands: An Applied UK Case Study. Appl. Energy 2021, 283, 116348. [Google Scholar] [CrossRef]
  8. Tarkowski, R. Wybrane Aspekty Podziemnego Magazynowania Wodoru. Przegląd Geol. 2017, 65, 282–291. [Google Scholar]
  9. Such, P. Magazynowanie Wodoru w Obiektach Geologicznych. Nafta-Gaz 2020, 76, 794–798. [Google Scholar] [CrossRef]
  10. Jaworski, J.; Kułaga, P.; Kukulska-Zając, E. Wybrane Zagadnienia Dotyczące Wpływu Dodatku Wodoru Do Gazu Ziemnego Na Elementy Systemu Gazowniczego. Nafta-Gaz 2019, 75, 625–632. [Google Scholar] [CrossRef]
  11. Ciechanowska, M. Hydrogen Strategy for a Climate-Neutral Europe. Nafta-Gaz 2020, 2020, 951–954. [Google Scholar] [CrossRef]
  12. Mielich, T.; Dobler, R.; Hollnagel, J.; Akca, O.; Müller-Kirchenbauer, J. Europe’s Way from Natural Gas to Green Hydrogen: Modeling and Simulation of the Transforming European Gas Transport Infrastructure. Int. J. Hydrogen Energy 2025, 135, 156–171. [Google Scholar] [CrossRef]
  13. Siekierski, M.; Majewska, K.; Mroczkowska-Szerszeń, M. Metody Efektywnego i Bezpiecznego Magazynowania Wodoru Jako Warunek Powszechnego Jego Wykorzystania w Transporcie i Energetyce. Nafta-Gaz 2023, 79, 114–130. [Google Scholar] [CrossRef]
  14. Stopa, J.; Stanislaw, R.; Kosowski, P. The Role of Salt Caverns in Underground Gas Storage. Miner. Resour. Manag. 2008, 24, 11–23. [Google Scholar]
  15. Filar, B.; Miziołek, M.; Cicha-Szot, R.; Moska, A.; Kwilosz, T.; Szpunar, T. Analysis of the Possibility of Increasing the Working Capacity of Underground Gas Storage Facilities in Poland. Nafta-Gaz 2024, 80, 571–580. [Google Scholar] [CrossRef]
  16. Kaliski, M.; Janusz, P.; Szurlej, A. NAFTA-GAZ Maj 2010 ROK LXVI. Nafta-Gaz 2010, 66, 325–332. [Google Scholar]
  17. Ahmadi, P.; Chapoy, A. CO2 Solubility in Formation Water under Sequestration Conditions. Fluid. Phase Equilib. 2018, 463, 80–90. [Google Scholar] [CrossRef]
  18. Londe, L. Underground Storage of Hydrocarbons: Advantages, Lessons Learnt and Way Forward. In Proceedings of the Abu Dhabi International Petroleum Exhibition & Conference, Abu Dhabi, United Arab Emirates, 13–16 November 2017. [Google Scholar]
  19. Such, P. Sekwestracja CO2 w Polsce Nie Ma Sensu?! Nafta-Gaz 2020, 76, 913–918. [Google Scholar] [CrossRef]
  20. Szott, W.; Miłek, K. Numerical Procedure to Effectively Assess Sequestration Capacity of Geological Structures. Nafta-Gaz 2021, 77, 783–794. [Google Scholar] [CrossRef]
  21. Terrien, P.; Lockwood, F.; Granados, L.; Morel, T. CO2 Capture from H2 Plants: Implementation for EOR. Energy Procedia 2014, 63, 7861–7866. [Google Scholar] [CrossRef]
  22. Pérez, A.; Pérez, E.; Dupraz, S.; Bolcich, J. Patagonia Wind-Hydrogen Project: Underground Storage and Methanation. In Proceedings of the 21st World Hydrogen Energy Conference 2016, Zaragoza, Spain, 13–16 June 2016. [Google Scholar]
  23. Cwicklinski, G.; Miras, R.; Pérard, J.; Rinaldi, C.; Darrouzet, E.; Cavazza, C. Development of a CO2-Biomethanation Reactor for Producing Methane from Green H2. Sustain. Energy Fuels 2024, 8, 1068–1076. [Google Scholar] [CrossRef]
  24. Heinemann, N.; Bünger, U.; Götz, R.; Hagemann, B.; Heinemann, T.; Henkel, S.; Kühn, M.; Schuppers, M. Hydrogen Underground Storage—Petrophysical and Geochemical Characteristics of Potential Storage Formations; Karlsruhe Institute of Technology (KIT): Karlsruhe, Germany, 2018; Available online: https://publikationen.bibliothek.kit.edu/1000094302 (accessed on 6 October 2025).
  25. Strobel, G.; Hagemann, B.; Huppertz, T.M.; Ganzer, L. Underground Bio-Methanation: Concept and Potential. Renew. Sustain. Energy Rev. 2020, 123, 109747. [Google Scholar] [CrossRef]
  26. Hellerschmied, C.; Schritter, J.; Waldmann, N.; Zaduryan, A.B.; Rachbauer, L.; Scherr, K.E.; Andiappan, A.; Bauer, S.; Pichler, M.; Loibner, A.P. Hydrogen Storage and Geo-Methanation in a Depleted Underground Hydrocarbon Reservoir. Nat. Energy 2024, 9, 333–344. [Google Scholar] [CrossRef]
  27. Götz, M.; Lefebvre, J.; Mörs, F.; McDaniel Koch, A.; Graf, F.; Bajohr, S.; Reimert, R.; Kolb, T. Renewable Power-to-Gas: A Technological and Economic Review. Renew. Energy 2016, 85, 1371–1390. [Google Scholar] [CrossRef]
  28. Bailera, M.; Lisbona, P.; Espatolero, S.; Romeo, L.M. Power to Gas Technology under Spanish Future Energy Scenario. Energy Procedia 2017, 114, 6880–6885. [Google Scholar] [CrossRef]
  29. Bauer, S. Underground Sun Conversion; RAG Austria AG: Vienna, Austria, January 2021; Available online: https://www.underground-sun-conversion.at/en/ (accessed on 8 October 2025).
  30. Efenberger, M.; Brzezińska-Blaszczyk, E.; Wódz, K. Archaeons—Still Unknown Microorganisms. Postep. Hig. Med. Dosw. 2014, 68, 1452–1463. [Google Scholar] [CrossRef] [PubMed]
  31. Wolicka, D.; Borkowski, A. Introduction to Enhanced Oil Recovery (EOR) Processes and Bioremediation of Oil-Contaminated Sites. In Microorganisms and Crude Oil; InTech: London, UK, 2012. [Google Scholar]
  32. Smigan, P.; Greksak, M.; Kozankova, J.; Buzek, F.; Onderka, V.; Wolf, I. Methanogenic Bacteria as a Key Factor Involved in Changes of Town Gas Stored in an Underground Reservoir. FEMS Microbiol. Ecol. 1990, 73, 221–224. [Google Scholar] [CrossRef]
  33. Moeininia, N.; Bueltemeier, H.; Krasper, L.; Nikolaev, D. Development of a New Workflow to Underground Biomethanation Simulation Using CMG STARS. In Proceedings of the World Gas Conference 2022 (WGC2022), Dageu, Republic of Korea, 23 May 2022. [Google Scholar]
  34. Panfilov, M.; Reitenbach, V.; Ganzer, L. Self-Organization and Shock Waves in Underground Methanation Reactors and Hydrogen Storages. Environ. Earth Sci. 2016, 75, 313. [Google Scholar] [CrossRef]
  35. Pudlo, D.; Ganzer, L.; Henkel, S.; Kühn, M.; Liebscher, A.; De Lucia, M.; Panfilov, M.; Pilz, P.; Reitenbach, V.; Albrecht, D.; et al. The H2STORE Project: Hydrogen Underground Storage—A Feasible Way in Storing Electrical Power in Geological Media? In Clean Energy Systems in the Subsurface: Production, Storage and Conversion; Springer Series in Geomechanics and Geoengineering; Springer: Berlin/Heidelberg, Germany, 2013; pp. 395–412. [Google Scholar]
  36. Bauer, S. Undeground Sun Storage—Final Report; RAG Austria AG: Vienna, Austria, 2020; Available online: https://www.underground-sun-storage.at/en/ (accessed on 8 October 2025).
  37. Konegger, H.; Loibner, A.; Waldmann, N.; Zaduryan, A.; Zeiser, M.; Rüdisüli, M.; Mutschler, R.; Sidler, D.; Boggiano, M.; Kunz, A.; et al. Underground Sun Conversion-Flexible Storage (USC-Flex Store); RAG Austria: Vienna, Austria, 2023; Available online: https://www.underground-sun-conversion.at/flexstore/presse/publikationen/endbericht.html (accessed on 8 October 2025).
  38. Panfilov, M. Underground Storage of Hydrogen: In Situ Self-Organisation and Methane Generation. Transp. Porous Media 2010, 85, 841–865. [Google Scholar] [CrossRef]
  39. Carroll, J.J.; Slupsky, J.D.; Mather, A.E. The Solubility of Carbon Dioxide in Water at Low Pressure. J. Phys. Chem. Ref. Data 1991, 20, 1201–1209. [Google Scholar] [CrossRef]
  40. Rezania, P.; Ranjbar, V.; Nasrifar, K. High Pressure Solubility of Light Gases (CH4, C2H6, C3H8, H2S, CO2, N2, Xe, Ar and Kr) and Certain Gas Mixtures in Water from Cubic Equations of State. J. Solut. Chem. 2021, 50, 1169–1188. [Google Scholar] [CrossRef]
  41. Zhu, Z.; Cao, Y.; Zheng, Z.; Chen, D. An Accurate Model for Estimating H2 Solubility in Pure Water and Aqueous NaCl Solutions. Energies 2022, 15, 5021. [Google Scholar] [CrossRef]
  42. Chen, X.; Wang, Y.; He, Z.; Fan, Q. Solubility Models of CH4, CO2, and Noble Gases and Their Geological Applications. J. Nat. Gas Geosci. 2023, 8, 337–347. [Google Scholar] [CrossRef]
  43. Hogeweg, S.; Strobel, G.; Hagemann, B. Benchmark Study for the Simulation of Underground Hydrogen Storage Operations. Comput. Geosci. 2022, 26, 1367–1378. [Google Scholar] [CrossRef]
  44. Wu, L.; Hou, Z.M.; Luo, Z.F.; Fang, Y.L.; Huang, L.C.; Wu, X.N.; Chen, Q.J.; Wang, Q.C. Impacts of Microbial Interactions on Underground Hydrogen Storage in Porous Media: A Comprehensive Review of Experimental, Numerical, and Field Studies. Pet. Sci. 2024, 21, 4067–4099. [Google Scholar] [CrossRef]
  45. Shabani, B.; Pashin, J.; Vilcáez, J. TOUGHREACT-CO2Bio—A New Module to Simulate Geological Carbon Storage under Biotic Conditions (Part 2): The Bio-Geochemical Reactive Transport of CO2-CH4-H2-H2S Gas Mixtures. J. Nat. Gas. Sci. Eng. 2020, 76, 103190. [Google Scholar] [CrossRef]
  46. Wang, J.; Guo, X. The Gompertz Model and Its Applications in Microbial Growth and Bioproduction Kinetics: Past, Present and Future. Biotechnol. Adv. 2024, 72, 108335. [Google Scholar] [CrossRef]
  47. Safari, Z.; Fatehi, R.; Azin, R. Developing a Numerical Model for Microbial Methanation in a Depleted Hydrocarbon Reservoir. Renew. Energy 2024, 227, 120426. [Google Scholar] [CrossRef]
  48. Wu, L.; Hou, Z.; Luo, Z.; Huang, L.; Xiong, Y.; Mehmood, F.; Liu, J.; Sun, W.; Xie, Y. Efficiency Assessment of Underground Biomethanation with Hydrogen and Carbon Dioxide in Depleted Gas Reservoirs: A Biogeochemical Simulation. Energy 2023, 283, 128539. [Google Scholar] [CrossRef]
  49. Szott, W.; Miłek, K. Numerical Simulations of Hydrogen Storage in a Partially Depleted Gas Reservoir. Nafta-Gaz 2022, 78, 41–55. [Google Scholar] [CrossRef]
  50. Feldmann, F.; Hagemann, B.; Ganzer, L.; Panfilov, M. Numerical Simulation of Hydrodynamic and Gas Mixing Processes in Underground Hydrogen Storages. Environ. Earth Sci. 2016, 75, 1165. [Google Scholar] [CrossRef]
  51. Schlumberger. Internal Technical Note: Simulation of Methanisation Process Using Multi-Component Water (Isothermal); Schlumberger: Houston, TX, USA, 2024; Unpublished Material. [Google Scholar]
  52. Wu, J.; Ansari, U. From CO2 Sequestration to Hydrogen Storage: Further Utilization of Depleted Gas Reservoirs. Reserv. Sci. 2025, 1, 19–35. [Google Scholar] [CrossRef]
  53. Wang, F.; Kobina, F. The Influence of Geological Factors and Transmission Fluids on the Exploitation of Reservoir Geothermal Resources: Factor Discussion and Mechanism Analysis. Reserv. Sci. 2025, 1, 3–18. [Google Scholar] [CrossRef]
  54. Panfilov, M. Physicochemical Fluid Dynamics in Porous Media; Wiley: Hoboken, NJ, USA, 2018; ISBN 9783527342358. [Google Scholar]
  55. Miłek, K.; Szott, W.; Tyburcy, J.; Lew, A. Reservoir Simulations of Hydrogen Generation from Natural Gas with CO2 EOR: A Case Study. Energies 2024, 17, 2321. [Google Scholar] [CrossRef]
  56. Yao, C.; Meng, X.; Qu, X.; Cheng, T.; Da, Q.; Zhang, K.; Lei, G. Kinetic Model and Numerical Simulation of Microbial Growth, Migration, and Oil Displacement in Reservoir Porous Media. ACS Omega 2022, 7, 32549–32561. [Google Scholar] [CrossRef] [PubMed]
  57. Schlumberger. ECLIPSE Technical Description, version 2019.1; Schlumberger Ltd.: Houston, TX, USA, 2019. [Google Scholar]
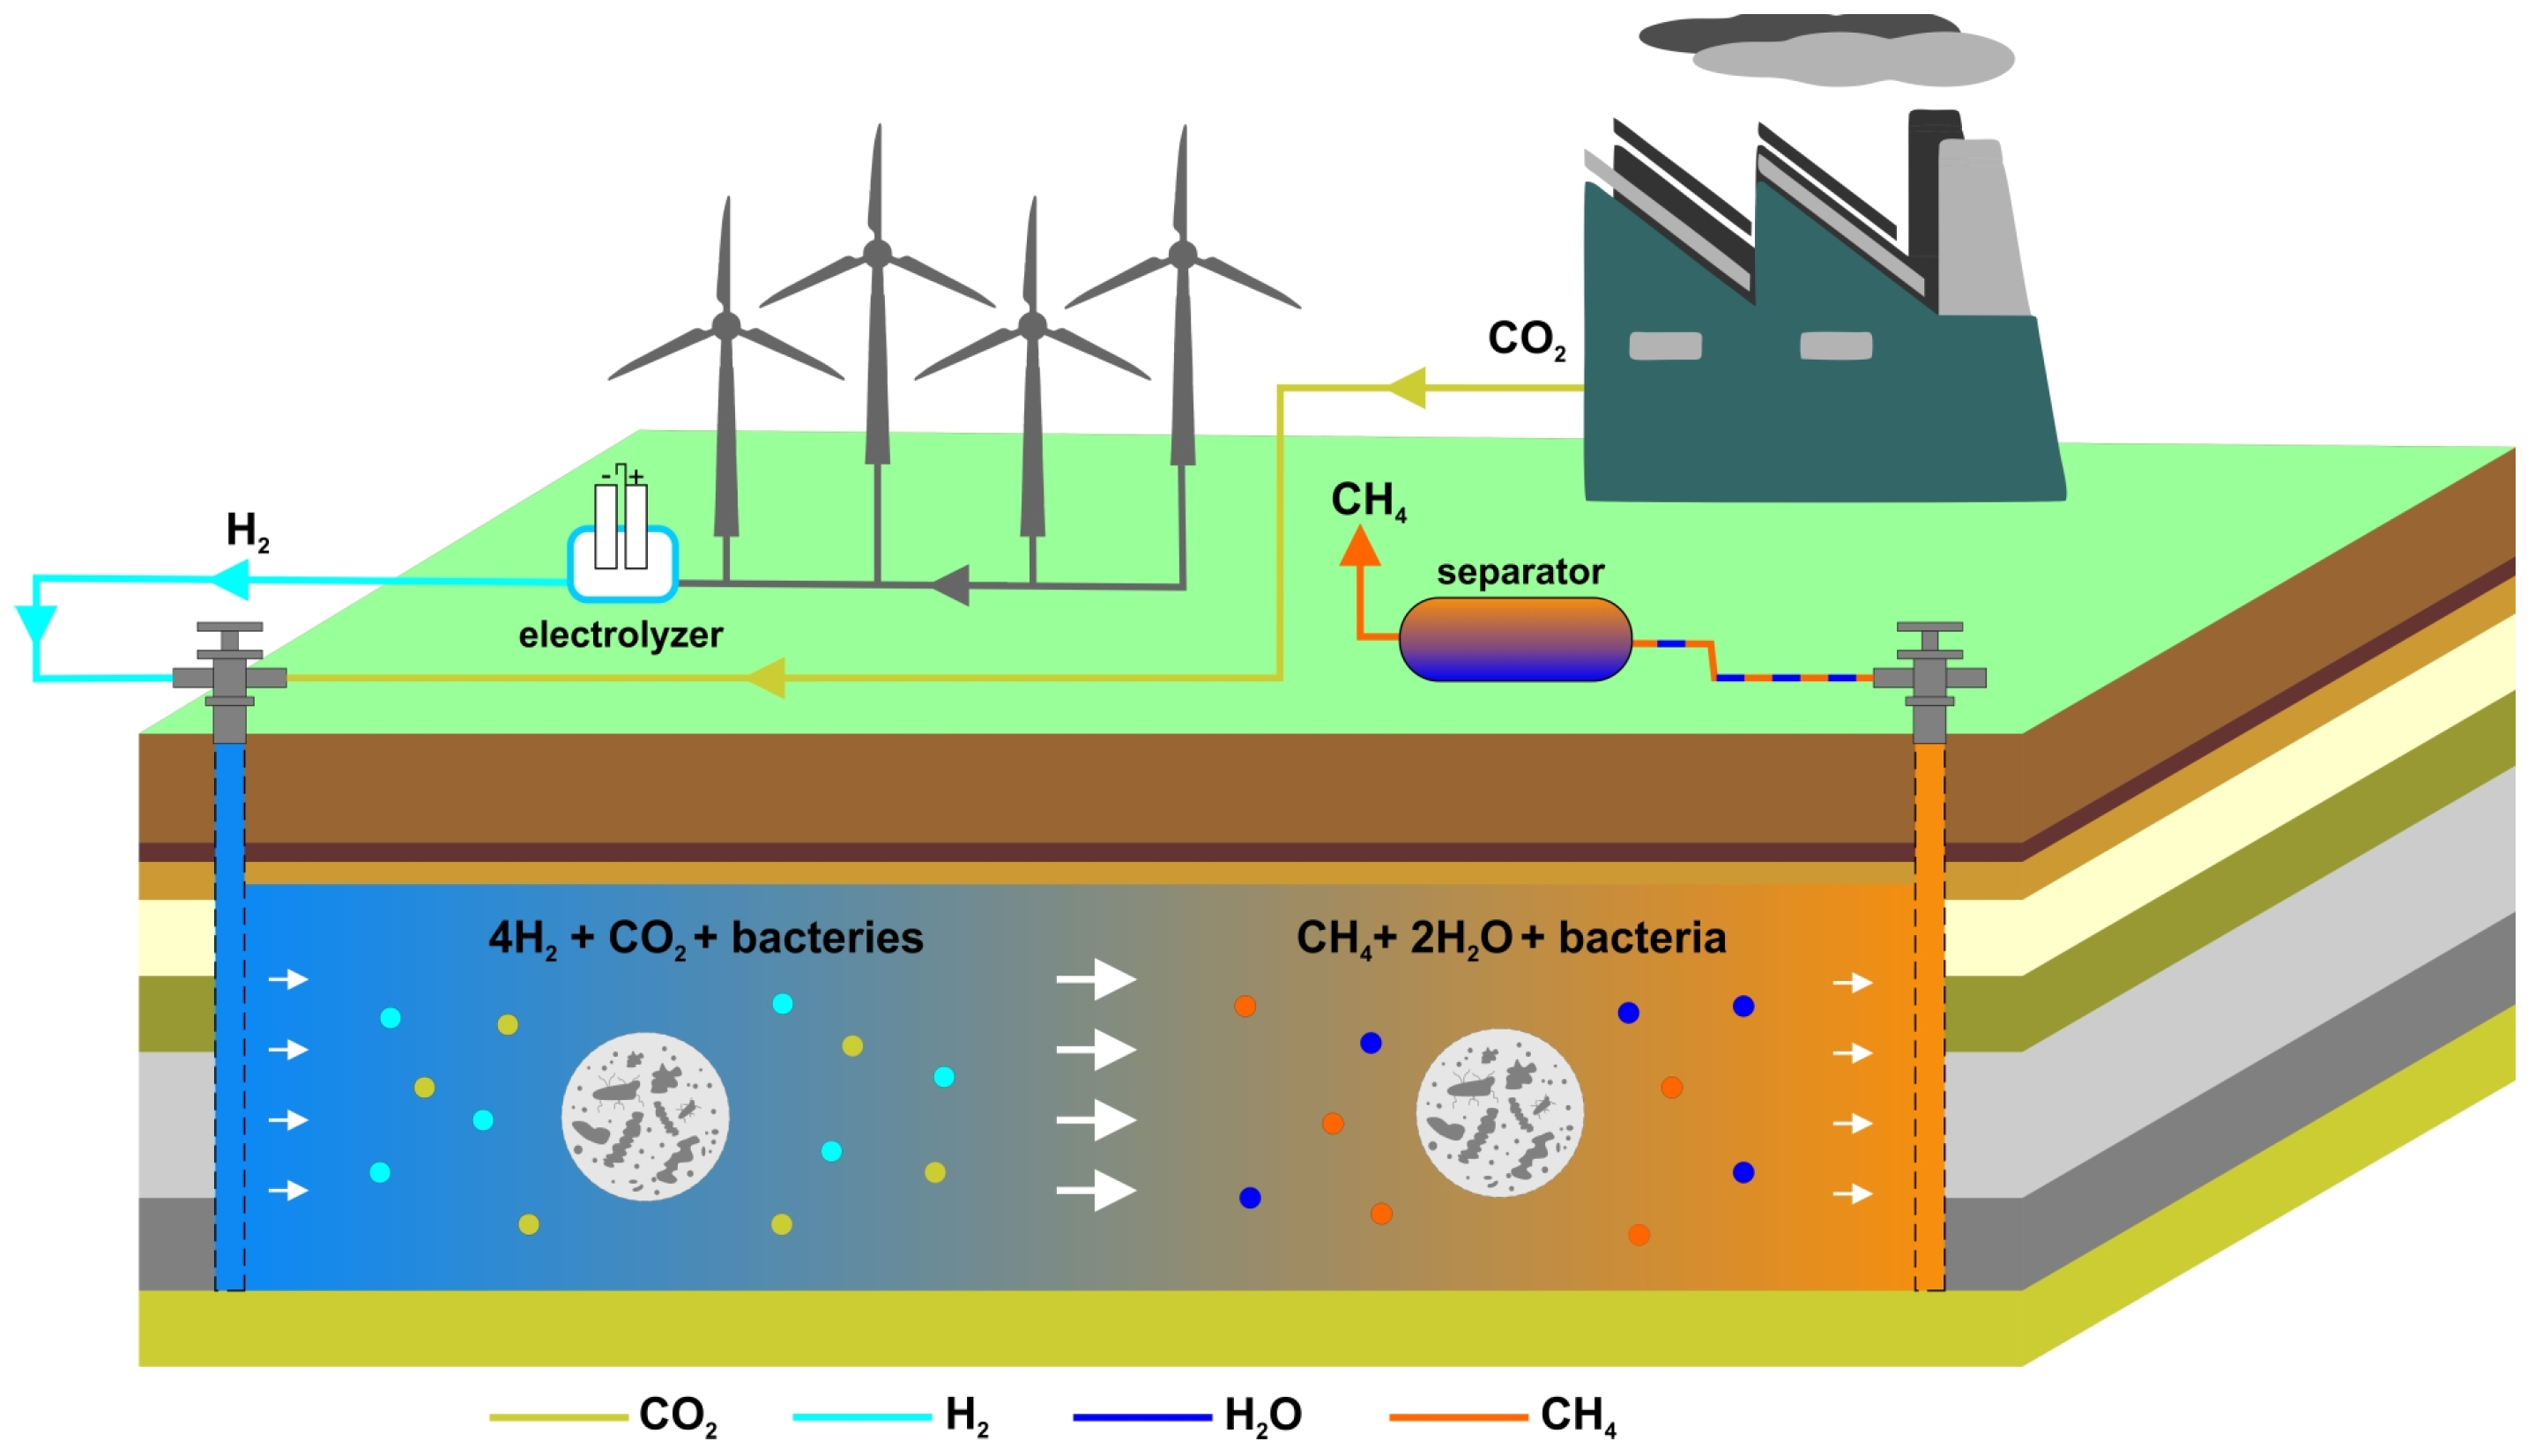
Figure 1. Schematic of Power-to-Gas installation.
Energies 18 05661 g001
Figure 2. Synthetic UMR model: (a) 3D view, (b) vertical section with initial water saturation distribution.
Energies 18 05661 g002
Figure 3. Schematic representation of the biomethanation process.
Energies 18 05661 g003
Figure 4. The result of fitting the solubility model to the measured data for (a) H2, (b) CO2, (c) CH4.
Energies 18 05661 g004
Figure 5. Gas injection efficiency, its molar composition, and average reservoir pressure in UMR.
Energies 18 05661 g005
Figure 6. Volume of water, gas, and average reservoir pressure in UMR.
Energies 18 05661 g006
Figure 7. Number of moles of H2 (C1), CO2 (C2), CH4 (C3), and formation water in the UMR.
Energies 18 05661 g007
Figure 8. Number of moles of components present in the formation water: bacteria (C5), H2,DS (C6), CO2,DS (C7), CH4,DS (C8) in UMR.
Energies 18 05661 g008
Figure 9. Number of moles of pure water (C4) in solution and formation water in the UMR.
Energies 18 05661 g009
Figure 10. Number of moles of H2: in the gas phase (C1) and dissolved in the formation water (C6). Total amount of CH4 produced in the biomethanation reaction (R1) and H2 dissolved in water (R2). Average reservoir pressure.
Energies 18 05661 g010
Figure 11. Number of moles of CO2: in the gas phase (C2) and dissolved in the formation water (C7). Total amount of CH4 produced in the biomethanation reaction (R1), and CO2 dissolved in formation water (R3). Average reservoir pressure.
Energies 18 05661 g011
Figure 12. Number of moles of CH4 dissolved in formation water (C8). Total amount of produced CH4 (R1) and CH4 released from the aqueous phase to the gas phase (R4). Average reservoir pressure. Note: The C3 component (CH4 in the gas phase) is not visible in this figure because it lies outside the displayed scale range; see Figure 13 for the corresponding full-range distribution.
Energies 18 05661 g012
Figure 13. Number of moles of CH4 in the gas phase (C3) and dissolved in the formation water (C8). Total amount of produced CH4 (R1) and CH4 released from the aqueous phase to the gas phase (R4). Average reservoir pressure.
Energies 18 05661 g013
Figure 14. Vertical section. H2 concentration in the gas phase for selected time steps.
Energies 18 05661 g014
Figure 15. Vertical section. CO2 concentration in the gas phase for selected time steps.
Energies 18 05661 g015
Figure 16. Vertical section. CH4 concentration in the gas phase for selected time steps.
Energies 18 05661 g016
Figure 17. Vertical section. H2,DS concentration in water formation for selected time steps.
Energies 18 05661 g017
Figure 18. Vertical section. CO2,DS concentration in water formation for selected time steps.
Energies 18 05661 g018
Figure 19. Vertical section. CH4,DS concentration in formation water for selected time steps.
Energies 18 05661 g019
Figure 20. Number of moles: H2 (C1), CO2 (C2), CH4 (C3) in UMR, reservoir pressure for three scenarios differing in the composition of the injected gas. The solid line represents Scenario 0 (CO2/H2 = 20:80), the dashed line Scenario 1 (CO2/H2 = 25:75), and the dotted line Scenario 2 (CO2/H2 = 15:85).
Energies 18 05661 g020
Figure 21. Number of moles of H2,DS (C6), CO2,DS (C7), CH4,DS (C8) in UMR, formation pressure for three scenarios differing in the composition of the injected gas. The solid line represents Scenario 0 (CO2/H2 = 20:80), the dashed line Scenario 1 (CO2/H2 = 25:75), and the dotted line Scenario 2 (CO2/H2 = 15:85).
Energies 18 05661 g021
Figure 22. Total amount of CH4,DS from biomethanation (R1), H2 dissolved in water (R2), CO2 dissolved in water (R3), CH4 released from water (R4). The solid line represents Scenario 0 (CO2/H2 = 20:80), the dashed line Scenario 1 (CO2/H2 = 25:75), and the dotted line Scenario 2 (CO2/H2 = 15:85).
Energies 18 05661 g022
Table 1. Parameters of the SRK equation for a fluid of variable composition.
ComponentMolecular WeightTcritPcritVcritZcritVol ShiftAcentric FactorParachor Omega AOmega B
[kg/kmole][K][Bar][m3/kg-Moles][-][-][-][Dyne/cm][-][-]
H22.0233.2013.000.0650.30610−0.218340.42750.0866
CO244.01304.7073.870.0940.274100.225780.42750.0866
CH416.04190.6046.040.0980.284700.013770.42750.0866
Table 2. Parameters of formation water components.
ComponentMolecular WeightCompressibilityDensity
[kg/kmole][1/Bar][kg/m3]
H2O18.024.74 × 10−71004.8
Bact104.74 × 10−71004.8
H2,DS2.024.74 × 10−71004.8
CO2,DS44.014.74 × 10−71004.8
CH4,DS16.044.74 × 10−71004.8
Table 3. Initial molar composition of formation water.
ComponentMolar Composition [%]
pure H2O99.9205
bacteria0.01
H2,DS<0.01
CO2,DS<0.01
CH4,DS0.0695
Table 4. Basic results for prognostic scenarios of the biomethanation process differing in the composition of the injected gas.
SizeScenario
012
Initial amount of CH4 in gas8,805,0008,805,0008,805,000
Amount of injected H2 [kmol]2,497,0012,340,9382,653,063
Amount of CO2 injected [kmol]624,250780,313468,188
Amount of dissolved H2,DS in water [kmol]1,806,2321,959,2291,519,725
Amount of CO2,DS dissolved in water [kmol]624,290741,657468,277
Amount of CH4,DS produced [kmol]446,643485,839373,867
Conversion efficiency of H2 to CH4 [%]71.5583.0256.37
Amount of CH4,DS released from water [kmol]440,836479,814368,743
Relative rise of CH4 in gas phase [%]5.015.454.19
Disclaimer/Publisher’s Note: The statements, opinions and data contained in all publications are solely those of the individual author(s) and contributor(s) and not of MDPI and/or the editor(s). MDPI and/or the editor(s) disclaim responsibility for any injury to people or property resulting from any ideas, methods, instructions or products referred to in the content.