Article

Agent-Based Energy Market Modeling with Machine Learning and Econometric Forecasting for the Net-Zero Emissions Transition

by
Burak Gokce
* and
Gulgun Kayakutlu
Energy Science and Technology, Energy Institute, Istanbul Technical University, 34469 Istanbul, Türkiye
*
Author to whom correspondence should be addressed.
Energies 2025, 18(21), 5655; https://doi.org/10.3390/en18215655
Submission received: 27 September 2025 / Revised: 21 October 2025 / Accepted: 25 October 2025 / Published: 28 October 2025
(This article belongs to the Section B1: Energy and Climate Change)

Abstract

The transition of Türkiye’s energy market toward net-zero emissions by 2053 requires modeling approaches capable of capturing complex interactions and long-term uncertainties. In this study, a long-term agent-based modeling (ABM) framework was developed, integrating econometric demand forecasting with a seasonal autoregressive integrated moving average (SARIMA) model and machine learning (ML)-based day-ahead market (DAM) price prediction. Of the ML models tested, CatBoost achieved the highest accuracy, outperforming XGBoost and Random Forest, and supported investment analysis through net present value (NPV) calculations. The framework represents major market actors—including generation units, investors, and the market operator—while also incorporating the impact of Türkiye’s first nuclear power plant (NPP) under construction and the potential introduction of a carbon emissions trading scheme (ETS). All model components were validated against historical data, confirming robust forecasting and market replication performance. Hourly simulations were conducted until 2053 under alternative policy and demand scenarios. The results show that renewable generation expands steadily, led by onshore wind and solar photovoltaic (PV), while nuclear capacity, ETS implementation, and demand assumptions significantly reshape prices, generation mix, and carbon emissions. The nuclear plant lowers market prices, whereas an ETS substantially raises them, with both policies contributing to emission reductions. These scenario results were connected to actionable policy recommendations, outlining how renewable expansion, ETS design, nuclear development, and energy efficiency measures can jointly support Türkiye’s 2053 net-zero target. The proposed framework provides an ex-ante decision-support framework for policymakers, investors, and market participants, with future extensions that can include other energy markets, storage integration, and enriched scenario design.

1. Introduction

The transition toward carbon neutrality in energy markets involves numerous heterogeneous actors and complex interactions, making it difficult for traditional modeling approaches to capture long-term dynamics. Agent-based modeling (ABM) provides an effective framework for analyzing such complex systems. In electricity markets, ABM enables the representation of producers, consumers, storage units, market operators, and regulators, while also capturing their individual decision-making behaviors and interactions. This approach allows researchers to investigate how the collective behavior of agents influences the overall system, thereby facilitating a better understanding of real-world dynamics [1]. In this way, newly introduced market participants, policies, regulations, and technologies can be examined in detail to support the development of effective decision-making frameworks.
In ABM studies, the accuracy of simulations can be improved by incorporating machine learning (ML) methods. Reinforcement learning (RL) techniques enable agents to learn and adapt their strategies in ways that more closely reflect real-world decision-making [2]. A typical application is the adjustment of bidding strategies for producers or consumers through learning during the simulation process [3]. Moreover, ML can be applied to predict exogenous variables such as demand or market prices, further enhancing model accuracy. Supervised ML methods are often used for such forecasting tasks [4]. In the literature, studies focusing on agent learning significantly outnumber those relying on external data prediction [5].
Among the general-purpose ABM software tools, the Recursive Porous Agent Simulation Toolkit (Repast) was one of the earliest platforms to integrate ML algorithms, including genetic algorithms, artificial neural networks (ANNs), and other methods [6]. Another widely used tool is AnyLogic, a commercially developed software that enables agent modeling and simulation with reduced coding requirements and advanced visualization features [7,8]. These general-purpose ABM platforms paved the way for energy market-specific simulation frameworks. For instance, the Simulator for Electric Power Industry Agents (SEPIA) models stakeholders such as power plants, consumers, suppliers, and transmission operators [9]. Similarly, the Electricity Market Complex Adaptive Systems (EMCAS) tool incorporates independent system operators (ISOs) and regulators, allowing users to define market rules and observe their effects [10]. The Multi-Agent System that Simulates Competitive Electricity Markets (MASCEM) further extends this approach by introducing virtual producers that represent groups of agents and make strategic group decisions on their behalf [11].
Several ABM frameworks have also been developed to represent specific national electricity markets. For instance, the National Electricity Market Simulation System (NEMSIM) models the Australian market, incorporating contracts, investments, and carbon emissions [12]. ElectTrans simulates the Dutch system by capturing long-term capacity additions and plant retirements, while ElecSim provides a framework for analyzing investment decisions in the UK market [13,14]. The electricity markets investment suite–agent-based simulation (EMIS-AS) broadens this perspective by integrating financing options, technology preferences, and risk tolerance into investment decision-making [15]. Nexus-e simulates the Swiss electricity market, including cross-border trading [16,17]. As a last example, Guven et al. [18] developed a long-term ABM model with yearly resolution that integrates climate projections and policy scenarios, demonstrating how renewable incentives and nuclear development influence emissions and energy costs.
Despite these advances, the number of studies remains limited, with a review of ABM–ML integration in local energy markets between 2000 and 2019 indicating that only a small number of works existed, particularly those employing ML for external data prediction [5]. Long-term studies are particularly challenging, as they require reliable projections of market behavior and policy developments. Consequently, most research has concentrated on short-term analyses [19]. Nevertheless, incorporating ML-based forecasting of external variables can significantly enhance the accuracy of ABM simulations. For example, Fraunholz et al. [20] employed the power agent-based computational economics (PowerACE) platform to predict European day-ahead prices from 2020 to 2050, with ANN models achieving the highest accuracy. Similarly, Kell et al. [21] assessed forecasting models within the ElecSim tool for UK hourly demand data (2011–2017), finding that the extra trees regressor outperformed offline methods, whereas online retraining with a multilayer perceptron produced superior results.
Studies conducted between 2016 and 2021 show that ABM–ML research in energy markets has primarily focused on specific applications such as bidding and price forecasting [22]. Most studies have been limited to electricity markets, with relatively little attention paid to broader system perspectives. Although some research has incorporated carbon emissions trading mechanisms, the number of such studies is still limited [23]. Another notable shortcoming is that only a few studies explicitly discuss verification and validation procedures [24]. In ABM, verification ensures that the model has been correctly implemented, whereas validation examines whether the model structure and behavior accurately reflect real-world dynamics [25]. Notably, 58% of the studies published between 2014 and 2024 relied on artificial data, limiting their ability to validate models under actual market conditions and often resulting in less realistic simulations compared with those based on real-world data [19]. This study addresses those gaps by presenting an ABM application that integrates machine learning and econometric forecasting, specifically designed for the Turkish energy market.
Türkiye’s electricity market is liberalized and is rapidly increasing its renewable electricity production share. By the end of September 2025, total installed capacity reached 121 GW, of which 61% was derived from renewable energy resources (hydropower, wind, solar, geothermal, and biofuel). Solar photovoltaics (PVs) have shown the strongest growth momentum, with capacity more than doubling within two years to reach 24.1 GW [26]. Market operations are administered by the Energy Exchange Istanbul (EXIST), which oversees the hourly day-ahead and intraday electricity markets, while the Turkish Electricity Transmission Corporation (TEIAS)—a state-owned enterprise—manages transmission system reliability through balancing power and ancillary services. Electricity prices are strongly influenced by hydrology and fuel costs, since hydropower (reservoir and run-of-river) still has the largest installed capacity, and natural gas and coal-fired generation continue to play a critical role in meeting rising demand [26]. The Turkish natural gas market is organized around BOTAS, the state-owned pipeline operator and principal importer, alongside the EXIST-operated natural gas spot market. In practice, gas prices for power plants are largely governed by BOTAS’s wholesale tariff-setting mechanisms, meaning that the marginal costs of the electricity market are heavily influenced by BOTAS’s pricing decisions [27].
Türkiye ratified the Paris Agreement on 7 October 2021 and committed to achieving net-zero greenhouse gas emissions by 2053 [28]. The National Energy Plan foresees a large additional capacity for renewables consistent with this target, while the Akkuyu Nuclear Power Plant (NPP), whose first unit is scheduled to start test production in 2025, is expected to significantly alter the emissions’ trajectory [29]. Complementary climate policy instruments are also evolving. A draft regulation for a national emissions trading scheme (ETS)—aligned in structure with the European Union (EU) ETS—was published in 2023 to establish allowance allocation and auctioning mechanisms [30]. In parallel, Türkiye supports low-carbon investment through feed-in tariffs (FITs) and renewable energy resource area (YEKA) schemes, which provide long-term power purchase guarantees and auctions for increased wind and solar PV capacities, respectively [31,32]. Moreover, the EXIST guarantee of origin system certifies renewable electricity and enables voluntary green-energy trading [33]. TEIAS continues to expand high-voltage infrastructure and interconnection projects to facilitate renewable integration, although a comprehensive long-term grid expansion master plan is not publicly disclosed. Together, these market, policy, and infrastructure initiatives frame Türkiye’s transition toward a more flexible, low-carbon electricity system.
This study examines how renewable energy integration, nuclear deployment, a potential carbon trading scheme, and various demand scenarios may shape electricity market dynamics, investment decisions, generation mix, prices, and emissions. Through scenario-based simulations, the model projects possible future developments of the Turkish market, thereby providing valuable insights for policymakers and investors seeking to align with the 2053 net-zero target.
The Turkish energy market is modeled as a holistic system that encompasses the central electricity market, carbon emission trading scheme, generation units, investors, and the market operator. While the primary emphasis is on long-term projections, the model also incorporates short-term simulations for verification, thereby enhancing the reliability of long-term outcomes. Real market data are employed, and multiple supervised ML techniques, together with an econometric approach based on the seasonal autoregressive integrated moving average (SARIMA) method, are applied to forecast exogenous demand and price variables. The integration of econometric and ML methods represents a methodological innovation, strengthening the robustness of the long-term ABM framework. The main contributions of this study can be summarized as follows:
  • Developing a long-term ABM framework for Türkiye’s energy market that integrates econometric (SARIMA) demand forecasting with ML-based (CatBoost) day-ahead price (DAP) prediction;
  • Integrating ML for exogenous data prediction to enhance ABM accuracy and benchmarking multiple ML models to identify the best-performing approach;
  • Demonstrating the value of combining ABM, econometric forecasting, and ML methods for long-term policy and investment assessment;
  • Quantifying the effects of nuclear commissioning, carbon pricing, and demand variations on electricity prices, generation mix, and emissions;
  • Introducing a short-term ABM component for model verification and validation, thereby increasing confidence in long-term outcomes;
  • Conducting hourly simulations through 2053 to capture market granularity and realistic operational dynamics;
  • Employing real-world, publicly available data to ensure transparency, reproducibility, and policy relevance.
The remainder of this paper is structured as follows. Section 2 introduces the overall modeling framework, including materials and data, as well as the econometric and ML methods employed for electricity demand and price forecasting. Section 3 presents the agent representation and the design of the day-ahead market (DAM), ETS, and investment modules. Section 4 reports the results of long-term simulations, highlighting how alternative policy and demand scenarios shape electricity market prices, generation mix, and carbon emissions trajectories. It also provides a practical policy translation, connecting the simulation results to actionable recommendations for Türkiye’s energy transition. Finally, Section 5 summarizes the conclusions and outlines directions for future research.

2. Methods Used in ABM of Energy Markets

2.1. Materials and Scope

The subject of this research is Türkiye’s national energy market and its transition toward the 2053 net-zero emissions target. This study addresses the problem of how policy, investment, and demand developments influence long-term generation mix, market prices, and carbon emissions under uncertain future conditions. The main research objective is to develop a comprehensive long-term ABM framework that integrates econometric demand forecasting and ML-based price prediction to evaluate energy policy and investment pathways. The following hypotheses were formulated to guide this analysis:
  • Investors will prioritize renewable technologies with higher net present value (NPV) returns, leading to the steady expansion of onshore wind and solar PV capacity;
  • The inclusion of nuclear capacity in Türkiye’s generation portfolio will lower wholesale electricity prices and reduce emissions relative to a system without nuclear power;
  • The introduction of a national ETS will increase market prices but accelerate emission reductions;
  • Higher electricity demand trajectories will raise prices and slow the decarbonization rate, whereas lower demand will have the opposite effect.
This study employs publicly available datasets from EXIST, TEIAS, and other national institutions, complemented by international data and forecasts covering fossil fuel prices, carbon prices, investment and operation costs, and plant lifetime parameters (Table 1).
The software framework for the proposed ABM was implemented using AnyLogic 8.9.6 Personal Learning Edition, chosen for its flexibility in defining agents and customizable interactions. AnyLogic was complemented by an in-house Python 3.10 application, which was used for data preprocessing, econometric analysis, ML model training, and the post-processing of simulation outputs. The Python environment included widely used scientific libraries—Pandas, NumPy, Scikit-learn, CatBoost, and Matplotlib—to ensure robustness and reproducibility. Data transfer between Python and AnyLogic was managed via structured Microsoft Excel (.xlsx) interfaces. Simulation results were analyzed in Python for model validation, visualization, and scenario-based policy interpretation.
The analyses and simulations in this study were performed on an HP Z4 G4 Workstation equipped with an Intel(R) Xeon(R) W-2123 CPU (3.60 GHz, 4 cores/8 threads), 64 GB DDR4-2933 MHz RAM (CL 21, two Kingston KSM29RD4/32HDR modules), and a 512 GB Samsung MZVL2512HCJQ SSD. The system is built on an HP 81C5 motherboard (BIOS version P61 v02.95, 21 November 2024) and operates on Microsoft Windows 11 Pro 64-bit (Build 26100.1).
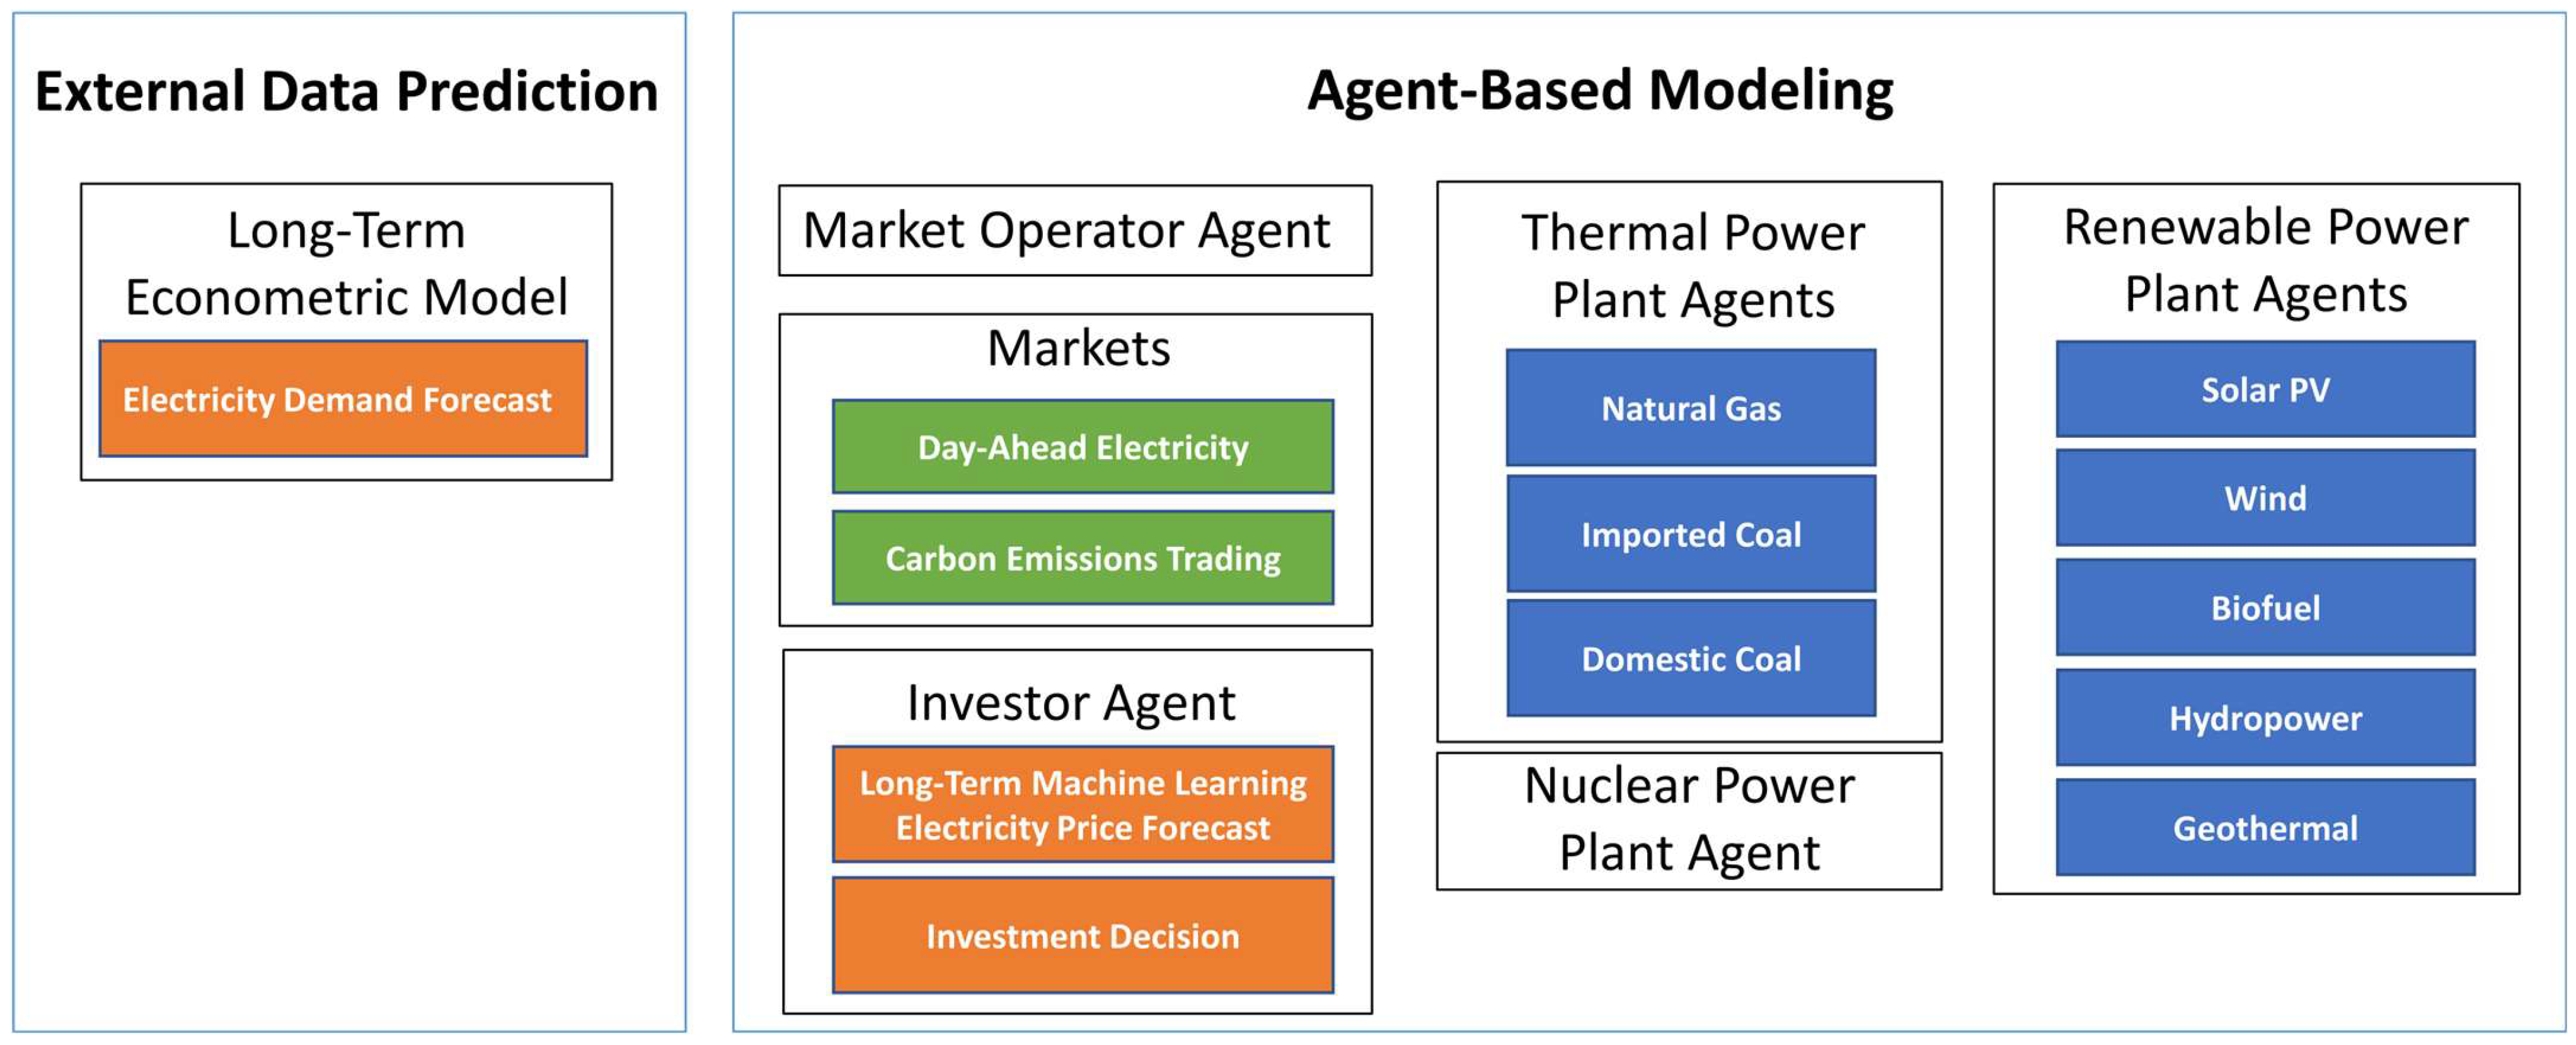
The proposed framework connects external data prediction with agent-based modeling to capture both the short- and long-term dynamics of the Turkish energy market. As shown in Figure 1, the external econometric model (SARIMA) provides long-term electricity demand projections, while the CatBoost ML model supplies DAP forecasts that feed into the investor agent’s decision-making process. Within the ABM environment, the market operator agent clears the DAM and, under the relevant scenarios, a prospective carbon ETS. Thermal power plant agents (natural gas, imported coal, and domestic coal), renewable agents (solar PV, wind, hydropower, geothermal, and biofuel), and the NPP agent submit bids based on their cost structures, technical constraints, and policy environment. The Akkuyu NPP is modeled as a baseload generation unit, following Türkiye’s official commissioning plan. Its installed capacity is treated as an exogenous parameter in the scenario design, reflecting a fixed policy commitment rather than an endogenous investment decision.
Investor agents decide on new capacity additions and retirements according to projected demand and prices, thereby updating the generation portfolio over time. As illustrated in Figure 2, these interactions create a feedback loop in which demand, market prices, emissions, and investment decisions co-evolve on an hourly basis until 2053, providing a comprehensive view of how policy, technology, and market forces can shape Türkiye’s pathway to net-zero emissions.
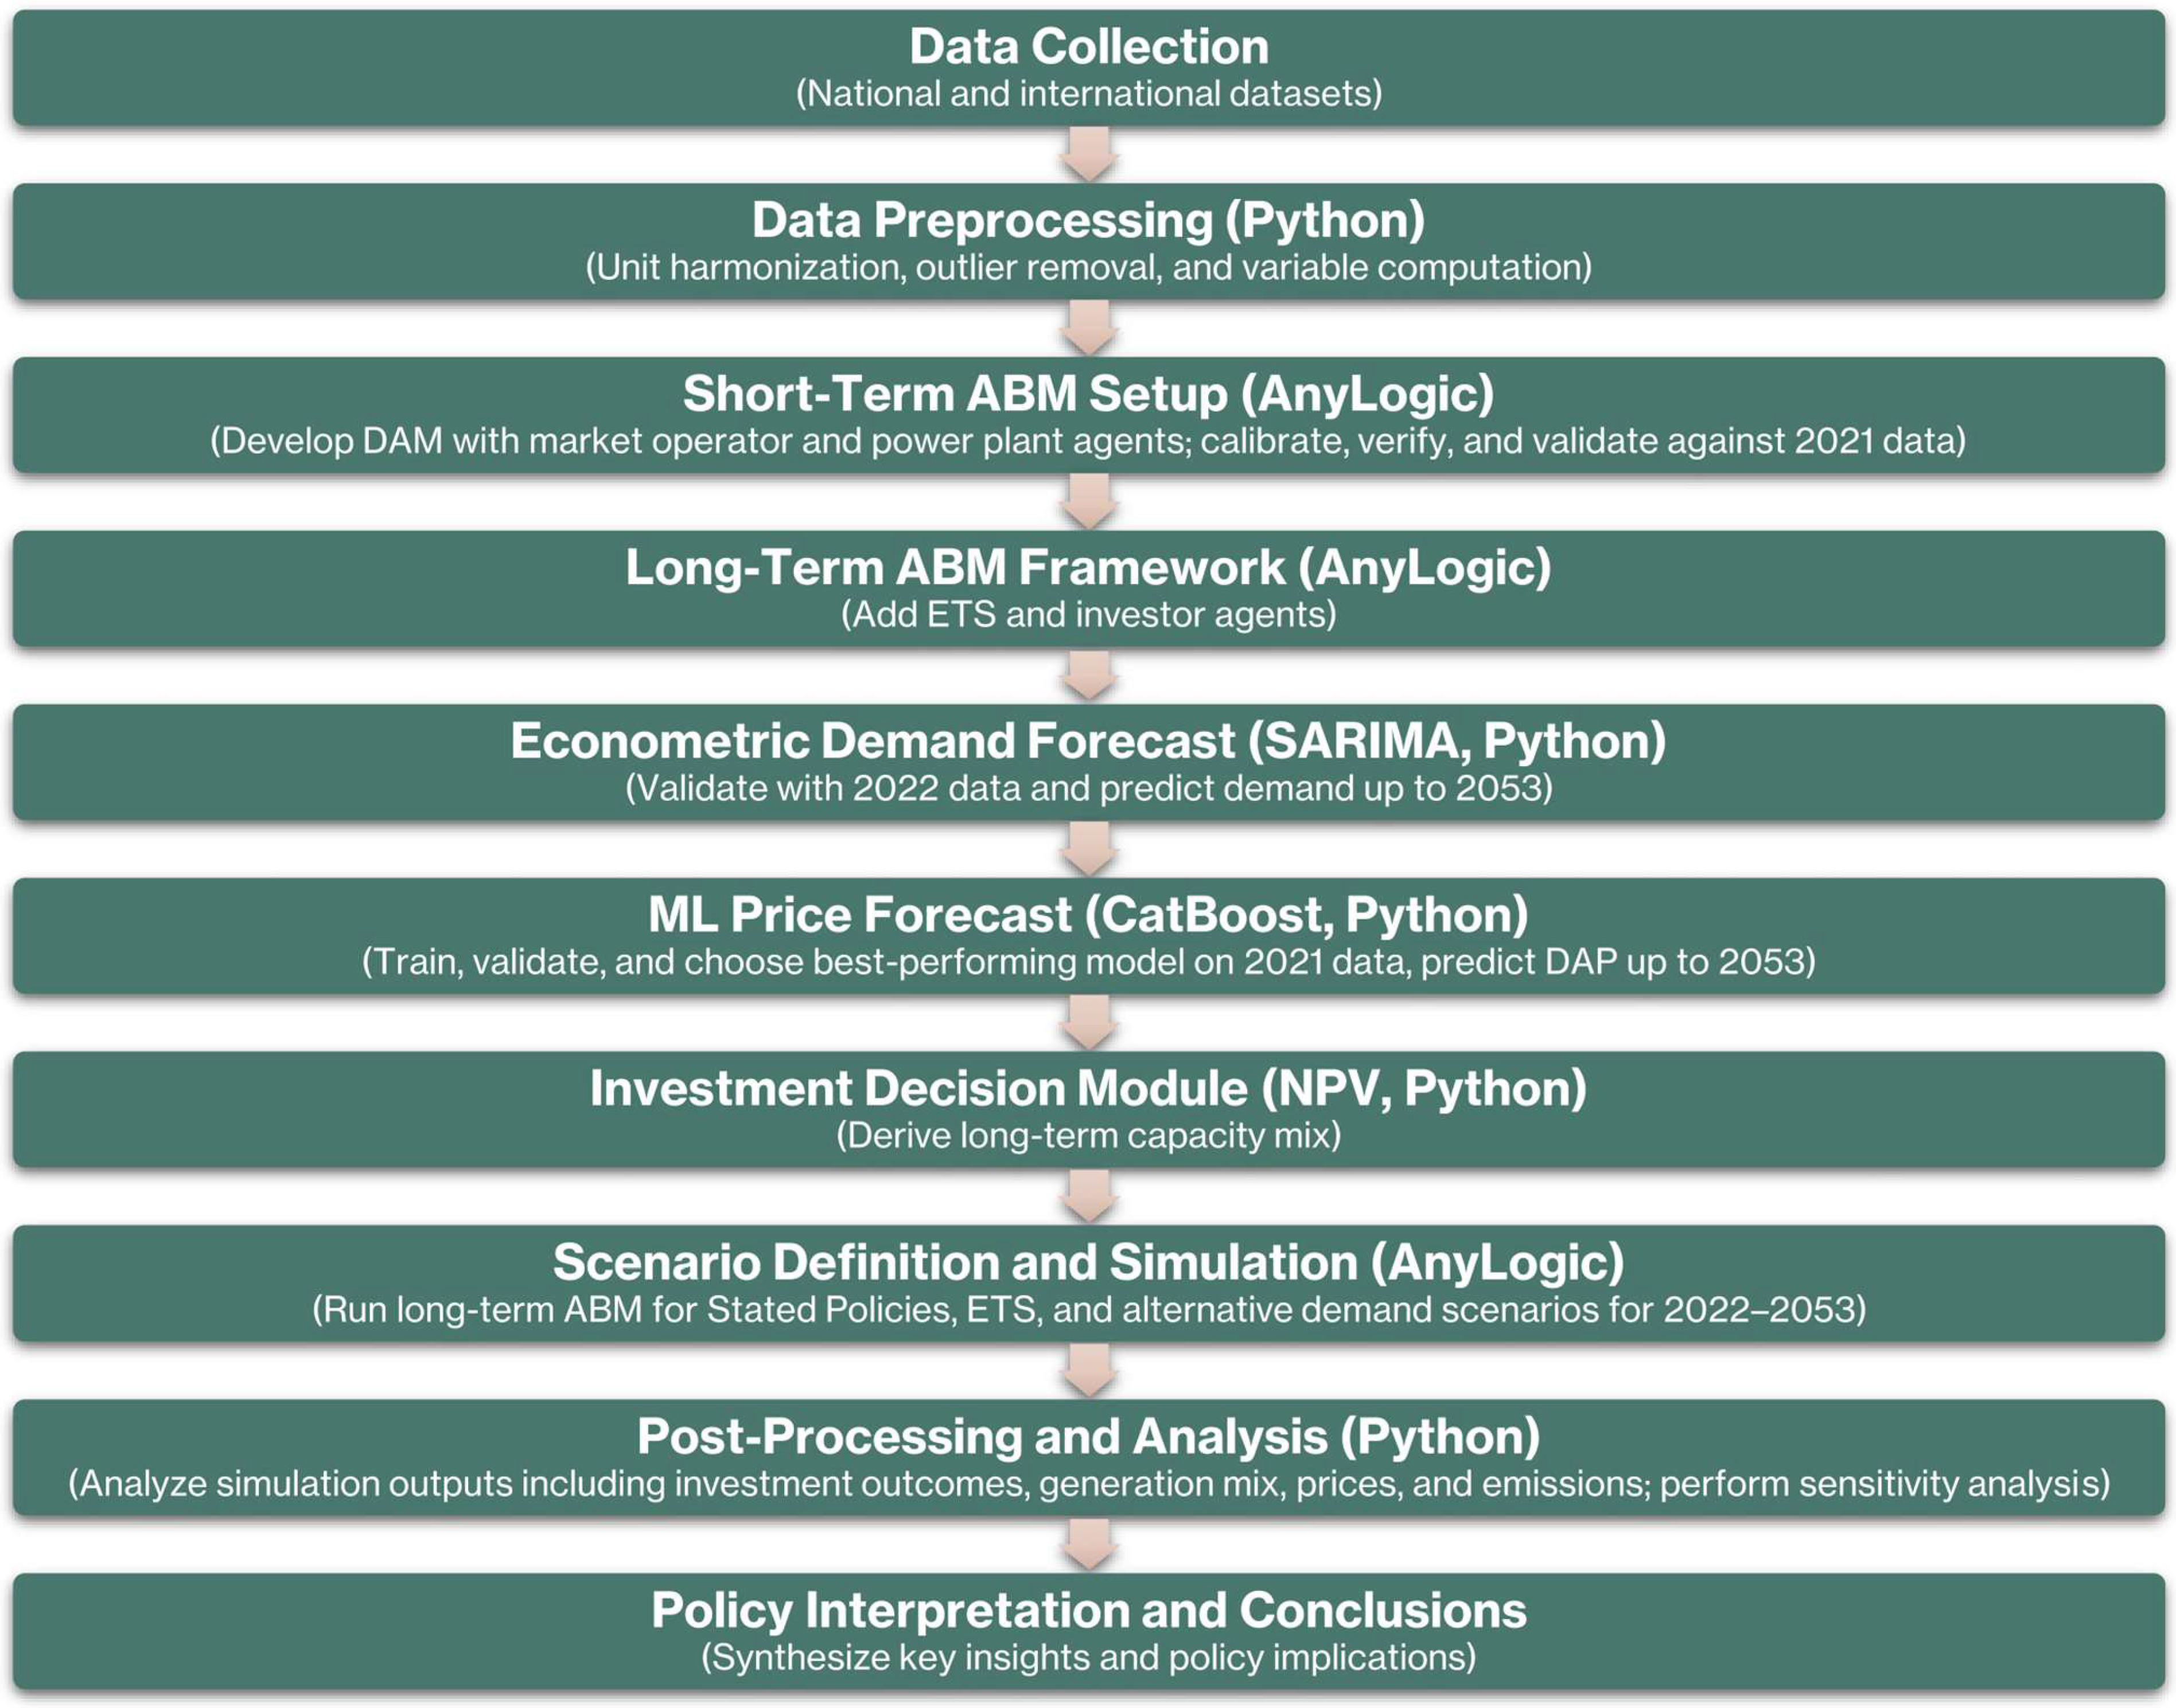
The overall research procedure followed in this study is summarized in Figure 3, which presents the integrated workflow combining econometric, ML, and ABM components. The process begins with data collection from national and international sources, followed by preprocessing and variable computation in Python. A short-term ABM is first developed and validated in AnyLogic to ensure model accuracy before extending it into a long-term ABM that incorporates nuclear generation, an ETS module, and investor decision-making based on NPV analysis. Electricity demand is forecasted using an econometric SARIMA model, while multiple ML models are trained to predict DAP, with CatBoost achieving the best performance. Scenario-based simulations are then conducted for the period 2022–2053 under varying policy and demand assumptions. Finally, post-processing and sensitivity analyses are performed in Python to evaluate prices, generation mix, emissions, and investment outcomes, leading to policy interpretation and conclusions.

2.2. Econometric Demand Forecasting Model

Long-term electricity demand was modeled econometrically, as time-series models generally outperform alternatives for electricity demand forecasting [46]. Accordingly, consistent with [47] and given the role of seasonality, this study adopted the seasonal [48]. After selecting an appropriate specification, the model forecasts future values as a linear function of past observations and a random error term. In SARIMA p , d , q × P , D , Q S , p   is the autoregressive order, d the differencing order, q the moving-average order, and P , D , Q are their seasonal counterparts [49]. S = 12 denotes the annual seasonal cycle in the monthly electricity demand data. This value was selected because electricity consumption in Türkiye exhibits strong annual seasonality, with demand patterns repeating every 12 months due to climatic and economic cycles. The complete list of symbols and parameters used in all mathematical formulas is summarized in Table A1 (Appendix A).
Monthly gross electricity consumption data for 1975–2021 were used to build the time series. Because stationarity (i.e., constant mean and variance over time) is a prerequisite for reliable econometric forecasting, we tested it using unit-root tests, namely the Augmented Dickey–Fuller (ADF) and Phillips–Perron (PP) tests. The initial ADF p -value was 0.99, indicating non-stationarity, which was expected for inherently seasonal demand. We applied a natural log transformation, after which the ADF p -value became 0.13. We then differenced the logged series with a 12-month seasonal period; the ADF p -value fell to 0, and the ADF statistic was –4.67, confirming stationarity at the 1% level (Table 2). As a robustness check, we also applied the PP test, which indicated stationarity (PP statistic –11.7, p -value~0). To assess multicollinearity, we computed the Variance Inflation Factor; values were below 10, indicating no serious multicollinearity.
We further examined distributional properties. High kurtosis (7.843) suggested heavy tails. Taking the log of first differences improved normality:
  • Skewness: –0.179;
  • Kurtosis: 2.954;
  • Jarque–Bera: 3.123; p-value = 0.209.
Given the monthly frequency and sample size, this proximity to normality was sufficient. The ADF statistic (–4.36) and PP statistic (–53.30), both with p -value~0 confirmed suitability for modeling. The 2022 forecast yielded a monthly mean absolute percentage error (MAPE) of 3.5% and the annual total differed by 1.9% compared to historical (actual) demand data from 2022. After validation, the model was run monthly for the 2022–2053 period (Figure 4). Hourly demand was then obtained by allocating monthly forecasts using the observed 2021 hourly shape.

2.3. ML-Based Day-Ahead Price Forecasting Model

An ML-based approach is applied for DAM electricity price forecasting, as it can capture potential mark-ups or strategic bidding behavior that may arise under tight supply conditions. The input data used in the model consist of hourly natural gas fuel cost ( G a s C o s t ), coal fuel cost ( C o a l C o s t ), and residual demand ( R e s D e m ) for the 2017–2020 period. Residual demand is defined as total demand ( T o t D e m ), forecasted using the SARIMA model, minus demand met by price-independent resources ( I n d D e m ), such as renewable and NPPs (Equation (1)). The output variable is DAP.
R e s D e m = T o t D e m I n d D e m ,
Outliers were removed from the training set using the interquartile range (IQR × 1.5) method, which reduced the dataset from 35,064 to 34,987 observations. For validation, 20% of the training data were randomly selected, and the 2021 data were used for testing. Correlation analysis showed that some feature–target correlations exceeded 0.6, particularly between G a s C o s t and D A P . To mitigate bias, a transformed dependent variable ( D A P F a c ) was defined (Equation (2)). The ML model was constructed using C o a l C o s t and R e s D e m as inputs, with D A P F a c as the output. All input variables were scaled to the [−1, 1] range using min–max scaling.
D A P F a c = D A P G a s C o s t ,
CatBoost, XGBoost, and Random Forest models were trained on historical data for the 2017–2020 period, with their hyperparameters optimized through grid-search cross-validation. Each trained model was then evaluated on the 2021 historical dataset, and the test results were compared. As summarized in Table 3, CatBoost achieved the best overall performance during the test period, recording the lowest monthly mean absolute percentage error (MAPE, 6.09%) and annual average error (−1.94%). In comparison, XGBoost yielded 6.60% MAPE and −4.32% average error, while Random Forest produced 6.49% MAPE and −5.58% average error. Thus, CatBoost outperformed XGBoost and Random Forest across both indicators. This superiority is consistent with CatBoost’s ordered (unbiased) gradient-boosting design [50].
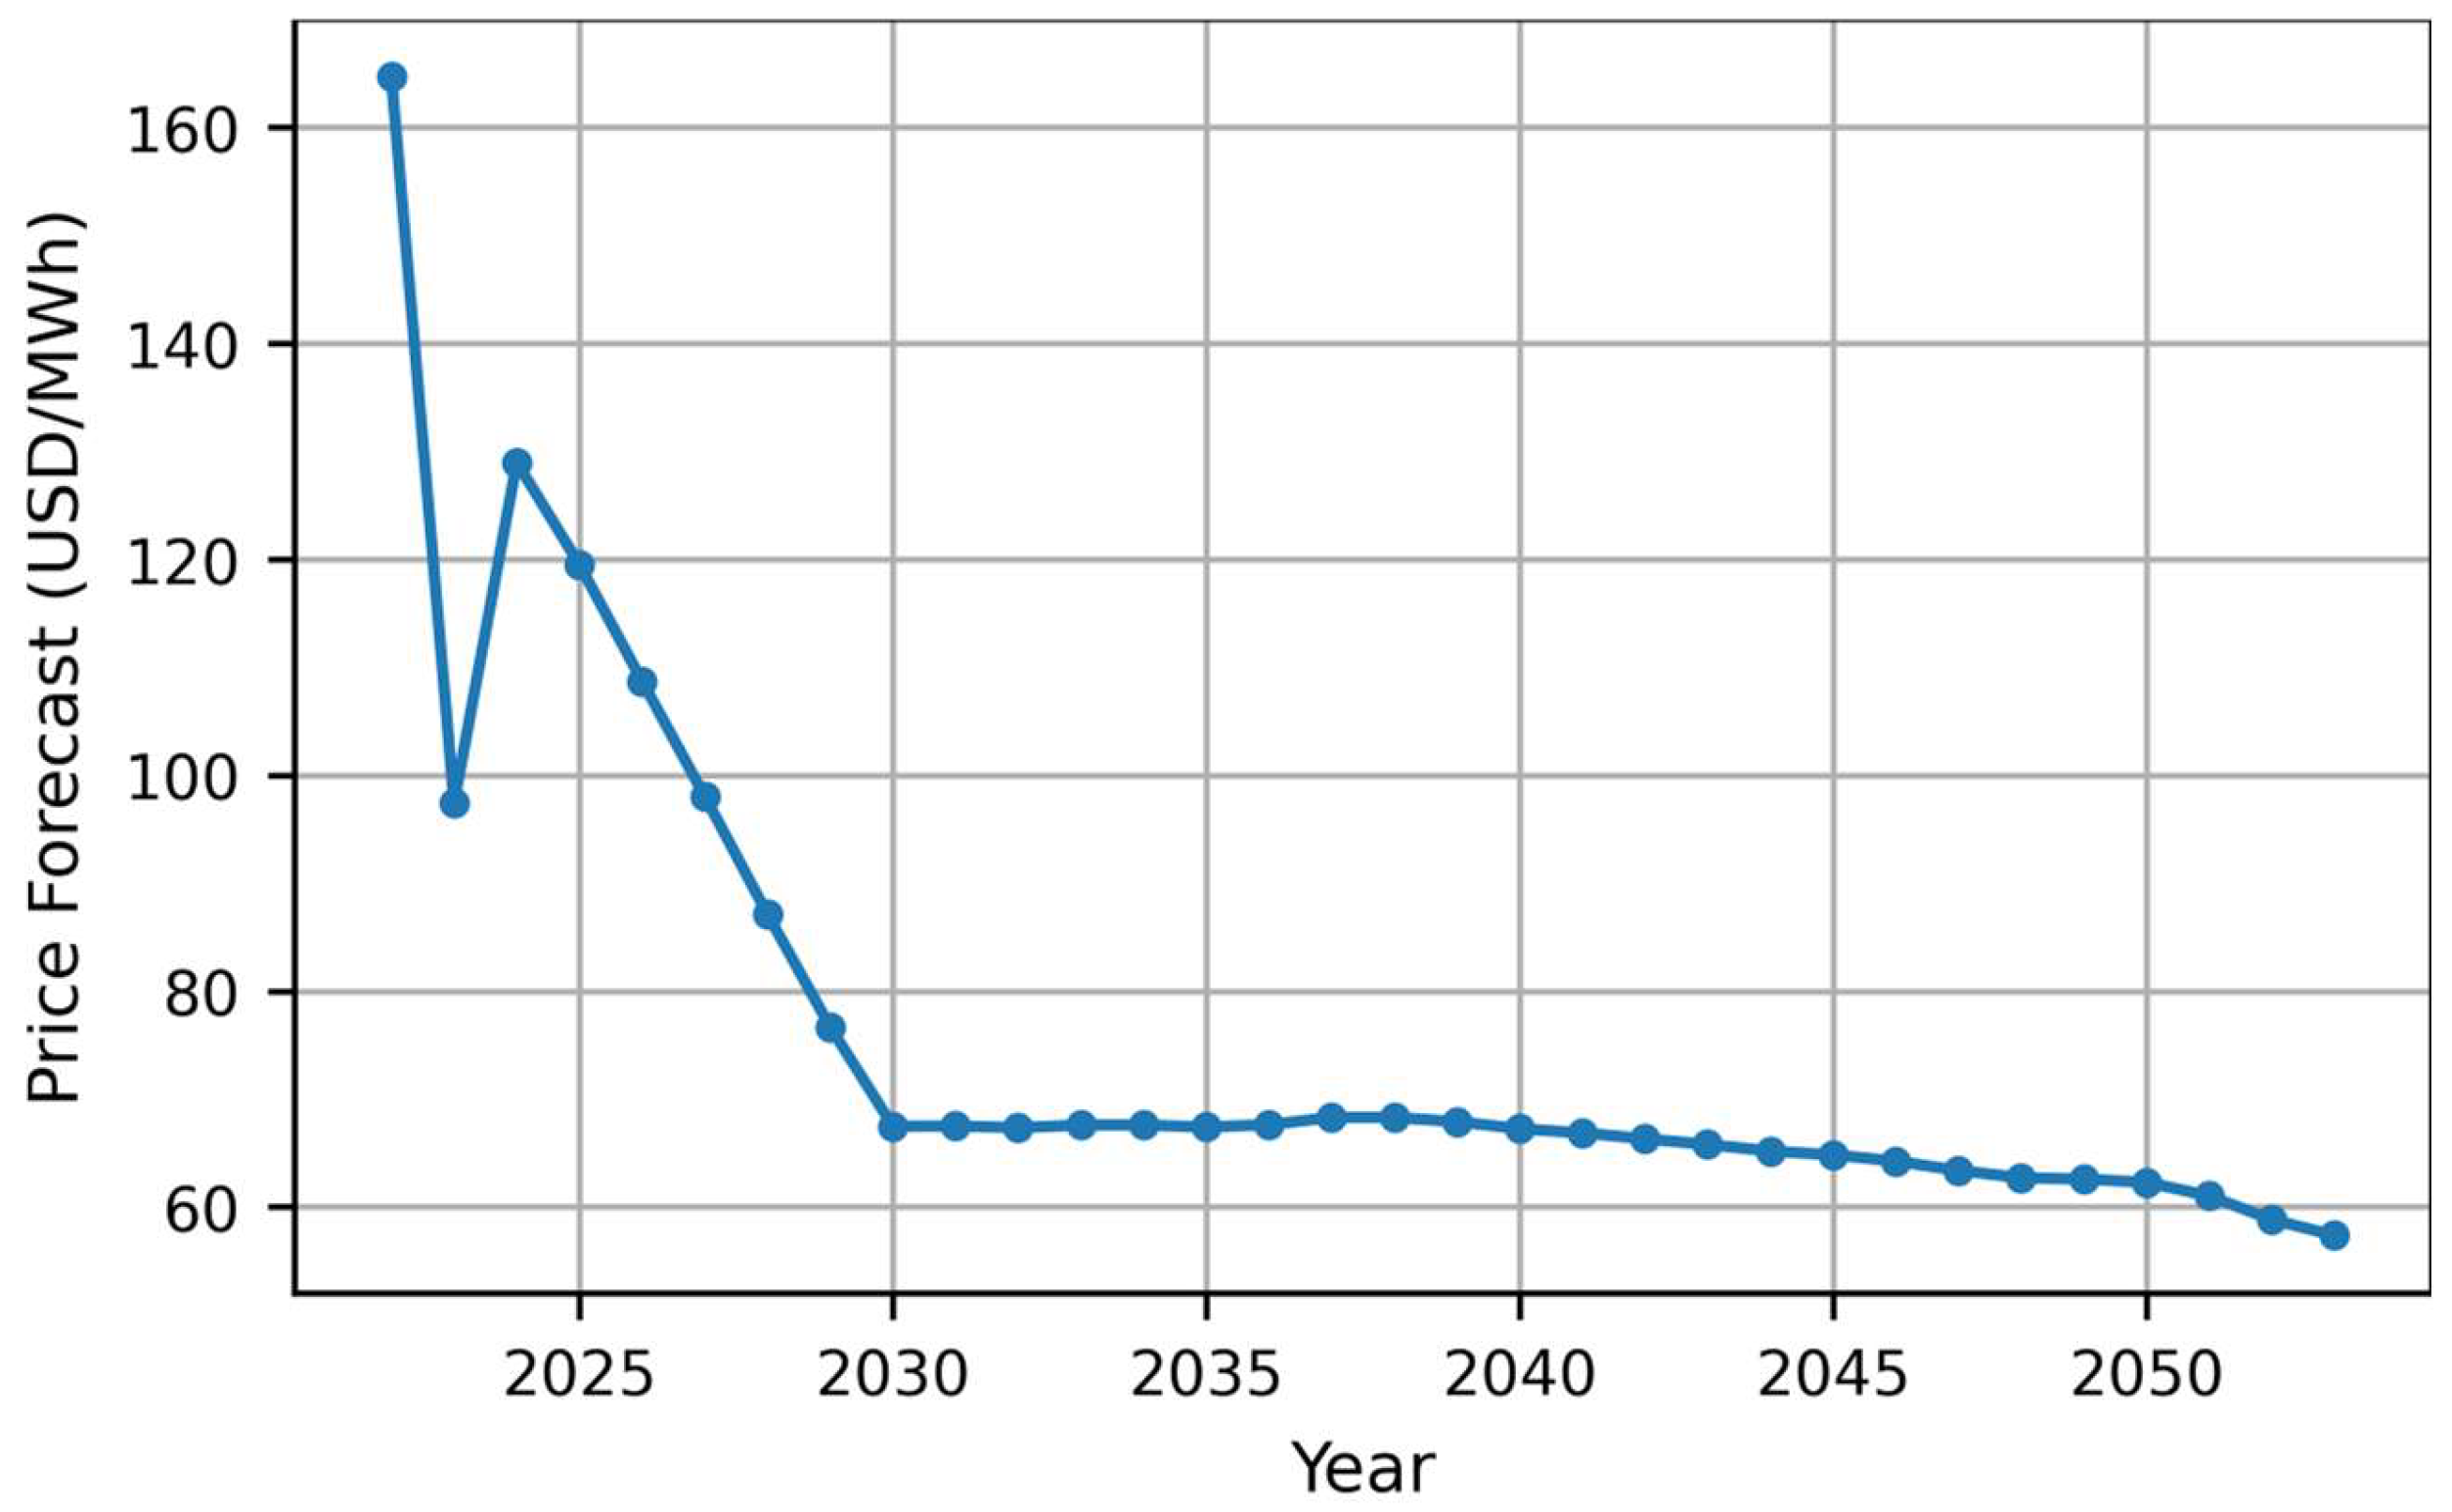
Using long-term capacity mix and fuel prices, the investor projects hourly DAP with the CatBoost model for 2022–2053, which serves as a reference for investment decisions (Table 4). Figure 5 illustrates the yearly average of the predicted prices. All monetary values are expressed in constant 2022 United States dollars (USD_2022) to eliminate the effect of inflation. For brevity, USD_2022 is hereafter denoted simply as USD throughout the paper.

3. Models and the Framework

3.1. Agent Modeling

The key agents and their modeling assumptions are summarized below.
Market Operator Agent: The operator manages the DAM by clearing 24-h bids and calculating hourly market prices. Prices are determined according to DAM rules and the merit-order principle, with the results of accepted bids reported to each generator.
Nuclear Power Plant Agent: Nuclear plants are modeled as baseload units operating at full capacity every hour, regardless of market prices. Their installed capacity is provided as input according to commissioning schedules.
Renewable and Domestic Coal Agents: For renewable technologies, capacity factors (CapacityFactors) are computed for each hour of the day and month using historical data on installed capacity (InstalledCapacity) and actual generation (ActualGeneration) (Equation (3)). Domestic coal plants are modeled analogously, as they benefit from state incentives and sell power via power purchasing agreements rather than marginal cost bidding. The calculated capacity factors, together with projected future installed capacities, are then used to estimate future hourly generation.
C a p a c i t y F a c t o r = A c t u a l G e n e r a t i o n I n s t a l l e d C a p a c i t y × O p e r a t i n g H o u r s ,
Natural Gas and Imported Coal Agents: Every day, the plant agents submit their bids for 24 h of the next day to the market operator. These bids are expressed as price–quantity pairs, with the bid quantities equal to the full installed capacity of each plant. The bid prices correspond to the marginal fuel cost ( M F C ) of the plants, which are primarily driven by fuel costs:
M F C = U n i t   F u e l   C o s t T h e r m a l   E f f i c i e n c y   ,
The installed capacity of each plant is defined as its maximum historically observed hourly electricity output. For natural gas plants, thermal efficiencies are taken directly as input parameters, with cogeneration plants being the exception. In the case of cogeneration, efficiency is presented by the maximum monthly economic efficiency ratio observed in the past (Equation (5)). This formulation captures the dependence of cogeneration output on steam demand at associated facilities rather than purely technological performance. Consequently, cogeneration plants are assumed to operate with lower marginal costs than other natural gas-fueled power plants.
M o n t h l y   E c o n o m i c   E f f i c i e n c y = A v g   G a s C o s t A v g   D A P ,
Investor Agent: Investors decide on new capacity additions and plant retirements. Decisions are based on long-term price forecasts, investment returns, and plant lifetimes.

3.2. Day-Ahead Market Modeling

The price of Turkish DAM is determined daily via a merit-order mechanism, with marginal plants—primarily natural gas and imported coal—setting the price. In the merit-order process, bids with the lowest prices are accepted first. Hourly bids from N power plants are sorted in ascending order of price ( p i ) and their corresponding production capacities ( q i ) :
p 1   p 2   p N   ,   q 1 , q 2 , , q N ,
The bids are accepted sequentially until the hourly demand is met, with the corresponding generation capacities accumulated. Cumulative generation ( G j ) is calculated iteratively until hourly demand ( D e m ) is met:
G j = i = 1 j q i ,   j = 1,2 , , N ,
The marginal plant ( j * ) is defined as the smallest j for which,
G j * D e m ,
and the D A P is set as:
D A P = p j *   ,
Plants bidding below the DAM price perform production at the offered capacity, while those bidding above produce zero. The marginal plant adjusts to meet residual demand. Moreover, a price cap ( P c a p ) is also applied and given the model as input:
D A P = m i n D A P , P c a p ,
The short-term ABM, including the DAM module, was calibrated and validated using a combination of historical (actual) data from 2019–2020 and 2021. Technical parameters of generation agents—such as available capacities and technology-specific thermal efficiencies—were derived from power plant-level records from 2019 to 2020 to reflect representative operating conditions prior to major market and fuel-price shifts. Using these fixed parameters, the model was then behaviorally calibrated on 2021 hourly data so that the simulated dispatch reproduced observed merit-order behavior and day-ahead price formation. The resulting configuration was verified and validated against 2021 historical (actual) DAP and generation volumes to assess model accuracy. The ABM reproduced monthly DAP with an average error of 0.49% and a MAPE of 4.01%, closely matching observed market outcomes. Calibrated components include (i) plant available capacity, (ii) technology-specific thermal efficiencies, (iii) the merit-order clearing algorithm of the DAM, and (iv) generator bidding at the marginal fuel cost (MFC) as defined in Equation (4), reflecting observed price setting by marginal gas and coal units. Verification confirmed that each plant agent produced consistent outputs and that simulated generation by technology aligned with historical data from 2021 (Table 5). It should be noted that short-term modeling was not applied for solar power due to the limited deployment of licensed solar capacity; instead, actual generation figures were used directly.
Price elasticity of electricity demand is not modeled explicitly in the short-term ABM. Demand is treated as exogenous and fixed to 2021 actual hourly values. In the long-term ABM, the SARIMA forecast provides the exogenous demand input, capturing historical macroeconomic and seasonal drivers. The SARIMA model was validated on actual data from 2022 before its application. This design choice avoids double-counting price feedback between SARIMA and the ABM and is consistent with the study’s primary focus on supply-side dispatch, policy scenarios, and investment responses.

3.3. Emissions Trading Modeling

A draft regulation for the establishment of a Turkish ETS was published on 13 November 2023, but has not come into force. Its provisions are closely aligned with those of the EU ETS, particularly regarding the allocation of emission allowances through both free allocation and auctions [30]. The draft envisions a primary market, where allowances are auctioned annually, and a secondary market, where continuous trading occurs through spot transactions or bilateral contracts. Since allocation amounts, demand levels, and reference prices remain undefined, allowance prices in this study are assumed to follow EU ETS prices. The start of the Turkish ETS is assumed to coincide with the launch of the EU’s Carbon Border Adjustment Mechanism (CBAM) in 2026.
For modeling purposes, the implications of the proposed Turkish ETS are translated into carbon cost additions to plant-level marginal costs ( M C ), based on forecasted EU ETS prices:
M C = M F C + P C O 2 × E F ,
where E F denotes the emission factor, P C O 2 represents the unit carbon price, and the M F C corresponds to the marginal fuel cost calculated in Equation (4). For Türkiye, emission factors are 0.374 (gas), 0.806 (imported coal), and 1.152 (lignite) tCO2/MWh, taken from the Ministry of Energy and Natural Resources [51]. These values are also closely aligned with EU-average emission intensities reported by Eurostat [52]. Using emission factor ( E F ) values, total C O 2   E m i s s i o n s are calculated as follows:
C O 2   E m i s s i o n s = G e n e r a t i o n   × E F
Emissions costs enter the long-term ABM solely through the marginal cost ( M C ) calculation, as defined in Equation (11). The emission factors ( E F s) are fixed by fuel type (natural gas, imported coal, and lignite), and no endogenous abatement within power plants is modeled. Consequently, emissions reductions in the ETS scenario result from re-dispatch away from carbon-intensive units, rather than from within-plant efficiency improvements. To evaluate the robustness of these assumptions, a sensitivity analysis on emission factors is introduced in Section 4.1 (Stated Policies Scenario), where lower emission factor cases are tested to represent potential efficiency or technology upgrades.

3.4. Proposed Investment Framework

Investor decisions follow the process shown in Figure 6. First, announced licensed projects are commissioned according to their construction periods in Table 6, and plants reaching the end of their lifetimes are retired [53]. For each energy source, future capacity mixes are projected by deriving the average annual new installed capacity during 2020–2023 and adding it to the end-of-2023 installed capacity (Table 7).
Investors may consider technical, economic, environmental, and social factors when making investment decisions [54]. In this study, the primary criterion is economic return, with environmental consideration used as a secondary factor. Accordingly, beyond pre-announced projects, investors are assumed to further invest only in renewable energy resources.
For each year, electricity sales revenues ( R s a l e s ) are calculated as the product of electricity generation and market prices. Unit running costs—including fuel, emission, and O&M costs listed in Table 8—are multiplied by annual production to obtain generation costs ( C g e n ). Net Revenue ( R n e t ) is then calculated as follows:
R n e t   = R s a l e s     C g e n   ,
Investment viability is evaluated using the NPV method:
N P V = t = 0 n R n e t , t 1 + i t ,
where R n e t , t denotes the net revenue in year t , i is the inflation-adjusted real discount rate, and n is the plant project lifetime. A central real discount rate of 6% was adopted, with 4% and 8% used for sensitivity analysis. These values are consistent with the real cost of capital for renewable power generation reported by the International Energy Agency [39]. The results indicate that solar PV and onshore wind investments offer the highest returns among renewables, even under higher discount rate assumptions (Table 9). Note that biofuel is excluded from the investment analysis, as high costs generally restrict it to mandated waste-to-energy (WtE) projects.
Two types of investors are considered: large and small.
  • Large investors: Their budget is defined as the average annual investment costs of all licensed projects commissioned during 2021–2023, representing the recovery period following the COVID-19 downturn. The annual budget is therefore set at USD 1.88 billion. Their commissioning assumptions are summarized in Table 10.
  • Small investors: These investors are assumed to invest exclusively in unlicensed small-scale solar PV projects, mainly due to their lower upfront costs. Historically, almost all solar investments in Türkiye have taken this form, and the trend is expected to continue. The budget of small investors is defined as the average annual investment costs of unlicensed solar projects commissioned during 2021–2023, yielding 1.12 billion USD.
Finally, the Akkuyu NPP, developed by the state, is included exogenously in the model rather than by the investor agents. The plant consists of four units of 1200 MW each, assumed to enter operation sequentially between 2026 and 2029.

4. Results and Discussion

The installed capacities after 2023 are determined after final investment decisions, commissioning, and retirement years of all existing plants and incorporated into the agent-based framework. The framework is run on an hourly basis with multiple scenarios until 2053. Following the preference of investors, most of the installed capacity addition is expected to be 60.4 GW and 24.3 GW for solar PV and wind, respectively (Table 11). The results are presented in the following subsections.

4.1. Stated Policies Scenario

The Stated Policies scenario reflects the current trajectory and legislation adopted by the Turkish state. In this scenario, the Akkuyu NPP, which is currently in the commissioning phase, is included. As nuclear power constitutes a major addition in Türkiye’s generation mix, its commissioning capacity serves as a key parameter in the long-term projections, strongly influencing price formation and emissions outcomes within the Stated Policies scenario. The Stated Policies scenario excludes ETS because it is still pending legislation.
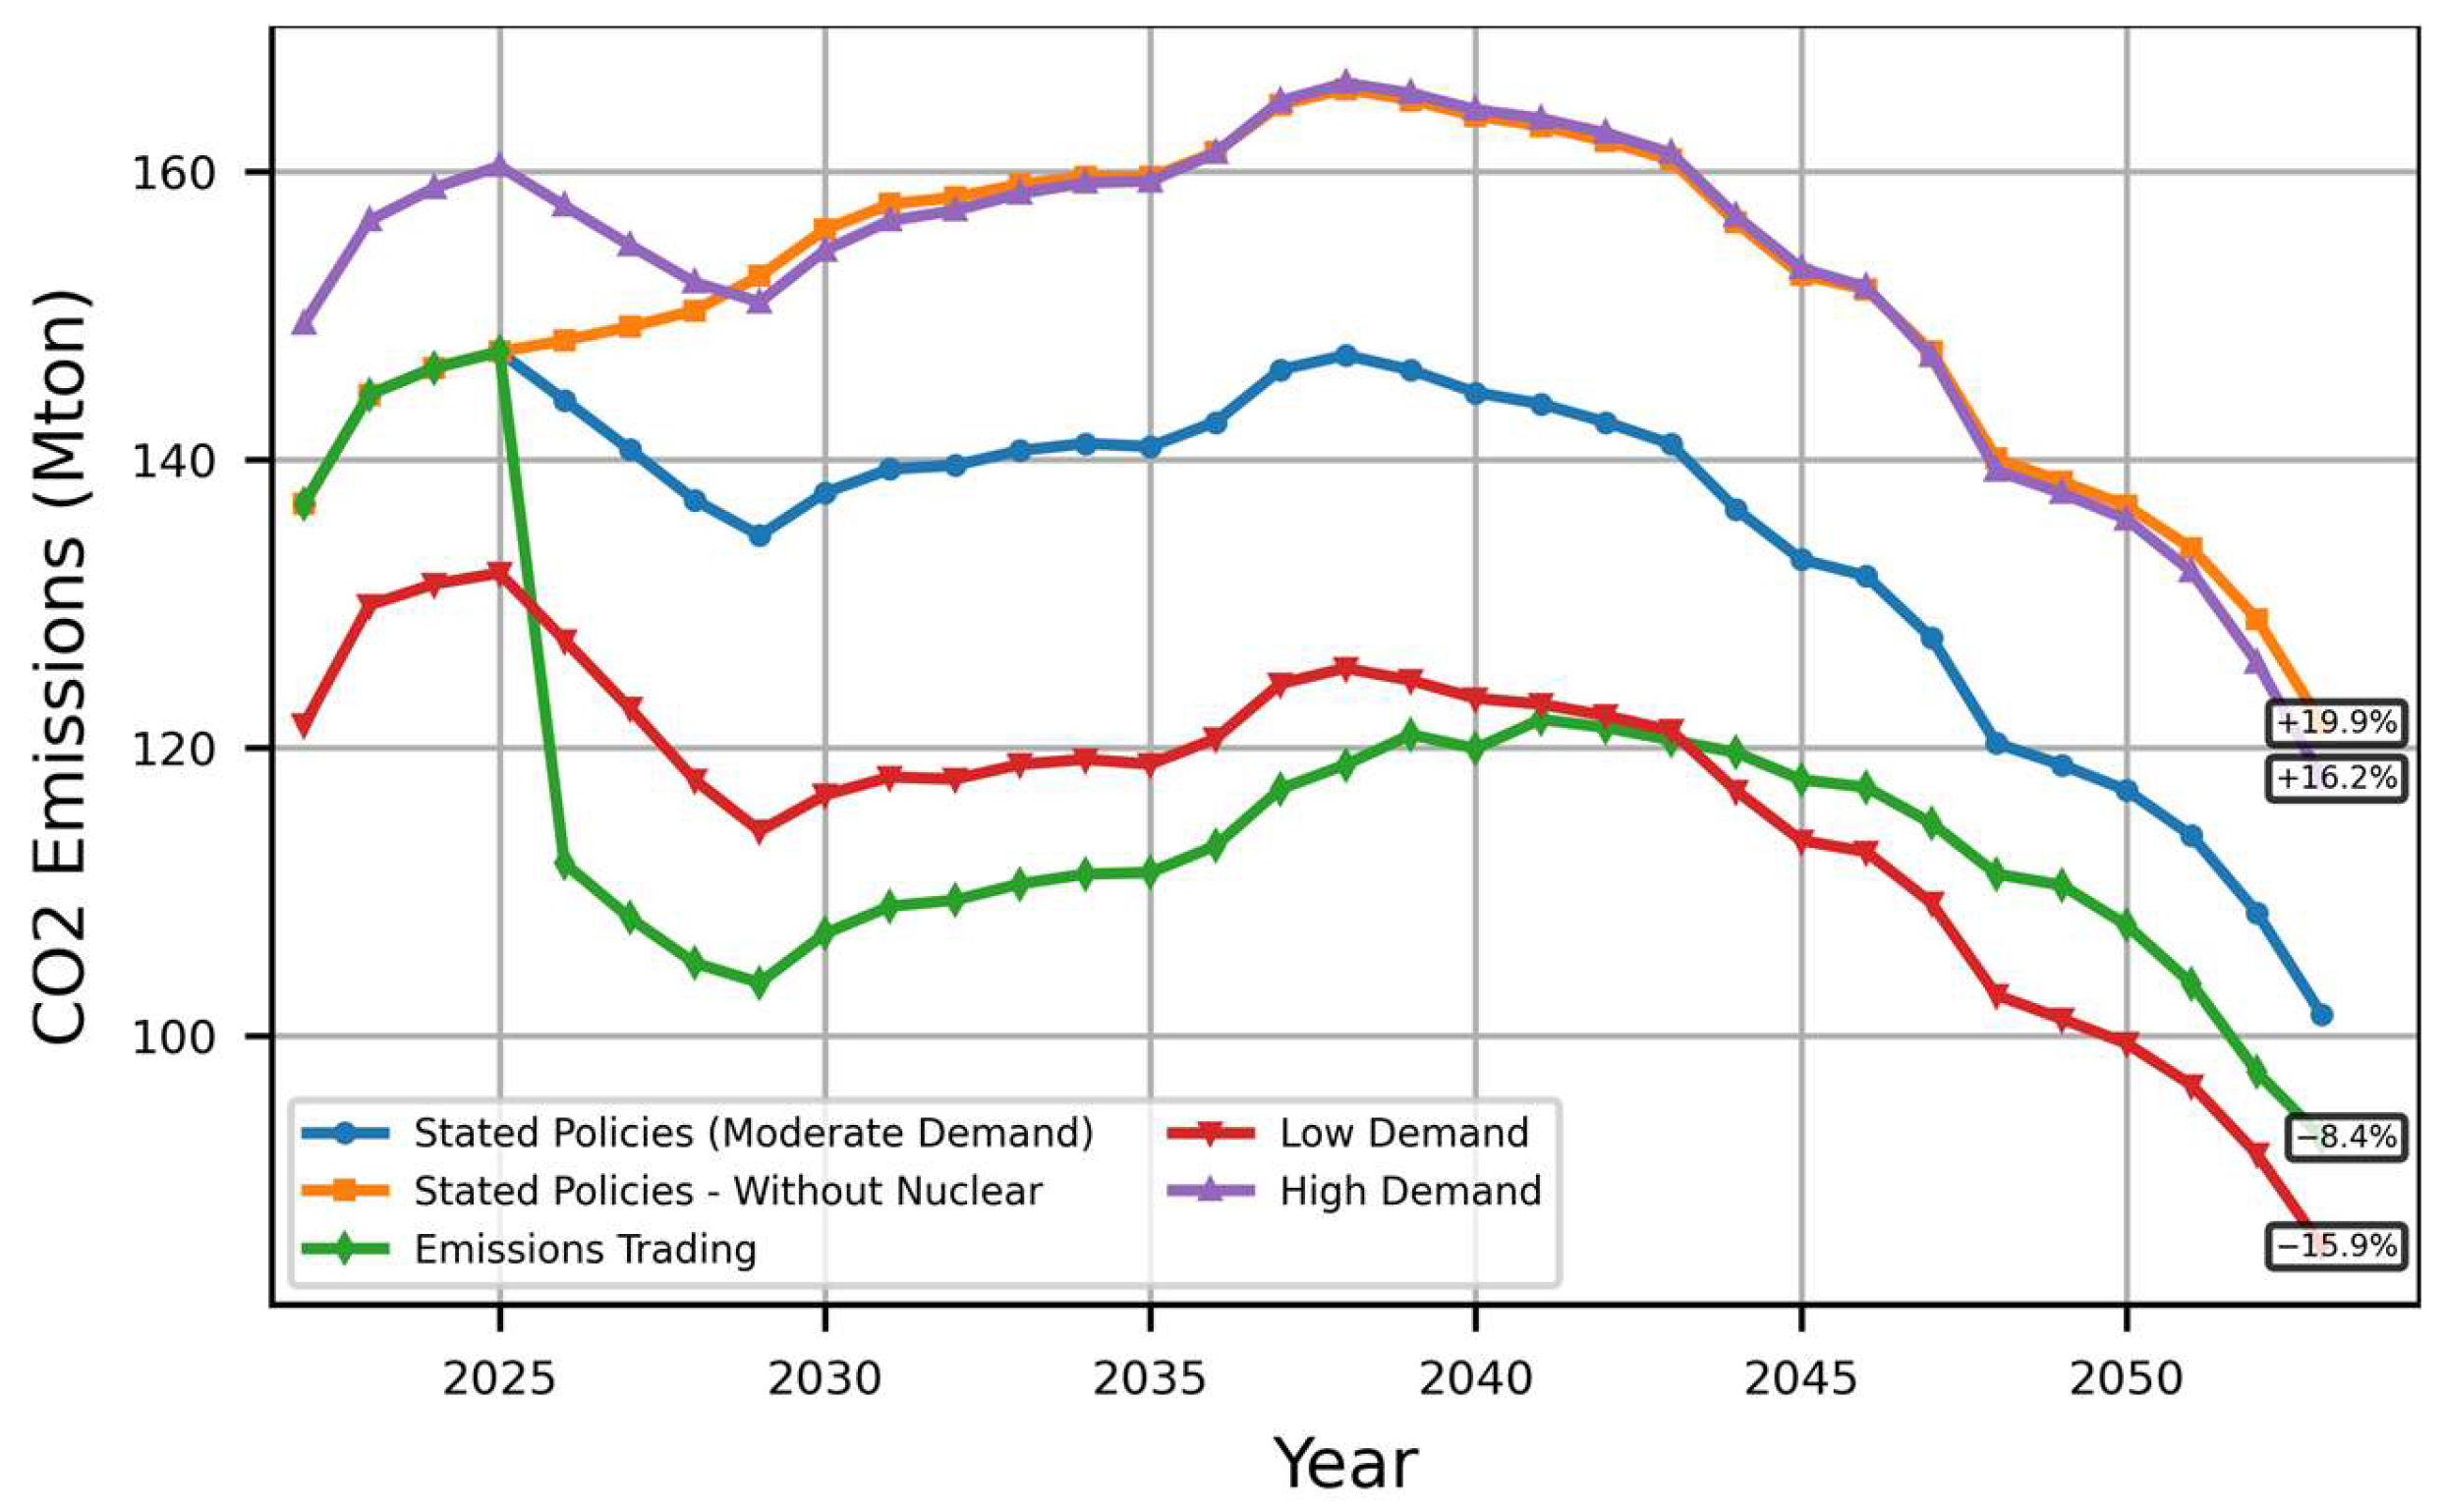
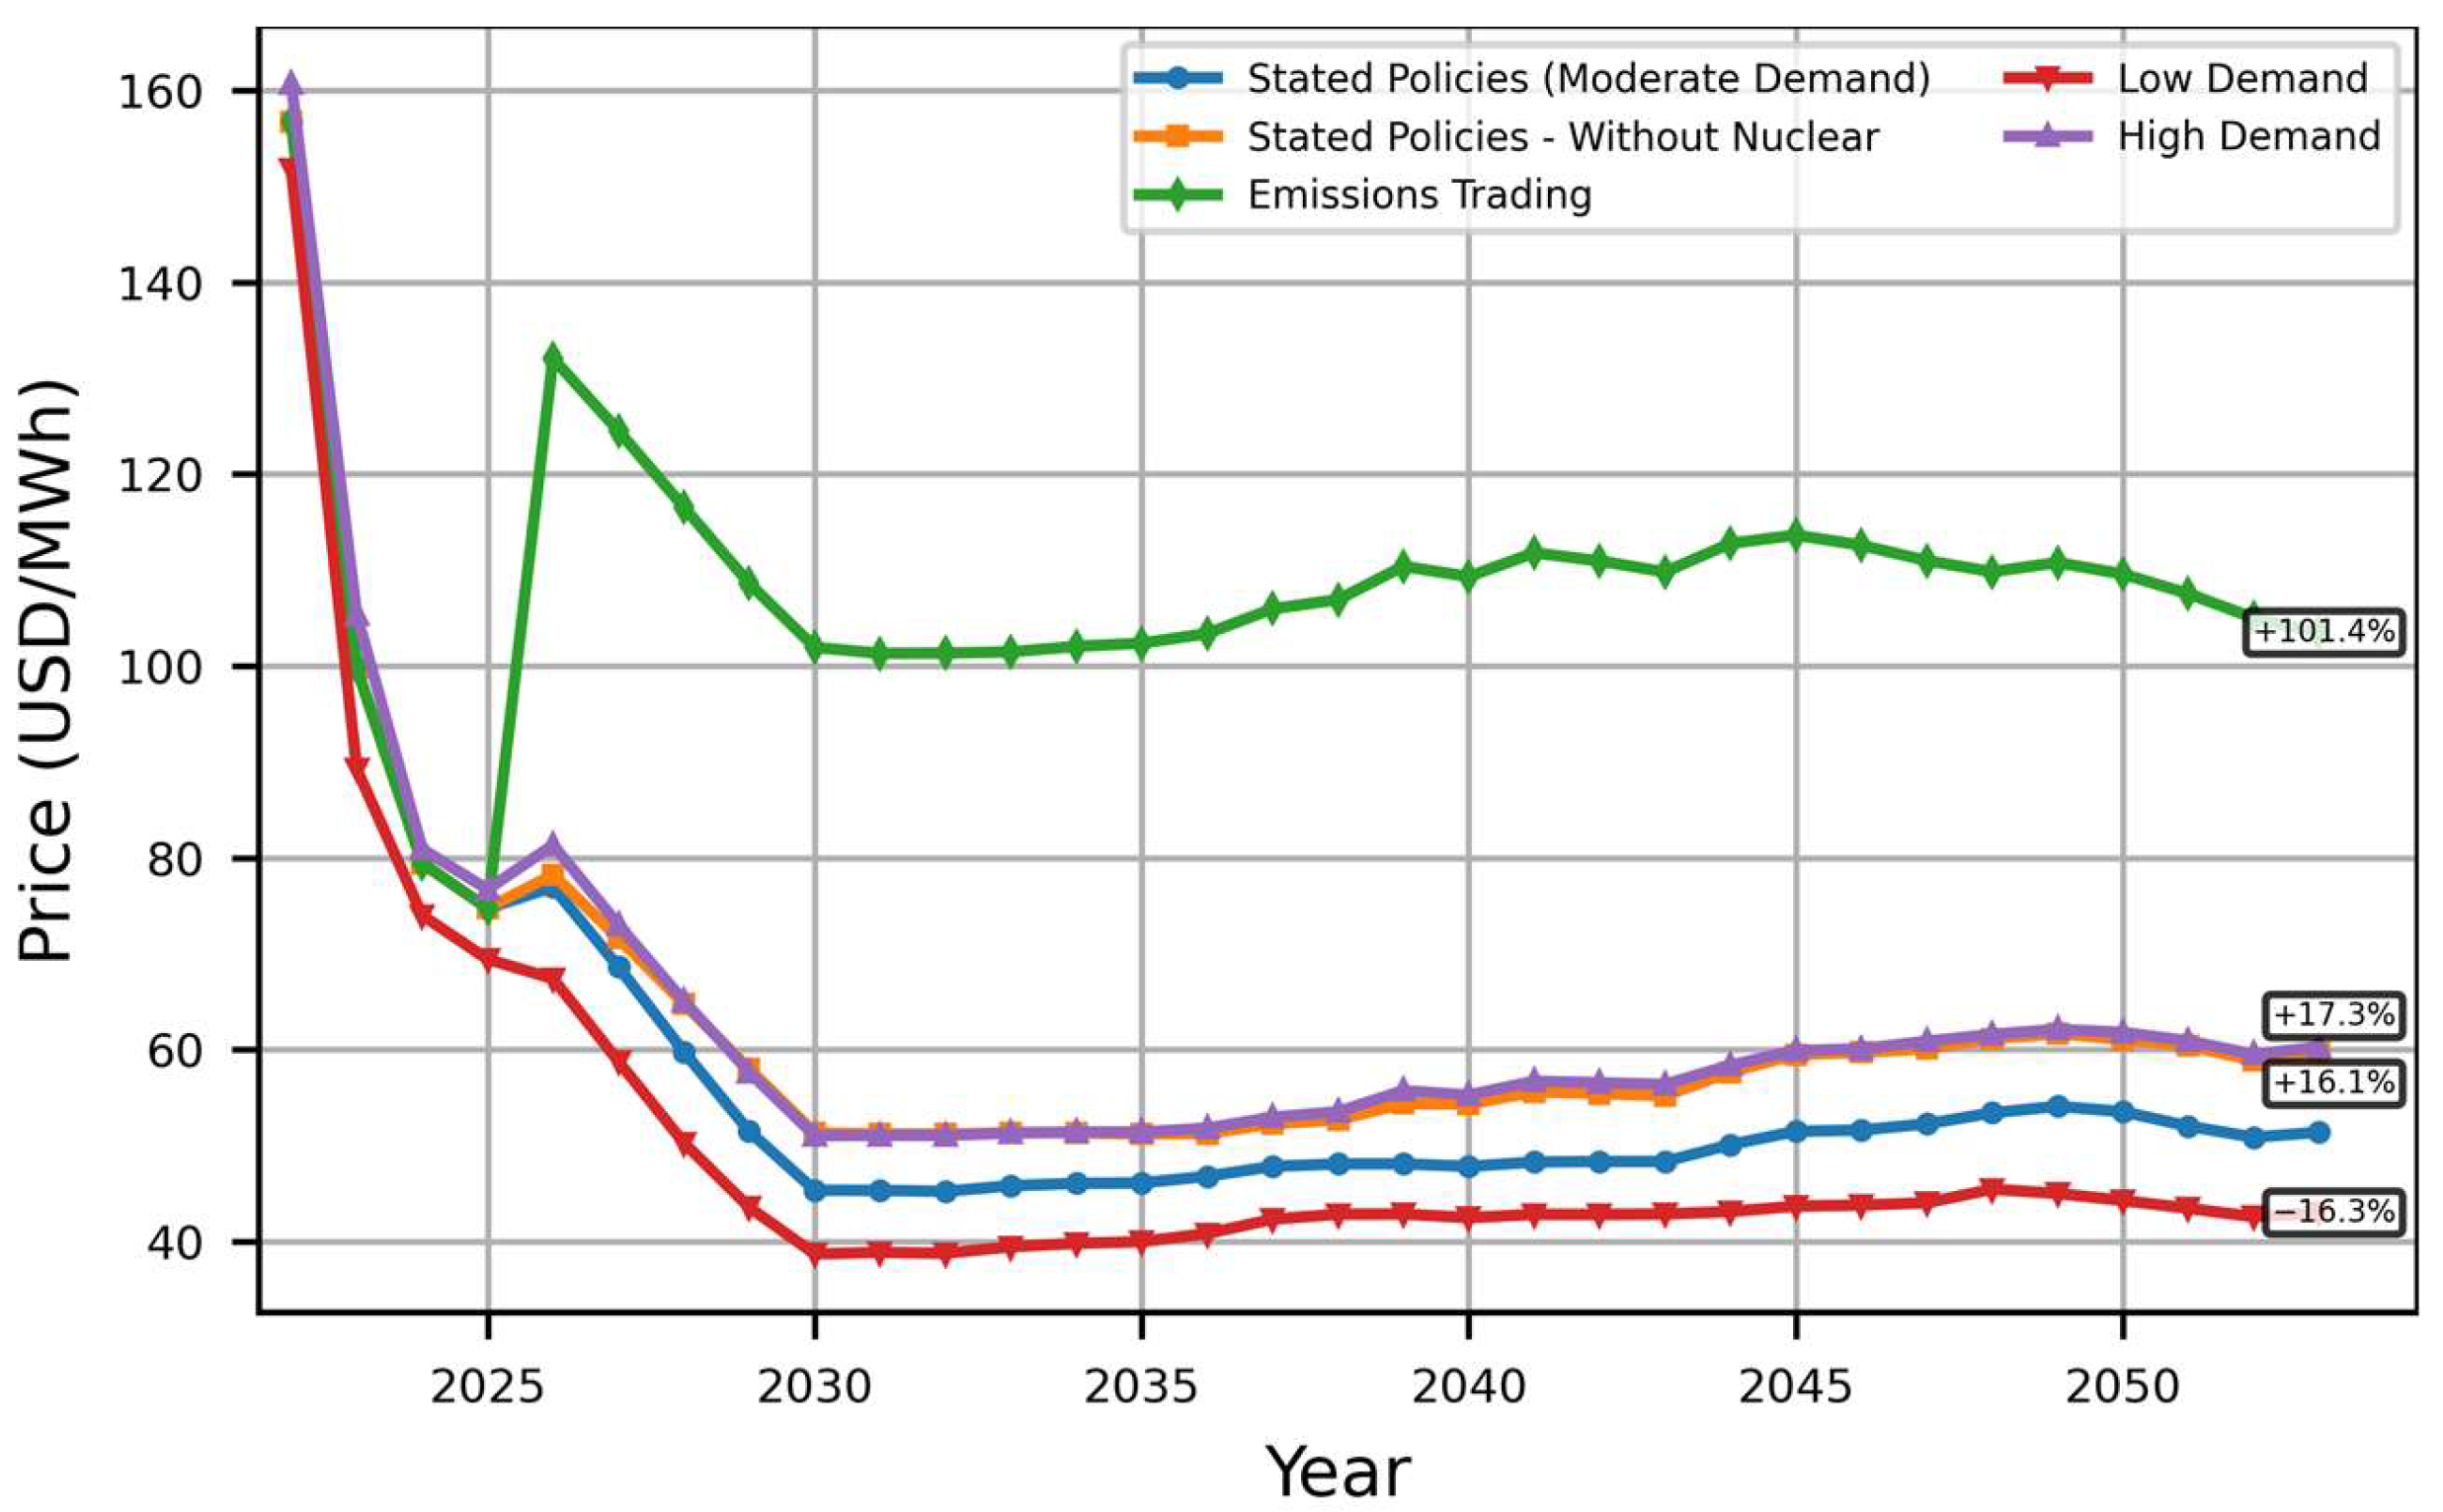
The generation mix that meets the demand forecast in this scenario (Figure 4) is shown in Figure 7a, and the resulting CO2 emissions are reported in Figure 8. Total emissions increase from 2029 onward, driven by the commissioning of new natural gas and lignite power plants up to 2030. Although additional fossil capacity enters the system, the sharp decline in fossil fuel prices (Table 4) causes DAP to fall to 45.33 USD/MWh in 2030. After 2030, all new investments shift toward renewables, with steadily declining installation costs enabling annual onshore wind additions by large investors and solar PV additions by small investors. A turning point is reached in 2038, when renewable expansion reverses the upward emissions trend, peaking at 147.2 million tons (Mt) CO2 before beginning to decline. By 2053, the renewable share of generation rises from 44.0% in 2022 to 63.1%, with wind and solar PV jointly reaching 35.8%. Gross annual emissions fall to 101.4 Mt CO2, a 25.9% reduction from the initial 2022 level, driven primarily by a 45.0% decrease in imported coal plant generation. Natural gas plants, however, remain the largest non-renewable source at 14.8% of generation share in 2053, reflecting their flexibility in balancing intermittent renewable output.
Stated Policies—Without Nuclear represents a counterfactual future in which nuclear power is not included in the generation mix. It examines the impact of a situation where the planned nuclear plant is assumed not to be commissioned. In this case, the lost nuclear generation is partly replaced by higher-cost thermal plants, raising the average price after 2025 by 6.28 USD/MWh (Figure 9). The most significant impact occurs during hours that would otherwise be set by low-cost renewables in the Stated Policies scenario; here, marginal price-setting shifts to thermal plants (Figure 7b), which increases carbon emissions by 20.2 Mt CO2 (+19.9%) in 2053 (Figure 8).

4.2. Emissions Trading Scenario

The Emissions Trading scenario assumes that a national ETS will be implemented during the first month of 2026. In the Emissions Trading scenario, high carbon costs lead to sharp price spikes during peak-demand hours when thermal units set the price. On average, prices rise by 57.91 USD/MWh from 2026 onward (Figure 9). In 2053, emissions trading reduces CO2 output by 8.54 Mt (−8.4%) compared to the baseline, confirming it to be an effective mitigation tool—though less impactful than nuclear deployment.
To examine the robustness of results under potential technological improvements, a sensitivity analysis was conducted on the emission factors used in the Emissions Trading scenario. Two alternative cases were evaluated: a Low Emission Factor (EF) case (−10% from the base factors) representing moderate efficiency gains or partial abatement, and a Very Low EF case (−20%), reflecting substantial emission-intensity reductions (Table 12). The resulting ranges capture plausible near- to long-term efficiency improvements in Türkiye’s generation fleet. Lower EFs reduce effective carbon-cost pass-through, thereby moderating DAP levels. Relative to the base Emissions Trading scenario case, average DAP decreased by 6.02 USD/MWh (5.5%) and 12.13 USD/MWh (11.1%) in the Low and Very Low cases, respectively. The nearly proportional decrease in average DAP across the two cases indicates a linear relationship between emission intensity and carbon-cost pass-through, confirming the consistency of the ETS cost mechanism within the ABM framework. Despite these quantitative differences, the qualitative conclusion remains unchanged: carbon pricing raises average electricity prices, although the magnitude of price impact depends on underlying emission-intensity assumptions.

4.3. Demand Scenarios

Demand variations also have a significant effect on market outcomes. The SARIMA-based forecast used in the Stated Policies scenario is treated as Moderate Demand. Two additional cases are considered:
  • High Demand scenario: Demand is increased by 9.1% relative to Moderate Demand to match the 2022 National Energy Plan forecast of 510.5 TWh by 2035 [29].
  • Low Demand scenario: Demand is reduced by 10% relative to Moderate Demand.
In the High Demand scenario, more generation is supplied from higher-cost thermal plants, raising the average price by 6.46 USD/MWh over the simulation period (Figure 9). By 2053, demand reaches 562 TWh, and the reliance on gas plants suppresses the renewable share to 58.7% (Figure 7d). In contrast, the Low Demand scenario reduces average prices by 7.11 USD/MWh, while cutting gas generation substantially (Figure 7c). Renewables, therefore, increase their share to 68.0% in 2053 when demand falls to 485 TWh. Even in the High Demand scenario, CO2 emissions fall by 21.1% in 2053 compared to the initial simulation year, demonstrating the resilience of the emissions reduction pathway across different demand trajectories (Figure 8).

4.4. Practical Policy Translation

4.4.1. Renewable Integration and Investment

The baseline simulation indicates that, even with steady renewable expansion, existing measures alone will not deliver the 2053 net-zero target in the electricity sector. Residual power-sector emissions from thermal generation persist at 28.9% in 2053 under current commitments, despite large-scale renewable and nuclear deployment. Policymakers should therefore strengthen and extend existing mechanisms rather than relying solely on present measures. Key actions include:
  • Expand renewable-support mechanisms. The duration and scope of existing FITs and YEKA auctions should be extended. Increasing support periods and guaranteed returns will sustain investor confidence, enhance expected returns, reduce policy discontinuity risk, and accelerate new renewable capacity additions.
  • Facilitate affordable financing. Consistent with the assumptions of this study, the current level of renewable investment budgets should be maintained by improving access to affordable capital. Lowering the cost of capital will increase NPV returns and enable investments at the required scale.
  • Modernize the electricity grid. To meet the assumptions of this study, Türkiye must modernize its transmission and distribution infrastructure to enable continuous renewable deployment. This requires expanding network capacity, upgrading digital infrastructure, deploying energy storage at scale, and improving transparency in grid-investment planning to attract private investors. These measures are essential for maintaining system security, affordability, and efficient renewable utilization. Grid-connection procedures for renewable plants should also be simplified and standardized to reduce bureaucratic barriers.
  • Deepen regional energy-market integration. Türkiye’s ties with EU energy markets and carbon policies should be strengthened by expanding cross-border interconnections, thereby enhancing flexibility, energy security, and cost efficiency.
The commissioning of the planned NPP shows a substantial decline in thermal generation and emissions—by 19.9% in 2053—because nuclear energy provides low-carbon baseload capacity. Policymakers should therefore commit to the existing plans and facilitate the safe expansion of nuclear energy. Specific measures include:
  • Ensure timely completion and integration of Akkuyu NPP. Aligned with the study’s stated policies, the on-schedule commissioning and grid integration of the Akkuyu NPP (2026–2029) should be facilitated while maintaining international safety and environmental standards.
  • Plan the next phase of nuclear expansion. There is currently no detailed roadmap for subsequent nuclear projects. Türkiye should therefore prioritize the detailed planning of at least one additional nuclear power plant, ensuring coordination between nuclear and renewable expansion to minimize curtailment and maintain grid stability.

4.4.2. ETS and Emission Abatement

The ETS simulation shows that the introduction of an ETS significantly reduces CO2 emissions—by 8.42% in 2053—by shifting generation toward cleaner energy sources. Policymakers should therefore accelerate ETS implementation and complementary emission reduction measures. Key recommendations include:
  • Launch the ETS by 2026. The Turkish ETS should be implemented in 2026 with transparent and predictable allowance-allocation mechanisms to ensure market credibility and encourage renewable investment.
  • Design a fair and stable carbon-price corridor. Carbon prices should be aligned with the EU ETS trajectory, but maintained within an affordable range to prevent excessive market-price impacts (+57.91 USD/MWh from 2026 onward, according to this study’s results).
  • Mandate emission-intensity improvements in thermal plants. Based on this study’s emission-factor sensitivity analysis, regulatory measures should require thermal power plants to adopt abatement technologies. The main available methods include improving plant efficiency, applying post-combustion carbon capture, and blending fuels with low-carbon or carbon-neutral alternatives.

4.4.3. Demand Growth and Flexibility

The model’s demand-side sensitivity analysis reveals that electricity-demand growth represents a major uncertainty for Türkiye’s clean-energy transition. In the high-demand case (562 TWh by 2053), renewable-capacity expansion struggles to keep pace, reducing the renewable share of generation to 58.7% and increasing reliance on fossil backup, thereby raising emissions. Policymakers should therefore focus not only on renewable deployment but also on managing demand growth. Recommended actions include:
  • Implement energy efficiency obligations effectively. Türkiye’s Energy Efficiency 2030 Strategy and 2nd National Energy Efficiency Action Plan (NEEAP) (2024–2030) targets a 16% reduction in national energy consumption by 2030. The plan mandates energy efficiency obligations across industries, buildings, and equipment, and provides incentives for upgrading to more efficient appliances and processes [55]. Implementation of these targets should be closely monitored by responsible institutions.
  • Promote flexibility and smart-grid infrastructure. Regulators should advance flexibility mechanisms—such as demand–response programs and distributed battery storage—to reduce peak loads and ensure that rising electrification (from electric vehicles and heat pumps) does not outpace renewable supply. This requires mandating the upgrading of distribution networks into smart-grid systems capable of managing flexible demand and integrating distributed resources, as recommended in SHURA’s Transportation Sector Transformation Report (2024) [56].

5. Conclusions

In this study, a long-term ABM simulation of the Turkish energy market was performed to analyze how policy, investment, and demand trajectories will shape the pathway to net-zero emissions by 2053. The framework includes power plants across diverse technologies—wind, hydropower, solar PV, geothermal, biofuel, coal, natural gas, and nuclear—and represents investors, the market operator, the DAM, and a potential ETS. By running hourly simulations from 2022 to 2053 under alternative policy and demand scenarios, the model offers a forward-looking perspective on how Türkiye’s energy sector can evolve during its low-carbon transition.
The ABM simulation results highlight three main insights. First, under the Stated Policies scenario, renewable generation steadily expands to reach 63.1% of total production by 2053, with onshore wind and solar PV jointly accounting for 35.8%, supported by declining technology costs and continued investment. This expansion drives a 45.0% reduction in imported coal plant generation. Natural gas plants, however, retain a 14.8% share in 2053 due to their role in balancing intermittent renewable output. Emissions peak at 147.2 Mt CO2 in 2038, before declining to 101.4 Mt CO2 in 2053, representing a 25.9% reduction from the initial level. Excluding nuclear power increases average wholesale electricity prices by 6.28 USD/MWh over the simulation period and raises 2053 emissions by 20.2 Mt CO2. Second, policy choices significantly influence both prices and emissions. Introducing an ETS results in much sharper price increases—averaging +57.91 USD/MWh—but reduces emissions by 8.54 Mt CO2 in 2053 relative to the baseline. Third, demand scenarios alter the generation mix and fuel reliance. In the High Demand case (+9.1%), additional supply is primarily met by natural gas, raising average prices by 6.46 USD/MWh and limiting the renewable share to 58.7% in 2053. In the Low Demand case (–10%), prices fall by 7.11 USD/MWh, natural gas generation drops substantially, and the renewable share increases to 68.0%. Even under high demand, emissions are reduced by 21.1% by 2053 compared to 2022, confirming that the net-zero pathway is preserved, although the pace and composition of decarbonization differ across scenarios.
These findings provide actionable insights for both policymakers and market participants. For regulators, the results underscore the pivotal role of nuclear capacity and carbon pricing in shaping future prices and emissions, offering a framework to help design ETS rules and broader market policies that balance decarbonization with affordability. For private investors, the scenarios illustrate how renewable deployment, demand evolution, and policy choices influence the generation mix, investment risks, and long-term profitability, thereby supporting more informed investment strategies.
The scenario-based findings can be directly translated into policy pathways for accelerating Türkiye’s transition toward its 2053 net-zero target. Under the Stated Policies framework, achieving deeper decarbonization requires expanding existing renewable support mechanisms (FITs and YEKA), maintaining affordable financing channels, modernizing the electricity grid with digitalized and storage-integrated infrastructure, and deepening regional energy-market integration with the EU. The nuclear policy track must ensure the timely completion of the Akkuyu NPP and initiate the planning of at least one additional plant to secure low-carbon baseload generation. In the Emissions Trading Scenario, early ETS implementation—ideally by 2026—should be combined with a predictable carbon-price corridor and technology mandates that improve thermal plant emissions efficiency. Finally, the Demand Scenarios highlight the need to couple renewable expansion with effective demand management. This entails enforcing the Energy Efficiency 2030 Strategy and 2nd NEEAP targets, promoting demand–response programs and distributed storage, and upgrading distribution networks into smart-grid systems. Collectively, these measures form an integrated policy package that aligns Türkiye’s energy market development with its long-term climate commitments while safeguarding security of supply and investment stability.
Methodologically, this study demonstrates a novel integration of ABM, SARIMA econometric demand forecasting, and CatBoost ML-based price prediction, each validated against historical data. The SARIMA model achieved a monthly MAPE of 3.5% and an annual deviation of 1.9% on realized demand from 2022. The CatBoost model achieved a 6.09% MAPE and −1.94% average error on actual prices from 2021, outperforming the other benchmarked ML models. The ABM reproduced market behavior from 2021 with a 0.49% average price error and 4.01% MAPE. Furthermore, the investment evaluation was refined through NPV analysis using a central real discount rate sensitivity testing. These enhancements collectively improve the transparency, robustness, and empirical credibility of the proposed framework.
Several limitations should be acknowledged. First, the model does not explicitly capture policy uncertainty or the transmission mechanisms between electricity, carbon, and fuel markets, which may influence investment and pricing outcomes. Second, the transition of investor behavior over time is not dynamically represented, as investment decisions are modeled through rational, economically driven assumptions. Third, the analysis assumes that Türkiye’s electricity transmission infrastructure will receive adequate investment to integrate the projected renewable capacity additions. Relaxing these assumptions in future work would allow for a more comprehensive representation of long-term market dynamics. Fourth, demand-side behavioral responses are not endogenously represented, as price elasticity was excluded to prevent double-counting with the SARIMA forecast. Incorporating explicit demand–response behavior in future work could further enhance the realism of short-term market dynamics. Fifth, because high-resolution historical data remain limited, both the calibration and validation of the ABM were performed using observations from 2021. This represents an in-sample validation demonstrating that the model reproduces observed market behavior under current conditions. Future work will extend the calibration–validation process by incorporating additional historical years as they become available, enabling out-of-sample validation and broader robustness testing across different market states.
Future work may extend the framework in several other directions. First, model granularity can be improved by including ancillary markets and BESS dynamics. Second, the ABM framework could be enhanced by incorporating risk-awareness across all agents to better capture their heterogeneity. Third, incorporating local energy markets and their interactions with the national system would allow for a more integrated analysis. Fourth, wholesale and spot natural gas markets could be modeled in greater detail. Finally, generative artificial intelligence could be employed to enrich scenario generation and improve forecasting accuracy.
Author Contributions

Conceptualization, B.G. and G.K.; methodology, B.G. and G.K.; software, B.G.; validation, B.G. and G.K.; formal analysis, B.G.; investigation, B.G.; resources, B.G.; data curation, B.G.; writing—original draft preparation, B.G.; writing—review and editing, B.G. and G.K.; visualization, B.G.; supervision, G.K. All authors have read and agreed to the published version of the manuscript.

Funding

This research received no external funding.

Data Availability Statement

Most of the data used in this study are publicly accessible, with corresponding references provided in Table 4. The authors’ own data are not publicly available but can be obtained from the corresponding author upon reasonable request.

Acknowledgments

This work has been derived from the first author’s doctoral thesis. The first author expresses gratitude for the support received through the YOK 100/2000 scholarship during his Ph.D. studies. Note that this scholarship did not contribute to the funding of this article. During the preparation of this manuscript, the authors used ChatGPT 5 by OpenAI and the professional English language editing service of MDPI Author Services for grammar and language refinement. The authors have reviewed and edited the output and take full responsibility for the content of this publication.

Conflicts of Interest

The authors declare no conflicts of interest.

Abbreviations

The following abbreviations are used in this manuscript:
ABMAgent-based modeling
ADFAugmented Dickey–Fuller
BESSBattery energy storage system
CO2Carbon dioxide
DAMDay-ahead market
DAPDay-ahead price
EFEmission factor
ETSEmissions trading scheme
EXISTEnergy Exchange Istanbul
EUEuropean Union
FITFeed-in tariff
GWGigawatt
IQRInterquartile range
MAPEMean absolute percentage error
MLMachine learning
MtMillion tons
MWMegawatt
MWhMegawatt-hour
MUSDMillion United States dollars
NEEAPNational Energy Efficiency Action Plan
NPVNet present value
NPPNuclear power plant
O&MOperation and maintenance
PPPhillips–Perron
PVPhotovoltaic
SARIMASeasonal autoregressive integrated moving average
TEIASTurkish Electricity Transmission Corporation
TWhTerawatt-hour
USDUnited States dollar
WtEWaste-to-energy
YEKARenewable energy resource area

Appendix A

Table A1. Symbols and notations used in the equations.
SymbolDescriptionUnit
p , d , q Orders of autoregressive ( p ), differencing ( d ), and moving-average ( q ) terms
P , D , Q Seasonal p , d , and q
S Seasonal cycle lengthmonths
G a s C o s t Natural gas unit price for plantsUSD/MWh
C o a l C o s t Imported coal unit price for plantsUSD/MWh
R e s D e m Residual demand to be met by price-dependent plantsMWh
T o t D e m Total hourly electricity demandMWh
I n d D e m Demand met by price-independent plantsMWh
D A P Day-ahead priceUSD/MWh
D A P F a c D A P to G a s C o s t ratio
A c t u a l G e n e r a t i o n Realized electricity generation in a given periodMWh
I n s t a l l e d C a p a c i t y Maximum power of the plantMW
O p e r a t i n g H o u r s Number of hours in a given period
C a p a c i t y F a c t o r Hourly utilization factor of the plant, between 0 and 1
U n i t   F u e l   C o s t Fuel cost per unit of thermal inputUSD/MWh
T h e r m a l   E f f i c i e n c y Electrical output per thermal input
M F C Marginal fuel cost of a plant to produce one unit of electricityUSD/MWh
A v g   G a s C o s t Monthly average natural gas unit price for plantsUSD/MWh
A v g   D A P Monthly average D A P USD/MWh
M o n t h l y   E c o n o m i c
E f f i c i e n c y
Ratio of A v g   G a s C o s t to A v g   D A P
N Number of plants participating in the DAM
p i i -th lowest bid price in merit orderUSD/MWh
q i Offered quantity of i -th bidMWh
G j Cumulative accepted quantity after j -th bidMWh
j * Index of marginal plant or price-setting bid
D e m Hourly electricity demand of the DAMMWh
p j * DAP setting bid priceUSD/MWh
P c a p Maximum price allowed to bidUSD/MWh
P C O 2 Unit carbon priceUSD/tCO2
E F Carbon emission amount per unit of electricity generationtCO2/MWh
M C Marginal cost of a plant to produce one unit of electricityUSD/MWh
G e n e r a t i o n Electricity generation by the plantMWh
C O 2   E m i s s i o n s Total carbon dioxide emissionstCO2
R s a l e s Electricity sales revenueUSD
C g e n Total electricity generation cost (fuel, emission, and O&M)USD
R n e t Net revenueUSD
t Time periodyears
R n e t , t Net revenue in year t USD
i Real discount rate (inflation-adjusted)-
n Plant project lifetimeyears

References

  1. Bonabeau, E. Agent-Based Modeling: Methods and Techniques for Simulating Human Systems. Proc. Natl. Acad. Sci. USA 2002, 99, 7280–7287. [Google Scholar] [CrossRef]
  2. Macal, C.M. Everything You Need to Know about Agent-Based Modelling and Simulation. J. Simul. 2016, 10, 144–156. [Google Scholar] [CrossRef]
  3. Sun, Q.; Wang, X.; Liu, Z.; Mirsaeidi, S.; He, J.; Pei, W. Multi-Agent Energy Management Optimization for Integrated Energy Systems under the Energy and Carbon Co-Trading Market. Appl. Energy 2022, 324, 119646. [Google Scholar] [CrossRef]
  4. Saeed, F.; Paul, A.; Ahmed, M.J.; Gul, M.J.J.; Hong, W.; Seo, H. Intelligent Implementation of Residential Demand Response Using Multiagent System and Deep Neural Networks. Concurr. Comput. 2021, 33, e6168. [Google Scholar] [CrossRef]
  5. Ashreeta, P.; Holzhauer, S.; Krebs, F. Overview of Machine Learning and Data-Driven Methods in Agent-Based Modeling of Energy Markets. In Proceedings of the INFORMATIK 2019: 50 Jahre Gesellschaft für Informatik–Informatik für Gesellschaft, Kassel, Germany, 23–26 September 2019; Volume 294, pp. 571–584. [Google Scholar]
  6. Argonne National Laboratory Repast Website. Available online: https://repast.github.io/index.html (accessed on 15 June 2024).
  7. Borshchev, A.; Karpov, Y.; Kharitonov, V. Distributed Simulation of Hybrid Systems with AnyLogic and HLA. Future Gener. Comput. Syst. 2002, 18, 829–839. [Google Scholar] [CrossRef]
  8. The AnyLogic Company AnyLogic Website. Available online: https://www.anylogic.com (accessed on 1 February 2024).
  9. Harp, S.A.; Sergio, B.; Wollenberg, B.F.; Samad, T. SEPIA: A Simulator for Electric Power Industry Agents. IEEE Control Syst. 2000, 20, 53–69. [Google Scholar] [CrossRef]
  10. Conzelmann, G.; Boyd, G.; Koritarov, V.; Veselka, T. Multi-Agent Power Market Simulation Using EMCAS. In Proceedings of the IEEE Power Engineering Society General Meeting, San Francisco, CA, USA, 16–16 June 2005; IEEE: New York, NY, USA, 2005; Volume 3, pp. 917–922. [Google Scholar]
  11. Praca, I.; Ramos, C.; Vale, Z.; Cordeiro, M. MASCEM: A Multiagent System That Simulates Competitive Electricity Markets. IEEE Intell. Syst. 2003, 18, 54–60. [Google Scholar] [CrossRef]
  12. Grozev, G.; Batten, D.; Anderson, M.; Lewis, G.; Moran, J.; Katzfey, J. NEMSIM: Agent-Based Simulator for Australia’s National Electricity Market. In Proceedings of the SimTecT 2005 Conference Proceedings, Sydney, Australia, 9–12 May 2005. [Google Scholar]
  13. Kell, A.; Forshaw, M.; McGough, A.S. ElecSim: Monte-Carlo Open-Source Agent-Based Model to Inform Policy for Long-Term Electricity Planning. In Proceedings of the e-Energy 2019: Proceedings of the 10th ACM International Conference on Future Energy Systems, Phoenix, AZ, USA, 25–28 June 2019; pp. 556–565. [Google Scholar]
  14. Kwakkel, J.H.; Yücel, G. An Exploratory Analysis of the Dutch Electricity System in Transition. J. Knowl. Econ. 2014, 5, 670–685. [Google Scholar] [CrossRef]
  15. Anwar, M.B.; Dalvi, S.; Stephen, G.; Frew, B.; Ericson, S.; Valqui Ordonez, B.; Brown, M.; Biagioni, D. EMIS Agent Simulation Model (Electricity Markets Investment Suite) [SWR-19-56]; Computer Software; National Renewable Energy Laboratory (NREL): Golden, CO, USA, 2020.
  16. Crespo del Granado, P.; van Nieuwkoop, R.H.; Kardakos, E.G.; Schaffner, C. Modelling the Energy Transition: A Nexus of Energy System and Economic Models. Energy Strategy Rev. 2018, 20, 229–235. [Google Scholar] [CrossRef]
  17. Gjorgiev, B.; Garrison, J.B.; Han, X.; Landis, F.; van Nieuwkoop, R.; Raycheva, E.; Schwarz, M.; Yan, X.; Demiray, T.; Hug, G.; et al. Nexus-e: A Platform of Interfaced High-Resolution Models for Energy-Economic Assessments of Future Electricity Systems. Appl. Energy 2022, 307, 118193. [Google Scholar] [CrossRef]
  18. Guven, D.; Kayalica, M.O.; Sen, O.L. The Impact of Electricity Generation on CO2 Emissions in Türkiye: An Agent-Based Simulation Approach. Energies 2025, 18, 655. [Google Scholar] [CrossRef]
  19. Gokce, B.; Kayakutlu, G. Multi-Agent Energy Market Simulations with Machine Learning Integration: A Systematic Literature Review. IEEE Access 2025, 13, 106003–106018. [Google Scholar] [CrossRef]
  20. Fraunholz, C.; Kraft, E.; Keles, D.; Fichtner, W. Advanced Price Forecasting in Agent-Based Electricity Market Simulation. Appl. Energy 2021, 290, 116688. [Google Scholar] [CrossRef]
  21. Kell, A.J.M.; McGough, A.S.; Forshaw, M. The Impact of Online Machine-Learning Methods on Long-Term Investment Decisions and Generator Utilization in Electricity Markets. Sustain. Comput. Inform. Syst. 2021, 30, 100532. [Google Scholar] [CrossRef]
  22. Kell, A.J.M.; Stephen McGough, A.; Forshaw, M. A Systematic Literature Review on Machine Learning for Electricity Market Agent-Based Models. In Proceedings of the 2022 IEEE International Conference on Big Data, Osaka, Japan, 17–20 December 2017; IEEE: New York, NY, USA, 2022; pp. 4503–4512. [Google Scholar]
  23. Weidlich, A.; Sensfuß, F.; Genoese, M.; Veit, D. Studying the Effects of CO2 Emissions Trading on the Electricity Market: A Multi-Agent-Based Approach. In Emissions Trading; Springer: New York, NY, USA, 2008; pp. 91–101. [Google Scholar]
  24. Guerci, E.; Rastegar, M.A.; Cincotti, S. Agent-Based Modeling and Simulation of Competitive Wholesale Electricity Markets. In Handbook of Power Systems II; Springer Nature: Berlin/Heidelberg, Germany, 2010; pp. 241–286. [Google Scholar]
  25. Yücel, G.; van Daalen, C. A Simulation-Based Analysis of Transition Pathways for the Dutch Electricity System. Energy Policy 2012, 42, 557–568. [Google Scholar] [CrossRef]
  26. Turkish Electricity Transmission Corporation (TEIAS) Türkiye Electricity Statistics. Available online: https://ytbsbilgi.teias.gov.tr/ytbsbilgi/frm_istatistikler.jsf (accessed on 8 October 2025).
  27. BOTAS Petroleum Pipeline Company Natural Gas Sales Tariff. Available online: https://botas.gov.tr (accessed on 23 September 2025).
  28. Republic of Türkiye Directorate of Climate Change Paris Agreement. Available online: https://iklim.gov.tr/en/paris-agreement-i-117 (accessed on 15 September 2025).
  29. Republic of Türkiye Ministry of Energy and Natural Resources. Türkiye 2022 National Energy Plan; Republic of Türkiye Ministry of Energy and Natural Resources: Ankara, Türkiye, 2022.
  30. Türkiye Energy Market Regulatory Authority (EMRA). Draft Regulation on the Operation of Carbon Markets. Available online: https://www.epdk.gov.tr/Detay/Icerik/5-13184/karbon-piyasalarinin-isletilmesine-iliskin-yonetm (accessed on 1 June 2024).
  31. Türkiye Energy Market Regulatory Authority (EMRA). Regulation on the Certification and Support of Renewable Energy Resources. Available online: https://www.epdk.gov.tr/Detay/Icerik/3-0-159/yonetmelikler (accessed on 8 October 2025).
  32. Republic of Türkiye Ministry of Energy and Natural Resources Production Activities-Renewable Energy Resource Area. Available online: https://enerji.gov.tr/production-activities-en (accessed on 8 October 2025).
  33. Energy Exchange Istanbul (EXIST). Regulation on Renewable Energy Guarantees of Origin in the Electricity Market. Available online: https://www.epias.com.tr/wp-content/uploads/2025/07/Regulation-on-Renewable-Energy-Guarantees-of-Origin-in-the-Electricity-Market_17.12.2024.pdf (accessed on 8 October 2025).
  34. Energy Exchange Istanbul (EXIST). Transparency Platform. Available online: https://seffaflik.epias.com.tr/home (accessed on 23 September 2025).
  35. Energy Exchange Istanbul (EXIST). Electricity Market Announcements. Available online: https://www.epias.com.tr/en/spot-electricity-market/electricity-market-announcements/ (accessed on 23 September 2025).
  36. Turkish Electricity Transmission Corporation (TEIAS) Installed Capacity Reports. Available online: https://www.teias.gov.tr/kurulu-guc-raporlari (accessed on 1 June 2022).
  37. Turkish Electricity Transmission Corporation (TEIAS). Tariffs. Available online: https://www.teias.gov.tr/tarifeler (accessed on 23 September 2025).
  38. Turkish Electricity Transmission Corporation (TEIAS). Türkiye Electricity Generation and Transmission Statistics. Available online: https://www.teias.gov.tr/turkiye-elektrik-uretim-iletim-istatistikleri (accessed on 1 December 2023).
  39. International Energy Agency. World Energy Outlook 2023; IEA: Paris, France, 2023. [Google Scholar]
  40. Lazard. Levelized Cost of Energy+. Available online: https://www.lazard.com/media/2ozoovyg/lazards-lcoeplus-april-2023.pdf (accessed on 1 October 2024).
  41. Fraunhofer ISE. Levelized Cost of Electricity Renewable Energy Technologies; Fraunhofer-Institut für Solare Energiesysteme ISE: Freiburg im Breisgau, Germany, 2021. [Google Scholar]
  42. Oladosu, G.; Sasthav, C. Hydropower Capital and O&M Costs: An Exploration of the FERC Form 1 Data; OAK RIDGE National Laboratory: Oak Ridge, TN, USA, 2022.
  43. International Energy Agency. Hydropower Special Market Report; IEA: Paris, France, 2021. [Google Scholar]
  44. Republic of Türkiye Ministry of Energy and Natural Resources Energy Investments. Available online: https://enerji.gov.tr/eigm-raporlari (accessed on 10 December 2023).
  45. Türkiye Energy Market Regulatory Authority (EMRA) Electricity Market Licenses. Available online: https://lisans.epdk.gov.tr/epvys-web/faces/pages/lisans/elektrikUretim/elektrikUretimOzetSorgula.xhtml (accessed on 10 December 2023).
  46. Ediger, V.Ş.; Akar, S. ARIMA Forecasting of Primary Energy Demand by Fuel in Turkey. Energy Policy 2007, 35, 1701–1708. [Google Scholar] [CrossRef]
  47. Barbier, G. Estimation and Forecasting Electricity Load in Benin: Using Econometric Model ARIMA/GARCH. In Proceedings of the 2021 International Conference on Electrical, Communication, and Computer Engineering (ICECCE), Kuala Lumpur, Malaysia, 12–13 June 2021; pp. 1–6. [Google Scholar]
  48. Bilgili, M.; Pinar, E. Gross Electricity Consumption Forecasting Using LSTM and SARIMA Approaches: A Case Study of Türkiye. Energy 2023, 284, 128575. [Google Scholar] [CrossRef]
  49. Tutun, S.; Chou, C.A.; Caniyilmaz, E. A New Forecasting Framework for Volatile Behavior in Net Electricity Consumption: A Case Study in Turkey. Energy 2015, 93, 2406–2422. [Google Scholar] [CrossRef]
  50. Prokhorenkova, L.; Gusev, G.; Vorobev, A.; Dorogush, A.V.; Gulin, A. Catboost: Unbiased Boosting with Categorical Features. In Proceedings of the 32nd International Conference on Neural Information Processing Systems, Montréal, QC, Canada, 3–8 December 2018; pp. 6639–6649. [Google Scholar]
  51. Republic of Türkiye Ministry of Energy and Natural Resources Emission Factors for Electricity Generation and Points of Electricity Consumption in Türkiye. Available online: https://enerji.gov.tr/evced-cevre-ve-iklim-elektrik-uretim-tuketim-emisyon-faktorleri (accessed on 1 June 2024).
  52. Eurostat. Production of Lignite in the EU-Statistics; European Commission: Brussels, Belgium, 2023. [Google Scholar]
  53. Tao, Z.; Moncada, J.A.; Poncelet, K.; Delarue, E. Review and Analysis of Investment Decision Making Algorithms in Long-Term Agent-Based Electric Power System Simulation Models. Renew. Sustain. Energy Rev. 2021, 136, 110405. [Google Scholar] [CrossRef]
  54. Strantzali, E.; Aravossis, K. Decision Making in Renewable Energy Investments: A Review. Renew. Sustain. Energy Rev. 2016, 55, 885–898. [Google Scholar] [CrossRef]
  55. Republic of Türkiye Ministry of Energy and Natural Resources. Energy Efficiency 2030 Strategy and 2nd National Energy Efficiency Action Plan (2024–2030); Republic of Türkiye Ministry of Energy and Natural Resources: Ankara, Türkiye, 2023.
  56. SHURA Energy Transition Center. Transportation Sector Transformation: Integrating Electric Vehicles into Türkiye’s Distribution Grids; SHURA Energy Transition Center: Istanbul, Turkey, 2024. [Google Scholar]
Figure 1. Scope of the study.
Energies 18 05655 g001
Figure 2. Long-term agent and market interactions.
Energies 18 05655 g002
Figure 3. Research algorithm of the study.
Energies 18 05655 g003
Figure 4. SARIMA demand forecast.
Energies 18 05655 g004
Figure 5. CatBoost DAP forecast.
Energies 18 05655 g005
Figure 6. Decision-making process of the investor agent.
Energies 18 05655 g006
Figure 7. Generation mix under alternative scenarios: (a) stated policies; (b) stated policies—without nuclear; (c) low demand; (d) high demand.
Energies 18 05655 g007
Figure 8. CO2 emissions under alternative scenarios.
Energies 18 05655 g008
Figure 9. DAP under alternative scenarios.
Energies 18 05655 g009
Table 1. Data sources and descriptions used in the simulation model.
DataDescriptionStartResolutionSource
Net electricity demandElectricity demand excluding internal consumption of unlicensed generation2016Hourly[34]
DAM priceDAM electricity price2009Hourly[34]
Natural gas plant fuel priceNatural gas sales price tariff2014Monthly[27]
Licensed power plant listLicensed power plant list2020-[34]
Licensed power plant unit listList of generation units of the power plants2020-[34]
FIT installed capacityInstalled capacity of power plants supported under the feed-in tariff (FIT) scheme2016Monthly[34]
FIT licensed generationGeneration of licensed power plants under the FIT scheme, by energy source2016Hourly[34]
Total day-ahead planDay-ahead generation schedule by energy source2014Hourly[34]
Total generationRealized generation by energy source2015Hourly[34]
Net international generationNet electricity imports (imports minus exports)2015Hourly[34]
Plant generationRealized generation by the power plant2019Hourly[34]
DAM bid capBid limit cap in DAM2021Monthly[35]
Total installed capacityInstalled capacity by energy source2019Monthly[36]
Total unlicensed generationUnlicensed generation by energy source2018Hourly[34]
System usage and operating feeElectricity transmission system usage and operating fee2021Yearly[37]
Total gas transmission feeTotal natural gas entry, exit, and transmission charges2019Yearly[34]
Gross electricity demandTotal electricity demand1975Monthly[38]
Fossil fuel and CO2 priceForecast of natural gas, coal, and carbon dioxide (CO2) emission prices2022Yearly[39]
Plant investment and O&M costInvestment and operation and maintenance (O&M) costs by plant type2021Yearly[39,40,41]
Hydropower plant costInvestment and O&M costs of hydropower plants2010Yearly[42]
Plant lifetime and commissioningLifetimes and commissioning periods by plant type2021-[40,41,43]
Thermal plant efficiencyThermal efficiency values for natural gas and imported coal power plants2021-*
New thermal plant efficiencyThermal efficiency rate of thermal power plants to be constructed2021Yearly[41]
Realized plant investmentLicensing and commissioning dates of power plants and commissioned capacity2003Daily[44]
Generation licenseElectricity generation licenses by company and power plant2016Daily[45]
* Authors’ own data (not publicly available).
Table 2. Critical values for unit-root tests.
Significance LevelConfidence LevelCritical Value
%1%99−3.44
%5%95−2.87
%10%90−2.57
Table 3. Comparison of ML models on historical data from 2021.
MetricCatBoostXGBoostRandom Forest
Average Error (%)−1.94%−4.32%−5.58%
MAPE (%)6.09%6.60%6.49%
Table 4. Fossil fuel and carbon price inputs.
Price Type202220302050
Natural Gas (USD/MWh)110.223.524.2
Coal (USD/MWh)35.68.28.5
CO2 (USD/ton)120129135
Table 5. Comparison of monthly generation by energy source in 2021.
Energy SourceActual Generation (TWh)Simulated Generation (TWh)Error (%)
Biofuel6.76.6−2.1
Lignite49.248.9−0.7
Geothermal10.110.0−0.9
Imported Coal54.955.10.4
Natural Gas107.7108.00.3
Solar PV1.51.50.0
Hydropower55.556.31.4
Wind30.929.9−3.4
Total316.5316.3−0.1
Table 6. Technical parameters of power plants by energy source.
Energy SourceConstruction Period (Years)Lifetime (Years)
Natural Gas230
Coal540
Biofuel225
Geothermal325
Solar PV130
Onshore Wind125
Reservoir Hydropower460
Run-of-River Hydropower260
Table 7. End-of-year installed capacity by energy source, 2019–2023 (GW).
Energy Source20192020202120222023
Wind7.68.810.611.411.7
Reservoir Hydropower20.622.923.323.323.5
Run-of-River Hydropower7.98.18.28.38.3
Solar PV66.77.89.511.3
Geothermal1.51.61.71.71.7
Biofuel1.21.52.02.32.4
Lignite11.311.311.411.411.4
Natural Gas25.925.725.625.325.4
Imported Coal9.09.09.010.410.4
Table 8. Costs by energy source and year.
Energy SourceInvestment Cost
(MUSD/MW)
Fuel, Emission, O&M Costs (USD/MWh)
202220302050202220302050
Natural Gas111170125130
Coal222125150160
Biofuel444717171
Geothermal5.45.45.4191919
Solar PV0.990.620.45101010
Onshore Wind1.751.671.61201515
Reservoir Hydropower1.171.171.17101010
Run-of-River Hydropower2.152.152.15272727
Table 9. NPV (MUSD/MW) sensitivities by real discount rate ( i ).
Energy Source i = 0.04 i = 0.06 i = 0.08
Onshore Wind1.310.830.47
Unlicensed Solar PV1.631.371.18
Licensed Solar PV2.261.91.63
Geothermal−0.84−1.76−2.43
Reservoir Hydropower0.870.410.09
Run-of-River Hydropower−0.48−0.79−1.02
Table 10. Assumptions for future capacity additions by energy source.
Energy SourceAssumptions
BiofuelInvestment continues only in mandatory WtE projects. From 2025 onward, annual additions are fixed at the planned 2025 commissioning capacity of 25 MW.
GeothermalInvestment remains very limited, with much potential unused. Projected biofuel and geothermal combined capacity is 5100 MW by 2035 [29]. After subtracting the biofuel share, average geothermal additions are assumed to be 22.8 MW/year from 2025 onward.
HydropowerTotal capacity is projected to reach 35.1 GW by 2035, using all remaining potential [29]. This implies average annual additions of 250.3 MW until 2035.
LigniteA total of 1700 MW of new capacity is foreseen between 2024 and 2030, considering the remaining domestic coal reserves [29]. This is modeled as a 145 MW addition in 2028, followed by 777.5 MW/year in 2029–2030.
Imported coalNo new capacity, due to high fuel costs and environmental concerns.
Natural gasBy 2030, 2.4 GW of natural gas capacity and 0.6 GW of cogeneration capacity are foreseen [29]. This is modeled as three 800 MW combined-cycle units commissioned between 2027 and 2029, and twelve 50 MW cogeneration units distributed between 2028 and 2030.
Onshore windOnshore wind is considered the most attractive investment. Large investors allocate all residual budgets, after licensed projects, to onshore wind.
Table 11. Results of the investment decision module.
Energy SourceCapacity
Additions (GW)
Capacity
Retired (GW)
2053-End
Capacity (GW)
Wind24.3927
Reservoir Hydropower2.3025.7
Run-of-River Hydropower1.109.4
Solar PV60.49.562.2
Geothermal0.71.41
Biofuel1.21.81.8
Lignite1.72.610.5
Natural Gas3.87.821.3
Imported Coal03.66.8
Nuclear4.804.8
Table 12. Emission factor (EF) price sensitivity scenarios.
FuelBase EF
(Current)
Low EF
(−10%)
Very Low
EF (−20%)
Natural gas0.3740.3370.299
Imported coal0.8060.7250.645
Lignite1.1521.0370.922
Disclaimer/Publisher’s Note: The statements, opinions and data contained in all publications are solely those of the individual author(s) and contributor(s) and not of MDPI and/or the editor(s). MDPI and/or the editor(s) disclaim responsibility for any injury to people or property resulting from any ideas, methods, instructions or products referred to in the content.