Abstract
With the transformation of the global energy structure, offshore wind power is developing on a large scale, and the efficient and safe installation of offshore converter platforms has become a key technological bottleneck. Based on the elastic force–gravity similarity principle, a 1:65 model scale was adopted. A physical model of the offshore converter station platform was constructed, and the accuracy of the numerical simulation was validated by comparison with the physical model tests. This study investigates the dynamic response of the offshore converter platform and converter valve equipment during the float-over installation and mating process. The structural dynamic responses at key positions were analyzed. The results indicate that, due to the slender and flexible structure of the converter valve equipment, the Z-direction acceleration at the top is about 20% higher than that at the bottom. Moreover, the stress and strain at the bottom connection with the deck are higher than those at the top. The Y-direction acceleration at the edge foundation beam of the platform module is 47% higher than that at the mid-span position. The vibration frequency of the foundation beam on the first floor with the converter valve arranged is increased by 15%. When the jacket piles are subjected to impact, the mid-span response is 25% higher than that at the edges, showing characteristics of “strong at mid-span and weak at the edges”.
1. Introduction
Since the beginning of the 21st century, the offshore wind power industry has developed rapidly [1,2], and the construction of offshore converter platforms has become particularly important. As an important supporting facility for offshore flexible direct current (DC) transmission, the offshore converter platform undertakes conversion between alternating current (AC) and DC power, meeting the requirements of the power system for safety and power quality. The offshore converter platform is composed of a ten-thousand-ton steel structure integrated with electrical equipment, which must not only ensure sufficient load-bearing capacity but also guarantee the proper operation of high-voltage converter valve equipment. At present, existing technologies struggle to balance computational accuracy and efficiency, especially when dealing with the integrated motion and response of the platform and valve tower. The nonlinear boundary conditions introduced by contact collisions, the non-zero initial conditions, and the high-frequency vibration responses further increase the difficulty of the solution. Therefore, it is urgently necessary to develop a multi-substructure integrated analysis method for the contact–collision conditions during float-over installation in order to provide theoretical and technical support for the safe construction of offshore converter platforms.
Flexible DC transmission employs voltage source converters (VSC) [3,4], including modular multilevel converters (MMCs) and high-voltage HCDC, among others [5,6]. Currently, advanced flexible DC transmission technology has been extensively applied in long-distance, high-capacity power transmission, offshore platforms, and island power supply, making it an essential technical approach for constructing modern power systems [7,8]. During offshore transportation, installation, and long-term operation, offshore flexible DC converter valves are exposed to adverse environmental loads such as wind, waves, and currents, which produces higher safety requirements for marine flexible DC converter valves [7,8]. Lan et al. [9] analyzed the floor response spectra (FRS) of various deck levels of an offshore electrical platform under multi-directional random wave excitation, and further discussed their correlation with the natural frequencies of the equipment. The quantitative relationship between equipment elevation and frequency-band amplification is provided, which directly supports vibration verification of equipment (including valve towers), as well as vibration checks and vibration reduction layout after transportation during on-site installation. Luo et al. [10] conducted numerical and model test comparisons focusing on the standby phase of dual-barge float-over operations, quantified the effects of mooring/fender systems and environmental disturbances on station-keeping and random responses, and provided sensitivity analyses of key parameters as well as engineering recommendations. Sun et al. [11] proposed a simplified vibration converter valve model. In comparison with the original complex model, discrepancies in physical parameters and vibration characteristics were within 5%, with the simplification degree quantified at 95%. Assessing vibration levels and identifying their form and spectrum is an important tool for evaluating the dynamic properties of structures, and frequency response analysis can be effectively used to determine dynamic characteristics in complex systems. This approach has also been successfully applied in the vibration analysis of centrifugal loop dryer machines, where Karpenko et al. [12] revealed the relationship between vibration characteristics and operational performance based on vibration and frequency response analyses, providing methodological support for evaluating vibration responses and optimizing structural designs of offshore converter valves.
With the continuous improvement of the theoretical framework of dynamics and the rapid development of computational technology, time-domain dynamic simulation methods have gradually become the mainstream research approach in the numerical simulation of float-over installation engineering. O’Neill et al. [13] carried out numerical studies on barge stability during the float-over installation process, employing MOSES to assess the stability parameters of float-over barges under varying heel angles. Using the SIMO software, they performed time-domain simulations. To reduce computational conditions, a novel design wave method (Constrain New Wave) was proposed, which significantly reduced computational time, and statistical comparisons indicated no substantial differences in the results. On this basis, O’Neill et al. [14] conducted a sensitivity analysis of equipment parameters such as LMU, DSU, mooring lines, and fenders, and determined that these positioning and buffering devices have a significant influence on the motions of the barge and the topside module during the float-over installation process. Ji et al. [15] conducted studies on the float-over installation of Spar platforms under the environmental conditions of the West African sea area, using the MLTSIM software for time-domain simulations, and ultimately obtained the six degrees of freedom motions and forces of the barge and the topside module. On this basis, the stiffness of the LMU and DSU devices was designed, and appropriate schemes were selected through comparison of motion response results.
Refined modeling of key equipment on large offshore platforms is not only a current research focus but also a critical technological prerequisite for ensuring safe service of platforms in complex marine environments. The accuracy of such modeling directly affects the overall structural safety, operational reliability, and economic efficiency over the entire life cycle of the platform. It also serves as an essential means to deeply reveal the coupling mechanisms among devices and to precisely capture the mechanical behavior and dynamic response under complex loading conditions. Berhault et al. [16] carried out numerical simulation studies on the float-over installation of a topside module on a jacket platform in a certain sea area, simulating devices such as the mooring system, LMU, DSU, and fenders. The quasi-static catenary method was applied to calculate anchor chains and mooring lines, while the fenders, LMU, and DSU were simplified using linear-stiffness springs. Hu et al. [17] incorporated structural characteristics into the modeling of the LMU, and subsequently examined the nonlinear influences of barge system motions-namely sway, heave, and roll-on the LMU. Chen et al. [18] introduced a bilinear spring-damper system, taking into account the limited load-carrying capacity of the vibration absorption system, and developed an effective constant-parameter time-domain model (CPTDM) to investigate the nonlinear dynamics of a floating structure composed of rigid-body motions, impact absorption systems, and mooring dynamics. Zhou et al. [19] proposed a novel active motion compensation device (MCE) that reduces the duration and magnitude of barge impacts during load transfer, thereby improving the efficiency of load transfer operations.
At present, with the increasing maturity of related technological systems, research on multi-body coupled dynamics in the field of float-over installation technology in offshore engineering is gradually evolving from early simplified analyses of single-system models to in-depth explorations of the coupling characteristics of multidimensional complex systems. Lan et al. [20] investigated the coupling among platform, riser tower and equipment, comparing the differences between “platform/equipment decoupled” analysis and “platform-riser tower coupled modeling”, and evaluated the transfer effects of platform structural parameter variations on riser tower responses. Clarifying the dynamic characteristics of the platform (natural frequency, damping, and inter-story stiffness distribution) significantly affects the peak acceleration/displacement of the riser tower, thereby supporting coupled verification and tuning after installation. Zhao et al. [21] proposed a numerical modeling strategy tailored for non-stationary conditions, in which hydrodynamic coefficients are updated over time to characterize the evolution of loads and responses, enabling a more realistic reproduction of the time-varying forces and motions during the berthing/contact stage. Chen et al. [22] developed a coupled model for catamaran–Spar float-over installation, covering both the initial-contact and final-contact stages, and addressed issues of gap resonance and mechanical coupling, quantifying the impact of connection and hydrodynamic coupling on stability. Wang et al. [23] incorporated the dual-barge with DP control and flexible connections/fenders into a fully coupled time-domain framework, quantified the sensitivity of operational window and force distribution to DP gain, connection parameters, and wave direction, and provided guidelines for parameter tuning. Ullah et al. [24] further incorporated suspended load-hull coupling into a nonlinear model, demonstrating that the mutual excitation between load swing and hull motion amplifies impacts and relative displacements, which need to be mitigated through coordinated buffering and control strategies. Luo et al. [25] conducted a coupled time-domain numerical evaluation for dual-barge float-over operations, pointing out that wave spectra and wave directionality have significant effects on docking stability and limiting forces, and proposed engineering optimization recommendations regarding barge spacing and connection configuration. Chen et al. [26] developed a time-domain coupled impact model of roll and pitch, considering wave-induced multiple collisions, and analyzed the complex impact behaviors associated with floating deck installations. By contrast, existing studies often replace the converter valves with equivalent loads or decouple them from the platform, failing to capture how valve flexibility feeds back on platform modes and response amplification; they frequently rely on quasi-static, frequency-domain, or mode-superposition approaches premised on linear or weakly nonlinear assumptions, which are inadequate for transient collisions and multi-interface contact in float-over docking; parameter identification and validation of key buffering/positioning devices (LMU/DSU) are often incomplete, lacking mutual calibration with physical tests; quantitative conclusions about spatial response distributions and positional differences are limited, offering insufficiently actionable indicators for operation windows, stiffness tuning, and risk assessment.
This study focuses on the docking collision process during the offshore float-over installation stage, investigating the dynamic response of the topside platform module and the jacket structure with LMU devices under “steel-to-steel” contact collisions. Through numerical simulation, this study proposes an integrated multi-substructure analysis method for offshore converter platforms and converter-valve equipment under contact–collision conditions. A 1:65 physical model, constructed according to the elastic force–gravity similarity principle, is used to validate the method at key measurement locations, further improving the theoretical framework and simulation methodology for structural dynamic analysis of offshore converter platforms. Using an explicit dynamic calculation method, finite element numerical simulations were conducted in ABAQUS to validate the accuracy of the model and to analyze the structural dynamic responses at key locations of the converter valve equipment, topside platform module, and jacket structure. The remaining chapters of this study are organized as follows: Section 2 introduces the numerical methods and models employed in this study. Section 3 presents the results and discussion. Section 4 provides the conclusions.
2. Numerical Method
2.1. Transient Dynamics Theory
Docking collision is the most critical stage in the float-over installation process, involving a complex load transfer process and nonlinear coupling among different structures [27,28]. A sufficiently small time step is required to clearly capture the intense impacts of contact collisions [29]. This necessitates the use of transient dynamics theory and explicit dynamics in ABAQUS to perform the calculations, thereby improving computational efficiency while ensuring accuracy.
Transient dynamic analysis technology refers to an engineering mechanics analysis method in which loadings based on event functions are taken as input conditions, and the time-varying displacement, stress, strain, and other dynamic response data are obtained through computation. The equilibrium equation established in the dynamic analysis is:
where denotes the load vector, which is a known function of time; represents the displacement vector, which is a function of time; and are the velocity vector and acceleration vector, which are the first-order and second-order derivatives of the displacement vector with respect to time, respectively.
Using the kinetic energy of the entire system,
It can be obtained that
Thus, the stiffness matrix M reflects a positive-definite symmetric matrix as well as the kinetic energy of the system.
From the elastic potential energy of the entire system,
It can be obtained that
Thus, the stiffness matrix K reflects a semi-definite matrix and the potential energy of the system.
In dynamic analysis, the damping parameter C is usually modeled using a viscous damping model, in which the magnitude of the damping force is linearly proportional to the velocity of motion. ABAQUS (version 6.14-1)/Explicit with explicit central-difference time integration is employed to simulate the float-over docking stage, which involves strong nonlinear contact/separation, non-zero initial conditions, and high-frequency transient responses. The explicit scheme avoids global Newton iterations and is therefore more robust for multi-interface contact and topology switching than implicit solvers, which in such problems often suffer from convergence difficulties and step cutbacks. The stable time step is controlled by element size and material wave speed, enabling resolution of short-duration impacts. By contrast, the mode superposition method assumes a linear (or weakly nonlinear) system and is not used for the contact–collision analysis; it is applied only to the linearized model to extract natural frequencies/modes and to rationalize initial damping estimates. Finite-element discretization follows the structural features of each component with local mesh refinement in contact and stress-concentration regions. Contact is modeled using standard surface-to-surface formulations available in ABAQUS.
2.2. Finite Element Model
A full-scale prototype steel structure model was established based on the actual dimensions and material properties of the structure. In the finite element model, the pipe members were simulated using PIPE sections, while the beam members included both I-beams and rectangular beams, which were modeled using the I-Beam and RECT beam sections, respectively. The PIPE and BEAM members were discretized with line elements (B31). The electrical equipment was modeled by combining PIPE elements and BEAM elements according to its dimensions and material properties, while the structural counterweight was represented using non-structural mass elements (Mass).
The finite element model of the large offshore converter platform mainly consists of three parts: the topside platform module, the converter valve equipment group, and the jacket structure. The overall finite element model of the converter platform is shown in Figure 1. The topside platform module weighs 21,000 tons, with main dimensions of 73 m × 69 m × 45 m. It consists of seven internal decks, with accessible platforms located on the first, fifth, and sixth levels. The converter platform module is primarily composed of beam and column structures, as shown in Figure 2a. The converter valve equipment group consists of 12 units, arranged along the platform’s X-direction in a 2 × 6 configuration. Each unit weighs 55 tons, with a total weight of 660 tons, and all are slender and flexible cantilever structures, as shown in Figure 2b. The jacket structure is a single six-leg vertical piled jacket, designed to allow float-over installation vessels to enter for construction and installation. It weighs 12,000 tons, with plan dimensions of 69 m × 48 m, as shown in Figure 2c. The positions of the key nodes are also indicated in Figure 2.
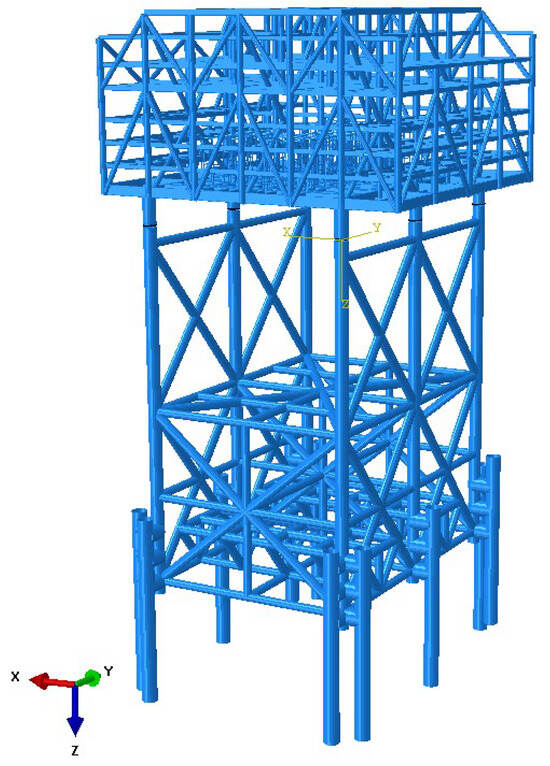
Figure 1.
Integrated finite element model of the offshore converter platform.
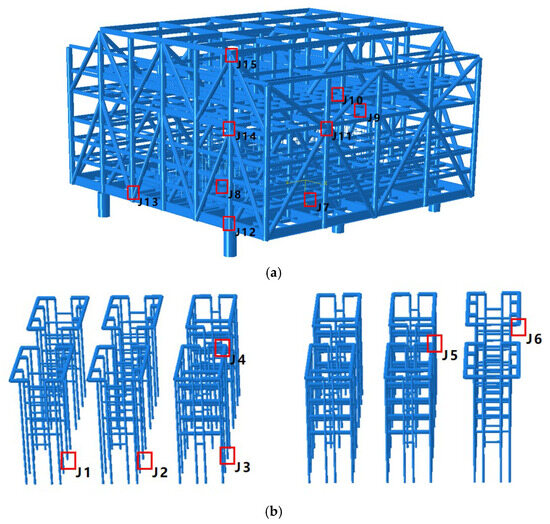
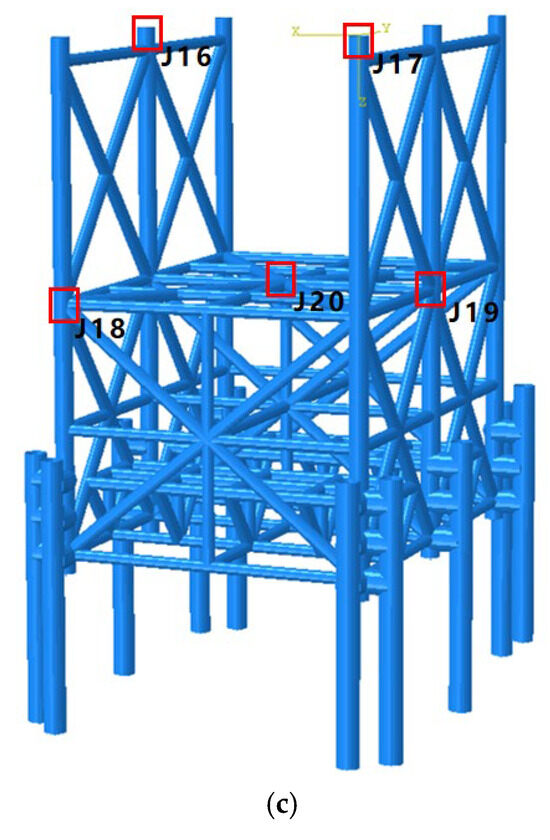
Figure 2.
Finite element models of each module of the offshore converter platform and key nodes. (a) topside platform module, (b) converter valve equipment group, (c) jacket structure.
2.3. Experimental Validation
2.3.1. Modal Validation
As illustrated in Figure 3, the physical model of the offshore converter platform was constructed at a 1:65 geometric scale in strict accordance with the elastic force–gravity similarity principle [30,31], ensuring that the key dynamic characteristics of the prototype were preserved in the scaled specimen. To assess the fidelity of the numerical representation, modal analyses were conducted for both the scaled physical model and the full-scale prototype, and the corresponding results were placed in a one-to-one comparison for validation purposes. For the physical model, the first-order natural frequency along the X direction of the structure was determined to be 1.972 Hz. For the numerical finite element model, the first-order natural frequency in the same direction was obtained as 2.054 Hz. The difference between these two values corresponds to a relative error of 4.16%, which is within an acceptable range for engineering validation. The close agreement of the modal frequencies, derived independently from the physical experiment and the numerical simulation, confirms the rationality and credibility of the finite element modeling strategy, indicating that the model adequately captures the stiffness distribution, mass characteristics, and boundary conditions relevant to the platform’s dynamic behavior.
2.3.2. Dynamic Response Validation
Before conducting the overall contact–collision study of the converter platform, a single-pile contact–collision experiment was first carried out. The physical model experiment results were compared with the numerical simulation results to evaluate the reliability of the chosen numerical method for contact–collision analysis. In the preliminary experiment, the PTO motion simulation system was used to simulate the contact–collision posture of the pile legs. The PTO motion simulation system (a six-degree-of-freedom shaking table) was a closed-loop servo simulation platform, as shown in Figure 4. It was composed of six actuators and twelve universal joints, with six joints at the top and six at the bottom. Through the telescopic motion of the six actuators, the topside platform was able to move in six degrees of freedom in space (X, Y, Z, , , ), thereby enabling the simulation of various spatial motion postures.

Figure 3.
Physical model of the offshore converter platform.
Figure 3.
Physical model of the offshore converter platform.


Figure 4.
PTO shaking table.
Figure 4.
PTO shaking table.

The peak acceleration response obtained from the single-pile contact–collision physical model experiment was compared with that from the numerical simulation analysis. The peak acceleration response of the model experiment was 1.54 m/s2, while that of the numerical simulation was 1.61 m/s2, resulting in a relative error of 4.35%. The analysis revealed that the error was caused by vibrations that occurred when the PTO six-degree-of-freedom shaking table started to drop. This level of discrepancy is acceptable for engineering purposes and supports the reliability of the contact–collision numerical methodology.
A physical model experiment of the overall contact–collision behavior of the converter station platform was carried out using the PTO shaking table, with a docking drop velocity of 0.4 m/s set as the working condition. The peak values of acceleration and strain responses at the location of the converter valve equipment on the first deck of the platform were compared with the numerical simulation results. In the physical model experiment, the peak acceleration response at the bottom of the converter valve equipment was 8.92 m/s2, while the numerical simulation yielded 9.70 m/s2, with an error of 8.04%. In the physical model experiment, the peak strain response at the bottom of the converter valve equipment on the first deck was 79 , while the numerical simulation gave 85 , resulting in a relative error of 7.06%. The analysis revealed that the error arose because the physical model experiment adopted a combined integrated approach, in which the excitation was applied only to the converter valve equipment through contact–collision, without considering the interaction between the converter valve equipment and the platform deck modules. In contrast, the numerical simulation was based on an integrated finite element model, and its results were closer to reality. The structural dynamic response results obtained from the numerical simulation and those from the physical model experiment were generally consistent, with the relative error falling within the required range, thereby verifying the reliability of the contact-collision numerical method.
3. Results and Discussion
The dynamic responses of the offshore converter platform under contact-collision conditions during the float-over installation were analyzed. The study focused on key structural components, including the converter valve equipment, the topside platform module, and the lower jacket. Representative monitoring positions (J1–J20) were selected to evaluate the acceleration and strain responses under a docking drop velocity of 0.3 m/s and an LMU stiffness 22.4 kN/mm. The following sections present and discuss the detailed dynamic response characteristics of each component.
3.1. Dynamic Response of the Converter Valve Equipment Structure
In this section, a vertical docking drop velocity of 0.3 m/s and an LMU stiffness of 22.40 kN/mm are defined. The nominal LMU stiffness was derived from the supplier’s vertical load–compression curve by linearizing the curve within the operating compression range and adopting the local slope as the nominal value; to reflect the curve’s nonlinearity at larger compressions, a ±30% variation around 22.40 kN/mm was also considered in a sensitivity check. The structural acceleration responses at key positions of the converter valve equipment (J1–J6) are analyzed. The time–history curves of acceleration responses in the X, Y, and Z directions at positions J1, J2, and J3 are shown in Figure 5. During the float-over docking and lowering process of the offshore converter station platform, the Z-direction acceleration responses of the converter valve equipment at J1, J2, and J3 were all significantly higher than those in the X and Y directions. From the characteristics of the Z-direction acceleration responses, the peak acceleration responses of the converter valve equipment at the three positions are relatively close: 6.53 m/s2 at J1, 6.95 m/s2 at J2, and 6.74 m/s2 at J3. The Y-direction acceleration responses show a clear positional difference: at positions J1 and J2, the acceleration responses are higher than at J3, with peak values of around 3 m/s2, while the peak value at J3 is only 1.52 m/s2, approximately half of the former two. From the characteristics of the X-direction acceleration responses, the acceleration at positions J1 and J3 is higher than that at J2, with peak values of around 1.9 m/s2, whereas the peak acceleration at J2 is 0.85 m/s2, approximately half of the former two.
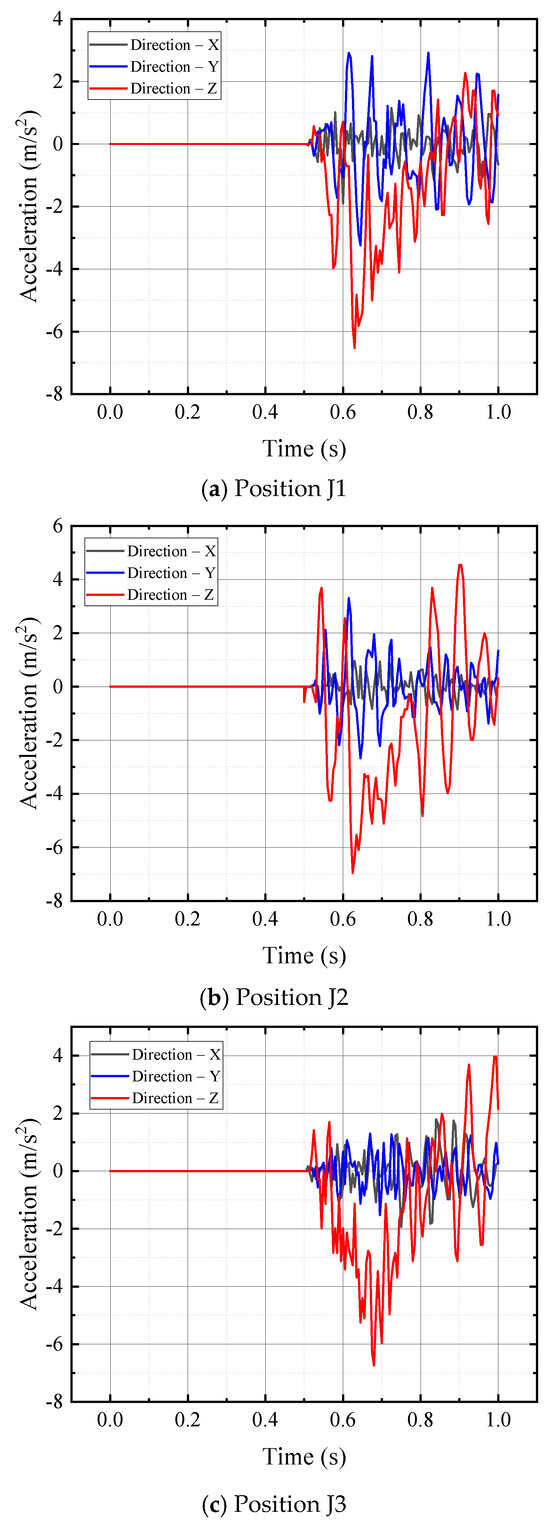
Figure 5.
Time–history curves of bottom acceleration responses of the converter valve equipment at different positions.
The time–history curves of acceleration responses in the X, Y, and Z directions at positions J4, J5, and J6 are shown in Figure 6. At positions J4, J5, and J6, the peak Z-direction acceleration responses are significantly higher than those at positions J1, J2, and J3, and the Z-direction acceleration response still maintains a dominant advantage over the X-direction and Y-direction responses.
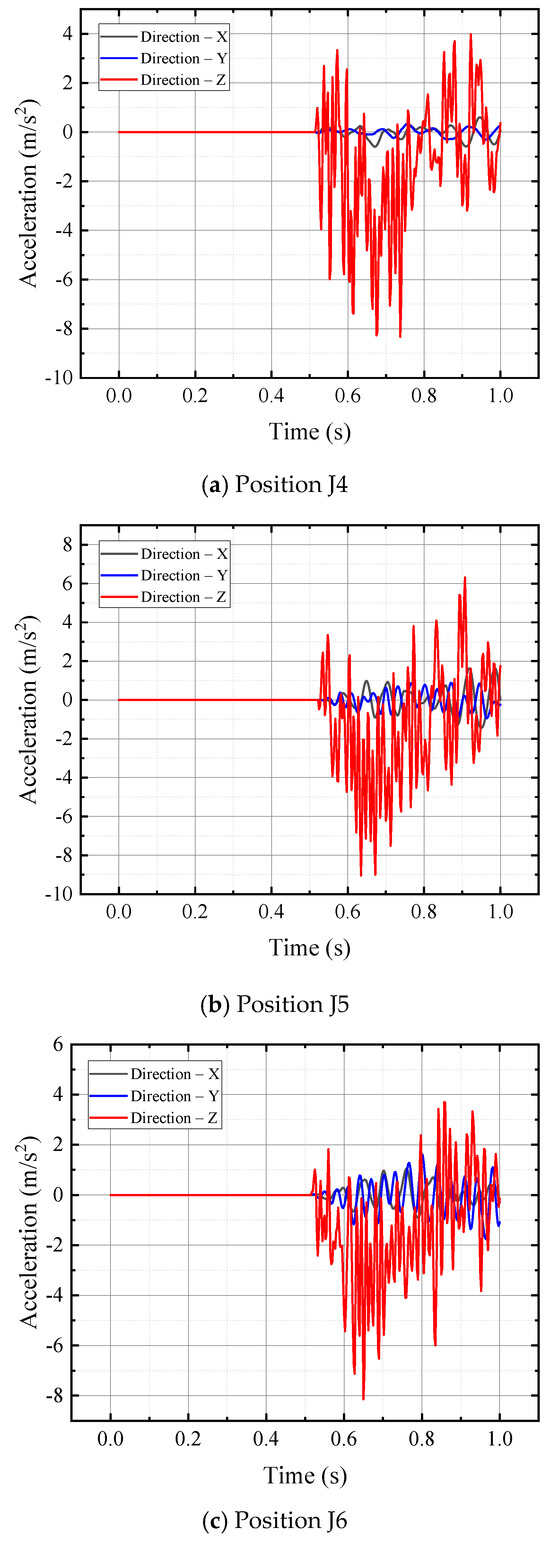
Figure 6.
Time–history curves of top acceleration responses of the converter valve equipment at different positions.
Specifically, the peak Z-direction acceleration responses at positions J4, J5, and J6 are 8.33 m/s2, 9.04 m/s2, and 8.14 m/s2, respectively, which are about 20–35% greater than the peak responses at positions J1, J2, and J3. This reflects the amplification effect of the cantilever structure on vertical dynamic loads, and the magnitude is consistent with amplification levels reported for slender equipment under float-over impact/coupled dynamics [17,26]. From the characteristics of the horizontal acceleration responses, the X- and Y-direction accelerations at positions J5 and J6 are significantly greater than those at position J4, in line with central load-path concentration and connection/fender-parameter sensitivity observed in coupled float-over evaluations [23,25]; this difference likely arises from boundary-constraint stiffness and local mass/stiffness distribution near J5–J6.
The strain response results of the converter valve equipment at positions J1–J6 are shown in Figure 7. The peak strain responses of the converter valve equipment at positions J1, J2, and J3 are relatively close, reaching 85 με, 88 με, and 69 με, respectively. And at all three positions, the maximum strain of the converter valve equipment is compressive strain. In contrast, at positions J4, J5, and J6, the converter valve equipment exhibits obvious differentiation. The strain responses at these three positions are characterized by the combined action of tensile and compressive strains, with the peak values of maximum compressive and tensile strains being nearly equivalent. The peak strain responses at J4, J5, and J6 are 3 με, 9 με, and 8 με, respectively. Overall, the strain responses of the converter valve equipment at positions J1–J3 differ by an order of magnitude from those at positions J4–J6, with the former showing significantly higher peak values than the latter.
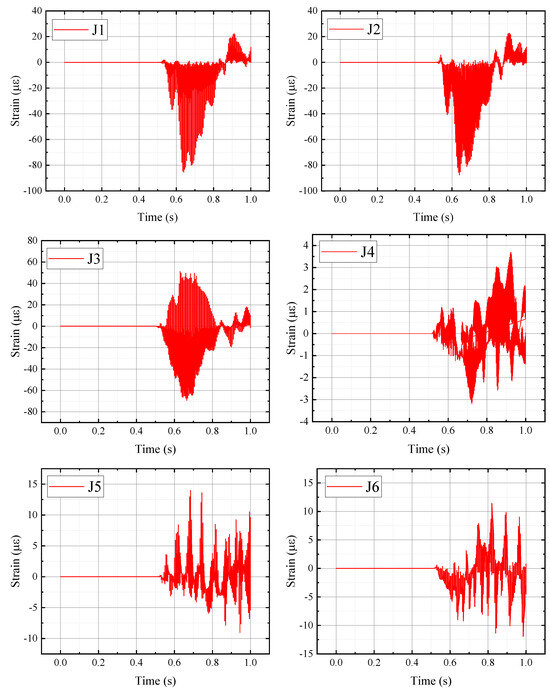
Figure 7.
Time–history curves of strain responses of the converter valve equipment at different positions.
3.2. Dynamic Response of the Topside Platform Module
The time–history curves of acceleration responses in the X, Y, and Z directions at positions J7, J8, J9, and J10 are shown in Figure 8. During the float-over installation and docking process of the offshore converter platform, the foundation beam of the topside platform module, serving as a critical load transfer structure, exhibits pronounced directional characteristics in its acceleration responses. Among the three-directional acceleration responses of the foundation beam, the peak value in the Z-direction is the most pronounced. This observation is consistent with the dynamic characteristics governed by vertical impact loads during the float-over docking and lowering stage. In the horizontal direction of the platform, the foundation beam at position J7 exhibits higher peak acceleration responses in the X, Y, and Z directions compared with that at position J8. Specifically, the peak accelerations reach 4.85 m/s2 in the X direction, 7.10 m/s2 in the Y direction, and 14.90 m/s2 in the Z direction. In the vertical direction of the platform, the foundation beam at position J7 exhibits higher acceleration responses in all three directions compared with those at positions J9 and J10. Furthermore, the foundation beam at position J10 demonstrates larger accelerations in the X and Y directions than that at position J9, while both exhibit comparable trends in the Z-direction acceleration responses. These acceleration response patterns are closely associated with the structural characteristics.
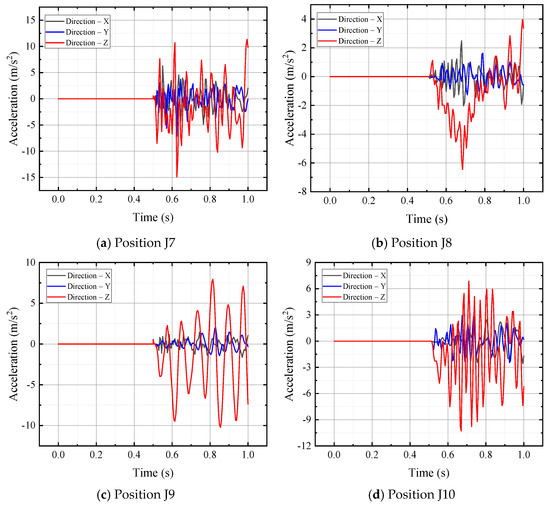
Figure 8.
Time–history curves of acceleration responses of deck foundation beams at different positions.
During the complex dynamic load transfer process of float-over installation and docking of the offshore converter platform, the column structures experience significant acceleration responses. To address this, four representative positions (J11, J12, J13, and J14) of the column structures in the topside platform module were selected for detailed analysis. The acceleration response time history curves in the X, Y, and Z directions at positions J11–J14 are shown in Figure 9. In terms of the directional characteristics of acceleration responses, the column structures at positions J11, J12, and J14 exhibit the largest peak accelerations in the Z-direction. At the J13 position, the column structure presents a unique situation where the acceleration in the X direction is greater than that in the Y and Z directions. Further analysis of the differences at different positions shows that the Z-direction acceleration of the column at position J14 is greater than that at position J12, while the peak acceleration responses in the X and Y directions differ little. At position J11, the peak acceleration response in the Y direction is 12.27 m/s2, and the peak acceleration response in the Z direction reaches 18.01 m/s2.
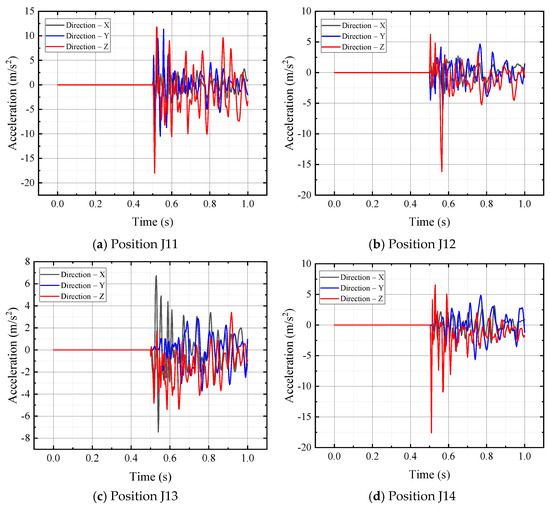
Figure 9.
Time–history curves of column acceleration responses at different positions.
The strain response time–history curves at positions J7, J8, J9, and J10 are shown in Figure 10. In the horizontal direction of the platform, the peak strain responses of the foundation beams at positions J7 and J8 are relatively similar, with both being dominated by compressive strain. The peak strain reaches 85 με at position J7 and 81 με at position J8. In the vertical direction of the platform, the foundation beam at position J10 exhibits the maximum peak strain response of 100 με, whereas the beam at position J9 shows the minimum peak strain response of 50 με.
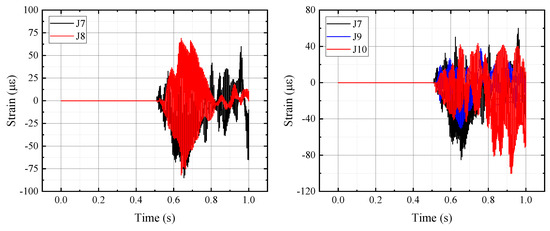
Figure 10.
Time–history curves of strain responses of deck foundation beams at different locations.
The strain response time–history curves at positions J12 to J15 are shown in Figure 11. The maximum strains of the column structures at positions J12, J13, and J14 are compressive, while at position J15, the maximum strain is dominated by tension. At position J12, the peak strain response reaches 227 με, representing the maximum among the measured positions. Furthermore, the strain of the column structure at position J14 is greater than that of the column structure at position J15.
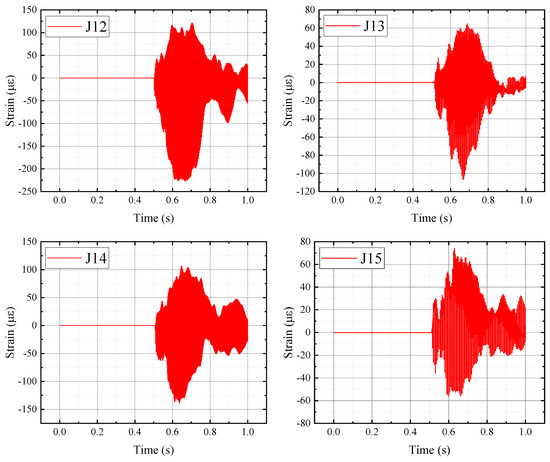
Figure 11.
Time–history curves of strain responses of column structures at different locations.
3.3. Dynamic Response of the Lower Jacket Structure
The time–history curves of acceleration responses in the X, Y, and Z directions at positions J16 and J17 are shown Figure 12. During the float-over installation and lowering process of the offshore converter platform, the lower jacket, as the key load-bearing structure responsible for transferring the loads of the topside platform, exhibits significant acceleration response characteristics in the Z direction, showing the maximum dynamic response. A comparative analysis of the acceleration responses of pile legs at different positions reveals that the Z-direction peak acceleration at position J16 reaches 31.55 m/s2, which is markedly higher than the 23.92 m/s2 recorded at position J17. In addition, the pile leg at position J17 also exhibits a relatively high level of acceleration response in the Y direction, with a peak value of 21.35 m/s2, reflecting the dynamic stress characteristics of the pile leg under lateral loading at this position.
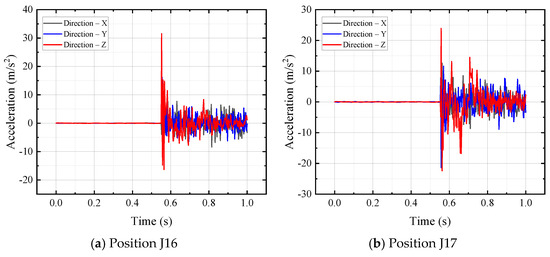
Figure 12.
Time–history curves of acceleration responses of the main pile legs at different locations.
During the float-over installation and lowering process, the loads carried by the lower jacket are transferred to the bottom pile legs through the spatial truss system. Hence, it is essential to investigate and analyze the acceleration responses of the truss structure. The time–history curves of the acceleration responses in the X, Y, and Z directions at the positions J18, J19, and J20 of the spatial truss structure are shown in Figure 13. Through comparative analysis of the three-directional acceleration data at monitoring points J18, J19, and J20, it is found that the acceleration responses at all three positions are most significant in the Z direction, reflecting the dominant role of vertical dynamic loads during the float-over mating process. Among them, the Z-direction acceleration response at position J19 reaches a peak value of 7.67 m/s2, which is significantly higher than the 4.42 m/s2 at position J18 and the 3.19 m/s2 at position J20, forming a distribution characteristic where the response value at the central monitoring point is higher than those at both sides. This is closely related to the load-bearing characteristics of the truss structure. Meanwhile, at position J20, the Z-direction acceleration during the contact collision process exhibits periodic peak fluctuations, with a trend of gradual attenuation.
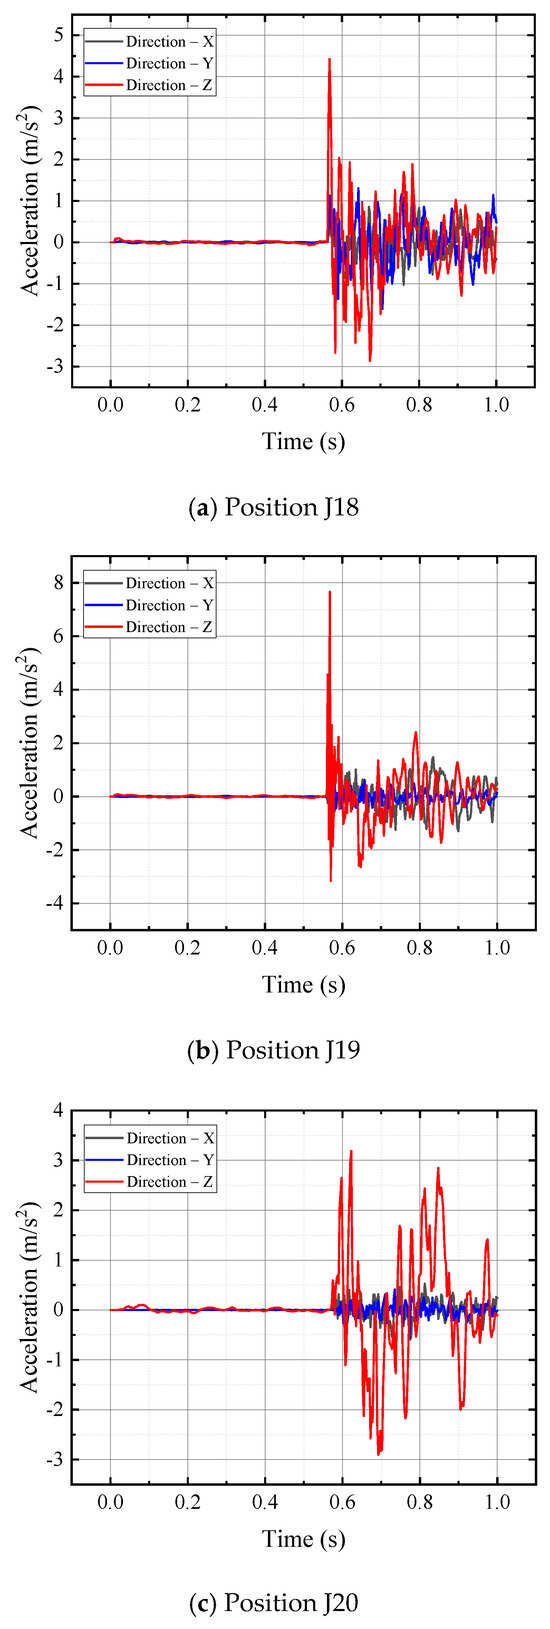
Figure 13.
Time–history curves of acceleration responses at various positions of the truss structure.
The stress response time–history curves at positions J16–J20 are shown in Figure 14 and Figure 15. The peak strain response of the pile leg at position J16 reaches 1113 με, which is significantly greater than that of the pile leg at position J17, and both maximum strains are compressive strains. The peak strain responses at J18, J19, and J20 are similar, with alternating tensile and compressive strains, and the maximum compressive and tensile strain peaks are close. Through the analysis of strain responses at different positions of the lower jacket, it can be concluded that during the float-over installation and lowering process of the offshore converter platform, the pile legs of the jacket, due to the instantaneous restructuring of the load-bearing system and the dynamic redistribution of loads, exhibit abrupt changes in their strain response characteristics, with peak values reaching 1100 με. Since the weight of the topside platform module is mostly concentrated in the middle, the strain of the pile legs at the mid-span positions is greater than that of the pile legs at the edge positions. The strain of the truss structure in the lower jacket is smaller compared with that of the pile legs. Due to the complex mechanical effects induced by contact collisions, the truss structure experiences high-frequency vibrations in three-dimensional space. During these vibrations, the cyclic deformation of the structure leads to alternating tensile and compressive strains with nearly equal amplitudes, exhibiting distinctive dynamic mechanical response characteristics.
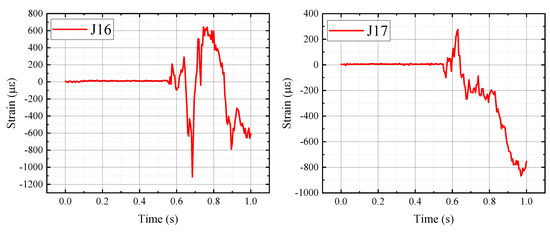
Figure 14.
Time–history curves of strain responses of main pile legs at different positions of the jacket.
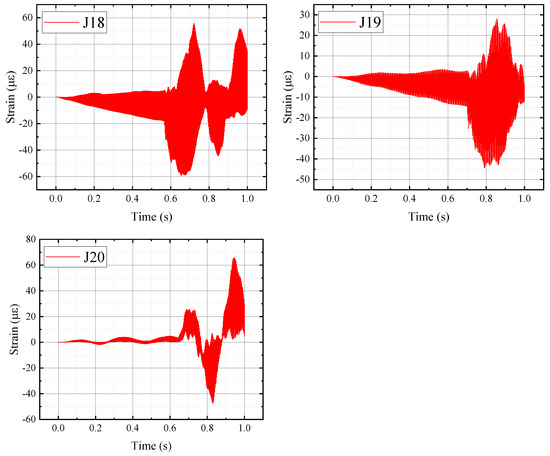
Figure 15.
Time–history curves of strain responses of the jacket truss at different positions.
4. Conclusions
This study investigated the dynamic responses of an offshore converter platform subjected to high-frequency vibration excitation, induced by contact collisions during the float-over installation and lowering process. Based on the integrated numerical simulation results, the coupled dynamic behaviors of the topside platform, converter valve equipment, and lower jacket were analyzed. The main conclusions are summarized as follows:
- (i)
- The converter valve equipment is a bottom-fixed, slender and flexible cantilever structure. This structural feature has a significant influence on its acceleration response, but a limited effect on stress and strain. Among the three-directional accelerations of the converter valve equipment, the Z-direction acceleration response is the most prominent, and the Z-direction acceleration amplitude at the top position exceeds that at the bottom position by about 20%. Meanwhile, the Y-direction acceleration at the bottom of the converter valve equipment in the edge position is greater than that at the mid-span position. The stress and strain responses at the bottom of the converter valve equipment, where it connects with the deck, are greater than those at the top position.
- (ii)
- The platform module has a cantilever structure extending outward along the Y-direction. This structural characteristic has a significant influence on acceleration, while its effect on stress and strain is limited. The acceleration of the deck foundation beam at the edge position is about 47% higher than that of the mid-span foundation beam. Due to the arrangement of converter valve equipment on the first-layer deck foundation beam, its acceleration vibration frequency is 15% faster than that of other floors. Under comparable weight conditions, stress and strain exhibit an increasing trend with the rise in height. The Z-direction acceleration of the main column structure of the platform module is the largest, while for other column structures, the X-direction and Z-direction accelerations are close.
- (iii)
- The pile legs of the jacket structure exhibit pronounced stepwise variations in dynamic response when subjected to transient impact loads induced by contact collisions. The dynamic response of the pile legs at the mid-span position is about 25% greater than that at the edge positions, forming a non-uniform response characteristic of “strong at the mid-span and weak at the edges”. Meanwhile, as it is necessary to reserve space for barge entry to carry out float-over installation, the top of the jacket structure is formed by a Y-Z plane composed of columns and braces. This configuration results in relatively large X-direction and Y-direction accelerations of the main pile legs, reaching about half of the peak of Z-direction acceleration.
However, this study also has certain limitations. The structural modeling does not explicitly account for fluid–structure interaction or barge hydrodynamics; the contact–collision process is imposed via prescribed docking kinematics rather than being coupled to vessel motions, which may underestimate added-mass and radiation-damping effects near impact. The material models and connections are simplified (predominantly elastic), the boundary conditions are idealized, and validation covers only a limited set of loading cases; broader experimental calibration across more operating conditions would help bound model error and improve external validity.
Author Contributions
Conceptualization, Z.J., W.W., T.W., Z.S. and B.Z.; methodology, Z.J. and C.B.; validation, B.Z. and Z.S.; formal analysis, Z.S. and G.D.; investigation: C.B.; resources, G.D. and C.B.; data curation, Z.J., W.W., T.W. and B.Z.; writing—original draft preparation, Z.J., W.W. and B.Z.; writing—review and editing, C.B. and G.D.; supervision, C.B. and G.D.; project administration, G.D.; All authors have read and agreed to the published version of the manuscript.
Funding
This research was funded by the Major Scientific and Technological Project of Power China Huadong Engineering Corporation Limited (grant nos. KY2023-ZD-06) and the National Key Research and Development Program of China (grant nos. 2021YFB2400605).
Data Availability Statement
The original contributions presented in the study are included in the article, and further inquiries can be directed to the corresponding author.
Conflicts of Interest
Authors Zhenqiang Jiang and Zhenzhou Sun were employed by the company Power China Huadong Engineering Corporation. Authors Weiwei Wu and Tianchai Wang were employed by the company China Power Construction (Wenzhou) Green Energy Development Co., Ltd. The remaining authors declare that the research was conducted in the absence of any commercial or financial relationships that could be construed as a potential conflict of interest.
References
- Hong, S.; Mc Morland, J.; Zhang, H. Floating offshore wind farm installation: Challenges and opportunities—A comprehensive survey. Ocean Eng. 2024, 304, 117793. [Google Scholar] [CrossRef]
- Bi, C.-W.; Zhang, Y.-M.; Ma, C.; Cui, S.-Q. Experimental study on the hydrodynamic responses of a novel platform integrating vertical-axis wind turbine with a fish cage in regular waves. Aquacult. Eng. 2025, 111, 102585. [Google Scholar] [CrossRef]
- Tang, G.; He, Z.; Pang, H. R&D and application of voltage sourced converter based HVDC engineering technology in China. J. Mod. Power Syst. Clean Energy 2014, 2, 1–15. [Google Scholar]
- Ooi, B.T.; Wang, X. Boost-type PWM HVDC Transmission System. IEEE Trans. Power Deliv. 1991, 6, 1557–1563. [Google Scholar] [CrossRef]
- Ooi, B.T.; Wang, X. Voltage Angle Lock Loop Control of the Boost Type PWM Converter for HVDC Application. IEEE Trans. Power Electron. 1990, 5, 229–235. [Google Scholar] [CrossRef]
- Nguyen, T.H.; Quach, N.T. A Hybrid HVDC Converter Based on M2C and Diode Rectifiers Without DC Capacitors for Offshore Wind Farm Integration. Int. J. Electr. Power Energy Syst. 2021, 133, 107217. [Google Scholar] [CrossRef]
- Kim, H.S.; Jeong, C.W.; Kim, H.E. Modeling and Simulation of Modular Multilevel Converter Based-HVDC Connecting to Offshore Wind Farms. Adv. Mater. Res. 2014, 905, 421–426. [Google Scholar] [CrossRef]
- Wang, W.; Li, G.; Guo, J. Large-Scale Renewable Energy Transmission by HVDC: Challenges and Proposals. Engineering 2022, 19, 252–267. [Google Scholar] [CrossRef]
- Lan, D.; Li, J.; Chen, J.; Xu, Q. Floor response spectra of offshore electrical platform under sea waves and earthquake. Ocean Eng. 2022, 265, 112623. [Google Scholar] [CrossRef]
- Luo, H.; Liu, Q.; Bai, X.; Xie, P.; Zhang, L. Numerical and experimental investigations on dynamic response of twin-barge floatover system in standby phase. Ocean Eng. 2024, 309, 118362. [Google Scholar] [CrossRef]
- Sun, Z.Z.; Li, W.; Zhao, X.S. Simplified Method for Vibration Model of Converter Valve in Offshore HVDC Substation Based on Response Surface. Front. Energy Res. 2022, 10, 909377. [Google Scholar] [CrossRef]
- Karpenko, M.; Ževžikov, P.; Stosiak, M.; Skačkauskas, P.; Borucka, A.; Delembovskyi, M. Vibration Research on Centrifugal Loop Dryer Machines Used in Plastic Recycling Processes. Machines 2024, 12, 29. [Google Scholar] [CrossRef]
- O’Neill, L.A.; Fakas, E.; Cassidy, M. A Novel Application of Constrained NewWave Theory for Floatover Deck Installations. In Proceedings of the ASME 23rd International Conference on Offshore Mechanics & Arctic Engineering (OMAE), Vancouver, BC, Canada, 22 December 2004; pp. 165–174. [Google Scholar]
- O’Neill, L.A.; Pinna, R.; Fakas, E.; Walsh, T. Floatover Deck Installation: Case Study—Structural Efficiency of Longitudinally and Transversely-Recessed Structures. In Proceedings of the OMAE, Vancouver, BC, Canada, 1 January 2004. [Google Scholar]
- Ji, C.; Halkyard, J. Spar Deck Float-Over Feasibility Study for West Africa Environment Condition. In Proceedings of the OMAE, Hamburg, Germany, 4–9 June 2006; pp. 151–159. [Google Scholar]
- Berhault, C.; Gubrin, P.; Foulhoux, L. Optimization of an Integrated Deck Installation Process Using a Fully Coupled Hydrostructures Time Domain Analysis. In Proceedings of the Offshore Technology Conference, Houston, TX, USA, 4–7 May 1998. [Google Scholar]
- Hu, Z.; Li, X.; Zhao, W.; Wu, X. Nonlinear Dynamics and Impact Load in Float-over Installation. Appl. Ocean Res. 2017, 65, 60–78. [Google Scholar] [CrossRef]
- Chen, M.; Zou, M.; Zhu, L.; Li, L.; Sagrilo, L. A fully coupled time domain model capturing nonlinear dynamics of float-over deck installation. Ocean Eng. 2024, 293, 116721. [Google Scholar] [CrossRef]
- Zhou, Z.; Wang, H.; Zhang, B.; Zheng, Z.; Chang, Z. Multibody dynamic analysis of float-over installation based on active multi-dimensional motion compensation equipment. Ocean Eng. 2023, 285, 115330. [Google Scholar] [CrossRef]
- Lan, D.; Li, J.; Xu, Q.; Chen, J. Influence of the offshore electrical platform on the dynamic responses of converter valve under sea waves and earthquakes. Ships Offshore Struct. 2022, 17, 2531–2544. [Google Scholar] [CrossRef]
- Zhao, S.; Meng, X.; Gao, Z.; Li, H. Numerical modeling of nonstationary hydrodynamic forces and induced motions of a coupled offshore floating installation system. Ocean Eng. 2022, 246, 110618. [Google Scholar] [CrossRef]
- Chen, M.; Ouyang, M.; Li, T.; Zou, M.; Ye, J.; Tian, X. Numerical modelling of a catamaran float-over deck installation for a Spar platform with complex hydrodynamic interactions and mechanical couplings. Ocean Eng. 2023, 287, 115905. [Google Scholar] [CrossRef]
- Wang, R.; Shi, Q.; Tian, X.; Guo, X.; Li, X.; Yang, J. Dynamic responses of a twin-DP-barge float-over installation system with flexible connections. J. Ocean Eng. Sci. 2025, 10, 353–365. [Google Scholar] [CrossRef]
- Ullah, N.; Manderson, P.; Li, L.; Johanning, L. Coupled numerical model for the nonlinear dynamics of a floating installation system with suspended payload. Ships Offshore Struct. 2024, 19, 1979–1995. [Google Scholar] [CrossRef]
- Luo, H.; Zhang, L.; Liu, F.; Qin, L.; Bai, X. Numerical analysis on coupling dynamic response of twin barge–topside float-over during load transfer stage in beam waves. Int. J. Offshore Polar Eng. 2024, 34, 138–145. [Google Scholar] [CrossRef]
- Chen, M.; Taylor, E.R.; Choo, S.Y. Investigation of the Complex Dynamics of Float-Over Deck Installation Based on a Coupled Heave-Roll-Pitch Impact Model. Ocean Eng. 2017, 137, 262–275. [Google Scholar] [CrossRef]
- Wang, K.; Luo, K.; Tian, Q. Nonsmooth Model Order Reduction for Transient Tire–Road Dynamics of Frictional Contact with ALE Formulations. Nonlinear Dyn. 2024, 112, 18847–18868. [Google Scholar] [CrossRef]
- Tao, W.; Sun, J.; Wang, S.; Che, J.; Wei, Y. Hybrid Laplace-time domain model for coupled dynamic analysis of multibody mating system in topside float-over installations. Ocean Eng. 2025, 316, 119918. [Google Scholar] [CrossRef]
- Zhao, S.; Meng, X.; Li, H.; Li, D.; Fu, Q. Continuous multi-body dynamic analysis of float-over deck installation with rapid load transfer technique in open waters. Ocean Eng. 2021, 224, 108729. [Google Scholar] [CrossRef]
- Gao, L.; Zhu, T.; Lin, B. Similarity Techniques in Structural Dynamic Model Testing. J. Dalian Univ. Technol. 2000, 40, 1–8. [Google Scholar]
- Zhu, T. Similarity Issues in Structural Dynamic Models and Structural Dynamic Testing Techniques. Ph.D. Thesis, Dalian University of Technology, Dalian, China, 2004. [Google Scholar]


Disclaimer/Publisher’s Note: The statements, opinions and data contained in all publications are solely those of the individual author(s) and contributor(s) and not of MDPI and/or the editor(s). MDPI and/or the editor(s) disclaim responsibility for any injury to people or property resulting from any ideas, methods, instructions or products referred to in the content. |
© 2025 by the authors. Licensee MDPI, Basel, Switzerland. This article is an open access article distributed under the terms and conditions of the Creative Commons Attribution (CC BY) license (https://creativecommons.org/licenses/by/4.0/).