1. Introduction
The global push towards renewable energy has intensified as nations seek to combat climate change and decrease fossil fuel dependency. Organic waste has become a particularly attractive renewable resource, recognized for its abundance and multifaceted potential to address environmental challenges and promote sustainable waste management [
1]. By leveraging organic waste, countries can make significant progress across multiple sustainable development objectives, simultaneously advancing environmental protection, economic development, and social progress [
2].
Anaerobic digestion (AD) of organic materials represents a pivotal method for biogas production, widely acknowledged for its potential to mitigate greenhouse gas (GHG) emissions [
3]. This innovative approach effectively addresses environmental challenges associated with traditional waste management and mineral fertilizer production [
4]. Extensive research has demonstrated that AD-based energy generation consistently yields lower GHG emissions compared to fossil fuel alternatives [
5,
6]. However, the performance of AD systems is inherently complex, influenced by a diverse range of variables including feedstock composition, operational parameters, biogas utilization strategies, and digestate treatment methodologies [
7], as well as the specific energy technologies being replaced [
8,
9]. Methane-rich biogas emerges as a promising fossil fuel substitute, offering versatile applications through direct combustion in on-site cogeneration facilities for heat and electricity generation, or through upgrading to biomethane as a natural gas replacement [
3]. Moreover, the digestate produced by AD systems presents a sustainable agricultural resource, potentially replacing conventional mineral fertilizers [
10] or serving as a source for solid fuel production [
11]. By integrating carbon capture technologies into the AD process, it becomes possible to separate and sequester CO
2, further enhancing the environmental benefits and reducing the overall carbon footprint of biogas production. The captured CO
2 can be strategically stored or repurposed across various industrial sectors, thereby contributing to the principles of a circular economy [
12].
Techno-economic analysis (TEA) is a systematic methodology that evaluates the economic feasibility and technical efficiency of processes or technologies by integrating engineering design, process modeling, and economic assessment to provide comprehensive evaluations of costs, benefits, and risks [
13]. For anaerobic digestion (AD) plant development, TEA modeling serves as an essential tool that combines engineering principles, process modeling, and economic analysis to systematically assess the financial implications, advantages, and risk factors of AD projects [
14]. Through TEA implementation, investors and developers gain valuable insights into the economic sustainability and technical capabilities of AD facilities [
15]. This approach facilitates design and operational optimization that improves efficiency while minimizing costs [
16]. Additionally, TEA modeling identifies and quantifies uncertainties, supporting evidence-based decision-making and effective risk management. The insights from TEA studies are instrumental in securing funding and policy support, as they demonstrate the economic and environmental benefits of AD technology, strengthening the case for sustainable energy investments [
17].
Previous studies have extensively explored techno-economic analyses (TEAs) of anaerobic digestion (AD) processes [
18,
19,
20,
21,
22,
23,
24,
25]. For instance, Lin et al. [
19] compared solid-state anaerobic digestion (SS-AD) and composting for yard trimmings, concluding that while composting offers a faster payback period and higher IRR, SS-AD may be more advantageous for centralized waste management due to lower operational costs and possible financial incentives. Another study by Hamedani et al. [
20] investigated the combined AD and composting approach, demonstrating that integrating a compost facility with a biogas plant enhances carbon credit earnings and overall profitability, achieving an IRR of 6–9% while also reducing emissions. The economic benefits are further amplified by selling digestate as fertilizer. Research by [
21] applied TEA modeling to assess co-digestion of cattle manure and wheat straw in small-to-medium dairy farms. The findings indicate that co-digestion improves economic performance over mono-digestion, with profitability heavily dependent on electricity prices and straw costs. Similarly, Ref. [
22] compared mono-digestion (dairy manure), binary mixtures (manure + corn stalk), and ternary mixtures (manure + corn stalk + tomato residues), revealing that the ternary blend under a CHP system delivers the best economic returns. Additionally, ref. [
24] evaluated AD-based cow manure management, analyzing three scenarios: mono-digestion, co-digestion with maize silage, and co-digestion with cow feed waste, sewage sludge, and returned dairy products. The third option proved most viable, yielding an NPV of MYR 1.28 million, an IRR of 14%, and a payback period of 6.56 years.
While traditional TEA methods provide robust assessments of AD systems, their practical application faces significant barriers. These methods often require specialized expertise in computational modeling, economics, and process engineering to configure parameters, interpret results, and operate complex simulation software. For end users—such as farmers, small-scale biogas plant operators, or policymakers—this creates a reliance on costly consultants or lengthy training periods, limiting broader adoption. To address these challenges, this study introduces an AI-agent framework designed to simplify techno-economic analysis (TEA) for anaerobic co-digestion plants. To our knowledge, no prior studies have applied AI-agent frameworks specifically to TEA of AD processes. AI-agent frameworks represent an emerging paradigm in computational modeling, leveraging artificial intelligence to automate complex analytical processes while maintaining rigorous technical standards. This intelligent system combines natural language processing with advanced simulation capabilities, enabling users to conduct sophisticated analyses through intuitive conversational interfaces rather than traditional software tools. The framework features an intuitive conversational interface that guides users through parameter provision and scenario description, while automating simulation workflows and data interpretation. This approach enables stakeholders to generate actionable insights by simply inputting basic operational parameters (e.g., feedstock types and processing capacity), eliminating the need for specialized technical knowledge or complex software proficiency. Furthermore, the system significantly reduces computational complexity by integrating multiple simulation stages—including feedstock optimization, biogas yield prediction, and cost–benefit analysis—into a seamless automated pipeline, thereby removing dependence on modeling experts for manual intervention.
2. Material and Method
2.1. Modeling Overview
The advanced techno-economic assessment (TEA) model developed for the biogas facility comprehensively integrates anaerobic digestion (AD), combined heat and power (CHP), carbon capture, and digestate treatment technologies into a unified analytical framework. This sophisticated model evaluates multiple financial dimensions including feedstock gate fees, capital expenditures, operational costs, and diverse revenue streams derived from biogas production, captured carbon, and digestate-derived products. The methodology has been strategically organized into three interconnected process segments: the AD process, carbon capture process, and digestate treatment process. The AD process encompasses several critical phases: feedstock selection and characterization, precision mixing and feeding systems, core anaerobic reaction mechanics, and optimized biogas utilization pathways. The carbon capture process incorporates specialized CO
2 separation techniques, liquefaction systems, and cryogenic processing capabilities. The digestate treatment process transforms residual materials into marketable products. This holistic analytical approach ensures rigorous evaluation of each operational stage—from initial feedstock reception through to the commercialization of biogas, CO
2, and processed digestate—providing comprehensive insights into the plant’s overall techno-economic performance.
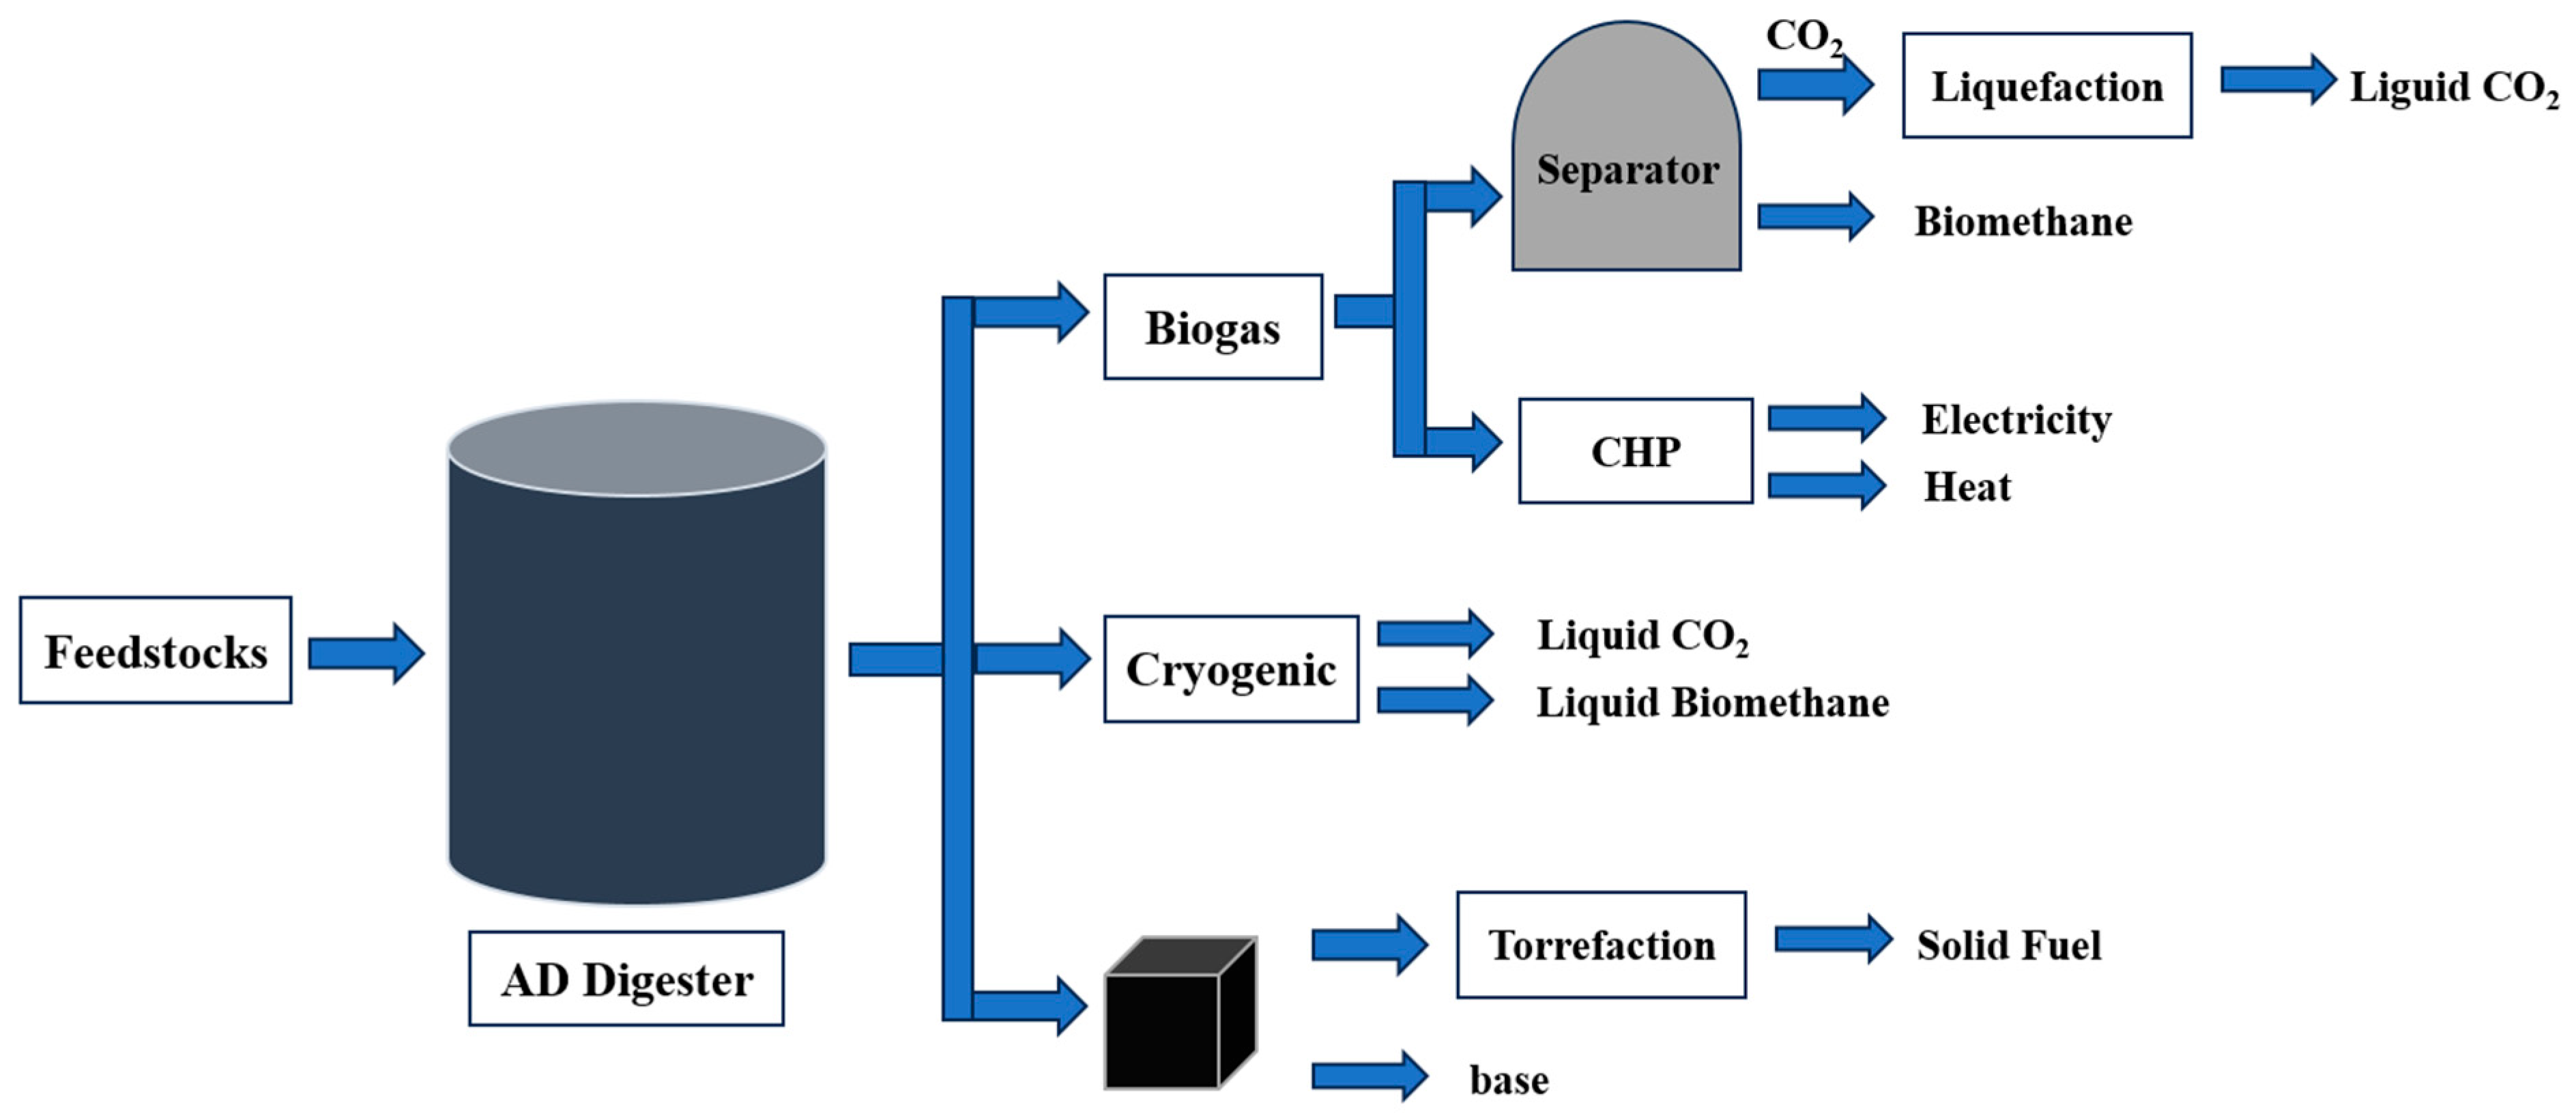
Figure 1 illustrates the integrated system architecture of the AD plant. The AI-agent interface enables dynamic interaction with users, interpreting their specific scenario descriptions and calculation requirements. This functionality allows the system to reconfigure computational modules across different processing stages, activate appropriate calculation models, and ultimately deliver customized TEA results along with comprehensive assessment reports tailored to user specifications.
2.2. Systems and Test Scenarios Definition
Figure 1 illustrates the comprehensive biogas production system where agricultural biomass serves as feedstock for the anaerobic digestion (AD) reactor. Within this controlled environment, specialized microorganisms decompose organic materials through biological reactions in oxygen-free conditions, yielding biogas—a gaseous mixture predominantly containing methane (CH
4) and carbon dioxide (CO
2). A portion of the generated biogas is channeled to the combined heat and power (CHP) unit, which converts the gas into simultaneous electricity and thermal energy outputs. Following energy extraction, the remaining biogas undergoes CO
2 separation via advanced membrane technology that exploits selective permeability principles, allowing CO
2 molecules to traverse the membrane while containing methane. The isolated CO
2 subsequently undergoes liquefaction for economical storage and transportation. The purified methane fraction, designated as biomethane, possesses sufficient quality for direct injection into existing natural gas infrastructure networks. Alternatively, the plant may employ cryogenic separation techniques, which achieve gas component isolation by subjecting biogas to extremely low temperatures that exploit different condensation points of constituent gases. Further value addition occurs through torrefaction, wherein digestate residue from the AD system undergoes controlled thermal treatment between 200 °C and 300 °C in an oxygen-depleted atmosphere. This thermal conditioning transforms digestate into torrefied biomass—a refined solid fuel product exhibiting enhanced stability, water resistance, and superior logistics properties. Detailed technical specifications for these processes have been documented in previous research [
26].
In this research, the developed AI agent was rigorously evaluated across four distinct operational scenarios for AD power plants.
Scenario 1: Investigates a site utilizing a feedstock combination of maize, sugar beet pulp, and cow manure (designated as ‘mix1’), incorporating membrane-based CO2 separation and liquefaction processes.
Scenario 2: Evaluates a feedstock blend consisting of maize, rye, and beet pulp (referred to as ‘mix2’), implementing CO2 capture through membrane-based technology and liquefaction.
Scenario 3: Examines mix1 feedstock configuration while employing cryogenic processes for CO2 capture.
Scenario 4: Represents the baseline digestate treatment approach, utilizing mix1 with membrane-based CO2 capture and liquefaction, where digestate undergoes separation into solid and liquid fractions. The solid component can be composted or applied as soil amendment, while the liquid fraction serves as nutrient-rich fertilizer.
These scenarios aim to assess the impact of different feedstock compositions, CO2 capture technologies, and digestate management strategies on the techno-economic performance of integrated AD systems.
2.3. The Anaerobic Digestion Process
2.3.1. Feedstocks
The feedstock specifications for both anaerobic co-digestion facilities were established through comprehensive experimental analysis, with detailed characterization provided in
Table 1.
Table 1 offers a comparative assessment of four distinct feedstock materials utilized across the operational sites. Maize and rye demonstrate superior composition profiles, exhibiting the highest concentrations of dry matter and volatile solids (VSs). This superior composition translates to exceptional productivity, with maize generating 226.2 m
3/t of biomethane and rye yielding a comparable 222.7 m
3/t. Sugar beet pulp occupies an intermediate position with more modest dry matter and volatile solid content, resulting in biogas production of 171.5 m
3/t. Cow manure consistently exhibits the lowest performance metrics across all analytical parameters, with biomethane generation limited to 103.5 m
3/t.
2.3.2. Feedstock Blending and Feeding
On both sites, feedstock feeding is a crucial step where materials including maize, rye, and sugar beet pulp are initially loaded into feed hoppers, then gradually fed into the digester via a screw mechanism throughout the day. This continuous feeding process is essential for maintaining optimal digester conditions and ensuring efficient anaerobic digestion performance. Additionally, manure is either loaded into a feeding system or directly pumped into the digester. The power consumption for operating the AD reactor system is primarily attributed to the energy requirements for feeding and pumping feedstocks [
26]. The process requires approximately 7.2 kWh per ton of input slurry [
26]. Therefore, to calculate the power consumption for feeding feedstocks into the AD reactor, Equation (1) can be utilized.
in which
(kWh) is the power required for feeding and pumping feedstocks,
(
t) is the total amount of feedstocks, and
(
t) is the total amount of water.
2.3.3. The Digester
During the AD process, microorganisms decompose organic matter under oxygen-free conditions through four main stages: hydrolysis (decomposing complex materials), acidogenesis (generating volatile fatty acids and gases), acetogenesis (producing acetic acid and additional gases), and methanogenesis (forming methane and water). For technical analysis and biomethane production calculations in this work, the modified Hill’s model [
27] was employed. The modified Hill’s model is an adaptation of the original Hill’s AD model [
28] and simplifies the complex biochemical reactions in anaerobic digestion into key microbial interactions between acid-forming bacteria (acidogens) and methane-forming bacteria (methanogens). Biogas production calculations using the modified Hill’s model are based on mass balances and reaction kinetics for different components in the AD process, with the essential equation summarized in Equation (2).
Mass balance of biodegradable volatile solids (BVSs):
This equation calculates the rate of change in BVS, where is the concentration of BVS, is the feed rate, V is the reactor volume, and is the growth rate of acidogens.
Mass balance of volatile fatty acids (VFAs) is calculated using Equation (3).
Equation (3) models the accumulation of VFAs, where is the concentration of VFAs and is the growth rate of methanogens.
The mass balance of acidogens is shown in Equation (4).
Equation (4) calculates the concentration of acidogens, where is the death rate of acidogens and is the retention time ratio.
Similarly, the mass balance of methanogens is as follows:
Equation (5) calculates the concentration of methanogens, where is the death rate of methanogens.
The methane gas flow rate is calculated using Equation (6).
Equation (6) is the key equation to predict methane gas flow, where is a yield parameter related to methane production and is the methanogen growth rate.
The reaction rate for acidogens is calculated by Equation (7).
The reaction rate for methanogens is as shown in Equation (8).
Equation (8) models the growth rate of methanogens, where is the maximum reaction rate for methanogens and is the half-saturation constant for VFAs.
The capital cost (£) of the AD digester in 2013 was quantified by employing the correlation developed by [
29] (Equation (9)).
where
and
are the volume of digesters in the plant.
To update this cost to August 2024, the Chemical Engineering Plant Cost Index (CEPCI) values are used. The CEPCI for 2013 was 567.3, and for August 2024, it is 790.7. The updated capital cost (£) is then calculated by Equation (10).
The maintenance and operation cost (£) is estimated to be 7% of the updated capital cost according to [
29], as shown in Equation (11).
2.3.4. Biogas Utilization
Biogas utilization through the CHP pathway is an efficient and sustainable method to maximize the energy output from biogas. The biomethane is used as a fuel to generate both electricity and heat simultaneously. In the current work, the power generated is used on-site, while the excess biomethane is injected into the natural gas pipeline network for distribution and use elsewhere.
The capital cost (£) of the CHP process in 2017 was quantified by employing the correlation developed by [
30], as shown in Equation (12).
The power size depends on the site’s power consumption ().
In order to update this cost to August 2024, the CEPCI values are used. The CEPCI for 2017 was 567.5, and for August 2024, it is 790.7. The updated capital cost (£) is then calculated by Equation (13).
According to [
31] and as shown in Equation (14), the maintenance and operation cost (£) is estimated to be 3.6% of the power generated from CHP.
2.4. Carbon Capture Process
2.4.1. CO2 Separation
This study employs membrane-based technology for CO
2 separation from biogas due to its multiple advantages, including reduced energy requirements, high methane recovery rates, modular design flexibility, and economical investment and operating expenses [
32]. Membrane-based systems generally demonstrate lower capital costs relative to alternative biogas upgrading techniques [
32]. For biogas facilities generating 500 m
3/h of biomethane, the typical investment cost for membrane-based technology spans from EUR 3500 to EUR 3700 per m
3/h of biomethane capacity, with operational expenses ranging from EUR 6.5 to EUR 10.1 per m
3/h of biomethane [
32]. These expenditures encompass membrane modules, gas compression equipment, and essential pre-treatment processes including gas drying and H
2S removal. Standard power requirements for membrane systems in biogas upgrading applications range from 0.25 to 0.46 kWh per cubic meter of biomethane produced, depending on the level of compression required for gas permeation and the number of stages in the process [
32].
2.4.2. CO2 Liquefaction
CO
2 liquefaction compresses and cools carbon dioxide gas until it transforms into a liquid state, suitable for storage or transport. The process involves multi-stage compression to increase pressure, followed by cooling using refrigerants like ammonia to condense the CO
2. Impurities such as water or nitrogen are removed to prevent freezing or contamination [
33]. According to [
33], the CO
2 liquefaction cost is dependent on the delivery pressure and CO
2 purity; the correlation between the capital cost of liquefaction
(£) and delivery pressure
and CO
2 purity ξ is found using Equation (15).
The maintenance and operation costs (£/y) are dependent on the delivery pressure and CO
2 purity, which can be expressed by Equation (16).
Power usage in this process is calculated using Equation (17).
2.4.3. Cryogenic Gas Separation
An alternative technology for producing liquefied biomethane, suitable as a liquefied natural gas (LNG) substitute for sites with limited grid connectivity, is the cryogenic process. Cryogenic biogas upgrading separates gases based on their condensation and sublimation temperatures through cryogenic distillation and anti-sublimation methods. Cryogenic distillation extracts both CO
2 and CH
4 in liquefied forms under high pressure and low temperature conditions, while anti-sublimation directly converts CO
2 from the gas to solid state [
34]. Capital costs for cryogenic distillation typically range from EUR 2300 to EUR 8600 per m
3/h of biomethane capacity [
34]. This study adopts EUR 5300 per m
3/h of biomethane capacity, with maintenance and operational costs at 7% of capital expenditure. Energy consumption is relatively high due to gas compression and cooling requirements, ranging between 0.25 and 2.07 kWh per Nm
3 of raw biogas [
34], with 0.5 selected for this work.
2.5. Digestate Treatment Process
This study considers two digestate treatment methods: standard digestate treatment and torrefaction. Standard digestate treatment involves separating digestate into solid and liquid fractions. Torrefaction is a thermal process that heats biomass to temperatures between 200 °C and 300 °C in oxygen-free conditions, producing carbonized solid fuel with enhanced properties including higher energy density and improved grindability [
11]. Torrefaction offers several advantages for treating AD digestate, primarily by significantly enhancing fuel properties through an increased higher heating value (HHV), creating a more efficient and valuable energy source. The process also effectively reduces moisture content, simplifying storage and transportation logistics.
The mass yield is determined based on Equation (18).
where
is the mass of raw material before torrefaction and
is the mass of carbonized solid fuel after torrefaction.
According to experimental findings [
11], mass yield depends on torrefaction temperature and residence time. To derive an equation calculating mass yield using these parameters, regression analysis is required. Given the non-linear relationship, multiple polynomial regression is appropriate. Python 3.10 was employed to perform this analysis and determine the best-fitting equation using Equation (19).
where
T is the torrefaction temperature and t is the torrefaction residence time.
The capital cost, operation cost, and electricity utility were dependent on the torrefaction capacity according to the study in [
35]. CEPCI values are used to update capital cost to August 2024, as shown in Equation (20).
where
is the torrefaction capacity.
The maintenance and operation cost per year is calculated by Equation (21).
The electricity usage per year is calculated by Equation (22).
2.6. Economic Evaluation
The economic evaluation of an anaerobic co-digestion plant with integrated carbon capture assesses capital and operational costs across multiple stages: anaerobic digestion, biogas utilization, CO
2 separation and liquefaction, and digestate treatment. The plant generates revenue primarily through biomethane and CO
2 sales. After biogas is upgraded to biomethane, the portion not used on-site for power generation can be sold by injecting excess biomethane into the natural gas grid or selling directly as renewable natural gas (RNG). This work considers topping up biomethane’s calorific value with propane to meet energy content requirements for grid injection. Revenue is calculated by determining the total value of biomethane or RNG based on production volume and market prices, then subtracting associated propane production costs. The propane volume required is calculated using Equation (23).
where
is the volume of propane,
is the target calorific value,
is the calorific value of biomethane, and
is the calorific value of propane.
The revenue from biomethane sales is calculated using Equation (24).
where
is the volume of excess biomethane produced and
is the current market price per unit of natural gas, which is approximately GBP 0.039/kWh [
36].
is the unit price of biomethane from the Green Gas Support Scheme (GGSS) [
37].
is the price per unit of propane.
The carbon dioxide separated during the biogas upgrading process (via membrane separation or cryogenic processes) can also be sold. Liquid CO2 has value in several industries, including food and beverage, chemical production, and enhanced oil recovery (EOR), or can be sold as negative emissions offsets if stored permanently. The revenue from CO2 sales depends on the volume of CO2 captured and its market price.
Revenue from CO
2 sales is shown in Equation (25).
where
is the volume of captured CO
2 and
is the market price per ton of liquid CO
2. The price of carbon dioxide in the UK has fluctuated over time. The carbon price per ton of carbon dioxide equivalent for the scheme year beginning on 1 January 2024 is GBP 64.90 [
38]. This is base-case value, and sensitivity analysis is performed later in the manuscript at around a 50% range of values.
The solid fuel generated from the torrefaction process can serve as a substitute for coal in power generation, offering a renewable and cleaner alternative. The revenue from solid fuel sales depends on the mass of solid fuel production and its market price, which is calculated by Equation (26).
2.7. Financial Indices
To evaluate the economic viability of the anaerobic co-digestion plant with integrated carbon capture, two key financial indexes are used: the NPV and IRR. These metrics provide insights into the project’s profitability and return on investment over its lifetime [
22].
The NPV is a financial metric that calculates the present value of all future cash flows over the project’s lifetime, discounted at a specified rate. It is a crucial indicator of a project’s profitability. The NPV is calculated using Equation (27) [
22].
where
is the initial investment,
is the net cash flow in year t, and r is the discount rate. Additionally, we use the interest rate as the discount rate in the current work, according to [
26], and
t is the number of years.
The NPV is calculated over the project’s lifetime, typically 20–25 years for AD plants. A positive NPV indicates that the project is expected to be profitable, while a negative NPV suggests that the project may not be economically viable.
The IRR is the discount rate at which the NPV of the project becomes zero. It represents the annualized effective compounded return rate that the project is expected to generate. The IRR is calculated by solving Equation (28) [
22].
2.8. Sensitivity Analysis Method
To assess the techno-economic viability of the AD plant, a robust sensitivity analysis was conducted using a “One-At-A-Time” (OAT) simulation approach. The study evaluated the project’s sensitivity to key parameters, particularly how variations in product price, tax rates, and interest rates influence economic performance. Variables were systematically varied within ±50% of their base-case values, providing a comprehensive assessment of potential financial outcomes. This sensitivity analysis quantified uncertainty and risks associated with the AD plant investment over a 20-year net present value (NPV) horizon, enabling better understanding of the project’s economic feasibility while accounting for inherent variability in critical financial parameters.
2.9. AI-Agent Framework
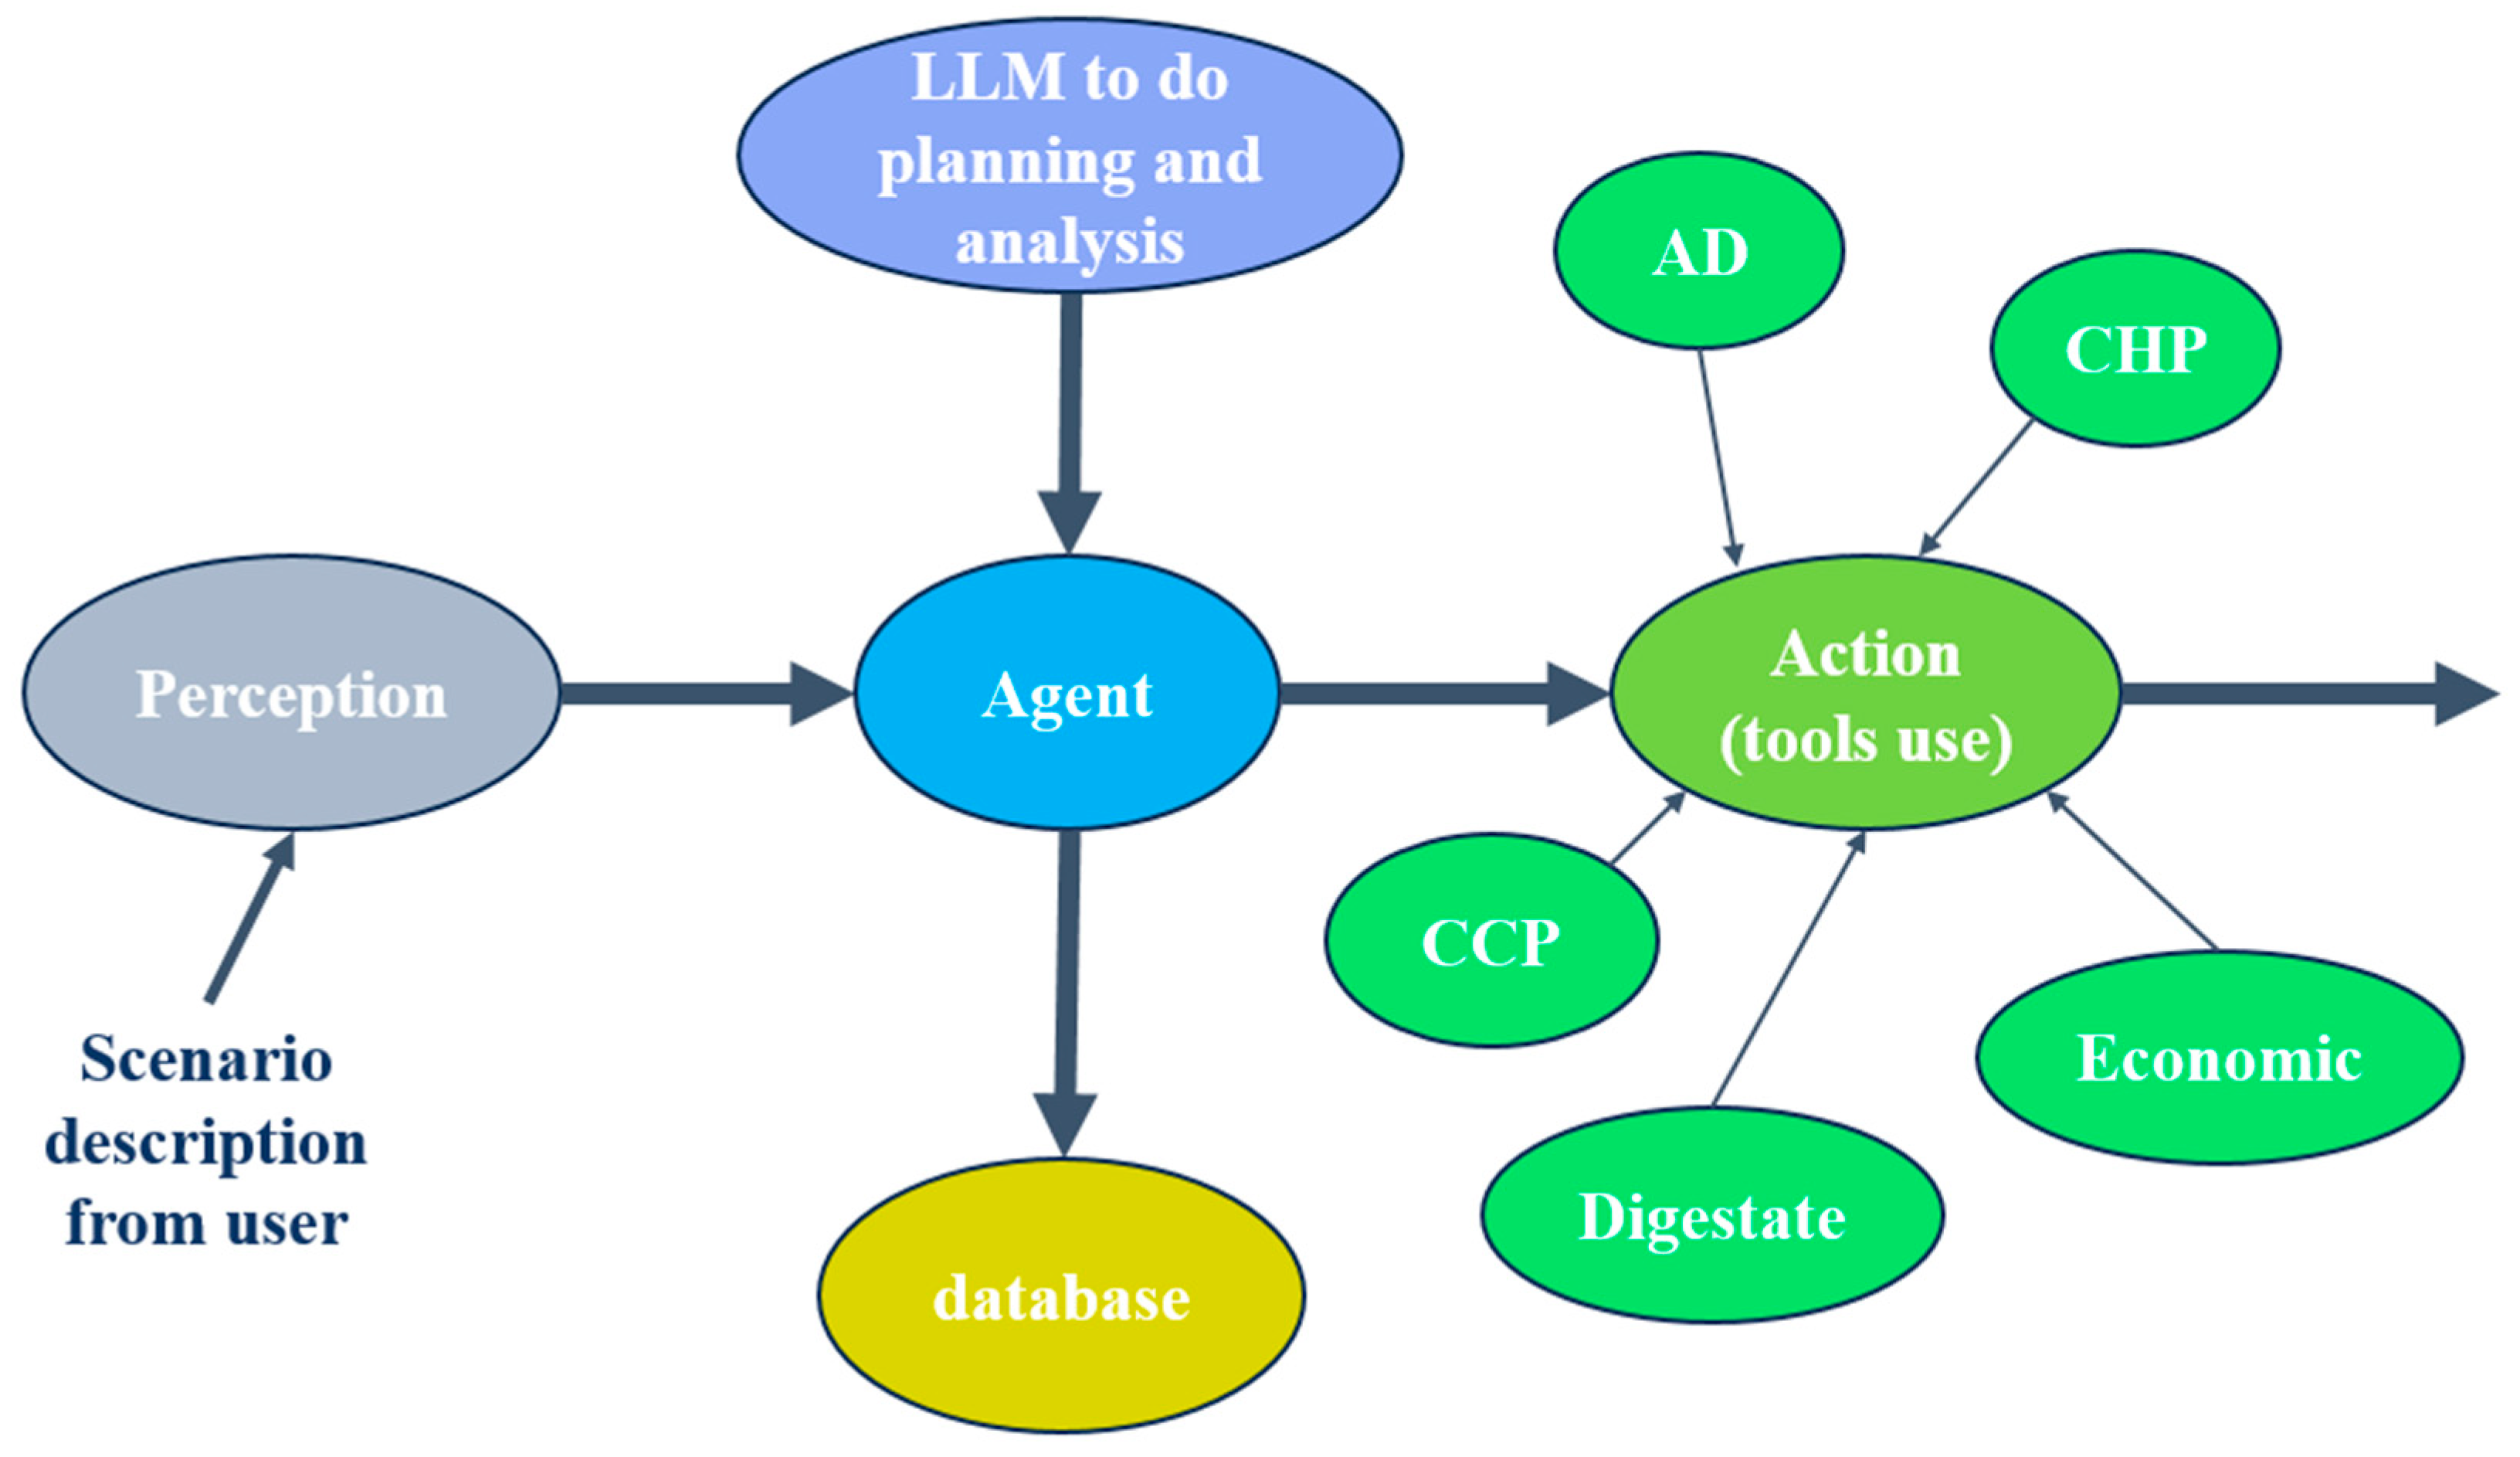
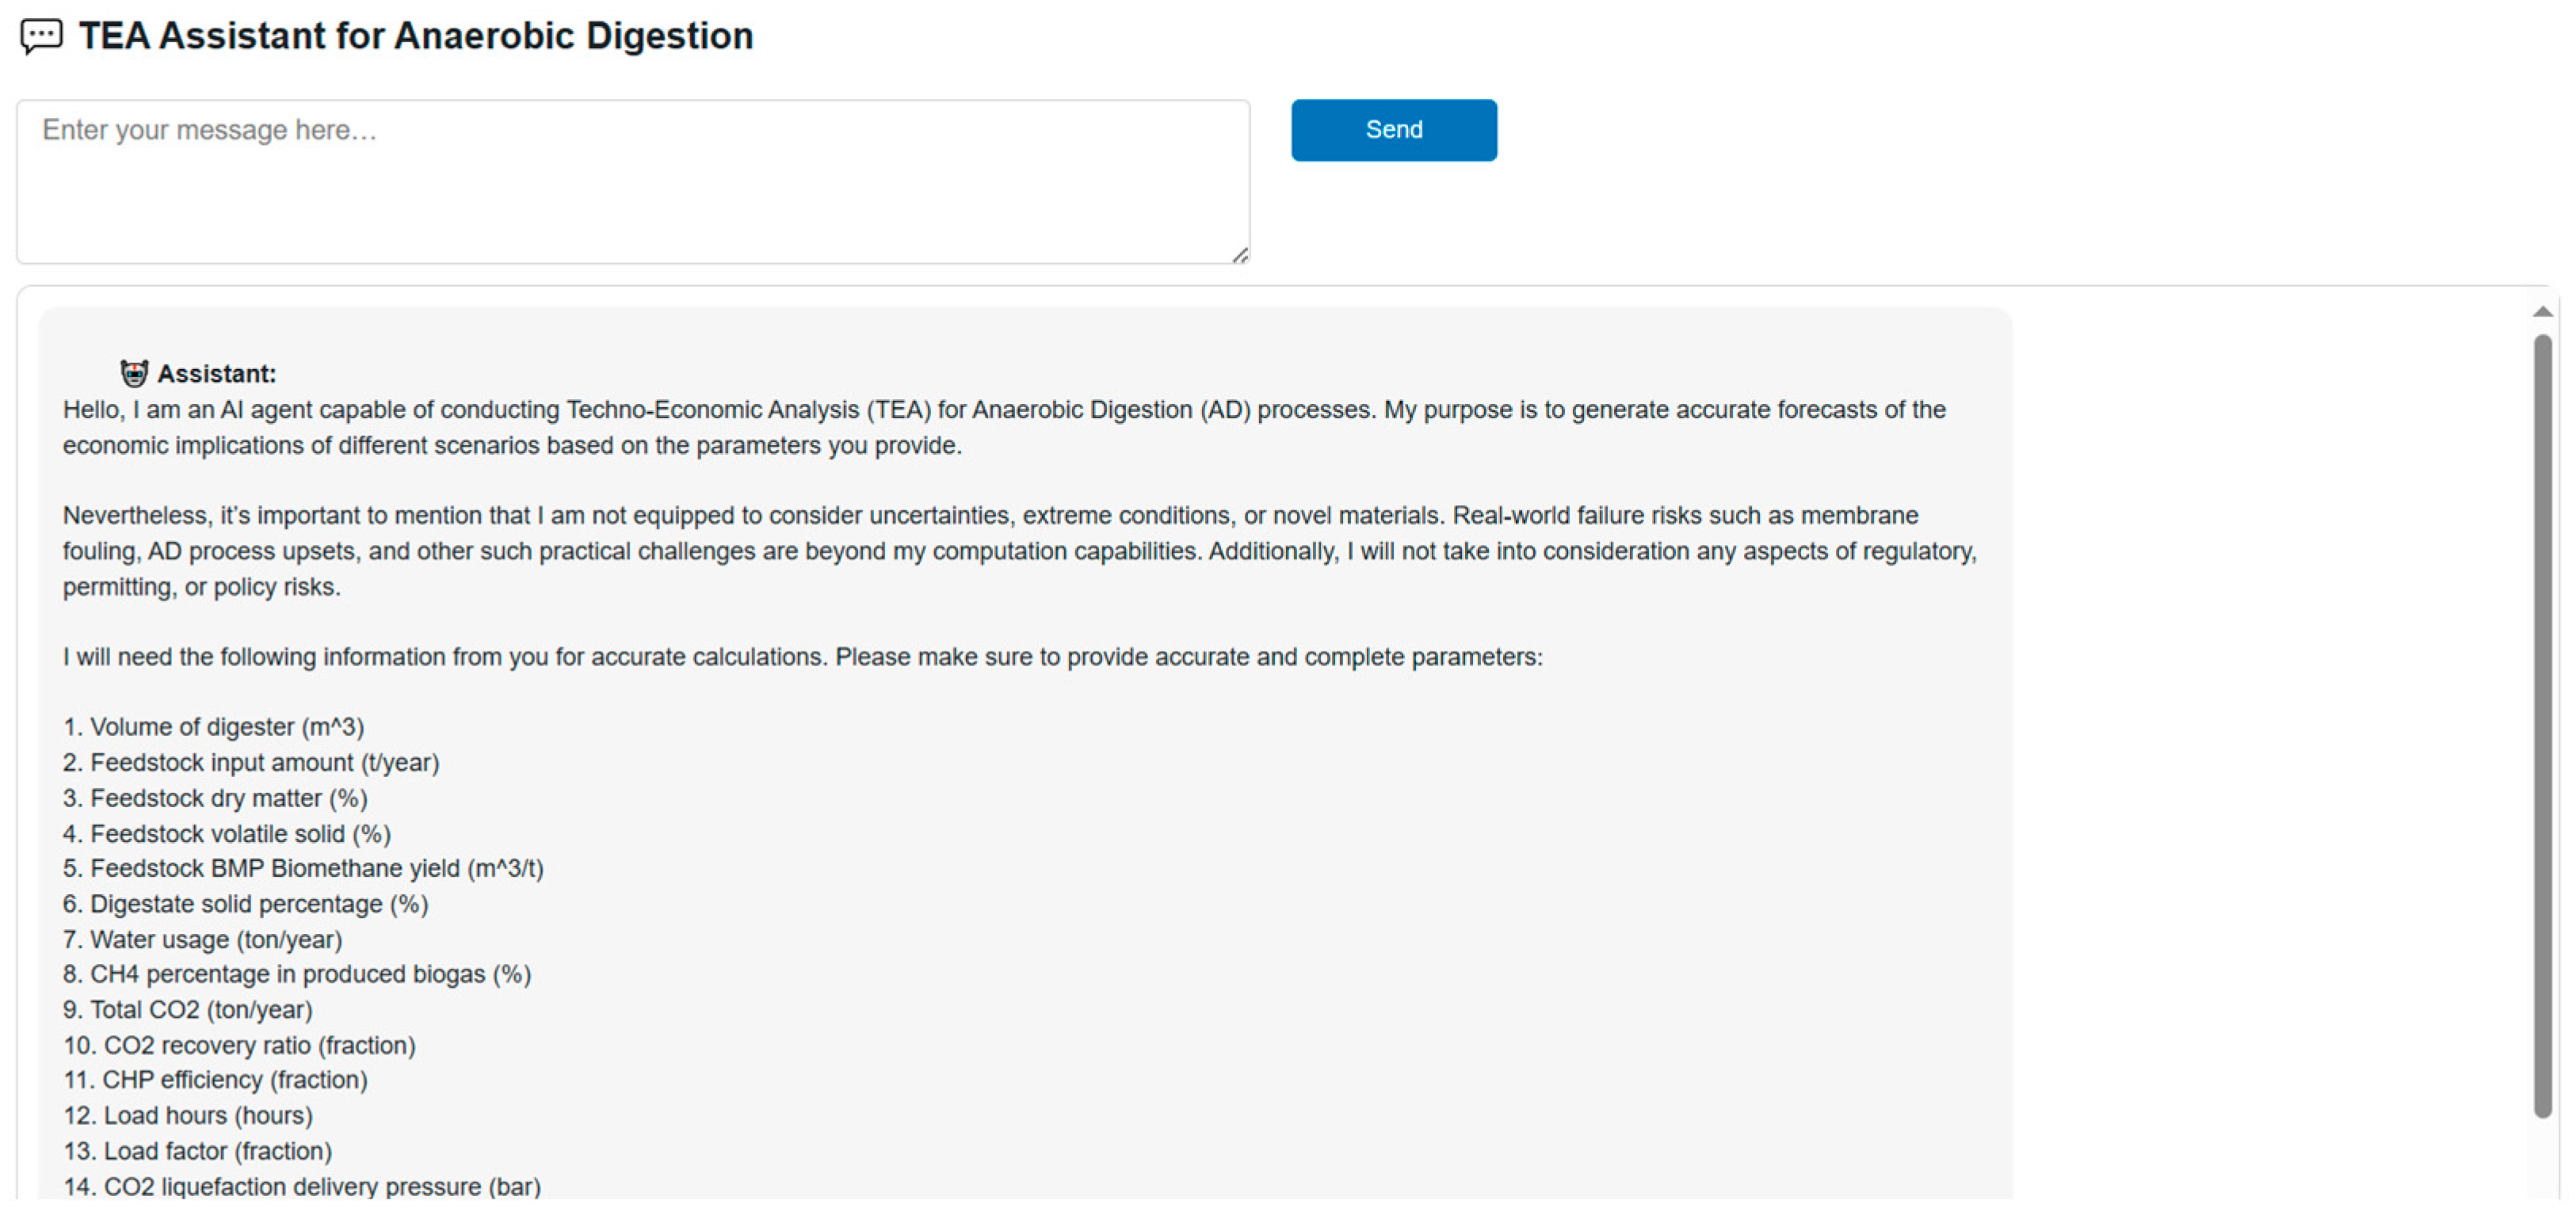
As illustrated in
Figure 2 and
Figure 3, the AI-agent architecture is designed to facilitate natural language interaction for techno-economic analysis (TEA). The system comprises three primary layers: a perception layer, an agent layer, and an action layer. The perception layer enables users to describe their specific analytical scenarios through a natural language interface. The agent layer leverages ChatGPT 5.0 to interpret these user-defined scenarios, guiding users to provide the necessary parameters and variables required for TEA calculations. Users can account for different geographical or regulatory contexts, as well as variations in plant size and type, by specifying corresponding parameters such as CO
2 price, energy price, GHG emission scheme (GGSS), feedstock quantity, digester volume, and technology pathway. Through multi-turn dialog, the AI agent progressively refines the scenario description and analytical requirements.
Subsequently, the system calls the large language model via the OpenAI-provided API to analyze the generated text, extract relevant TEA parameters and variables, and structure them into a JSON format. This JSON data is then passed into a Python-based object-oriented TEA model, which activates appropriate computational modules based on the interpreted scenario—including anaerobic digestion (AD), combined heat and power (CHP), carbon capture process (CCP)—or economic indicator analysis. Once the computations are completed, the system automatically generates analytical results and produces a comprehensive report using predefined templates.
The AI agent also explicitly declares its capability boundaries. It cannot handle uncertainties, extreme conditions, or novel raw materials, nor address issues such as membrane fouling, AD process upsets, seasonal variations in feedstock supply, or regulatory, permitting, and policy risks. These limitations arise from the inherent constraints of the underlying TEA model. Therefore, future work should focus on developing more comprehensive TEA models to enable the AI agent to address more complex and realistic scenarios.
3. Results and Discussion
This section provides a systematic evaluation of the techno-economic performance of the anaerobic co-digestion plant across four distinct operational scenarios, as generated by the AI-agent framework. In the AI-agent framework, the outcomes of the techno-economic analysis (TEA) rely on an expert-driven TEA model. The AI agent’s primary function is to interpret user-described scenarios and input parameters and subsequently activate the corresponding computational modules for analysis. In this work, all results generated through the AI-agent architecture were systematically compared with those obtained directly from the TEA model, yielding consistent and reliable outcomes.
The analysis examines the material and energy balance, provides detailed breakdowns of capital investment and operational costs, estimates revenue streams, and concludes with a comprehensive financial analysis. By comparing these aspects across different scenarios, it seeks to identify the most economically viable and technically efficient configuration for integrating anaerobic digestion (AD) with carbon capture technologies. The assessment covers various operational aspects—from feedstock processing to biogas utilization and carbon capture—offering a holistic perspective on system performance and economic potential. This integrated approach provides a comprehensive understanding of how different technological configurations and operational strategies influence the overall feasibility and sustainability of combined AD and carbon capture systems.
3.1. Materials and Energy Balance
The material and energy balance analysis reveals significant differences between feedstocks and CO
2 capture technologies.
Figure 4 presents the co-digestion feedstock distribution for both sites, showing notable compositional differences between the two real-world industrial plants based on feedstock availability and cost. The mix1 site primarily uses maize (82%) with smaller amounts of sugar beet pulp and cow manure (both 9%), while the mix2 site uses maize (73%), rye (24%), and sugar beet pulp (3%). The C/N ratio is crucial for optimal microbial activity during AD. Maize provides a high C/N ratio beneficial for biogas production, but excessive ratios can cause nitrogen deficiency and slow digestion. The inclusion of cow manure and sugar beet pulp at mix1 helps balance this ratio. The maize and rye combination at mix2 creates a more balanced nutrient profile, promoting better microbial activity and higher biogas yields, directly impacting production efficiency.
Figure 5 shows the total biogas and methane production at both sites. The TEA model calculations have been validated against real industrial site data, achieving over 90% accuracy, as shown in
Table 2. The mix2 site achieves higher biogas production (approximately 26,029 m
3/d) compared to mix1 (approximately 23,182 m
3/d), primarily due to its feedstock composition with higher proportions of maize and rye. Methane content remains relatively consistent between the sites, averaging at around 52% of the total biogas volume.
Figure 6 illustrates the digestate treatment process, showing the transformation from dried solid digestate to solid fuel through torrefaction. The mix1 site produces approximately 15 tons of dried digestate daily, yielding around 11 tons of solid fuel after torrefaction, while the mix2 site demonstrates higher yields with approximately 17 tons of dried digestate daily, converting to roughly 12 tons of solid fuel due to higher dry matter content in its feedstock.
Figure 7 highlights the power consumption for two carbon capture technologies at the mix1 site: upgrading and liquefaction and cryogenic separation. The carbon separation and liquefaction stages are the most power intensive, with upgrading and liquefaction technology consuming approximately 2400 MWh/year compared to 3000 MWh/year for cryogenic technology. This difference stems from the substantial cooling and compression energy required for cryogenic processes, significantly impacting overall plant efficiency and economic viability.
The biomethane produced can be used either on-site for power generation or injected into the natural gas grid.
Figure 8 compares the biomethane usage across two carbon capture technologies at the mix1 site. The upgrading and liquefaction process allows for a higher percentage of biomethane to be injected into the grid, creating a revenue stream from RNG sales. Specifically, in the upgrading and liquefaction system, around 21% of biomethane is used for power generation, with the remaining 79% injected into the gas pipeline. In contrast, the cryogenic system, due to its higher internal energy demands, uses approximately 24% of biomethane for power generation, leaving only 76% available for sale.
The material and energy balance analysis demonstrates that while the mix2 site achieves higher biogas production rates, the choice of CO2 capture technology significantly impacts the overall system efficiency and available biomethane for external use. The upgrading and liquefaction technology uses lower energy compared to the cryogenic system, resulting in more biomethane available for pipeline injection.
3.2. Capital Investment and Operation Costs
This section provides a comparative analysis of capital investment and operational costs across various scenarios, focusing on the mix1 and mix2 sites using two CO2 capture technologies: membrane-based CO2 separation and liquefaction, and cryogenic CO2 separation.
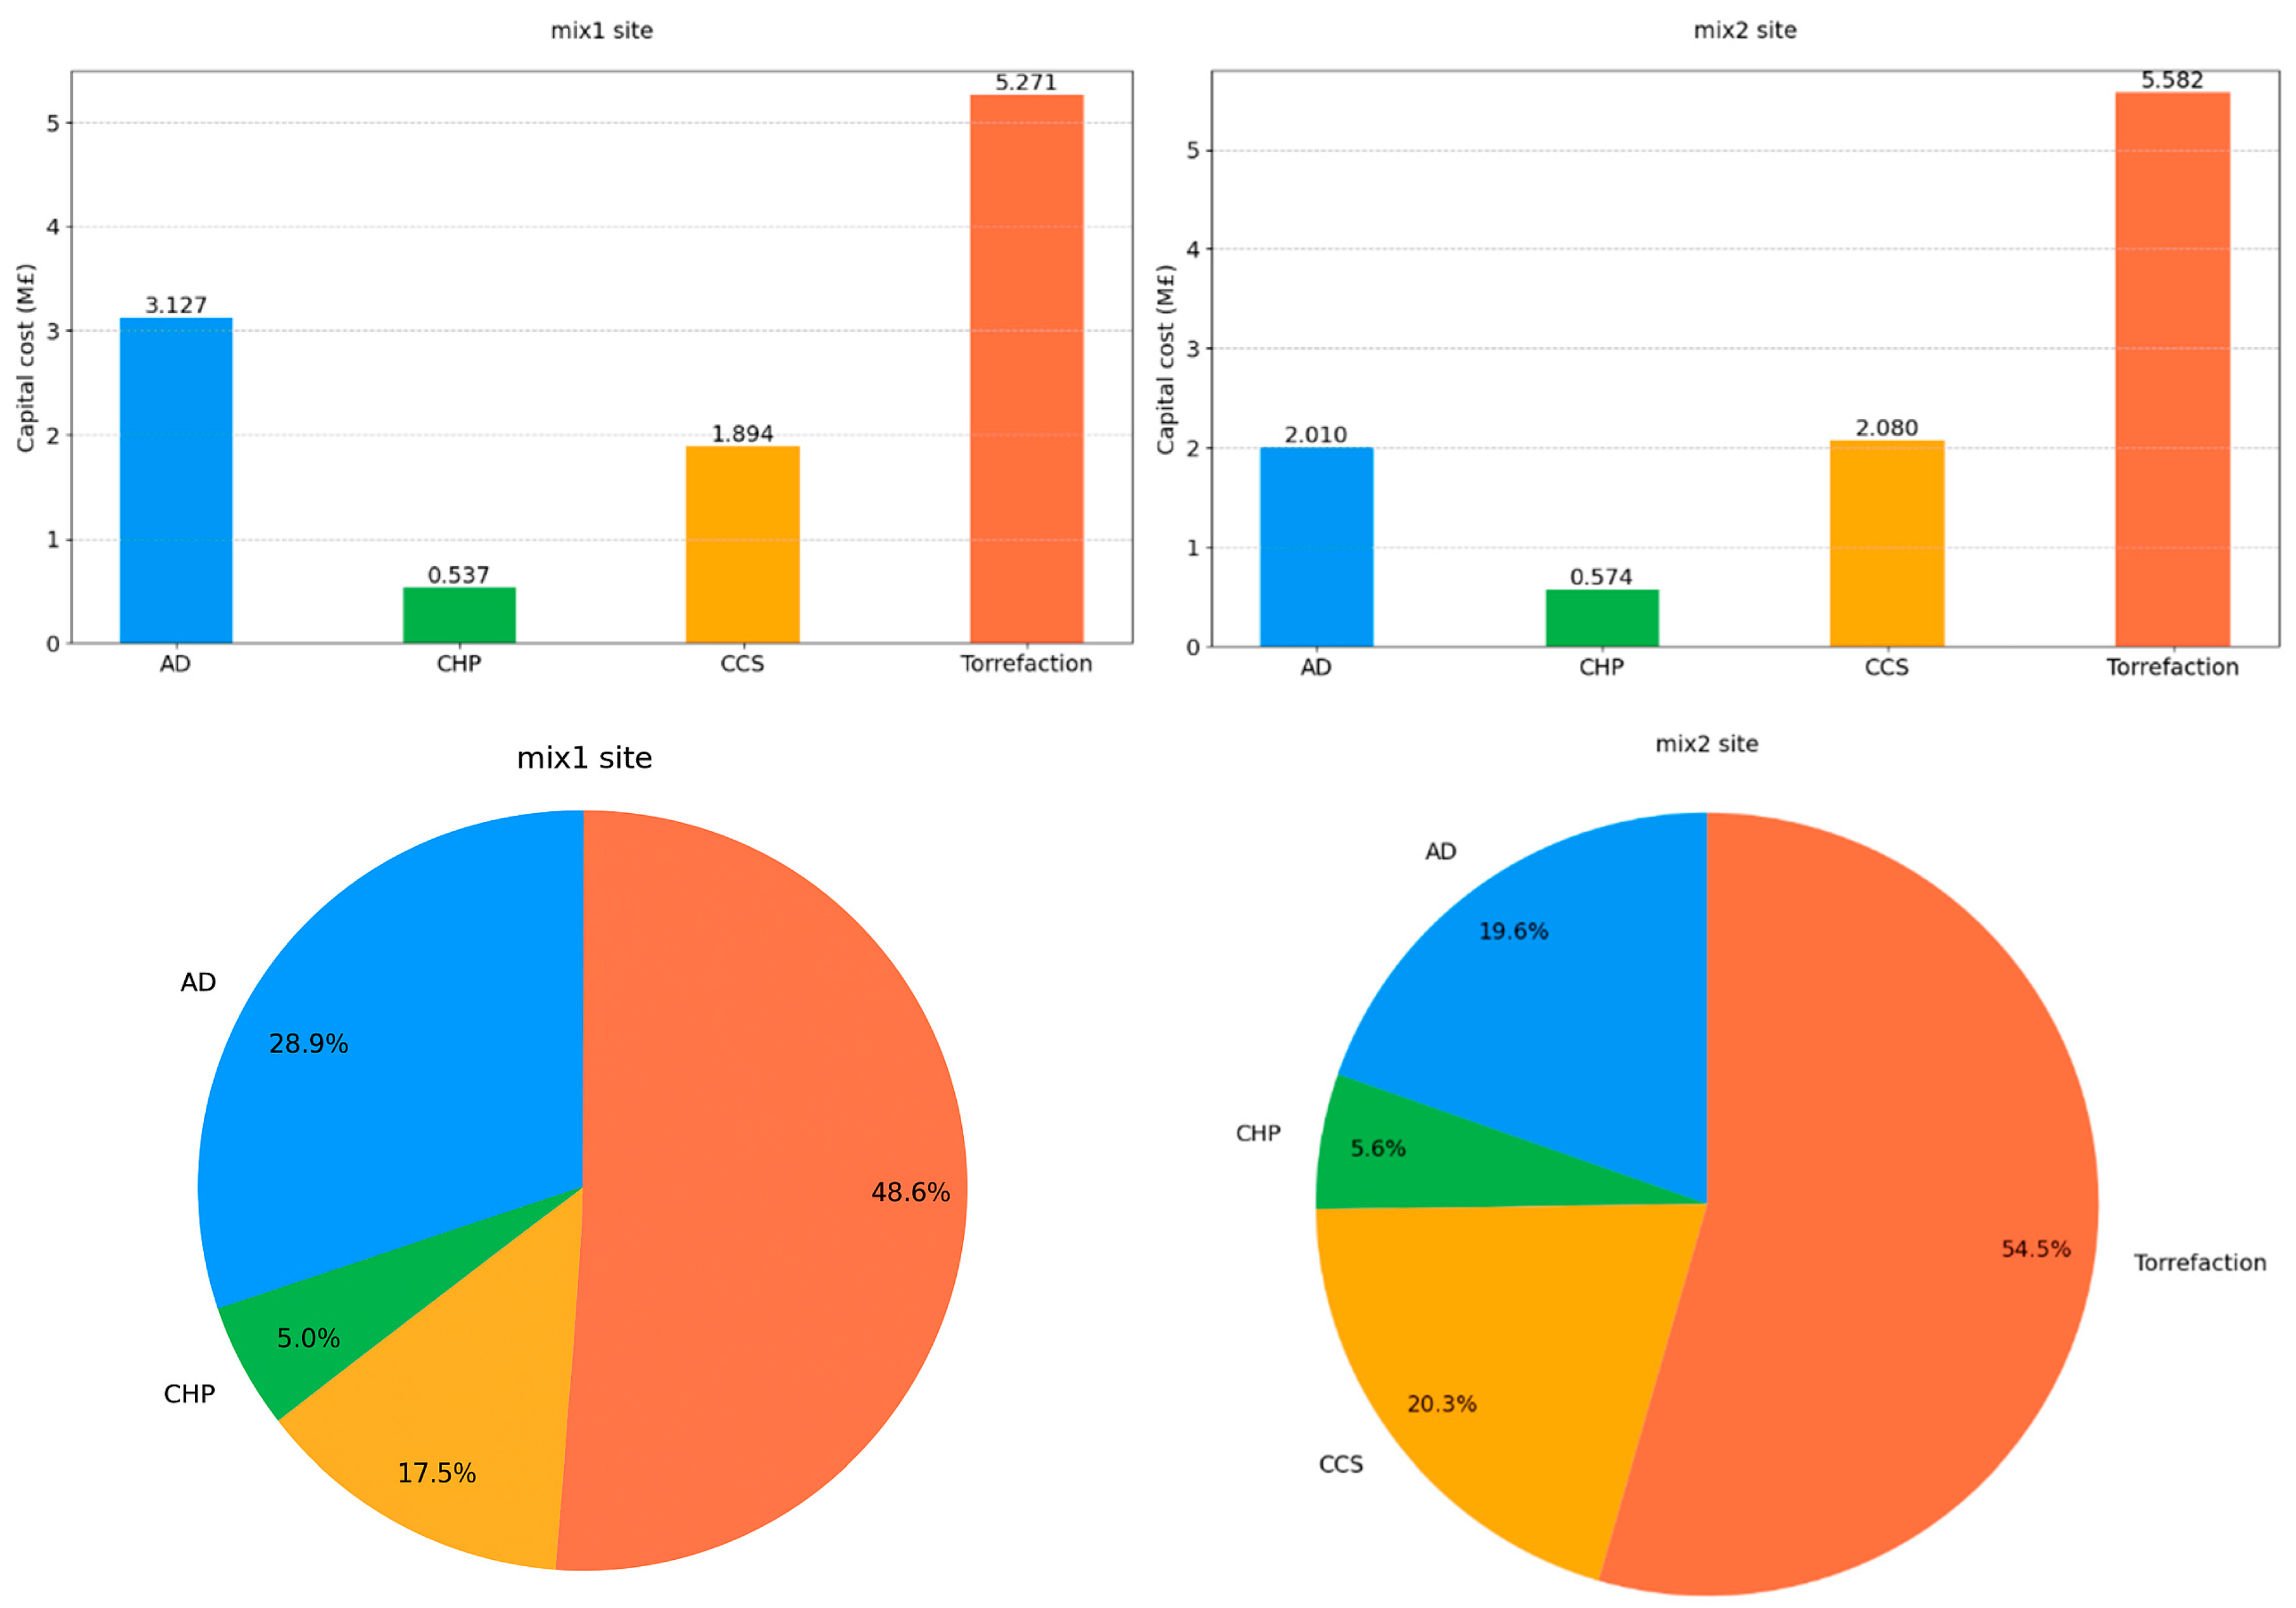
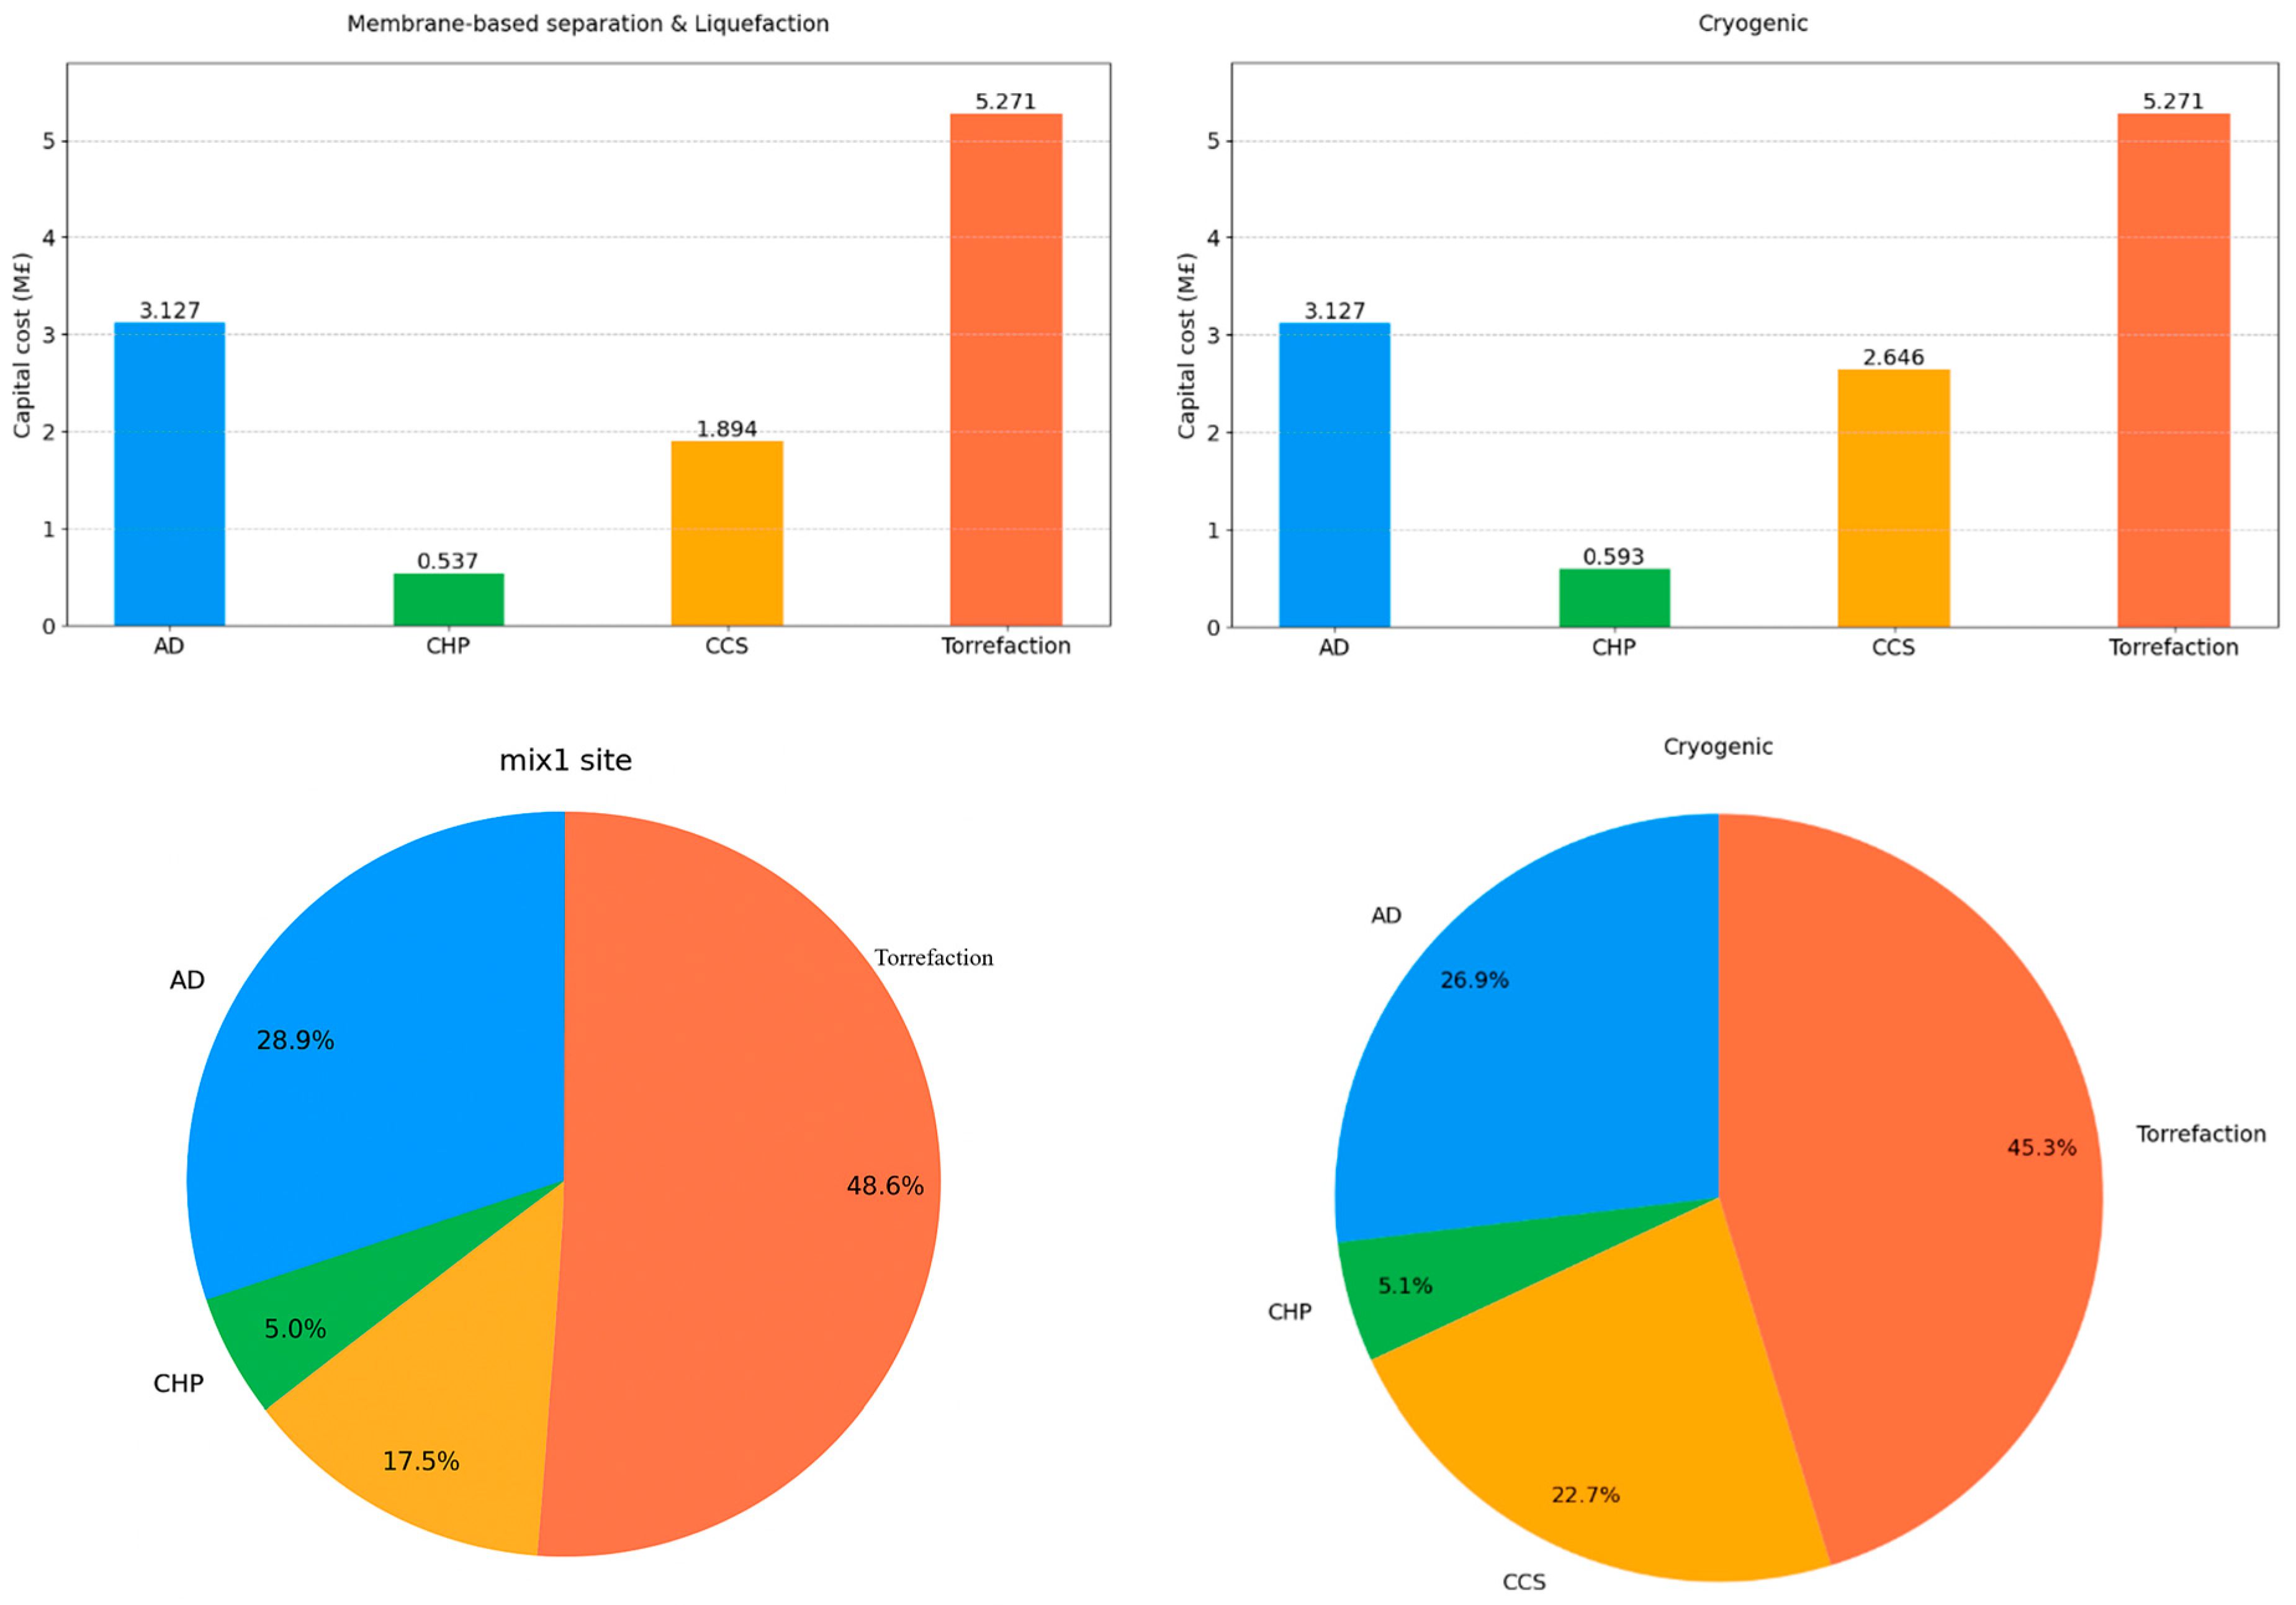
At the mix1 site using CO
2 separation and liquefaction technology, the total capital cost reaches GBP 10.82 million, with significant investments allocated to the AD system, CO
2 capture infrastructure, and digestate treatment facilities. As shown in
Figure 9, the CO
2 capture system, which includes membrane separation and liquefaction units, comprises about 18% of the overall capital cost, while the AD system represents approximately 28%. Digestate treatment, particularly torrefaction, accounts for the largest share at 48%. The mix2 site has a slightly lower total capital cost of GBP 10.24 million. The cost distribution is similar to the mix1 site, with the AD system, CO
2 capture technology, and digestate treatment being the primary expenditures. However, the AD system’s share is slightly smaller than at the mix1 site, while the CO
2 capture technology and digestate treatment account for a slightly higher proportion of the costs.
When comparing CO
2 capture technologies at the mix1 site, the site with a cryogenic system shows a higher total capital cost of GBP 11.64 million, approximately 7.5% more than with the membrane-based separation and liquefaction approach. According to
Figure 10, this increased cost is primarily due to the more sophisticated cooling and compression equipment required for the cryogenic process, despite potentially simpler gas separation mechanisms. For the case of Scenario 4, the base-case digestate treatment and the capital cost for the AD, CHP, and CCS components are the same as the case of the mix1 site with membrane-based separation and liquefaction. However, the costs do not include the torrefaction part.
At the mix1 site employing CO2 separation and liquefaction technology, the annual maintenance and operation costs total GBP 0.68 million, with substantial portions directed towards the AD system and digestate treatment facilities. The mix2 site has a slightly lower annual maintenance and operation cost of GBP 0.64 million pounds.
The mix1 site’s cryogenic system incurs the highest annual maintenance and operational expenses at GBP 0.8 million.
Figure 11 demonstrates that annual costs for CHP and CCS components increase substantially with the cryogenic system. This elevation in expenses stems primarily from the cryogenic process’s higher energy requirements, as demonstrated in the previous energy balance analysis where its power consumption exceeded that of the membrane-based and liquefaction system. Furthermore, the cryogenic equipment’s complexity necessitates enhanced maintenance requirements and specialized personnel.
These cost analyses suggest that while the mix2 site has lower overall capital and operational costs, the choice of CO2 capture technology has a significant impact on both initial investment and ongoing expenses. The membrane-based separation and liquefaction technology appears to offer a more economical solution compared to the cryogenic system, both in terms of capital investment and operational costs.
3.3. Revenue Estimation
The revenue analysis evaluates three income sources across various sites and CO2 capture technologies: biomethane sales, CO2 sales, and solid fuel sales from digestate treatment. The base-case scenario excludes digestate sales considerations. The comparative analysis demonstrates the revenue generation variations between different site configurations and carbon capture technologies.
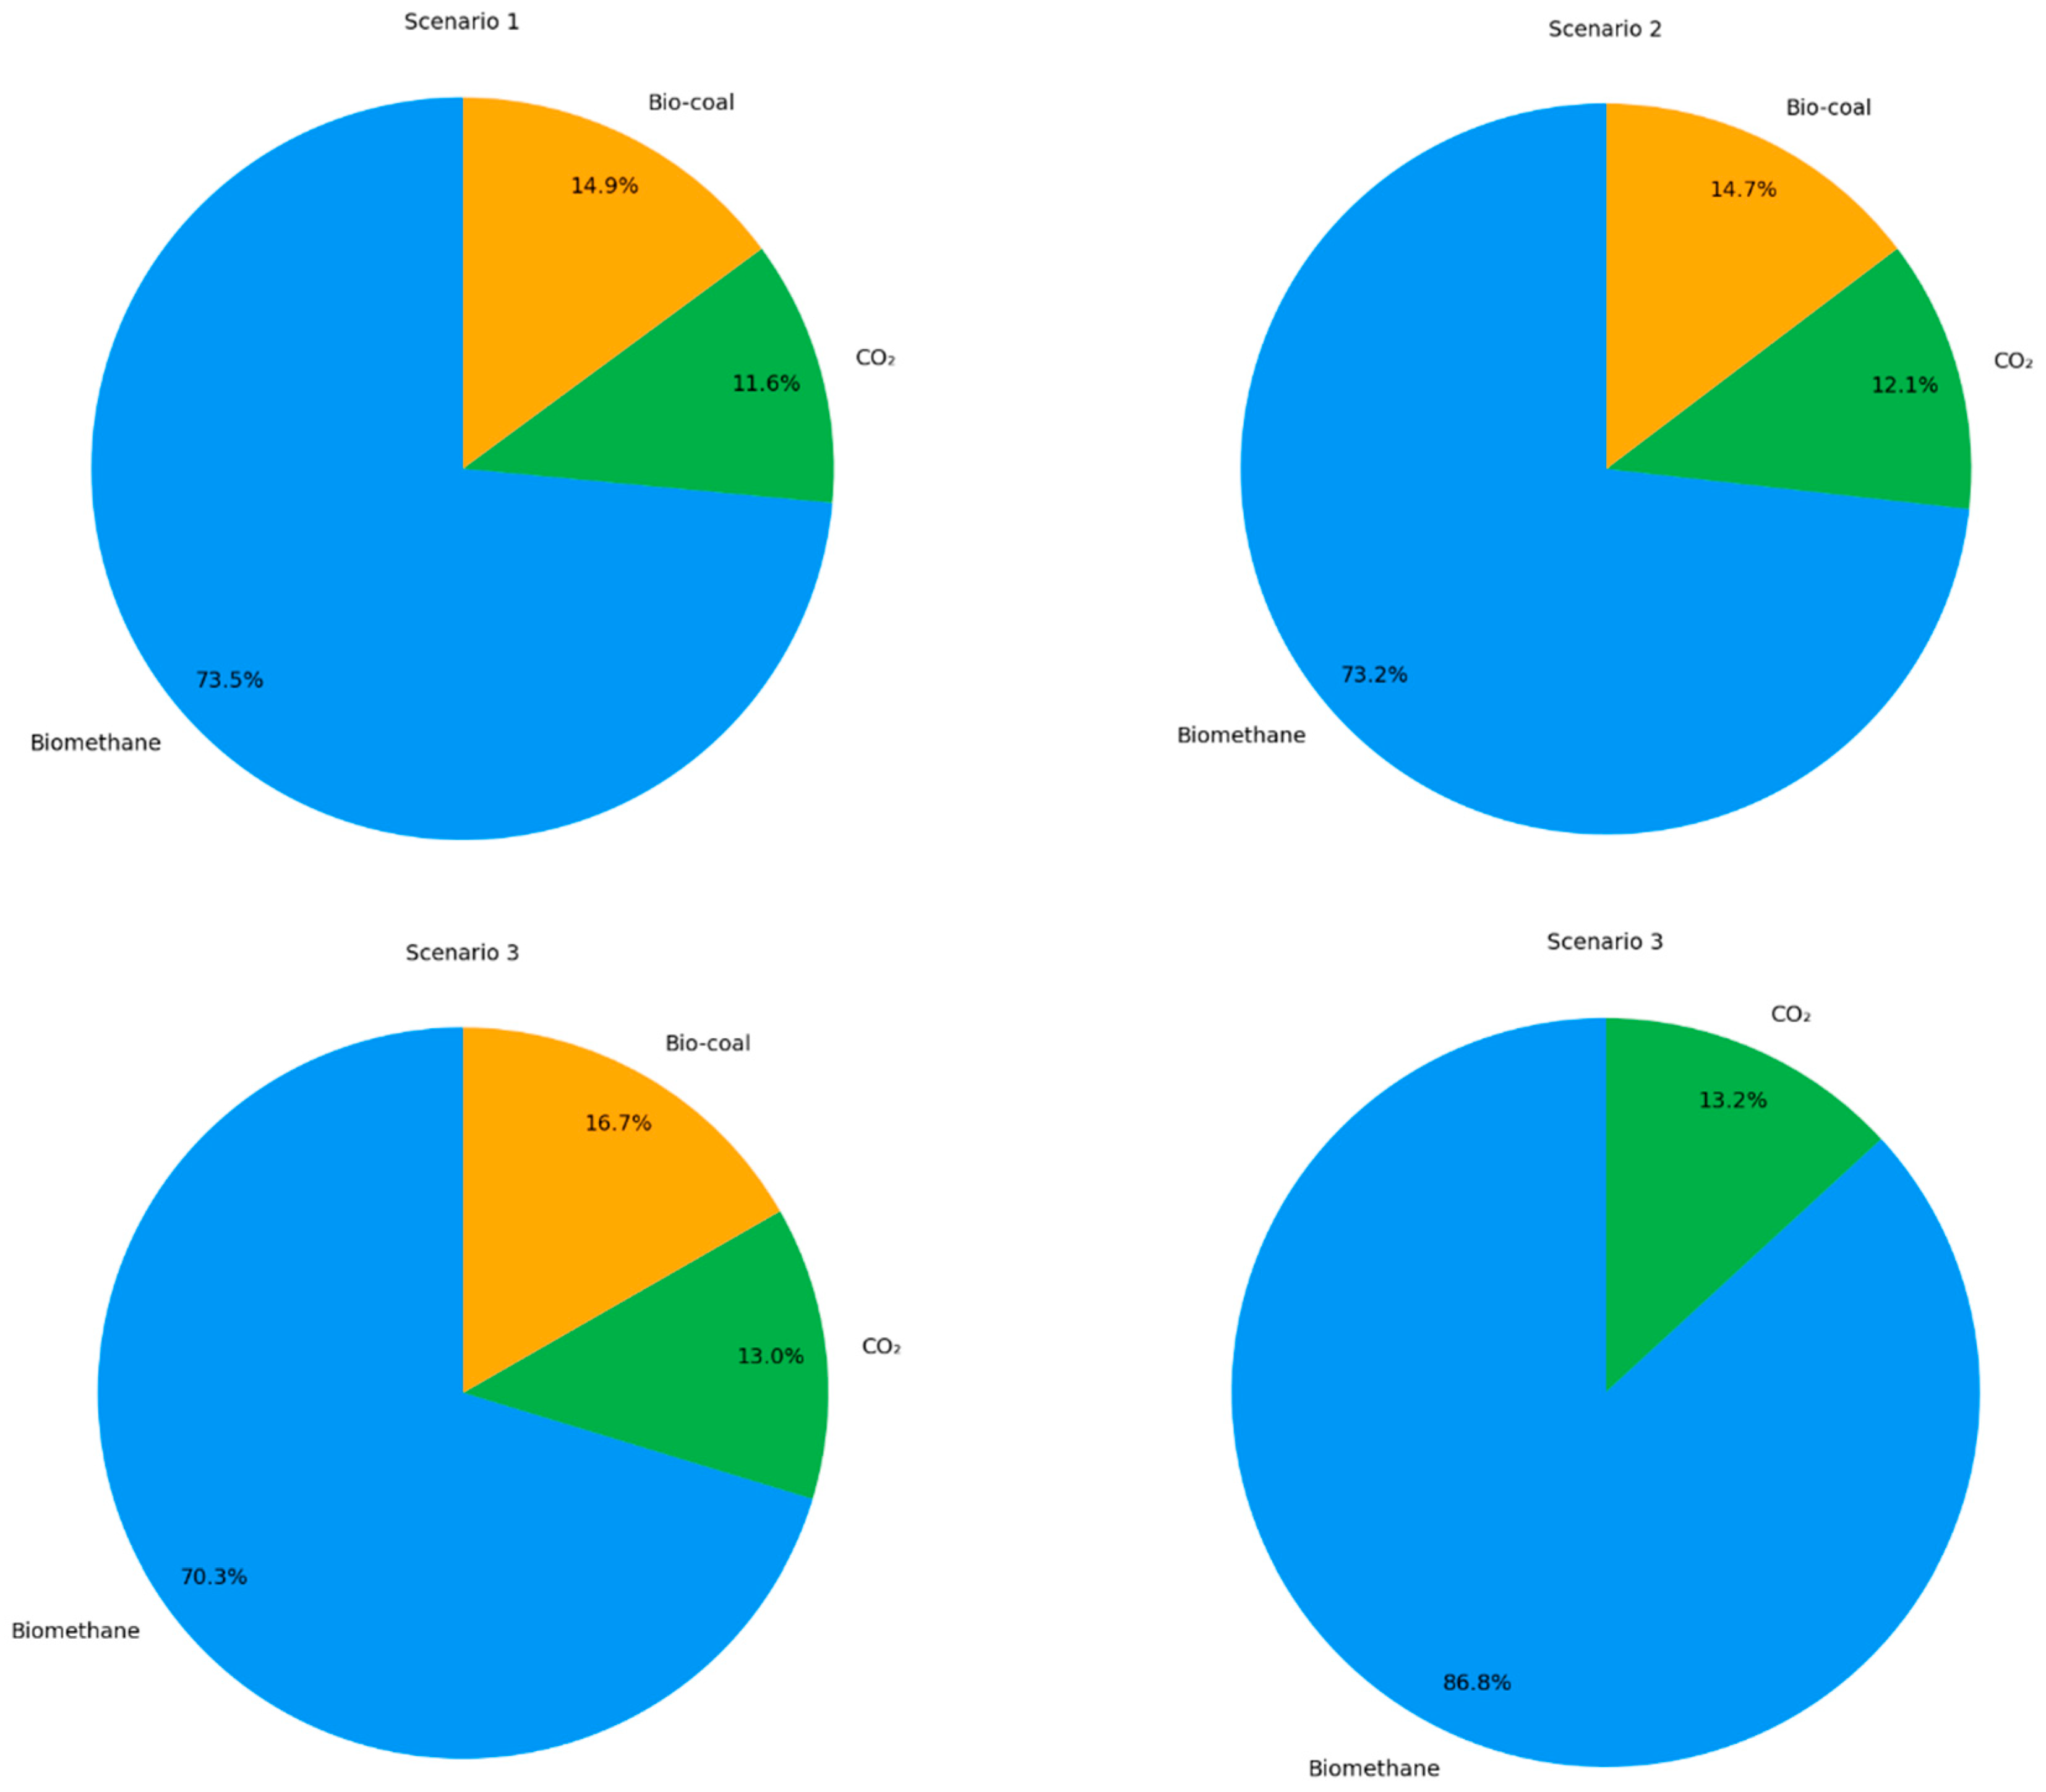
From
Figure 12, we can see that for the mix1 site using CO
2 separation and liquefaction technology (Scenario 1), the total annual revenue amounts to approximately GBP 4.0 million. The revenue distribution shows that biomethane sales constitute the largest portion at about 73% (GBP 2.956 million), followed by CO
2 sales at 11% (GBP 0.465 million), and solid fuel sales contributing 14% (GBP 0.60 million). This revenue structure reflects the efficient biomethane production and CO
2 capture capabilities of the membrane-based separation system, which allows for higher biomethane injection into the gas grid (approximately 79% of produced biomethane). The mix2 site, also employing CO
2 separation and liquefaction technology (Scenario 2), achieves higher total annual revenues of approximately GBP 4.4 million. This superior performance can be attributed to its more efficient biogas production (26,029 m
3/y compared to 23,182 m
3/y at the mix1 site). The fractions of revenues show biomethane sales at approximately 73% (GBP 3.242 million), CO
2 sales at 12% (GBP 0.534 million), and solid fuel sales at 14% (GBP 0.650 million).
A comparison of CO2 capture technologies at the mix1 site reveals that the cryogenic system (Scenario 3) produces lower total annual revenues of approximately GBP 3.5 million, representing a 10% decrease compared to the membrane-based separation and liquefaction method. This revenue reduction stems mainly from decreased biomethane sales, as the cryogenic system consumes more biomethane for internal power generation (24% versus 21% in the membrane-based system). The cryogenic system’s revenue distribution comprises biomethane sales at approximately 70% (GBP 2.52 million), CO2 sales at 13% (GBP 0.6 million), and solid fuel sales maintaining consistency at about 16% (GBP 0.60 million).
The revenue analysis indicates that the mix2 site utilizing the membrane-based CO2 separation and liquefaction technology (Scenario 2) delivers the highest revenue potential through the combined benefits of increased biogas production and efficient carbon capture. CO2 capture technology selection substantially influences revenue generation, with membrane-based separation and liquefaction systems providing superior economic performance through reduced internal energy consumption and enhanced biomethane availability for grid injection. These results correspond with the material and energy balance analysis, which demonstrated the membrane-based CO2 separation and liquefaction technology’s superior efficiency regarding power consumption and biomethane utilization.
3.4. Financial Analysis
The financial analysis evaluates the economic feasibility of various anaerobic co-digestion power plant configurations using NPV, IRR, and payback period calculations. The analysis contrasts both site types (mix1 and mix2) and CO2 capture technologies (membrane-based separation and liquefaction versus cryogenic separation).
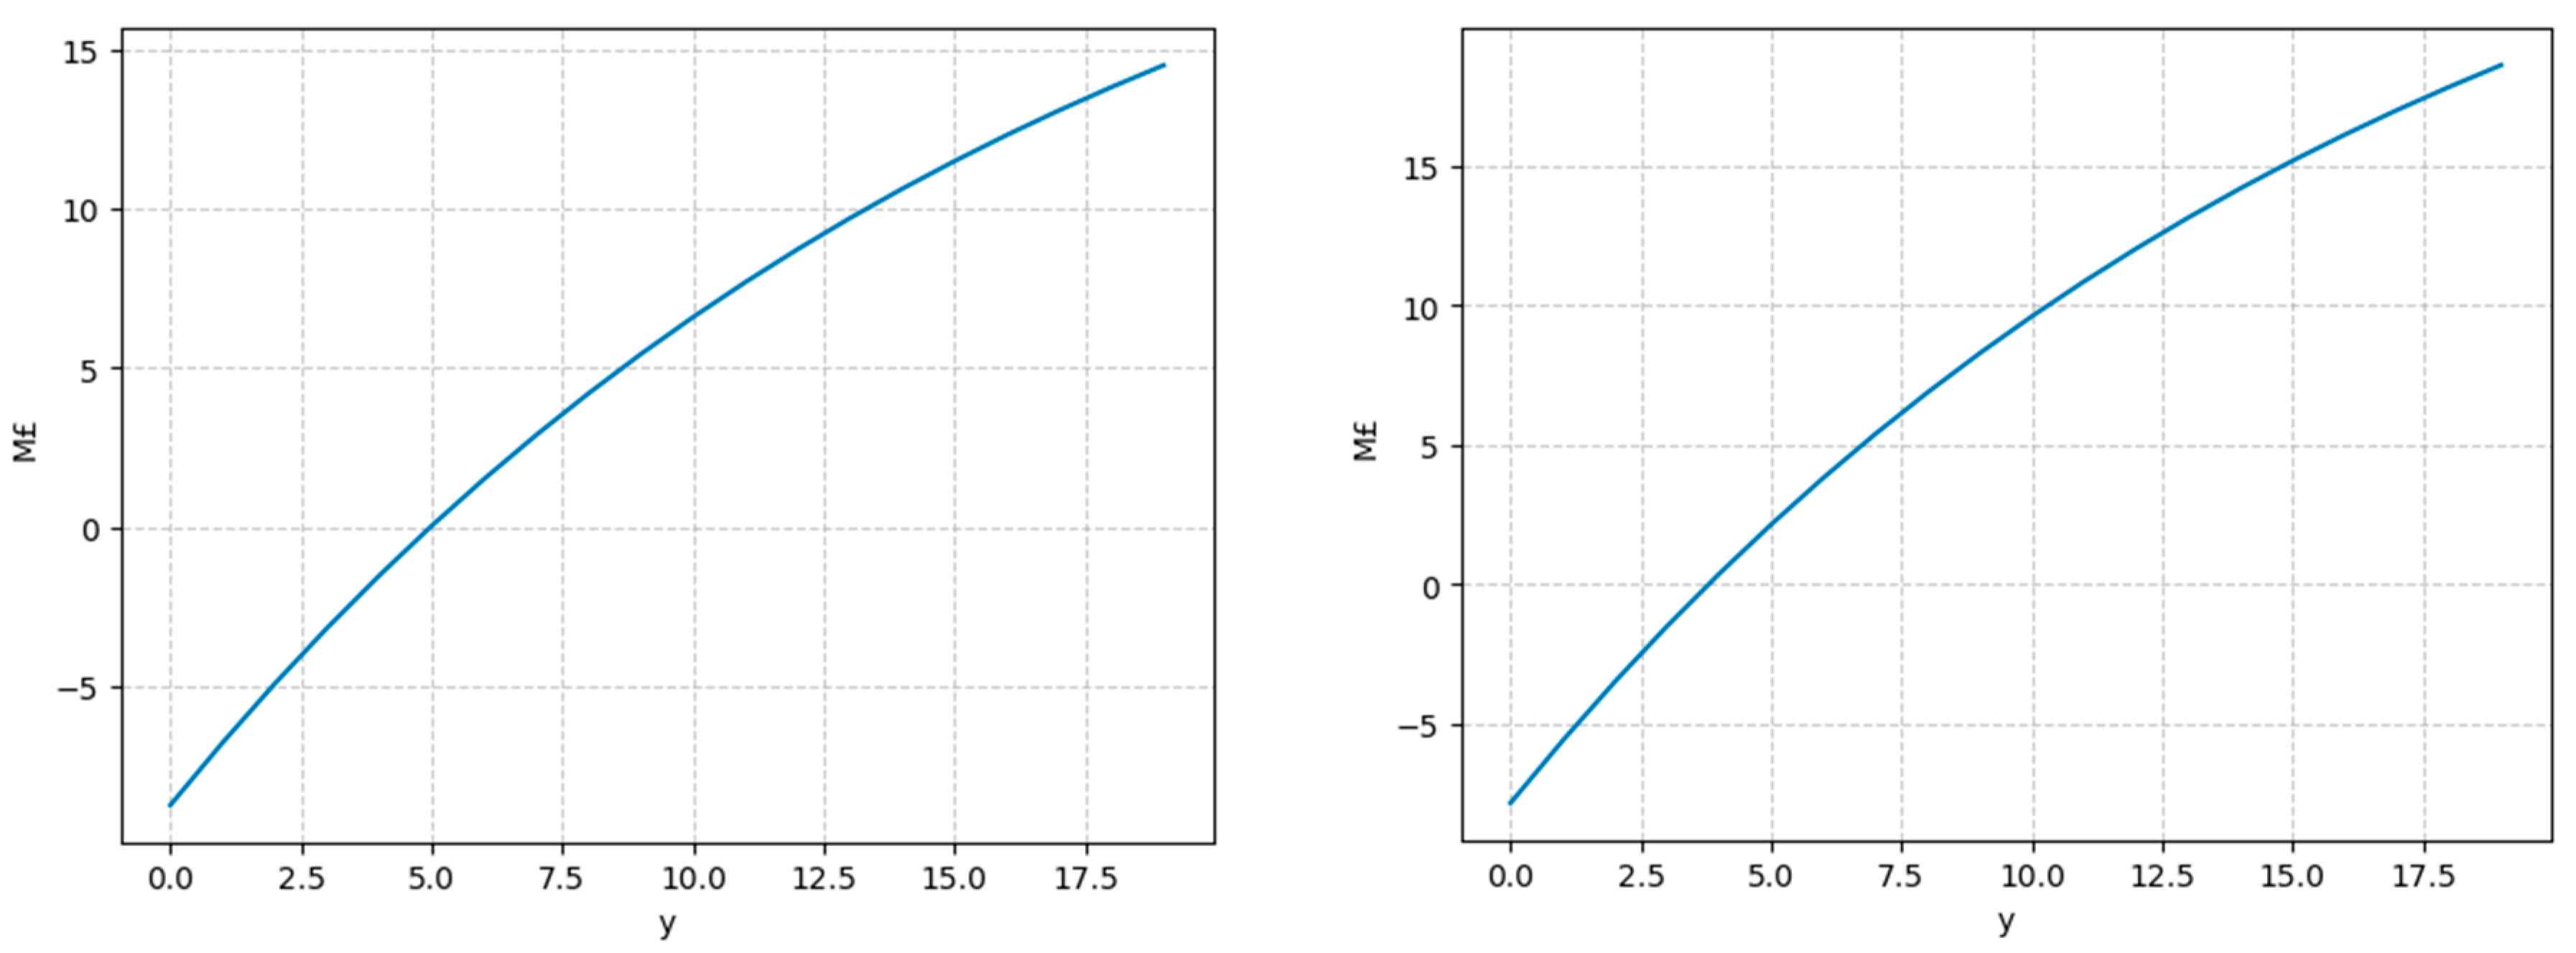
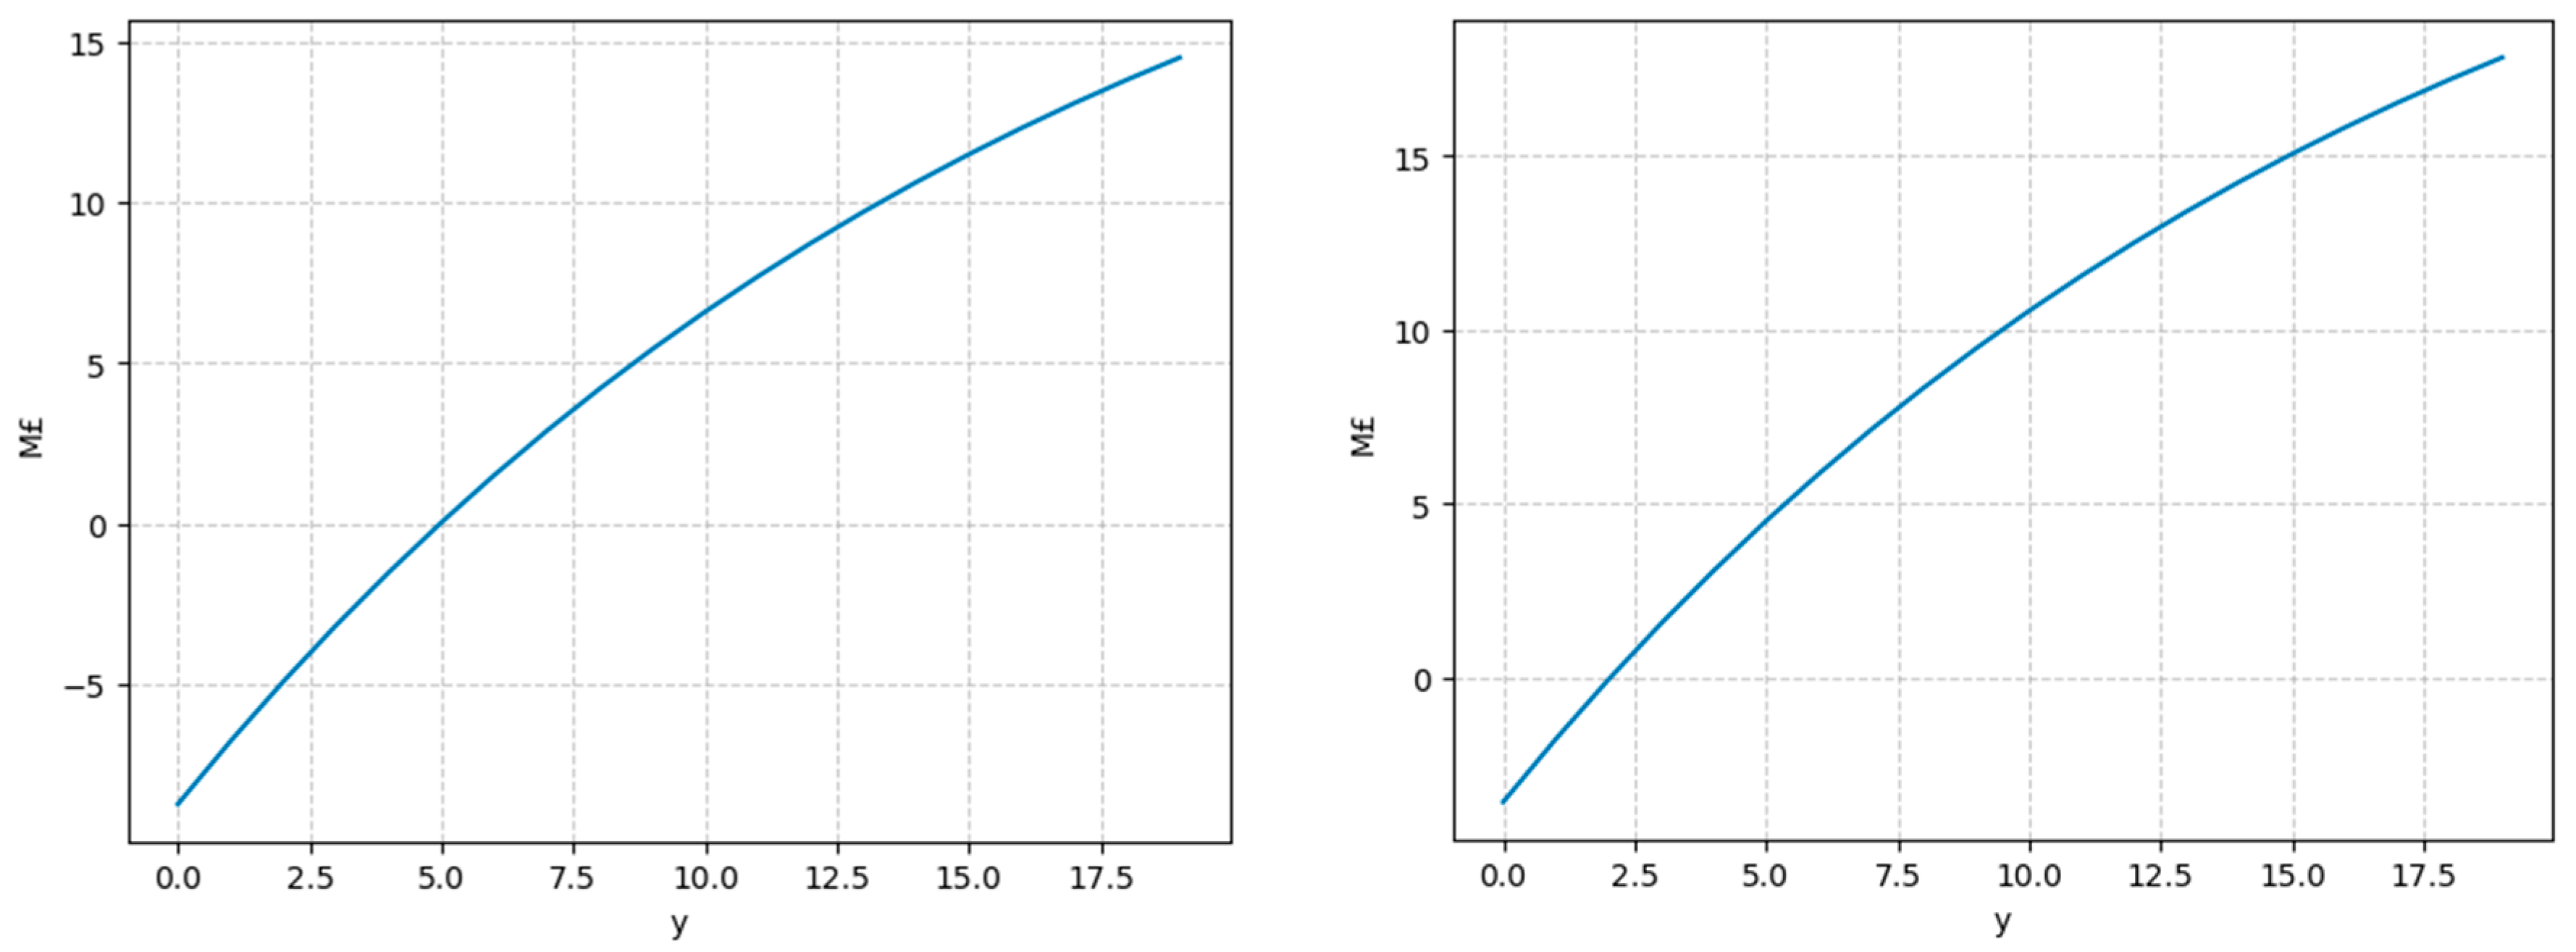
Figure 13 compares the NPV results for the mix1 site and mix2 site using membrane-based CO
2 separation and liquefaction technology. The NPV analysis, conducted over a 20-year project lifetime, reveals significant variations between different sites. The mix2 site using membrane-based CO
2 separation and liquefaction technology demonstrates the most favorable NPV profile, reaching approximately GBP 19 million by year 20. This good performance can be attributed to its higher biogas production capacity (26,029 m
3/y compared to 23,182 m
3/y at the mix1 site) and more efficient feedstock composition (73% maize, 24% rye, and 3% sugar beet pulp), resulting in annual revenues of GBP 4.4 million.
The mix1 site with membrane-based CO2 separation and liquefaction technology shows a lower NPV performance, achieving approximately GBP 15 million by year 20. Despite lower biogas production, this configuration maintains strong financial viability through balanced revenue streams from biomethane sales (73%), CO2 sales (12%), and solid fuel sales (15%), totaling annual revenues of GBP 4.0 million.
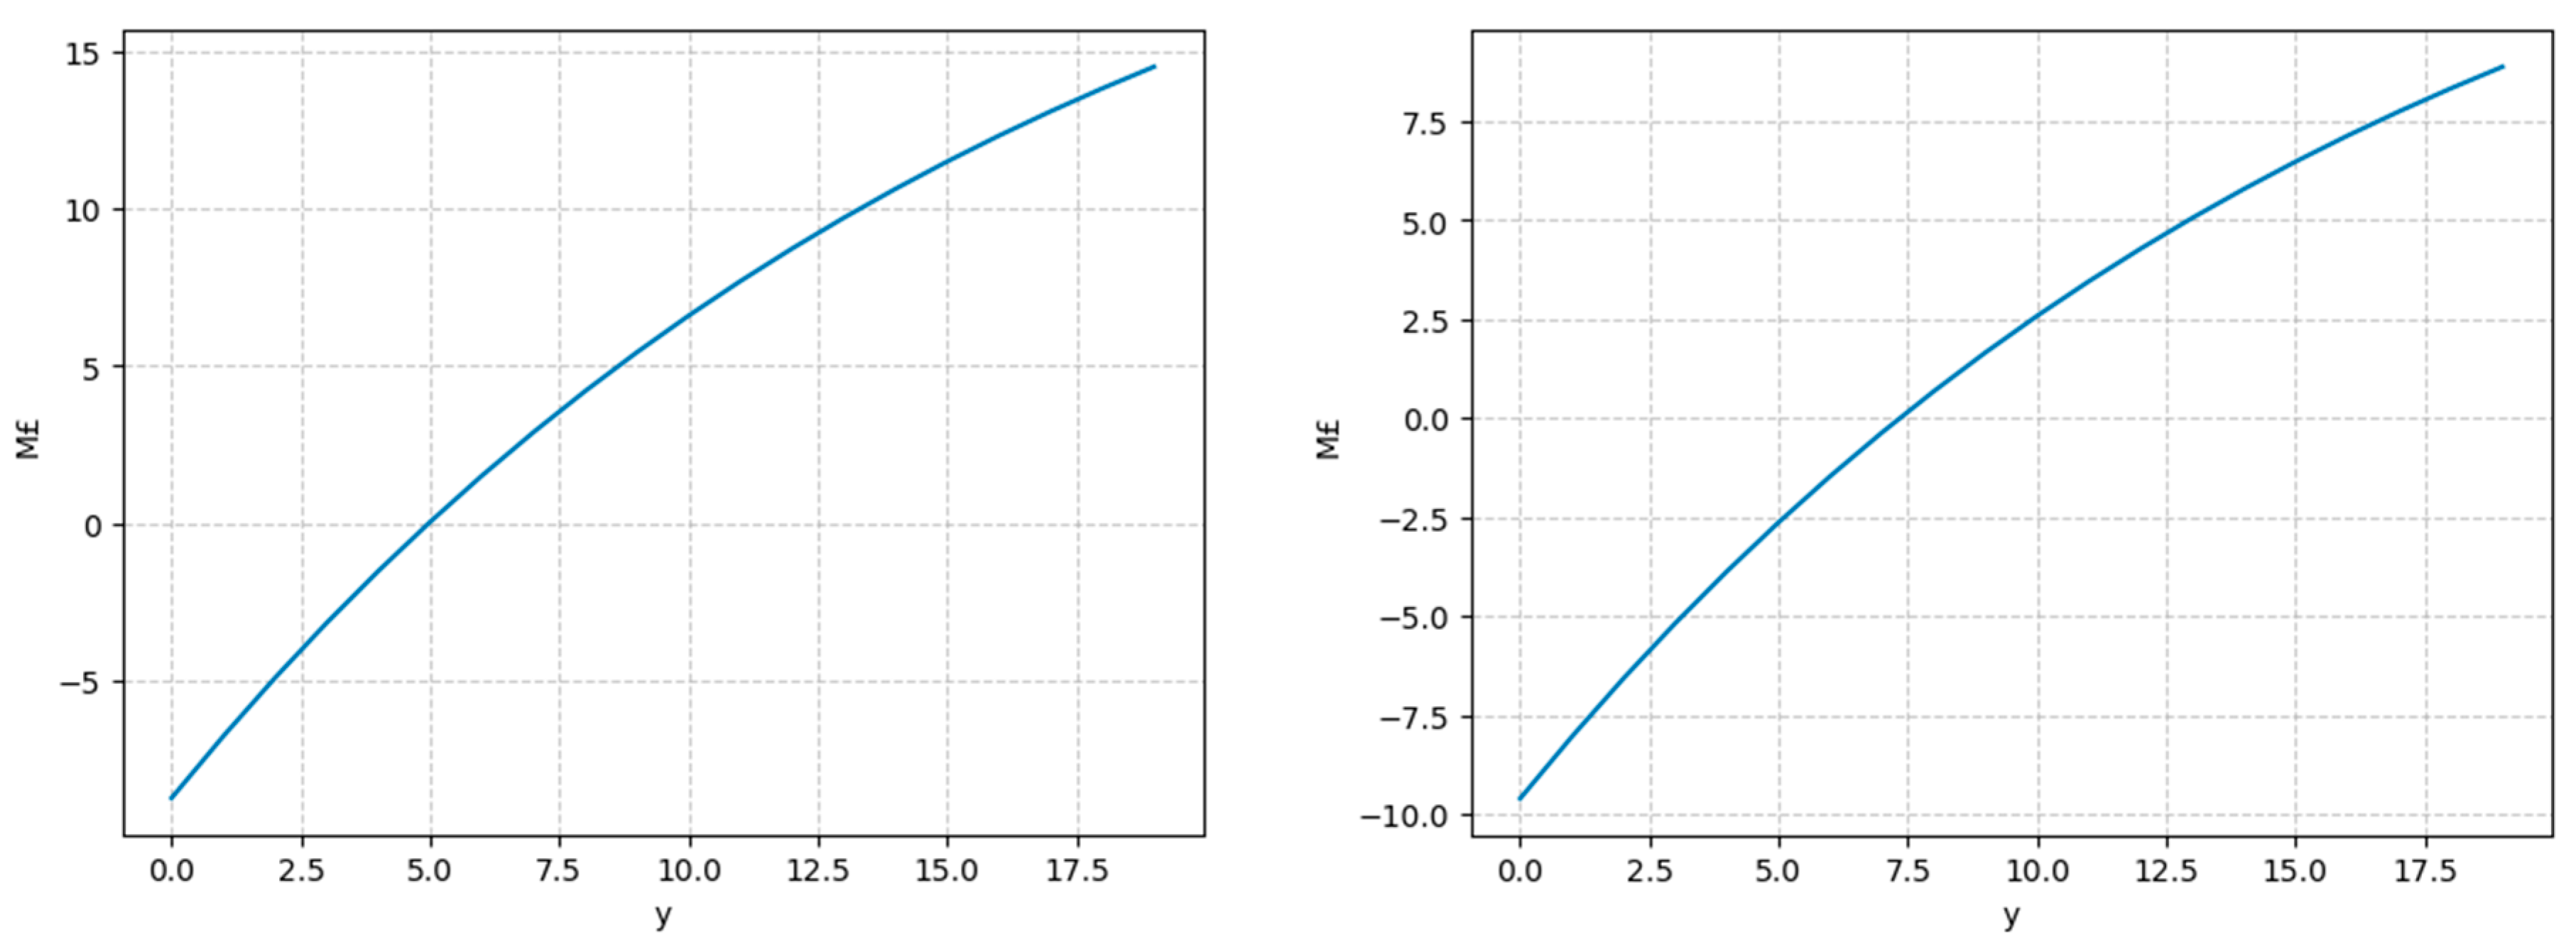
As shown in
Figure 14, membrane-based separation and liquefaction technology yields a higher NPV compared to cryogenic technology at the mix1 site. The mix1 site using cryogenic CO
2 separation demonstrates the least favorable NPV trajectory, reaching approximately GBP 8 million by year 20. This reduced performance results from higher capital costs (GBP 11.64 million versus GBP 10.82 million for membrane-based technology), increased operational expenses (GBP 0.8 million annually versus GBP 0.68 million), and lower revenue generation (GBP 3.58 million annually) due to greater internal biomethane consumption for power generation (24% versus 21% in membrane-based systems).
Figure 15 compares the NPV results for the mix1 site under different digestate treatment methods. The mix1 site employing torrefaction technology exhibits an unfavorable NPV trajectory, reaching only approximately GBP 15 million by year 20, in contrast to the base digestate treatment method, which achieves GBP 18 million in the same period. This significantly reduced financial performance can be attributed to the substantial upfront and operational costs associated with torrefaction, including high capital expenditures of GBP 5.27 million and operational expenses of GBP 0.26 million, coupled with a relatively low annual revenue generation of GBP 0.6 million.
Figure 16 illustrates the IRR and payback time for four Scenarios. Among these, the mix1 site with membrane-based CO
2 separation and base-case digestate treatment achieves the highest IRR of approximately 36% and a payback period of 3 years. In contrast, the mix1 site with cryogenic technology has the lowest IRR at around 14.8%, with a longer payback period of 8 years, reflecting the higher internal energy consumption and operational costs associated with cryogenic CO
2 capture. The mix1 site employing membrane-based separation demonstrates a moderately improved IRR of 24.5% and a payback period of 4.0 years, indicating a more favorable investment return when utilizing less energy-intensive CO
2 capture technologies.
3.5. Sensitivity Analysis
The sensitivity analysis examines the impact of critical economic and operational parameters on techno-economic performance across four distinct scenarios.
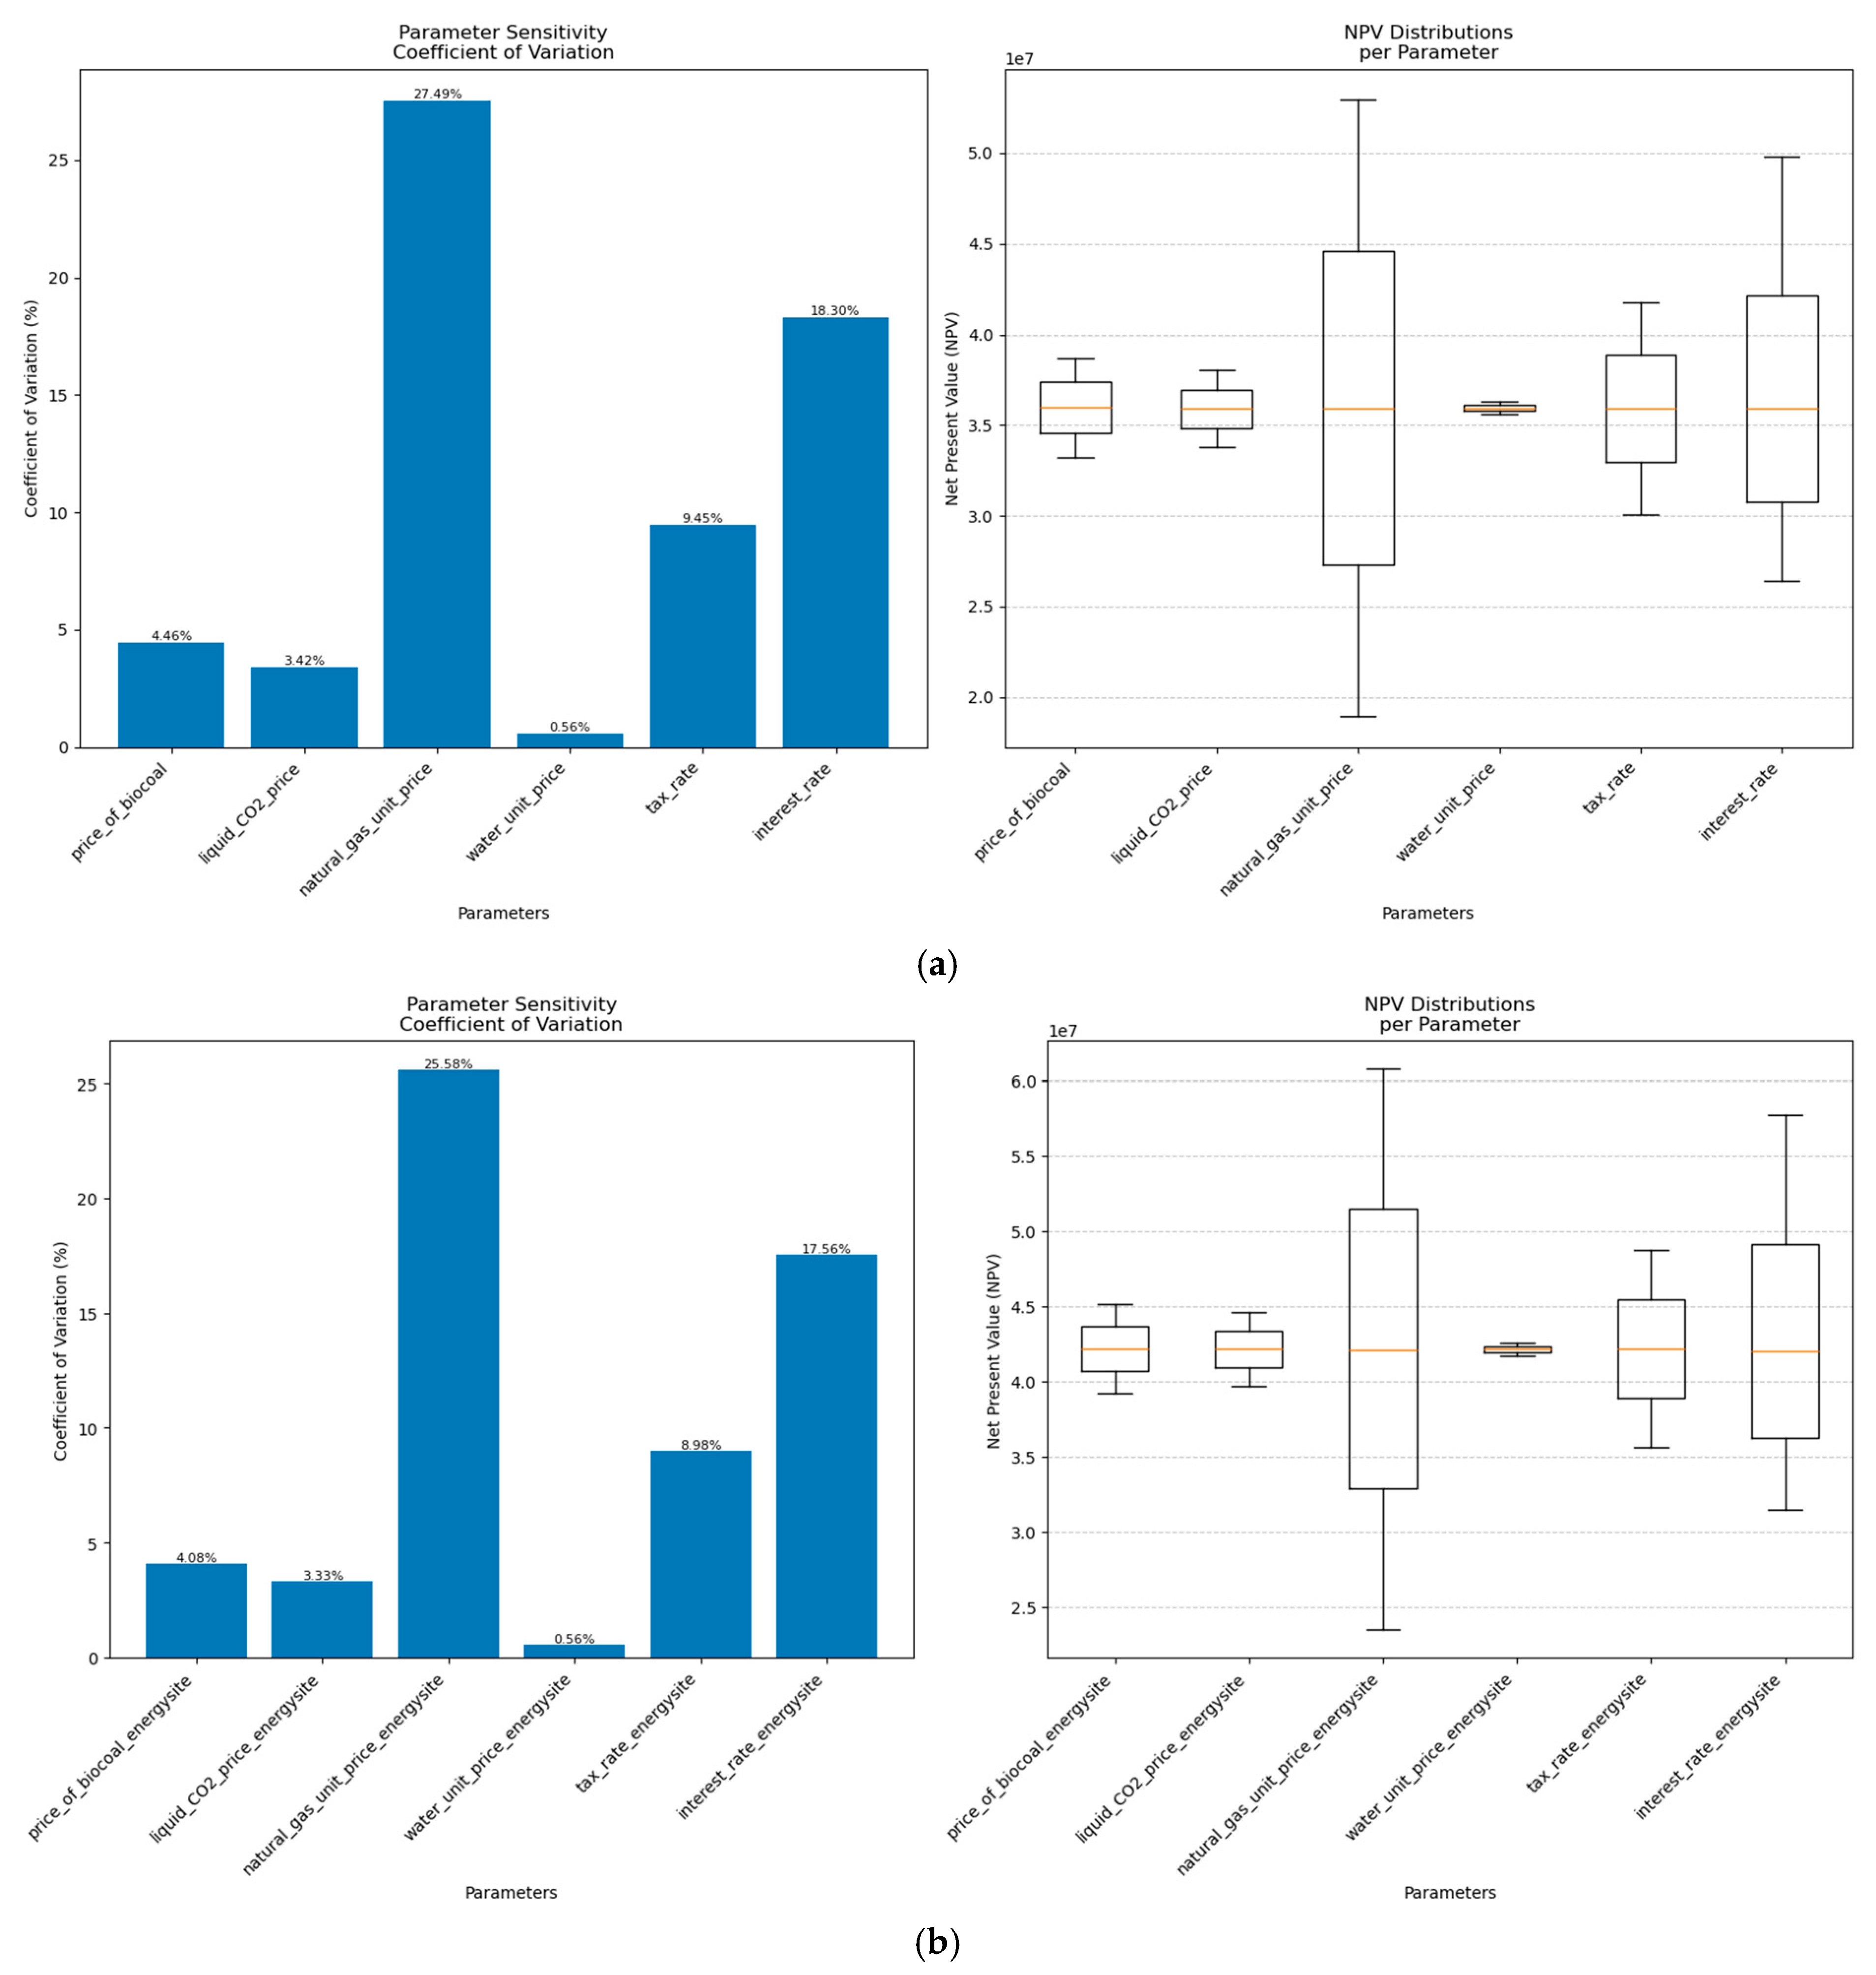
Figure 17 presents a simulation systematically varying key variables within ±50% of base-case values, quantifying uncertainty and risks associated with AD plant investment over 20 years. The analysis focused on six parameters: bio-coal price, liquid CO
2 price, natural gas unit price, water unit price, tax rate, and interest rate across scenarios including (a) mix1 site with membrane-based CO
2 separation and liquefaction and torrefaction digestate treatment; (b) mix2 site with membrane-based CO
2 separation and liquefaction and torrefaction digestate treatment; (c) mix1 site with cryogenic CO
2 capture and torrefaction digestate treatment; and (d) mix1 site with membrane-based CO
2 separation and base-case digestate treatment. The blue rectangular bars represent financial parameter variability, showing how changes directly influence AD plant economic performance. The 20-year NPV demonstrates highest sensitivity to product sale prices, particularly natural gas and tax rate, as well as interest rate. Liquid CO
2 market price significantly impacts overall economics, affecting revenue streams and financial viability. Natural gas price emerged as the most critical parameter across all scenarios, with sensitivity percentages reaching 20%, while water price had minimal impact at below 0.5%.
Figure 17 also provides a comprehensive visualization of NPV variations for key financial parameters. Notably, no negative NPV occurred when variables fluctuated within the ±50% range across scenarios (a) through (d). Natural gas price and interest rate were the most significant factors affecting NPV magnitude. When natural gas price fluctuated within the ±50% range, the NPV changed by at least 30% in each scenario.
4. Conclusions
This study conducted a detailed techno-economic analysis (TEA) of anaerobic digestion (AD) systems integrated with carbon capture and digestate treatment technologies through an innovative AI-agent framework that transforms traditional TEA models into accessible analytical tools. The AI-agent integration enables stakeholders—including farmers, small-scale operators, and policymakers—to conduct complex economic evaluations without specialized expertise, supporting broader AD technology adoption by eliminating reliance on costly consultants.
The AI-enhanced TEA model revealed that the maize–rye blend (mix2) with membrane-based CO2 separation achieves optimal economic performance, generating an NPV of GBP 19 million, a 36% IRR, and a 3-year payback period, while outperforming cryogenic systems in energy consumption (2400 MWh/y vs. 3000 MWh/y) and revenue generation (GBP 4.0 million/y vs. GBP 3.5 million/y). The automated sensitivity analysis identified natural gas prices and tax rates as the most critical factors affecting project viability, while base-case digestate separation proved more economically favorable than torrefaction. This research demonstrates that AI-agent TEA frameworks successfully democratize complex renewable energy assessments, providing valuable insights for investors, policymakers, and industry stakeholders seeking to advance sustainable waste-to-energy solutions while contributing to global decarbonization efforts.
