Abstract
With the increasing penetration of distributed energy resources (DERs) in distribution networks, traditional passive distribution systems are evolving into active and flexible systems capable of participating in the transmission-level energy market. Integrating distribution networks into a transmission-centric market-clearing model introduces challenges, such as capturing internal operational constraints and reflecting the economic features of distribution systems. To this end, this paper proposes a market integration method for distribution networks based on a feasible region and an accompanying bidding strategic bidding method to enable their efficient participation in the transmission-level electricity market. With a two-stage adaptive robust optimization framework, the feasible region that preserves operational characteristics of the distribution system and ensures the satisfaction of operational constraints within the distribution system is first depicted. The feasible region appears as time-coupled box-shaped regions. On this basis, a strategic bidding method is proposed based on the nested segmentation of the feasible region, jointly considering power and reserve. With it, the bidding prices of energy and reserve can be prepared, and then, together with the feasible region, can be smoothly integrated into the transmission-level market model. Numerical case studies demonstrate the effectiveness of the proposed method.
1. Introduction
In recent years, with the increasing penetration of distributed energy resources (DERs) in distribution networks, traditional distribution systems have gradually transformed from passive networks that merely respond to load demands into power resources with high flexibility and active regulation capabilities [1]. The emerging landscape shift enables distribution networks not only to meet local power demands but also to participate in the optimization and regulation of transmission system operations. Distribution networks with certain regulation capabilities are increasingly regarded as dispatchable resources that can effectively participate in the energy market by providing active power and reserve capacity to deal with real-time supply–demand imbalances, renewable energy fluctuations, and unexpected contingencies, thereby enhancing safe, reliable, and economic grid operation while enhancing the integration of DERs. Therefore, from the perspective of the energy market, developing effective clearing models is a key driving force for promoting the deep integration of DERS, while from the distribution network side, reasonably assessing the operational characteristics and strategically formulating bidding strategies are essential for effective market participation.
However, integrating distribution networks in electricity markets inevitably introduces new challenges to the traditional market-clearing model that is historically transmission-centric. Typically, passive distribution networks are practically modeled as fixed loads with forecasting feed-in, which has become an outdated simplification. To flexibly dispatch distribution networks, it is important to fully consider their internal operational constraints, such as power flow limits, voltage limits, and nodal power balance. Otherwise, under-response to dispatch instructions, local flow congestion, and voltage violations could arise. However, in fact, it is difficult to accurately capture the operational constraints and internal behaviors at the distribution level. This is because accurately representing the internal structure and resource characteristics of distribution networks during the clearing process often requires incorporating detailed models of numerous distributed energy resources, which significantly increases the dimensionality and computational complexity of the original market-clearing model, potentially leading to a sharp decline in solving efficiency. Moreover, the operational data of distribution networks tend to be highly commercially sensitive; fully disclosing their network topology, node information, and resource parameters may pose risks to data privacy and security.
In recent years, feasible operational region has been extensively studied. The essence of feasible region projection lies in eliminating a subset of variables from a high-dimensional optimization problem, retaining variables of power injection through the interconnection bus. On the one hand, this results in a simplified, lower-dimensional equivalent region that preserves the most critical decision-related characteristics of the external system, and on the other hand, for any operating point within the feasible region, the distribution system can recover a corresponding dispatch solution.
The concept of casting a region defined by the active and reactive power injections at the interconnection bus around a given operating point was pioneered by reference [2], which, with further development, gradually evolved into the concept of the feasible region. Reference [3] proposed a convex polytope-based representation method to efficiently aggregate flexibility of distributed energy resources before market clearing and disaggregate after market clearing, enabling power market participation. Reference [4] proposed a feasible region projection method to build a multi-period DER aggregation model that considers both network and economic constraints. Moreover, in this work, the progressive vertex enumeration (PVE) approach on the basis of the Quickhull algorithm is extended to enable projection computation for high-dimensional feasible regions. Reference [5] considered the characteristics of three-phase imbalance and line impedance uncertainty in distribution networks, and proposed a feasible region depicting method based on robust optimization. The proposed model is built upon a linear unbalanced three-phase power flow framework and employs the Motzkin transposition theorem to reformulate it as a non-convex problem with bilinear terms. Finally, an iterative algorithm is adopted to solve the model, ultimately yielding a robust feasible region that accounts for parameter uncertainties. The feasible operational region is also referred to as the dispatchable region in some works. Considering a second-order cone programming (SOCP) based power flow model of distribution networks, reference [6] proposed an approximate-depicting method for the schedulable region. By relaxing the AC power flow model and utilizing its dual problem to construct a convex polyhedral approximation, the method improves the accuracy of depicting the non-convex schedulable region. Reference [7] adopted an approximate SOCP relaxation approach to develop a schedulable region model for active distribution networks and employed an adaptive constraint generation algorithm to enhance both computational efficiency and model accuracy. Reference [8] considered distribution networks with multiple interconnection buses to the transmission system and proposed a Gaussian elimination and Fourier–Motzkin elimination combined method to project operational constraints onto boundary port variables. On this basis, reference [9] introduces acceleration techniques such as boundary filtering. However, Fourier–Motzkin elimination would increase the number of inequalities exponentially during the variable elimination process, potentially leading to exponential computational complexity. To this end, references [8,9] integrate an inactive constraint identification method to remove redundant constraints during the elimination process. Considering the computational complexity of Fourier–Motzkin elimination, kth-order approximate models and two types of multi-timescale approximate models are proposed in reference [10]. A transmission system operator–distribution system operator coordination framework is developed by embedding temporally coupled constraints of feasible regions in reference [11]. To achieve convergence, an outer progressive approximation algorithm is introduced, which iteratively incorporates feasibility cuts until the solution stabilizes. Reference [12] proposed an inner-box approximation method to measure the aggregate flexibility. Three trajectories are considered, including the upper, the base, and the lower, where the base takes cost-effectiveness into consideration, and the remaining two define the feasible regions. Reference [13], from the perspective of the distribution network, proposed a temporally coupled feasible region depicting method by reconstructing the projection problem with a max–min optimization problem.
Constructing bids for distribution networks after integrating DERs while respecting operational limitations is a key problem in the current electricity market reform. The bidding construction involves the participation and coordination mechanisms of DERs under network constraints. With the widespread integration of DERs, the traditional load-centralized bidding model faces challenges, prompting researchers to propose various innovative approaches to address these issues. Reference [14] proposed an alliance bidding strategy for aggregators representing photovoltaic-energy storage system users. A bi-level optimization model is proposed, where the upper level focuses on maximizing the aggregator’s profit, and the lower level represents the market-clearing model of the distribution system, aiming to enhance the competitiveness of small-scale users in market participation. Reference [15] designed a coordination mechanism between distribution system operators and distributed energy resource aggregators. A forward auction is used to allocate quotas of power that can be bid in the wholesale market under the condition of complying with network constraints. Reference [16] proposed a game-theoretic bidding model for day-ahead markets, employing a bi-level optimization framework to coordinate competition among participants such as microgrids and distributed generators (DGs). Reference [17] compared five bidding strategies and highlighted their tradeoffs and advantages. Based on output forecasts of renewable energy resources, reference [18] proposed a multi-objective optimization for bidding into the day-ahead market and a deep-learning-based rolling model to bid into the real-time market. Focusing on energy storage, reference [19] proposed a strategy of arbitrage using reserved storage capacity. Reference [20] particularly considered market operation and bidding strategies under extreme weather conditions.
From the market perspective, while various bidding strategies have been explored, most studies focus on power plants and virtual power plants, while few works focus on integrating distribution systems into the energy market model, but do so without fully ensuring internal operational feasibility of distribution systems. Although depicting feasible regions of distribution networks has been extensively studied, a clear research gap exists in integrating distribution systems with computationally efficient feasible regions and strategic bidding mechanisms. Specifically, the coupling between energy and reserve bidding, i.e., joint energy-reserve bidding, remains underexplored. To this end, towards high-DER-penetrated distribution systems, this paper proposes a market integration model and a corresponding bidding method. A day-ahead energy market model is first introduced, considering the joint dispatch of energy and reserve. With detailed operational constraints of the distribution system, a two-stage adaptive robust optimization-based model is built to depict the feasible region of the system. Then, on this basis, a joint energy and reserve strategic bidding model based on the nest segmented feasible region is further proposed, enhancing the distribution side’s ability to respond to market price signals and improving scheduling flexibility.
The contributions of this paper are twofold:
- Using feasible regions that are cast by a two-stage adaptive robust optimization framework to capture detailed operational constraints of high-DER-penetrated distribution systems, distribution systems are securely integrated into the day-ahead market.
- Building on the feasible region, a joint energy-reserve bidding strategy based on the nested segmented feasible region is proposed, enhancing the distribution side’s responsiveness to market price signals and improving scheduling flexibility.
The rest of this paper is organized as follows: Section 2 introduces the modeling of the transmission and distribution side; Section 3 discusses the construction of the feasible region and the bid of the distribution system; numerical case studies are presented in Section 4; and Section 5 concludes the paper.
2. The Modeling of the Transmission and Distribution Side
2.1. The Day-Ahead Energy Market Model
The meanings of symbols and notations used in this paper are collected in the nomenclature at the end. A basic day-ahead energy market model based on shift factors is formulated as (1)–(13). The model includes operational constraints of thermal units, such as minimum ON/OFF time, output range, and ramping capability, and system-level constraints, including power balance constraints, power flow limits, and reserve capacity limits. Typically, the power flow model of the day-ahead energy market model is based on shift factors.
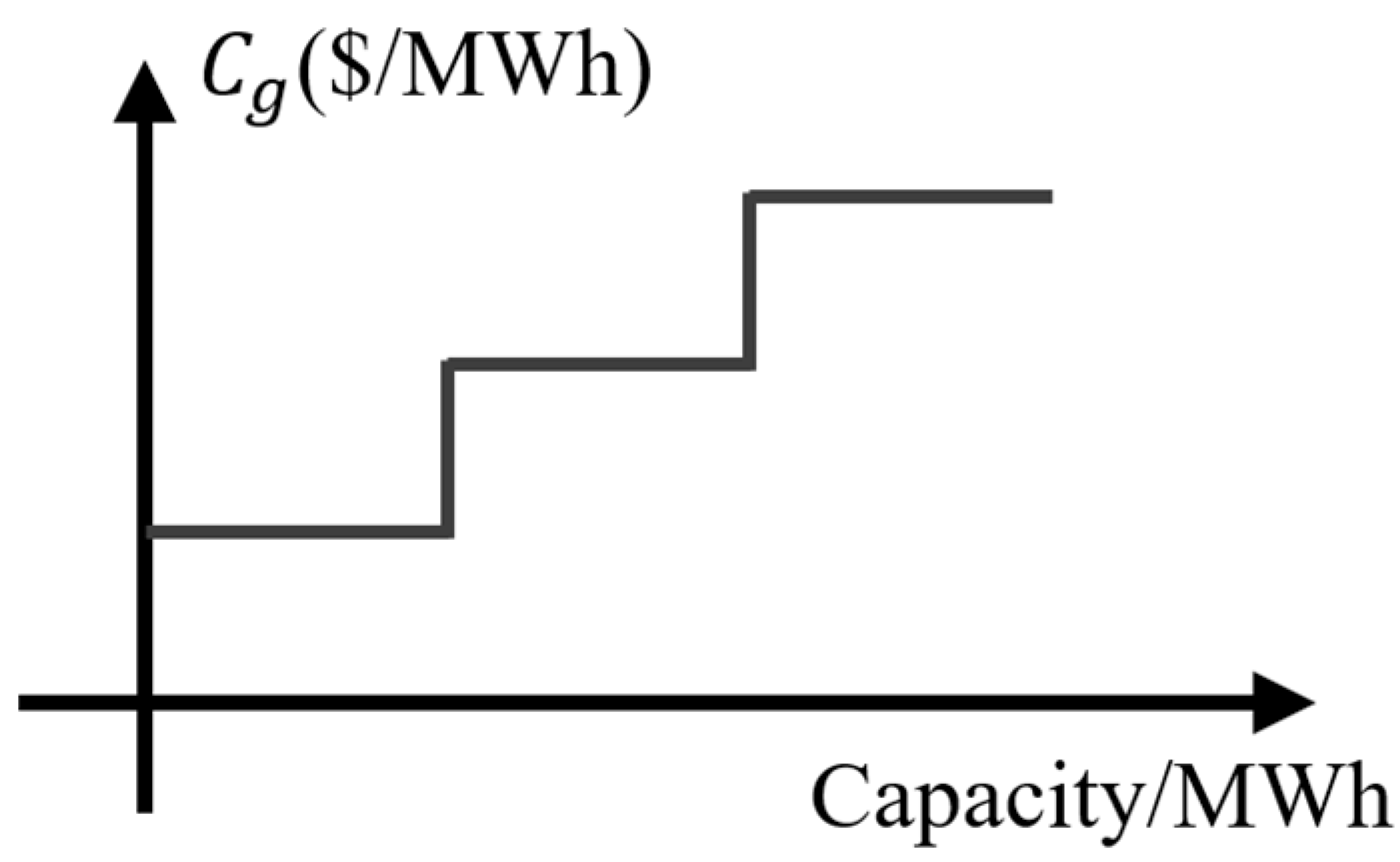
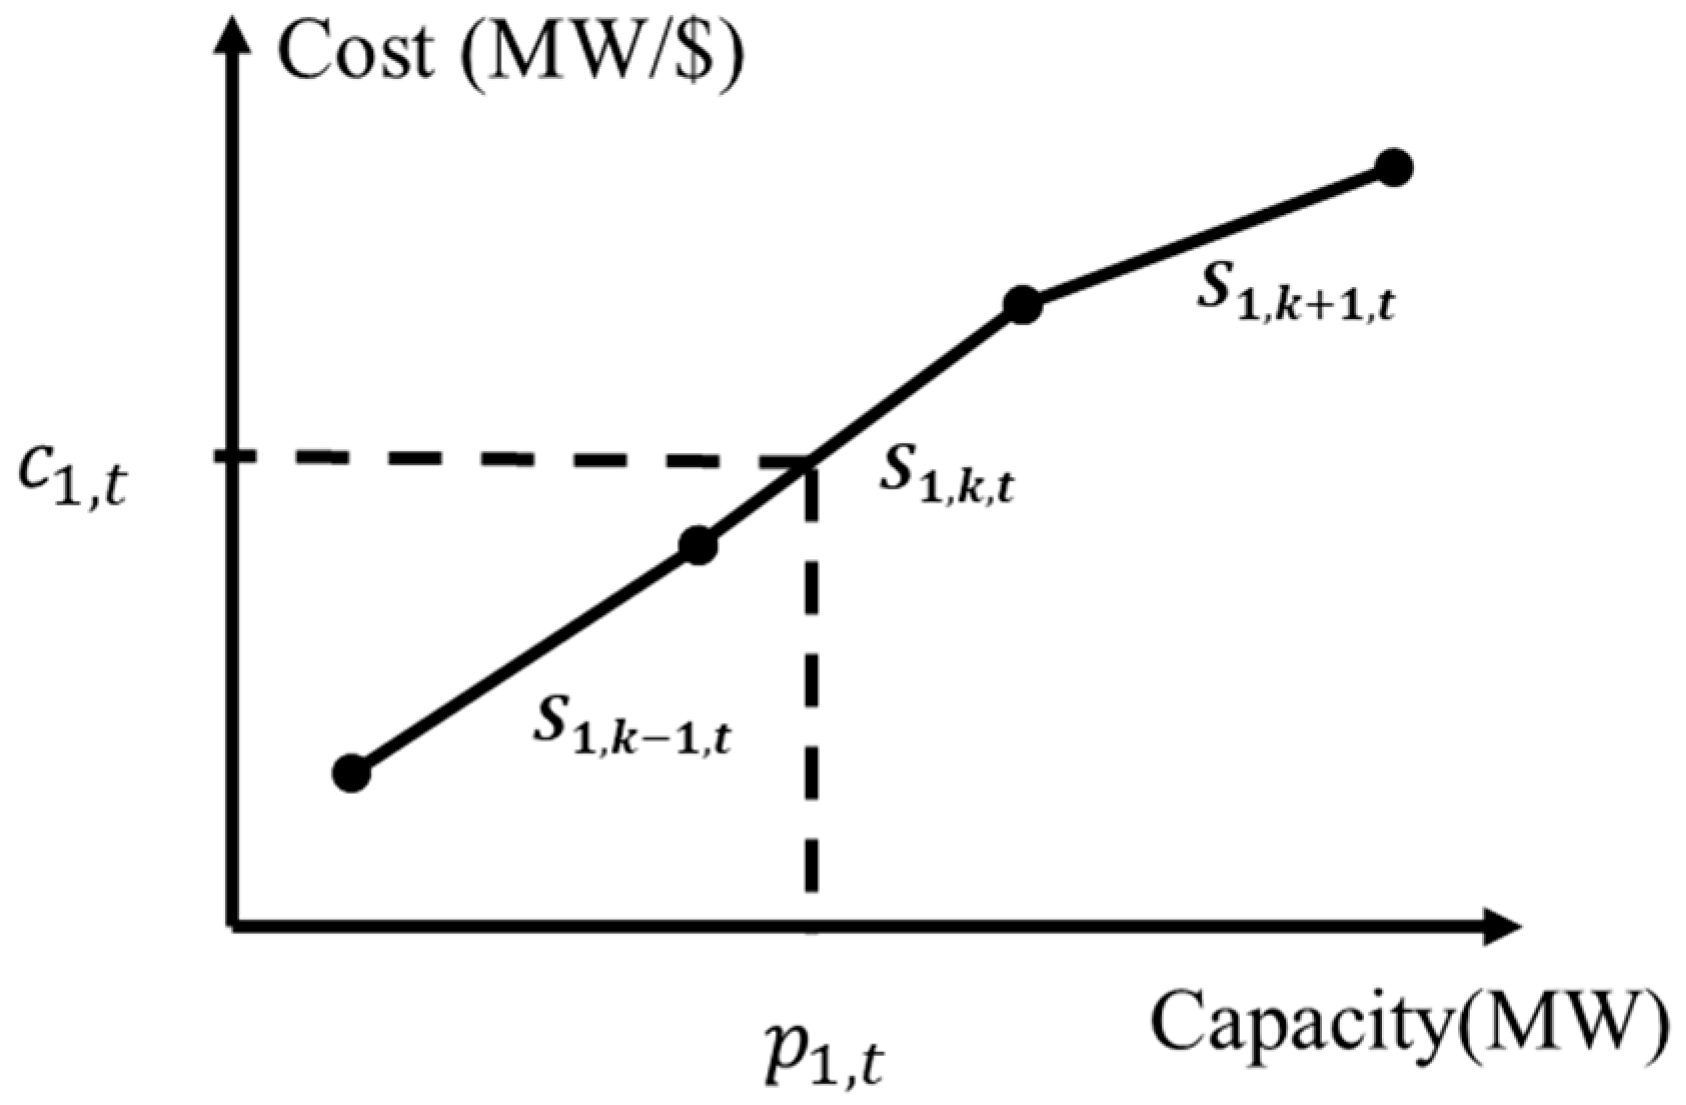
The objective is to minimize the system operating cost, considering the bids for distribution networks. The first term includes energy cost, reserve cost, no-load loss cost, and startup cost of the thermal units, and the second term includes the energy and reserve costs on the distribution side. The term represents the bid of unit at time period , while denotes the bid associated with providing reserve. Specifically, represents the bid provided by distribution network at time period , while denotes the bid associated with providing reserve of distribution network at time period . Both and are monotonically increasing bidding curves, as shown in Figure 1. Similarly, and follow the same form. The construction of then will be discussed in the next section.
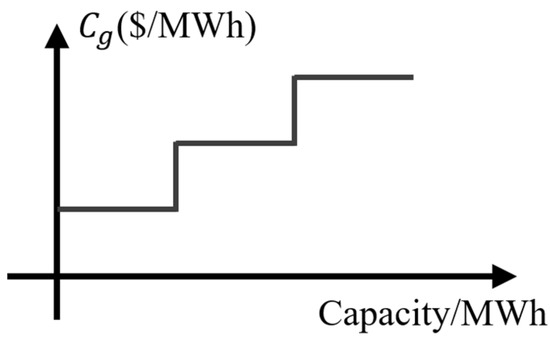
Figure 1.
Monotonically increasing bidding curve example.
The constraints of the day-ahead energy market model can be categorized into two groups: unit-level constraints and system-level constraints.
- Unit-level constraints
- Unit power output and reserve constraints:Constraint (2) ensures that the sum of the generation output and reserve capacity of a unit remains within its allowable power output range, while constraint (3) enforces the scheduled reserve to be non-negative.
- Startup and shutdown logic constraint:Constraints (4)–(5) adopt the classic “three-binary” formulation to represent the startup and shutdown logic of thermal units.
- Minimum ON/OFF time constraints:The minimum ON and OFF time limits of units are imposed by constraints (6)–(7), which ensure that once a unit is started up or shut down, it must remain in operation or stay OFF for, respectively, no less than the minimum ON time or minimum OFF time .
- Ramping rate constraints of units:Constraints (8)–(9) represent the ramp-up and ramp-down limits of units during operation while also taking into account the ramping rates during startup and shutdown processes.
- 2.
- System-level constraints
- System power balance constraint:Constraint (10) ensures the system power balance at each time interval. The power generation from units and DER-penetrated distribution systems together support the fixed loads.
- Line flow constraints:Constraint (11) uses shift factors to calculate the power flow on transmission lines. includes the flow contribution from units, distribution systems, and fixed loads. Constraint (12) then imposes upper and lower bounds on the power flow through the line to secure operation.
- Reserve capacity requirement constraints:Constraint (13) enforces the requirement that the total system reserve capacity provided by units and distribution systems should meet the system’s security reserve demand at each time interval. This constraint ensures that sufficient backup capacity is available to handle uncertainties such as load fluctuations or renewable generation variability.
2.2. The Operational Constraints of the Distribution System
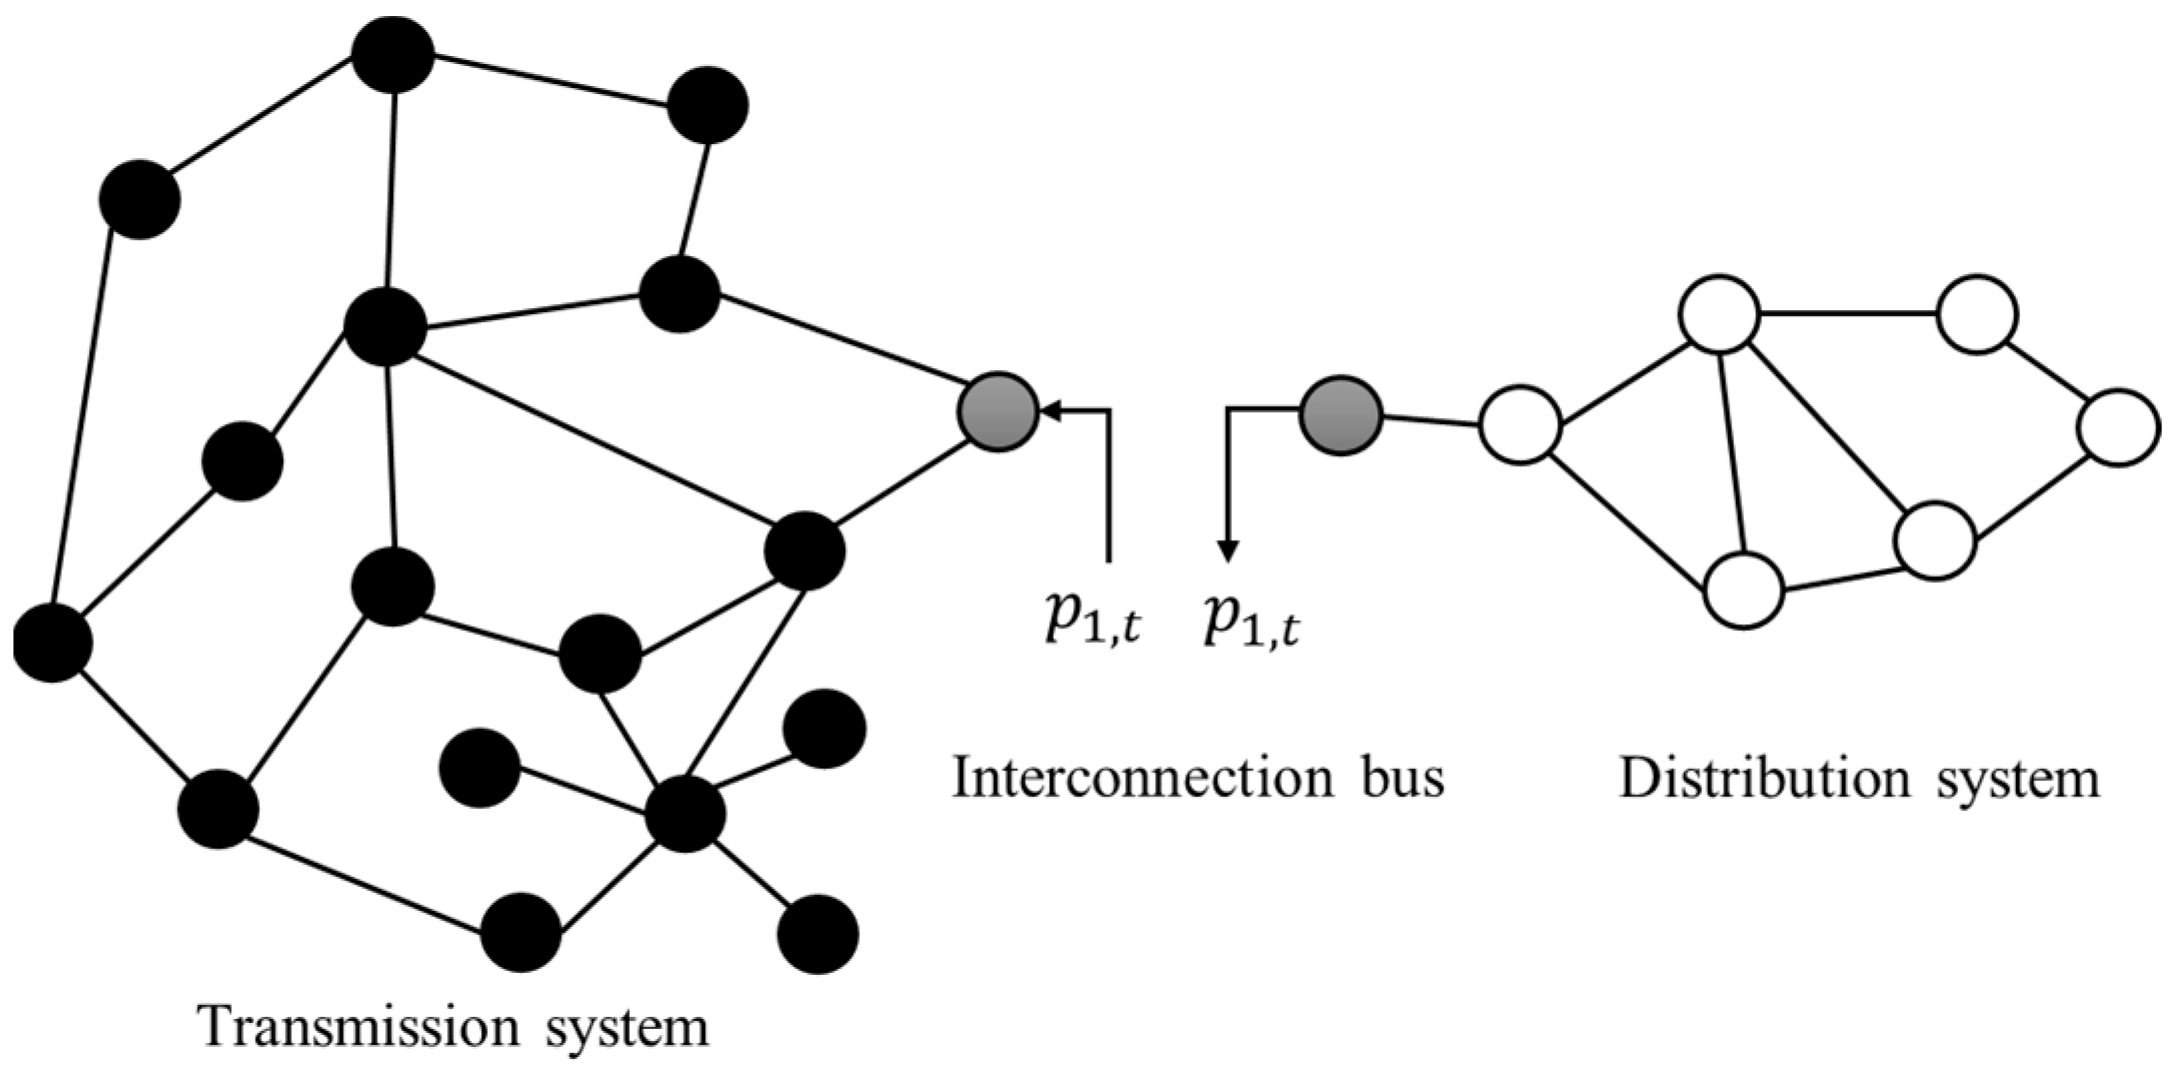
This paper considers typical single interconnection bus-connected distribution systems. Figure 2 illustrates the connection structure. We define injection as the positive direction and the injection power to the transmission side, denoted as , is determined by the output power of the distribution side, revealing a univariate coupling between the transmission and distribution sides. This indeed provides a foundation for the subsequent method.
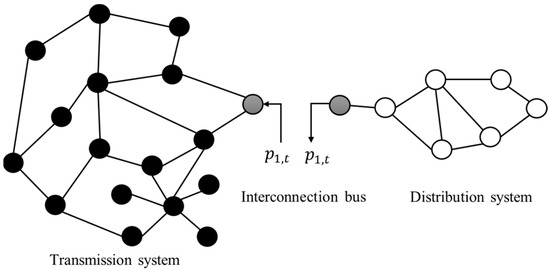
Figure 2.
The example of a single interconnection bus-connected distribution system.
Compared to transmission systems, distribution networks typically have higher resistance-to-reactance ratios, which makes reactive power flows have a more pronounced impact on system voltage. Therefore, in modeling distribution networks, both active and reactive power flows should be considered, and voltage magnitude constraints should be imposed on nodes as they are more susceptible to power injections. In this paper, we adopt the method proposed in [21] and model the distribution system using an approximate linear power flow model based on voltage magnitudes and voltage phase angles. This model can well capture the operational characteristics of the distribution system while significantly reducing the model’s complexity and computational burden. Using the linearized AC power flow model, the inclusion of reactive power flows enables the calculation and enforcement of bus voltage constraints. Furthermore, unlike the simplified DC flow model that neglects line resistances, both the resistance (R) and reactance (X) of distribution lines are explicitly accounted for. Ensuring the safe operation of the distribution network should satisfy a series of constraints, including nodal power balance, branch power flow limits, nodal voltage constraints, and output range limits of DERs. The specific constraints are formulated in Equations (14)–(28).
- Active and reactive power flow on distribution lines:
Constraints (14) and (15), respectively, describe the active power flow and reactive power flow on line at time . Constraints (14) and (15) are approximate linear power flow formulations based on voltage phase angles, with which the active and reactive power flow are linearized and expressed as a linear combination of voltage magnitude differences and phase angle differences between nodes. and , respectively, denote the real and imaginary parts of the branch admittance, namely conductance and susceptance. It can be seen that both active and reactive power flows are determined by voltage magnitude differences and voltage phase angle differences.
- Nodal power balance constraints:
Constraint (16) represents the active power balance of node at time interval , except for the interconnection bus. represents the power flowing in through the connected lines and represents the power flowing out. Thus, in (16), for a node, the power flowing in is enforced to be equal to the power flowing out.
Constraint (17) represents the corresponding reactive power of node at time interval . Similarly to constraint (16), constraint (17) enforces nodal reactive power balance.
- Active and reactive power flow balance of the interconnection bus:
We set node 1 as the interconnection bus, and constraints (18)–(19) stipulate that the total active and reactive power flowing out from node 1 is equal to the injected power to the transmission system, which are, respectively, denoted as and . As the power injected into the transmission system is defined as the positive direction, negative signs are present in front of and . Constraints (20) and (21) limit the maximum and minimum active and reactive power that the distribution network can inject or withdraw to the transmission system.
- Distribution line active power limit:
Constraint (22) enforces upper and lower bounds of the active power flow on each branch in the distribution network, reflecting the thermal stability limits.
- Nodal voltage constraints:
To ensure the safe and stable operation of the distribution network, the voltage magnitude at each node should be maintained within allowable limits, which is expressed as (23). Constraint (24) fixes the voltage magnitude of the interconnection bus at , designating it as the reference node. is the given substation bus voltage.
- Output constraints of DERs:
Constraints (25) and (26), respectively, specify the active and reactive power output limits of DERs. In addition, the available power reserve is incorporated into constraint (25). Considering the fast startup and shutdown capabilities of DERs, along with their strong ramping ability, typical constraints such as minimum ON/OFF time and ramp limits are generally omitted in this model. Constraint (27) ensures that the reserve provided by DERs is non-negative.
- System reserve constraints:
Constraint (28) calculates the total reserve from DERs of the distribution system at time interval . We use to indicate the reserve from a distribution system, and it is equal to the total reserve from DERs in the distribution system.
3. The Feasible Region and the Bidding Model of the Distribution System
With the operational constraint model of the distribution network, the two-stage adaptive robust optimization method is further introduced to construct the feasible operational region of the distribution system.
3.1. The Feasible Region of the Distribution System
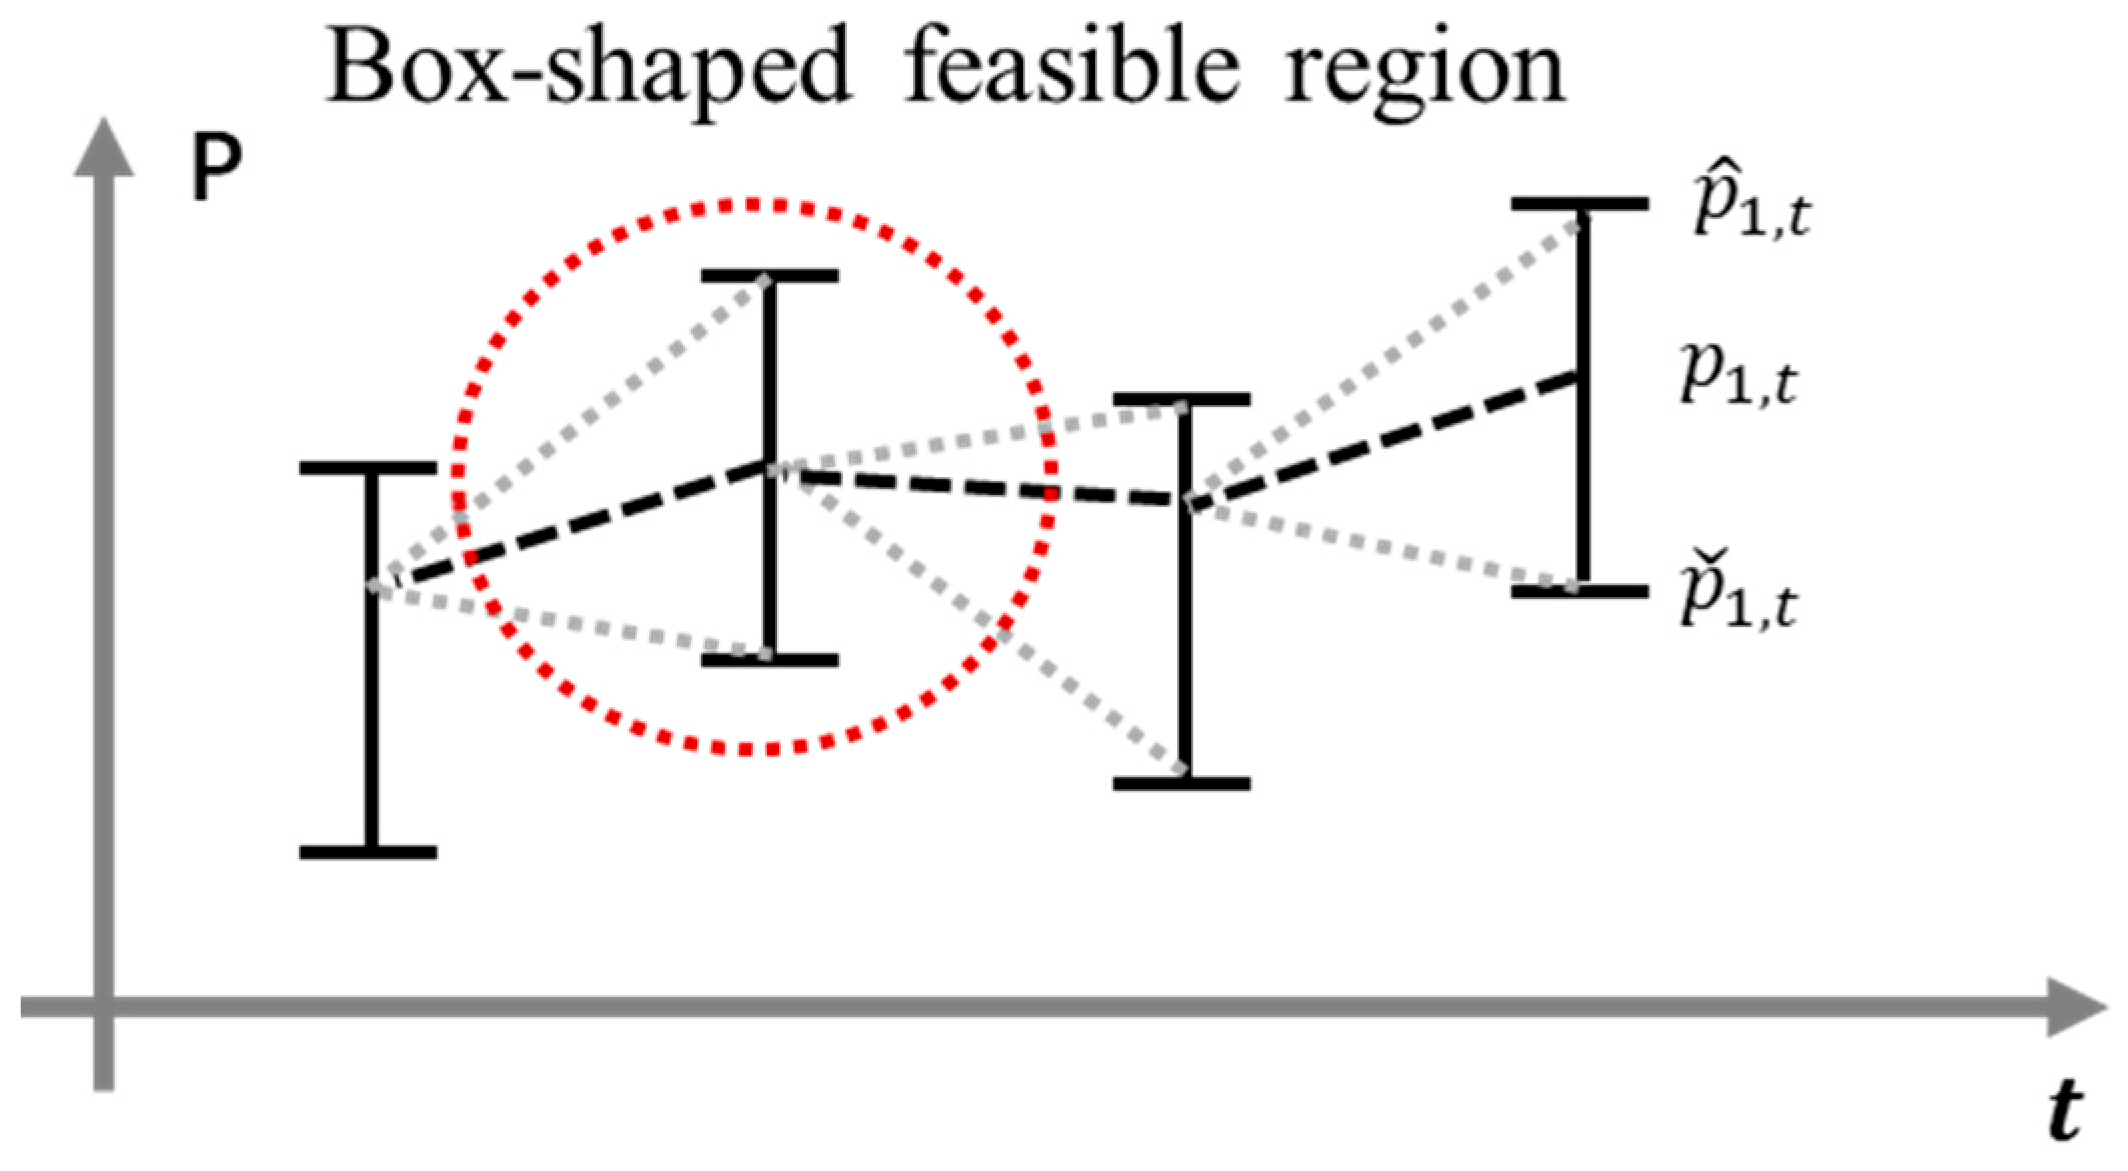
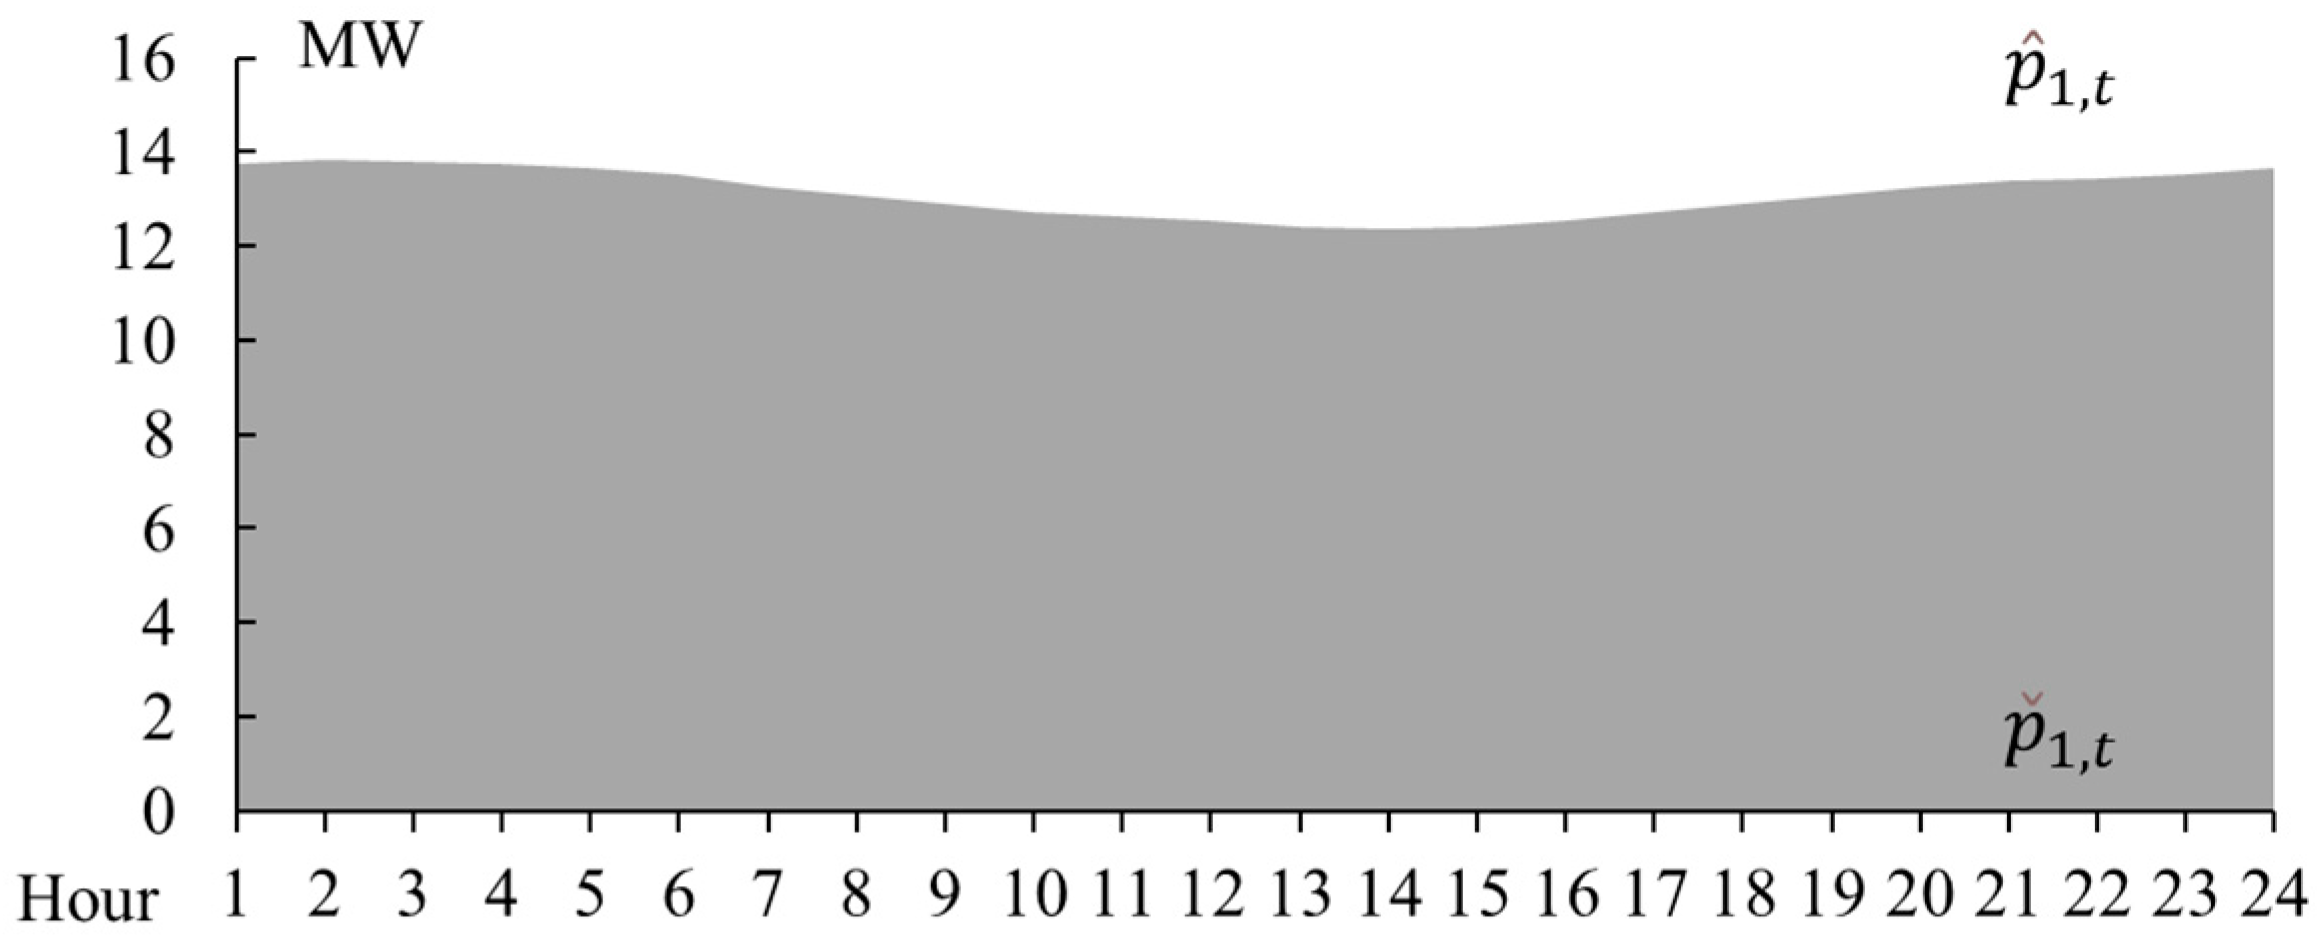
Considering active power injection to the transmission side, the feasible region can be represented as a series of time-coupled box-shaped regions, as formulated in (29) and shown in Figure 3. Each box-shaped region corresponds to a specific time interval, typically one hour. We collect the time series , ,…, and , ,…, using vector . In addition, all the variables appearing in the operation (14)–(28) are collected into vector .
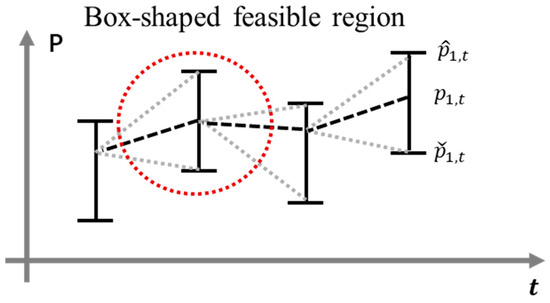
Figure 3.
The example of a series of time-coupled box-shaped feasible regions.
Referring to reference [22], the feasible region of the distribution system can be depicted based on the two-stage adaptive robust optimization model formulated as in (30)–(34). The objective function adopts a max–min–max structure, aiming to expand the series of time-coupled power injection ranges defined in (30) as much as possible, while ensuring operational feasibility, accommodating the worst-case scenario of power injection to the transmission side. In (30), the outermost layer represents the here-and-now decision, where the vector that collects and is determined, maximizing the total width of the ranges over the scheduling time horizon. Vector that collects all is introduced as an uncertain variable and is subject to the uncertainty set defined as in (34). It works in conjunction with constraint (32) to determine the power injection to the transmission side. Given the boundaries of the interval boxes, essentially serves as an indicator to select the worst-case scenario against . works against the objective of the outermost layer.
In response to these worst-case realizations, the innermost layer adaptively schedules DERs to ensure that the required power injection to the transmission side, namely , is satisfied. This constitutes the wait-and-see decision. In sum, variable strives to shrink the ranges to the extent necessary to ensure that, for any given power injection value within the final range, there exists a feasible internal dispatch solution to DERs, namely , within the distribution system. Constraint (31) ensures that is greater than , maintaining a valid range for each time interval. Constraint (32) determines the actual power injection into the transmission side through . Intuitively, and together can represent any value within . Constraint (33) integrates the operational constraints of the distribution network. As constraint (18) has been replaced by (32), it no longer appears in (33). As problem (30)–(33) presents a max–min–max structure, it is not directly solvable by commercial solvers. We adopt the Column-and-Constraint Generation (CCG) algorithm [23] to solve it.
Constraints (14)–(17), (19)–(28);
3.2. The Redispatch Problem of the Distribution System
After market clearing, awarded power and reserve are sent to the distribution system. For certain power and reserve values, the distribution system exactly follows it by dispatching its internal DERs, while the operational feasible region submitted to the transmission side guarantees that a feasible solution, i.e., a schedule to DERs, exists. However, the schedules to the DERs with different operating costs could be more than one, and the distribution system would prefer the one with the lowest cost. To identify the optimal schedule with the lowest cost, the redispatch problem of the distribution system with certain awarded power and reserve is formulated as in (35)–(38). Specifically, the objective is to find an optimal power output of DERs that minimizes the total operating cost, which consists of the generation cost and the reserve costs, while satisfying the operational constraints.
Constraint (36) fixes with and constraint (37) fixes with , namely, fixing the awarded power and reserve. and are, respectively, given power and reserve from the distribution system. Constraint (38), similar to (33), integrates the operational constraints of the distribution network. After solving the redispatch problem, the total objective value can be decomposed into two parts: and . The first term represents the cost of DER energy output, while the second term reflects the cost of reserve capacity. We ignore the startup and shutdown costs of DERs as they are generally small and can be integrated into . We, respectively, denote and as and . Thus, represents the energy cost at given and , and represents the reserve cost at given and . The redispatch problem (35)–(38) can be solved by commercial solvers.
Constraints (14)–(28);
3.3. The Bidding Model of the Distribution System
In the bidding phase of the energy market, the distribution network firstly assesses and manages the generation capacity of DERs, response ability of load demand, and physical constraints. On this basis, after constructing the feasible regions, within the ranges of the feasible regions, it should prepare bidding prices that satisfy the requirement of monotonic increase, and the bidding prices for reserve provision.
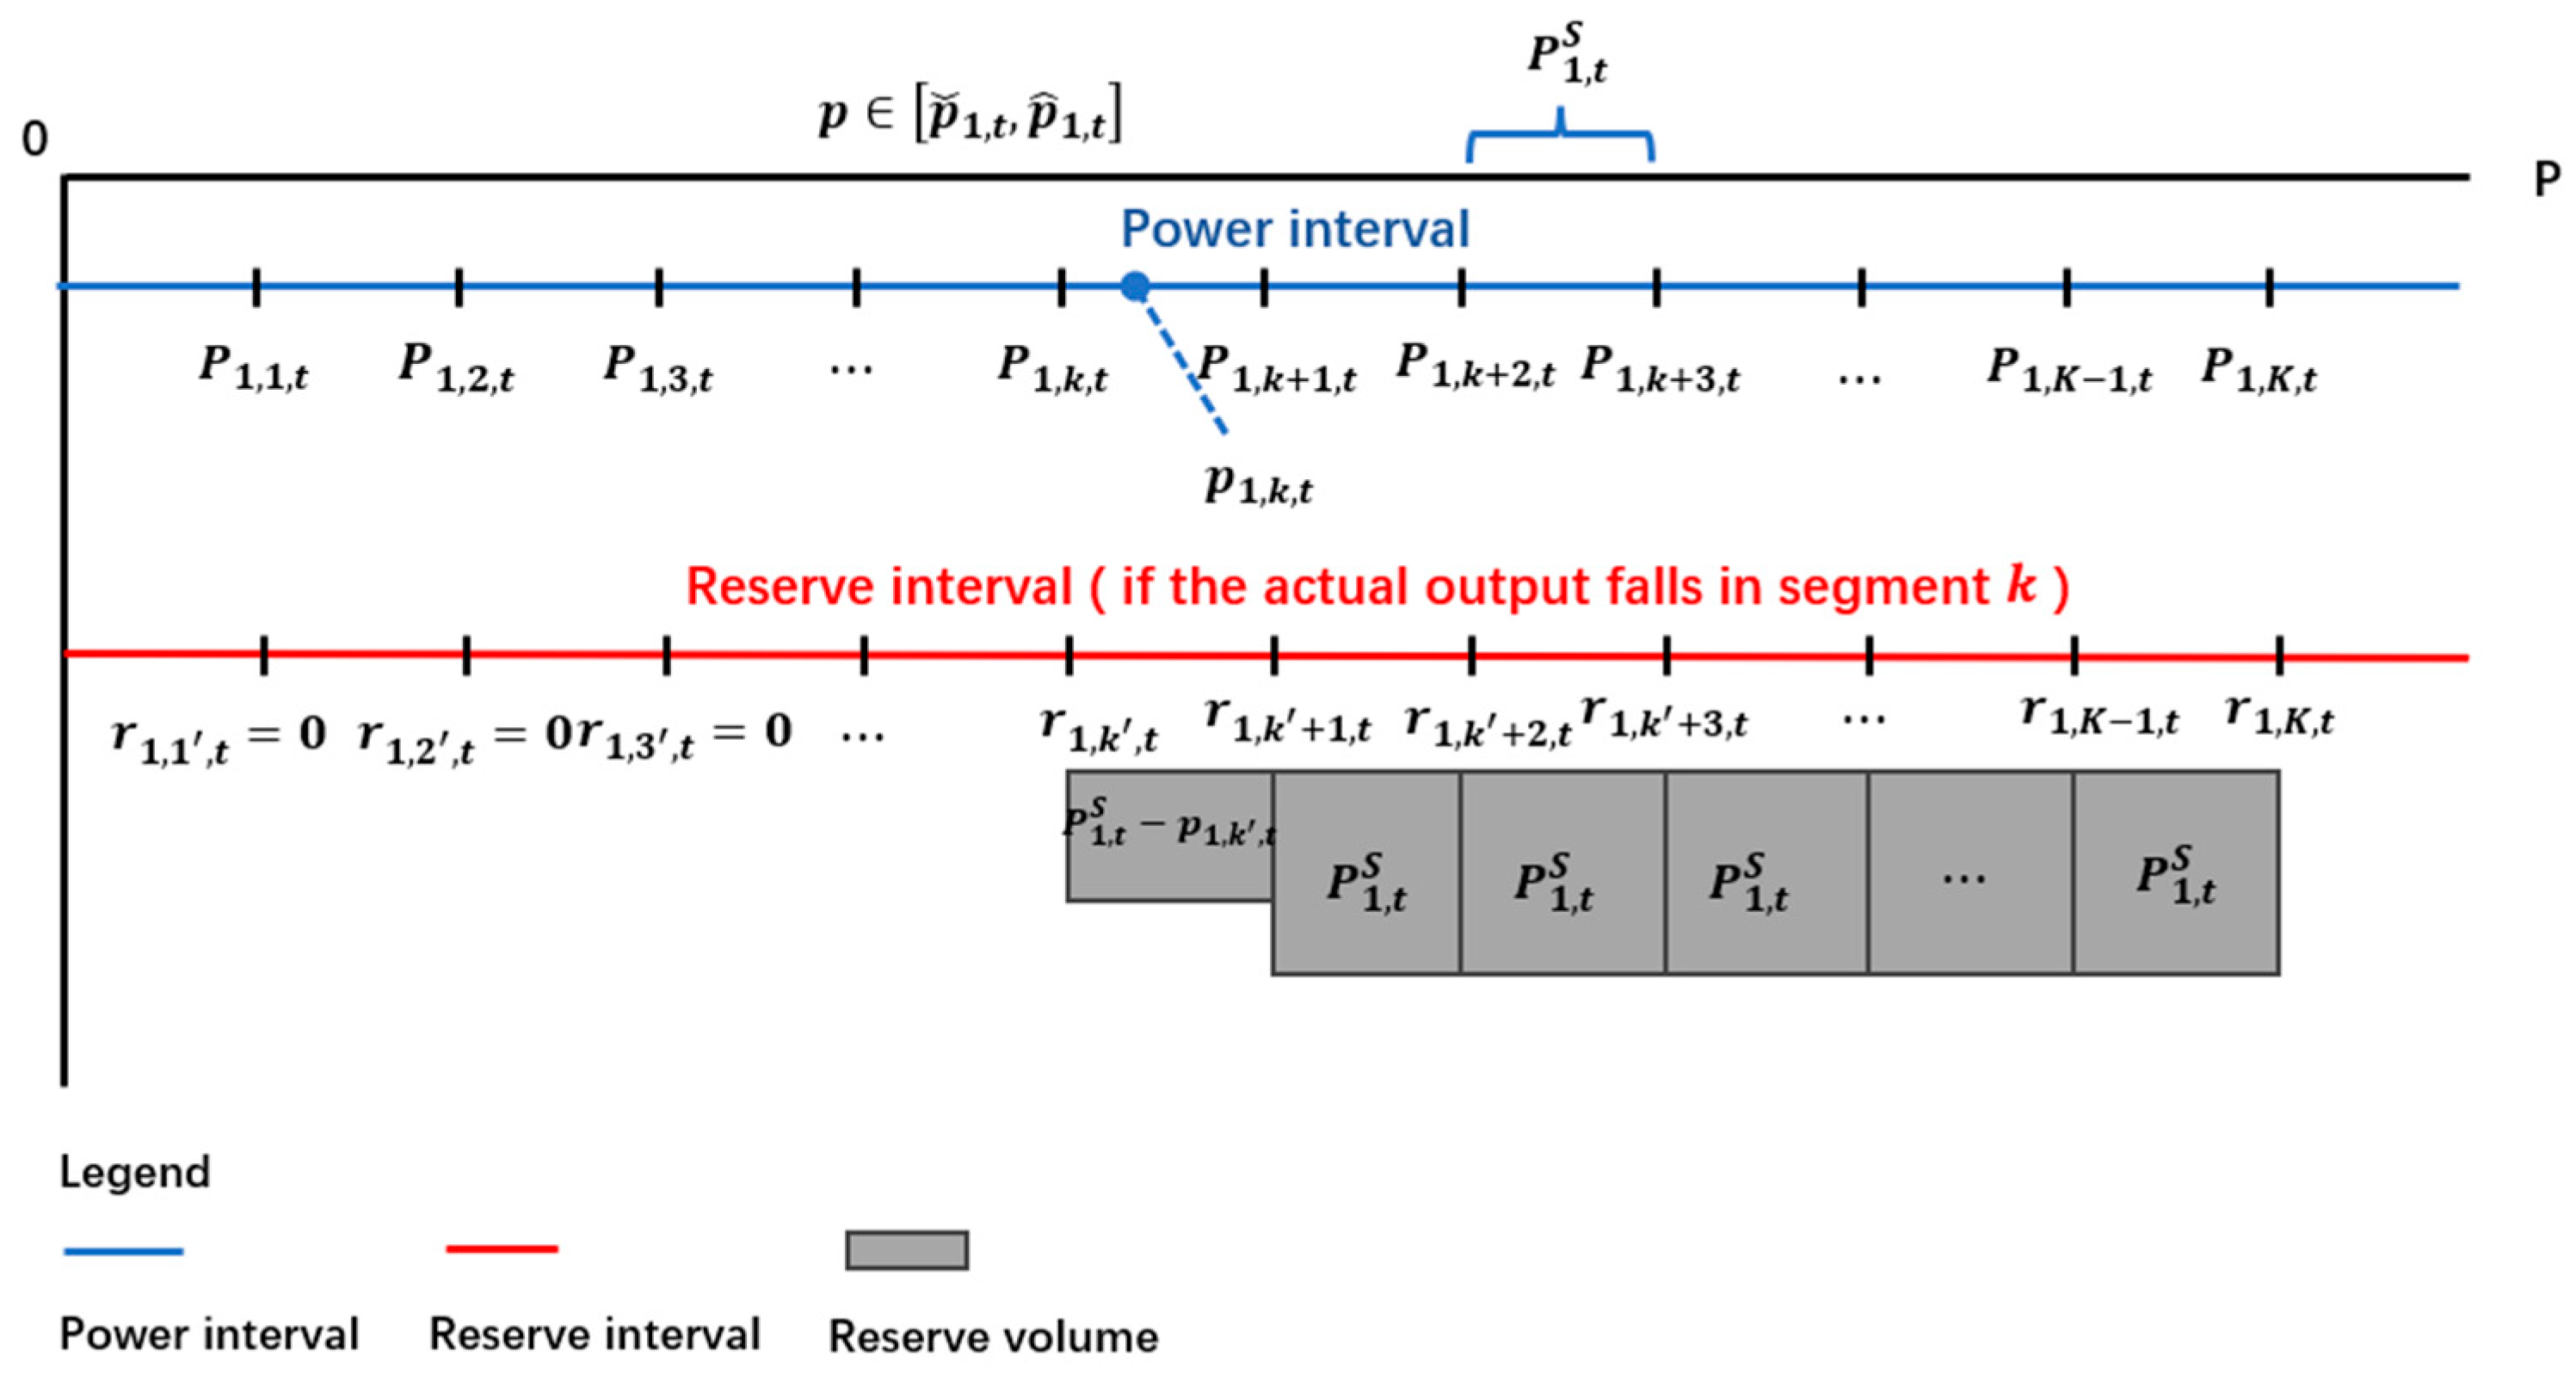
The feasible region obtained based on the two-stage adaptive robust optimization model, i.e., [, shows the output ranges of the injection power over time. On this basis, the output range can then be evenly divided into sub-intervals, each with a length , as in (39). The lower bound, namely endpoint of the segment, corresponding to the -th sub-interval, as calculated with (40), is denoted as , where , as shown in Figure 4.
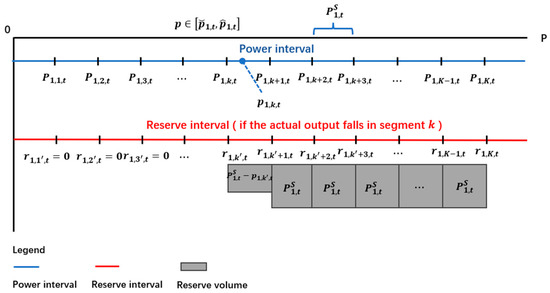
Figure 4.
Illustration of power and reserve segmentation of feasible region.
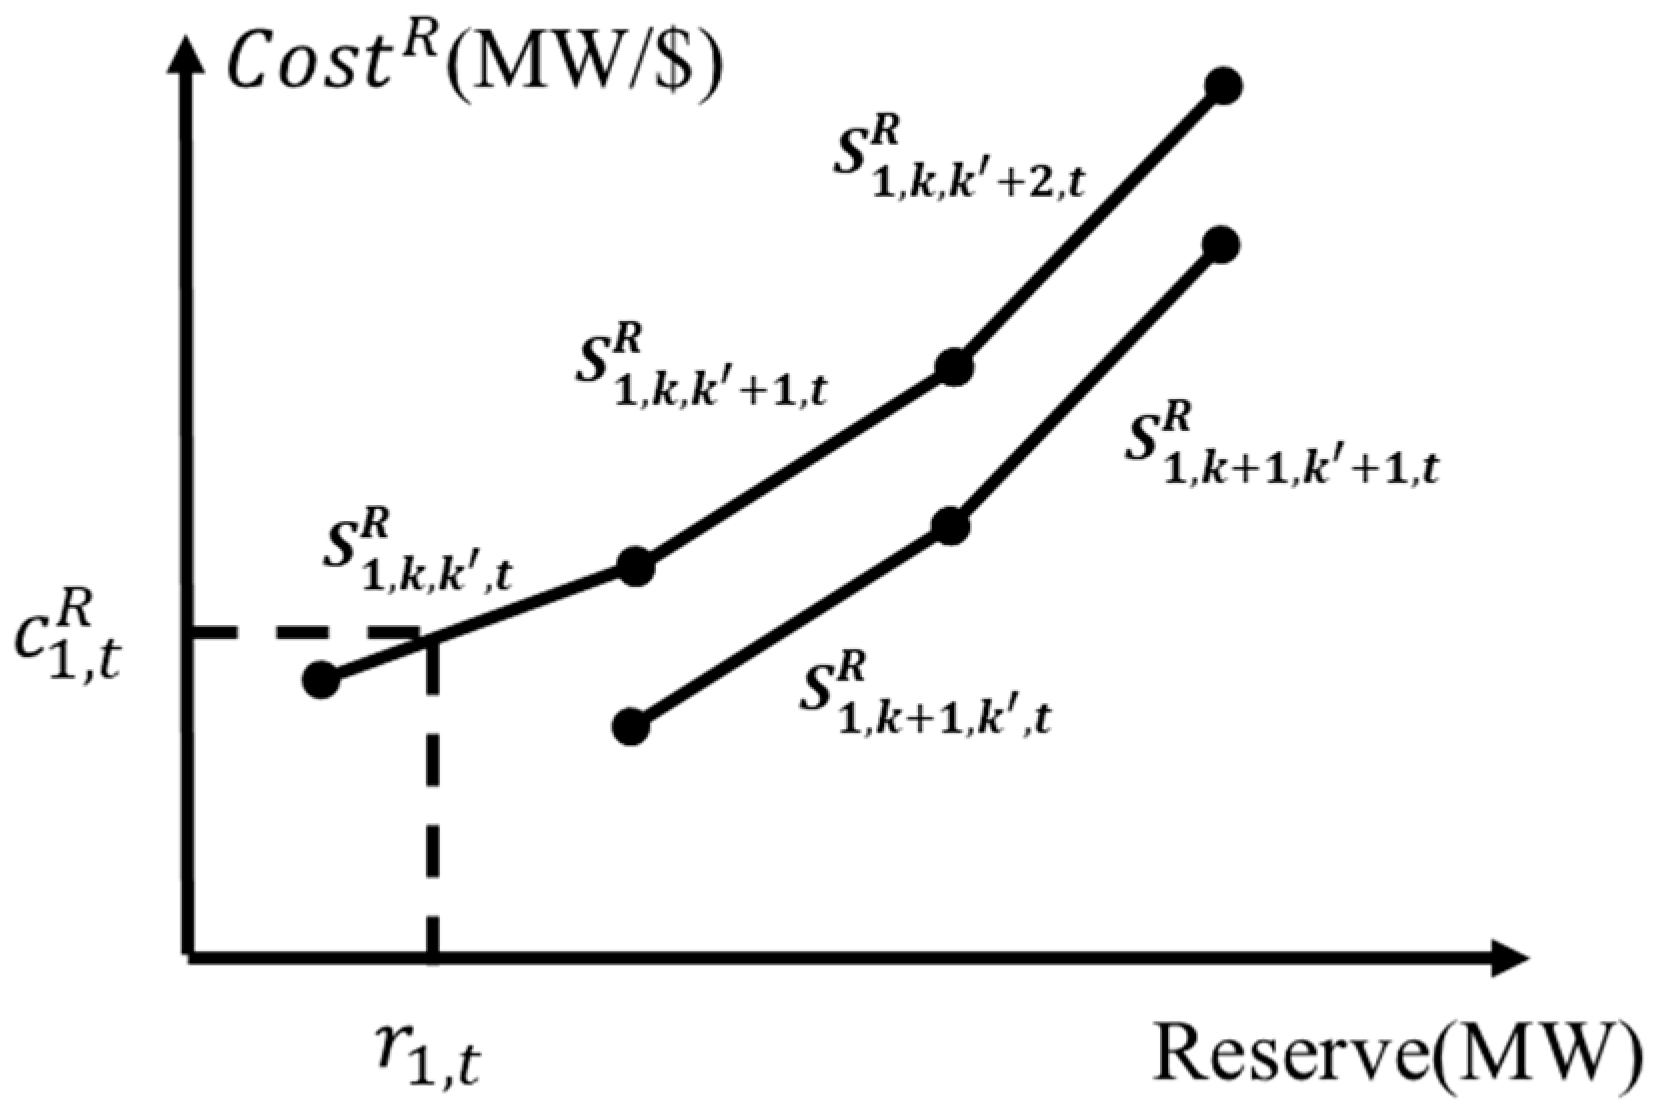
For the reserve, the feasible region is divided into the same segments and indexed by as shown in Figure 4. As an example, when the power output is dispatched to the -th segment as , the available reserve capacity range is [ that corresponds to remaining part of segment and all segments above segment . The remaining part can be represented as . It is worthwhile to emphasize that power and reserve endpoints of the segments remain unchanged, but their respective corresponding costs vary depending on the actually active segment of awarded power. In other words, for different awarded power levels, the corresponding available reserve prices may vary. The examples of energy bids and reserve bids are respectively illustrated in Figure 5 and Figure 6.
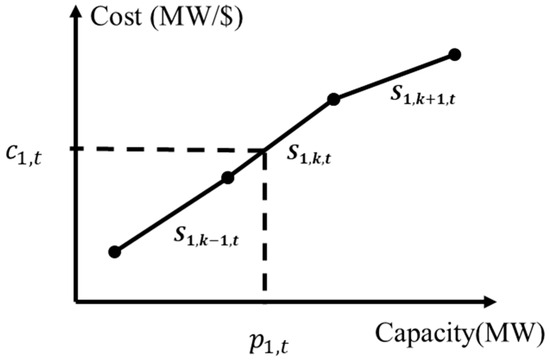
Figure 5.
Energy bid example.
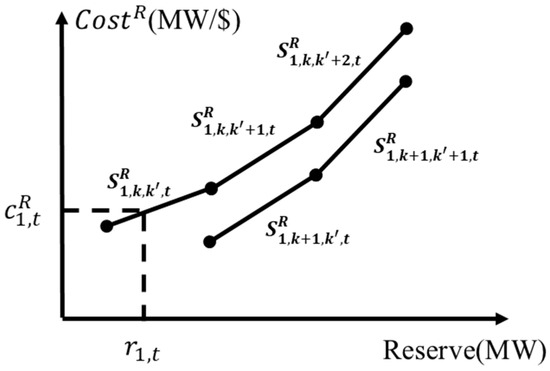
Figure 6.
Reserve bid example.
After segmenting the feasible range, for the endpoints of segments, the corresponding system cost can be obtained by solving the redispatch problem (35)–(38). Therefore, with for all time intervals, i.e., for different but the same , firstly, can be obtained without considering the reserve as in (41). Then, with , the can be set with being to to obtain the cost of different awarded reserves under . With them, can be calculated as in (42). In the bidding model proposed in this paper, a direct linkage is established between energy and reserve bidding prices with the nested segmentation. We use and to indicate segments.
In terms of integrating the energy bid, a piecewise linearized formula is adopted. Constraint (43) represents the awarded power injection through the interconnection bus at time interval , which can be expressed as the endpoint of segment plus the increment on this segment. Binary variable indicates whether the segment is active at time interval . Constraint (44) calculates the cost corresponding to the awarded power injection , where is the slope of segment and is the endpoint of segment . Constraint (45) ensures that the increment on segment is non-zero and limited by when ; otherwise, is fixed to 0. Constraint (46) ensures that only one segment is active at each time interval.
Constraint (47) excludes an unallowable segment of the reserve. As an example, when , should be zero, as a reserve is possible to be provided by segment any more. Constraint (48) calculates the remaining reserve that can be provided on the active segment. When segment is the active segment of power output, is equal to the space from to the upper bound, and if segment inactive, is zero and is limited by the bound. Constraint (49) calculates the reserve from all the segments, and constraint (50) calculates the cost according to for all the segments. As the bidding price of the reserve is monotonically increasing, binary variables are avoided. Constraint (51) determines by introducing the combination of of all , where serves as the selector to pick the bidding price corresponding to the active segment of energy.
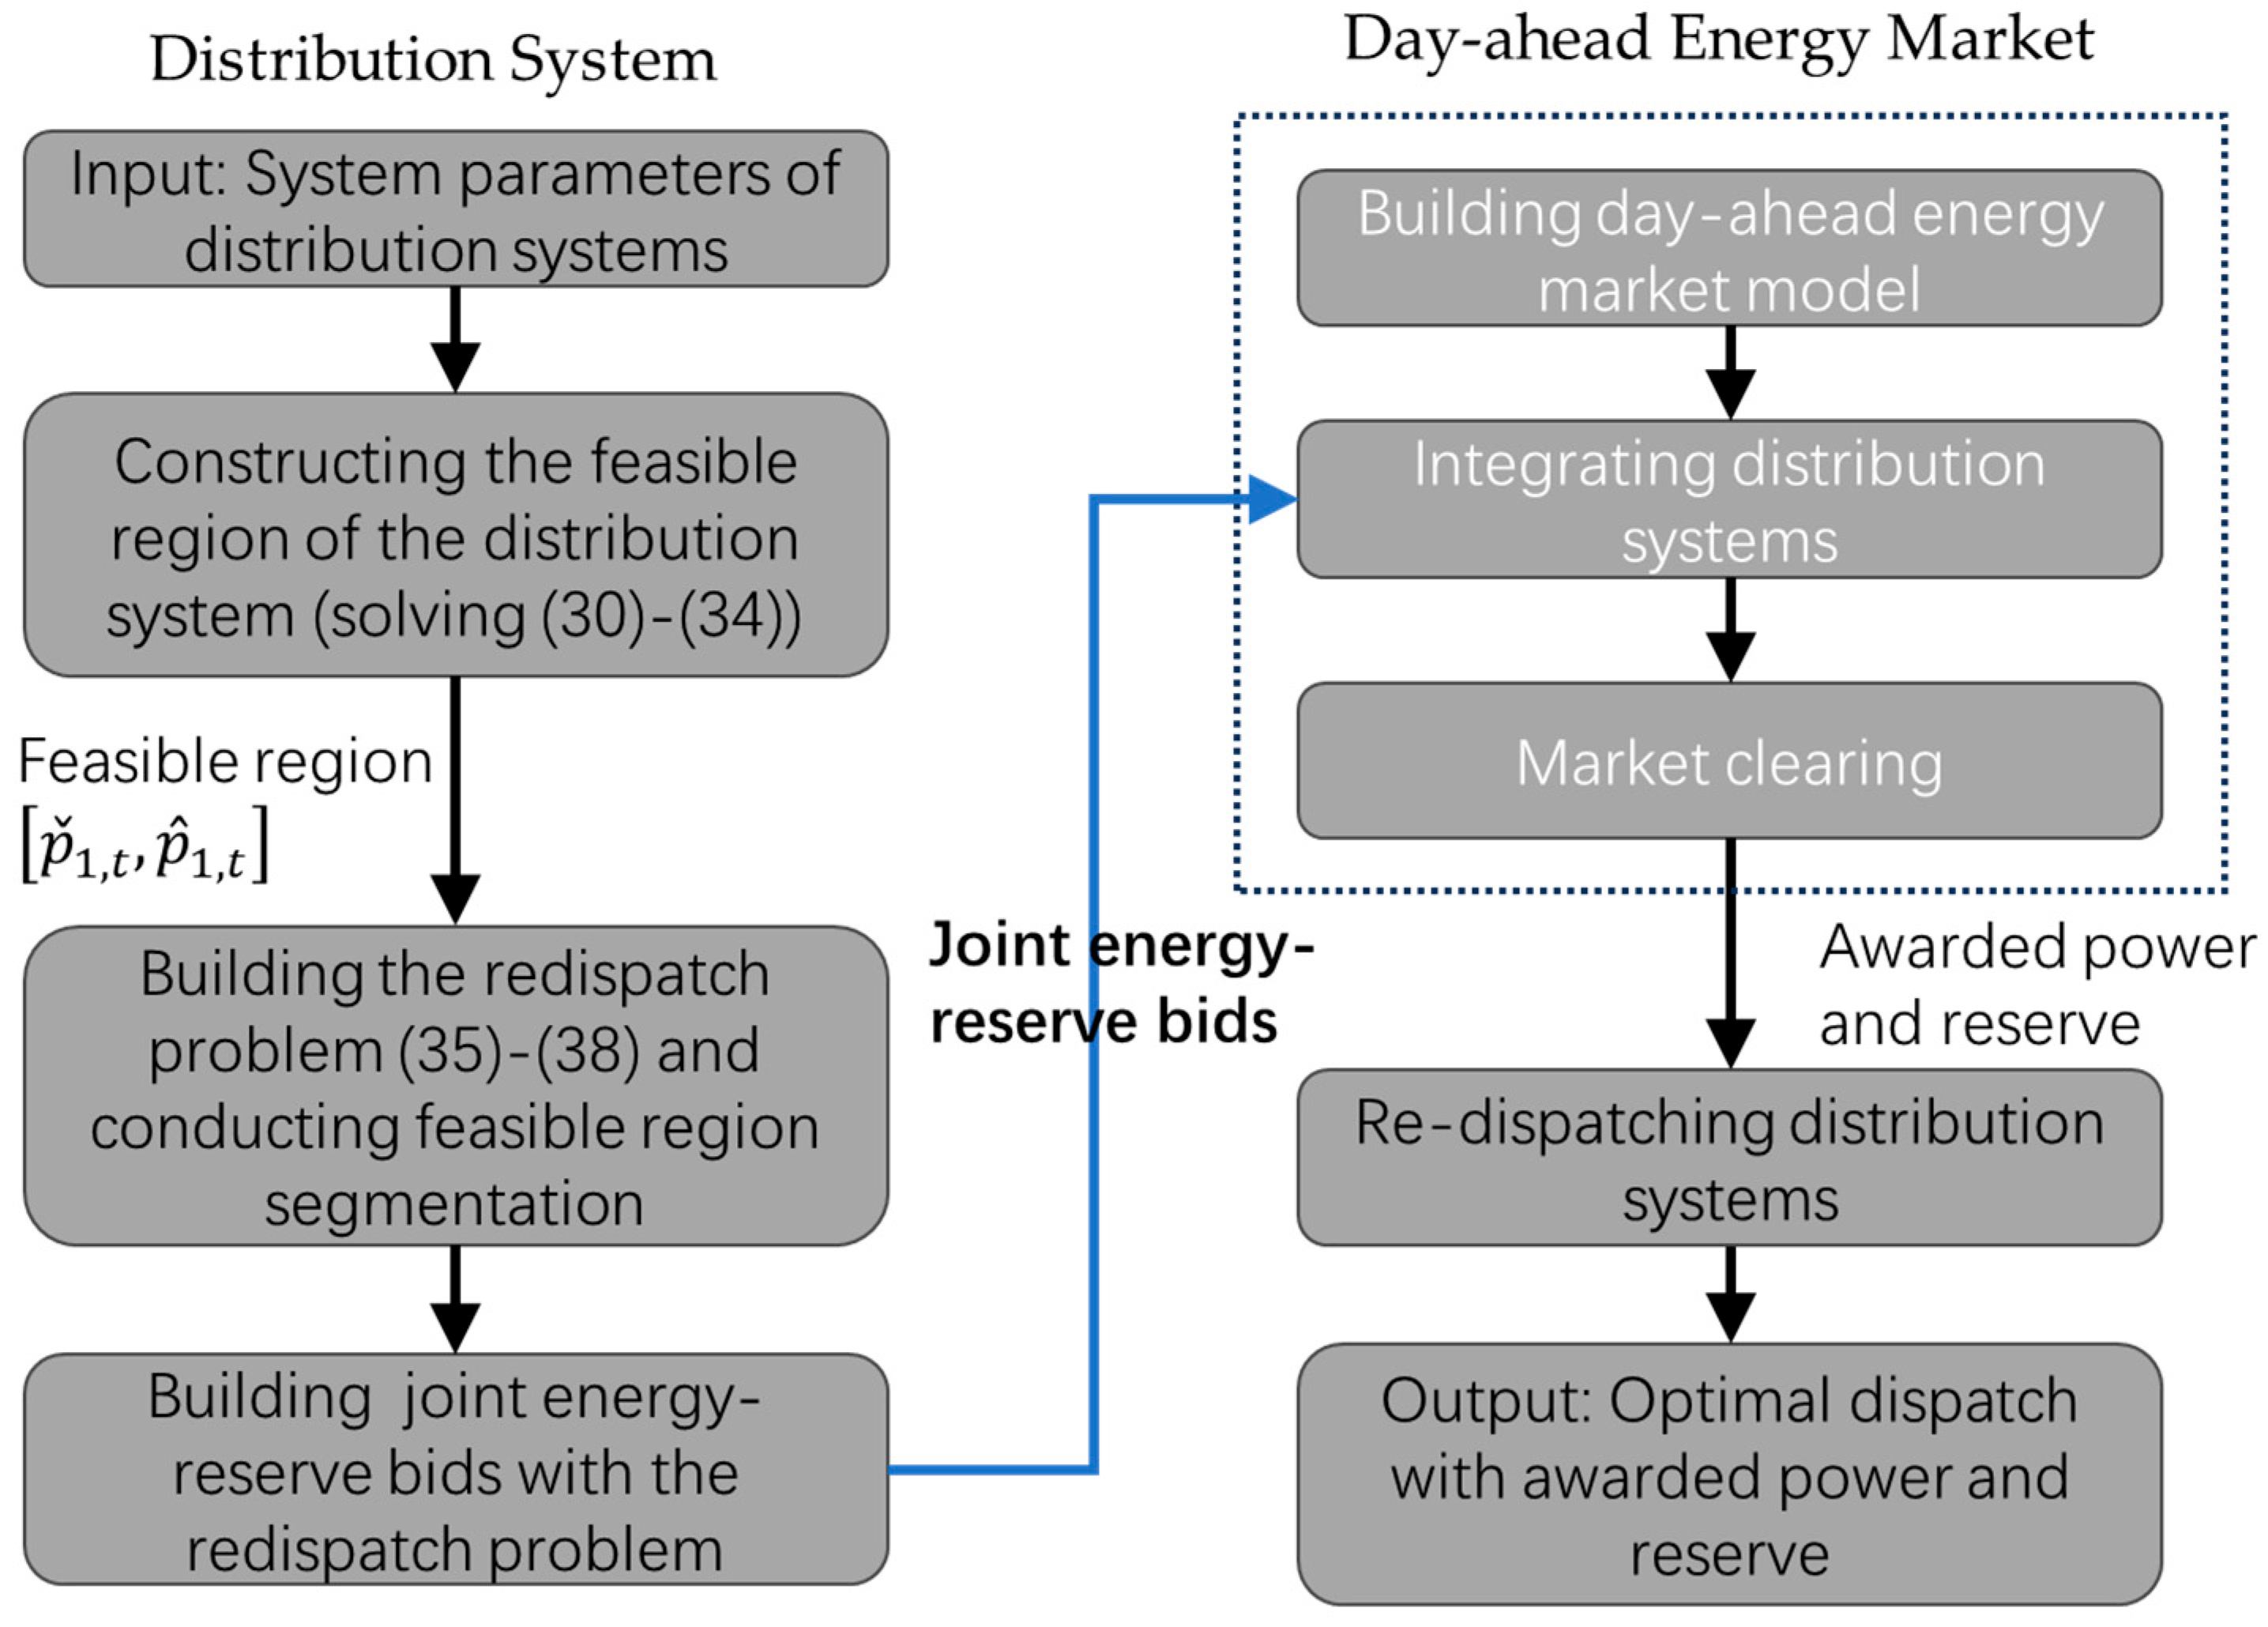
At last, the procedures of feasible region construction, bid preparation, and market participation are summarized and shown in the flowchart in Figure 7.
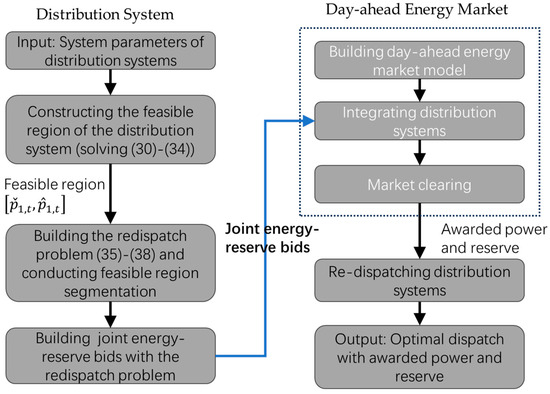
Figure 7.
The procedures of feasible region construction, bid preparation, and market participation.
4. Case Study
4.1. Test System Setup and Case Design
In this section, the effectiveness of the proposed method is validated with a modified IEEE 118-bus system, which is interconnected with six distribution systems. The six distribution systems are connected to the transmission system through one interconnection bus and are modified based on the IEEE 33-bus distribution system. Except for their interconnection buses, all six distribution systems are identical in configuration and parameter settings. The detailed system data can be found in [24].
In a connected distribution system, eight DERs are connected, and 2 distribution lines are added, forming a looped network on top of the originally 32 distribution lines. The lower and upper bounds of voltage magnitudes of all buses, namely and , are set as 0.95 p.u. and 1.05 p.u. For the distribution system, the installed capacity of DERs in the system is set to be much larger than the load within it, and therefore, the distribution system is exporting energy to the transmission system. In addition, electricity prices of DERs within the distribution system are set as different and generally lower than thermal units in the transmission system for enabling the dispatching of the distribution system after being integrated into the day-ahead market model.
4.2. The Feasible Region
Since the six distribution systems are identical and the calculation of the feasible region is independent of the transmission system, intuitively, the feasible regions of the six distribution systems should also be the same. Therefore, we only present the feasible region of distribution system #1 for discussion.
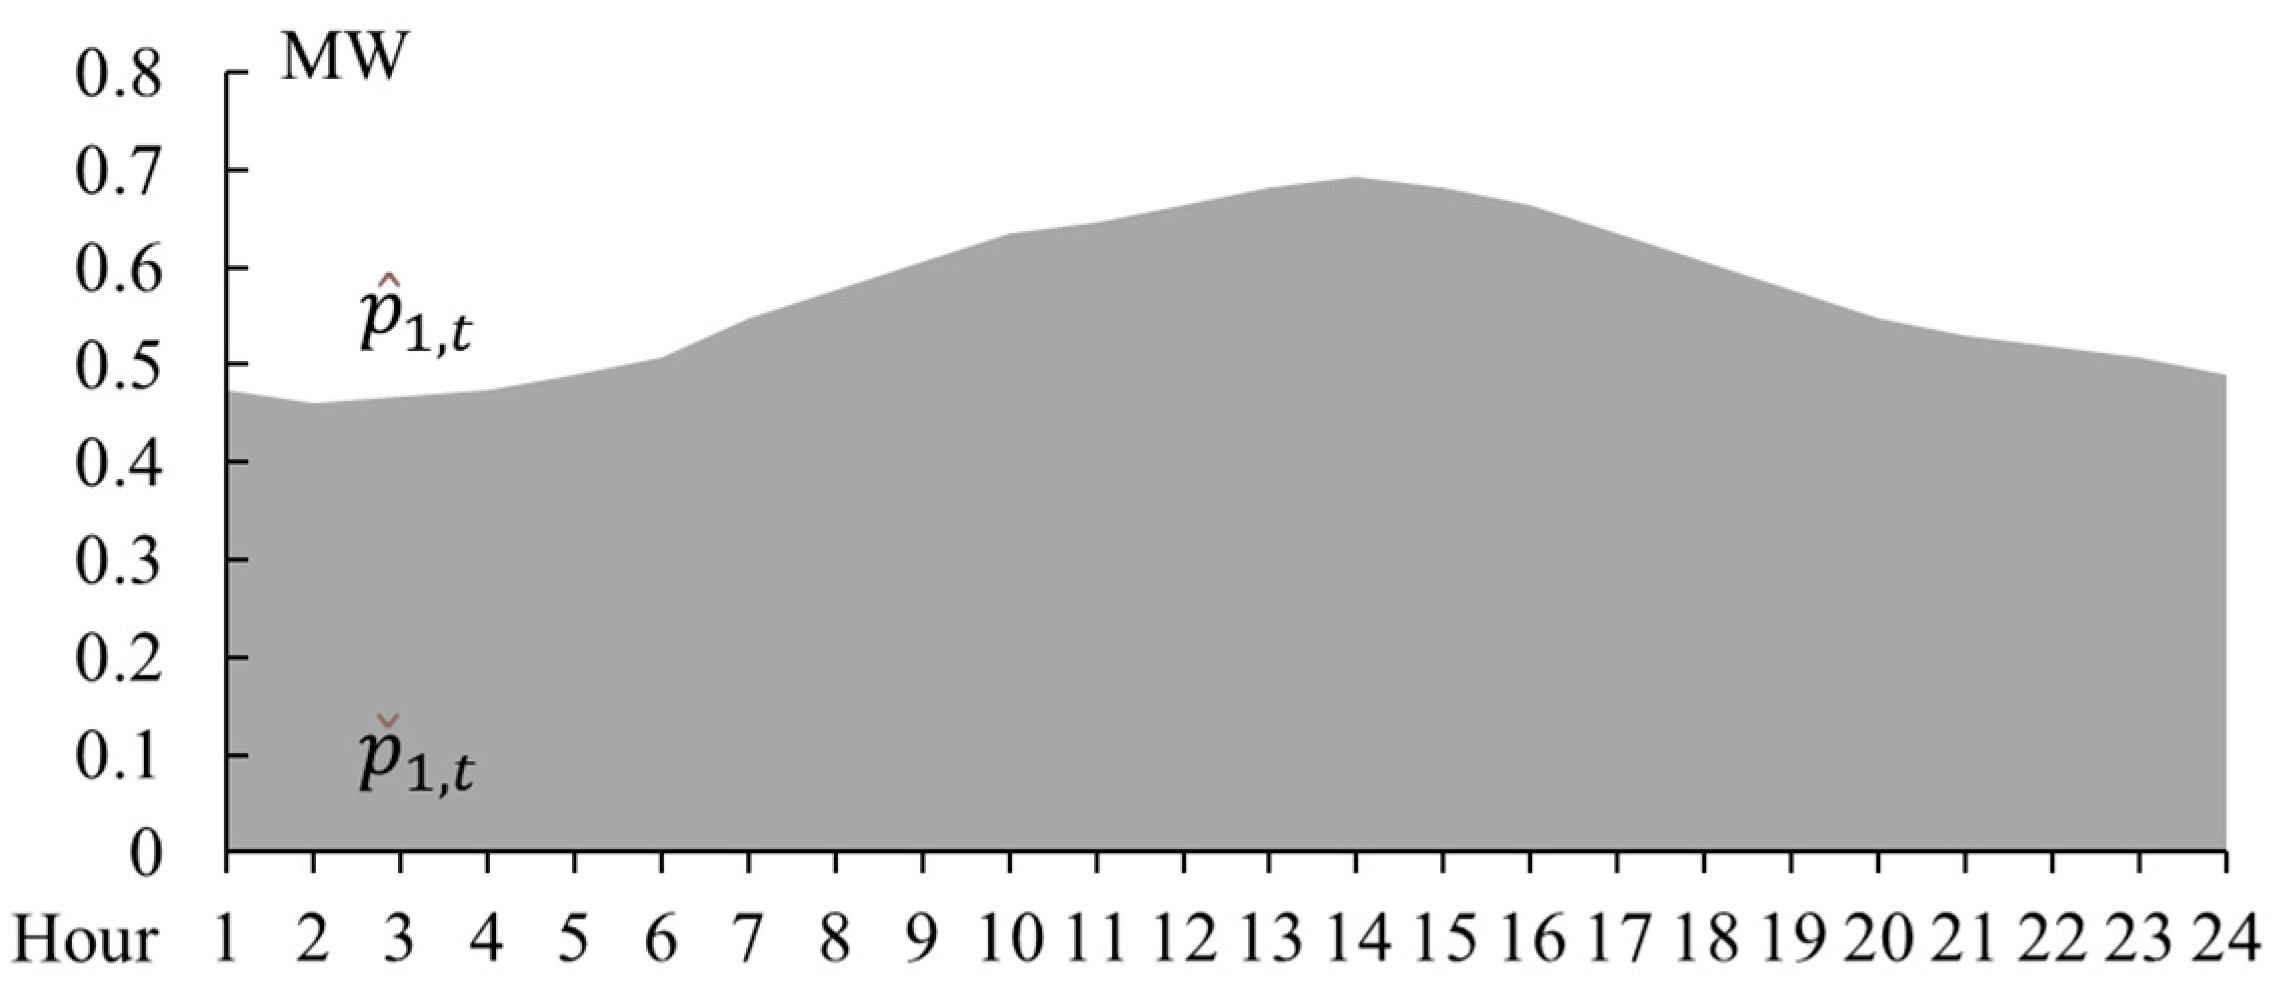
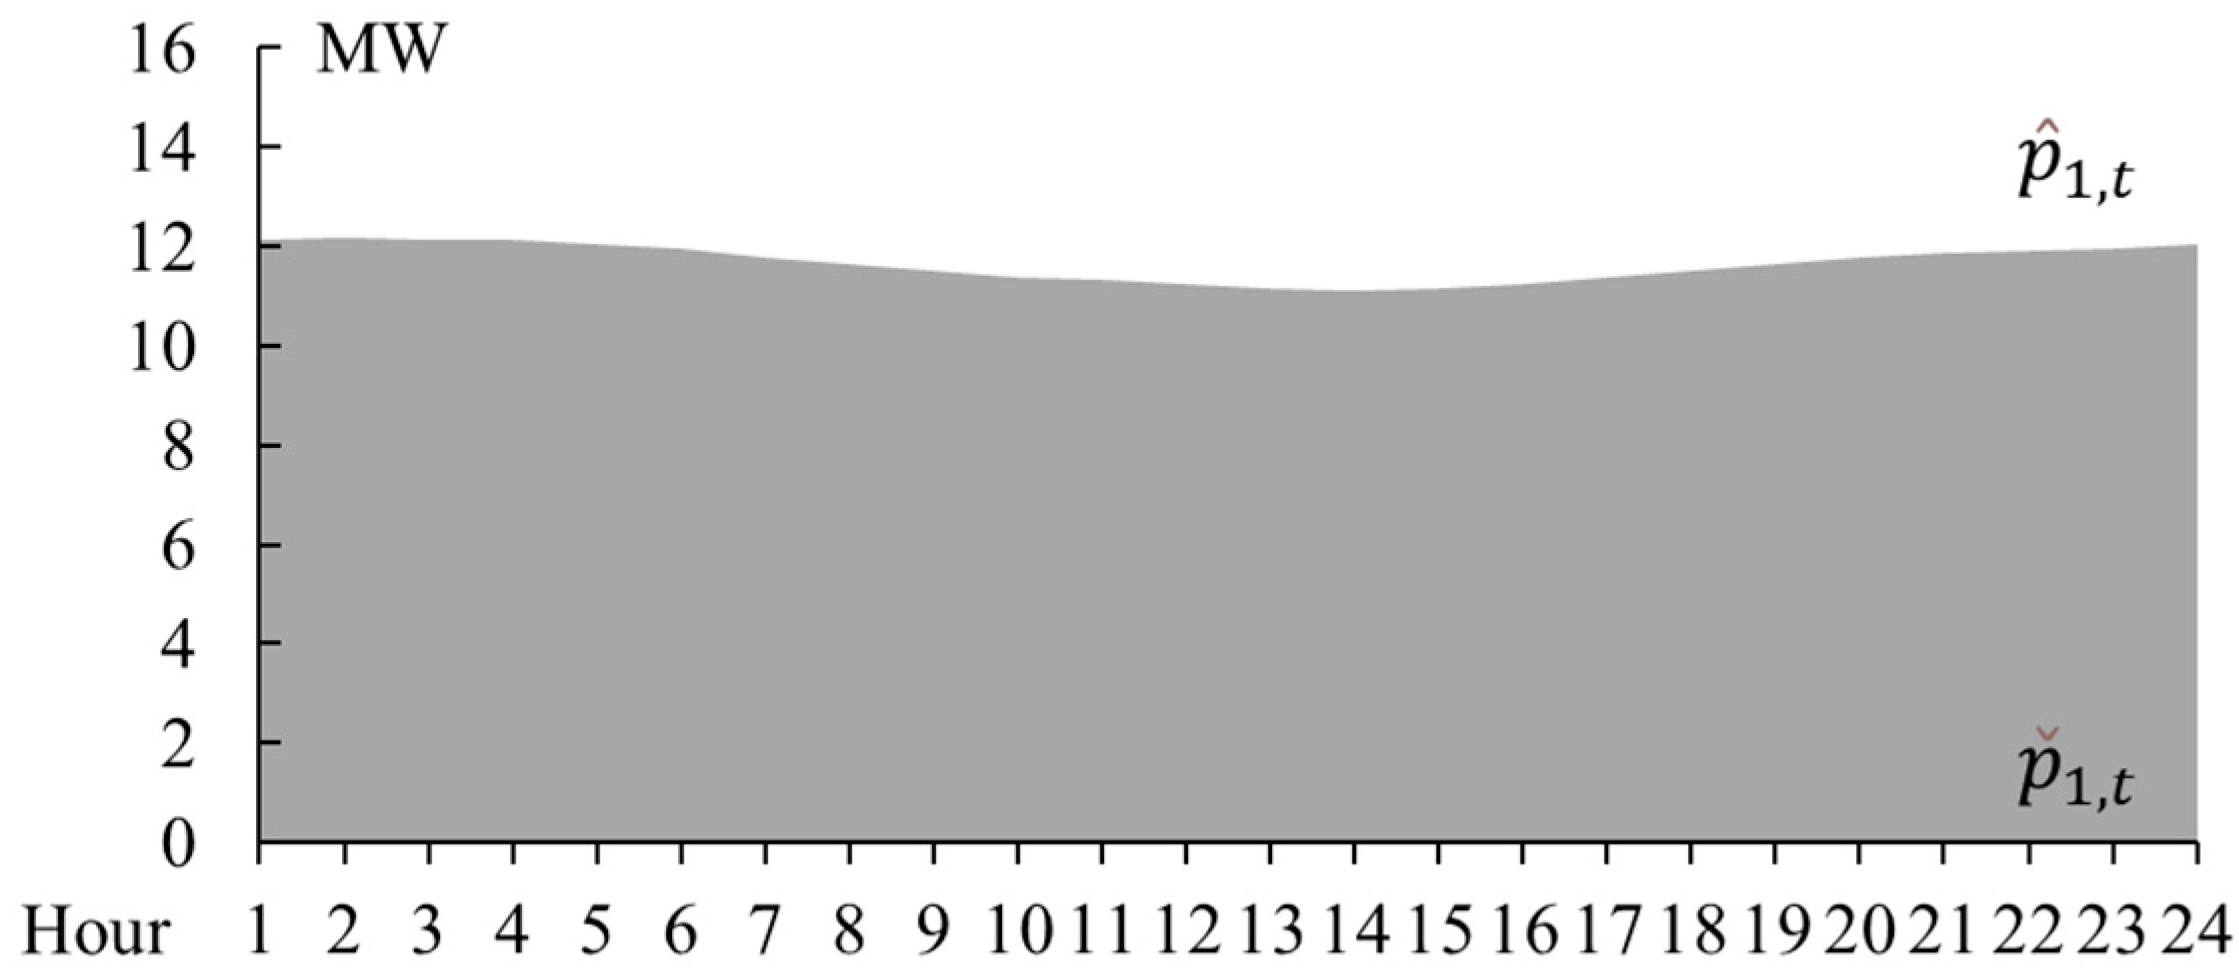
With the voltage magnitude of the interconnection bus, , being set as 1.0 p.u., and the flow limits of distribution lines being set relatively large, the feasible regions are shown in Figure 8. It can be seen that the feasible regions of different time intervals vary.
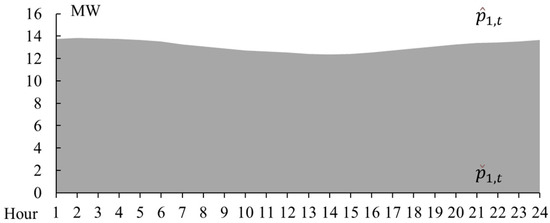
Figure 8.
The feasible region without binding constraints.
In fact, in this simple case, as there are no binding voltage or line flow constraints, the feasible region is essentially merely determined by the difference between the generation capability of DERs and the total local load. The remaining power can be aggregated through the distribution system and injected into the transmission system via the interconnection bus. The lower bounds of the feasible regions are all zeros, meaning that the distribution system can merely support its internal load without exporting power to the transmission system.
Moreover, it is worth noting that, since there are no time-coupling constraints in problem (30)–(33), and in the uncertainty set, for different time intervals are not coupled, the feasible region for different intervals can indeed be calculated independently. However, the proposed method can easily handle time-coupling constraints, such as ramping constraints of DERs and a more complicated uncertainty set with time-coupling .
With the voltage magnitude of the interconnection bus, , being increased to 1.05 p.u., the feasible regions change and are significantly reduced, as shown in Figure 9. This is because the active power injection would raise the bus voltages, which should remain within the voltage upper bound. Indeed, in this case, the voltage upper bound limits the power injection of DERs. In addition, with the line flow limit being reduced and line flow constraints becoming binding, the feasible regions change as well, as shown in Figure 10. In this case, as being set as 1.0 p.u., voltage constraints are no longer binding, but the line flow constraints limit the exporting power. Therefore, it can be seen that the feasible region could reflect the internal physical limitations of the distribution network, ensuring that each point within the feasible region always corresponds to a feasible operating point of the distribution system.
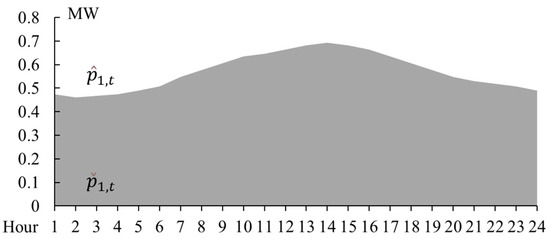
Figure 9.
The feasible region with binding voltage constraints.
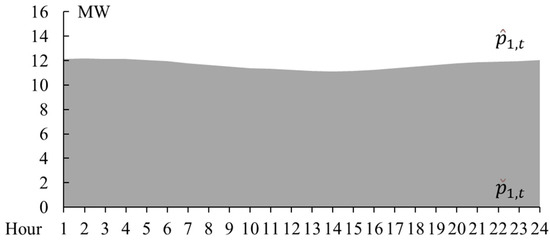
Figure 10.
The feasible region with binding line flow constraints.
4.3. The Strategic Bidding of the Distribution System
With the feasible region obtained with problem (30)–(34), the energy and reserve bids of the distribution system can be built. For the feasible regions of all hours, they are segmented into four segments, namely . To build the energy bids and reserve bids, the redispatch problem of the distribution system is solved repeatedly with different settings to and as in (36)–(37). It is worth noting that the prices of DERs in the distribution network, including both energy prices and reserve prices, are set to be monotonically increasing. The energy prices and reserve prices are set as different for different DERs.
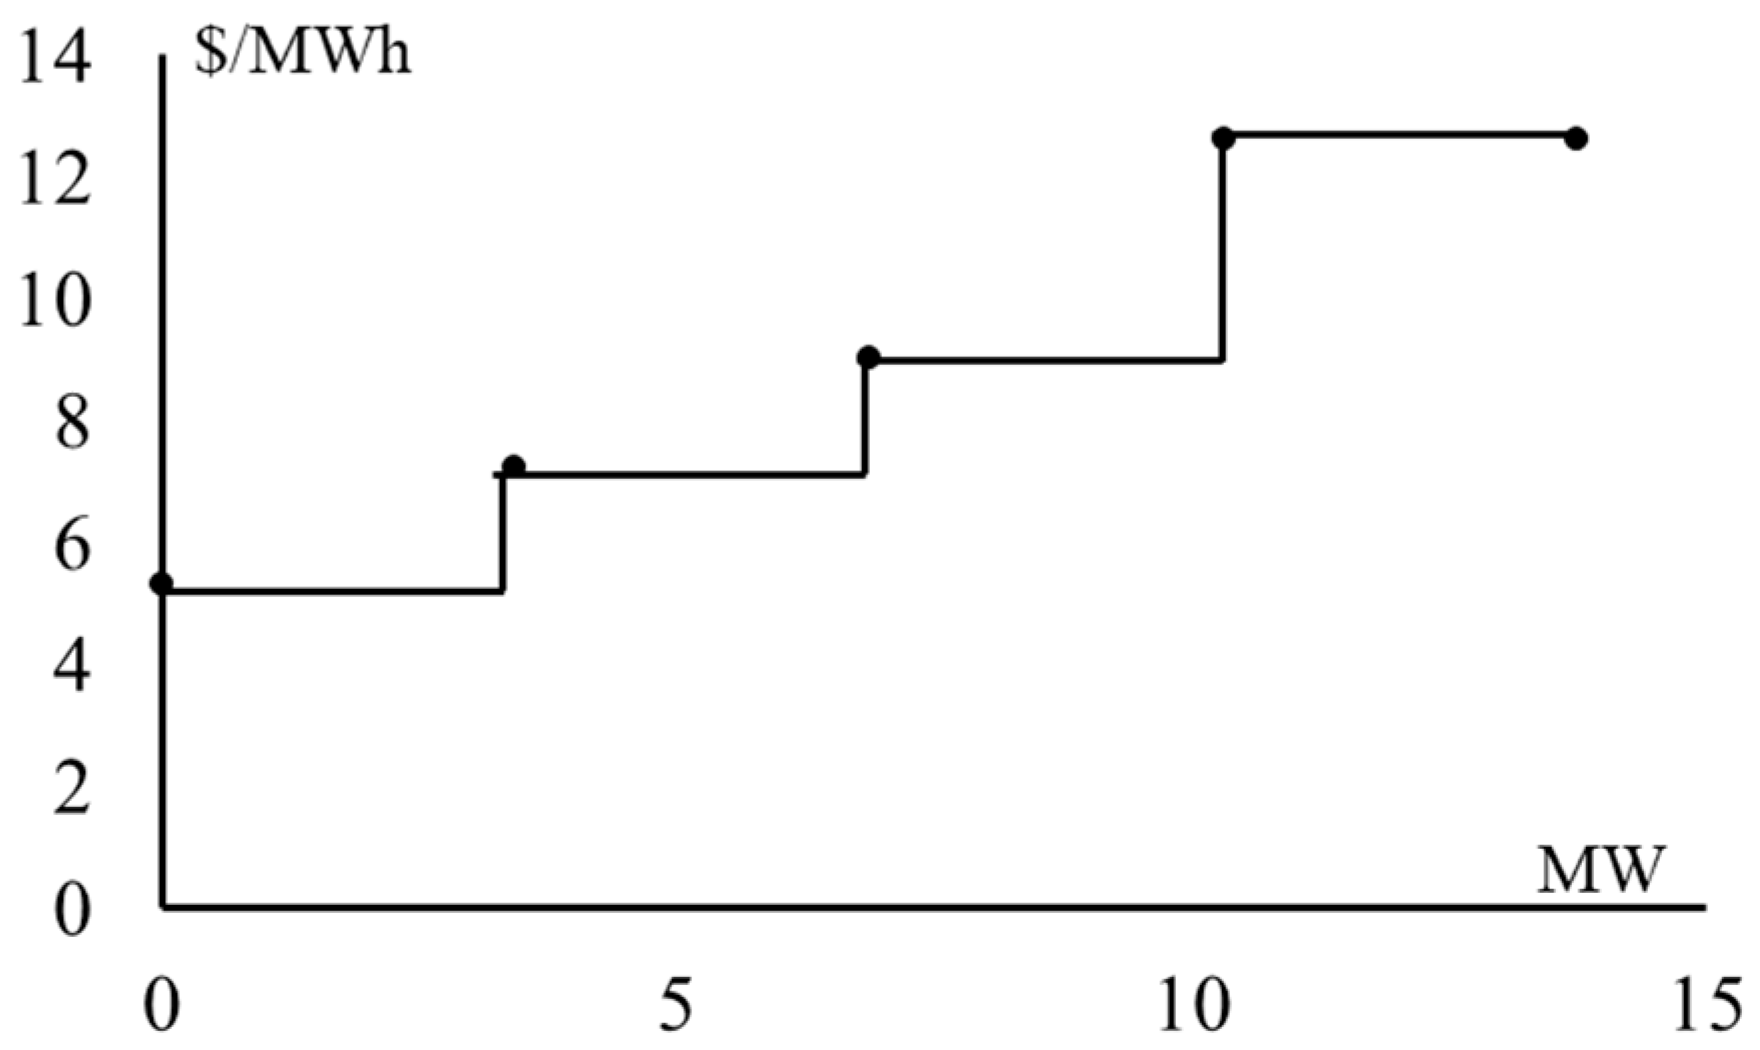
The energy bid of the distribution system for time interval 1, namely hour 1, is shown in Figure 11, and the corresponding reserve bid is shown in Figure 12. From Figure 11, it can be seen that the bid prices of energy are monotonically increasing. For a given energy segment, the bid prices of reserves may not be monotonically increasing, and in this case, the price can be adjusted to ensure that the bids exhibit a monotonically increasing feature, as shown in Figure 12.
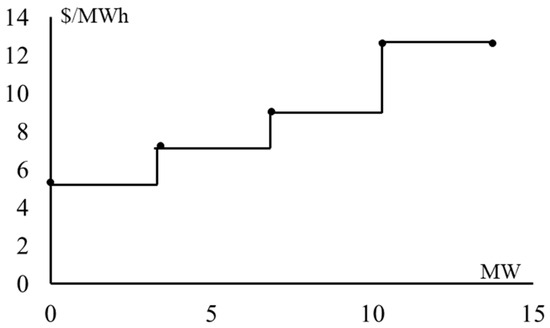
Figure 11.
Energy bid of the distribution system at hour 1.

Figure 12.
Reserve bids under segment 1 of the distribution system at hour 1.
4.4. Participating in the Day-Ahead Market
Based on the feasible regions, and together with the energy bid and reserve bids, the distribution systems can be integrated into the day-ahead market model of the transmission system. After clearing the day-ahead market mode, the awarded power and reserve to the distribution systems can be obtained.
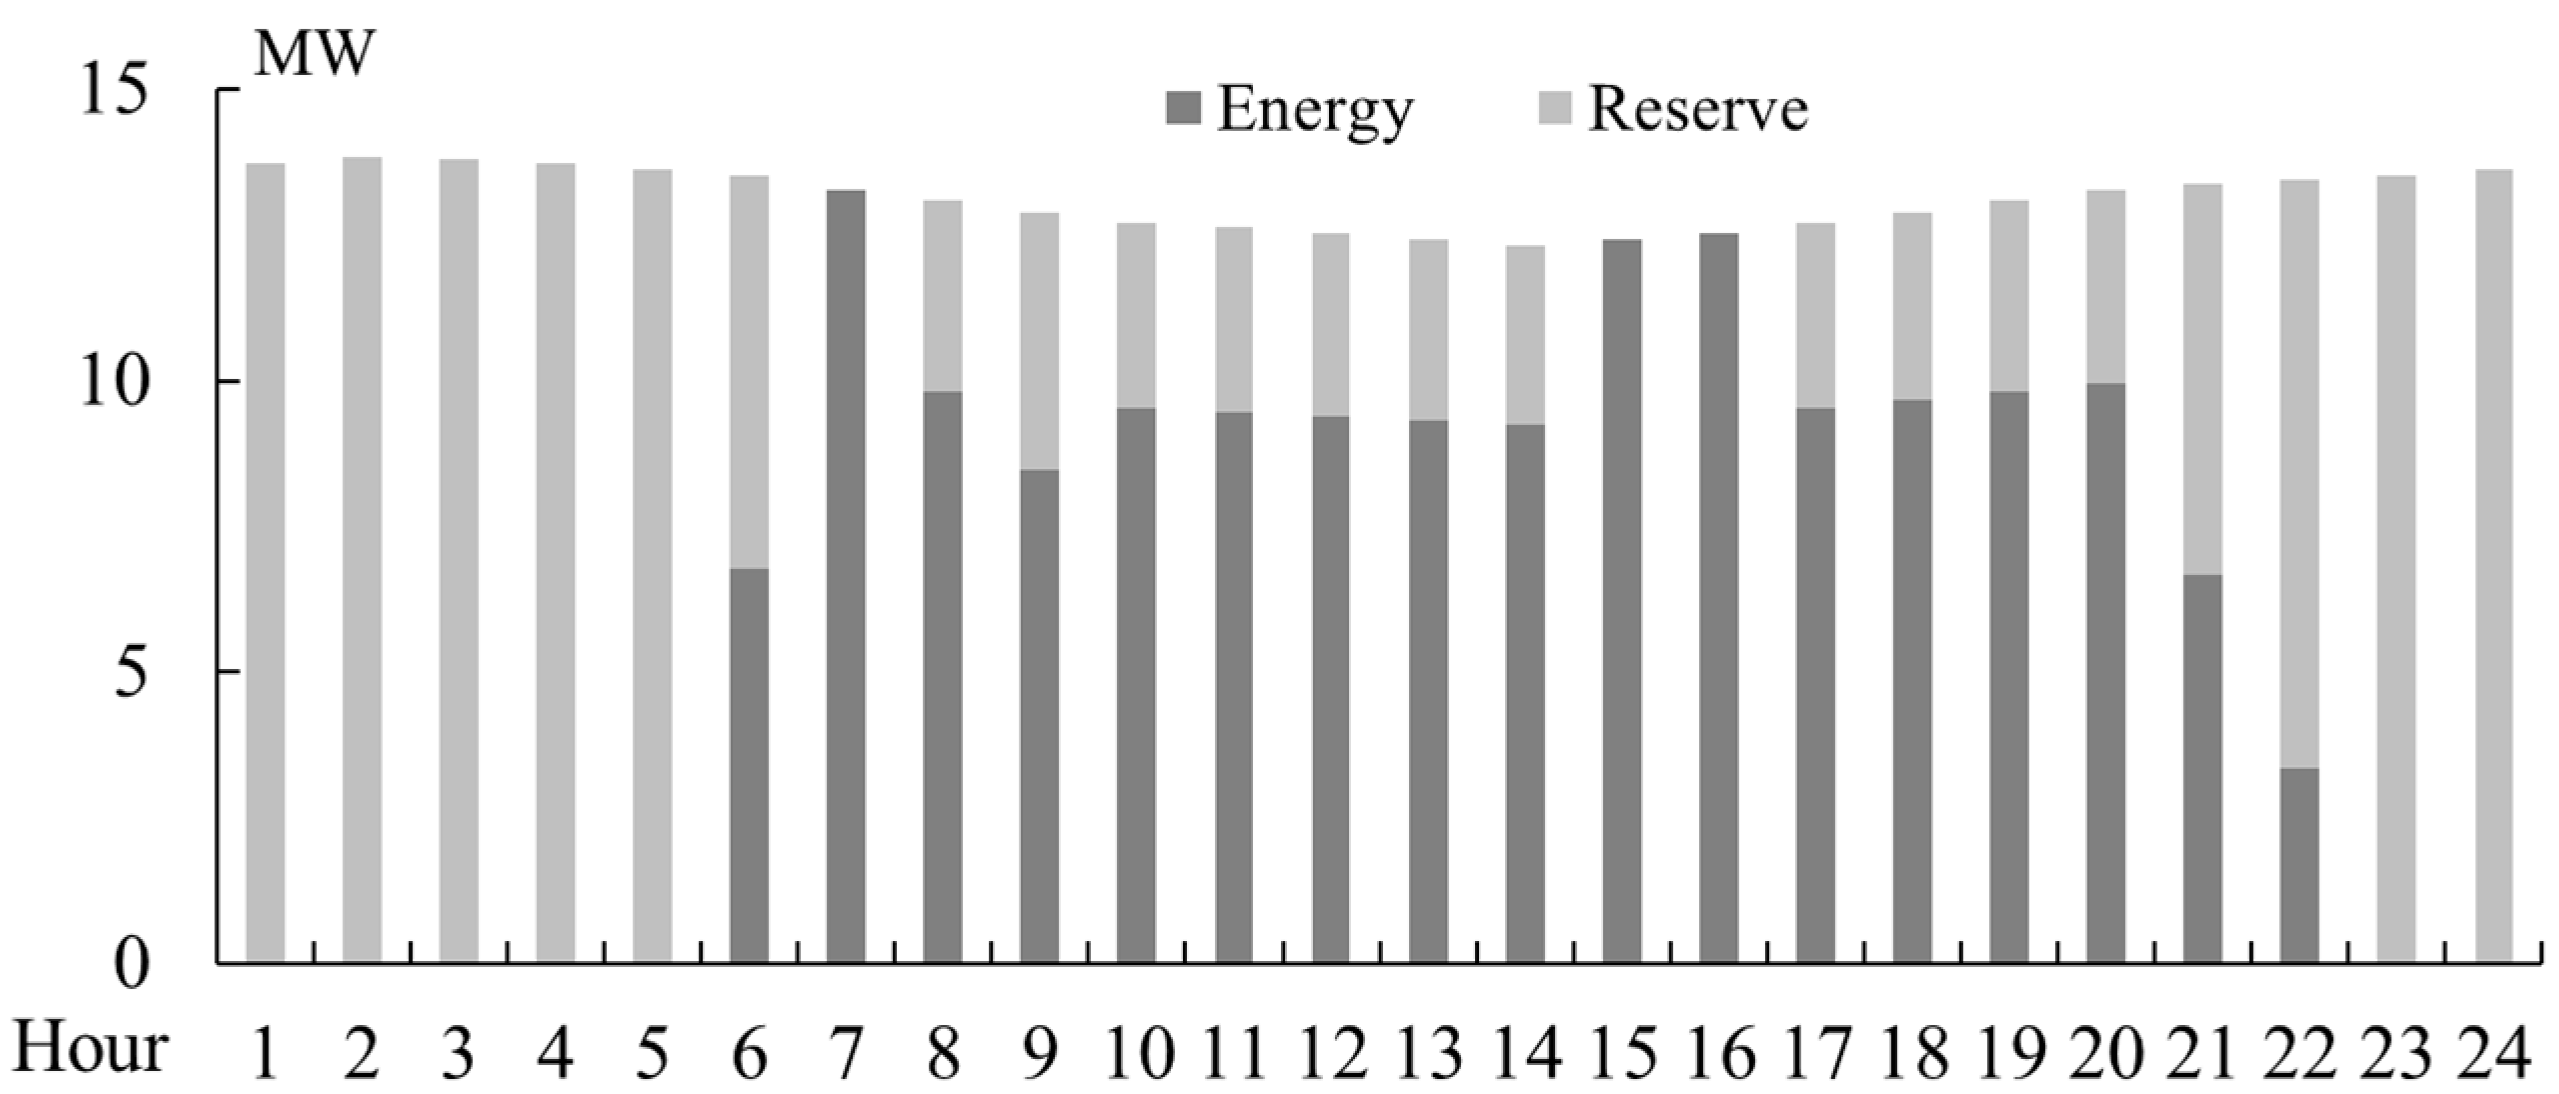
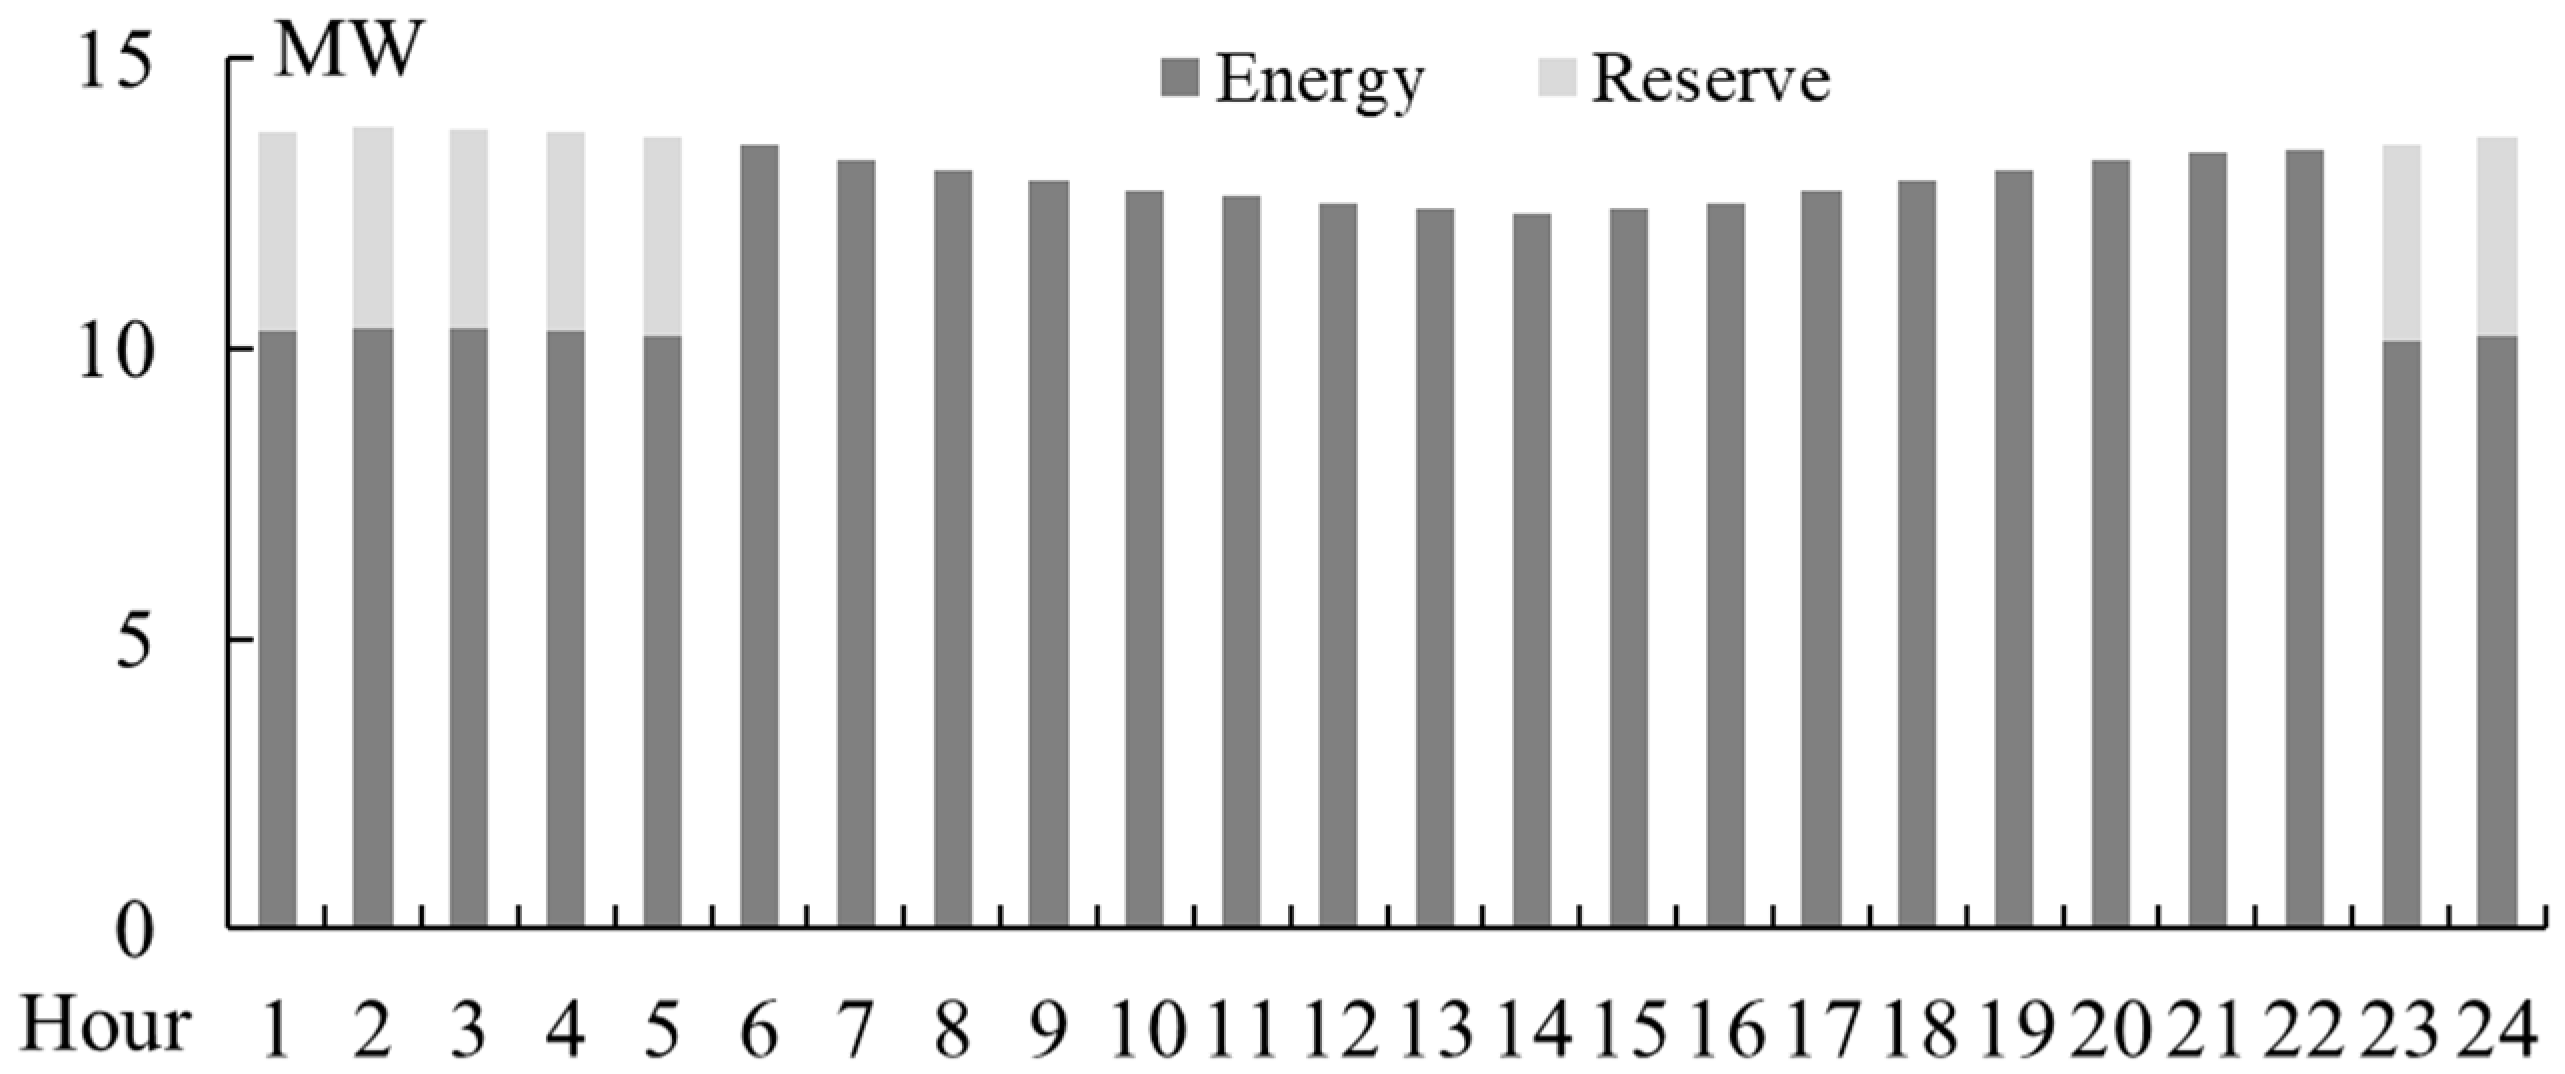
When the reserve prices of other generating units in the system are relatively high, the distribution network provides not only energy but also a portion of reserve, as illustrated in Figure 13. Conversely, when the reserve prices of other units are relatively low, the distribution network primarily supplies energy and ceases to offer reserve, as illustrated in Figure 14. This is intuitive because the energy prices of DERs in the distribution network are set lower than those of the thermal units in the system. Unless there is a larger price spread in providing reserve, awarding energy is always prioritized. With the awarded power and reserve, the redispatch problem can be solved again to verify that there exists a corresponding feasible operating point. All the awarded power and reserve values are verified by conducting the redispatch problem.
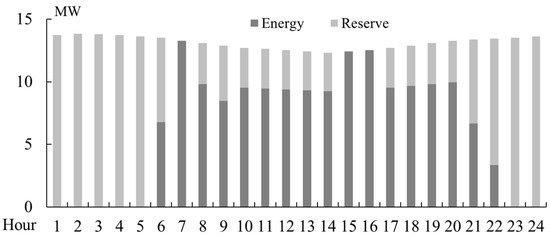
Figure 13.
Awarded energy and reserve of distribution system 1 with high reserve price.
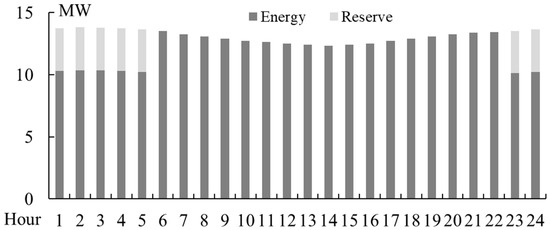
Figure 14.
Awarded energy and reserve of distribution system 1 with low reserve price.
To further highlight the effectiveness of the proposed method, we compare the proposed approach with different market participation settings. Specifically, we compare the results of three cases: distribution systems participating in no market, distribution systems participating only in the energy market, and distribution systems participating in power and reserve markets. The reserve price is set as high. The results are summarized in Table 1. The results show that joint participation in both energy and reserve markets yields the lowest total cost. Compared with no market participation, overall costs drop significantly, and compared with energy-only participation, the reduction mainly comes from lower reserve costs, even though energy costs rise slightly. This highlights the advantage of coordinated bidding across markets, where balancing energy and reserve decisions leads to a more efficient and economical outcome.

Table 1.
Result comparison of three cases with different market participation settings.
4.5. Redispatching After Market Clearing of the Day-Ahead Market
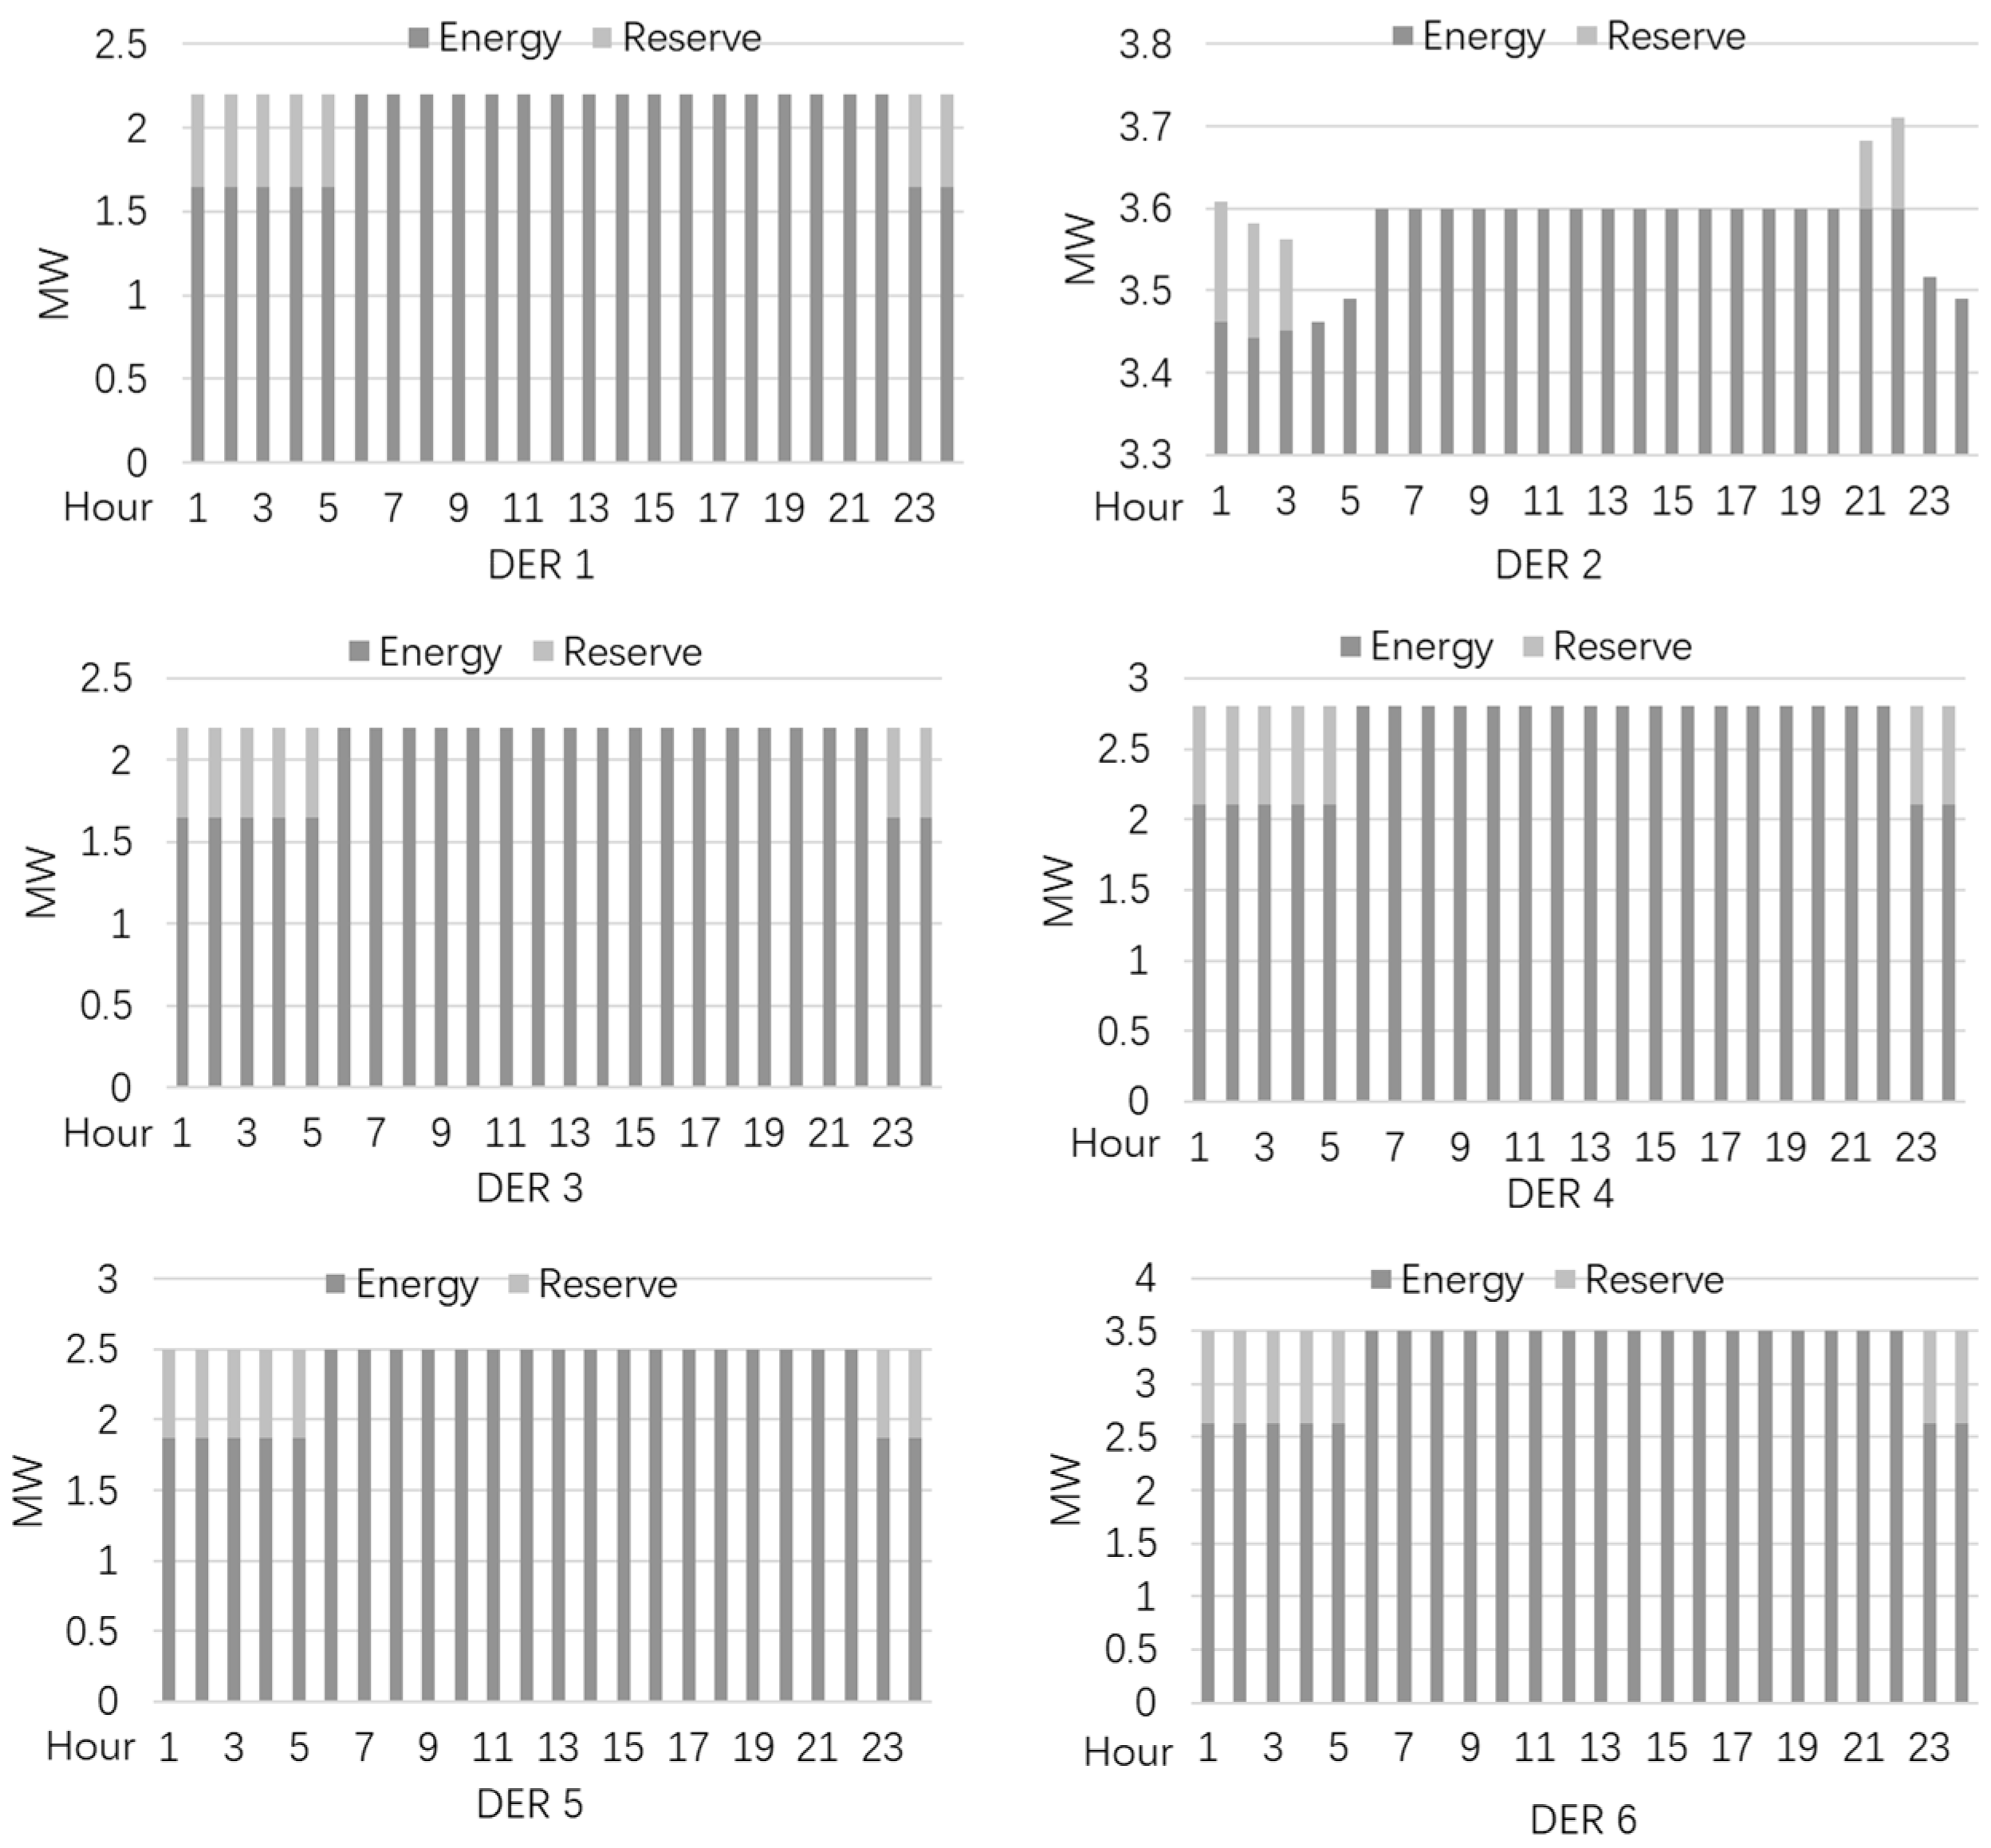
After obtaining the market clearing results, namely awarded power and reserve, each distribution system can further solve the redispatch problem of the distribution system, (35)–(38), to determine the generation outputs of DERs. Taking distribution system 1 under a low reserve price as an example (i.e., the results shown in Figure 13), the dispatch results of DERs in the distribution system are shown in Figure 15. First of all, a feasible solution can be found, which demonstrates the effectiveness of the feasible region. In addition, the total system cost could be minimized under the given awarded power and reserve.
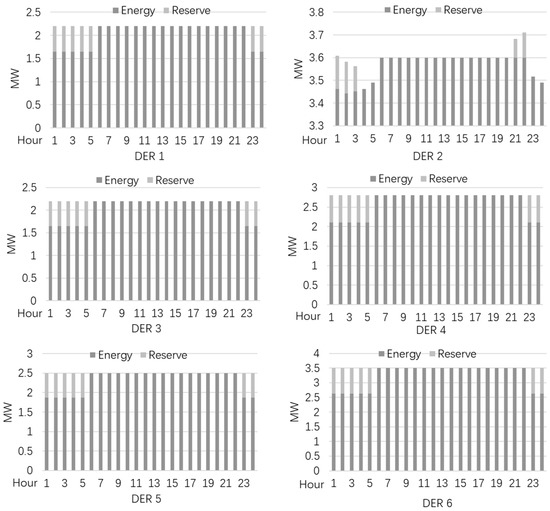
Figure 15.
The dispatch results of DERs in the distribution system 1.
It is not difficult to see that the capacity of DERs is well utilized. When power demand is low, namely, the awarded power is relatively small, the remaining generation capacity of DERs is used to provide reserves. Meanwhile, when power demand is high, especially during peak load periods, the capacity of DERs is allocated to generation rather than to provide reserve.
Therefore, based on the constructed feasible regions, and in conjunction with the formulated energy and reserve bids, the distribution systems can be seamlessly integrated into the day-ahead market model of the transmission system. This integration allows the transmission-level market to account for the operational flexibility and constraints of distribution networks, enabling coordinated optimization across system levels. By preserving the internal feasibility of distribution systems while aligning with transmission-level economic signals, the proposed framework facilitates more efficient resource allocation, enhances competition in both energy and reserve markets, and ultimately contributes to improving overall system reliability and economic performance.
5. Conclusions
This paper presents a novel market integration approach for distribution networks to participate in the transmission-level energy markets. By constructing box-shaped feasible regions using a two-stage adaptive robust optimization framework, the internal operational constraints of the distribution system can be accurately captured. Building on this, a strategic bidding method is developed through nested segmentation of the feasible region, enabling coordinated energy and reserve bidding. Reserve bid prices increase monotonically within each energy segment, and higher energy segments may be associated with higher reserve prices. This captures the coupling between energy and reserve in the bidding strategy while satisfying the requirements of the energy market. Our future research will focus on incorporating uncertainties and explicitly modeling energy storage to enhance system flexibility and bidding robustness. In addition, improving the computational efficiency of bid preparation is an important direction.
Author Contributions
Conceptualization, J.Z.; Methodology, T.Z.; Investigation, T.Z.; Writing—original draft, T.Z.; Writing—review & editing, J.Z., B.C., Z.C. and Y.J.; Funding acquisition, J.Z. All authors have read and agreed to the published version of the manuscript.
Funding
This research was funded by the “Price Incentive Mechanisms and Market Clearing Methods for Distributed Flexibility Resources in Ancillary Services” project of State Grid Jiangsu Electric Power Co., Ltd., Research Institute, grant number J2024JC-03.
Data Availability Statement
The data presented in this study are available on request from the corresponding author.
Conflicts of Interest
All Authors were employed by the company State Grid Jiangsu Electric Power Co., Ltd., Research Institute. The authors declare that the research was conducted in the absence of any commercial or financial relationships that could be construed as a potential conflict of interest. The authors declare that this study received funding from State Grid Jiangsu Electric Power Co., Ltd. Research Institute. The funder was not involved in the study design, collection, analysis, interpretation of data, the writing of this article or the decision to submit it for publication.
Nomenclature
| Indices and sets: | |
| Index of thermal units. | |
| Index of distributed energy resources. | |
| Index of loads. | |
| , , | Indices of buses; substation bus is indexed by . |
| , | Index of hours. |
| Set of thermal units. | |
| Set of distributed systems. | |
| Set of DERs in a distributed system. | |
| Set of loads in distribution system. | |
| Set of lines in distribution system. | |
| Set of buses in distribution system. | |
| Set of loads in transmission system. | |
| Set of lines in transmission system. | |
| Set of buses in transmission system. | |
| Set of thermal units on bus . | |
| Set of distribution systems on bus . | |
| Set of loads on bus in distribution system. | |
| Set of lines in distribution system connected to bus . | |
| Set of loads on bus in transmission system. | |
| Set of hours, , where . | |
| Variables for the transmission system: | |
| Active power dispatch of unit at hour . | |
| Reserve capacity of unit at hour . | |
| Active power injection to the distribution system from substation bus at hour . | |
| Active power flow of line at hour . | |
| ON/OFF indicator of unit at hour . | |
| Binary indicator of startup action of unit at hour . | |
| Binary indicator of shutdown action of unit at hour . | |
| Parameters for the transmission system: | |
| Bidding price of unit . | |
| Bidding price of reserve capacity of unit . | |
| No-load cost of unit . | |
| Active power demand of fixed load at hour . | |
| Power flow limit of line . | |
| Active power lower/upper bound of unit . | |
| Ramp-up/down ability of unit during operation procedure. | |
| Ramp-up/down ability of unit during startup/shutdown procedure. | |
| Startup cost of unit | |
| Shift factor of bus to line . | |
| Minimum ON time of unit . | |
| Minimum OFF time of unit . | |
| Total reserve capacity requirement. | |
| Variables for the distribution system: | |
| Active power of DER at hour . | |
| Active power injection to the transmission system at hour . | |
| Active power flow of line at hour . | |
| Reactive power output of DER at hour . | |
| Reactive power injection to the transmission side at hour . | |
| Reactive power flow along line at hour . | |
| Reserve capacity of DER at hour . | |
| Reserve capacity injection to the transmission side at hour . | |
| Voltage magnitude of bus at hour . | |
| Voltage phase angle of bus at hour . | |
| Lower boundary of substation bus active power injection at hour . | |
| Upper boundary of substation bus active power injection at hour . | |
| ON/OFF indicator of DER . | |
| Active power cost at hour for bus 1. | |
| Binary indicator for segment at hour . | |
| Power adjustment in segment at hour . | |
| Reserve capacity cost at hour for bus 1. | |
| Reserve capacity adjustment in segment at hour . | |
| Equivalent reserve price slope for segment at time . | |
| Uncertainty coefficient in two-stage robust optimization () | |
| Parameters for the distribution system: | |
| Bidding price of DER . | |
| Bidding price of reserve capacity of DER . | |
| The cost of DER energy output. | |
| The cost of DER reserve capacity. | |
| Susceptance of line . | |
| Conductance of line . | |
| Power flow limit of line . | |
| Active power demand of load at hour . | |
| Bound of active power injection to the transmission side. | |
| , | Active power lower and upper bound of DER . |
| Reactive power demand of load at hour . | |
| Bound of reactive power injection to the transmission side. | |
| , | Reactive power lower and upper bound of DER . |
| , | Voltage magnitude lower and upper bound of bus . |
| Number of power output segments. | |
| Maximum adjustable power/reserve range for bus 1 within a segment at hour . | |
| Lower bound of power output in segment at hour . | |
| Initial reserve capacity in segment at time . | |
| Reserve capacity in segment corresponding to energy segment at time . | |
| Marginal cost of power output in segment . | |
| Marginal cost of reserve capacity in segment . | |
| Active flag of segment . | |
| The slope of segment . | |
| The endpoint of segment . | |
| Given substation bus voltage. | |
References
- Castro, F.; Canizes, B.; Soares, J.; Almeida, J.; Vale, Z. Comprehensive framework for distribution network multi-investment expansion planning: Emissions, uncertainty, and resource remuneration integration. Energy Convers. Manag. 2024, 316, 118734. [Google Scholar] [CrossRef]
- Silva, J.; Sumaili, J.; Bessa, J.; Seca, L.; Matos, M.A.; Miranda, V.; Caujolle, M.; Goncer, B.; Sebastian-Viana, M. Estimating the Active and Reactive Power Flexibility Area at the TSO-DSO Interface. IEEE Trans. Power Syst. 2018, 33, 4741–4750. [Google Scholar] [CrossRef]
- Müller, F.; Szabó, J.; Sundström, O.; Lygeros, J. Leveraging Aggregation and Disaggregation of Energetic Flexibility from Distributed Energy Resources. IEEE Trans. Smart Grid 2019, 10, 1205–1214. [Google Scholar] [CrossRef]
- Wang, Y.; Zhong, H.; Ruan, G. A Projection-Based Approach for Distributed Energy Resources Aggregation. In Proceedings of the 2023 IEEE PES Innovative Smart Grid Technologies Europe (ISGT EUROPE), Grenoble, France, 23–26 October 2023; pp. 1–5. [Google Scholar]
- Liu, B.; Ma, J. Feasible Region for DERs in Unbalanced Distribution Networks with Uncertain Line Impedances. In Proceedings of the 2023 IEEE Power & Energy Society General Meeting (PESGM), Orlando, FL, USA, 16–20 July 2023; pp. 1–5. [Google Scholar]
- Chen, Y.; Zhao, C. Improved Approximation of Dispatchable Region in Radial Distribution Networks via Dual SOCP. IEEE Trans. Power Syst. 2023, 38, 5585–5597. [Google Scholar] [CrossRef]
- Li, Z.; Huang, W.; Zheng, J.; Wu, Q. Dispatchable Region for Active Distribution Networks Using Approximate Second-Order Cone Relaxation. CSEE J. Power Energy Syst. 2023, 9, 1999–2007. [Google Scholar] [CrossRef]
- Liu, Y.; Wu, L.; Chen, Y.; Li, J.; Yang, Y. On Accurate and Compact Model of High DER-Penetrated Sub-Transmission/Primary Distribution Systems in ISO Energy Market. IEEE Trans. Sustain. Energy 2021, 12, 810–820. [Google Scholar] [CrossRef]
- Liu, Y.; Wu, L.; Chen, Y.; Li, J. Integrating High DER-Penetrated Distribution Systems into ISO Energy Market Clearing: A Feasible Region Projection Approach. IEEE Trans. Power Syst. 2021, 36, 2262–2272. [Google Scholar] [CrossRef]
- Wen, Y.; Hu, Z.; You, S.; Duan, X. Aggregate Feasible Region of DERs: Exact Formulation and Approximate Models. IEEE Trans. Smart Grid 2022, 13, 4405–4423. [Google Scholar] [CrossRef]
- Zhang, T.; Wang, J.; Wang, H.; Ruiyang, J.; Li, G.; Zhou, M. On the Coordination of Transmission-Distribution Grids: A Dynamic Feasible Region Method. IEEE Trans. Power Syst. 2023, 38, 1857–1868. [Google Scholar] [CrossRef]
- Chen, X.; Dall’Anese, E.; Zhao, C.; Li, N. Aggregate Power Flexibility in Unbalanced Distribution Systems. IEEE Trans. Power Syst. 2020, 11, 258–269. [Google Scholar] [CrossRef]
- Zhang, T.; Wang, J.; Li, G.; Wang, X.; Zhou, M. Characterizing Temporal-Coupled Feasible Region of Active Distribution Networks. IEEE Trans. Ind. Applicat. 2022, 58, 5687–5696. [Google Scholar] [CrossRef]
- Wang, C.; Xing, J.; Wang, Y.; Xu, J.; Fu, Z.; Xu, B.; Liu, H. Bidding Strategy for the Alliance of Prosumer Aggregators in the Distribution Market. Energies 2024, 17, 5006. [Google Scholar] [CrossRef]
- Chen, C.; Bose, S.; Tong, L. DSO-DERA Coordination for the Wholesale Market Participation of Distributed Energy Resources. In Proceedings of the 2023 IEEE Power & Energy Society General Meeting (PESGM), Orlando, FL, USA, 16–20 July 2023. [Google Scholar]
- Mallaki, M.S.; Naderi, M.; Abedi, M.D.; Manshadi, S.B.; Gharehpetian, G. Strategic Bidding in Distribution Network Electricity Market Focusing on Competition Modeling and Uncertainties. J. Mod. Power Syst. Clean. Energy 2021, 9, 561–572. [Google Scholar] [CrossRef]
- Iria, J.; Scott, P.; Attarha, A.; Soares, F. Comparison of Network-(in)Secure Bidding Strategies to Coordinate Distributed Energy Resources in Distribution Networks. Sustain. Energy Grids Netw. 2023, 36, 101209. [Google Scholar] [CrossRef]
- Liu, Y.; Huang, B.; Lin, Y.; Chen, Y.; Wu, L. Optimal SOC Headroom of Pump Storage Hydropower for Maximizing Joint Revenue from Day-Ahead and Real-Time Markets under Regional Transmission Organization Dispatch. J. Mod. Power Syst. Clean. Energy 2024, 12, 238–250. [Google Scholar] [CrossRef]
- Kim, H.; Kim, M. Data-Driven Virtual Power Plant Bidding Strategy in Electricity Markets Integrating Hybrid Forecasting Model and Customized Incentive Demand Response. IEEE Internet Things J. 2025, 12, 13851–13869. [Google Scholar] [CrossRef]
- Wang, Z.; Hou, H.; Wei, R.; Li, Z. A Distributed Market-Aided Restoration Approach of Multi-Energy Distribution Systems Considering Comprehensive Uncertainties from Typhoon Disaster. IEEE Trans. Smart Grid 2025, 16, 3743–3757. [Google Scholar] [CrossRef]
- Yang, Z.; Zhong, H.; Xia, Q.; Kang, C. Solving OPF using linear approximations: Fundamental analysis and numerical demonstration. IET Gener. Transm. Distrib. 2017, 11, 4115–4125. [Google Scholar] [CrossRef]
- Chen, X.; Li, N. Leveraging Two-Stage Adaptive Robust Optimization for Power Flexibility Aggregation. IEEE Trans. Smart Grid 2021, 12, 3954–3965. [Google Scholar] [CrossRef]
- Zeng, B.; Zhao, L. Solving Two-Stage Robust Optimization Problems Using a Column-And-Constraint Generation Method. Oper. Res. Lett. 2013, 41, 457–461. [Google Scholar] [CrossRef]
- Test System Data. Available online: https://github.com/eethzhao/IEEE-118-bus-system-data-test-system- (accessed on 30 September 2025).
Disclaimer/Publisher’s Note: The statements, opinions and data contained in all publications are solely those of the individual author(s) and contributor(s) and not of MDPI and/or the editor(s). MDPI and/or the editor(s) disclaim responsibility for any injury to people or property resulting from any ideas, methods, instructions or products referred to in the content. |
© 2025 by the authors. Licensee MDPI, Basel, Switzerland. This article is an open access article distributed under the terms and conditions of the Creative Commons Attribution (CC BY) license (https://creativecommons.org/licenses/by/4.0/).

