Article

Hybrid Drive Simulation Architecture for Power Distribution Based on the Federated Evolutionary Monte Carlo Algorithm

1
China Electric Power Research Institute Co., Ltd., Beijing 100192, China
2
College of Mechanical and Electrical Engineering, Beijing Information Science and Technology University, Beijing 100192, China
*
Author to whom correspondence should be addressed.
Energies 2025, 18(21), 5595; https://doi.org/10.3390/en18215595 (registering DOI)
Submission received: 3 September 2025 / Revised: 16 October 2025 / Accepted: 18 October 2025 / Published: 24 October 2025

Abstract

Modern active distribution networks are increasingly characterized by high complexity, uncertainty, and distributed clustering, posing challenges for traditional model-based simulations in capturing nonlinear dynamics and stochastic variations. This study develops a data–model hybrid-driven simulation architecture that integrates a Federated Evolutionary Monte Carlo Optimization (FEMCO) algorithm for distribution network optimization. The model-driven module employs spectral clustering to decompose the network into multiple autonomous subsystems and performs distributed reconstruction through gradient descent. The data-driven module, built upon Long Short-Term Memory (LSTM) networks, learns temporal dependencies between load curves and operational parameters to enhance predictive accuracy. These two modules are fused via a Random Forest ensemble, while FEMCO jointly leverages Monte Carlo global sampling, Federated Learning-based distributed training, and Genetic Algorithm-driven evolutionary optimization. Simulation studies on the IEEE 33 bus distribution system demonstrate that the proposed framework reduces power losses by 25–45% and voltage deviations by 75–85% compared with conventional Genetic Algorithm and Monte Carlo approaches. The results confirm that the proposed hybrid architecture effectively improves convergence stability, optimization precision, and adaptability, providing a scalable solution for the intelligent operation and distributed control of modern power distribution systems.

1. Introduction

With the large-scale grid connection of renewable energy and the increasing diversification of power demand, the modern distribution system is facing unprecedented complexity and uncertainty. At present, the simulation of distribution networks mainly includes physical model simulation and digital simulation, as well as the digital analog hybrid simulation combining the two. Now, a large number of distributed generators are connected to the distribution network, and the actual operating conditions are complex and changeable, resulting in a large number of unconventional and nonlinear data, which makes the pure physical model simulation, the pure digital simulation, and the digital analog hybrid simulation combining the two unable to achieve the simulation effect of simulating the real working conditions. Therefore, the simulation method based on data model hybrid drive will be a new research trend.
Traditional distribution systems predominantly rely on centralized control and static models. These approaches encounter significant challenges when addressing nonlinear dynamics, fluctuations associated with high-penetration distributed generation, dynamic load variations, and the frequent need for network topology reconfiguration. Consequently, they often suffer from limited predictive accuracy, low computational efficiency, and restricted adaptability. In addition, growing requirements for data privacy and efficient distributed computing impose new demands on conventional centralized optimization frameworks. Accordingly, ref. [1] proposed a distributed voltage control algorithm where agents collaboratively regulate voltage controllers and capacitors to maintain voltage within prescribed bounds while minimizing system losses and switching frequency. Ref. [2] developed a distributed multi-agent voltage/reactive power control method that estimates only the reactive power flows between nodes connected to photovoltaic units, thereby reducing computational complexity. Ref. [3] introduced a single-loop branch exchange algorithm alongside a layered distributed reconfiguration approach, and ref. [4] presented two distributed optimization control methods for active distribution networks leveraging multi-agent systems, Thevenin’s theorem, and recursive techniques. For reconfiguration, ref. [5] proposed a mixed-integer second-order cone programming (SOCP) model employing an accurate loss model to obtain the global optimum; refs. [6,7] extended SOCP formulations to incorporate load uncertainties and renewable generation stochasticity, respectively. Enhancements in genetic algorithms—including adaptive population strategies [8] and an adaptive fuzzy-based parallel genetic algorithm [9]—have further improved reconfiguration efficiency. However, current studies predominantly focus on distributed implementation without sufficiently reducing problem complexity or accelerating solution times.
Data-driven techniques have been widely applied to monitor distribution network operations, including event detection, anomaly identification, fault localization, state estimation, and load forecasting. For instance, ref. [10] introduced a data-driven event monitoring method, and ref. [11] combined wavelet transforms with decision tree algorithms for fault diagnosis and classification. In a cluster-based distributed control framework, ref. [12] emphasized that inter-cluster cooperative decision-making must achieve global optimality, with distributed algorithms—particularly the alternating direction method of multipliers (ADMM)—playing a critical role. Refs. [13,14] developed a distributed voltage and VAR control model solved reliably via ADMM, while ref. [15] addressed its slow convergence through acceleration techniques. Further improvements in reconfiguration efficiency have been achieved by modifying genetic algorithm crossover mechanisms to increase the generation probability of feasible solutions [16,17], employ a non-revisiting genetic algorithm [18], and develop hybrid algorithms that combine particle swarm optimization with hybrid frog-jump [19] and colony optimization [20]. In power flow analysis, ref. [21] established a stochastic dynamic power flow optimization model based on extensive load and distributed generation data, and ref. [22] implemented a random forest algorithm leveraging historical load, date, and weather data for customer-side load forecasting. Ref. [23] presented a multi-microgrid coordinated scheduling model integrating generation, load, storage, and demand responses, employing Lagrange multipliers, coevolutionary algorithms, and market mechanisms to enhance renewable utilization, reliability, and cost-effectiveness. Ref. [24] proposed a model-driven and data-driven hybrid reinforcement learning framework to derive generation re-dispatch schemes that mitigate transmission branch overloads, thereby enhancing grid reliability and enabling efficient real-time control. Ref. [25] proposed a distribution network fault localization method that integrates time-domain signal-to-image conversion (SIG) with a lightweight convolutional neural network (CNN), achieving synchronization-free, high-precision, low-storage, and robust positioning. Ref. [26] presented a graph database-driven parallel computing framework for Security-Constrained Unit Commitment (SCUC) in pumped-storage water–thermal systems, employing convex hull reconstruction and SOS techniques to expedite Mixed-Integer Programming (MIP) solving and security verification. Ref. [27] incorporated physical processes into data-driven methods, reducing training costs and obtaining high-quality datasets. Ref. [28] proposed a real-time integrated energy management system (IEMs) for fuel cell hybrid electric vehicles and innovatively introduced the vehicle speed prediction model and exponential filtering mechanism based on a long-term and short-term memory network (LSTM) in order to improve the prediction accuracy, optimize the power distribution, and significantly improve the hydrogen energy utilization efficiency under dynamic driving conditions. Ref. [29] constructed a comprehensive data-driven framework combining machine learning and deep learning models, which is based on real SCADA data and is coupled with technical economic analysis to accurately assess Pakistan’s onshore and offshore wind energy potential. Ref. [30] proposed the importance of the integration of electric vehicles (EV) and battery energy storage systems (BESS) in the research of distributed generation optimization and control for the safe, stable, and efficient operation of microgrids. These new systems not only provide additional flexibility and energy storage capacity but also increase the complexity of the power grid, especially in the regulation of active power, reactive power, and power quality (such as harmonics and load fluctuations).
To address the aforementioned challenges, this study proposes an enhanced distributed hybrid-driven simulation architecture that integrates federated learning, Monte Carlo simulation, and genetic algorithms. Unlike other hybrid heuristic approaches that rely on centralized or single-domain optimization, FEMCO introduces a federated evolution mechanism, enabling distributed subsystems to collaboratively optimize without sharing raw data. Federated learning establishes a virtual common model through encrypted parameter exchange, ensuring data privacy and compliance, while Monte Carlo adaptive initialization generates candidate solutions with inherent uncertainties, improving the algorithm’s convergence speed and robustness under fluctuating network conditions. By combining global random sampling, distributed parameter aggregation, and evolutionary optimization, FEMCO not only reduces the dependence of conventional genetic algorithms on the initial population but also overcomes the limited search awareness of other hybrid heuristic methods, achieving an optimization framework that simultaneously ensures privacy protection, uncertainty modeling, and global convergence capability. Specifically, the main contributions of this article can be summarized as follows:
1.
A decomposition method based on spectral clustering is proposed to achieve the multi-subsystem partitioning of distribution networks, providing a structural foundation for distributed reconstruction and collaborative optimization.
2.
A data-driven module based on Long Short-Term Memory (LSTM) networks has been constructed, which achieves the high-precision prediction of distribution system parameters through feature extraction and dynamic mapping mechanisms and provides temporal decision support for reconstruction strategies.
3.
By integrating the model-driven and data-driven modules through the Random Forest Algorithm and combining them with the FEMCO for optimization, the initial high-quality solution set of the hybrid model is constructed from a global perspective by integrating the global sampling of Monte Carlo, the distributed training of Federated Learning, and the evolutionary optimization mechanism of a Genetic Algorithm. This partially solves the dependence of traditional Genetic Algorithms on initial population selection.
This article is organized as follows: Section 2 introduces the model-driven module of the distribution system. Section 3 describes the theoretical analysis of data-driven modules using LSTM to predict distribution system parameters. Section 4 introduces the use of a Random Forest Algorithm to construct a hybrid model and combines it with FEMCO for optimization. In Section 5, a standard distribution network is used as an example for simulation verification. Section 6 summarizes the article.

2. Distribution System Model-Driven Module Analysis

2.1. Spectral Clustering Decomposition Method for Distribution Systems

The loops in the distribution network are mutually coupled, and reconstruction cannot be performed within a single loop alone. To achieve distributed reconstruction, this section proposes a spectral clustering method based on graph theory to partition the distribution network into several autonomous subsystems. The power grid topology is modeled as an undirected graph G = (V, E, A), where V represents the set of equipment nodes, E represents the set of edges connecting the equipment, and A is the symmetric adjacency matrix used to describe the connection strength between nodes. The Laplacian matrix L is a key matrix that describes the graph structure, and it is defined by L = DA, where D is the degree matrix, a diagonal matrix with Dii = di representing the degree of node i, which reflects the total weight of the edges connected to node i. The Laplacian matrix L reflects the connectivity of the graph, and its eigenvalues are closely related to the graph structure. In spectral clustering, the main focus is on the smallest eigenvalue and its corresponding eigenvector.
The spectral clustering method partitions the power grid nodes into multiple subsystems by performing eigenvalue decomposition of the Laplacian matrix L. The first step is to compute the first k smallest eigenvalues of the Laplacian matrix and their corresponding eigenvectors. These eigenvectors reveal the natural divisions in the graph structure. The top k eigenvectors are then selected to form the matrix Vk. Each row of the eigenvector matrix Vk is subjected to k-means clustering, grouping similar nodes into the same cluster. The objective of each subsystem is to minimize the distance between the nodes and their centroids. Ultimately, the spectral clustering algorithm results in a set of subsystems, each corresponding to a subset of the power grid nodes. The topology of each subsystem can be represented as a subgraph G′ = (V′, E′), where V′V is the set of partitioned nodes, and E′E is the corresponding set of edges.

2.2. Distributed Reconstruction of Subsystems and Gradient Descent Algorithms

In a distribution system, each subsystem acts as a control unit that needs to consider the constraints and states of other subsystems, coordinating through communication between controllers. Therefore, this section proposes a distributed reconfiguration method for multiple subsystems and a correction algorithm for the distributed gradient descent algorithm to ensure the coordinated operation of the entire system. By modeling each subsystem after topological decomposition and considering the electrical coupling between subsystems, a coupling term is introduced to achieve distributed control, enabling global stability and optimization through local information and control. Its dynamic behavior is represented by the state equation shown in Equation (1), where xi(t) is the state vector of subsystem Si, Ai is the system matrix of subsystem Si, Bi is the control input matrix, ui(t) is the control input, t is the time variable, indicating the time of the simulation, Ni is the neighbor subsystem set of subsystem Si, and Cij is the coupling matrix between the state of neighbor subsystem Sj and subsystem Si, which quantifies the coupling strength of neighbor subsystem Sj to subsystem Si. Cij ≠ 0 with boundary power flow coupling. If there is no direct coupling, Cij = 0. xj(t) is the state vector of the neighbor subsystem Sj.
x ˙ i t = A i x i t + B i u i t + C ij x j t
To ensure the global system’s stability and optimality, this section employs a distributed optimization algorithm based on distributed gradient descent to adjust the control inputs of each subsystem. Each subsystem independently optimizes its objective function as a node and cooperates with other subsystems through a communication network. The local objective function of each subsystem is represented by Equation (2), and the global objective function is given by Equation (3). Here, fi(x) denotes the local objective function of the i-th subsystem, x represents the globally shared variable among all subsystems, and Ai and Bi refer to the local data matrix and target vector of the i-th subsystem, respectively.
f i x = 1 2 A i x b i 2
f x = i = 1 N f i x = 1 2 i = 1 N A i x b i 2
The goal of gradient descent is to independently compute the gradient for each subsystem and collaboratively minimize the global objective function f(x). If the gradient of the i-th subsystem ∇fi(x) is given by Equation (4), then the gradient of the global objective function ∇f(x) is given by Equation (5). For each subsystem, the update rule for the k-th iteration is expressed by Equation (6), where xik denotes the state variable of the i-th subsystem at the k-th iteration, and η is the learning rate.
f i x = A i T A i x b i
f x = i = 1 N A i T A i x b i
x i k + 1 = x i k η f i x i k = x i k η A i T A i x i k b i
In order to achieve global optimization, the adjacency matrix A is typically used to facilitate information exchange between subsystems and their neighboring subsystems. To ensure global variable consistency, communication constraints are usually imposed. Let the set of neighbors of subsystem i be Ni. Each node updates its local variable through its neighboring node j, as shown in Equation (7). Here, ωij represents the communication weight, which is typically a symmetric and normalized weight matrix. This equation consists of three parts: the gradient based on the local objective function as the local update term, the consistency constraint with the neighboring node’s variable as the communication term, and the global step size controlled by the learning rate η to regulate the update speed. The convergence condition of the distributed gradient descent method depends on whether fi(x) is a convex function or if the learning rate η is sufficiently small. The stopping criterion is whether the gradient satisfies ‖∇f(x)‖ ≤ ε.
x i k + 1 = x i k η f i x i k + j N i ω ij x j k x i k = x i k η A i T A i x i k b i + j N i ω ij x j k x i k

3. The Data-Driven Module Analysis of Distribution Systems

The efficient operation and optimization of power distribution systems rely on real-time data acquisition and preprocessing. The process of constructing a data-driven model includes steps such as data collection and preprocessing, model development, model training, optimization, and validation.
Data acquisition and preprocessing are the basis of building a data-driven model, which directly affects the performance and accuracy of the model. Data acquisition includes obtaining real-time or historical data from the distribution system. Preprocessing includes missing value processing, outlier detection, and normalization. Missing data can be input by linear interpolation, and outliers can be identified and processed by detection based on standard deviation. In order to improve the training efficiency of the model, the normalization method used in this section is MinMax normalization. Let x represent the original data, which can represent voltage and power data, respectively. xnorm represents the normalized data, and the normalization formula is shown in Equation (8).
x norm = x min x max x min ( x )
In order to improve the training accuracy and the deviation between the predicted data and the real data, this study uses the long-term and short-term memory (LSTM) network as the training model. The LSTM network is composed of an input layer, LSTM layer, full connection layer, and output layer and has a gating mechanism to control the information flow. This method solves the gradient vanishing problem of traditional recurrent neural networks (RNN) in long sequence training.
In the LSTM layer, the gating mechanism processes sequential input data through the forget gate, input gate, and output gate. The forget gate determines how much of the data from the current time step should be discarded, with its output being a value between 0 and 1, where 0 means complete forgetting and 1 means complete retention. The input gate controls how much new information is stored in the memory unit at the current time step. The output gate dictates the output at the current time step. The operation of these gates allows the LSTM to maintain the flow of information over long sequences, preventing the loss of important long-term dependencies due to excessive time steps.
At each node t, the two-dimensional load features and the distribution network topology are input into the LSTM layer. The forget gate determines whether the information should be passed on or forgotten. The input gate controls how much new information can be stored and generates a memory cell. Subsequently, the state of the block is updated, and the output gate decides whether the new cell should be passed to the next node. The structure of the LSTM layer is illustrated in Figure 1.
To enhance training accuracy and reduce the deviation between predicted and actual data, the learning process of the LSTM layer is based on Equations (9)–(14) to generate initial weight matrices and biases. Specifically, Wf, Wi, Wo, and Wc represent the weight matrices of the forget gate, input gate, output gate, and candidate cell state, respectively, while bf, bi, bo, and bc denote the bias vectors corresponding to the forget gate, input gate, output gate, and candidate cell state. Here, xt represents the input vector at the current time step, ht and ht−1 denote the hidden state vectors at the current and previous time steps, and Ct and Ct−1 represent the cell state vectors at the current and previous time steps. The forget gate, input gate, output gate, and candidate cell state vectors are represented by ft, it, ot, and C ~ t , respectively. As shown in Equation (15), the RMSE index quantifies the deviation between the predicted and actual values. A smaller RMSE indicates higher prediction accuracy, where N denotes the number of samples, ytrue represents the true data, and ypred refers to the predicted data obtained through the trained model.
f t = σ W f × h t 1 , x t + b f
i t = σ W i × h t 1 , x t + b i
C ~ t = tanh W c × h t 1 , x t + b c
C t =   f t × C t 1 + i t × C ~ t
o t = σ W o × h t 1 , x t + b o
h t =   o t × tanh C t
RMSE = 1 N i = 1 N y true y pred 2
To enhance the predictive performance of the LSTM model, one approach is to optimize it by increasing the number of LSTM layers. Stacking multiple LSTM layers can improve the model’s representational capacity, but care must be taken to prevent overfitting. Additionally, hyperparameters such as the learning rate, the batch size, and the number of hidden units can be fine-tuned. Incorporating external features, such as temperature, humidity, and holiday information, can also provide the model with more context, thereby improving prediction accuracy.

4. The Analysis of the Data-Model Hybrid-Driven Framework for the Distribution System

4.1. Integration Method Based on the Random Forest Algorithm

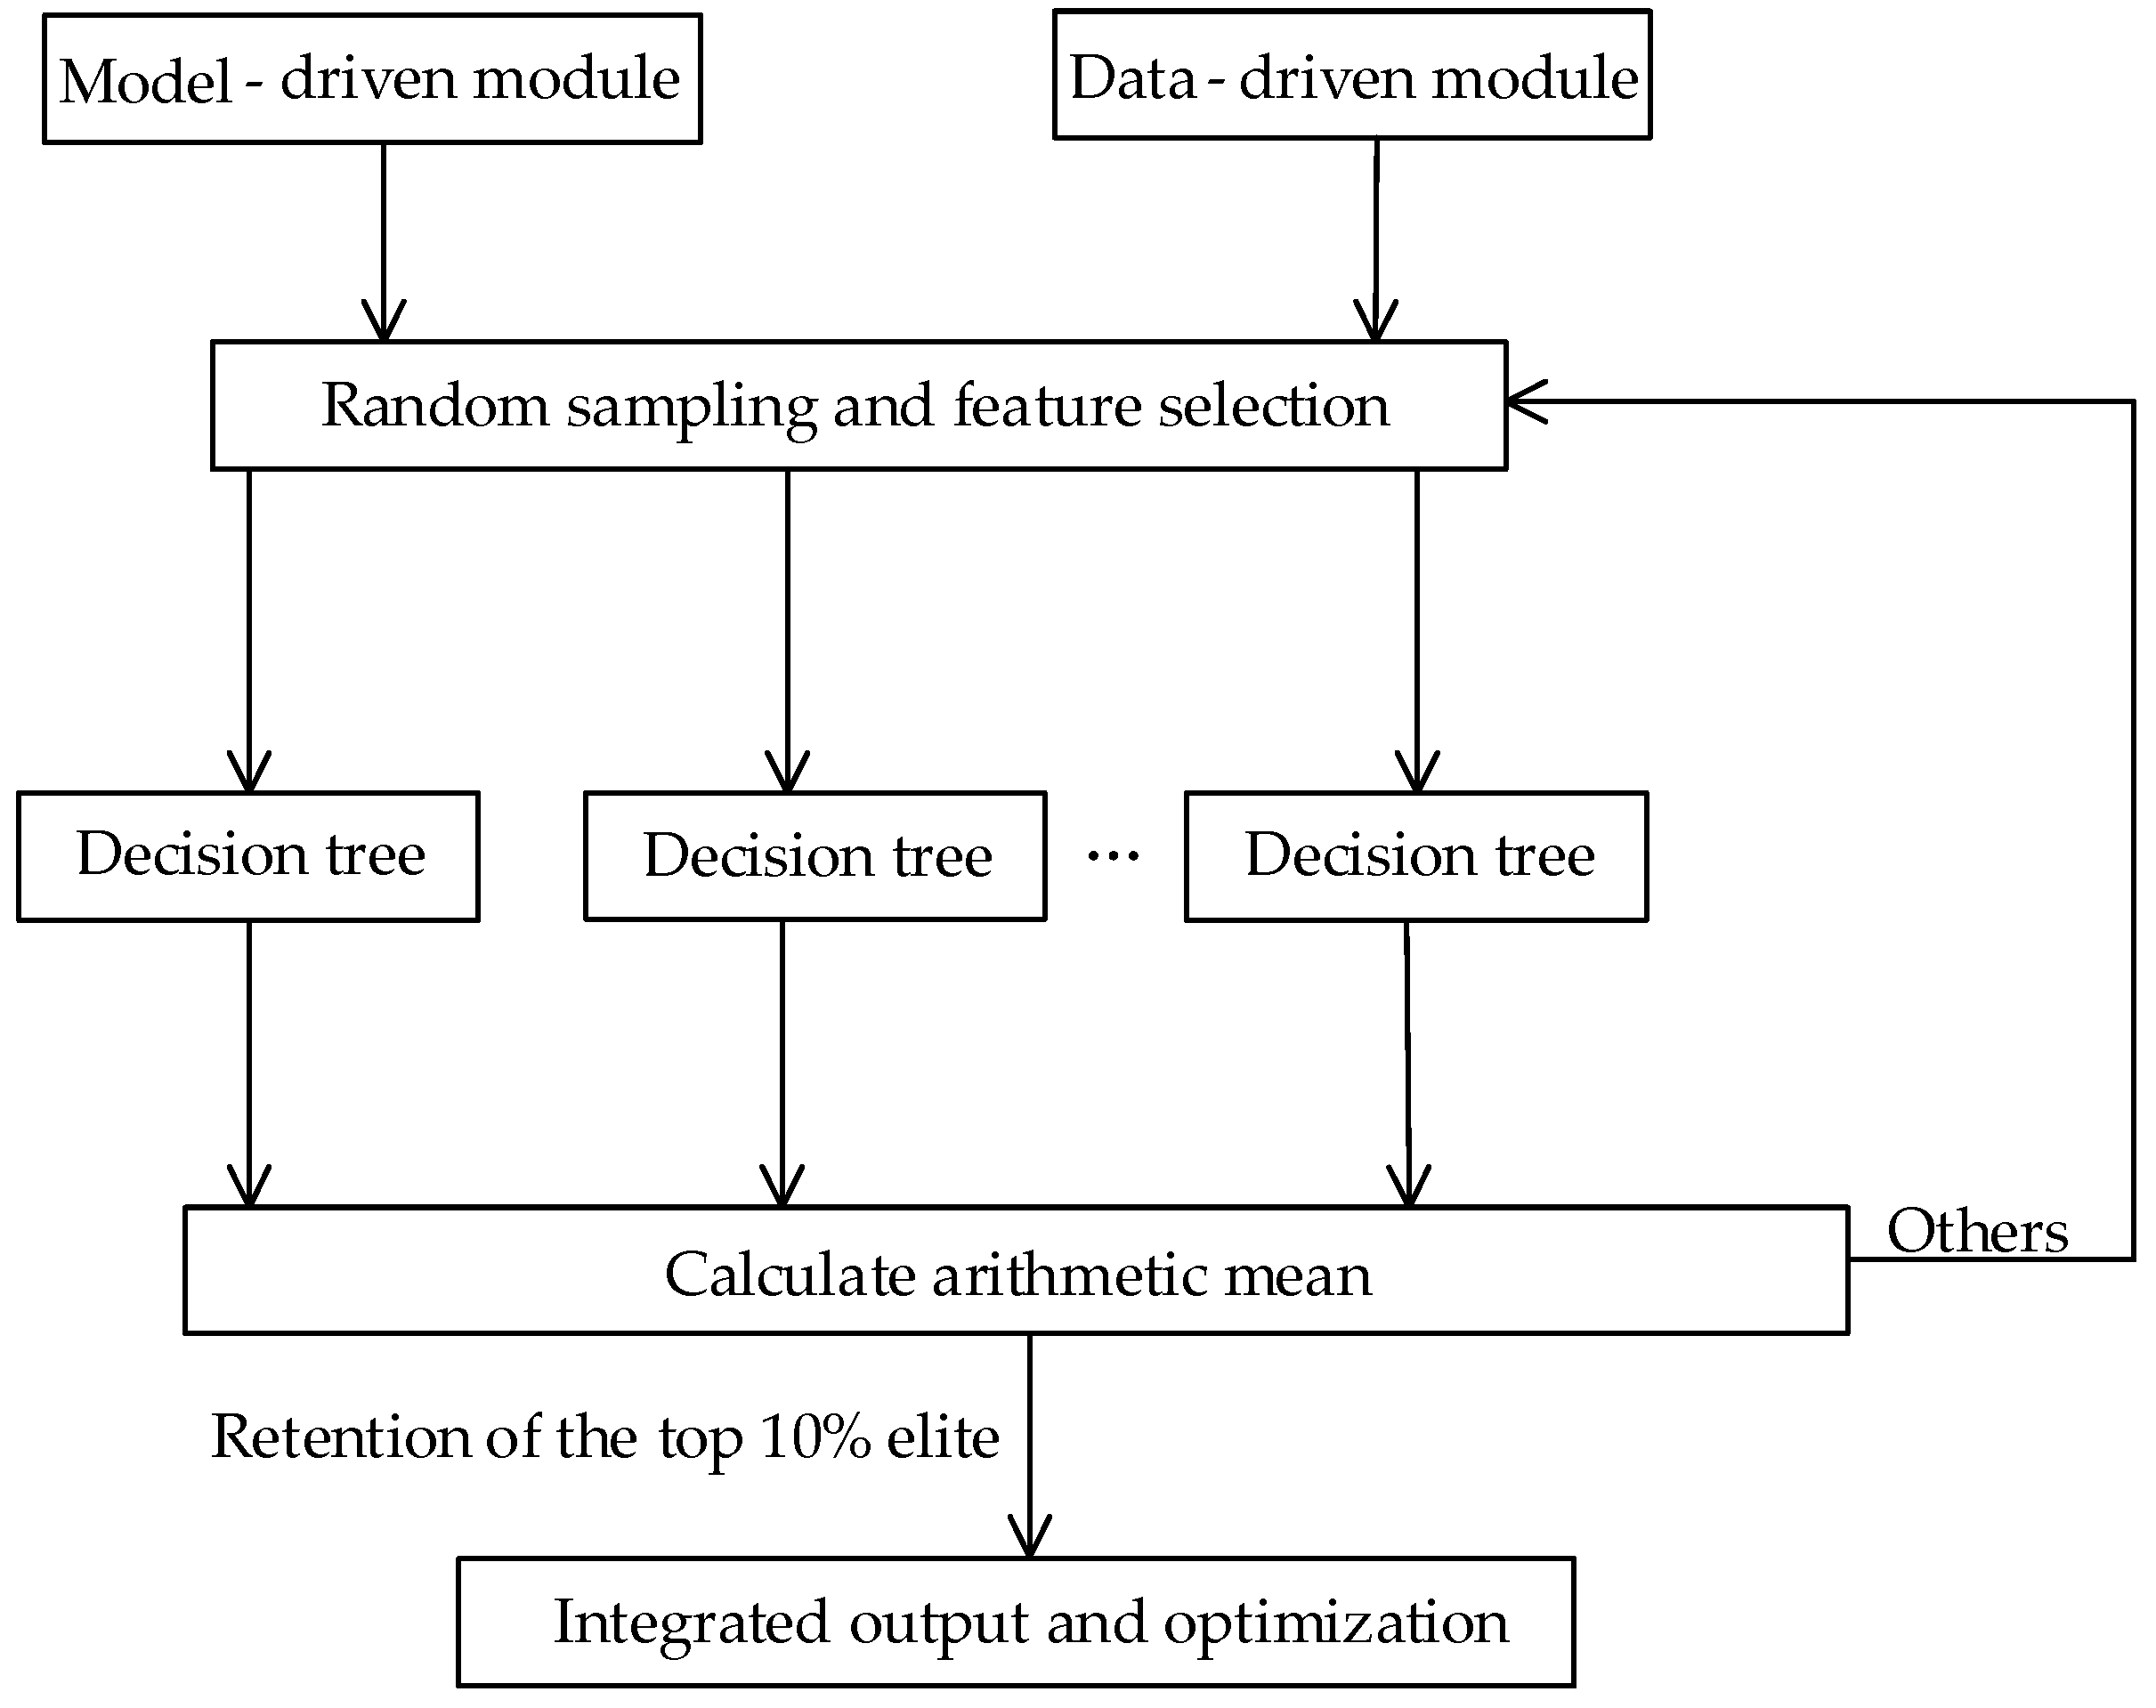
The core of constructing a data-model hybrid-driven framework for distribution systems lies in combining the reliability of physical models with the adaptability of data-driven models. This is achieved by using machine learning models based on the LSTM algorithm to supplement and optimize traditional K-means-based spectral clustering methods, thereby enhancing the system’s predictive ability and operational optimization. The prediction results from the data-driven model are utilized to perform real-time calibration of the physical model’s parameters, adjusting the model’s output to better align with the actual system state. In cases where the physical model fails to accurately capture complex nonlinear dynamics, the additional predictions provided by the LSTM-based data-driven model can serve as a complement. The goal of the data-model hybrid-driven framework is to optimize the integration of physical constraints and data features, ensuring that the system can adapt to environmental changes while maintaining physical validity. In the distribution system, the data-driven model automatically learns system behaviors from historical data, reflecting the dynamic characteristics of the distribution network under various operating conditions. Specifically, the framework can incorporate demand response strategies to enable utility companies to more accurately predict future demand, adjust load curves, and allow customers to achieve energy conservation. The model-driven module, on the other hand, simulates and predicts the distribution network based on physical principles through mathematical models. By integrating the data-driven module and the model-driven module, the aim is to improve the system’s prediction accuracy and decision-making efficiency, thereby reducing energy loss and enhancing system utilization. This section intends to integrate the data-driven and model-driven components using random forests, as shown in Figure 2, to obtain an optimized operational strategy for the distribution system.
In constructing a random forest, we first draw N samples from the training set D = {(x1, y1), (x2, y2), …, (xN, yN)} with replacement to generate a new subset D(t), where the size of each subset is the same as the original training set. Each tree is trained using one such subset. During the construction of each tree, assume there are d features in total, and at each node split, a random subset of m = [√d] features is selected. The optimal split point is then chosen based on the root mean square error (RMSE) among the selected m features.
In the Random Forest algorithm, for regression tasks, the final prediction is obtained by averaging the predicted values from all trees. The final regression prediction is the average of the predicted values from all trees, as shown in Equation (16). Here, ŷ(t) Represents the predicted output of tree t, and T represents the number of trees.
y ^ = 1 T i = 1 T y ^ t
In the distribution network, the random forest integrates the data-driven module and the model driven module through Equations (17)–(19). Specifically, the global voltage state reconstructed by the model driven module is used as the static feature, and the load and photovoltaic and other dynamic quantities trained by the LSTM are used as the dynamic features. The physical quantities and data-driven quantities are input into multiple decision trees after normalized mapping, and the fusion is realized by the RF regression of multiple decision trees. The RF model outputs a voltage correction term ΔVRF, which quantifies the deviation between the physically reconstructed voltage and the voltage estimated by the LSTM. Therefore, the final hybrid voltage state is represented as Vhybrird = Vmodel + ΔVRF, ensuring consistency between the physical subsystem and the data-driven subsystem. U(kV) is taken from the global voltage state reconstructed by the model drive module, I(A), P(MW), and Q(MVAR) represent the current, active power, and reactive power data predicted by the LSTM, and Z(Ω) represents the network impedance matrix.
U = f ( Z , I , P , Q )
X data = x 1 , x 2 , , x m
y ^ = 1 T t = 1 T y ^ RF ( t ) X data , f ( Z , I , P , Q )

4.2. Operation Optimization Method Based on the FEMCO Algorithm

The distribution system is designed to achieve energy balance at each node and maintain system stability, with optimization objectives typically including the reduction in energy losses and the improvement of operational efficiency. To balance multiple objectives, this section proposes a Federated Evolutionary Monte Carlo Optimization (FEMCO) algorithm. This algorithm integrates the stochastic search capabilities of Monte Carlo Simulation (MCS), the data privacy protection and distributed computing features of Federated Learning (FL), and the evolutionary optimization capabilities of a Genetic Algorithm (GA) to optimize the data–model hybrid-driven approach for distribution systems.
The core concept of the Federated Evolutionary Monte Carlo Optimization algorithm (FEMCO) is to utilize Monte Carlo Simulation (MCS) to generate a large number of candidate solutions, providing a high-quality random initial solution set for the optimization process. Federated Learning (FL) is employed to integrate distributed distribution system data, enhancing the model’s global generalization capability. Finally, the Genetic Algorithm (GA) is applied to perform optimization through crossover, mutation, and selection processes, progressively approaching the optimal operational scheme.
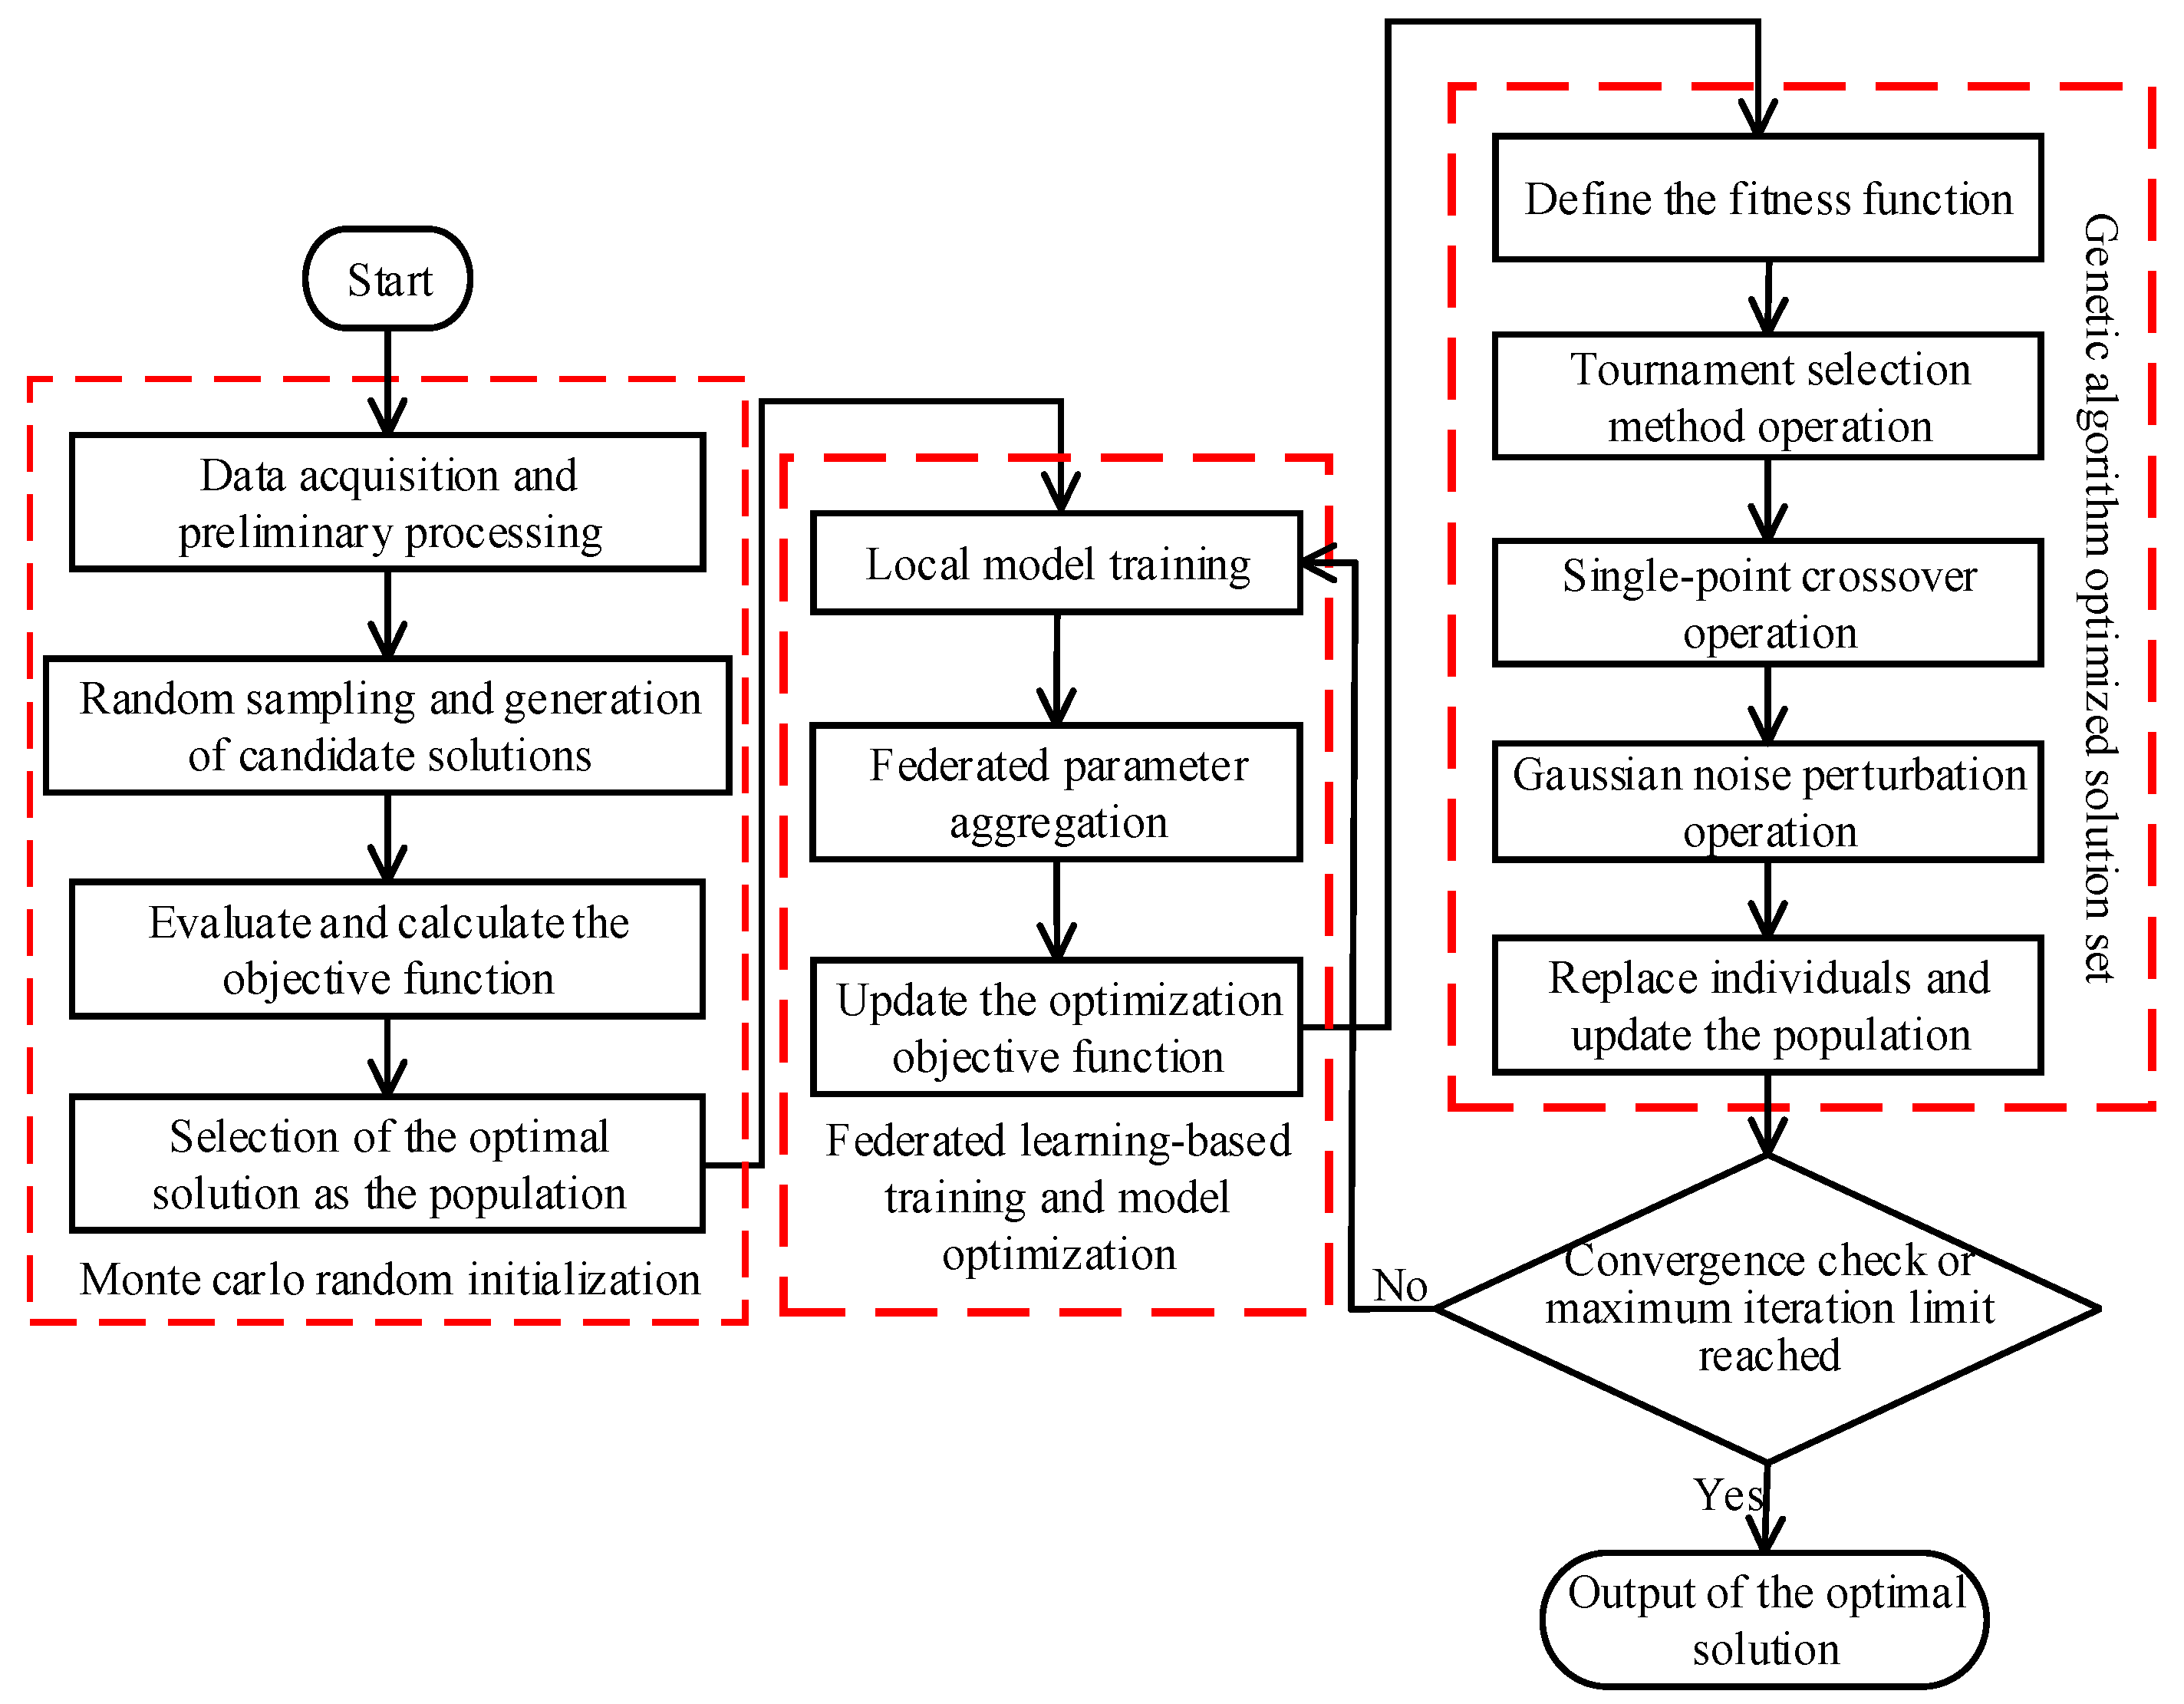
In the Federated Evolutionary Monte Carlo (FEMC) optimization algorithm, the Monte Carlo method is used to sample the uncertainty of input variables, thereby achieving high-quality initialization of the solution space. Let the input parameter set of the distribution system be denoted X = {X1, X2, …, Xn}, where each parameter follows the probability distribution P(Xi). N sets of random candidate solutions X(j) = {X1(j), X2(j), …, Xn(j)} are generated, where j = 1, 2, …, N. The objective function F(X(j)) of the random candidate solutions X(j) is calculated as shown in Equation (20), and the top K solutions are selected as the initial population P0, where m represents the number of candidate solutions in X(j), fi(X(j)) denotes the objective function of the i -th candidate solution in X(j), and ωi is the weight coefficient corresponding to the objective function of the i-th candidate solution.
F X j = i = 1 m ω i f i X j
The model driven components of the distribution system divide the system into multiple subsystems. The optimization model of each subsystem uses the federated model for distributed training and optimization to improve the generalization ability of the model. The method also improves the global adaptability of the optimization algorithm and aggregates the global parameters. The model parameter θit+1 of each subsystem i in the next time step t + 1 is given by Equation (21), where θit represents the model parameter of the i-th subsystem in the current time step T, Li(θ) is the local loss function, and η represents the learning rate.
θ i t + 1 = θ i t η L i θ i t
The model-driven component of distribution system divides the system into multiple distribution systems by the spectral clustering method, and each distribution system is regarded as a client. Each client saves local datasets of loads, voltage, reactive power, etc. in its area, which are not independent and identically distributed due to temporal and spatial differences. The federal learning framework can realize the independent distributed training and optimization of each distribution system to improve the generalization ability of the model. During the training process, each client independently optimizes the local model, uses the same learning rate and loss function, and periodically aggregates the model parameters through the FedAvg protocol, as shown in Equation (22), where M is the number of subsystems participating in the training and ni is the data of the i-th subsystem, N = ∑ni. After training with the federated algorithm, the optimization objective function can be improved from the data-driven prediction model to the form shown in Equation (23). The federal learning framework proposed in this manuscript reflects the distributed characteristics of the distribution system. Because local control centers usually cannot share the original data, there are privacy and communication bandwidth restrictions. Therefore, the federated learning framework can realize distributed training under the premise of system partition, which helps to improve the scalability and generalization ability of the model.
θ t + 1 = i = 1 M n i N θ i t + 1
F FL X = i = 1 m ω i f i X , θ t + 1
The Genetic Algorithm is used to optimize the candidate solution obtained from the Federal Learning Algorithm (FL). First, the fitness function fitness(Xi) of individual Xi is defined as shown in Equation (24), and the tournament selection shown in Equation (25) is used to select individuals with higher fitness. Then, single-point crossover is used to generate new candidate solutions as shown in Equation (26), and Gaussian noise mutation is introduced as shown in Equation (27). Mutation candidate solutions are used to replace some inferior individuals and form a new group. A global assessment of the optimized solution set is performed. If the objective function FFL(x) satisfies |FFLt+1FFLt| < ε, the process is terminated; otherwise, the iteration will continue. Or, if the maximum number of iterations Tmax is reached, the process is terminated; otherwise, the iteration will continue. FFL(Xi) is the objective function of individual i; P(Xi) represents the selection probability of tournament selection; Xnew represents a new individual generated by cross-operation; Xi and Xj represent the parent individuals i and j participating in the crossover; Xmut represents the candidate solution after Gaussian mutation; X is the individual to be mutated; ε is the probability of Gaussian variation, which follows the Gaussian distribution with a mean value of 0 and variance of σ2; and σ is the variation amplitude.
fitness X i = 1 1 + F FL X i
P X i = fitness X i j fitness X i
X new = α X 1 + 1 α X 2 , α ϵ 0 , 1
X mut = X + ε , ε ~ N 0 , σ 2
The Federated Evolutionary Monte Carlo Optimization algorithm (FEMCO) provides high-quality initialization through the Monte Carlo method, performs data-driven optimization using federated learning, and further optimizes the solution set with a genetic algorithm, ultimately achieving data–model hybrid-driven optimization for the distribution system. This method integrates global search, distributed computing, and evolutionary optimization, enabling efficient parallel computation and finding the optimal solution for the distribution system’s operation, effectively enhancing system optimization performance. The algorithmic flowchart of the Federated Evolutionary Monte Carlo Optimization (FEMCO) algorithm is shown in Figure 3.

4.3. Binding Conditions

In the actual simulation, we consider the power flow constraints, branch current constraints, and node voltage constraints of equality and inequality constraints.
(1)
Nodal power flow equation constraints:
P Gi P Li U i j = 1 N U j G ij cos δ ij + B ij sin δ ij = 0 Q Gi Q Li U i j = 1 N U j G ij sin δ ij + B ij cos δ ij = 0
where PGi(MW) and QGi(MVAR) are the active and reactive power output of the power supply at the node, respectively; PLi(MW) and QLi(MVAR) are the active and reactive loads at the node, respectively; Ui(kV) is the node voltage; Gij(S) and Bij(S) are system admittance; and δij(°) is the phase angle difference of node voltage.
(2)
Branch current constraint:
0 I j , t I j b , t max
where Ij,tmax(A) refers to the maximum allowable current of branch j in t period.
(3)
Node voltage constraint:
U i , t min U i , t U i , t max
where Ui,tmax(kV) and Ui,tmin(kV) refer to the upper and lower limits of the voltage of node i in period t.

5. Case Study Analysis

In order to verify the effectiveness of the method proposed in this paper, based on the IEEE 33 bus distribution system, and combined with the actual data of the distribution network in the author’s workplace, the simulation verification and analysis are carried out. The parameters of the model driving module are based on the IEEE 33 bus distribution system, with a basic voltage of 12.66 kV and a basic power of 100 MVA, including 32 normally closed branches and 5 normally open branches. The load data of IEEE 33 distribution nodes 18, 22, 25, 27, and 33 are replaced by the power load data of five buildings in the author’s workplace.
The data used in the data-driven module were obtained from the internal distribution network of the author’s workplace, comprising a total of 720 h of historical data over a 30-day period. In the LSTM module, the simulation includes 32 normally closed branches. After 16 iterations, the error stabilizes, leading to a total of 32 × 16 ≈ 510 updates. The sensitivity analysis reveals that the default settings are as follows: two LSTM layers with 128 hidden units, a look-back window of 24 h, a prediction horizon of 1 h ahead, and a dropout rate of 0.2. The optimizer used is AdamW (weight decay = 1 × 10⁻⁴, learning rate = 0.001, batch size = 32), with OneCycleLR as the learning rate scheduler. Gradient clipping and early stopping are employed to prevent overfitting. Additionally, fivefold time-series cross-validation was applied, ensuring that validation samples followed training samples in temporal order to avoid data leakage.
The Random Forest uses 50 decision trees to build the regression model and sets the maximum tree depth to 14, criterion = squared_error, max_features = ‘sqrt’, and min_samples_leaf = 2, and class_ weight = ‘balanced’ is adopted in the scenario of the unbalanced category. The FEMCO algorithm uses 50 individuals for 100 iterations and 1000 Monte Carlo simulations to screen the population. Using algorithm crossover and the Gaussian mutation strategy, the top 10% of elite data directly enter the next generation.
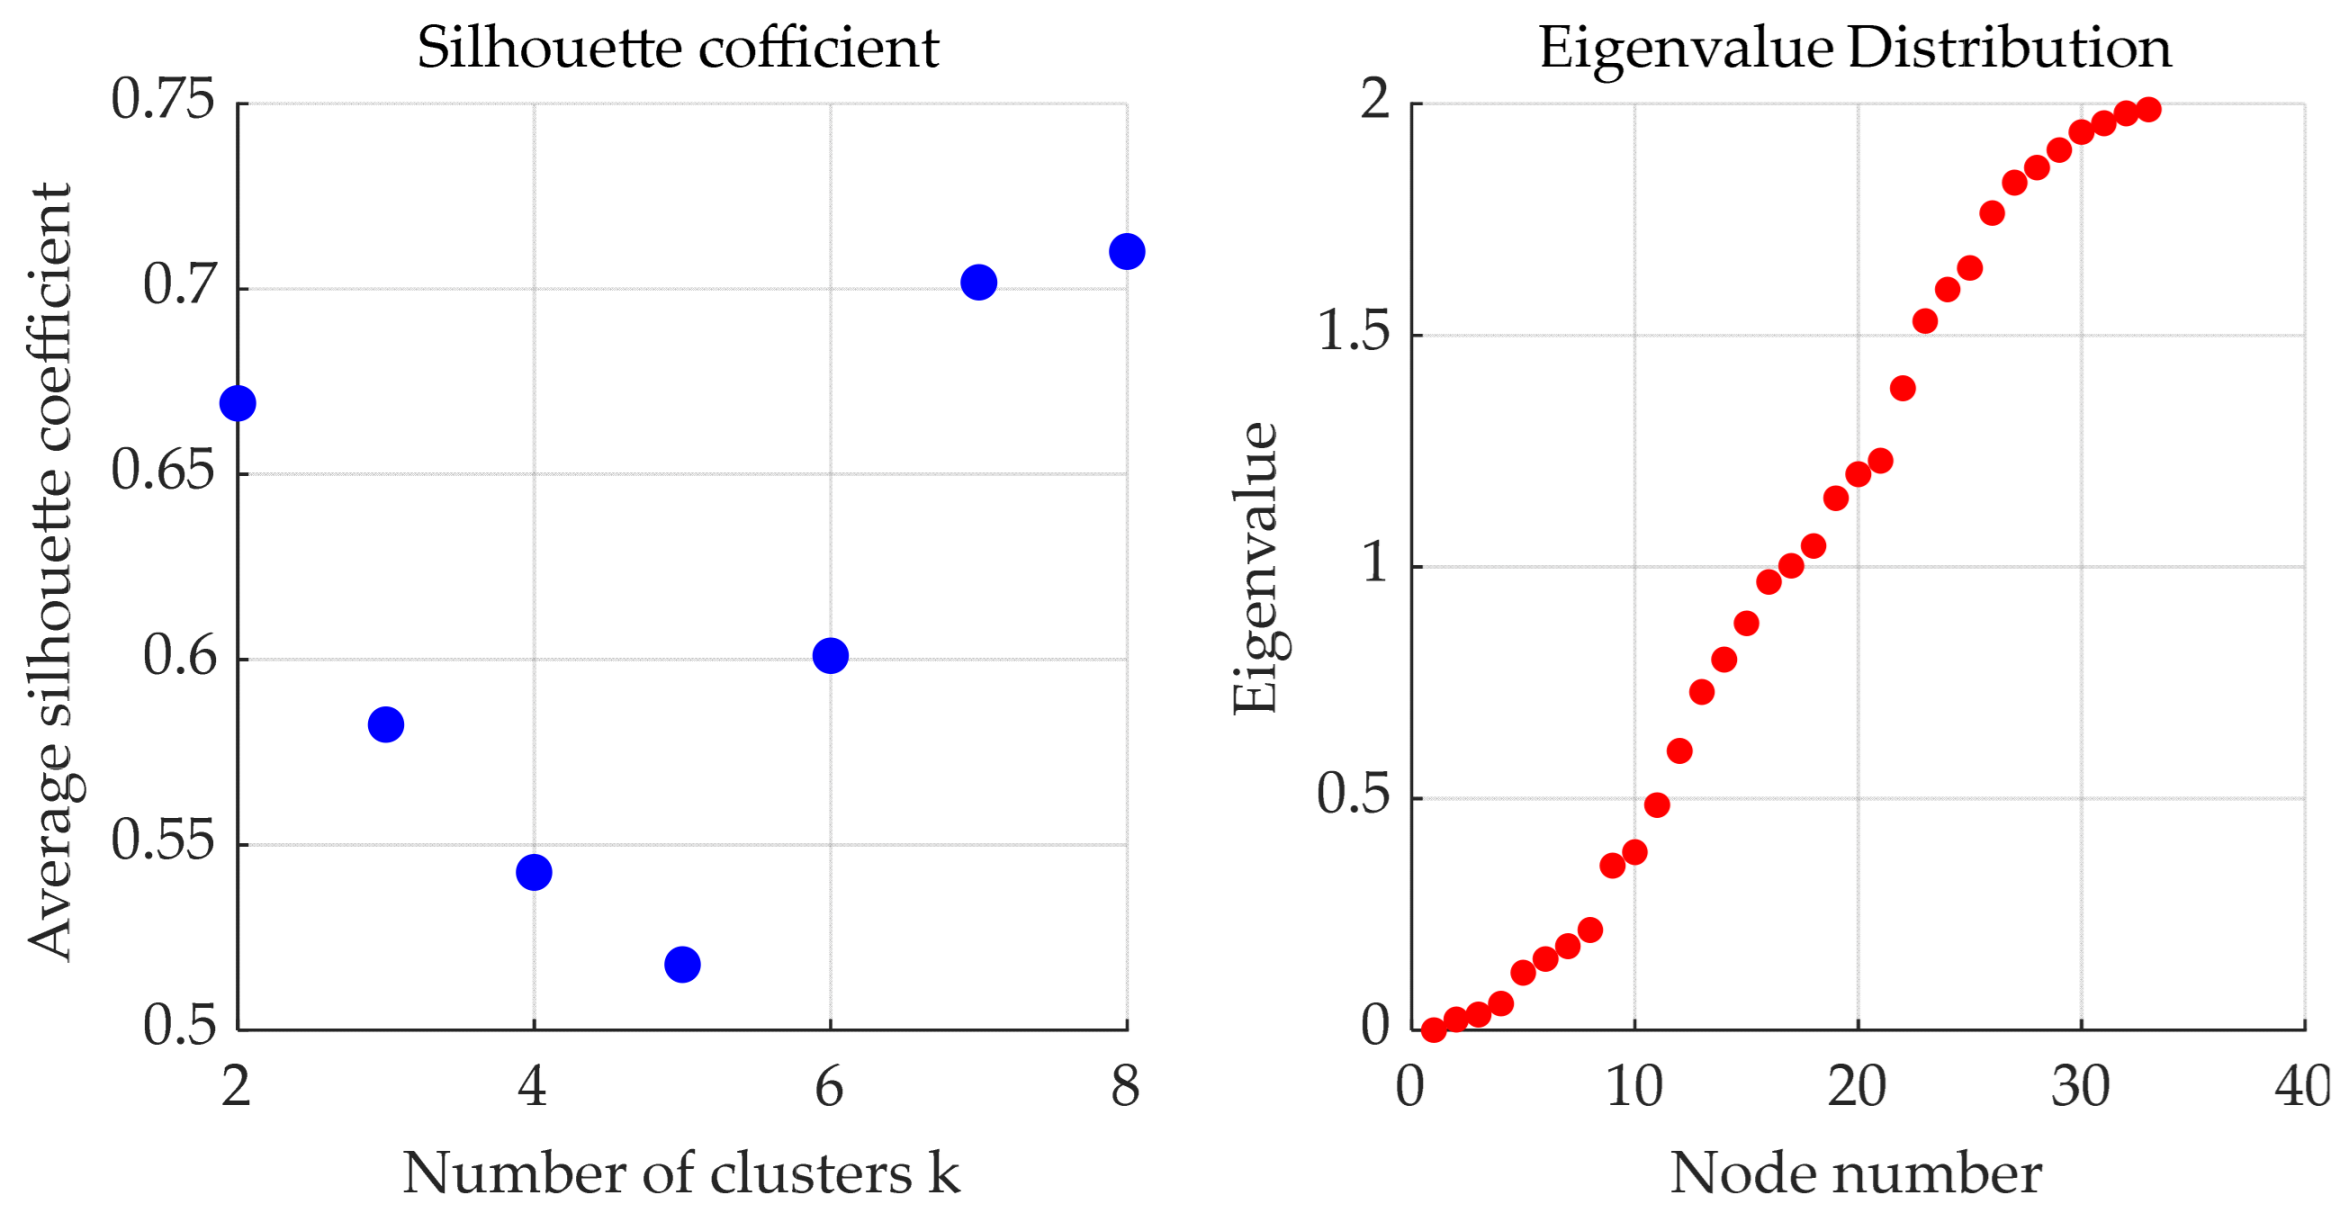
The contour coefficient and eigenvalue distribution of the Laplacian matrix at each node are obtained by spectral clustering analysis, as shown in Figure 4. The optimal number of clusters is determined to be k = 5, and the IEEE 33 bus distribution system is divided into five independent sub networks, as shown in Figure 5. Through the stability verification, the RAND Index (ARI) and Normalized Mutual Information (NMI) were calculated, and the results were 0.71 and 0.75, respectively. Other k values would rapidly reduce ARI and NMI, so k = 5 was the best number of clusters.
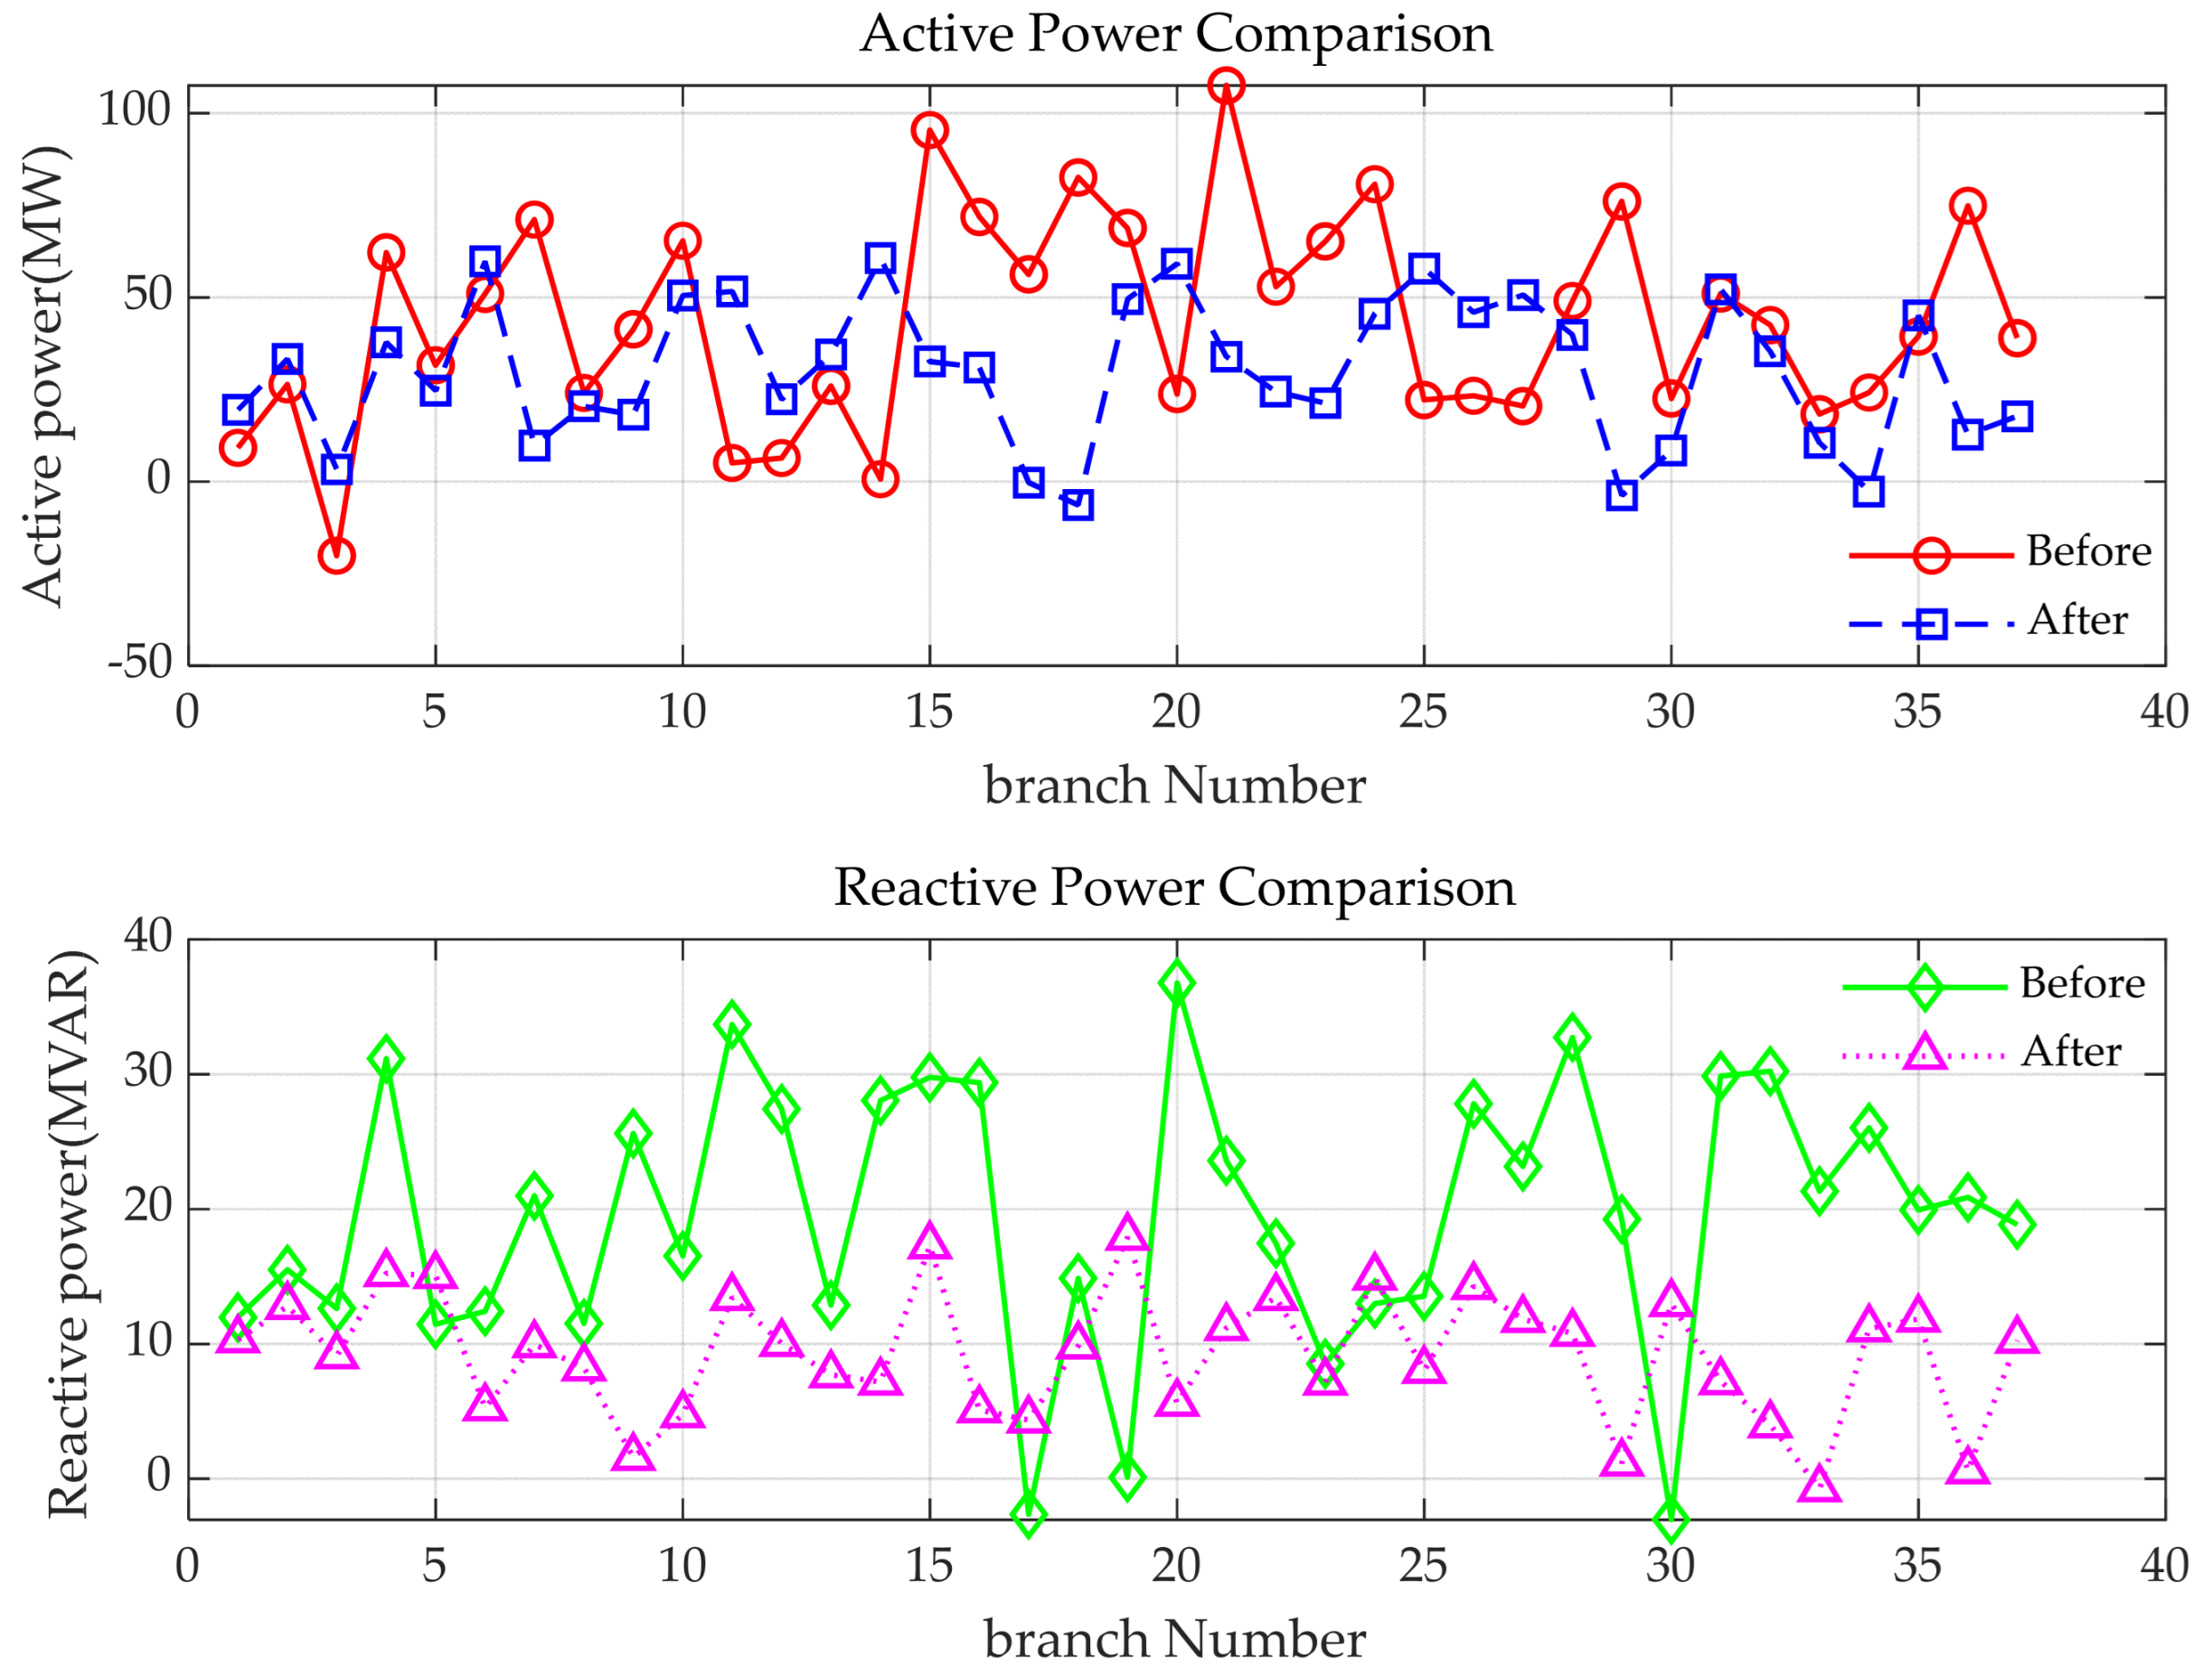
After the IEEE 33 bus distribution system is decomposed into independent distribution systems, the distributed gradient descent algorithm is used for reconstruction and correction. Comparing the active power and reactive power curves of the branch before and after decomposition, as shown in Figure 6, the fluctuation of the active and reactive power of the branch after decomposition is significantly reduced, indicating that the power flow of the branch is more stable and the energy distribution is more balanced. This means that the load sharing is more reasonable, the branch operation stress is reduced, and the voltage regulation ability and operation stability of the system are improved.
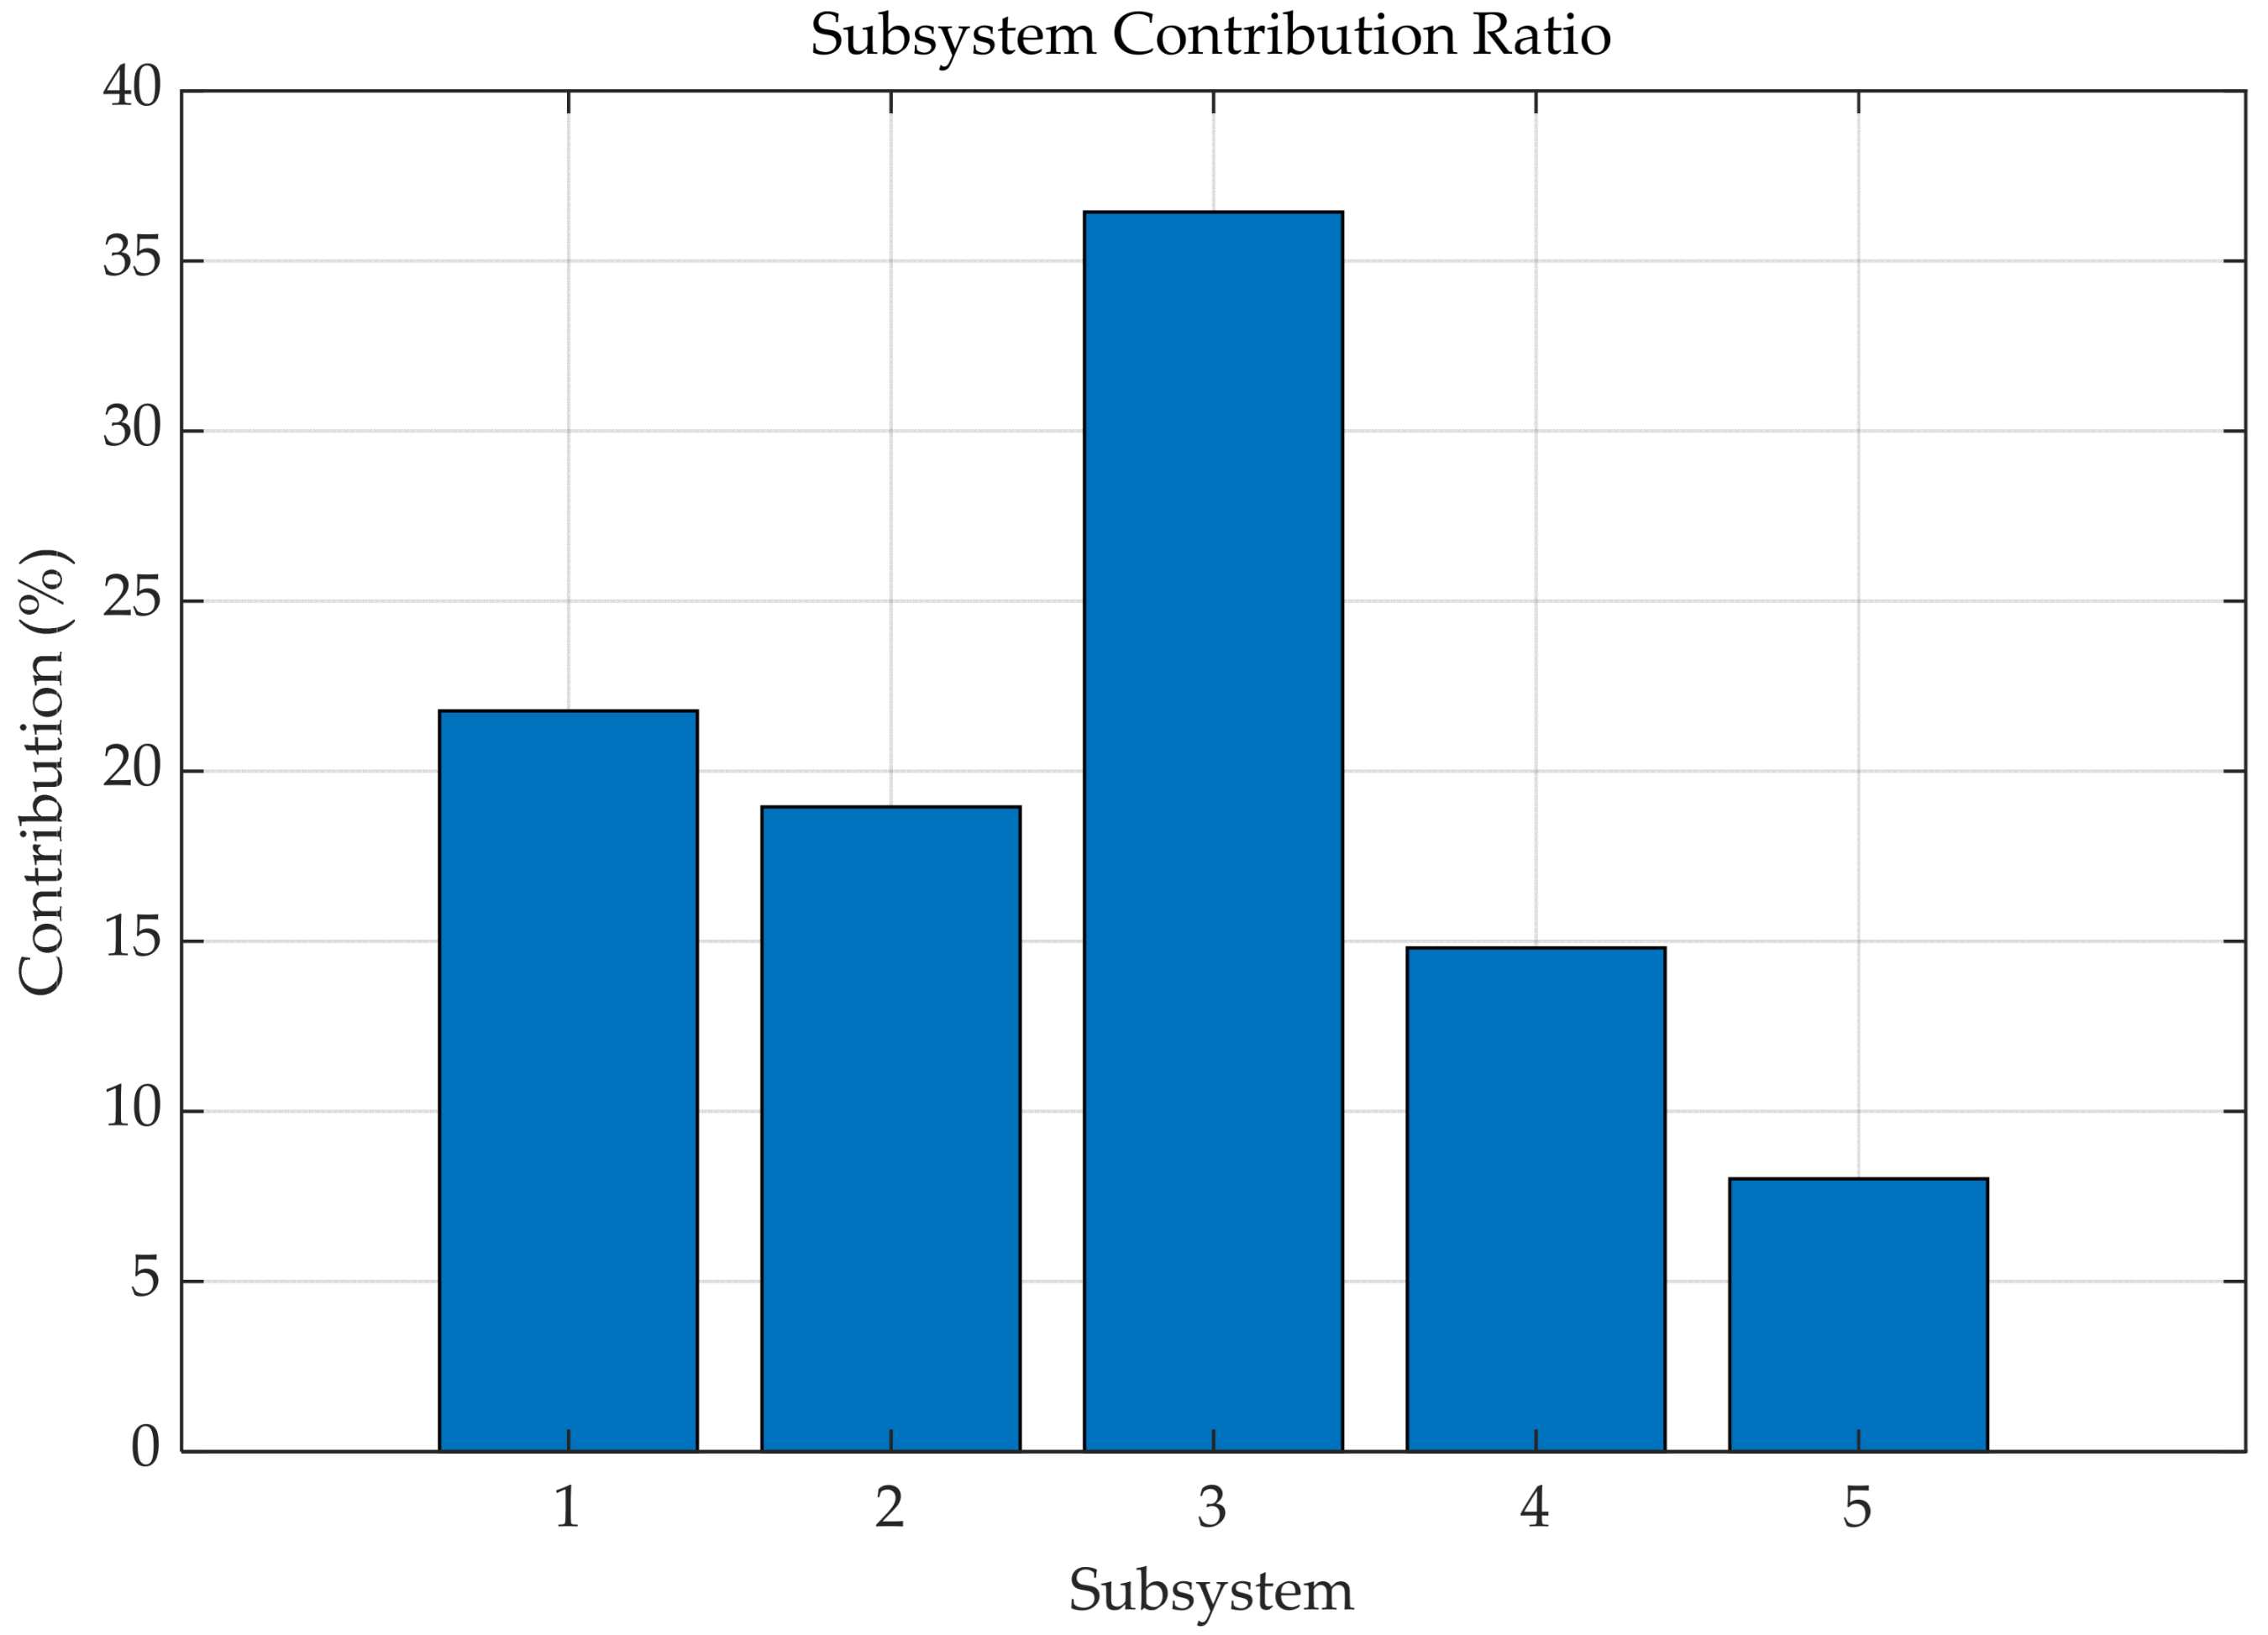
Figure 7 quantifies the contribution of each subsystem to the overall optimization. The results show that the optimization process has changed from centralized to distributed, which improves the collaborative efficiency and reduces the dependence on single node control, and the robustness and scalability of the system are significantly enhanced. This also provides a model basis for a data–model hybrid-driven algorithm.
This study constructs a data-driven model based on an LSTM network and uses the data of the internal distributed distribution network in the author’s workplace. By comparing the predicted and actual 24 h voltage values of key nodes in Figure 8, it can be seen that the predicted voltage curve is highly consistent with the measured value, the deviation is reduced, and the change is smoother, indicating that the hybrid drive framework has a higher voltage stability margin, better prediction accuracy, and real-time adaptive ability under dynamic conditions, providing clear and quantitative guidance for dynamic voltage stability control and power quality improvement of distribution systems.
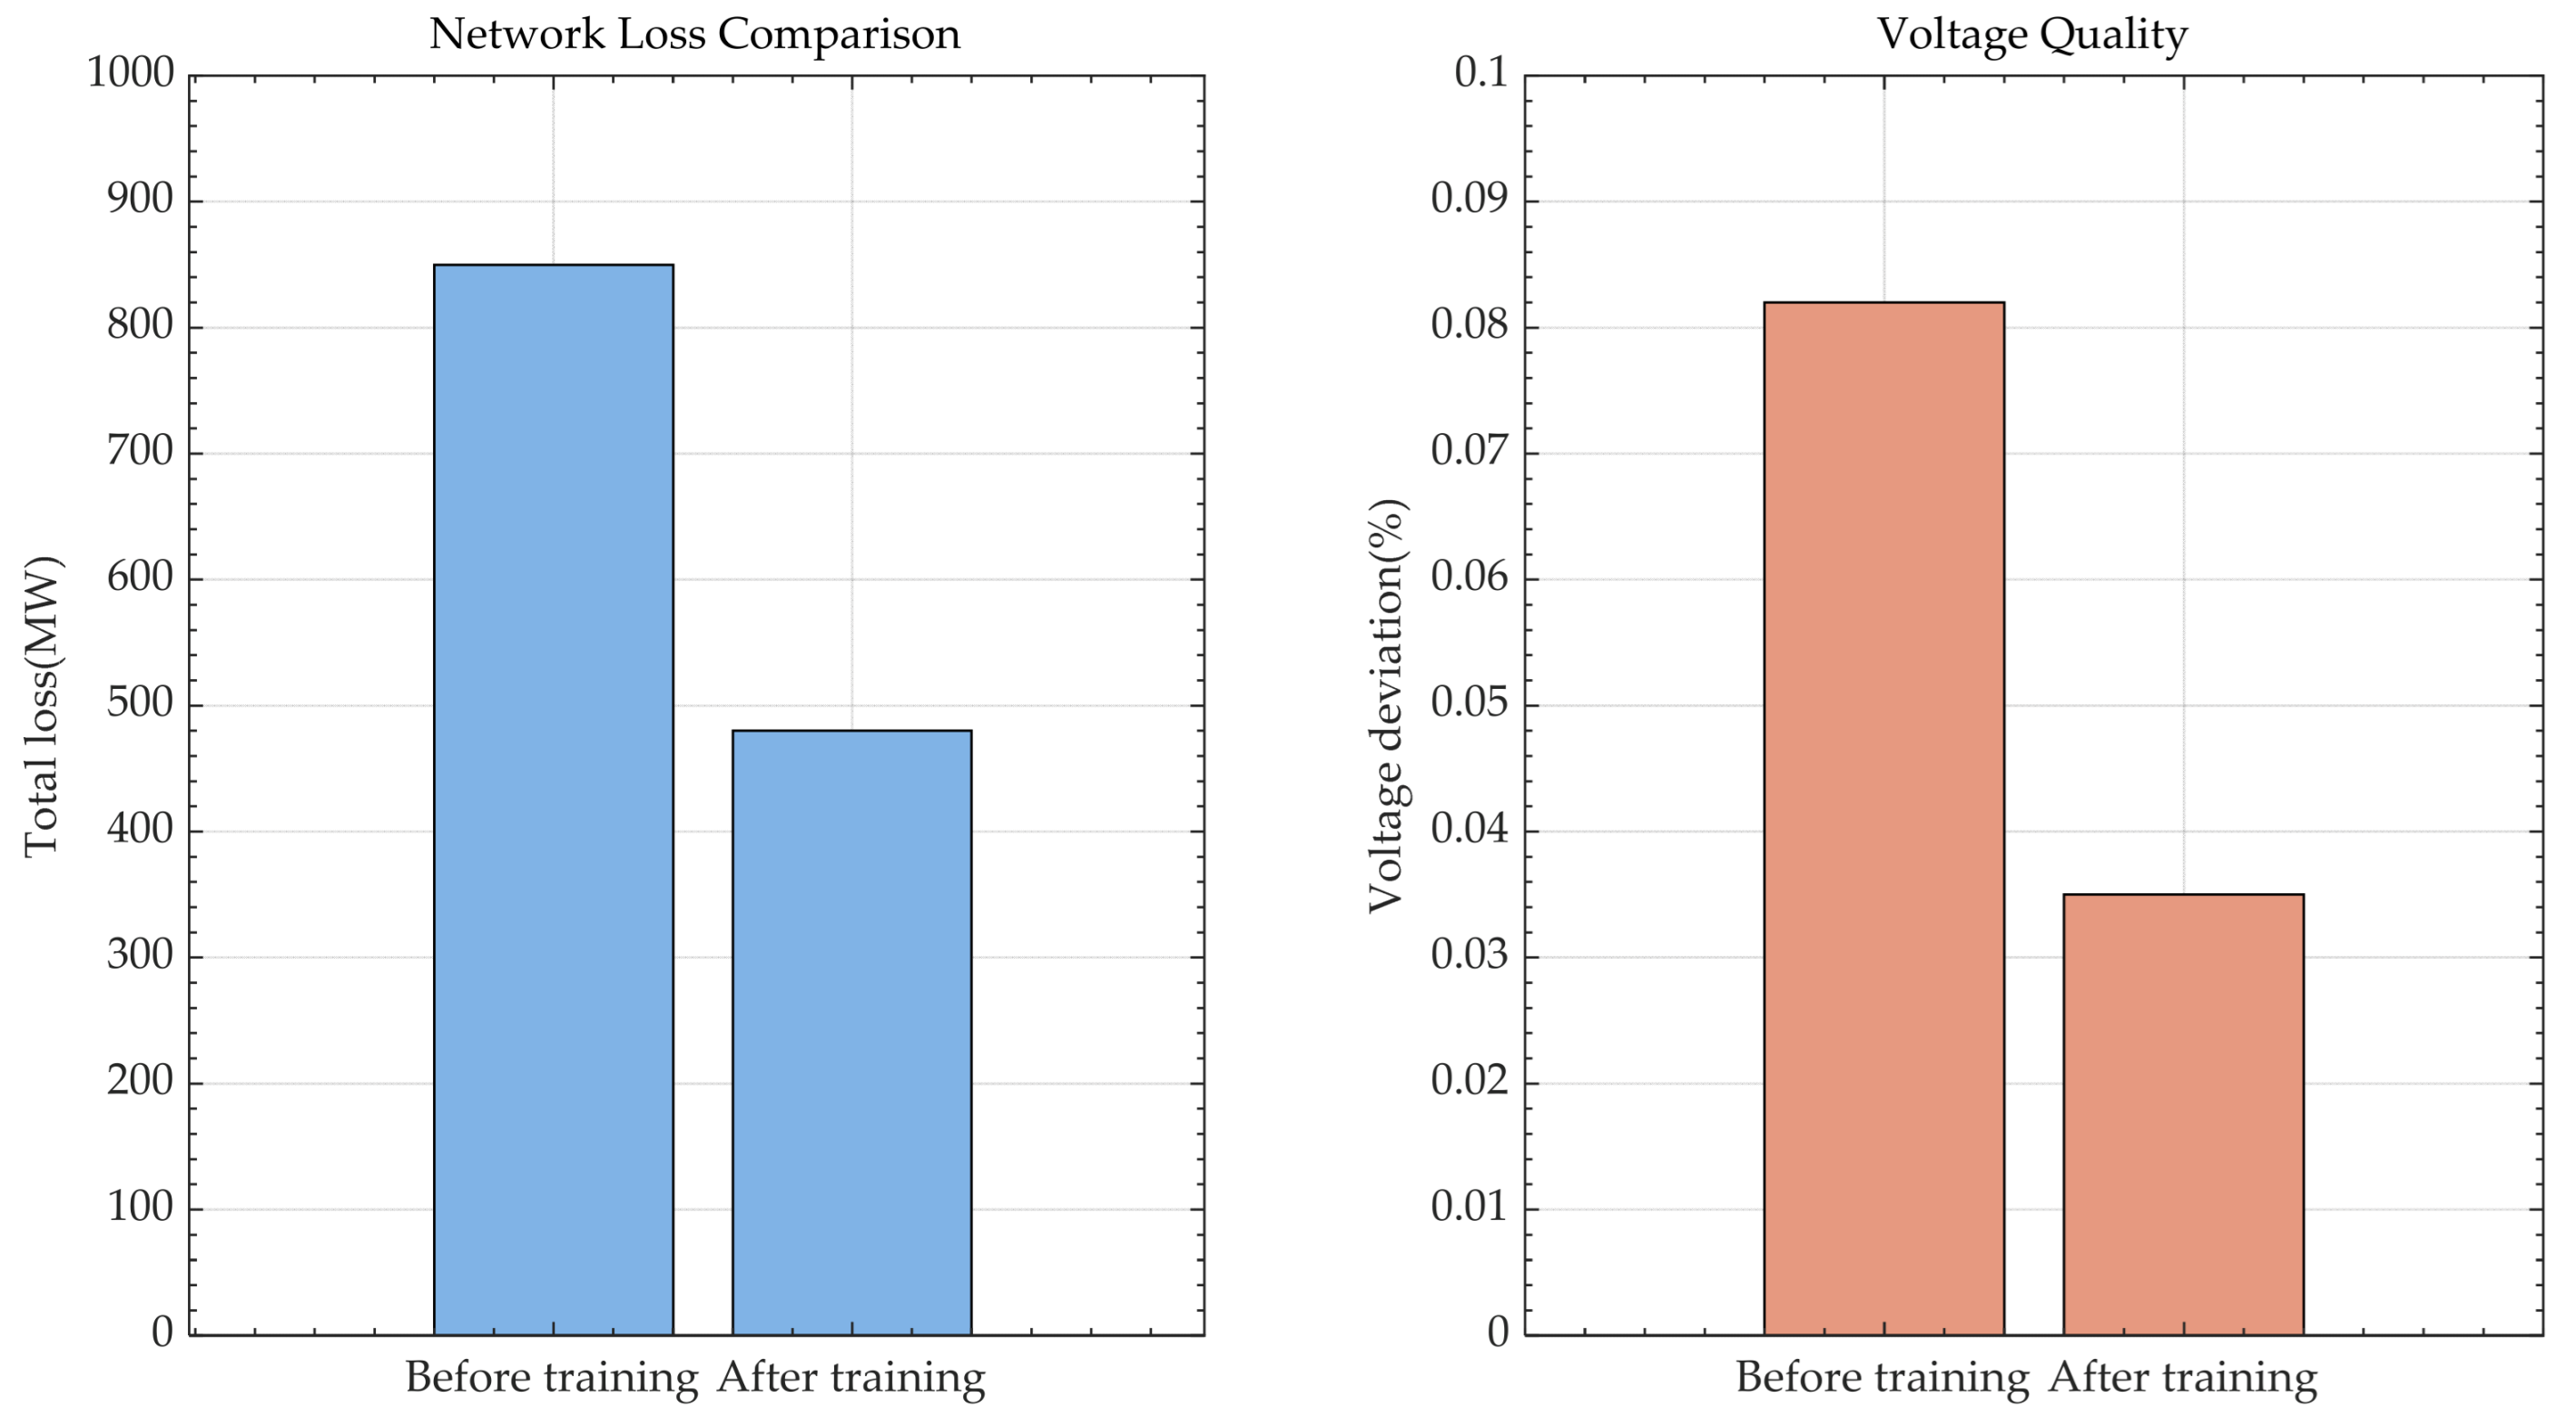
As shown in Figure 9, the network loss and voltage deviation after separate training of the LSTM module are reduced by about 50% and 55%, indicating that the optimized control strategy achieves higher energy efficiency and lower line loss, thus improving the economic operation level of the system.
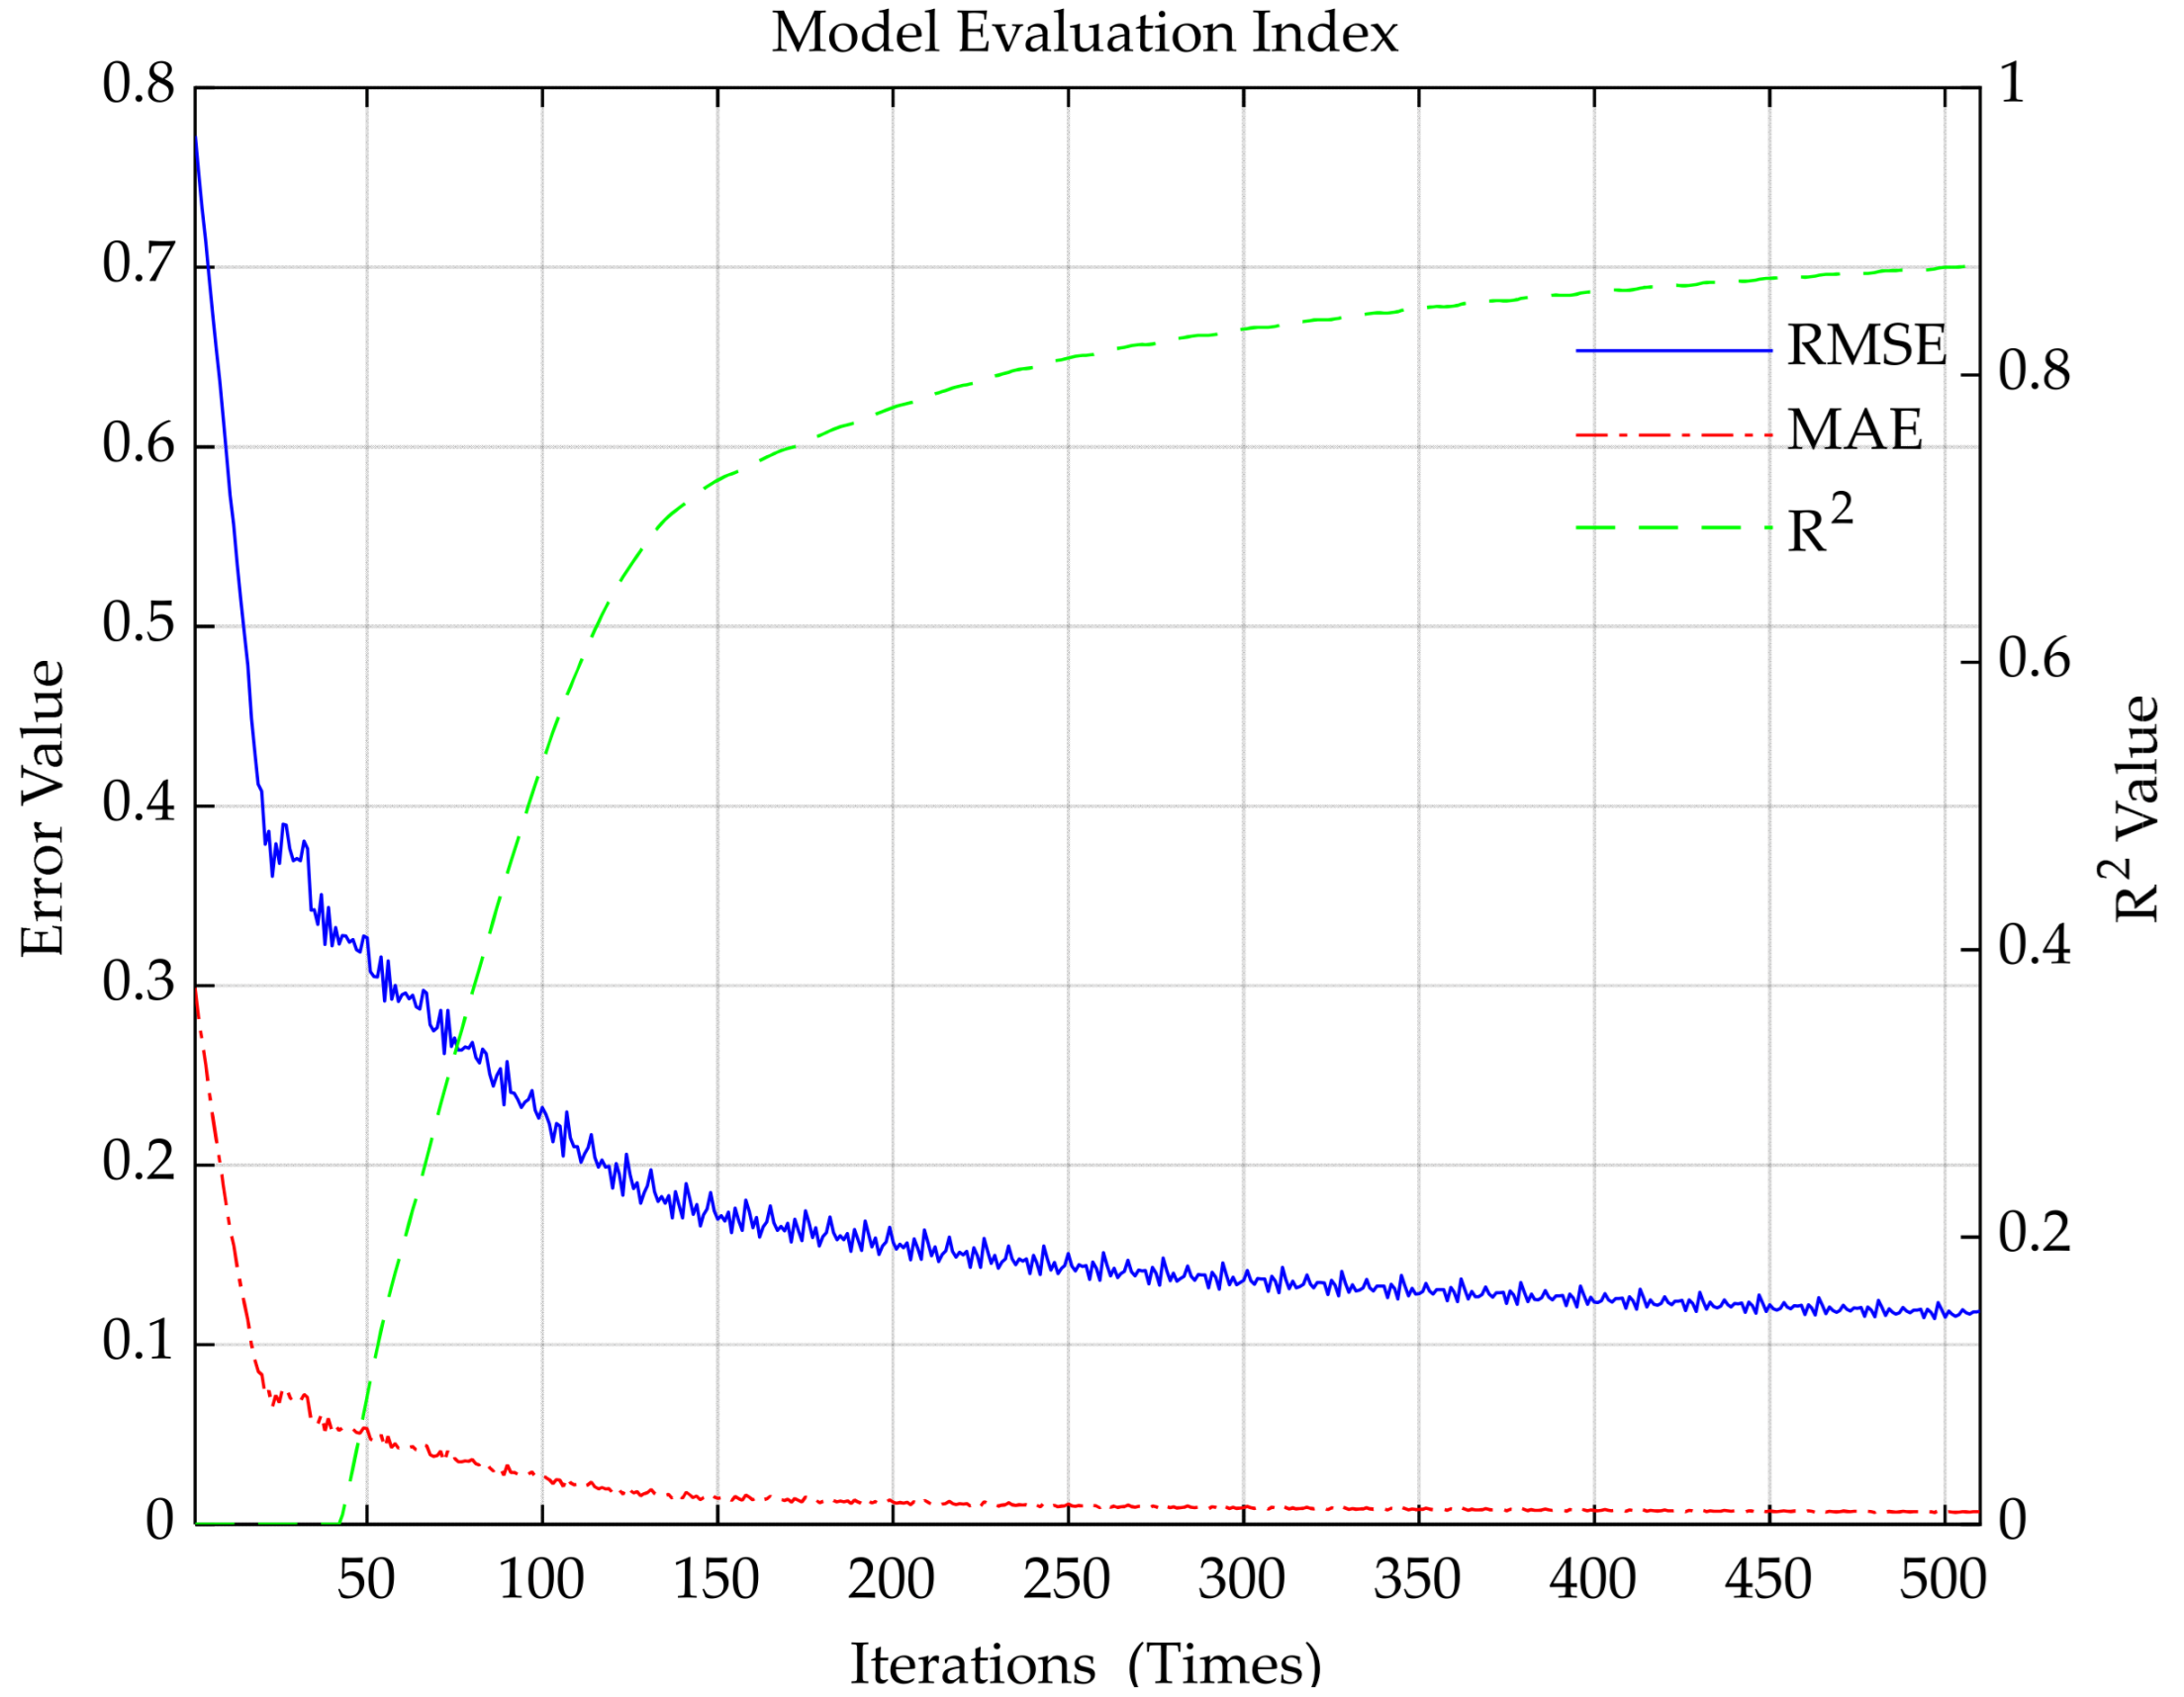
After training, the trend curves and values of statistical indicators RMSE, MAE, and R2 are shown in Figure 10 and Table 1. RMSE and MAE continue to decline, and R2 continues to rise. Under the 95% confidence interval setting, the mean and standard deviation of RMSE Ma R2 are (0.1188, 0.019), (0.0071, 0.0011), and (0.8756, 0.058), respectively. The results show that the model converges to the high-precision prediction state, which reflects the strong robust learning ability of the hybrid frameworkz and can maintain stable performance in the case of input uncertainty. It verifies that the method can predict and optimize the operation control of the distribution system and provides data support for the hybrid drive algorithm of the data model.
The data–model hybrid-driven framework of the distribution system combines the partition results of the spectral clustering method with a machine learning model based on the LSTM algorithm. As shown in Figure 11, the net load variance quickly stabilized after about the 40th iteration, indicating that the FEMCO algorithm has fast convergence and high computational efficiency, which can realize real-time optimization with low iteration overhead and support online control applications.
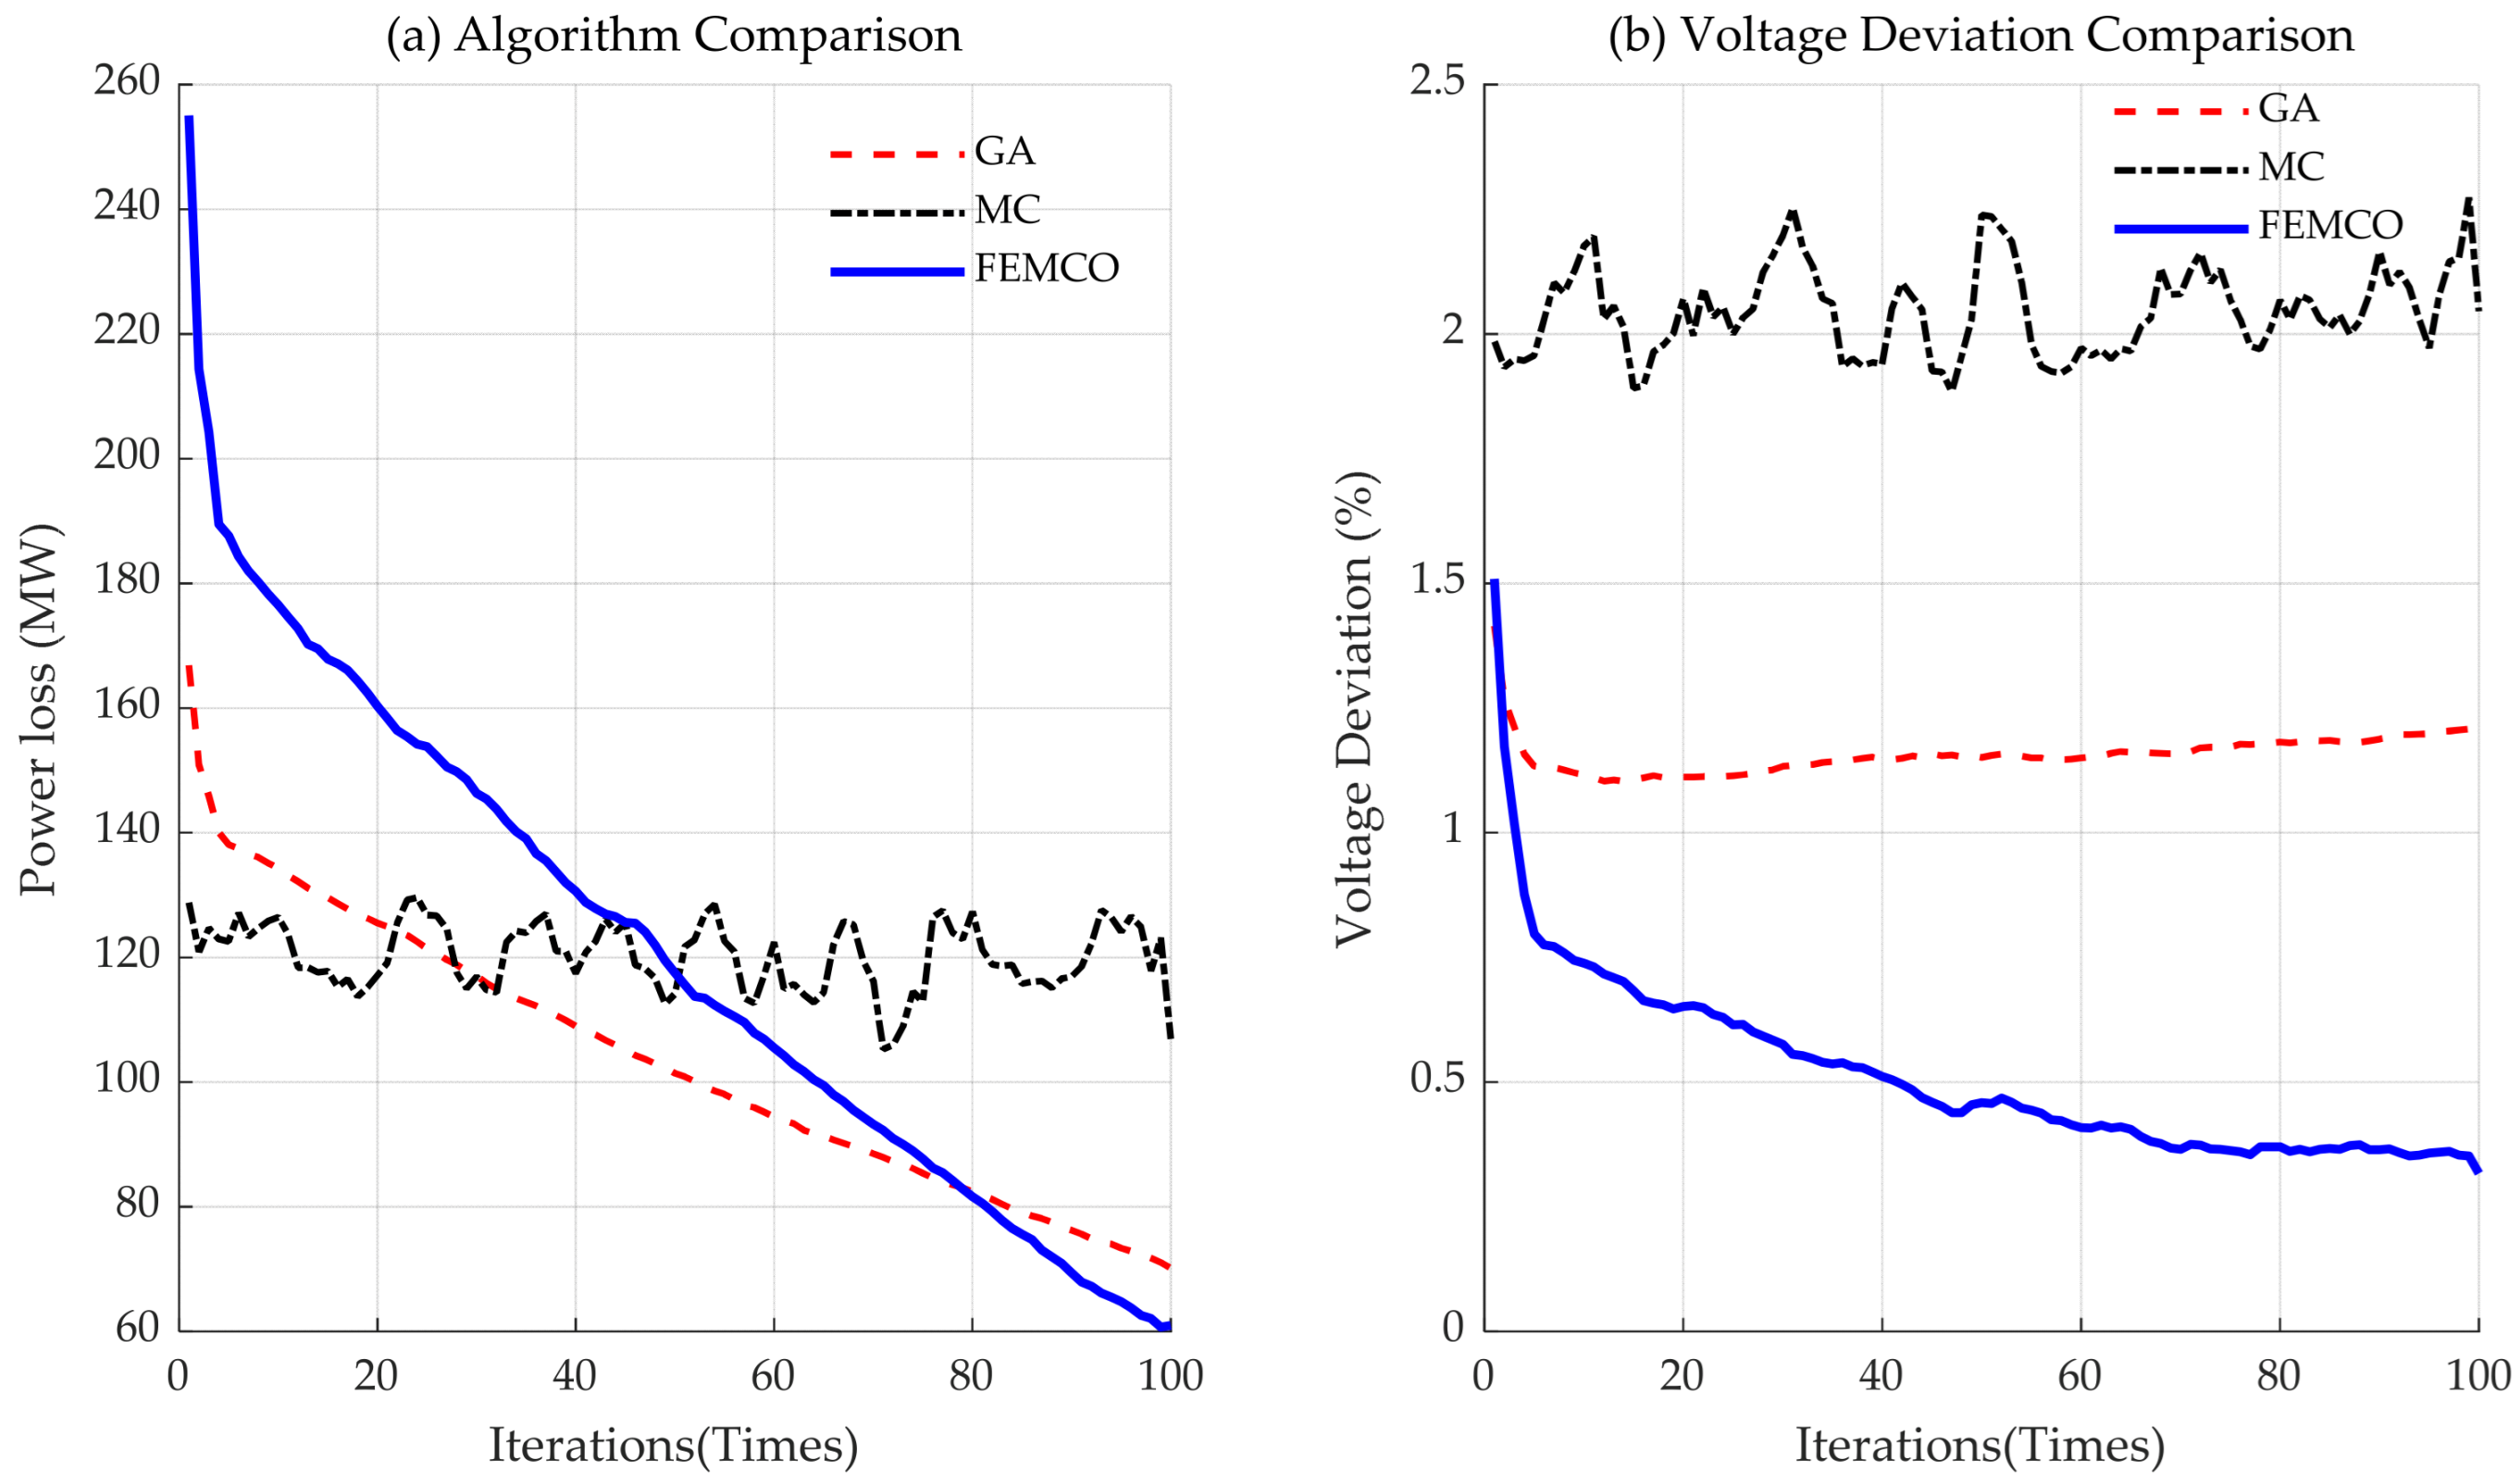
As shown in Figure 12 and Figure 13, after overall hybrid optimization, the FEMCO algorithm achieves the best performance in terms of power loss and voltage deviation compared with the traditional genetic algorithm and Monte Carlo simulation. After 100 iterations, the power consumption of the FEMCO algorithm is about 58.36 mw, while the power consumption of the traditional genetic algorithm and Monte Carlo simulation is about 78.51 MW and 131.90 MW, respectively. Compared with the genetic algorithm, the final power consumption is further reduced by about 25%, and compared with Monte Carlo simulation, the final power consumption is further reduced by about 45%. The voltage deviation of the FEMCO algorithm is about 0.35%, while that of the traditional genetic algorithm and Monte Carlo simulation is about 1.38% and 2.21%, respectively. Compared with the genetic algorithm, the final voltage deviation is further reduced by about 75%, and compared with Monte Carlo simulation, the final voltage deviation is further reduced by about 85%. It shows that it has a stronger global search ability and optimization effect, which improves the operation reliability and voltage quality of the system, and verifies its advantages in maintaining voltage stability and reducing equipment operation stress, showing its potential to realize long-term distributed voltage regulation in an active distribution system. Parallel computing acceleration is used in distributed optimization to reduce the computational complexity and improve the accuracy of local calculation.

6. Conclusions

This article focuses on the application of data–model hybrid-driven architecture in distribution network optimization and control and proposes an integrated optimization algorithm that integrates Federated learning, Monte Carlo simulation, and a Genetic Algorithm. It systematically promotes research on the intelligent operation of distribution networks from three levels: model construction, algorithm design, and empirical verification. Through theoretical analysis and simulation experiments, the following conclusions are drawn:
1.
The proposed model-driven module based on the spectral clustering decomposition method can effectively divide the distribution network into multiple independent subsystems and improve it through a distributed gradient descent algorithm. The experiment in the IEEE 33 bus distribution system shows that this method reduces the fluctuation of active/reactive power in the transmission branch.
2.
The data-driven module based on a Long Short-Term Memory (LSTM) network has been constructed, which relies on a gate control mechanism and temporal modeling capability to predict relevant parameters of the distribution network. The case results show that after training, the model can reduce network loss by about 50% and voltage deviation by about 55%. RMSE can be reduced to 0.11, MAE can be reduced to 0.007, and R2 is 0.88, providing effective data support for the reconstruction strategy.
3.
By using the Random Forest algorithm to integrate model-driven and data-driven modules, combined with the FEMCO algorithm for optimization, the case shows that the algorithm exhibits excellent convergence stability on the IEEE 33 bus distribution system. Compared with the traditional Genetic Algorithm (GA) and Monte Carlo method (MC), FEMCO reduces power loss by about 25% and 45% and voltage deviation by 75% and 85%, respectively.
This study provides new insights and methods for the efficient operation and optimization of distribution systems and valuable references for the collaborative control and dynamic optimization of distribution networks in practical applications. At present, research on this method mainly focuses on simulated data and cannot fully adapt to real scenarios. Future research can further improve the computational accuracy and efficiency of the model by introducing more actual scenario data and external environmental factors to optimize the initial solution set of the algorithm.

Author Contributions

D.J.: Investigation, Funding acquisition, Methodology, Project administration, Resources, Writing—review & Editing; X.Y.: Investigation, Funding acquisition, Methodology, Project administration, Resources, Writing—review & Editing; W.S.: Investigation, Funding acquisition, Methodology, Project administration, Resources, Writing—review & Editing; K.L.: Investigation, Funding acquisition, Methodology, Project administration, Resources, Writing—review & Editing; T.J.: Conceptualization, Data curation, Formal analysis, Software, Validation, Visualization, Writing—original Draft; X.L.: Supervision, Validation, Writing—review & editing; W.D.: Conceptualization, Funding acquisition, Methodology, Project administration, Resources, Supervision, Writing—review & editing. All authors have read and agreed to the published version of the manuscript.

Funding

This research was funded by the Science and Technology Project of State Grid Corporation of China “Research on the key technology of modeling and simulation analysis of peer-to-peer distribution system”, grant number No. 5400-202355767A-3-5-YS.

Data Availability Statement

The original contributions presented in this study are included in the article. Further inquiries can be directed to the corresponding author.

Conflicts of Interest

Authors Dongli Jia, Xiaoyu Yang, Wanxing Sheng and Keyan Liu were employed by the China Electric Power Research Institute Co., Ltd. The authors declare that this study received funding from the Science and Technology Project of State Grid Corporation of China. The authors declare that the research was conducted in the absence of any commercial or financial relationships that could be construed as a potential conflict of interest.

References

  1. Zhang, X.; Flueck., J.A.; Nguyen., P.C. Agent-Based Distributed Volt/Var Control With Distributed Power Flow Solver in Smart Grid. IEEE Trans. Smart Grid 2016, 7, 600–607. [Google Scholar] [CrossRef]
  2. Borghetti, A.; Bottura, R.; Barbiroli, M.; Nucci, C.A. Synchrophasors-Based Distributed Secondary Voltage/VAR Control via Cellular Network. IEEE Trans. Smart Grid 2017, 8, 262–274. [Google Scholar] [CrossRef]
  3. Ding, F.; Loparo, K.A. Hierarchical Decentralized Network Reconfiguration for Smart Distribution Systems-Part I: Problem Formulation and Algorithm Development. IEEE Trans. Power Syst. Publ. Power Eng. Soc. 2015, 30, 734–743. [Google Scholar] [CrossRef]
  4. Bahramipanah, M.; Cherkaoui, R.; Paolone, M. Decentralized voltage control of clustered active distribution network by means of energy storage systems. Electr. Power Syst. Res. 2016, 36, 370–382. [Google Scholar] [CrossRef]
  5. Jabr, R.A.; Singh, R.; Pal, B.C. Minimum Loss Network Reconfiguration Using Mixed-Integer Convex Programming. IEEE Trans. Power Syst. Publ. Power Eng. Soc. 2012, 27, 1106–1115. [Google Scholar] [CrossRef]
  6. Lee, C.; Liu, C.; Mehrotra, S.; Bie, Z. Robust Distribution Network Reconfiguration. IEEE Trans. Smart Grid 2015, 6, 836–842. [Google Scholar] [CrossRef]
  7. Dorostkar-Ghamsari, M.R.; Fotuhi-Firuzabad, M.; Lehtonen, M.; Safdarian, A. Value of Distribution Network Reconfiguration in Presence of Renewable Energy Resources. IEEE Trans. Power Syst. Publ. Power Eng. Soc. 2016, 31, 1879–1888. [Google Scholar] [CrossRef]
  8. Abdelaziz, M. Distribution network reconfiguration using a genetic algorithm with varying population size. Electr. Power Syst. Res. 2017, 142, 9–11. [Google Scholar] [CrossRef]
  9. Asrari, A.; Lotfifard, S.; Ansari, M. Reconfiguration of Smart Distribution Systems with Time Varying Loads Using Parallel Computing. IEEE Trans. Smart Grid 2016, 7, 2713–2723. [Google Scholar] [CrossRef]
  10. Zhou, Y.; Arghandeh, R.; Spanos, C.J. Partial Knowledge Data-Driven Event Detection for Power Distribution Networks. IEEE Trans. Smart Grid 2018, 9, 5152–5162. [Google Scholar] [CrossRef]
  11. Mishra, D.P.; Samantaray, S.R.; Joos, G. A Combined Wavelet and Data-Mining Based Intelligent Protection Scheme for Microgrid. IEEE Trans. Smart Grid 2016, 7, 2295–2304. [Google Scholar] [CrossRef]
  12. Wu, W.; Zhang, B.; Sun, H.; Wang, B.; Yang, Y.; Liu, H.; Lin, C.; Wang, S. Energy Management and Distributed Resource Cluster Control in Active Distribution Networks. Autom. Electr. Power Syst. 2020, 44, 111–118. [Google Scholar] [CrossRef]
  13. Li, P.; Zhang, C.; Wu, Z.; Xu, Y.; Hu, M.; Dong, Z. Distributed Adaptive Robust Voltage/VAR Control with Network Partition in Active Distribution Networks. IEEE Trans. Smart Grid 2020, 11, 2245–2256. [Google Scholar] [CrossRef]
  14. Jiang, T.; Zhang, D.; Li, X.; Zhang, R.; Li, G. Distributed Optimization Control of Voltage in Active Distribution Networks with Distributed Photovoltaics. Electr. Power Autom. Equip. 2021, 41, 102–109. [Google Scholar] [CrossRef]
  15. Kou, L.; Wu, M.; Li, Y.; Qu, X.; Xie, H.; Gao, B.; Chen, F.; Hu, C. Distributed optimization and control method for active and reactive power in active distribution networks. Chin. J. Electr. Eng. 2020, 40, 1856–1865. [Google Scholar] [CrossRef]
  16. Li, X.; Huang, Y.; Yin, X. A Genetic Algorithm for Distribution Network Reconfiguration Based on an Improved Strategy. Chin. J. Electr. Eng. 2004, 02, 50–55. [Google Scholar] [CrossRef]
  17. Li, M.; Wang, L.; Liu, X.; Yang, D.; Li, P. Multi-objective proactive reconfiguration of distribution networks based on a well-matched genetic algorithm. Electr. Power Syst. Prot. Control. 2019, 47, 30–38. [Google Scholar]
  18. Wang, C.; Gao, Y. Determination of Power Distribution Network Configuration Using Non-Revisiting Genetic Algorithm. IEEE Trans. Power Syst. Publ. Power Eng. Soc. 2013, 28, 3638–3648. [Google Scholar] [CrossRef]
  19. Ma, C.; Li, C.; Zhang, X.; Li, G.; Han, Y. Reconfiguration of Distribution Networks with Distributed Generation Using a Dual Hybrid Particle Swarm Optimization Algorithm. Math. Probl. Eng. 2017, 2017, 1517435. [Google Scholar] [CrossRef]
  20. Yuan, Y.; Zhong, J.; Li, Q.; Qin, M.; Tian, J.; Tian, B.; Long, Y. Application of a Hybrid Particle Swarm Optimization Algorithm in the Reconfiguration of Distribution Networks with Distributed Generation. Electr. Autom. 2019, 41, 55–57. [Google Scholar]
  21. Ding, T.; Yang, Q.; Yang, Y.; Li, C.; Bie, Z.; Blaabjerg, F. A Data-Driven Stochastic Reactive Power Optimization Considering Uncertainties in Active Distribution Networks and Decomposition Method. IEEE Trans. Smart Grid 2018, 9, 4994–5004. [Google Scholar] [CrossRef]
  22. Wang, D.; Sun, Z. Power Consumer-Side Big Data Analysis and Parallel Load Forecasting. Chin. J. Electr. Eng. 2015, 35, 527–537. [Google Scholar] [CrossRef]
  23. Yang, G.; Qian, A. Demand-side Response Strategy of Multi-microgrids Based on an Improved Co-evolution Algorithm. CSEE J. Power Energy Syst. 2021, 7, 903–910. [Google Scholar] [CrossRef]
  24. Kamel, M.; Dai, R.; Wang, Y.; Li, F.; Liu, G. Data-driven and Model-based Hybrid Reinforcement Learning to Reduce Stress on Power Systems Branches. CSEE J. Power Energy Syst. 2021, 7, 433–442. [Google Scholar] [CrossRef]
  25. Yu, Y.; Li, M.; Ji, T.; Wu, Q.H. Fault Location in Distribution System Using Convolutional Neural Network Based on Domain Transformation. CSEE J. Power Energy Syst. 2021, 7, 472–484. [Google Scholar] [CrossRef]
  26. Wei, L.; Liu, G.; Yan, S.; Dai, R.; Tang, Y. Graph Computing Based Security Constrained Unit Commitment in Hydro-thermal Power Systems Incorporating Pumped Hydro Storage. CSEE J. Power Energy Syst. 2021, 7, 485–496. [Google Scholar] [CrossRef]
  27. Finegan, D.P.; Zhu, J.; Feng, X.; Keyser, M.; Ulmefors, M.; Li, W.; Bazant, M.Z.; Cooper, S.J. The Application of Data-Driven Methods and Physics-Based Learning for Improving Battery Safety. Joule 2020, 5, 316–329. [Google Scholar] [CrossRef]
  28. Matignon, M.; Mcharek, M.; Azib, T.; Chaibet, A. Enhancing Fuel Cell Hybrid Electric Vehicle Energy Management with Real-Time LSTM Speed Prediction. Energies 2025, 18, 4340. [Google Scholar] [CrossRef]
  29. Miceli, A.V.; Cardona, F.; Lo Brano, V.; Micari, F. Assessing the Technical and Economic Viability of Onshore and Offshore Wind Energy in Pakistan Through a Data-Driven Machine Learning and Deep Learning Approach. Energies 2025, 18, 5080. [Google Scholar] [CrossRef]
  30. Sankhwar, P. Evaluation of transition to 100% electric vehicles (EVs) by 2052 in the United States. Sustain. Energy Res. 2024, 11, 35. [Google Scholar] [CrossRef]
Figure 1. Structure of the LSTM layer in the model.
Energies 18 05595 g001
Figure 2. Process flow diagram of the random forest ensemble module.
Energies 18 05595 g002
Figure 3. Algorithm flowchart of the federated evolutionary Monte Carlo optimization algorithm.
Energies 18 05595 g003
Figure 4. Silhouette coefficient and eigenvalue distribution.
Energies 18 05595 g004
Figure 5. Decomposition result model of the IEEE 33 bus distribution system (different colors represent different partitions).
Energies 18 05595 g005
Figure 6. Comparison of active/reactive power in the branch.
Energies 18 05595 g006
Figure 7. Contribution distribution of each subsystem to overall optimization.
Energies 18 05595 g007
Figure 8. Comparison of voltage at key nodes over 24 h.
Energies 18 05595 g008
Figure 9. Bar chart of network loss before and after optimization.
Energies 18 05595 g009
Figure 10. Trend Curve of Evaluation Indicators.
Energies 18 05595 g010
Figure 11. Convergence characteristics of the FEMCO algorithm.
Energies 18 05595 g011
Figure 12. Comparison of results from different algorithms.
Energies 18 05595 g012
Figure 13. Final voltage deviations and power losses of different algorithms.
Energies 18 05595 g013
Table 1. Training Parameters.
IterationsRMSEMAER2
10.77310.29880
500.32670.05340.0885
1000.23210.02690.5299
1500.16980.01440.7269
2000.15700.01230.7774
2500.15070.01140.8119
3000.13580.01000.8319
3500.12580.00830.8464
4000.12380.00770.8580
4500.12240.00750.8674
5000.11540.00670.8750
5100.11880.00710.8756
Disclaimer/Publisher’s Note: The statements, opinions and data contained in all publications are solely those of the individual author(s) and contributor(s) and not of MDPI and/or the editor(s). MDPI and/or the editor(s) disclaim responsibility for any injury to people or property resulting from any ideas, methods, instructions or products referred to in the content.