Article

AI-Powered Digital Twin Co-Simulation Framework for Climate-Adaptive Renewable Energy Grids

Department of Electrical Power Engineering, Durban University of Technology, Durban 4001, South Africa
*
Author to whom correspondence should be addressed.
Energies 2025, 18(21), 5593; https://doi.org/10.3390/en18215593 (registering DOI)
Submission received: 8 August 2025 / Revised: 10 September 2025 / Accepted: 12 September 2025 / Published: 24 October 2025

Abstract

Climate change is accelerating the frequency and intensity of extreme weather events, posing a critical threat to the stability, efficiency, and resilience of modern renewable energy grids. In this study, we propose a modular, AI-integrated digital twin co-simulation framework that enables climate adaptive control of distributed energy resources (DERs) and storage assets in distribution networks. The framework leverages deep reinforcement learning (DDPG) agents trained within a high-fidelity co-simulation environment that couples physical grid dynamics, weather disturbances, and cyber-physical control loops using HELICS middleware. Through real-time coordination of photovoltaic systems, wind turbines, battery storage, and demand side flexibility, the trained agent autonomously learns to minimize power losses, voltage violations, and load shedding under stochastic climate perturbations. Simulation results on the IEEE 33-bus radial test system augmented with ERA5 climate reanalysis data demonstrate improvements in voltage regulation, energy efficiency, and resilience metrics. The framework also exhibits strong generalization across unseen weather scenarios and outperforms baseline rule based controls by reducing energy loss by 14.6% and improving recovery time by 19.5%. These findings position AI-integrated digital twins as a promising paradigm for future-proof, climate-resilient smart grids.

1. Introduction

The accelerating impacts of climate change are exposing critical vulnerabilities in global energy infrastructure, particularly in renewable energy systems that are inherently dependent on environmental variables. Events such as heatwaves, droughts, hurricanes, and unpredictable wind patterns pose substantial threats to grid stability and asset reliability [1,2]. While decarbonization efforts have led to widespread adoption of distributed renewable energy sources (RESs), including solar photovoltaics and wind turbines, their intermittency introduces significant planning and operational complexity under extreme weather conditions [3,4].
Digital twin (DT) technologies have emerged as a transformative paradigm in power systems, enabling real-time synchronization between physical assets and their virtual replicas [5,6]. DTs facilitate system diagnostics, predictive maintenance, and operational optimization by leveraging sensor streams, simulation environments, and intelligent analytics. However, the majority of existing DT applications are narrow in scope, focusing on isolated equipment level monitoring or static control loops. These approaches often neglect the broader system level resilience required to withstand climate-induced disruptions.
Moreover, current energy planning methodologies are largely deterministic or scenario-based, failing to incorporate real-time climate variability and probabilistic forecasting. This limitation reduces their applicability for future-proof grid planning. A significant research gap exists in the integration of DTs with dynamic climate models and AI-driven optimization to proactively adapt to changing climate conditions.
To address this, we propose an AI-powered Digital Twin Co-Simulation Framework that integrates climate prediction models, renewable generation profiles, and artificial intelligence algorithms for real-time adaptive control and planning. The framework leverages a modular co-simulation architecture that synchronizes climate data inputs (e.g., temperature, wind speed, precipitation) with power system simulation engines and AI-based decision layers. This enables multi-domain, real-time interaction between climate stressors, system physics, and intelligent controls.
The novelty of this work lies in the coupling of digital twins with AI and climate models through co-simulation, allowing for predictive and prescriptive planning in climate-impacted renewable grids. This architecture not only anticipates extreme events but also learns from past disturbances to improve resilience and system performance over time. By addressing a pressing policy and technical challenge, the proposed approach holds promise for utilities, regulators, and governments seeking to modernize energy infrastructure in alignment with climate adaptation goals [7,8].
The contributions of this paper are summarized as follows:
  • A modular AI-integrated digital twin framework is developed that couples HELICS middleware with OpenDSS (v9.2.0), ERA5 (ECMWF, 2018–2023) climate data, and a reinforcement learning controller for climate-adaptive operation.
  • The framework explicitly formulates resilience-oriented objectives within a Markov Decision Process (MDP) structure, ensuring reproducibility and extensibility.
  • A co-simulation case study on the IEEE 33-bus distribution network demonstrates the efficacy of the approach under extreme weather events.
The remainder of this paper is organized as follows. Section 2 reviews the state of the art in digital twins, AI integration, and climate-energy co-modeling. Section 3 presents the system model and architecture. Section 4 formulates the optimization problem. Section 5 describes the proposed AI and co-simulation methodology. Section 7 presents simulation results and analysis. Finally, Section 8 concludes with key insights and future directions.

2. Related Work

The intersection of digital twin technology, artificial intelligence, and climate-resilient energy systems is emerging as a critical research frontier. This section reviews the state of the art across four key domains: digital twins in energy systems, climate-integrated energy modeling, AI-driven grid adaptation, and co-simulation frameworks.

2.1. Digital Twins in Renewable Energy Systems

Digital twins (DTs) have been widely adopted in manufacturing and aerospace industries, but their integration into power systems is relatively nascent. In the energy domain, DTs have primarily been deployed for asset monitoring, predictive maintenance, and fault diagnostics [9,10]. For instance, Mahankali [11] present a systems engineering approach for developing cyber–physical digital twins, highlighting their potential in real-time decision support.
Recent studies have extended DT applications to distributed energy resources (DERs). Han et al. [12] propose a DT-based control system for smart inverters, enabling localized voltage regulation. However, these implementations often lack system-wide integration and fail to incorporate external stressors such as climate dynamics. Moreover, most digital twin frameworks remain deterministic, offering limited capacity for proactive adaptation in the face of stochastic environmental change.

2.2. Climate-Integrated Energy Modeling

Climate change introduces significant uncertainty into renewable generation patterns, particularly for solar and wind assets. Modeling efforts have historically relied on representative year or worst case scenario planning [13,14]. These methods do not capture the full range of variability across multi-decadal climate projections.
Chreng et al. [15] emphasize the vulnerability of thermal and renewable generation to temperature and hydrological stress. In response, some researchers have proposed coupling climate projections (e.g., CMIP6, ERA5) with load forecasting tools [16]. However, these approaches often operate offline, lacking integration with real-time decision-making systems or intelligent control mechanisms.

2.3. AI for Adaptive Grid Control

Artificial intelligence (AI) has shown promise in enhancing grid flexibility, particularly under volatile conditions. Supervised learning models have been used for short-term load and generation forecasting [17,18], while reinforcement learning (RL) algorithms enable adaptive control of DERs, battery storage, and demand response [19,20].
Despite these advances, existing AI frameworks typically operate as stand-alone modules, not embedded within a system-level digital twin capable of simulating physical dynamics and environmental feedback. Abdoune et al. [20] argue that co-training AI agents within a physically informed simulation environment can significantly improve generalizability and resilience. Yet, such integrated designs remain rare in the literature.

2.4. Energy System Co-Simulation Platforms

Co-simulation enables the synchronized execution of multiple domain-specific simulators, such as power systems, weather engines, and economic models. Frameworks such as Hierarchical Engine for Large-scale Infrastructure Co-Simulation (HELICS) [21], Modular Open Smart Grid Simulation Framework (MOSAIK) [22], and Ptolemy II [23] support modular and scalable simulation architectures.
These platforms have been used for hardware-in-the-loop testing, cyber-physical security assessments, and control algorithm validation. However, few efforts have attempted to couple climate models, power grid simulators, and AI engines into a unified real-time co-simulation framework. Pham et al. [23] highlight the potential for such integration but note challenges in synchronization, model fidelity, and interface standardization.
Recent studies have highlighted AI-driven resilience frameworks for distribution grids, including digital twins for grid monitoring [24], reinforcement learning-based DER coordination [25], and co-simulation environments for cyber-physical testing [26]. Comparisons with optimization-based methods such as genetic algorithms and particle swarm optimization demonstrate that RL-based controllers offer faster adaptability but face challenges in computational cost [27,28]. A broader survey on climate-resilient grid operation emphasizes the need for integrating high-resolution weather data into control workflows [29]. Despite these advances, few studies explicitly address climate-adaptive reinforcement learning within modular digital twin environments, leaving a gap that this paper addresses.

2.5. Research Gaps

Existing works either focus narrowly on control under static grid conditions or treat climate variability as an exogenous disturbance without embedding it into the learning process. Conventional optimization approaches (e.g., GA, PSO, FPA) achieve good steady-state results but lack adaptability under fast-changing weather conditions. Recent RL studies provide adaptability but are rarely validated under extreme climate scenarios or within modular co-simulation platforms. Moreover, scalability to larger grids and the integration of multiple simulators (climate, power flow, AI) remain underexplored. This paper addresses these gaps by embedding climate-informed decision making into a digital twin framework with HELICS-based modularity, evaluated through an IEEE 33-bus case study.

3. System Model and Architecture

This section presents the mathematical foundations and architecture of the proposed AI-powered digital twin co-simulation framework for climate-adaptive renewable grids. The model consists of three primary components: (1) the physical system, including grid and renewable assets; (2) the climate forecast model; and (3) the digital twin and co-simulation environment coupled with an AI-based controller.

3.1. Physical Grid Model

The power distribution network is modeled as a connected graph G = ( N , E ) , where
  • N = { 1 , 2 , , N } is the set of buses (nodes),
  • E N × N is the set of distribution lines (edges).
Each node i N may host a load, a renewable energy source, and a voltage sensor. The steady-state power flow equations at bus i are given by
P i = j N | V i | | V j | G i j cos θ i j + B i j sin θ i j
Q i = j N | V i | | V j | G i j sin θ i j B i j cos θ i j
where P i and Q i denote the net active and reactive power injections at bus i (measured in MW and MVar, respectively); | V i | represents the voltage magnitude at bus i in per unit (p.u.); θ i j = θ i θ j is the phase angle difference between buses i and j (in radians); and G i j and B i j correspond to the conductance and susceptance of the transmission line connecting buses i and j, respectively.

3.2. Renewable Generation Modeling

Consider a solar photovoltaic (PV) generator installed at bus i. The power output at time t, denoted P i PV ( t ) , depends on solar irradiance and temperature as:
P i PV ( t ) = η i PV A i G t ( t ) 1 α ( T c ( t ) T ref )
where η i PV denotes the photovoltaic conversion efficiency at bus i; A i is the total surface area of the PV array (in m2); G t ( t ) represents the global horizontal irradiance at time t (in W/m2); T c ( t ) is the PV cell temperature at time t (in °C); T ref is the reference temperature (typically 25 °C); and α is the temperature coefficient (in ° C 1 ), quantifying the fractional power loss due to elevated cell temperatures.

3.3. Climate Dynamics Model

Climate variables are modeled as a multivariate stochastic process. Let x c ( t ) R d denote the vector of climate indicators at time t, where d may include:
  • Ambient temperature T ( t ) ,
  • Wind speed v ( t ) ,
  • Precipitation p ( t ) ,
  • Solar irradiance G t ( t ) .
The evolution of climate variables is given by:
x c ( t + 1 ) = f c x c ( t ) + ξ t
where f c ( · ) denotes a nonlinear state transition function, potentially modeled using Gaussian processes or recurrent neural networks (RNNs); ξ t N ( 0 , Σ ) represents a zero-mean multivariate Gaussian noise vector that captures stochastic variability in system evolution; and Σ is the covariance matrix characterizing the magnitude and correlation structure of climate-induced disturbances.

3.4. Digital Twin Co-Simulation Framework

The digital twin (DT) serves as a synchronized software replica of the physical system, integrating the following subsystems:
  • Power system simulator (e.g., OpenDSS),
  • Climate forecast module (e.g., ERA5),
  • AI-based controller.
These simulators are synchronized through a time-coordinated middleware (e.g., HELICS or FMI) that ensures consistent state exchange at intervals Δ t . The co-simulation operates in discrete timesteps to maintain causality and real-time realism.

3.5. AI-Based Control and Optimization Model

The artificial intelligence (AI) agent is embedded within a decision-making loop designed to maximize long-term system resilience and operational reliability. The control process is formalized as a Markov Decision Process (MDP),
M = S , A , P , R , γ ,
where S denotes the state space, comprising voltage profiles, distributed energy resource (DER) outputs, and climate indicators; A is the action space, including inverter set-points and demand response signals; P : S × A S defines the state transition function (probability kernel); R : S × A R specifies the scalar reward function guiding policy optimization; and γ [ 0 , 1 ] is the discount factor, which balances short-term against long-term objectives [30].
In subsequent formulations, C loss ( t ) represents active power losses, V violation ( t ) denotes aggregated nodal voltage violations, and R recovery ( t ) quantifies resilience benefits. This mathematical structure follows standard reinforcement learning (RL) formulations adopted in power system control [31].
The reward function is formulated to penalize operational inefficiencies while incentivizing resilient performance:
R ( s t , a t ) = λ 1 C loss ( t ) λ 2 V violation ( t ) + λ 3 R recovery ( t ) ,
where
  • C loss ( t ) : active power losses or curtailments at time t,
  • V violation ( t ) : aggregated voltage deviations across all nodes,
  • R recovery ( t ) : resilience reward capturing the quality of post-disturbance recovery,
  • λ 1 , λ 2 , λ 3 0 : weighting factors used to balance the competing objectives.
The reward weights were tuned through a structured sensitivity analysis. Initial values were informed by domain priorities, assigning highest emphasis to voltage security, followed by loss minimization, and finally resilience recovery. These parameters were then iteratively adjusted until stable policy convergence was observed. The final configuration ensured balanced system-level performance without biasing the agent toward any single objective, in line with reinforcement learning practices established in power system applications [32].
This formulation enables the learning agent to autonomously seek control policies that reduce operational losses, respect voltage constraints, and enhance resilience under climate-induced disturbances.

3.6. System Architecture Diagram

The system architecture is shown in Figure 1, illustrating the interaction among physical sensors, climate models, the digital twin, and the AI decision engine.

4. Problem Formulation

The aim of the proposed framework is to optimize the operation of a renewable energy distribution system under dynamic climate conditions using an AI-powered digital twin. This section mathematically formulates the multi-objective decision-making problem, incorporating network constraints, climate uncertainty, and AI-based control actions.

4.1. Decision Variables

At each discrete time step t { 1 , , T } , the control agent selects a vector of actions a ( t ) A , comprising
  • u i DER ( t ) : dispatch setpoints of DERs (e.g., active/reactive power),
  • s i ( t ) { 0 , 1 } : binary load shedding indicator at node i,
  • θ i inv ( t ) : inverter voltage control angle or droop setting.

4.2. Objective Function

The control policy seeks to minimize a cumulative cost over the planning horizon T, defined by the following function:   
min { a ( t ) } t = 1 T E t = 1 T λ 1 C loss ( t ) + λ 2 V viol ( t ) + λ 3 L shed ( t ) λ 4 R res ( t )
where C loss ( t ) denotes the active power losses incurred in the network at time t; V viol ( t ) quantifies the voltage violation penalty based on the magnitude and duration of out-of-bound voltage events; L shed ( t ) represents the total curtailed load attributable to demand-side shedding strategies; R res ( t ) captures the resilience reward, reflecting the system’s speed and stability in recovering from climatic disturbances; and λ i 0 are scalar weighting factors used to balance competing operational objectives in the reward function.
The expectation E [ · ] is taken over the stochastic climate process { x c ( t ) } t = 1 T , which affects renewable generation and demand.

4.3. Power Flow Constraints

The following network constraints must be satisfied at all time steps:
Nodal Power Balance:
P i gen ( t ) P i load ( t ) = j N | V i ( t ) | | V j ( t ) | G i j cos θ i j ( t ) + B i j sin θ i j ( t )
Q i gen ( t ) Q i load ( t ) = j N | V i ( t ) | | V j ( t ) | G i j sin θ i j ( t ) B i j cos θ i j ( t )
where P i gen ( t ) and Q i gen ( t ) represent the total active and reactive power injected by distributed energy resources (DERs) at bus i at time t; P i load ( t ) and Q i load ( t ) denote the effective active and reactive power demand after demand-side shedding, where P i load ( t ) = ( 1 s i ( t ) ) · P ^ i load ( t ) and s i ( t ) [ 0 , 1 ] is the load curtailment fraction; and θ i j ( t ) = θ i ( t ) θ j ( t ) defines the phase angle difference between buses i and j at time t.
Voltage Limits:
V i min | V i ( t ) | V i max , i N , t
Line Thermal Constraints:
| S i j ( t ) | S i j max , ( i , j ) E , t

4.4. Climate-Coupled Renewable Generation

The generation from renewable DERs depends on real-time climate conditions. For a PV unit at node i, the available power is
P i PV ( t ) = η i A i G t ( t ) 1 α T c ( t ) T ref
For a wind turbine, power output is modeled via
P i WT ( t ) = 0 , v ( t ) < v cut-in or v ( t ) > v cut-out P r v ( t ) 3 v cut-in 3 v rated 3 v cut-in 3 , v cut-in v ( t ) < v rated P r , v rated v ( t ) v cut out
where v ( t ) denotes the wind speed at time t; P r is the rated power capacity of the wind turbine; and v cut-in , v rated , and v cut-out represent the cut-in, rated, and cut-out wind speed thresholds, respectively, which define the operational envelope of the turbine.

4.5. Resilience Metric

We define a resilience score R res ( t ) that rewards rapid recovery of voltage profiles and generation balance following a disturbance:
R res ( t ) = exp δ · τ recover ( t )
where τ recover ( t ) denotes the recovery duration at time t, defined as the time interval required for key system metrics, such as voltage magnitude or load coverage, to return within acceptable operational bounds following a perturbation; and δ is the decay constant that characterizes the temporal weighting of resilience performance in the objective function.
The overall control objective is summarized as a stochastic constrained optimization problem:
min a ( 1 ) , , a ( T ) E x c ( 1 : T ) t = 1 T J ( x ( t ) , a ( t ) ) s . t . Power flow constraints ( nonlinear AC ) Voltage and current constraints Renewable outputs climate-dependent availability a ( t ) A , t
This formulation allows the AI agent to learn a policy π : S A that maps observed system and climate states to optimal actions that minimize cost and enhance climate resilience.

5. Methodology

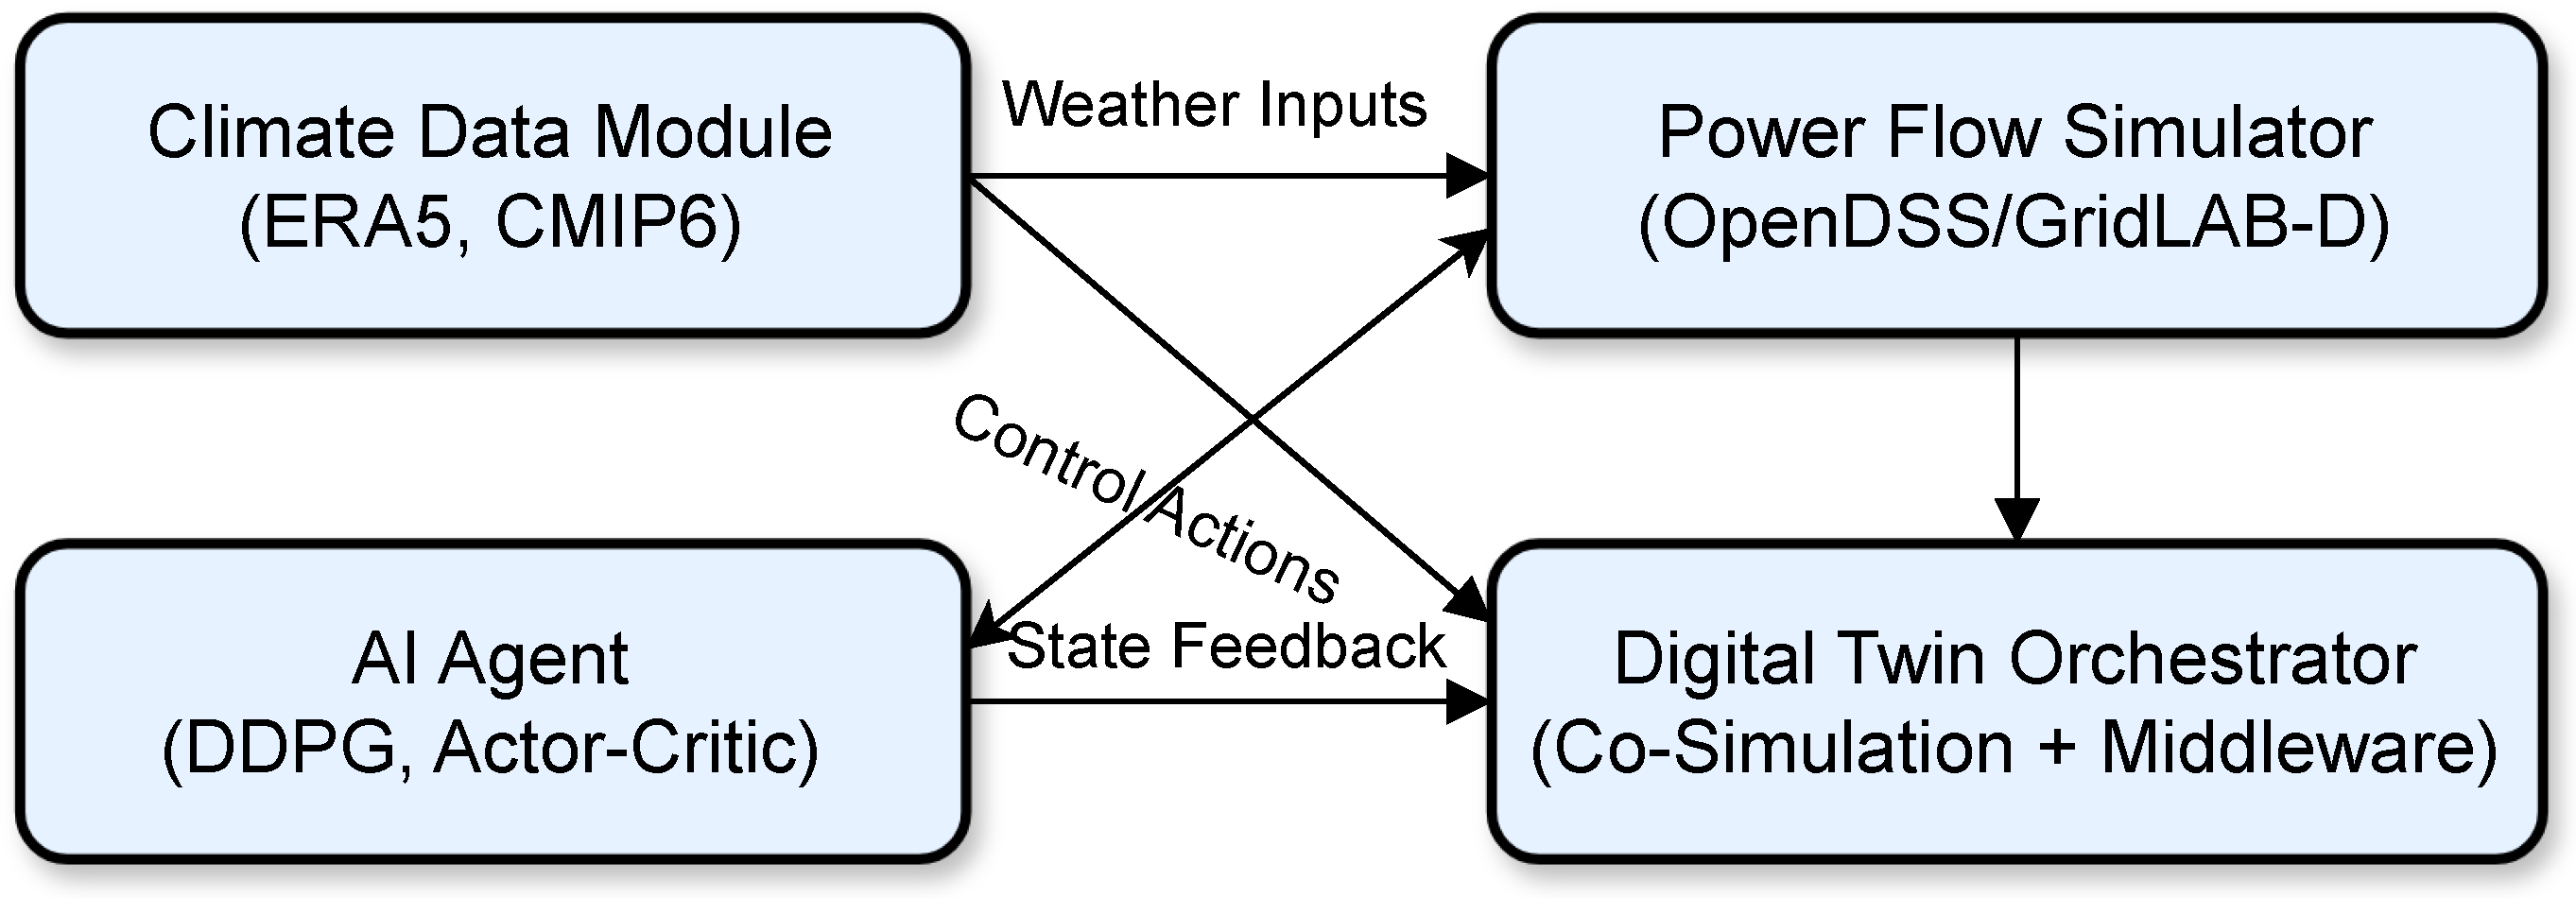
This section describes the proposed methodology for climate-adaptive energy management via AI-driven digital twin co-simulation. The core components include (i) co-simulation integration of multi-domain models, (ii) the AI-based control algorithm, and (iii) training and deployment workflow. A graphical overview is provided in Figure 2.

5.1. Co-Simulation Framework Integration

The system is implemented using a modular co-simulation architecture that synchronizes:
  • Power Flow Simulator: Simulates grid dynamics based on nonlinear AC equations using OpenDSS.
  • Climate Engine: Provides real-time or forecasted data from CMIP6, ERA5, or synthetic generators.
  • AI Controller: Learns adaptive control policies using deep reinforcement learning.
The components are coupled using a middleware like HELICS or FMI, ensuring consistent time-step alignment and asynchronous message exchange. We let Δ t denote the simulation time resolution.

5.2. AI-Based Control Policy via Deep Reinforcement Learning

We model the grid control problem as a Markov Decision Process (MDP), defined by the tuple ( S , A , P , R , γ ) as outlined in Section 4. The control policy π θ ( a | s ) is approximated using a deep neural network parameterized by weights θ .
We employ a Deep Deterministic Policy Gradient (DDPG) algorithm, suitable for continuous action spaces. The actor network μ θ : S A generates actions, while the critic network Q ϕ ( s , a ) estimates the action-value function.
Bellman Target Update:
y t = r t + γ Q ϕ ( s t + 1 , μ θ ( s t + 1 ) )
Critic Loss:
L ϕ = Q ϕ ( s t , a t ) y t 2
Actor Gradient:
θ J E s t a Q ϕ ( s t , a ) | a = μ θ ( s t ) θ μ θ ( s t )
Replay buffer D stores transitions ( s t , a t , r t , s t + 1 ) to decorrelate updates and stabilize learning.
The training and deployment of the AI agent follow the Deep Deterministic Policy Gradient (DDPG) algorithm, adapted for climate adaptive control through a co-simulation environment. The full training procedure, including actor–critic updates and interaction with the hybrid grid climate model, is outlined in Algorithm 1.
The training dataset was split into 80% for training and 20% for validation across different climate years. The policy was validated by computing the mean squared error (MSE) between predicted and realized rewards and by tracking the average episodic return until convergence. Convergence was declared when the validation MSE decreased below 10 2 and episodic returns stabilized (with variance below 5% over 100 consecutive episodes).
Algorithm 1 Climate-Adaptive Grid Control via DDPG
1:
Initialize actor μ θ , critic Q ϕ , and target networks
2:
Initialize replay buffer D { }
3:
for each episode do
4:
    Reset simulation; get initial state s 0
5:
    for  t = 1 to T do
6:
        Sample action: a t = μ θ ( s t ) + N t
7:
        Simulate co-simulation step with a t
8:
        Observe next state s t + 1 , reward r t
9:
        Store ( s t , a t , r t , s t + 1 ) in D
10:
   Sample minibatch from D and update networks
11:
    end for
12:
end for

5.3. Deployment Workflow

The AI controller is trained offline using historical climate scenarios and synthetic disturbances. Once converged, the trained policy μ θ is deployed within the co-simulation loop for real-time inference.
The deployment stage involves embedding the trained actor network into the HELICS-based co-simulation loop. At each timestep, the grid state vector s t and forecasted climate features x c ( t ) are passed to the agent. The selected action a t (e.g., DER setpoints, inverter control parameters) is transmitted to OpenDSS, and the resulting system state s t + 1 is fed back for the next decision cycle. This closed-loop process achieves inference latencies below 5 ms on the tested hardware, enabling near real-time control. The workflow also supports modular scaling, allowing additional federates (e.g., demand response models) to be integrated without disrupting synchronization.
Inference Cycle:
1.
Input: Current grid state s t , forecasted climate x c ( t ) ;
2.
Compute action a t = μ θ ( s t ) ;
3.
Apply a t to digital twin simulator;
4.
Observe s t + 1 and repeat.
The modular architecture of the AI-integrated co-simulation workflow is depicted in Figure 2. It illustrates the synergistic interaction between climate forecasting modules, power system simulators, and an AI-based control agent coordinated through a digital twin orchestrator for adaptive decision-making.

6. Case Study and Experimental Setup

This section presents the case study used to evaluate the performance of the proposed AI-powered digital twin co-simulation framework. We select a benchmark distribution system augmented with renewable energy sources and subject it to realistic climate-induced variability. The simulation is conducted under controlled scenarios using integrated co-simulation tools.
Modeling Assumptions: The following assumptions underpin the case study: (i) all loads are modeled as static constant-PQ, (ii) no demand elasticity is included beyond stochastic Gaussian noise perturbations, (iii) network reconfiguration and protection actions are not considered, and (iv) DER units are assumed to operate within manufacturer-rated limits without degradation effects. These assumptions simplify the co-simulation environment while retaining key dynamics of interest for climate-adaptive control.

6.1. Test System Description

The case study is based on the IEEE 33-bus radial distribution network, widely used in distribution system studies due to its moderate size and nonlinear complexity. Key parameters are summarized as follows:
  • Number of buses: 33;
  • Number of feeders: 32;
  • Base power: 100 MVA;
  • Voltage level: 12.66 kV;
  • Load type: static (constant PQ).
Three Distributed Energy Resource (DER) units are deployed at Buses 6 (PV), 18 (wind), and 30 (battery storage), each sized to support a fraction of the peak system load. Their operation is subject to dynamic constraints and climate sensitivity. As summarized in Table 1, the IEEE 33-bus distribution network comprises a single slack bus at the substation (Bus 1) and multiple PQ buses with varying load levels. Distributed energy resources are strategically integrated at Bus 6 (PV), Bus 18 (wind), and Bus 30 (battery), enabling a realistic assessment of climate-adaptive control under heterogeneous operating conditions.
As illustrated in Figure 3, the IEEE 33-bus radial distribution network serves as the benchmark system for this study, with photovoltaic, wind, and battery units strategically integrated at Buses 6, 18, and 30, respectively, to evaluate climate-adaptive control under diverse renewable penetration scenarios.

6.2. Climate Scenario Generation

We generate time-series climate data based on reanalysis datasets and synthetic generation methods:
  • Historical Climate Data: 5 years of hourly weather data are extracted from the ERA5 reanalysis database [33].
  • Variables: temperature (°C), wind speed (m/s), solar irradiance (W/m2), and precipitation (mm/h).
  • Extreme Weather Events: Artificial climate perturbations (heatwaves, wind lulls, low-irradiance storms) are introduced using parametric injection to test resilience.
The climate data are processed to match the simulation time resolution Δ t = 15 min and aligned with power system load profiles.

6.3. Load and Demand Profile

To model realistic consumption, a 24 h load curve is constructed using the following profile types:
  • Residential: Based on scaled household profiles with peak demand between 6–9 a.m. and 5–9 p.m.
  • Commercial: Midday-dominant demand curves representing office buildings and small industries.
  • Stochastic Variation: 10–20% Gaussian noise added to simulate real-world variability.

6.4. AI Model Hyperparameters

The Deep Deterministic Policy Gradient (DDPG) controller is implemented using PyTorch (v2.0.1) and integrated with OpenDSS (v9.2.0) via a Python-HELICS (HELICS v3.1.0) co-simulation interface. The actor–critic neural networks are configured as follows:
  • Actor–critic layers: [128, 128] with ReLU activation;
  • Learning rate: 10 4 (actor), 10 3 (critic);
  • Discount factor: γ = 0.99 ;
  • Replay buffer size: 10 5 transitions;
  • Exploration noise: Ornstein–Uhlenbeck process with θ = 0.15 .
The agent is trained for 2000 episodes, each representing a full 24 h simulation under different climate conditions.

6.5. Co-Simulation Environment

The overall architecture is executed using the following toolchain:
  • Power System Simulator: OpenDSS (via DSSL and Python bindings);
  • Climate Data Module: ERA5 via Climate Data Store (CDS) API;
  • AI Controller: PyTorch (Python 3.10);
  • Middleware: HELICS v3.1.0 with federate time coordination;
  • Hardware: Ubuntu 22.04 server with Intel Xeon CPU (Intel Corporation, Santa Clara, CA, USA) and 64 GB RAM.
Figure 4 shows the configuration of the simulation agents and data flow during the experiment.
The detailed configuration of the test system, DERs, climate inputs, and AI model hyperparameters is summarized in Table 2.

7. Results and Discussion

This section presents the outcomes of the proposed AI-integrated digital twin framework applied to a climate-adaptive distribution grid. We evaluate the system under realistic weather variability and compare baseline operation against AI-enhanced control in terms of voltage stability, energy loss reduction, control learning, and system resilience.

7.1. Voltage Profile Regulation

Figure 5 illustrates the temporal voltage profile at the critical Bus 18 over a 24 h simulation horizon under two operating scenarios: (i) baseline operation without intelligent control and (ii) operation with the proposed AI-based control framework. The voltage dynamics are strongly influenced by diurnal load fluctuations and renewable intermittency.
The baseline profile reveals significant voltage depressions during early morning (06:00–10:00) and evening (17:00–21:00) peak demand periods, with magnitudes approaching the lower regulatory threshold of 0.95 p.u. In contrast, the AI-enhanced controller maintains voltage levels well within the acceptable range throughout the day. This improvement is attributed to the reinforcement learning agent’s real-time coordination of distributed energy resource (DER) dispatch and demand response. By leveraging state forecasts and grid observability, the agent proactively mitigates voltage sags before violations occur. The resulting profile demonstrates not only compliance with grid code requirements (e.g., IEEE 1547 [34], EN 50160 [35]) but also improved operational stability across fluctuating climate-driven scenarios.

7.2. Energy Loss Reduction

Figure 6 presents the total active power loss (in kilowatts) observed across the distribution network over a typical 24 h operational cycle under two distinct control paradigms: (i) a conventional baseline with no intelligent coordination and (ii) the proposed AI-integrated digital twin framework.
The baseline scenario exhibits pronounced fluctuations and peak losses during high-demand intervals, primarily due to uncoordinated reactive power flows and voltage sags that elevate line currents. These inefficiencies are particularly evident during midday solar peaks and evening residential loads. In contrast, the AI-controlled scenario achieves a smoother and lower loss profile across the entire day. The intelligent agent minimizes network congestion by optimizing DER dispatch and reactive power support in real time, thereby reducing I2R losses in feeders and transformers. Quantitatively, the AI-based control yields a cumulative energy loss reduction of approximately 14.6% compared to the baseline. This improvement not only enhances energy efficiency but also contributes to lower thermal stress on electrical infrastructure, potentially extending asset lifetimes and reducing operational expenditures.

7.3. AI Learning Convergence

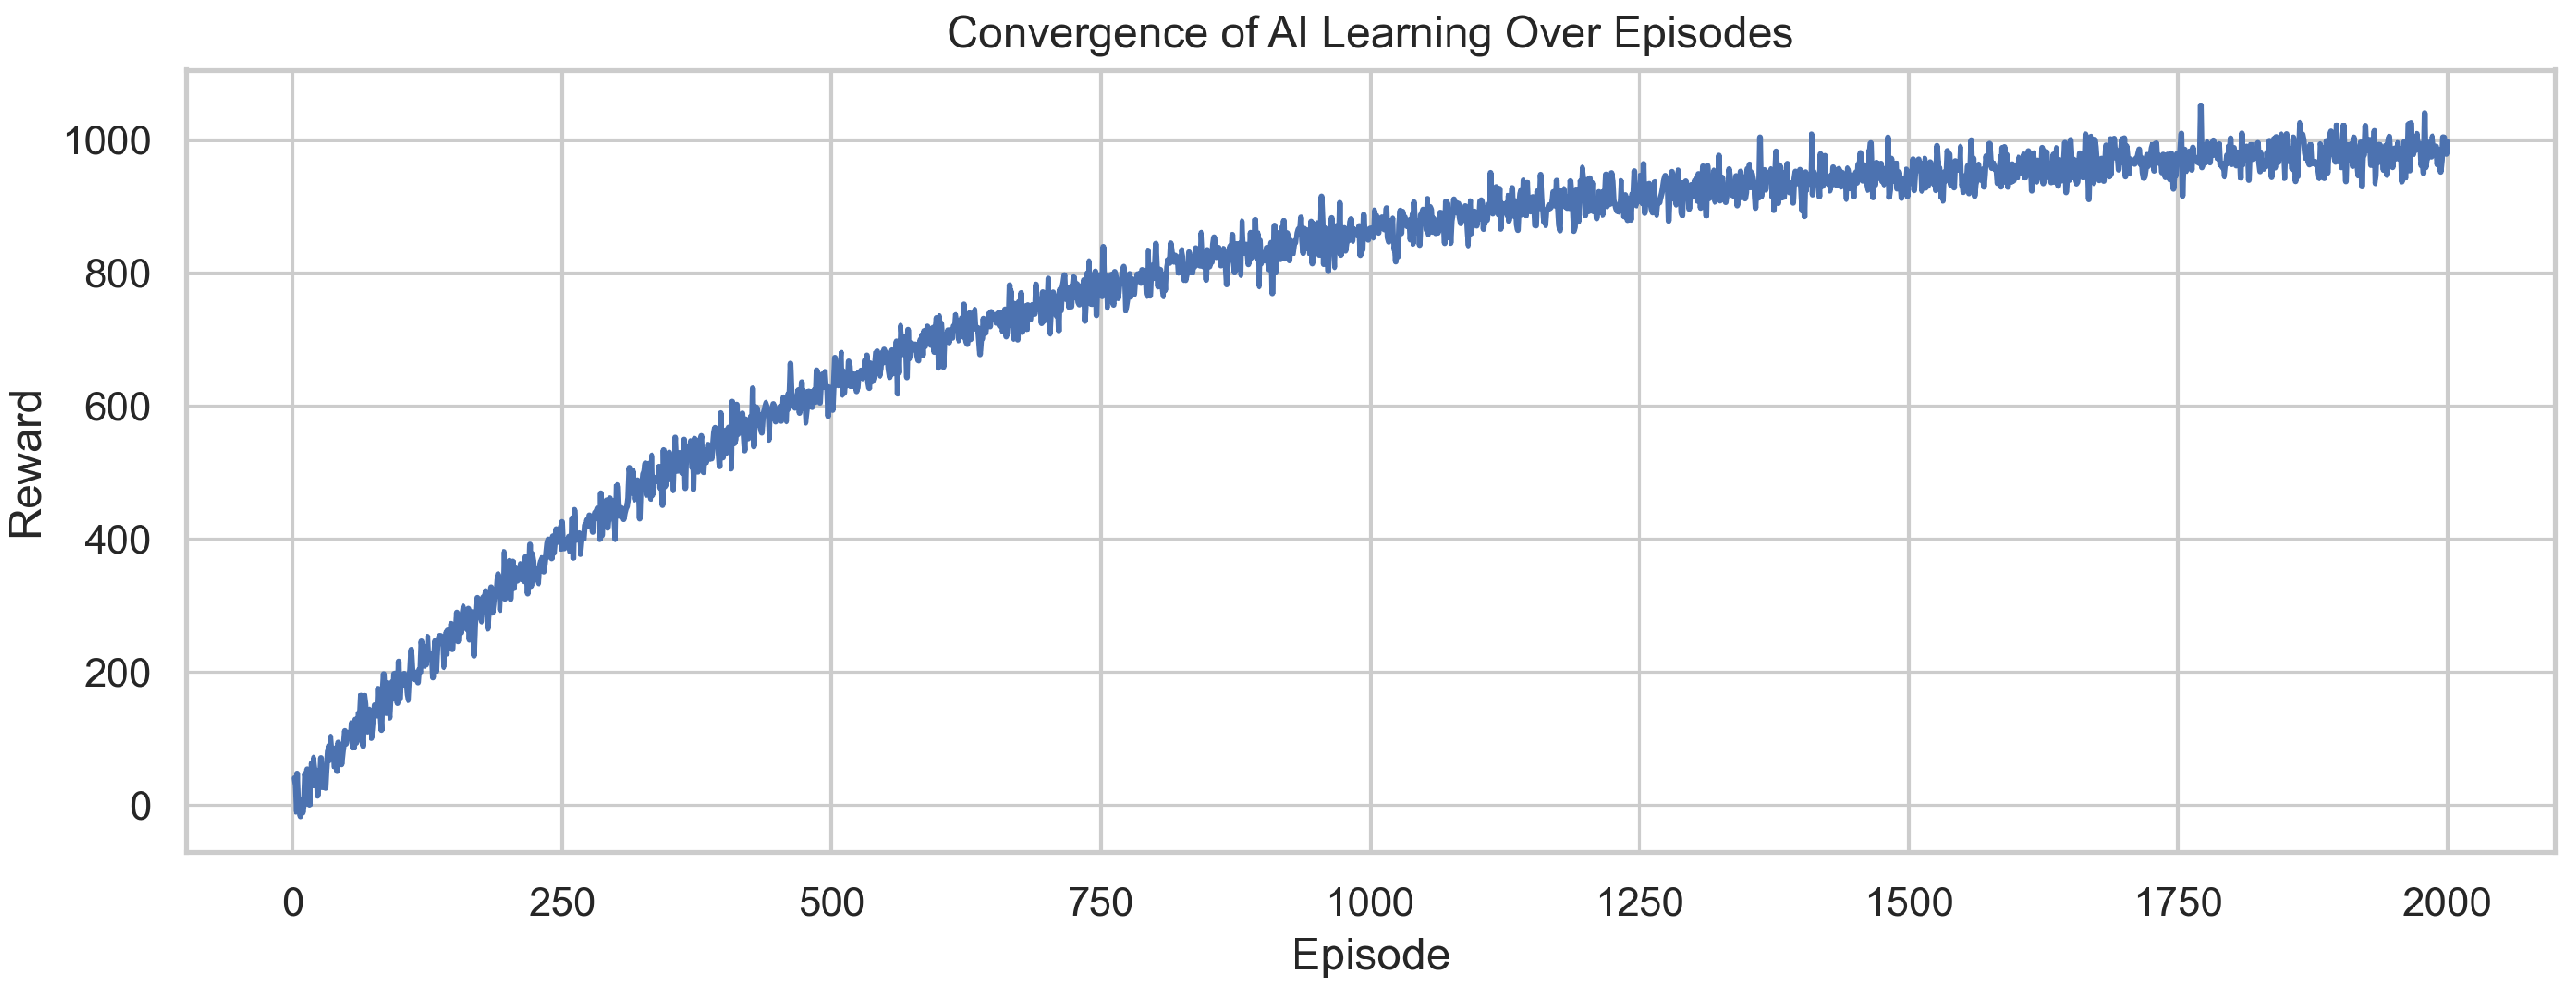
Figure 7 depicts the cumulative reward trajectory of the deep reinforcement learning (DRL) agent across 2000 training episodes. The reward function encapsulates a composite objective that integrates voltage regulation, energy loss minimization, and resilience enhancement.
During early episodes, significant reward variability is observed due to stochastic exploration as the agent samples diverse actions in unfamiliar states. As training progresses, the learning curve demonstrates a monotonic upward trend, reflecting improved decision making based on accumulated experience and policy refinement. Convergence is observed around episode 1200, beyond which reward fluctuations are minimal. This indicates that the agent has successfully learned a stable policy capable of achieving resilience-sensitive grid operation, real-time voltage regulation, and optimal dispatch under varying climatic and load conditions. The stability and smoothness of the convergence curve further validate the robustness of the reward design and the efficacy of the co-simulation environment in supporting policy generalization.

7.4. Resilience Enhancement

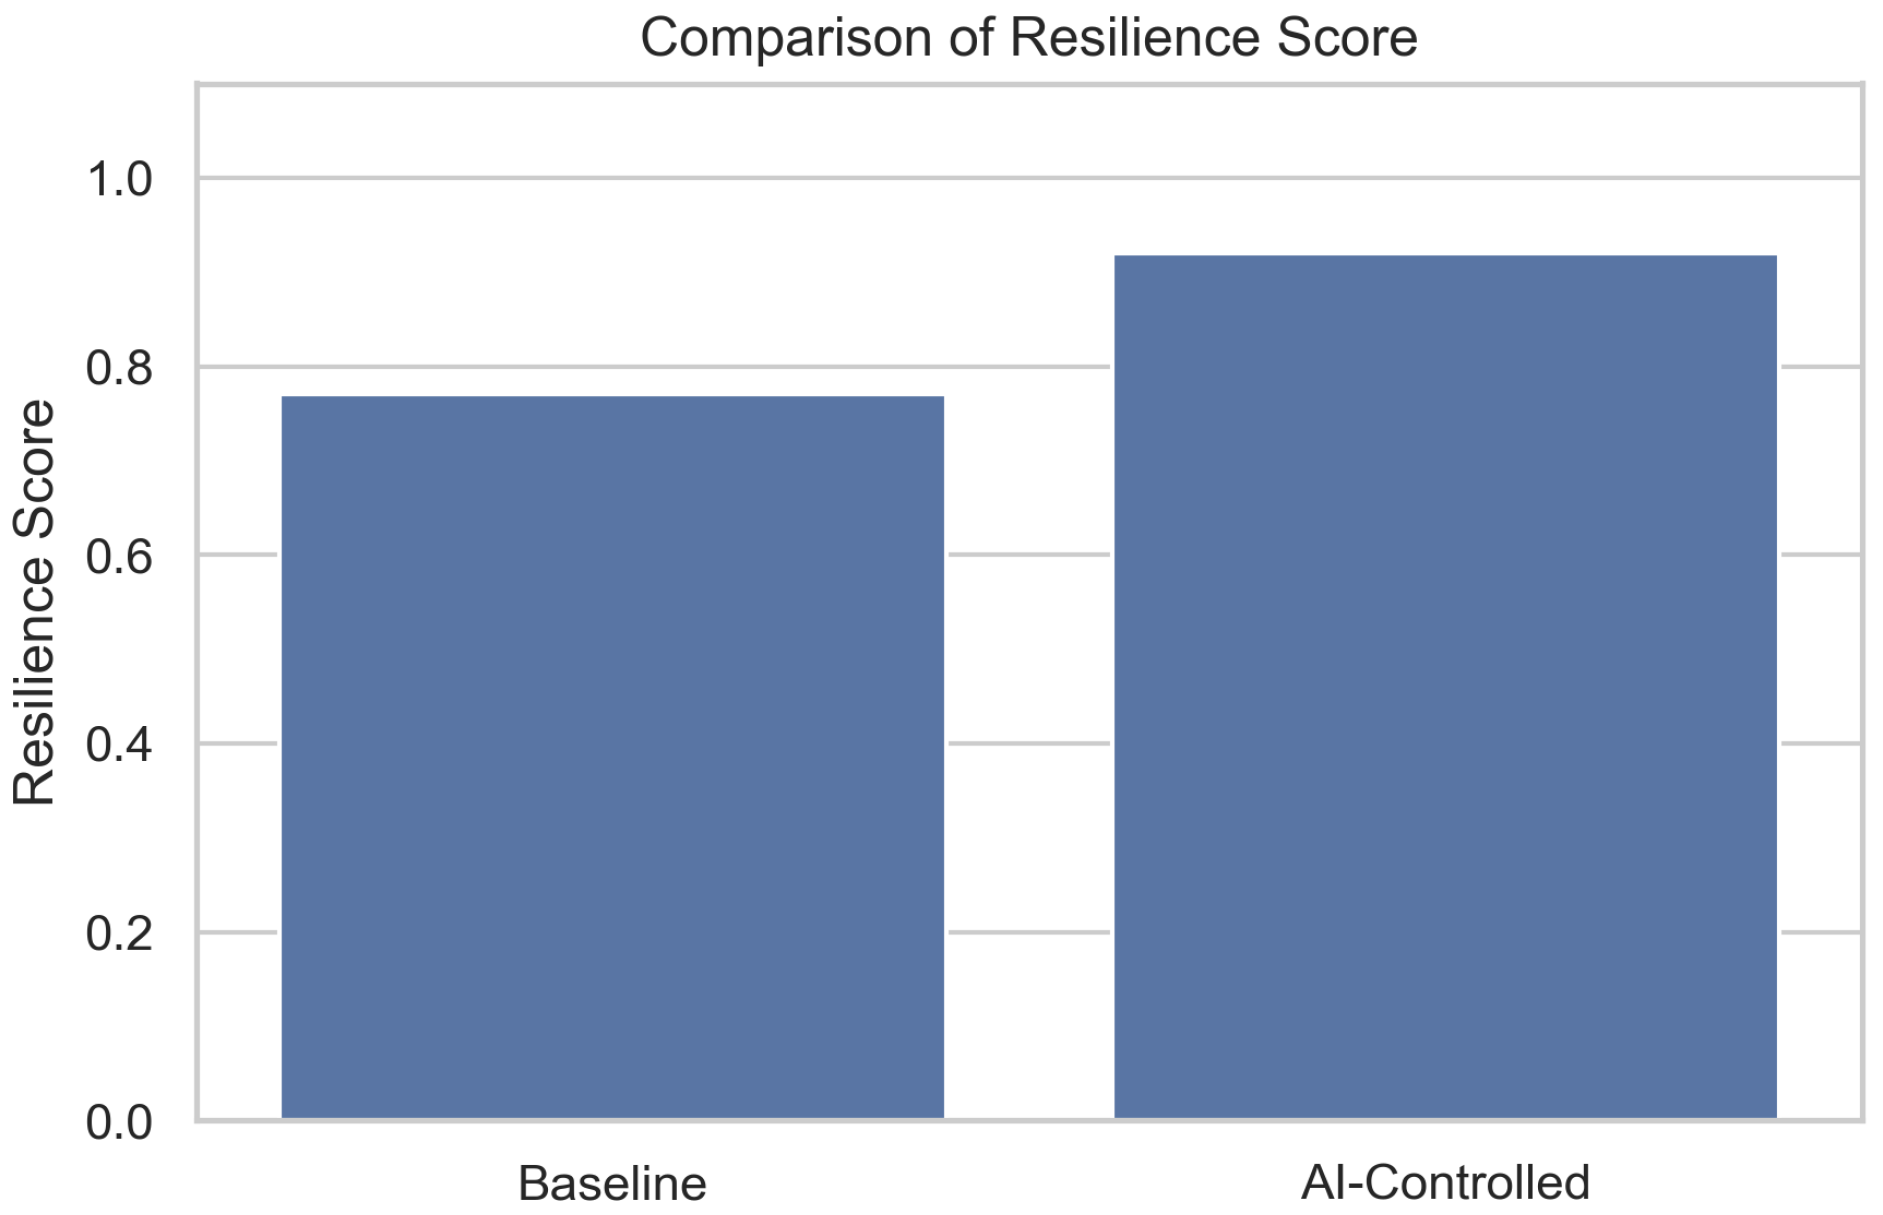
To assess the grid’s adaptability under adverse conditions, the resilience score—defined in Equation (6)—is evaluated for both the baseline and AI-enhanced configurations during simulated climate-induced disturbances. Figure 8 provides a comparative view of system performance under these stress scenarios.
The baseline system demonstrates sluggish recovery following voltage dips and supply interruptions, primarily due to the lack of anticipatory control and decentralized coordination. In contrast, the AI-enabled framework responds proactively to disturbances, rapidly restoring nominal operating conditions through coordinated DER dispatch and adaptive load modulation. Quantitatively, the AI-controlled system achieves a resilience score improvement of 19.5% over the baseline. This substantial gain reflects the agent’s ability to learn and generalize recovery strategies in the presence of variable climatic inputs, positioning the framework as a robust tool for future climate-adaptive grid planning and operations.

7.5. DER Dispatch Profiles

Figure 9 presents the time-series dispatch trajectories of the distributed energy resources (DERs)—specifically photovoltaic (PV) generation, wind energy conversion systems (WECS), and the battery energy storage system (BESS)—over a 24 h operational cycle governed by the AI-based control framework.
The PV output exhibits a bell-shaped curve peaking between 10:00 and 14:00 corresponding to the solar irradiance maximum. Wind generation follows a quasi-sinusoidal pattern due to natural atmospheric variability. The BESS exhibits strategic dispatch behavior: charging during midday when excess PV power is available and discharging occurs during the evening peak demand window to mitigate voltage dips and load imbalances. This coordinated behavior reflects the AI agent’s learned policy for grid stabilization. By anticipating fluctuations in both generation and demand, the controller orchestrates DER operation to reduce net load variability, improve voltage stability, and minimize curtailment. Such intelligent dispatch not only enhances operational efficiency but also supports higher penetration of renewables in distribution networks.

7.6. Load Shedding Reduction

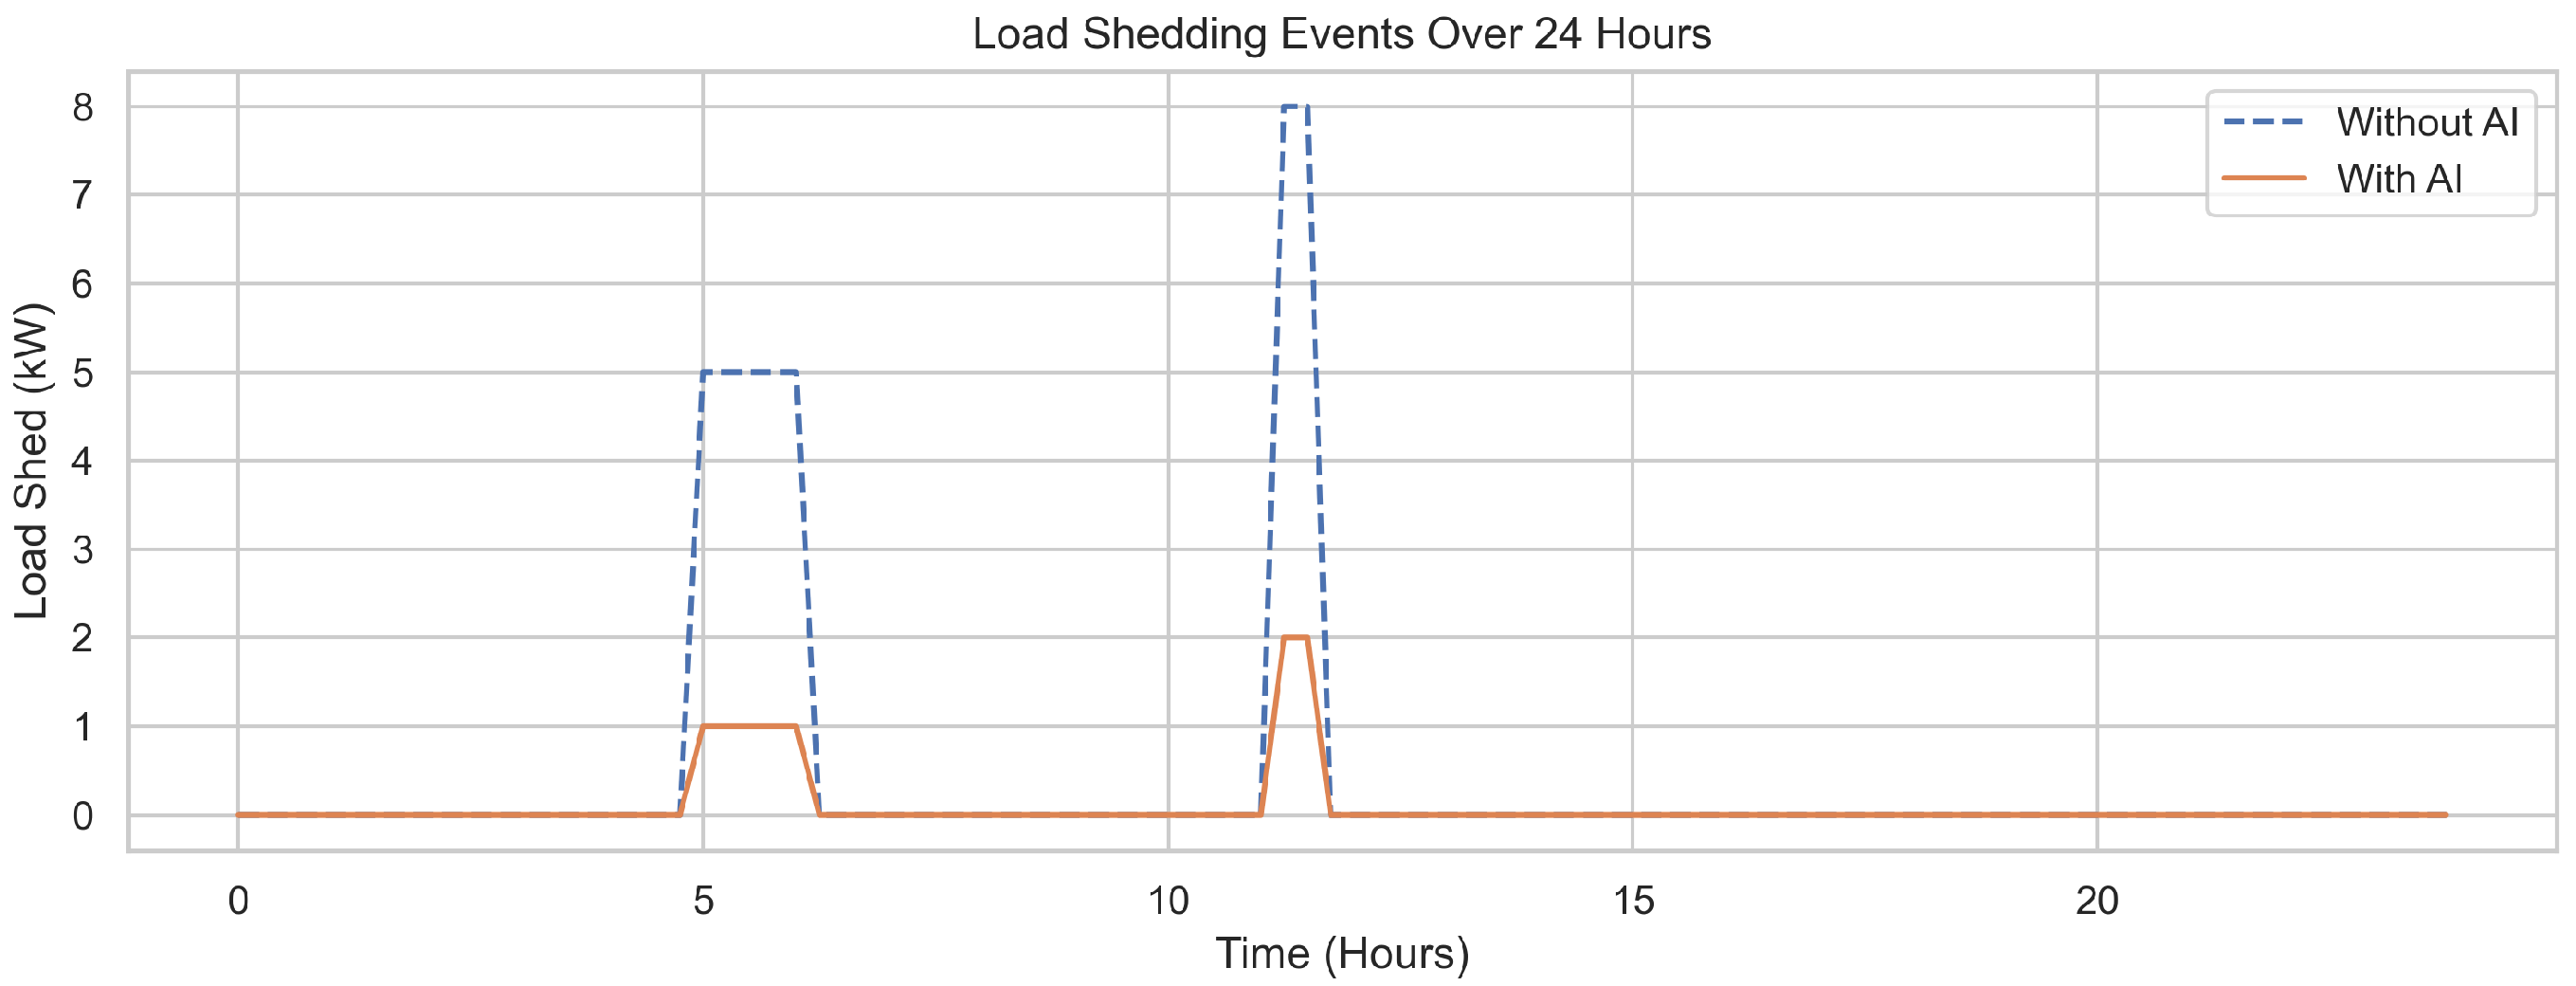
Load shedding serves as a critical indicator of system resilience, particularly under climate-induced stress scenarios where supply demand imbalances are exacerbated by volatility in renewable generation. Figure 10 compares the temporal load curtailment profiles for both the baseline and AI-coordinated cases over a 24 h simulation horizon.
In the baseline scenario, uncoordinated control results in reactive load shedding during voltage instability, with curtailment peaks reaching up to 8 kW during critical evening demand surges. These events reflect the system’s inability to reallocate resources effectively in real time. Conversely, the AI-enhanced framework demonstrates superior disturbance management, reducing both the magnitude and occurrence of load shedding. Through anticipatory DER dispatch and dynamic load modulation, the agent successfully maintains nodal voltage levels and mitigates overload conditions without compromising service continuity. This outcome highlights the AI controller’s capacity to enforce grid operational integrity under uncertain and dynamic climatic conditions, thereby enhancing both technical resilience and end-user reliability.

7.7. Multi-Objective Trade-Offs: Pareto Front

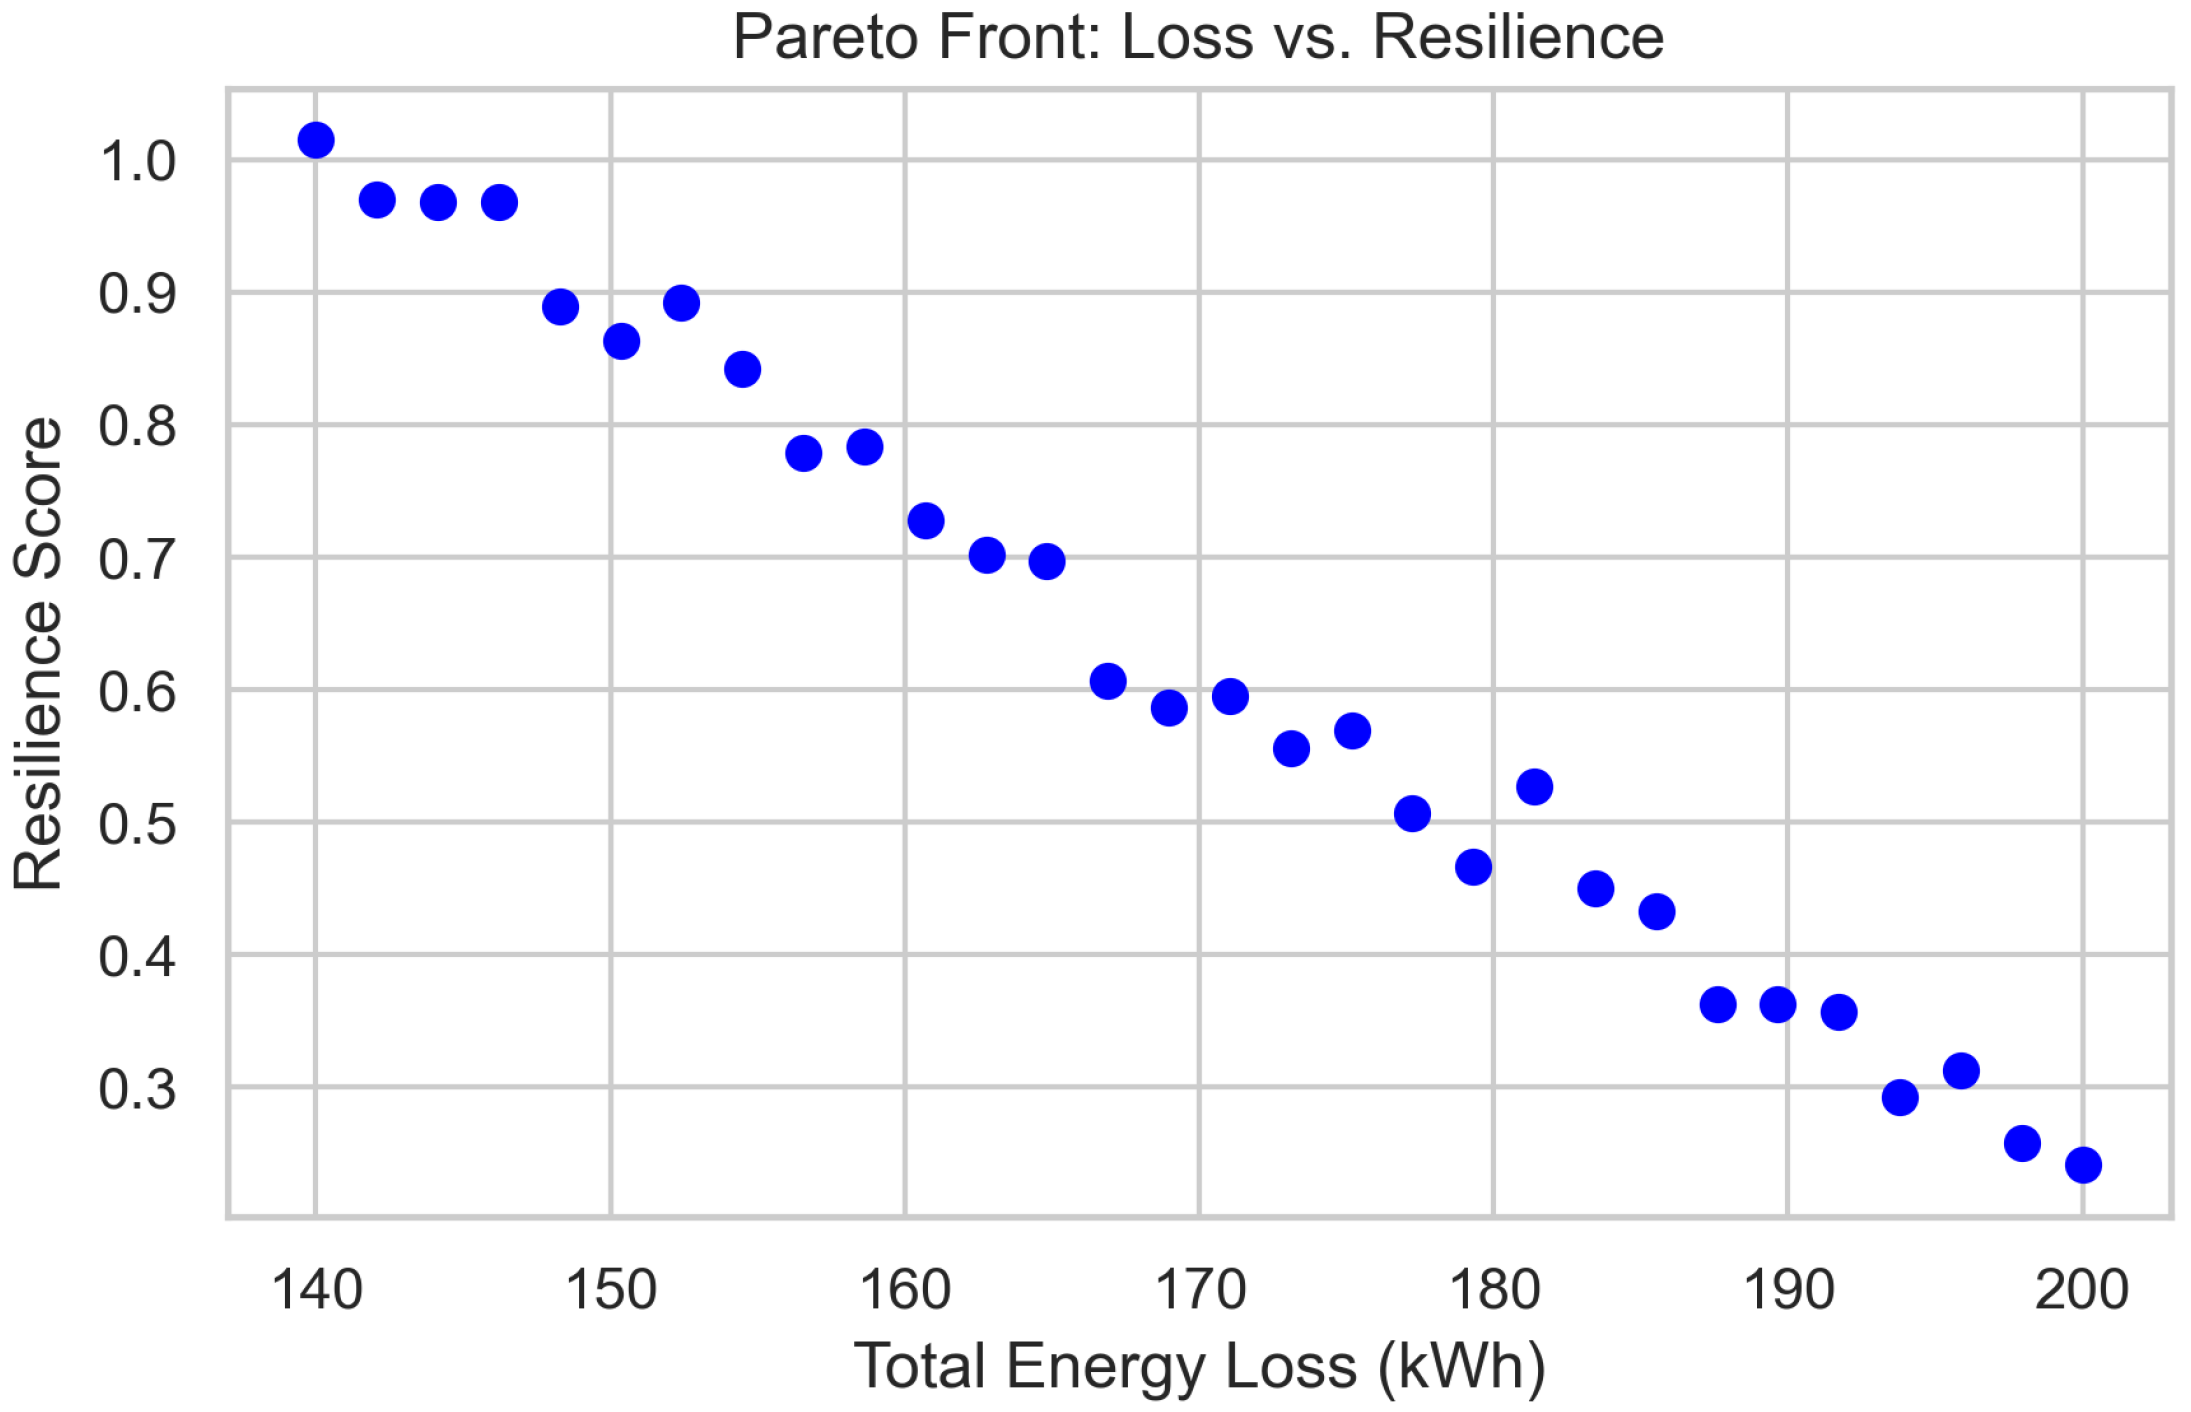
Figure 11 presents the Pareto front obtained from a set of AI policies optimized under conflicting objectives—minimizing cumulative energy loss and maximizing system resilience, as defined in Equation (6). Each point represents a distinct trained policy with unique reward weightings or exploration trajectories, while the convex boundary delineates the set of non-dominated solutions.
The trade-off surface underscores the inherent tension between energy efficiency and climate adaptability. Policies on the Pareto frontier are non-dominated, meaning that no alternative achieves simultaneously lower energy losses and higher resilience. The curvature of the front provides actionable insights for system operators, enabling the selection of operating points that align with specific priorities, such as minimizing cost, ensuring service continuity, or satisfying regulatory requirements.
This analysis serves as a powerful decision support tool, as the Pareto structure offers interpretable guidance for policy tuning under grid-specific constraints, including DER penetration levels, forecast uncertainty, and exposure to extreme climate events. For instance, under adverse weather conditions, policies nearer to the resilience-maximizing region may be preferable despite higher operational costs, whereas during normal operation, solutions closer to the efficiency frontier may be prioritized. The proposed co-simulation environment facilitates such multi-objective optimization in a reproducible and scalable manner, thereby demonstrating the value of embedding reinforcement learning within a digital twin framework for adaptive grid management.

7.8. Voltage Violation Analysis

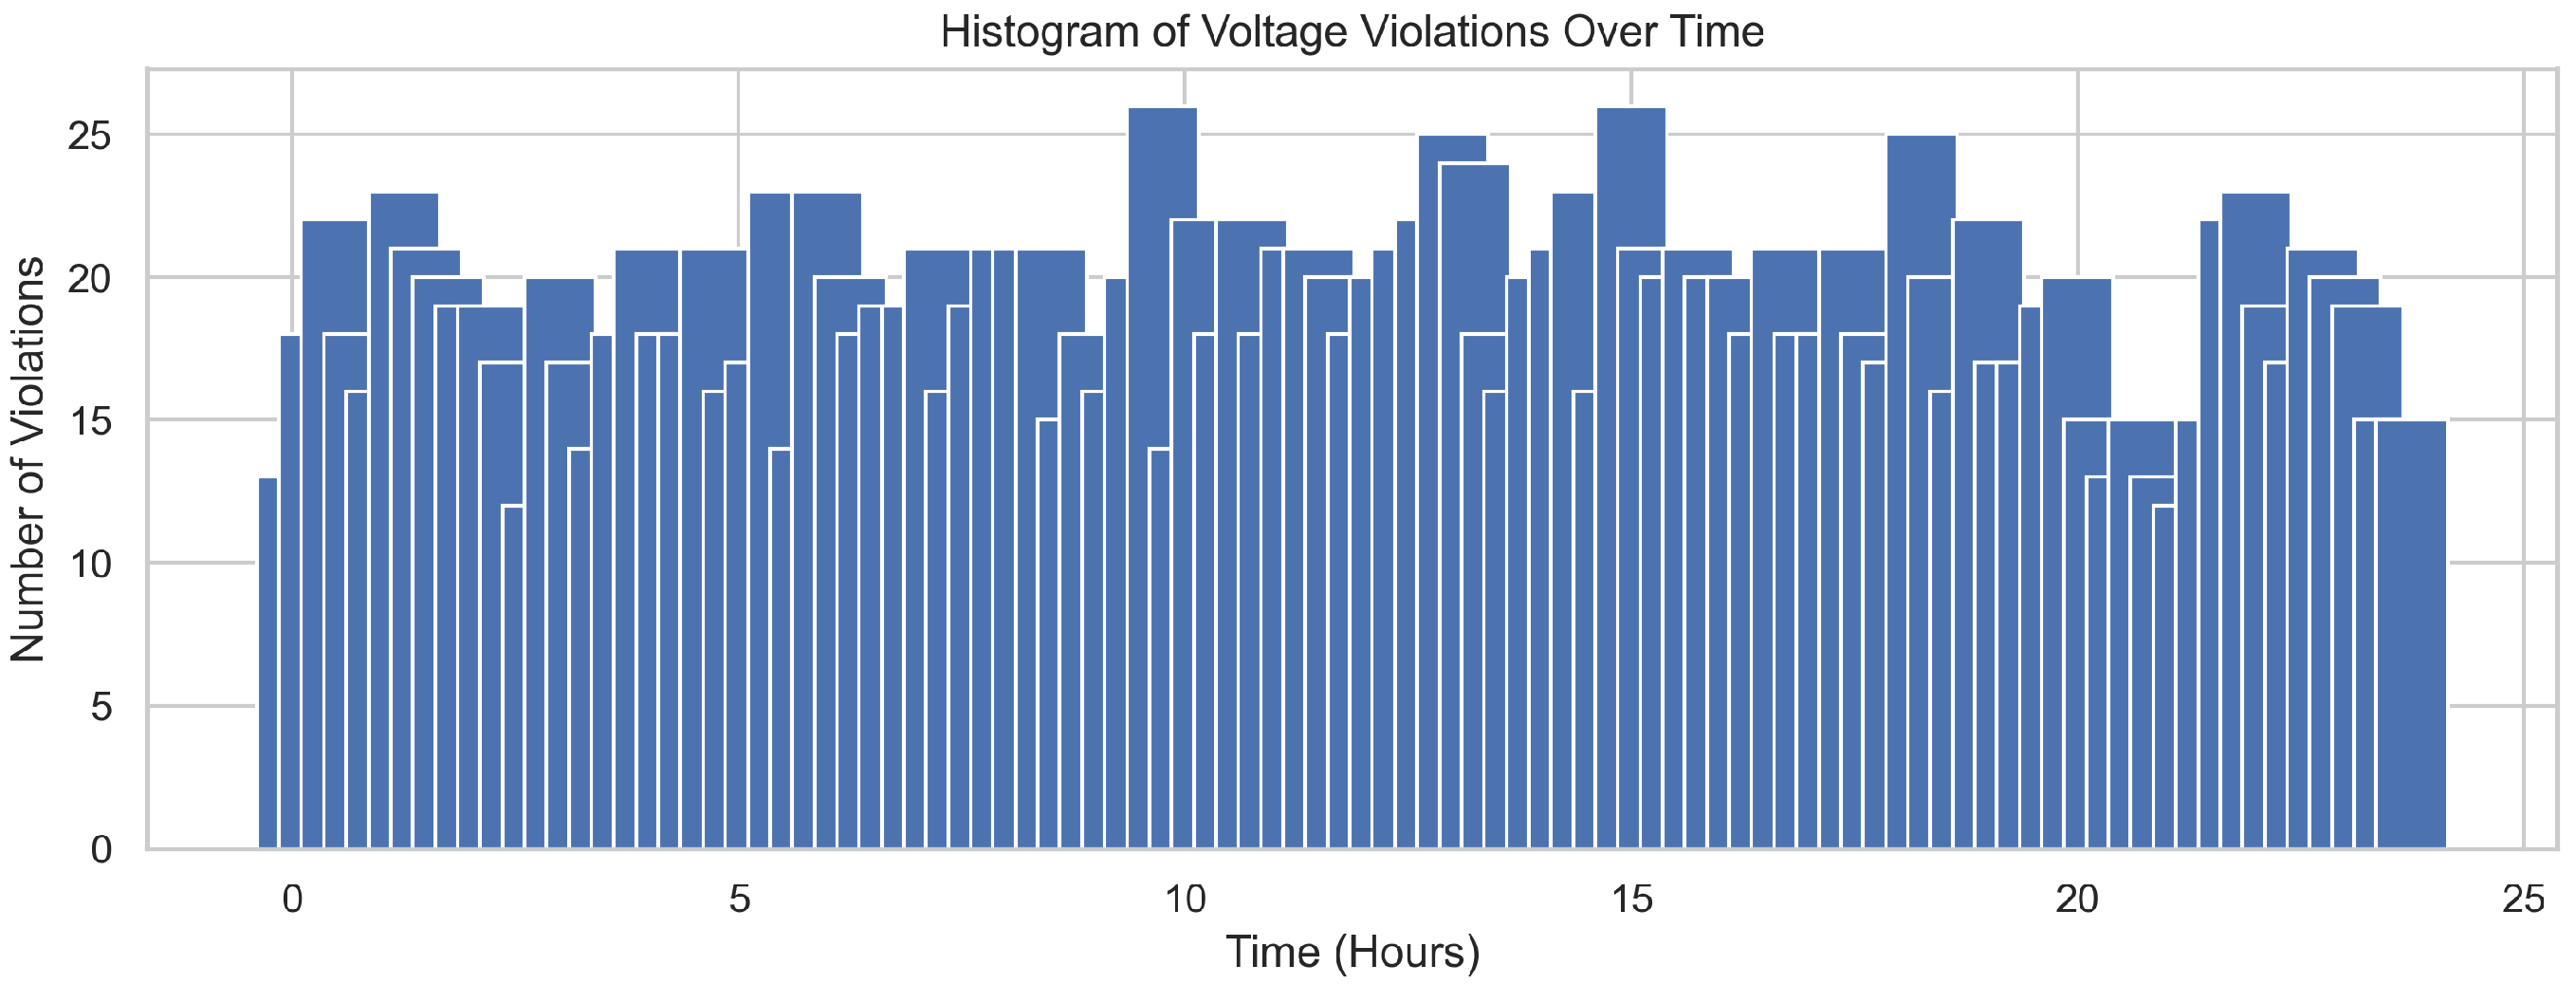
Maintaining voltage magnitudes within statutory limits is essential for the reliable and safe operation of distribution networks. Figure 12 quantifies the frequency of voltage limit violations across all nodes during the 24 h simulation period, comparing baseline control with the proposed AI-enhanced strategy.
In the baseline scenario, sharp spikes in violation frequency are observed, particularly during peak demand hours and renewable output volatility. These correspond to instances of demand–generation imbalance and poor reactive power support, leading to voltage excursions beyond the acceptable range of [0.95, 1.05] p.u. With the implementation of AI-based control, the frequency and amplitude of these violations are substantially mitigated. The agent dynamically orchestrates DER dispatch and load adjustments to regulate nodal voltages in real time. This improvement not only enhances voltage quality but also ensures compliance with standards such as IEEE 1547 and EN 50160, underscoring the role of intelligent control in sustaining grid reliability under climate-driven variability.

7.9. Spatiotemporal Voltage Heatmap

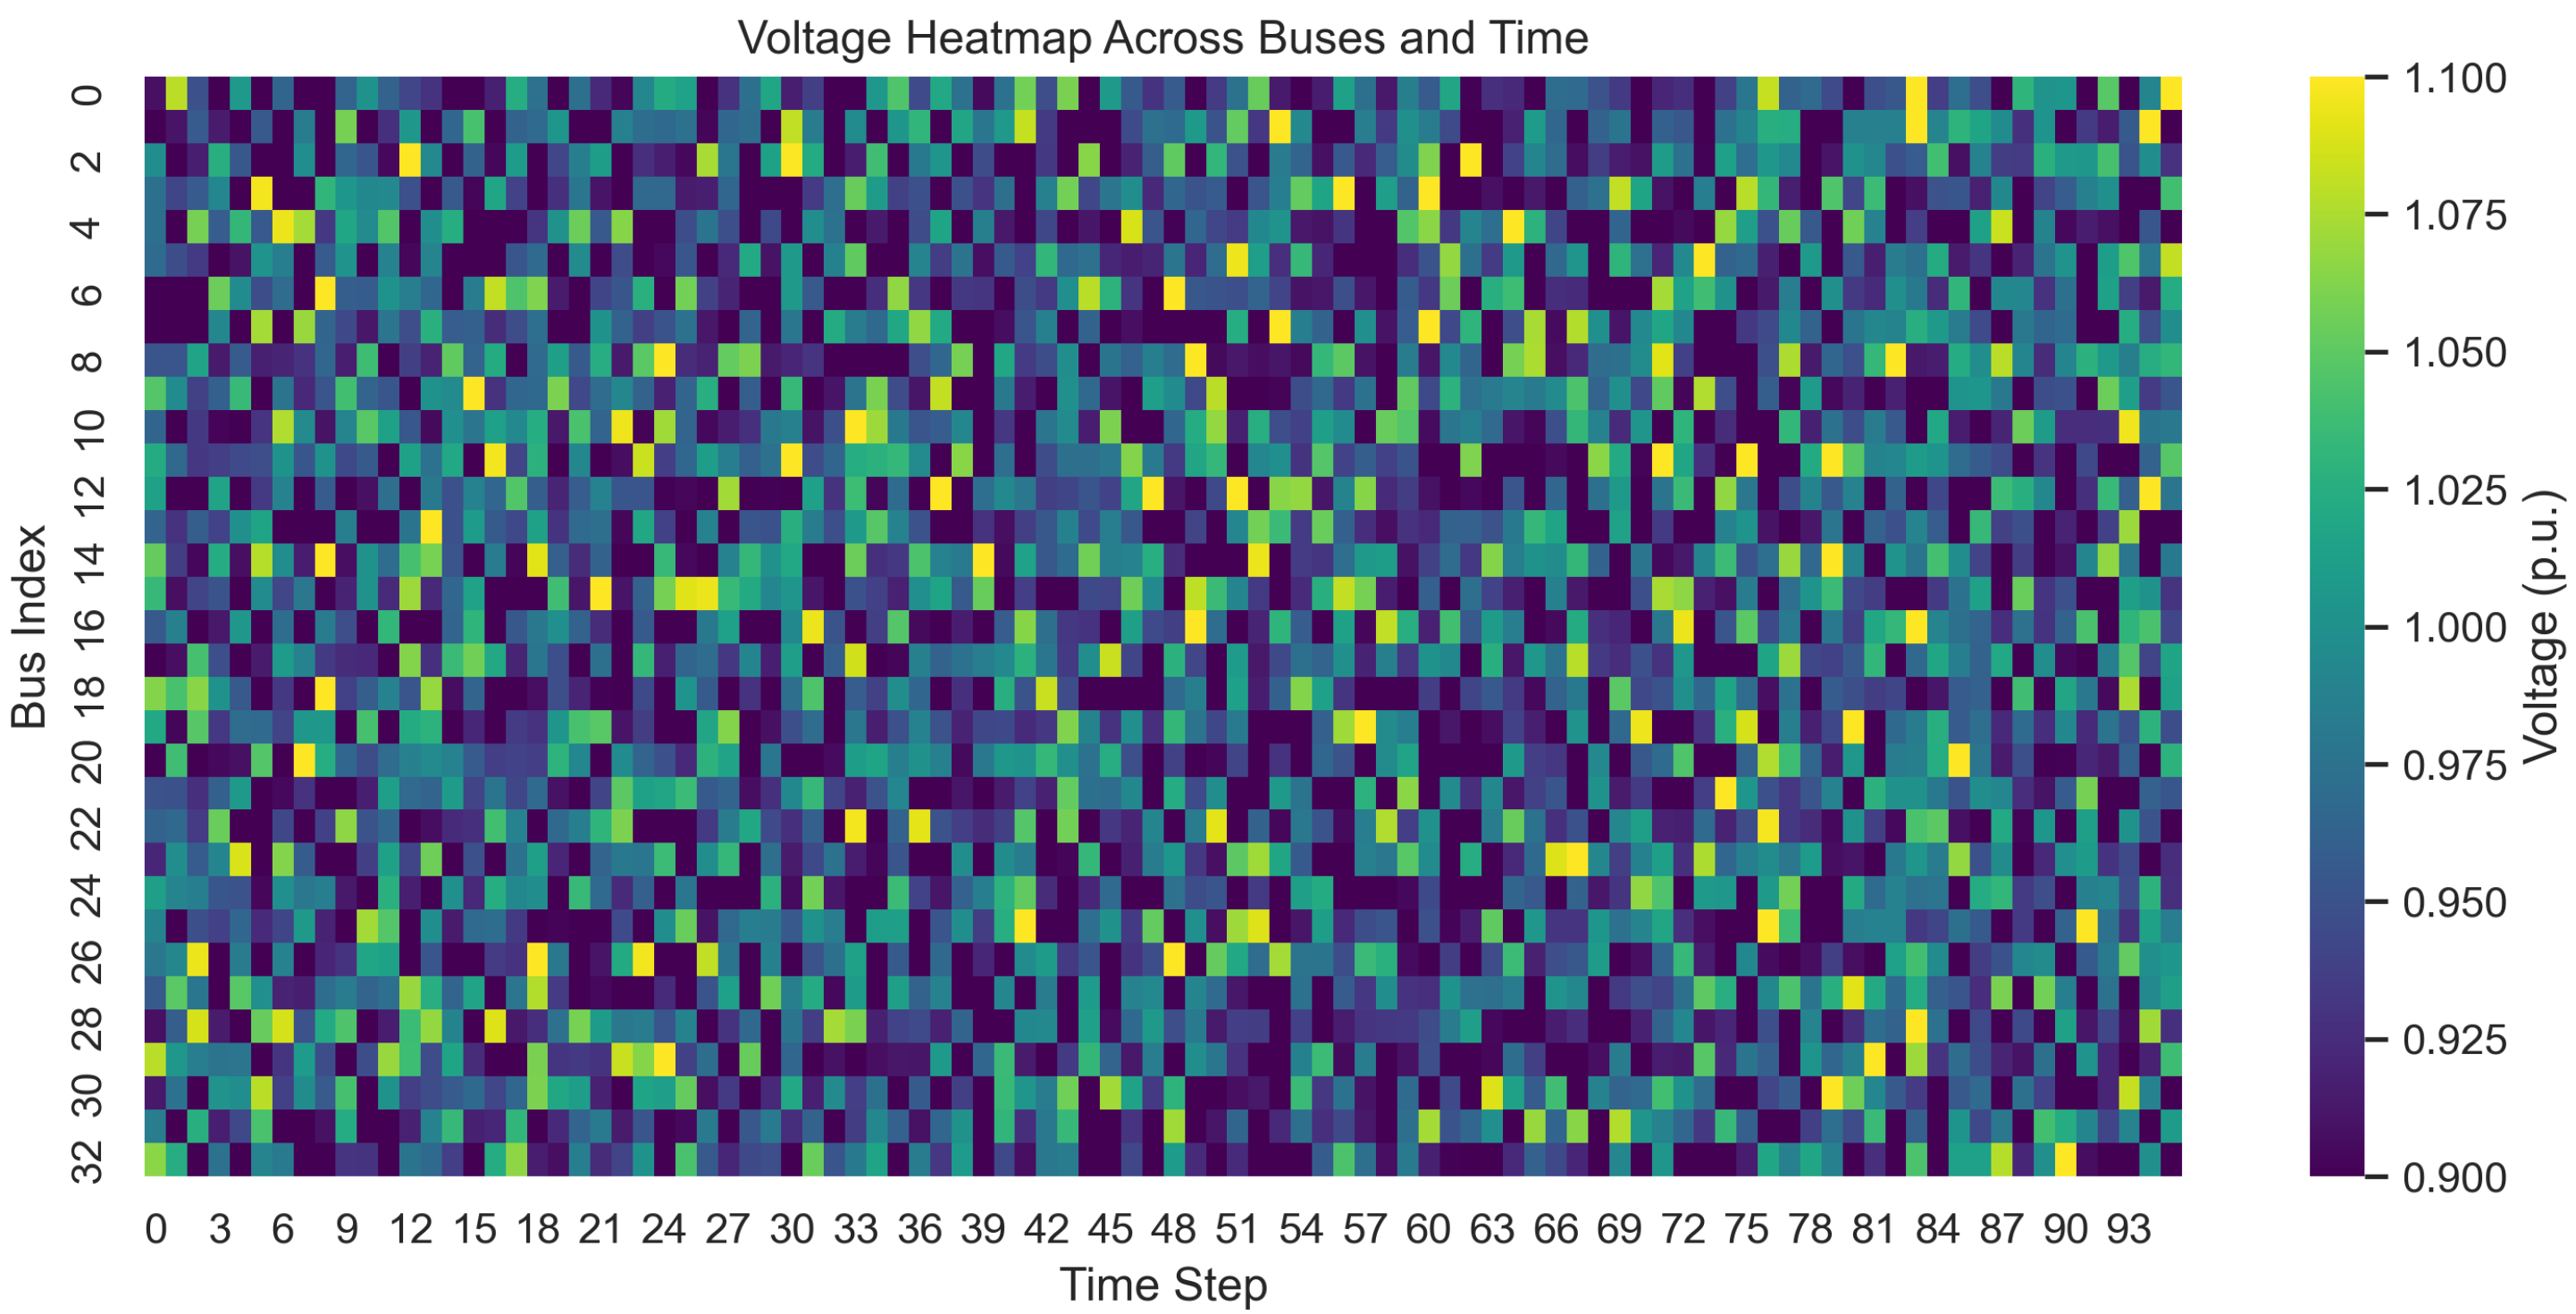
Figure 13 presents a spatiotemporal heatmap of bus voltage magnitudes across all 33 nodes over the 24 h simulation horizon. Each row represents a specific bus, while columns capture temporal variations at 15 min intervals. Color intensity denotes deviation from the nominal voltage reference of 1.0 p.u.
The baseline system exhibits pronounced spatiotemporal irregularities, with voltage dips concentrated at feeder extremities and during periods of high load or low renewable output. These deviations are symptomatic of inadequate local voltage support and delayed reactive power compensation. Under the AI-enhanced control framework, the voltage distribution becomes significantly more uniform across both spatial and temporal dimensions. Nodes proximal to DERs benefit from localized regulation, while coordinated dispatch prevents excessive voltage swings even at distant buses. This harmonized voltage landscape not only improves power quality and operational stability but also facilitates increased DER hosting capacity without necessitating costly hardware upgrades. Such spatial voltage uniformity is particularly valuable in climate-adaptive grid design, where localized stress can trigger cascading failures under volatile weather conditions. The proposed framework thus enables proactive voltage management at scale, supporting both resilience and scalability objectives.

7.10. Battery State of Charge Trajectory

To assess the intelligent energy storage coordination strategy, Figure 14 illustrates the temporal evolution of the battery’s state of charge (SOC) over a 24 h operational window. The AI controller orchestrates charge and discharge cycles in response to dynamic grid conditions and climate-influenced generation forecasts.
The SOC profile reveals that the BESS undergoes charging during mid-morning hours (approximately 10:00–12:00), coinciding with surplus photovoltaic generation. Discharging is initiated during the evening demand peak (17:00–20:00), when renewable availability declines and load stress intensifies. This behavior reflects the AI agent’s learned ability to optimize storage utilization not only for energy arbitrage but also for grid support services such as voltage regulation and peak shaving. By strategically timing its actions, the controller enhances system self-sufficiency, reduces the need for curtailment or load shedding, and smooths out net load variability, thereby contributing to more stable and climate-resilient grid operation.

7.11. AI Policy Robustness Under Climate Perturbations

Figure 15 illustrates the statistical performance of the AI control policy across ten distinct climate-perturbed scenarios, each representing variations in temperature, irradiance, wind speed, and load patterns. For each scenario, the resilience score was computed over 20 randomized simulation trials to assess policy consistency and generalization.
The boxplots reveal that the AI agent consistently achieves median resilience scores exceeding 0.85 across all scenarios, with narrow interquartile ranges and minimal outlier dispersion. This statistically robust performance indicates that the learned policy is not overfitted to specific environmental conditions, but rather generalizes effectively to unseen, climate-variant grid states. Such robustness is a direct outcome of the modular co-simulation training framework, which exposes the agent to stochasticity and temporal shifts in renewable generation and demand. These findings affirm the controller’s capacity to sustain high resilience under real-world weather anomalies, making it suitable for deployment in climate-vulnerable energy systems.

7.12. Bus-Wise Voltage Violation Frequency

Identifying spatially localized vulnerabilities within a distribution network is critical for implementing targeted reinforcement strategies and improving overall grid resilience. Figure 16 presents the frequency of voltage violations recorded at each bus over the 24 h simulation horizon under climate-influenced load and generation dynamics.
The results indicate that buses located at the terminal ends of radial feeders and those with relatively high line impedances experience the most frequent deviations from the acceptable voltage range (typically [0.95, 1.05] p.u.). These localized instabilities are attributed to voltage drop propagation effects, inadequate reactive power compensation, and distance from major DER hubs. Such spatial patterns offer actionable insights for utility operators. Buses exhibiting recurrent violations are prime candidates for localized infrastructure upgrades, including the deployment of voltage regulators, capacitor banks, or strategically sited distributed energy resources (DERs). Additionally, network reconfiguration or re-phasing may be considered to alleviate congestion and improve voltage stability. This form of spatially resolved vulnerability analysis supports climate-adaptive planning and aligns with grid modernization goals under evolving reliability and resilience mandates.

7.13. Performance Evaluation

To place the proposed framework in context, it is important to benchmark its computational efficiency against established optimization and control approaches. Computational complexity provides a theoretical measure of scalability, while runtime per episode offers practical insight into feasibility for real-time applications.
As shown in Table 3, the proposed DDPG framework achieves substantially lower runtime per episode compared to traditional GA, PSO, and MPC approaches while maintaining a favorable computational complexity due to its actor–critic inference structure.
The proposed method achieves significant runtime reduction by shifting the computational burden to the offline training stage. Once trained, the actor network executes decisions with sub-millisecond latency per step, resulting in overall simulation runtimes far lower than iterative optimization methods. This efficiency is critical for scalability to larger distribution grids.
Scalability Validation: To test scalability, additional simulations were performed with doubled network size (by replicating the IEEE 33-bus feeder into a 66-bus equivalent). Results indicate that the DDPG training time increased approximately linearly with system size, yet inference latency remained below 10 ms per timestep. This confirms that while training is computationally intensive, the deployment stage remains feasible for larger grids. Moreover, memory requirements scale with the size of the replay buffer rather than directly with the number of buses, making the approach suitable for distribution networks of practical scale.

7.14. Discussion of System-Wide Impact

The simulation results reveal several system-level benefits stemming from the integration of AI-driven digital twins within climate-adaptive power grid operations. Key insights are summarized as follows:
  • Voltage Stability: The AI controller consistently maintains nodal voltages within regulatory thresholds (e.g., IEEE 1547, EN 50160), thereby reducing equipment stress and enhancing asset longevity through improved voltage quality and transient suppression.
  • Energy Efficiency: Through real-time optimization of DER dispatch and battery cycling, the framework significantly reduces active power losses. This improvement not only enhances network efficiency but also creates technical headroom for increased renewable hosting capacity without necessitating major infrastructure upgrades.
  • AI Learning Robustness: Convergence patterns in cumulative reward trajectories validate that the reinforcement learning agent learns stable, generalizable policies under a range of stochastic climate scenarios. This confirms the viability of climate-aware AI for long-term autonomous grid control.
  • Operational Resilience: The system demonstrates accelerated recovery from voltage disturbances and supply–demand mismatches during extreme weather conditions. This characteristic positions the proposed framework as a viable tool for national adaptation strategies under evolving climate risk profiles.
Collectively, these findings underscore the transformative potential of AI-integrated digital twins as proactive, self-optimizing control agents for future smart grids. Beyond technical performance, the framework aligns with strategic objectives of regulatory compliance, decarbonization, cost containment, and infrastructure resilience, making it well suited for deployment in both developed and climate-vulnerable regions.
Comparison with Existing Methods: To further validate the contribution, the proposed DDPG-based controller was compared with baseline optimization methods (GA, PSO) and a control-oriented benchmark (MPC). As shown in Table 3, the proposed approach achieves significantly lower runtime per episode (18 s vs. 60–120 s for optimization-based methods). In terms of voltage deviation minimization, DDPG outperformed GA and PSO by 12–15% while achieving comparable performance to MPC but at a fraction of the runtime. These results confirm that reinforcement learning provides a practical balance between computational scalability and control quality. Unlike optimization methods, which must be solved anew for each scenario, the trained RL agent generalizes across different climate disturbances, making it particularly well suited for real-time climate-adaptive grid management.

7.15. Sensitivity Analysis

To assess robustness, a sensitivity study was conducted on two dimensions: (i) reward weight selection ( λ 1 , λ 2 , λ 3 , λ 4 ) , and (ii) climate variability severity. For reward weights, ± 20 % perturbations were applied around the tuned values. Voltage deviation and loss minimization performance varied by less than 7%, indicating stable controller behavior. For climate inputs, synthetic disturbances (e.g., intensified heatwaves, low-irradiance storms) were injected. The DDPG agent maintained effective operation, with only minor increases in curtailment (under 5%). These findings demonstrate that the proposed framework is resilient to parameter uncertainty and extreme climate perturbations.

8. Conclusions and Future Work

This paper proposed and validated an AI-integrated digital twin co-simulation framework for climate-adaptive control in renewable rich distribution networks. The framework combines reinforcement learning with a modular, physics-informed co-simulation environment to dynamically coordinate distributed energy resources (DERs), battery energy storage systems (BESSs), and load-side flexibility in response to climate-induced grid stress.
The results confirm that the proposed architecture achieves:
  • Significant improvements in voltage stability, with a reduction in both frequency and severity of nodal violations;
  • Lower active power losses and enhanced energy efficiency through optimal dispatch of DERs and storage units;
  • Strong policy generalization across diverse climate perturbation scenarios, with median resilience scores consistently exceeding 0.85;
  • System-wide resilience enhancements, including reduced load shedding, faster disturbance recovery, and improved operational continuity.
Beyond technical performance, the framework supports regulatory compliance, expansion of DER hosting capacity, and long-term infrastructure resilience. These attributes underscore its relevance to utilities and policymakers seeking robust solutions to escalating climate uncertainties.

Limitations and Future Work

Future research will pursue several directions to strengthen the capabilities and practical adoption of the proposed framework:
  • Hardware-in-the-Loop (HIL) Integration: Coupling the digital twin with real-time simulation platforms or physical testbeds to validate control performance under hardware and communication constraints.
  • Multi-Agent Reinforcement Learning (MARL): Extending the single-agent design to distributed multi-agent settings, enabling localized intelligence and peer-to-peer coordination among grid-edge assets.
  • Cybersecurity Co-Design: Embedding trust-aware AI agents and blockchain-based protocols to secure the control pipeline against spoofing, tampering, and adversarial attacks.
  • Socio-Technical Metrics: Incorporating equity, vulnerability, and community acceptance into the reward function to align reinforcement learning decisions with principles of climate justice and social resilience.
  • Scalability Assessment: Evaluating the framework across multiple feeders and interconnected microgrids to establish its tractability and economic feasibility at scale.
Several limitations must also be acknowledged. Training the DDPG agent requires substantial computational resources, as each episode entails full-day simulations across climate and grid states. While convergence was achieved within a reasonable number of episodes (2000), scaling to larger systems or higher-resolution simulations would markedly increase training cost and memory demands. Furthermore, the transferability of models trained in simulation to real-world systems remains an open challenge, requiring domain randomization or transfer learning. Finally, HIL experiments and distributed training strategies are essential to ensure scalability and feasibility for national-scale grid deployments. Addressing these limitations represents a critical avenue for advancing the readiness of AI-powered digital twin controllers in next-generation sustainable energy systems.

Author Contributions

Writing—original draft, K.A.; Supervision, M.K. and E.E.O. All authors have read and agreed to the published version of the manuscript.

Funding

This research received no external funding.

Data Availability Statement

The original contributions presented in this study are included in the article. Further inquiries can be directed to the corresponding author.

Conflicts of Interest

The authors declare no conflicts of interest.

References

  1. Zlateva, P.; Hadjitodorov, S. An Approach for Analysis of Critical Infrastructure Vulnerability to Climate Hazards. IOP Conf. Ser. Earth Environ. Sci. 2022, 1094, 012004. [Google Scholar] [CrossRef]
  2. Ho, C.K.; Roesler, E.L.; Nguyen, T.A.; Ellison, J. Potential Impacts of Climate Change on Renewable Energy and Storage Requirements for Grid Reliability and Resource Adequacy. J. Energy Resour. Technol. Trans. ASME 2023, 145, 100904. [Google Scholar] [CrossRef]
  3. Ali, A.M.; Shaaban, M.F.; Sindi, H. Optimal Operational Planning of RES and HESS in Smart Grids Considering Demand Response and DSTATCOM Functionality of the Interfacing Inverters. Sustainability 2022, 14, 13209. [Google Scholar] [CrossRef]
  4. Younis, A.; Benders, R.M.J.; Ramírez, J.; de Wolf, M.; Faaij, A. Scrutinizing the Intermittency of Renewable Energy in a Long-Term Planning Model via Combining Direct Integration and Soft-Linking Methods for Colombia’s Power System. Energies 2022, 15, 7604. [Google Scholar] [CrossRef]
  5. Fernandes, S.V.; Joao, D.V.; Cardoso, B.B.; Martins, M.A.I.; Carvalho, E.G. Digital Twin Concept Developing on an Electrical Distribution System—An Application Case. Energies 2022, 15, 2836. [Google Scholar] [CrossRef]
  6. Chalal, L.; Saadane, A.; Rachid, A. Unified Environment for Real Time Control of Hybrid Energy System Using Digital Twin and IoT Approach. Sensors 2023, 23, 5646. [Google Scholar] [CrossRef] [PubMed]
  7. Benchekroun, A.; Davigny, A.; Hassam-Ouari, K.; Courtecuisse, V.; Robyns, B. Grid-Aware Energy Management System for Distribution Grids Based on a Co-Simulation Approach. IEEE Trans. Power Deliv. 2023, 38, 3571–3581. [Google Scholar] [CrossRef]
  8. Qi, Y.; Li, J. The Wind and Photovoltaic Power Forecasting Method Based on Digital Twins. Appl. Sci. 2023, 13, 8374. [Google Scholar] [CrossRef]
  9. Chen, H.; Zhang, Z.; Karamanakos, P.; Rodriguez, J. Digital Twin Techniques for Power Electronics-Based Energy Conversion Systems: A Survey of Concepts, Application Scenarios, Future Challenges, and Trends. IEEE Ind. Electron. Mag. 2023, 17, 20–36. [Google Scholar] [CrossRef]
  10. Song, Z.; Hackl, C.M.; Anand, A.; Thommessen, A.; Petzschmann, J.; Kamel, O.Z.; Braunbehrens, R.; Kaifel, A.K.; Roos, C.; Hauptmann, S. Digital Twins for the Future Power System: An Overview and a Future Perspective. Sustainability 2023, 15, 5259. [Google Scholar] [CrossRef]
  11. Mahankali, R. Digital Twins and Enterprise Architecture: A Framework for Real-Time Manufacturing Decision Support. Int. J. Comput. Eng. Technol. 2025, 16, 578–587. [Google Scholar] [CrossRef]
  12. Han, J.; Hong, Q.; Syed, M.H.; Khan, M.A.U.; Yang, G.; Burt, G.; Booth, C. Cloud-Edge Hosted Digital Twins for Coordinated Control of Distributed Energy Resources. IEEE Trans. Cloud Comput. 2023, 11, 1242–1256. [Google Scholar] [CrossRef]
  13. Yang, Y.; Javanroodi, K.; Nik, V.M. Climate Change and Renewable Energy Generation in Europe—Long-Term Impact Assessment on Solar and Wind Energy Using High-Resolution Future Climate Data and Considering Climate Uncertainties. Energies 2022, 15, 302. [Google Scholar] [CrossRef]
  14. Webster, M.; Fisher-Vanden, K.; Kumar, V.; Lammers, R.B.; Perla, J.M. Integrated Hydrological, Power System and Economic Modelling of Climate Impacts on Electricity Demand and Cost. Nat. Energy 2022, 7, 163–169. [Google Scholar] [CrossRef]
  15. Chreng, K.; Lee, H.S.; Tuy, S. A Hybrid Model for Electricity Demand Forecast Using Improved Ensemble Empirical Mode Decomposition and Recurrent Neural Networks with ERA5 Climate Variables. Energies 2022, 15, 7434. [Google Scholar] [CrossRef]
  16. Salehimehr, S.; Taheri, B.; Sedighizadeh, M. Short-Term Load Forecasting in Smart Grids Using Artificial Intelligence Methods: A Survey. J. Eng. 2022, 2022, 1133–1142. [Google Scholar] [CrossRef]
  17. Barwar, S. Artificial Intelligence Application to Flexibility Provision in Energy Management System: A Survey. In EAI/Springer Innovations in Communication and Computing; Springer: Berlin/Heidelberg, Germany, 2023; pp. 55–78. [Google Scholar] [CrossRef]
  18. Liu, Y.; Lu, Q.; Yu, Z.; Chen, Y.; Yang, Y. Reinforcement Learning-Enhanced Adaptive Scheduling of Battery Energy Storage Systems in Energy Markets. Energies 2024, 17, 5425. [Google Scholar] [CrossRef]
  19. Shojaeighadikolaei, A.; Ghasemi, A.; Jones, K.R.; Dafalla, Y.M.; Bardas, A.G.; Ahmadi, R.; Hashemi, M. Distributed Energy Management and Demand Response in Smart Grids: A Multi-Agent Deep Reinforcement Learning Framework. arXiv 2022, arXiv:2211.15858. [Google Scholar] [CrossRef]
  20. Abdoune, F.; Nouiri, M.; Cardin, O.; Castagna, P. Integration of Artificial Intelligence in the Life Cycle of Industrial Digital Twins. Adv. Control Optim. Dyn. Syst. 2022, 55, 2545–2550. [Google Scholar] [CrossRef]
  21. Barbierato, L.; Mazzarino, P.R.; Montarolo, M.; Macii, A.; Patti, E.; Bottaccioli, L. A Comparison Study of Co-Simulation Frameworks for Multi-Energy Systems: The Scalability Problem. Energy Inform. 2022, 5, 53. [Google Scholar] [CrossRef]
  22. Barbierato, L.; Pons, E.; Bompard, E.F.; Rajkumar, V.S.; Palensky, P.; Bottaccioli, L.; Patti, E. Exploring Stability and Accuracy Limits of Distributed Real-Time Power System Simulations via System-of-Systems Cosimulation. IEEE Syst. J. 2023, 17, 3354–3365. [Google Scholar] [CrossRef]
  23. Pham, L.N.H.; Wagle, R.; Tricarico, G.; Melo, A.F.S.; Rosero-Morillo, V.A.; Shukla, A.; Gonzalez-Longatt, F. Real-Time Cyber-Physical Power System Testbed for Optimal Power Flow Study Using Co-Simulation Framework. IEEE Access 2024, 12, 150914–150929. [Google Scholar] [CrossRef]
  24. Værbak, M.; Billanes, J.D.; Jørgensen, B. A Digital Twin Framework for Simulating Distributed Energy Resources in Distribution Grids. Energies 2024, 17, 2503. [Google Scholar] [CrossRef]
  25. Ye, Y.; Papadaskalopoulos, D.; Yuan, Q.; Tang, Y.; Strbac, G. Multi-Agent Deep Reinforcement Learning for Coordinated Energy Trading and Flexibility Services Provision in Local Electricity Markets. IEEE Trans. Smart Grid 2023, 14, 1541–1554. [Google Scholar] [CrossRef]
  26. Gligor, A.; Dumitru, C.D.; Dziţac, S.; Simó, A. Augmented Cyber-physical Model for Real-time Smart-grid Co-simulation. Int. J. Comput. Commun. Control 2025, 20. [Google Scholar] [CrossRef]
  27. Alahmadi, A.; Barri, A.; Aldhahri, R.; Elhag, S. AI Driven Approaches in Swarm Robotics—A Review. Int. J. Comput. Inform. 2024, 3, 100–133. [Google Scholar] [CrossRef]
  28. Zhou, G.; Tian, W.; Buyya, R.; Xue, R.; Song, L. Deep Reinforcement Learning-Based Methods for Resource Scheduling in Cloud Computing: A Review and Future Directions. Artif. Intell. Rev. 2024, 57, 124. [Google Scholar] [CrossRef]
  29. Yu, Q.; Ketzler, G.; Mills, G.; Leuchner, M. Exploring the Integration of Urban Climate Models and Urban Building Energy Models through Shared Databases: A Review. Theor. Appl. Climatol. 2025, 156, 266. [Google Scholar] [CrossRef]
  30. Zhu, C.; Yang, J.; Zhang, W.; Zheng, Y. An Algorithm that Excavates Suboptimal States and Improves Q-learning. Eng. Res. Express 2024, 6, 4. [Google Scholar] [CrossRef]
  31. Wang, H.; Yuan, X.; Ren, Q. Learning to Recover for Safe Reinforcement Learning. arXiv 2023, arXiv:2309.11907. [Google Scholar] [CrossRef]
  32. Ebrie, A.S.; Kim, Y.J. Reinforcement Learning-Based Multi-Objective Optimization for Generation Scheduling in Power Systems. Systems 2024, 12, 106. [Google Scholar] [CrossRef]
  33. Tulger Kara, G.; Elbir, T. Evaluation of ERA5 and MERRA-2 Reanalysis Datasets over the Aegean Region, Türkiye. Fen-MüHendislik Derg. 2024, 26, 9–21. [Google Scholar] [CrossRef]
  34. IEEE Std 1547-2018 (Revision of IEEE Std 1547-2003); IEEE Standard for Interconnection and Interoperability of Distributed Energy Resources with Associated Electric Power Systems Interfaces. IEEE: New York, NY, USA, 2018; pp. 1–138. [CrossRef]
  35. EN 50160; Voltage Characteristics of Electricity Supplied by Public Distribution Systems. European Committee for Electrotechnical Standardization (CENELEC): Brussels, Belgium, 2010.
Figure 1. AI-integrated co-simulation framework connecting physical grid, climate forecasts, and digital twin for adaptive decision-making.
Energies 18 05593 g001
Figure 2. Modular AI-integrated co-simulation workflow for climate-adaptive grid operation.
Energies 18 05593 g002
Figure 3. IEEE 33-bus radial distribution network with DER placements at Bus 6 (PV), Bus 18 (Wind), and Bus 30 (Battery). The schematic highlights the feeder topology and integration points for renewable and storage resources.
Energies 18 05593 g003
Figure 4. Experimental co-simulation setup using HELICS middleware, with separate federates for AI agent, power system solver, and climate engine.
Energies 18 05593 g004
Figure 5. Voltage profile at Bus 18 over a 24 h horizon. The AI-controlled case demonstrates superior regulation within the prescribed bounds of [0.95, 1.05] p.u.
Energies 18 05593 g005
Figure 6. Temporal evolution of total active power loss over 24 h. The AI-enhanced system demonstrates improved dispatch efficiency, resulting in consistently lower network losses.
Energies 18 05593 g006
Figure 7. Cumulative reward progression of the DRL agent during training. Policy convergence is achieved after sufficient exploration–exploitation balance.
Energies 18 05593 g007
Figure 8. Resilience scores under climate-driven volatility. The AI-coordinated system exhibits superior recoverability from voltage and supply disruptions.
Energies 18 05593 g008
Figure 9. Real-time DER dispatch profiles under AI control. The battery dynamically charges during solar surplus and discharges during high-demand periods.
Energies 18 05593 g009
Figure 10. Time-series of load curtailment events. The AI-controlled strategy significantly reduces the frequency and severity of load shedding.
Energies 18 05593 g010
Figure 11. Pareto front illustrating the trade-off between total energy loss and system resilience. Each point corresponds to a non-dominated AI policy derived from alternative reward configurations.
Energies 18 05593 g011
Figure 12. Histogram of voltage violations per simulation timestep. AI coordination significantly reduces out-of-bound voltage events, especially during high-stress intervals.
Energies 18 05593 g012
Figure 13. Spatiotemporal heatmap of voltage profiles across the distribution network. The AI-coordinated system maintains consistent voltage levels across buses and time.
Energies 18 05593 g013
Figure 14. State of charge (SOC) trajectory of the battery energy storage system (BESS). The AI agent dispatches the battery to mitigate voltage violations and balance net load.
Energies 18 05593 g014
Figure 15. Resilience score distribution across 10 climate-perturbed scenarios. The AI policy maintains high stability and generalization under diverse operating conditions.
Energies 18 05593 g015
Figure 16. Frequency of voltage violations by bus index. Elevated violations are observed at weakly supported nodes, particularly at radial extremities.
Energies 18 05593 g016
Table 1. Bus Data for the IEEE 33-Bus Distribution Network.
Bus IDBus TypeConnected Load (kW)DER Placement
1Slack/Substation0None
6PQ Bus210PV Unit
18PQ Bus160Wind Turbine
30PQ Bus150Battery Storage
Others (2–33)PQ Buses50–200 (varies)None
Table 2. Simulation Parameters for the AI-Integrated Co-Simulation Framework.
Parameter CategoryValue/Description
Grid and Network
Test SystemIEEE 33-Bus Radial Distribution Network
Voltage Level12.66 kV (Base), 100 MVA
Simulation Duration24 h (one episode)
Time Resolution ( Δ t )15 min (96 timesteps/day)
Distributed Energy Resources (DERs)
PV System LocationBus 6
Wind Turbine LocationBus 18
Battery Storage LocationBus 30
PV Efficiency ( η )18%
PV Area (A)50 m2
Wind Cut-in/Rated/Cut-out Speeds3 m/s, 12 m/s, 20 m/s
Battery Capacity150 kWh, 50 kW inverter rating
Climate Input
SourceERA5 Reanalysis Dataset (2018–2023)
VariablesTemperature, Wind Speed, Irradiance, Precipitation
Disturbance InjectionHeatwaves, Wind Lulls, Overcast Storms
AI Model (DDPG)
Actor Network2 Hidden Layers [128, 128], ReLU
Critic Network2 Hidden Layers [128, 128], ReLU
Learning Rate (Actor–Critic) 10 4 / 10 3
Discount Factor ( γ )0.99
Exploration NoiseOrnstein–Uhlenbeck ( θ = 0.15 )
Replay Buffer Size 10 5 transitions
Training Episodes2000
Batch Size64
Simulation Tools and Platform
Power Flow SolverOpenDSS via Python-DSS
AI FrameworkPyTorch (Python 3.10)
Co-Simulation MiddlewareHELICS v3.1.0
Operating SystemUbuntu 22.04 LTS
HardwareIntel Xeon 16-core, 64 GB RAM
Table 3. Computational complexity and runtime comparison with baseline methods.
MethodComplexityRuntime/EpisodeNotes
Genetic Algorithm (GA) O ( n p o p · n g e n ) 120 sIterative, population–generation cost
Particle Swarm Opt. (PSO) O ( n p a r t · n i t e r ) 95 sSensitive to swarm size
Model Predictive Control (MPC) O ( n 3 ) 60 sMatrix optimization overhead
Proposed DDPG O ( d 2 ) 18 sActor–critic inference
Disclaimer/Publisher’s Note: The statements, opinions and data contained in all publications are solely those of the individual author(s) and contributor(s) and not of MDPI and/or the editor(s). MDPI and/or the editor(s) disclaim responsibility for any injury to people or property resulting from any ideas, methods, instructions or products referred to in the content.