Abstract
To investigate the three-dimensional spatial distribution characteristics of fluids during the combined production of coalbed methane from multi-coal reservoirs (MCR), a physical simulation test platform was established, and a quantitative characterization parameter calculation principle for fluid migration was developed. The influence of fluid pressure difference and in situ stress difference on the three-dimensional spatial distribution of fluids and their quantitative characterization parameters was analyzed. The results indicate that the dynamic pressure equilibrium between the coal reservoir and the wellbore forces fluids from high-pressure reservoirs to intrude into low-pressure reservoirs, altering the flow state of fluids in the latter. Consequently, the relative flow velocity in the low-pressure reservoir becomes negative, with the relative deflection angle approaching 180°, while the relative flow velocity in the high-pressure reservoir remains positive. An increase in the relative flow rate of 0.08 and 0.007 corresponds to a 1 MPa increase in fluid pressure difference and geostress difference, respectively. During the co-production of coalbed methane from MCR, the existing pressure difference and in situ stress difference between reservoirs modify the fluid migration patterns, leading to fluid interaction and interference effects. This results in centrifugal flow patterns in low-pressure reservoirs and centripetal flow patterns in high-pressure reservoirs. Compared to in situ stress difference, the fluid pressure difference exerts a more significant influence on the fluid migration patterns.
1. Introduction
Coal reservoirs are heterogeneous porous media that exhibit strong adsorption of multiphase fluids, including gas, water, and coal particles, severely restricting the efficient production of coalbed methane [1,2,3]. To maximize the effective extraction of coalbed methane from these reservoirs, understanding the fluid migration dynamics within the reservoir is critical. These efforts are also vital for optimizing the national energy structure, safeguarding the ecological environment, and advancing national carbon peak and carbon neutrality targets [4,5,6,7,8]. Currently, researchers focus on two primary areas: first, examining fluid migration patterns during coalbed methane production from a single reservoir; second, investigating the fluid migration dynamics during simultaneous extraction from MCR.
Fluid migration in single-coal seam coalbed methane production has been studied by several researchers. Tang et al. [9] conducted coal rock seepage experiments under constant external and gas pressures using a gas-bearing coal thermos–hydro–mechanical triaxial servo seepage device, establishing a permeability model that accounts for slippage effects. Meng et al. [10] systematically analyzed coalbed methane seepage behavior under varying in situ stresses, coal seam pressures, and temperatures, developed a permeability model incorporating these factors, and elucidated coal permeability mechanisms under multi-field conditions. Zeng et al. [11] highlighted that water competes with methane for adsorption sites, reducing coal’s effective methane adsorption capacity, with the impact of water on methane desorption varying with temperature and pressure. Li et al. [12] investigated the influence of floating oil water on methane adsorption characteristics of coal from different regions using isothermal adsorption experiments and molecular simulation. Lin et al. [13] utilized molecular dynamics simulations to study methane–water two-phase flow in coal seams at the micro-level, quantifying the effects of initial water film thickness, pore size, reservoir pressure difference, and porosity on WBE intensity. Arif et al. [14] found that coal’s CO2 wettability increases with pressure and salinity (independent of rank) but decreases with temperature. Qian et al. [15] examined the spatio-temporal evolution, energy characteristics, volumetric properties, and fracture network development of microseismic samples during hydraulic fracturing. Kumar et al. [16] reported that pore surface roughness in coal is comparable to or slightly exceeds that in shale, and that total organic carbon and mineral composition in both have minimal impact on pore connectivity. Dong et al. [17] performed CH4 adsorption–desorption and low-temperature liquid nitrogen experiments on a single reservoir. Wang et al. [18] observed that bituminous coal exhibits superior pore conductivity and hydrophilicity; methane passes easily through pores in bituminous coal with non-adsorbed water, whereas anthracite is susceptible to water blockage and Jamin effects. Massarotto et al. [19] noted that rapid high-pressure fluid flow in coal reservoirs can block fractures and pores near the wellbore in high-pressure drop zones, reducing permeability and gas/water production rates. Amani et al. [20] studied gas–liquid–solid flow by injecting foaming agents and residual gas into coal wellbores. Ma et al. [21] simulated binary gas diffusion in shale and coal nanoporous media, noting coal’s higher adsorption capacity and more pronounced surface diffusion compared to shale.
MCR coalbed methane co-production differs fundamentally from single-seam coalbed methane production. Significant differences in reservoir properties, particularly large disparities in fluid pressure and in situ stress between seams, can lead to operational incompatibility, impeding fluid migration. Based on logging data including lithology, breakthrough pressure, and gas content, Zhao et al. [22] delineated three distinct fluid pressure systems within the coal measures of the study area. Li et al. [22,23] conducted large-scale physical simulations of coalbed methane co-production, analyzing fluid flow patterns and their spatiotemporal distribution characteristics. Wang et al. [24] simulated MCR coalbed methane co-production using parallel cylindrical coal samples to analyze the production contribution rate and energy response characteristics. They later employed numerical simulations [25] to reveal the influence of fluid interference on fluid distribution within the reservoirs and wellbores. Jia et al. [26] developed an experimental system for coupled control of fluid migration involving MCR and wellbores. Shen et al. [27], based on logging data analysis, identified coal-measure mudstones exhibiting “four highs and two lows” characteristics as critical barrier layers for gas and water isolation in MCR. Chen et al. [28] established a novel mathematical model to assess the compatibility of MCR coalbed methane co-production and the intensity of fluid interference. Guo et al. [29], utilizing their self-developed experimental apparatus, conducted physical simulations of coalbed methane co-production under varying permeability and fluid pressure conditions, analyzing fluid distribution patterns and interference mechanisms. Zeng et al. [30] investigated the effects of temperature variations in coal reservoirs on fluid migration and accumulation behavior.
In summary, while significant research exists on fluid migration within coal reservoirs, studies specifically addressing the 3D visualization, spatial distribution patterns, and quantitative characterization of fluid migration pathways during MCR coalbed methane co-production remain limited. To address this gap, this study employs a self-developed large-scale physical simulation system to model the complete co-production process under varying fluid pressure and in situ stress conditions. We introduce a 3D visualization technique for fluid migration and establish mathematical models for quantitative parameter calculation. Our findings elucidate the 3D spatial distribution of fluids and the underlying mechanisms of fluid interference in MCR coalbed methane co-production scenarios.
2. 3D Monitoring Methodology for Fluid Migration Dynamics in MCR
2.1. Experimental Setup and Procedure
The experimental setup used in this study is illustrated in Figure 1. It comprises a MCR forming system, an experimental control and data acquisition system, a wellbore management simulation system, a reservoir simulation system, a true triaxial loading and servo control system, a gas injection and adsorption system, a vacuum extraction system, and several other subsystems. Further details on the system’s functionality and configuration are provided in the references [26].
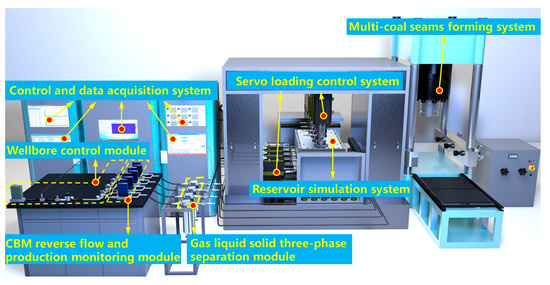
Figure 1.
Experimental setup for MCR coalbed methane co-production.
The MCR in this study comprises four coal seams, designated as coal seam I, II, III, and IV. Two experimental groups, Group A and Group B, were designed (Table 1). Group A varied the fluid pressure difference, with three experiments performed. Group B varied the in situ stress difference, also with three experiments performed. Details are provided below.

Table 1.
Experimental plan.
(1) In Group A’s experimental scheme, the in situ stresses in different directions were held constant, while the fluid pressure difference (∆p) was varied. The maximum horizontal principal stresses for Coal Seams I, II, III, and IV were set to σH1 = 3.5 MPa, σH2 = 3.9 MPa, σH3 = 4.3 MPa, and σH4 = 4.7 MPa, respectively. The minimum horizontal principal stresses were set to σh1 = 2.5 MPa, σh2 = 2.8 MPa, σh3 = 3.1 MPa, and σh4 = 3.4 MPa, respectively. The intermediate principal stress was fixed at σV = 3.2 MPa. The fluid pressure difference was increased from a base value by 0.2 MPa, 0.4 MPa, and 0.6 MPa, resulting in three experiments with fluid pressure differences of ∆p = 0.2 MPa, ∆p = 0.4 MPa, and ∆p = 0.6 MPa;
(2) In Group B, the fluid pressure difference was kept constant, while the in situ stress difference (∆σ) was varied. The fluid pressures for Coal Seams I, II, III, and IV were set at 1.0 MPa, 1.4 MPa, 1.8 MPa, and 2.2 MPa, respectively. For the maximum horizontal principal stress, the base value was 3.5 MPa, increased by 0.4 MPa, 0.8 MPa, and 1.2 MPa in three experiments. For the minimum horizontal principal stress, the base value was 2.5 MPa, increased by 0.3 MPa, 0.6 MPa, and 1.9 MPa in three experiments. The intermediate principal stress was maintained at 3.2 MPa.
Experimental Procedure: (1) The vacuum pump was activated to reduce the internal pressure of the MCR; (2) sequentially, the gas inlet valves were opened for the four coal seams to introduce gas for adsorption; (3) the flowmeter was adjusted to maintain a constant gas production rate of 16 L∙min−1 from the wellbore; (4) simultaneously, the gas outlet valves were opened for all four coal seams to enable synchronized gas production.
2.2. 3D Measurement of Fluid Pressure Data
Fluid pressure data were measured using sensors. In this study, the GB-Y-J6M model sensor was employed, featuring a measurement range of −0.1 to 6 MPa and an accuracy of ±0.25% F.S. (Full Scale). By deploying these sensors at various spatial locations within the coal reservoir, electrical signals were converted into digital signals, thus obtaining internal fluid pressure data. Sensors were calibrated prior to use. Calibration was performed relative to fluid pressure, with atmospheric pressure corresponding to 0 MPa. To enable three-dimensional acquisition of fluid pressure data, a right-handed Cartesian coordinate system was established. The origin of this system is the lower-left corner of the MCR, with the reservoir’s length, width, and height aligned with the Z, Y, and X axes, respectively. The spatial distribution of the sensors is depicted in Figure 2b. Here, yellow cylinders denote the connection segments of branch horizontal wells, while green cylinders represent the permeable segments. Sensors were deployed around the production pipe, with 10 sensors per coal seam. The spatial arrangement of coal seams and branch horizontal wells is illustrated in Figure 2a, and the sensor arrangement principle is shown in Figure 2b.
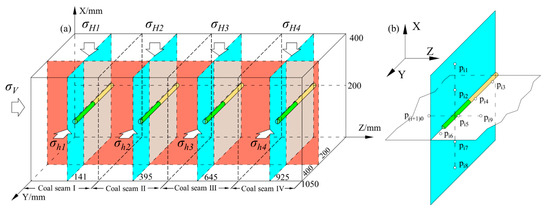
Figure 2.
Schematic of 3D fluid pressure data acquisition. (a) Coal seam spatial location; (b) Sensor spatial location.
3. 3D Visualization and Quantitative Characterization of Fluid Migration
3.1. 3D Visualization of Fluid Migration
To visualize the three-dimensional flow characteristics of the fluid, a three-dimensional visualization of fluid migration was performed. The specific steps are as follows:
- Save data: Store the fluid pressure data collected by the sensors in an Excel file;
- Establish database: Create a database ‘data’ containing the sensor coordinates (see Figure 2b) and the fluid pressure values;
- Read data: Use the xlsread function in Matlab R2022a to read the target data from the ‘data’ database;
- Divide grid: Perform grid division using the linspace function;
- Interpolate data: Use the griddata function to interpolate the limited experimental fluid pressure data;
- Plot flow field: Generate a 3D vector plot of the flow field using the quiver (x, y, z, u, v, w) command. The vector arrows represent vectors (u, v, w) originating from the sensor location (x, y, z), where u, v, and w are the reservoir pressure differences between adjacent measurement points in the X, Y, and Z directions, respectively.
- Plot isobars: Use the contour function to plot isobars.
These seven steps enable the 3D visualization of fluid migration.
3.2. Quantitative Characterization of Fluid Migration Pathways
Although 3D flow visualization of the reservoir fluid has been achieved, the study of fluid flow characteristics is still limited to observing and qualitatively analyzing flow patterns, necessitating further quantitative research. To this end, two quantitative parameters for fluid migration are proposed: relative flow velocity vf and relative deflection angle βf. During coalbed methane co-production, fluid interference effects disturb both flow velocity and direction, leading to a complex flow state. According to Darcy’s law, fluid flow velocity is linearly related to the pressure gradient, i.e.:
In this equation, vx, vy, and vz denote the velocity components along different directions; k denotes the reservoir permeability; μ denotes the coalbed methane viscosity; and p denotes the fluid pressure.
Since reservoir permeability during coalbed methane co-production cannot be directly measured by sensors, assumptions and mathematical models are typically required for indirect calculation. This study adopts the relative permeability model developed under triaxial stress conditions [31], i.e.:
Combining Equations (1)–(4) yields the relative velocity components in different directions:
Combining Equations (5)–(7) yields the relative fluid flow velocity vf affected by fluid interference effects:
Fluid flow deviates from the ideal path by an angle γ due to fluid interference effects and other factors, as shown in Figure 3.
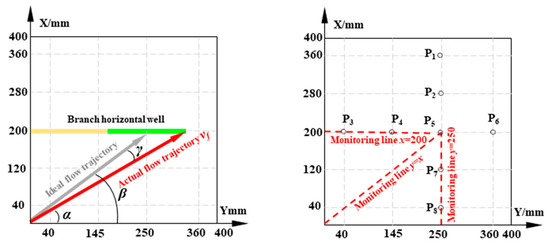
Figure 3.
Schematic of relative deflection angle calculation and data monitoring line layout.
Here, α denotes the angle between the actual flow path and the Y-axis and β denotes the angle between the optimal flow path trend line and the Y-axis.
As shown in Figure 3, to study the variation of reservoir fluid flow parameters, three monitoring lines were set at x = 200, y = 250, and y = x. The relative flow velocity and relative deflection angle at each point on these lines were calculated using Equations (8) and (10).
4. 3D Spatial Distribution of Fluid and Response Characteristics of Its Quantitative Characterization Parameters
4.1. 3D Spatial Distribution of Fluid and Characteristic Parameter Response
Figure 4 presents the 3D flow characteristics of fluid in coal seams I-IV during coalbed methane co-production in the MCR. At t = 0 min, the fluid in seams I-IV was in dynamic equilibrium with no flow. At t = 4 min, fluid in seams II-IV displayed convergent flow, with velocity vectors pointing towards the branched horizontal well center; flow velocity was inversely related to distance from the well center. Analysis indicates that a pressure potential between the reservoir and wellbore drives near-well fluid towards the well first, while far-well fluid moves slower due to a smaller pressure drop. At t = 4 min, seam I fluid reversed, showing divergent flow with near-well vectors pointing into the reservoir.
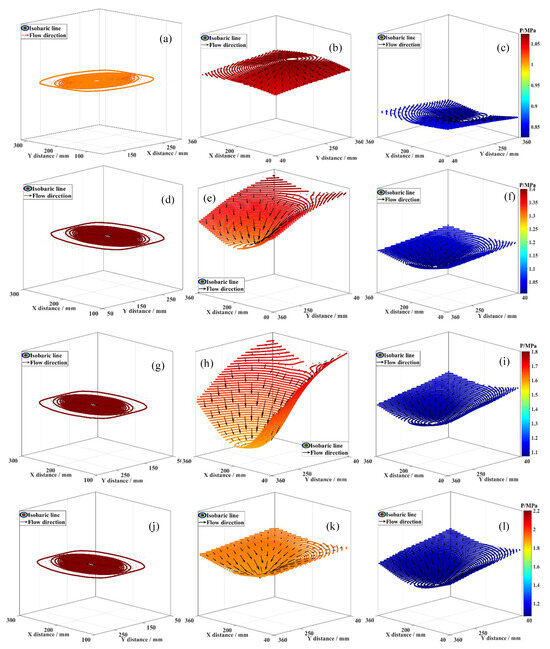
Figure 4.
3D fluid flow characteristics. (a) Coal seam I, t = 0 min; (b) Coal seam I, t = 4 min; (c) Coal seam I, t = 44 min; (d) Coal seam II, t = 0 min; (e) Coal seam II, t = 4 min; (f) Coal seam II, t = 44 min; (g) Coal seam III, t = 0 min; (h) Coal seam III, t = 4 min; (i) Coal seam III, t = 44 min; (j) Coal seam IV, t = 0 min; (k) Coal seam IV, t = 4 min; (l) Coal seam IV, t = 44 min.
This results from pressure equilibrium forcing high-pressure fluid into the low-pressure seam, causing flow towards the reservoir interior and divergent patterns, suggesting low-pressure reservoirs are more sensitive to fluid interference than high-pressure ones. Fluid interference can suppress the production of coalbed methane in low-pressure reservoirs, leading to low efficiency in coalbed methane co-production in MCR. By t = 44 min, all seams I-IV exhibited high-pressure reservoir-like convergent flow. Thus, during MCR coalbed methane co-production, fluid interference occurs, affecting near-well fluid migration more than far-well, and this effect diminishes over time as divergent flow transitions to convergent.
Figure 5 illustrates the evolution of fluid flow characteristic parameters along the y = 120 and 4y = 5x monitoring lines within Seam I at t = 4 min and t = 44 min, under a fluid pressure differential of 0.4 MPa. Analysis of Figure 5a reveals that the relative deflection angle progressively rises from approximately 170° in the far-well region to about 180° near the wellbore; the relative flow velocity is primarily negative, with relatively higher divergent flow velocities close to the branched horizontal well center. Examination of Figure 5b shows that as the distance to the branched horizontal well center diminishes, the relative deflection angle trends towards 180°. This suggests that fluid interference induces divergent flow to intrude into the reservoir and progressively migrate towards the deeper sections. Observations from Figure 5c,d indicate that by t = 44 min of combined production, the fluid flow characteristic parameters undergo a change: the relative flow velocity becomes positive, and the deflection angles predominantly fall below 90°. This signifies a shift in fluid movement from the deep reservoir towards the wellbore, characterized by convergent flow, and indicates that the flow is no longer influenced by fluid interference effects [22,23].
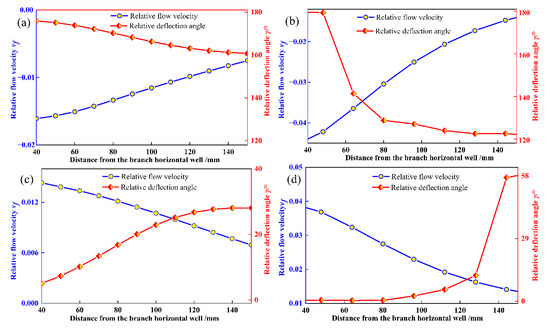
Figure 5.
Evolution of fluid flow characteristic parameters. (a) t = 4 min, monitoring line x = 120; (b) t = 4 min, monitoring line 4y = 5x; (c) t = 44 min, monitoring line x = 120; (d) t = 44 min, monitoring line 4y = 5x.
4.2. The Effect of Fluid Pressure on the 3D Spatial Distribution of Fluid and Its Characteristic Parameter Response
Figure 6 illustrates the effect of fluid pressure difference on the three-dimensional flow characteristics of fluid in Seam I. Under the three pressure difference conditions, two flow regimes are observed: fluid moving towards the branch horizontal well (e.g., at t = 4 min) and fluid moving towards the deep reservoir (e.g., at t = 44 min). Comparison reveals that the pressure drop funnel height is smaller under 0.2 MPa than under 0.4 MPa and 0.6 MPa. However, as production time increases, the 0.2 MPa condition exhibits a larger funnel height compared to the 0.4 MPa and 0.6 MPa conditions. It is proposed that the reservoir–wellbore coupling induces a fluid interference effect. A higher pressure difference intensifies this effect, potentially altering fluid migration in the low-pressure reservoir, even causing backflow and divergent flow. As combined production continues, the disruptive or inhibitory influence of the fluid interference effect on the reservoir fluid’s three-dimensional flow diminishes, leading to a gradual transition from divergent to convergent flow.
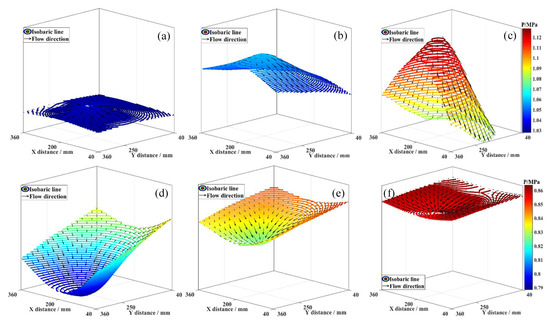
Figure 6.
Effect of fluid pressure on 3D fluid flow characteristics. (a) ∆p = 0.2 MPa, t = 4 min; (b) ∆p = 0.4 MPa, t = 4 min; (c) ∆p = 0.6 MPa, t = 4 min; (d) ∆p = 0.2 MPa, t = 44 min; (e) ∆p = 0.4 MPa, t = 44 min; (f) ∆p = 0.6 MPa, t = 44 min.
The effect of fluid pressure on relative flow velocity and deflection angle is illustrated in Figure 7. Figure 7a shows that on the x = 120 monitoring line, the relative flow velocity varies significantly under the three pressure difference conditions, with notable differences near the wellbore and less so at the far end. At 40 mm from the wellbore, as the reservoir pressure difference increases from 0.2 MPa to 0.4 MPa and 0.6 MPa, the relative flow velocity increases from −0.007 to −0.016 and −0.039, respectively, with deflection angles of 173.29°, 175.98°, and 178.86°. This shows that higher pressure differences correlate with increased flow velocity and deflection angle near the wellbore, with velocities remaining negative. At t = 4 min and t = 44 min, deflection angles evolve in two patterns: one approaching 180° closer to the branch horizontal well center (t = 4 min), and the other approaching 0° (t = 44 min). Overall, excessive pressure differences amplify inter-reservoir property disparities, intensify fluid interference effects, reduce combined production compatibility, and diminish fluid flow capacity. Thus, prioritizing reservoirs with smaller pressure differences during MCR coalbed methane co-production can mitigate fluid interference and enhance compatibility.
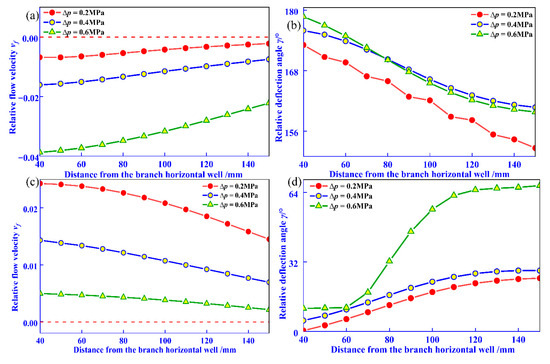
Figure 7.
Effect of fluid pressure difference on fluid migration parameters. (a) t = 4 min, relative flow velocity; (b) t = 4 min, relative deflection angle; (c) t = 44 min, relative flow velocity; (d) t = 44 min, relative deflection angle.
4.3. The Effect of In Situ Stress on the 3D Spatial Distribution of Fluid and Its Characteristic Parameter Response
Figure 8 illustrates the effect of in situ stress difference on the 3D flow characteristics of fluid in coal seam I. At t = 4 min, under the three in situ stress difference conditions, the fluid flow shape is inverted funnel-shaped, with vector arrows pointing from the center of the branched horizontal well to the deep reservoir, indicating divergent flow, and the flow characteristics show small differences. As extraction progresses, by t = 44 min, the fluid flow arrows under different conditions reverse direction, all pointing from the deep reservoir to the center of the branched horizontal well, indicating convergent flow, and the flow pattern is funnel-shaped, with flow characteristics showing small differences. This is attributed to fluid interference under reservoir-wellbore coupling altering the flow state in the low-pressure reservoir. The change in reservoir in situ stress difference has a negligible effect on the degree of fluid interference. As extraction continues, the fluid interference effect diminishes, the reservoir-wellbore pressure system approaches equilibrium, and fluid flow reverts to a convergent state.
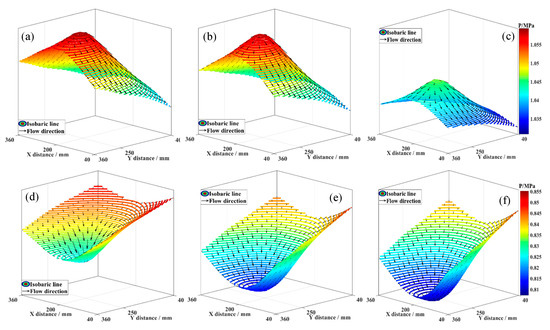
Figure 8.
Effect of in situ stress difference on 3D fluid flow characteristics. (a) ∆σ = 0.4 MPa, t = 4 min; (b) ∆σ = 0.8 MPa, t = 4 min; (c) ∆σ = 1.2 MPa, t = 4 min; (d) ∆σ = 0.4 MPa, t = 44 min; (e) ∆σ = 0.8 MPa, t = 44 min; (f) ∆σ = 1.2 MPa, t = 44 min.
In summary, compared to fluid pressure difference, varying the in situ stress difference causes negligible differences in the degree of fluid interference affecting the low-pressure reservoir fluid. Thus, in situ stress difference is not a primary factor in studying compatibility in MCR coalbed methane co-production.
On the x = 120 monitoring line, the evolution of relative flow velocity and relative deflection angle under reservoir in situ stress difference is shown in Figure 9. Figure 9a,b reveal that under all three conditions, the relative flow velocity is negative, and the relative deflection angle increases to 180° as the distance from the wellbore center decreases, indicating centrifugal flow. The relative flow velocity and deflection angle exhibit minimal differences across the three conditions. At t = 44 min, the relative flow velocity becomes positive, and the relative deflection angle decreases to 0° with decreasing distance from the wellbore center, indicating a transition from centrifugal to convergent flow.
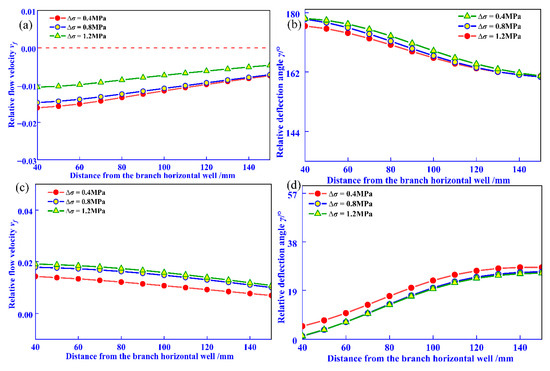
Figure 9.
Effect of in situ stress difference on fluid flow parameter evolution. (a) t = 4 min, relative flow velocity; (b) t = 4 min, relative deflection angle; (c) t = 44 min, relative flow velocity; (d) t = 44 min, relative deflection angle.
By comparing Figure 7 and Figure 9, it can be seen that at t = 4 min, for every 1 MPa increase in fluid pressure difference, the maximum relative flow rate change is 0.080, and the maximum relative deflection angle is 20°. However, when the local stress difference increases by 1 MPa, the maximum relative flow rate change and maximum relative deflection angle are 0.007 and 3.76°, respectively. Compared with fluid pressure difference, the influence of geostress difference on fluid interference is relatively small, and the sensitivity to fluid interference is relatively weak.
5. Conclusions
(1) MCR coalbed methane co-production experiments were conducted. A 3D visualization method for fluid migration in MCR was proposed, and mathematical models for calculating relative flow velocity and relative deflection angle during fluid migration were established. The influence of fluid pressure difference and in situ stress difference on the 3D spatial distribution of fluid and its characteristic parameters was analyzed;
(2) Dynamic pressure equilibrium between the coal seams and wellbore forces fluid from high-pressure reservoirs to intrude into low-pressure reservoirs, altering the flow state. This results in negative relative flow velocity and a deflection angle near 180° for the low-pressure reservoir fluid, while the high-pressure reservoir fluid shows positive relative flow velocity and a deflection angle near 0°;
(3) During MCR coalbed methane co-production, in situ stress difference and fluid pressure differences between reservoirs alter fluid migration patterns, causing interaction and fluid interference effects. This leads to centrifugal flow in low-pressure reservoirs and convergent flow in high-pressure reservoirs. Fluid pressure difference exerts a greater influence on fluid migration patterns than in situ stress difference.
Author Contributions
Conceptualization, A.D. and S.P.; Resources, C.X.; Writing—original draft, A.D. and L.J.; Writing—review & editing, L.J.; Supervision, A.D., J.X., S.P. and L.W.; Funding acquisition, A.D., J.X. and L.W. All authors have read and agreed to the published version of the manuscript.
Funding
This work was funded by the China Postdoctoral Science Foundation (grant numbers 2025M771783; GZC20251235), the National Natural Science Foundation of China, China (grant numbers: 52074047; 52174216), the Fundamental Research Funds for the Central Universities, China (grant numbers: 2022CDJQY-011; 2021YCPY0206), and Open Fund of Deep Coalbed Methane Exploration and Development Key Laboratory, Sinopec in 2024 (grant numbers: SMKK202404).
Data Availability Statement
The data that support the findings of this study are available from the corresponding author upon reasonable request.
Conflicts of Interest
No conflicts of interest exist in the submission of this manuscript, and manuscript is approved by all authors for publication. I would like to declare on behalf of my co-authors that the work described was original research that has not been published previously, and not under consideration for publication elsewhere, in whole or in part. All the authors listed have approved the manuscript that is enclosed.
References
- Zhao, Z.; Liu, D.M.; Cai, Y.D.; Qiu, F.; Sun, F.R. Gas-bearing characteristics of coal measure strata and logging evaluation of fluid pressure systems. Phys. Fluids 2025, 37, 046618. [Google Scholar] [CrossRef]
- Psaltis, S.; Farrell, T.; Burrage, K.; Burrage, P.; McCabe, P.; Moroney, T.; Turner, I.; Mazumder, S. Mathematical modelling of gas production and compositional shift of a CSG (coal seam gas) field: Local model development. Energy 2015, 88, 621–635. [Google Scholar] [CrossRef]
- Zhang, J.X.; Li, L.J.; Li, B.; Ding, S.M.; Guo, J.J.; Wang, Z.F.; Zhang, F.; Feng, Y.H. Multifractal characteristics on pore structure of grouted coal using nuclear magnetic resonance for anti–seepage evaluation. Phys. Fluids 2025, 37, 046622. [Google Scholar] [CrossRef]
- Li, H.; Liao, J.J.; Liu, R.; Hong, Y.D.; Lu, J.X.; Cao, J.Y. Coupling effect of high temperature steam-liquid nitrogen cyclic treatment on pore iteration and fluid flow behavior in bituminous coal. Phys. Fluids 2024, 36, 112001. [Google Scholar] [CrossRef]
- Liu, Y.X.; Gao, Y.; Wang, G.; Cheng, W.M.; Xu, C.H.; Cheng, J.X. Development of experimental system for rock anisotropic seepage under true triaxial stress. Geomech. Energy Environ. 2025, 42, 100677. [Google Scholar] [CrossRef]
- Liu, Y.X.; Jiang, C.R.; Wang, G.; Gao, Y.; Cheng, J.X.; Ni, G.H. Evolution of the hydraulic wetting path in fractured coal under true triaxial stress and the influence mechanism of fracture orientation. J. Hydrol. 2024, 640, 131692. [Google Scholar] [CrossRef]
- Zhang, J.X.; Feng, G.D.; Li, B.; Zhou, H.Q.; Guo, J.J.; Lu, W.Y. Modelling of multifield coupling and boreholes placement for hydraulic flushing and engineering applications. Int. J. Geomech. 2025, 25, 04024335. [Google Scholar] [CrossRef]
- Zhang, J.X.; Jiang, Y.L.; Li, B.; Guo, J.J.; Lu, W.Y.; Qu, L.N. Modeling and coupling analysis of enhanced coalbed methane recovery by gas injection. Int. J. Numer. Anal. Met. 2024, 48, 1931–1948. [Google Scholar] [CrossRef]
- Tang, Y.H.; Li, B.B.; Li, J.H.; Ding, Y.N.; Zeng, X.W.; Cao, J. Modeling apparent permeability of coal: Incorporation of slippage effect and gas pressure decline. Phys. Fluids 2025, 37, 053605. [Google Scholar] [CrossRef]
- Meng, Y.; Li, Z.P.; Lai, F.P.; Chen, W.M.; Zhao, K. An in situ study on coalbed methane seepage related to multiple physical fields: A case study from the Qinnan-East Block in the Qinshui Basin, China. Phys. Fluids 2024, 36, 047109. [Google Scholar] [CrossRef]
- Zeng, Q.S.; Wang McPherson, B.J.; McLennan, J.D. Modeling competitive adsorption between methane and water on coals. Energy Fuels 2017, 31, 10775–10786. [Google Scholar] [CrossRef]
- Li, J.; Wang, G.; Ning, Z.F.; Huang, Q.M.; Lyu, F.; Liu, B. Effect of slickwater on methane adsorption in coal: Experiment and molecular simulation. Energy Fuels 2024, 38, 5206–5217. [Google Scholar] [CrossRef]
- Lin, L.; Lu, H.; Huang, L.G.; Luo, P.Y. A molecular dynamics study of methane/water diffusion and water-blocking effects in coalbed methane. Fuel 2025, 386, 134234. [Google Scholar] [CrossRef]
- Arif, M.; Barifcani, A.; Lebedev, M.; Iglauer, S. CO2-wettability of low to high rank coal seams: Implications for carbon sequestration and enhanced methane recovery. Fuel 2016, 181, 680–689. [Google Scholar] [CrossRef]
- Qian, Y.A.; Liu, T.; Zhai, C.; Wen, H.D.; Zhang, Y.B.; Zheng, M.H.; Xu, H.X.; Xing, D.Y.; Gan, X.K. Real-time monitoring and analysis of hydraulic fracturing in surface well using microseismic technology: Case insights and methodological advances. Int. J. Min. Sci. Technol. 2025, 35, 619–638. [Google Scholar] [CrossRef]
- Kumar, S.; Chandra, D.; Hazra, B.; Vishal, V.; Ranjith, P.G.; Das, A.; Ahuja, M.; Ghosh, S. Integration of fluid-invasive, scattering, and imaging methods in resolving pore structures in coal and shale. Fuel 2025, 395, 135185. [Google Scholar] [CrossRef]
- Dong, K.; Zhong, D.L.; Lu, Y.Y.; Yan, J.; Dai, W.X. Facilitating desorption and diffusion of coalbed methane by wetting-corrosion: Perspectives from the change of pore structure. J. Nat. Gas Sci. Eng. 2023, 119, 205138. [Google Scholar] [CrossRef]
- Wang, F.; Yao, Y.B.; Wen, Z.A.; Sun, Q.P.; Yuan, X.H. Effect of water occurrences on methane adsorption capacity of coal: A comparison between bituminous coal and anthracite coal. Fuel 2020, 266, 117102. [Google Scholar] [CrossRef]
- Massarotto, P.; Iyer, R.S.; Elma, M.; Nicholson, T. An experimental study on characterizing coal bed methane (CBM) fines production and migration of mineral matter in coal beds. Energy Fuels 2014, 28, 766–773. [Google Scholar] [CrossRef]
- Amani, P.; Firouzi, M. Uninterrupted lift of gas, water, and fines in unconventional gas wells using foam-assisted artificial lift. J. Nat. Gas Sci. Eng. 2023, 114, 204977. [Google Scholar] [CrossRef]
- Ma, M.; Shakeel, Y.; Babatunde, K.; Emami-Meybodi, H. Modeling of adsorption-controlled binary gas transport in ultratight porous media. Geoenergy Sci. Eng. 2024, 244, 213414. [Google Scholar] [CrossRef]
- Li, Q.X.; Xu, J.; Shu, L.Y.; Yan, F.Z.; Pang, B.; Peng, S.J. Exploration of the induced fluid-disturbance effect in CBM co-production in a superimposed pressure system. Energy 2022, 265, 126347. [Google Scholar] [CrossRef]
- Li, Q.X.; Shu, L.Y.; Xu, J.; Peng, S.J.; Yan, F.Z.; Huo, Z.G.; Liu, D.; Li, C.; Zhou, B. Experimental study on interlayer interference effect of CBM commingled production in a multi-pressure system under output control mode. Fuel 2023, 350, 128812. [Google Scholar] [CrossRef]
- Wang, Z.W.; Qin, Y. Physical experiments of CBM coproduction: A case study in Laochang district, Yunnan province, China. Fuel 2019, 239, 964–981. [Google Scholar] [CrossRef]
- Wang, Z.W.; Qin, Y.; Li, T.; Zhang, X.Y. A numerical investigation of gas flow behavior in two-layered coal seams considering interlayer interference and heterogeneity. Int. J. Min. Sci. Technol. 2021, 31, 699–716. [Google Scholar] [CrossRef]
- Jia, L.; Wang, L.; Cheng, Y.P.; Xu, J.; Nie, B.S.; Peng, S.J. Advanced physical simulation technique for investigating coalbed methane coproduction in multicoal seams. Energy Fuels 2025, 39, 1981–1997. [Google Scholar] [CrossRef]
- Shen, Y.L.; Qin, Y.; Wang, G.G.X.; Guo, Y.H.; Shen, J.; Gu, J.Y.; Xiao, Q.; Zhang, T.; Zhang, C.L.; Tong, G.C. Sedimentary control on the formation of a multi-superimposed gas system in the development of key layers in the sequence framework. Mar. Pet. Geol. 2017, 88, 268–281. [Google Scholar] [CrossRef]
- Chen, Y.H.; Luo, J.H.; Hu, X.Y.; Yang, Y.G.; Wei, C.T.; Yan, H.P. A new model for evaluating the compatibility of multi-coal seams and its application for coalbed methane recovery. Fuel 2022, 317, 123464. [Google Scholar] [CrossRef]
- Guo, C.; Qin, Y.; Sun, X.Y.; Wang, S.Q.; Xia, Y.C.; Ma, D.M.; Bian, H.Y.; Shi, Q.M.; Chen, Y.; Bao, Y.; et al. Physical simulation and compatibility evaluation of multi-seam CBM co-production: Implications for the development of stacked CBM systems. J. Petrol. Sci. Eng. 2021, 204, 108702. [Google Scholar] [CrossRef]
- Zeng, L.B.; Zhang, Y.Z.; Li, Y.C.; Wang, X.Y.; Shi, J.X.; Dong, S.Q. Coexistence of coalbed methane, shale gas, and tight sandstone gas in coal measure strata: A case study from the southern Qinshui Basin, China. AAPG Bull. 2025, 109, 637–657. [Google Scholar] [CrossRef]
- Jia, L.; Peng, S.J.; Xu, J.; Yan, F.Z.; Chen, J.R.; Wu, B.; Chen, Y.X. On the evolution mechanism of permeability during gas drainage: Insights from deformation field, gas pressure field and temperature field. Process Saf. Environ. 2022, 162, 825–836. [Google Scholar] [CrossRef]


Disclaimer/Publisher’s Note: The statements, opinions and data contained in all publications are solely those of the individual author(s) and contributor(s) and not of MDPI and/or the editor(s). MDPI and/or the editor(s) disclaim responsibility for any injury to people or property resulting from any ideas, methods, instructions or products referred to in the content. |
© 2025 by the authors. Licensee MDPI, Basel, Switzerland. This article is an open access article distributed under the terms and conditions of the Creative Commons Attribution (CC BY) license (https://creativecommons.org/licenses/by/4.0/).