Abstract
The non-uniform distribution of outlet parameters in a Radial Wave Rotor Combustor (RWRC) significantly impacts downstream component performance. This study aims to investigate the spatial-temporal characteristics of temperature and pressure at the RWRC outlet. Three-dimensional unsteady Reynolds-Averaged Navier–Stokes (RANS) simulations were coupled with a User-Defined Function (UDF) to efficiently model the combustion process. The Shear-Stress Transport (SST) k-ω turbulence model was employed. Quantitative metrics including Relative Standard Deviation (RSD) and Christiansen Uniformity Coefficient (CUC) were introduced to evaluate the non-uniformity. The results reveal significant temporal fluctuations and spatial non-uniformity in both temperature and pressure. At 3000 r/min, the average temperature fluctuation amplitude and uniformity coefficient are 0.38 and 0.9, respectively, while the pressure fluctuation amplitude reaches 0.44. Crucially, temperature distribution expands circumferentially with increasing speed, whereas pressure distribution remains locally concentrated and is less sensitive to speed variations. This study provides a quantitative assessment of outlet non-uniformity in RWRC, highlighting the distinct behaviors between temperature and pressure distributions. The findings offer critical insights for the design and optimization of wave rotors and their integration with downstream components.
1. Introduction
Nowadays, gas turbines based on the Brayton cycle have developed rapidly. Owing to a series of advantages [1,2], they play a significant role in the aerospace field [3,4]. However, this type of engine still faces numerous challenges, and its working efficiency has approached the limit of the Brayton cycle. The Humphrey cycle, another working cycle characterized by high efficiency and large specific work, shows potential to replace the Brayton cycle [5,6]. New-concept combustors based on the Humphrey cycle include the pulse detonation engine [7] and the wave rotor combustor [8]. As an efficient pressurized combustion device, the wave rotor combustor mainly compresses the inhaled fresh air through the wave system motion within the rotor channels, achieving additional pressure rise based on the compressor pressure ratio [9]. Meanwhile, fuel is injected to induce deflagration or detonation within the limited channel space, realizing constant volume combustion with high thermodynamic efficiency of the fuel.
In recent years, research on wave rotor combustor has attracted increasing attention from scholars and research institutions. Investigations have primarily focused on evaluating wave rotor performance and exploring methods to enhance it. Sun et al. [10,11] and Zheng et al. [12] compared the Humphrey cycle with the Otto, Diesel, and Brayton cycles, concluding that the Humphrey cycle offers higher thermal efficiency under identical initial conditions and peak temperatures. Wilson J et al. [13] demonstrated that integrating a wave rotor into a gas turbine engine can effectively increase specific power output while reducing specific fuel consumption. Nagashima T and Okamoto K [14] proposed a novel wave disk concept that laid a solid foundation for the application of wave rotor engines in micro-electro-mechanical systems (MEMS). Akbari P et al. [15,16,17,18] analyzed entropy generation in the Brayton cycle, the Humphrey cycle, and wave disk engine (WDE) cycles under equal heat input using thermodynamic diagrams. Additionally, they introduced a hybrid gas turbine reheat cycle that employs a WDE as the main combustor and an ultra-compact combustor (UCC) as the secondary combustor, thereby combining the advantages of constant-volume and circumferential combustion. A thermodynamic analysis model was established to quantitatively assess the influence of various parameters on wave rotor performance. Their results indicate that wave rotor can significantly enhance engine performance, and the upper performance limits under specific conditions were identified. Piechna J et al. [19] proposed a novel radial-flow device in which multiple radial wave rotor combustors are stacked and integrated with radial-flow turbomachinery placed at specific angles around the periphery and center of the stack. This configuration accommodates varying mass flow rates and power outputs, reduces flow losses, and improves overall efficiency. Brun K et al. [20] developed a novel conceptual prototype of a gas turbine featuring a compact structure, ease of maintenance, and a high thrust-to-weight ratio.
Efficient fuel–air mixing in wave rotor combustor is a prerequisite for high-performance combustion and represents one of the key approaches to improving overall engine performance. Accurate fuel injection and effective mixing contribute to the formation of high-quality premixed fuel, which facilitates constant-volume combustion and enables more efficient energy conversion. Nalim M.R [21] proposed a stratified filling concept, in which fuel and air are distributed in layers with varying concentrations across different regions of the channel, providing thermal protection for the rotor and other components. Pekkan K [22] also introduced a concept of radially stratified fuel/oxidizer mixtures within the wave rotor channel. This approach helps reduce NOx formation, enhances combustion stability, and improves combustion efficiency. Wijeyakulasuriya D et al. [23,24] investigated the mixing characteristics of fuel jets in narrow channels, comparing various injection strategies. Their findings showed that transverse injection achieves optimal mixing with acceptable flow losses. Matsutomi Y et al. [25] experimentally studied the effects of fuel injection location and equivalence ratio on mixing quality and combustion characteristics. Their results demonstrated that the propagation of pressure waves promotes fuel–air mixing and thus enhances combustion efficiency. High-quality fuel–air mixing was found to be critical for improving combustion performance. Khalid S et al. [26], using two-dimensional numerical simulations, analyzed the distribution of fuel and air within RWRC. Their study revealed that the uniformity of mixing in the ignition zone is positively correlated with the inlet airflow velocity. Feng et al. [27] numerically investigated the influence of wave rotor channel geometry on mixing formation. The results indicated that although the internal flow structures and patterns were generally similar across different channel configurations, reducing the channel width significantly improved mixing quality.
Constant-volume combustion (CVC) in wave rotor combustor offers significant advantages; however, due to the complex internal flow and combustion processes characterized by strong interactions between multiple physical phenomena, further investigation into the combustion characteristics of wave rotor combustor is necessary. Karimi A [28] conducted numerical studies of hot jet ignition in wave rotor channels treated as constant-volume combustion chambers, using three different fuels. The results indicated that while methane ignition is more susceptible to shock wave effects within the channel, ethylene demonstrated superior overall performance. Kiran R et al. [29] explored a method of enhancing combustion efficiency by reinjecting combustion products into channels filled with fresh fuel–air mixtures to achieve ignition. Their study concluded that, with appropriate design of the wave rotor ports, combustion products can reliably ignite the fresh mixture, thereby enabling self-sustained combustion. Najim Y. M. et al. [30] focused on the propagation of premixed flames in constant-volume curved channels. Their results revealed that the curvature of the channel plays a critical role in determining flame propagation behavior. Hariharan et al. [31] conducted both numerical and experimental investigations of premixed flame propagation in rectangular constant-volume channels. The resulting flame speed distributions provided valuable insights into the intake timing and rotational speed requirements of wave disk engines. He et al. [31] experimentally examined the correlation between premixed flame development and pressure variation inside wave rotor channels. Their study demonstrated a significant relationship between flame dynamics and pressure fluctuations within the rotor passage.
In summary, prior research has primarily advanced our understanding of RWRC in three key aspects: (1) thermodynamic cycle analysis [10,11,12,13,15,16,17,18], which established the performance potential of wave rotor technology; (2) fuel–air mixing processes [21,22,23,24,25,26,27], which are critical for achieving high-quality combustion; and (3) combustion characteristics [28,29,30,31], which focus on flame propagation and ignition mechanisms within the confined channels. However, while these studies provide invaluable insights into the internal processes of RWRC, they inevitably treat the outlet flow as a boundary condition or a lumped parameter, overlooking its spatially and temporally non-uniform characteristics. This constitutes a significant knowledge gap, as the highly unsteady and non-uniform exhaust flow can severely impact the performance and longevity of downstream components such as turbines or transition ducts. Consequently, a systematic quantification of the outlet flow field is not merely supplementary but essential for the practical integration of RWRCs into propulsion systems. Therefore, to address this gap, this study presents a comprehensive numerical investigation for the quantitative assessment of outlet non-uniformity. Beyond fundamental insights, this analysis provides critical practical implications for mitigating adverse effects on downstream components, thereby offering a valuable foundation for optimizing wave rotor design and integration.
2. Working Process and Establishment of Numerical Model of Radial Wave Rotor Combustor
2.1. The Working Process of the Radial Wave Rotor Combustor
Figure 1 illustrates the working process of the RWRC. Within a single rotation cycle, the rotor completes two identical intake and exhaust cycles. As the rotor channels rotate at high speed, the intake and exhaust ports are periodically connected to the channels, enabling a sequence of processes including fuel filling, ignition, combustion, and exhaust. When the exhaust port is closed, the high-speed gas flow impacts the end wall of the exhaust port, generating a pre-compression wave that pre-compresses the gas inside the channel under cold conditions. Subsequently, the intake port closes, and ignition occurs at the center of the channel, initiating constant-volume combustion. After combustion is completed, the exhaust port opens as the channel continues to rotate. Due to the pressure difference between the inside and outside of the channel, an expansion wave is generated and propagates toward the intake end.
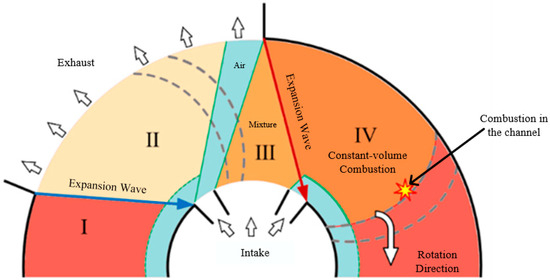
Figure 1.
Working process of the RWRC.
2.2. Computational Model and Numerical Method
Based on the schematic diagram of the working process, the three-dimensional simplified computational model of the RWRC is constructed, as shown in Figure 2. The model includes 24 wave rotor channels, uniformly distributed in the radial direction, along with corresponding inlet and exhaust ports. The RWRC channels are designed to optimize both inlet and exhaust processes, effectively reducing the filling rate and thereby suppressing the phenomenon of fuel overfilling. The inlet system consists of three ports: the central port supplies a premixed ethylene–air mixture (with an equivalence ratio of 1), while the two side ports supply pure air for scavenging and pre-compression purposes. Additionally, five monitoring points are evenly arranged along the radial direction at the exhaust port to capture flow characteristics. Owing to the geometric regularity of the model, a structured mesh is employed for the entire computational domain.
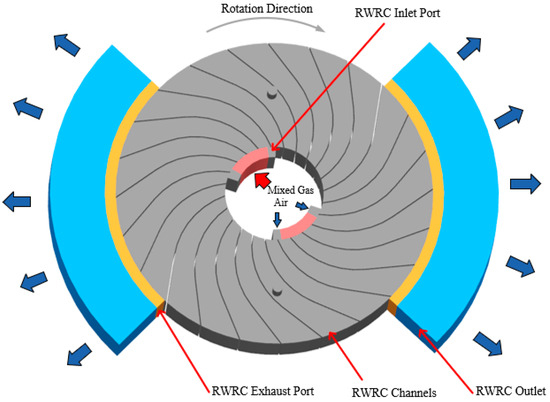
Figure 2.
Computational model for numerical simulation.
The numerical simulations were conducted using the commercial finite-volume solver Ansys Fluent (v2021 R1), which is well-established for simulating complex turbulent reacting flows. The three-dimensional, transient Reynolds-Averaged Navier–Stokes (RANS) equations were solved to capture the dominant unsteady flow characteristics. The shear-stress transport (SST) k-ω turbulence model was adopted, and it combines the advantages of k-ω and k-ε models, ensuring high accuracy in handling complex flows, which are prevalent in RWRC. For pressure–velocity coupling, the Pressure-Implicit with Splitting of Operators (PISO) scheme was employed due to its noted stability and efficiency for transient simulations with large time steps. All spatial discretization schemes were second-order accurate to minimize numerical diffusion. The fluid in the computational model was defined as an ideal gas. The boundary conditions were set as a mass flow inlet at the entrance and a pressure outlet at the exit, while the wall was specified as a no-slip adiabatic wall. In the calculation, the specific heat capacity and thermal conductivity are set as constant values.
In this study, a series of monitoring points are set at the outlet of the RWRC, as shown in Figure 3. The monitoring points are divided into circumferential monitoring points and radial monitoring points, which capture the distribution characteristics of the RWRC outlet parameters at different positions, respectively. In the circumferential direction, 11 groups of monitoring points are set, with each group containing 5 monitoring points, and the interval between each group is 8.8°. In the radial direction, 5 groups of monitoring points are set, with each group including 11 monitoring points in the blue box in Figure 3, and the interval between each group is 12 mm.
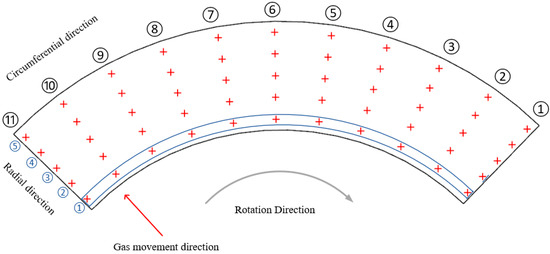
Figure 3.
Setting of monitoring points.
Taking advantage of Fluent’s support for user-defined functions (UDF), this study simplified the simulation of combustion reactions within the wave rotor. The method is based on time variables, using Fluent’s built-in function statements to obtain the computational time and matching it with the cycle period of each channel calculated from the rotational speed to determine whether to assign a high-temperature and high-pressure state to the channel. The flowchart of the UDF used in this computation is shown in Figure 4.
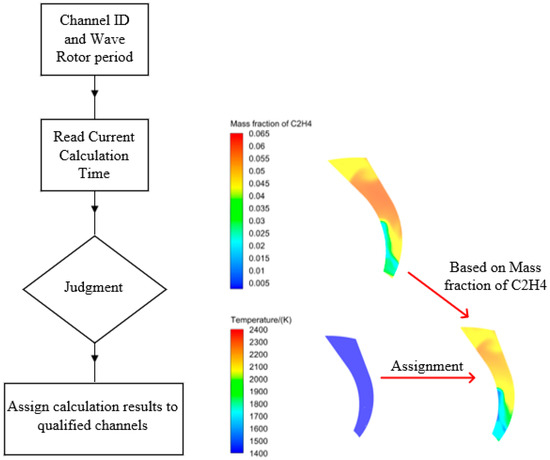
Figure 4.
UDF model.
Considering the actual operation of the RWRC and to ensure the accuracy of calculation results, values are assigned based on the fuel distribution within the channels. According to the law of energy conservation, the temperature of the fuel after constant-pressure combustion in the RWRC channels is
In the equation, is the combustion efficiency of the RWRC, is the lower heating value of the fuel, is the mass fraction of the fuel, is the specific heat at constant volume, and is the gas density. Since constant volume combustion occurs in the channel of the RWRC, the pressure after isochoric combustion can be obtained according to the gas state equation.
To verify the UDF model, a combustion model is set up using the model shown in Figure 2. The wall where the wave rotor channel contacts the igniter is connected to the igniter via an interface; the igniter inlet is set as a mass flow inlet, with a flow rate of 5 g/s and a temperature of 2000 K for a single igniter. The detailed chemical reaction mechanism of ethylene with 66 steps and 23 components is adopted; the Eddy Dissipation Concept (EDC) model is selected as the chemical reaction model for turbulent combustion. The results are presented in Figure 5, which shows the pressure inside the channel calculated by the two methods. It can be seen from Figure 4 that at 0.25 ms, the channel meets the igniter, and at this moment, the high-temperature jet in the igniter enters the channel, igniting the fuel in the channel. The pressure reaches its peak at 0.6 ms. The UDF model is triggered at 0.5 ms, and the channel pressure reaches the target value shortly afterward. In contrast, the combustion model simulates the ongoing reaction of the fuel within the channel. By 0.75 ms, the channel pressure predicted by both methods reaches approximately 25 atm. The difference between the two models remains within 5% and 0.5 ms is negligible compared to the wave rotor cycle, indicating that the UDF model can effectively replace the combustion model in this simulation.
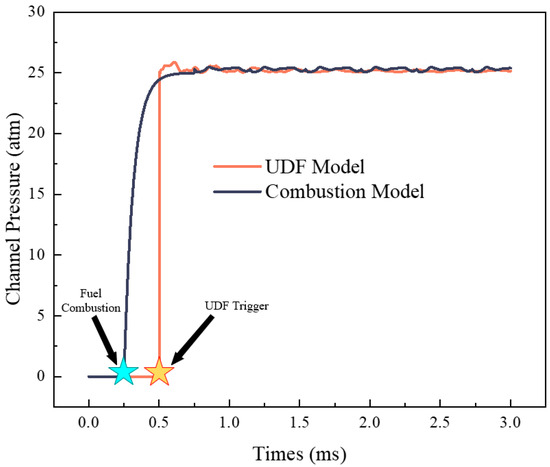
Figure 5.
Channel pressure calculation results via different methods.
The use of a UDF to model combustion represents a deliberate simplification to make the long-duration, parametric simulations of this study computationally feasible. This approach is justified for the following reasons: (1) the primary focus of this research is on the macro-scale transport and distribution of the outlet flow field, rather than the detailed chemical kinetics of combustion; (2) as demonstrated in Figure 5, the UDF method accurately captures the critical peak pressure and its timing generated by the constant-volume combustion event, which is the primary driver of the wave dynamics and exhaust flow; (3) the deviation between the UDF and detailed chemistry results is within 5% for peak pressure prediction, which is considered acceptable for the system-level analysis performed here. While a detailed combustion model would be necessary for studying ignition in RWRC, the UDF provides a robust and efficient alternative for the specific objectives of this work.
2.3. Performance Evaluation Indicators
Due to the unsteady working characteristics of the radial-flow internal combustion wave rotor, the outlet parameters must have a non-uniform distribution. To monitor the parameter distribution at the exhaust port of the radial-flow internal combustion wave rotor, this paper defines four parameters to describe the parameter distribution at the outlet of the RWRC.
2.3.1. Relative Standard Deviation (RSD)
The relative standard deviation (RSD), a dimensionless measure of relative variation, can be used to quantify the dispersion of populations with significantly different means and compare the improvement in flow field uniformity.
The instantaneous fluctuation of a parameter at the RWRC outlet is defined as
In the above equation, represents the standard deviation of the mass-weighted total pressure at the RWRC outlet at a given time.
In the above equation: n is the total number of nodes at the RWRC outlet, is the mass-weighted parameter at the i-th node at a given time, is the mass-weighted average total pressure at the outlet at that time, defined as
In the equation, l is the circumferential length of the outlet of the RWRC.
Define the mean value of the outlet total pressure pulsation:
In the equation, T is the rotation period of the RWRC, with a value of 0.02 s.
The RSD is employed here as a temporal intensity metric. A high instantaneous RSD value indicates strong temporal fluctuations in the outlet flow parameters at a given moment, which are directly linked to the periodic opening and closing of rotor channels and the ensuing unsteady wave dynamics. This pulsation is a critical source of potential flow instability and noise generation for downstream components.
2.3.2. Christiansen Uniformity Coefficient
The Christiansen Uniformity Coefficient (CUC), proposed by Christiansen in 1942, is a statistical metric based on the mean absolute deviation. It reflects the degree of deviation of the measured parameter from its mean value. A higher CUC indicates better uniformity of the parameter distribution across the measured cross-section. The expression is given by
In the above equation: i denotes the index over a total of n monitoring points, is the average value of the variable at a given time.
Equation (6) enables the non-dimensionalization of the obtained data, and the resulting uniformity coefficient effectively reflects the differences in temperature and pressure among the monitoring points. This provides an important basis for the subsequent analysis. A higher value of the coefficient indicates a more uniform parameter distribution across the monitoring points, while a lower value suggests significant variation among them.
In contrast to the RSD, the CUC is a spatial uniformity metric. It quantifies the homogeneity of the parameter distribution across the entire outlet cross-section at a single time instance. A CUC value of 1 represents perfect uniformity, while lower values indicate spatial stratification. This is crucial for assessing thermal and pressure loading on downstream components, such as turbine guide vanes, as non-uniformity can lead to localized hot spots and uneven mechanical stresses, compromising component life.
2.3.3. Circumferential Parameter Non-Uniformity Intensity
To quantify the circumferential non-uniformity of outlet parameters in the RWRC, the method of parameter gradient variation is employed. Based on all monitoring points arranged circumferentially, the circumferential gradient is defined as
where is the instantaneous value of the variable.
Furthermore, the circumferential non-uniformity intensity over an entire period is introduced. A larger value indicates stronger non-uniformity. It is defined as
where is the circumferential parameter gradient at time t, and T is the operating period of the RWRC.
2.3.4. Radial Parameter Non-Uniformity Intensity
Similarly, the radial parameter gradient is introduced to quantify the radial non-uniformity at the RWRC outlet. It is defined as
where is the instantaneous value of the variable.
The radial non-uniformity intensity is defined as
where is the radial parameter gradient at time t, and T is the operating period of the RWRC.
3. Numerical Validation
3.1. Grid Independence Verification
To ensure the accuracy and reliability of the calculation results and avoid errors or deviations caused by unreasonable grid division, this study conducted grid independence verification using grids with minimum grid sizes of 1.4 mm, 1.2 mm, 1 mm, 0.8 mm, and 0.6 mm, respectively.
A grid independence study was conducted to ensure that the numerical results were not sensitive to the spatial discretization. Five mesh configurations with varying minimum sizes were generated, as detailed in Table 1. The key metrics of each mesh, including the total cell count, average skewness (a measure of mesh quality), and estimated computational cost, are provided. The monitoring point pressure and temperature traces over a 1 ms interval were compared across all meshes.

Table 1.
Minimum grid size for different examples.
The numerical simulations were performed on a high-performance computing cluster. Each node was equipped with two Intel Xeon Platinum 8259CL CPU (2.5 GHz, 24 cores per node) and 192 GB of RAM. The simulations for the grid independence study and the final parametric analysis were conducted in parallel using 48 cores. A single physical rotation cycle of the RWRC (e.g., 0.02 s for 3000 r/min) required approximately 480 h of wall-clock time to compute. The significant computational cost, primarily driven by the long physical time required to achieve periodic convergence and the fine mesh necessary to resolve wave dynamics, was a key factor in justifying the use of the simplified UDF combustion model for this system-level study.
As shown in Figure 6, the temperature and pressure changes at the same monitoring channel were calculated over the same 1 ms interval. It can be observed from Figure 6 that when the minimum grid size is 1.4 mm, the temperature and pressure variation values exhibit significant differences from those of the other two grid sizes within the same time interval. Conversely, when the minimum grid size is 1 mm, 0.8 mm, or 0.6 mm, the corresponding temperature and pressure variation values show minor discrepancies. Additionally, it is evident that when the grid size is 1 mm, the temperature and pressure variations show no significant difference from those of 0.8 mm and 0.6 mm. Considering both computational cost and accuracy, a grid with a minimum size of 1 mm was selected for subsequent calculations in this study.
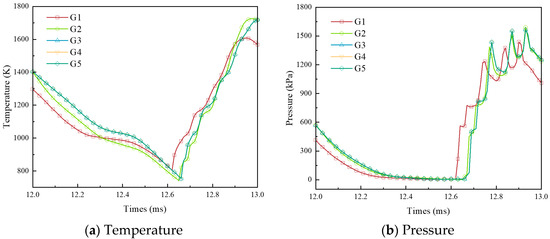
Figure 6.
Grid independence study: (a) temperature and (b) pressure traces at a monitoring point over a 1 ms time interval for different minimum grid sizes.
3.2. Numerical Method Validation
To verify the reliability of the adopted numerical algorithm and turbulence model, the simulation results were compared with the experimental data from two experimental platforms: the radial-flow internal combustion wave rotor platform designed by Nanjing University of Aeronautics and Astronautics (NUAA) and the internal combustion wave rotor platform designed by Purdue University.
The experimental platform of NUAA comprises an inlet pipeline and a wave rotor with 24 channels. A temperature-measuring rake is arranged at the outlet of the wave rotor test bench, and this rake is equipped with 7 measuring points. Figure 7 presents the structure of the temperature-measuring rake as well as photographs of the experimental platform.
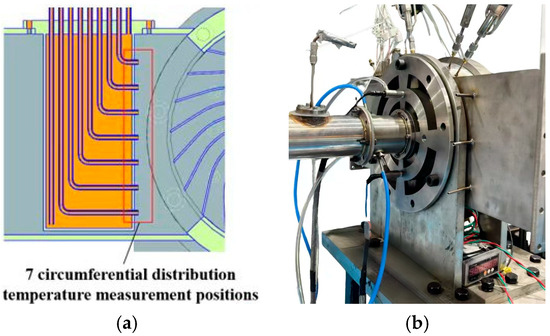
Figure 7.
Schematic diagram of the experimental platform and temperature measurement setup. (a) Structure of the temperature rake; (b) experimental platform.
A cross-sectional view of the components of Purdue University’s experimental setup is shown in Figure 8. The key components of this setup include an air inlet, an exhaust outlet, a rotor, a sealing plate, an ignition source, a fuel injector, and an electric motor.
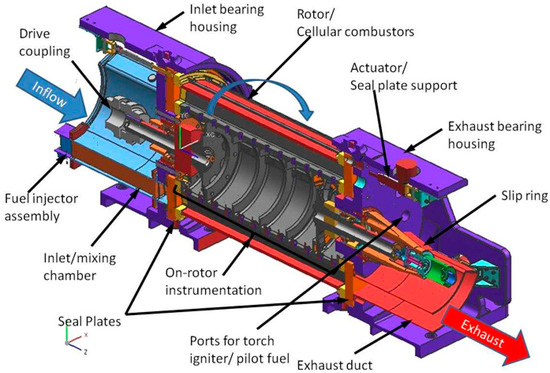
Figure 8.
Cross-sectional view of Purdue University’s experimental setup [24].
Figure 9 presents a comparison between the numerically simulated outlet temperature distribution and the experimental results. The numerical calculations and experimental data exhibit consistent overall trends; however, the experimental curve shows a steeper slope. This discrepancy is attributed to heat exchange between the temperature measurement points and the external environment during the experiment, whereas the simulation assumes adiabatic smooth walls and uses viscous loss parameters that differ from the actual experimental conditions. These factors reasonably explain the deviation between the computed and experimental values, thereby validating the reliability of the wave rotor outlet temperature distribution.
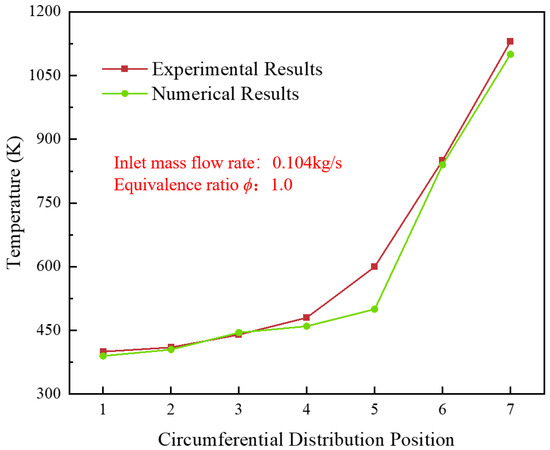
Figure 9.
Validation of numerical model: comparison of numerically simulated and experimentally measured outlet temperature distributions at different radial positions.
The results demonstrate good agreement in the overall trend, capturing the key feature of decreasing temperature with increasing radial distance. To quantify the agreement, the root mean square error (RMSE) and mean absolute percentage error (MAPE) were calculated across all seven measurement points. The RMSE was found to be 40.62 K, and the MAPE was 4.22%, with 0.975. The primary source of discrepancy is attributed to unavoidable heat losses from the temperature rake to the environment in the experiment—an effect not accounted for in the adiabatic wall simulations—as well as uncertainties in the exact boundary conditions and turbulence modeling. Considering the complexity of the unsteady flow and the challenges of experimental measurement in such a system, this level of agreement is deemed satisfactory and validates the numerical model’s capability to predict the mean temperature distribution reliably.
Regarding pressure validation, it is important to note that experimentally capturing the high-frequency spatial pressure distribution at the RWRC outlet poses significant technical challenges. This requires a series of high-response pressure sensors, and the arrangement of these sensors constitutes a major difficulty in this preliminary study. Therefore, this paper focuses the core of pressure validation on the qualitative and quantitative analysis of the pressure distribution characteristics at the wave rotor outlet, aiming to simplify the validation system and ensure the feasibility of the research. It should be supplemented that the wave rotor used in previous studies by Purdue University is an axial flow wave rotor. Although its structure differs from that of the RWRC, the core principle is consistent. This determines that both will exhibit the characteristics of uneven pressure distribution in the outlet region, providing a basis for result comparison. Figure 10 presents a comparison between the pressure distribution at the outlet of Purdue University’s experimental setup and the simulation results. Numerically, there are significant differences between the two sets of results due to variations in the equivalence ratio; however, the overall trend of change shows consistency. Further analysis reveals that the source of deviation lies in the fact that experiments need to consider factors such as leakage, which are not accounted for in the simulation process. These differences indicate that a certain degree of deviation between calculated values and experimental values is reasonable, thereby verifying the reliability of the pressure distribution at the wave rotor outlet.
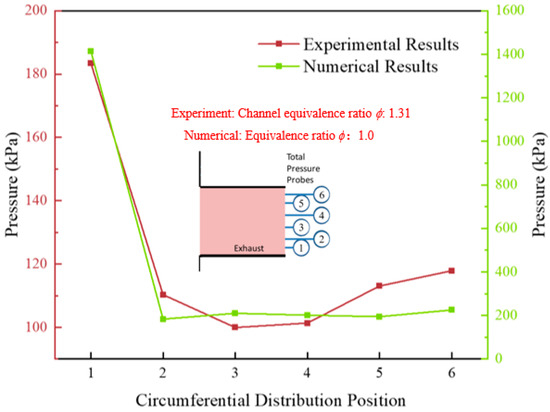
Figure 10.
Validation of numerical model: comparison of numerically simulated and experimentally measured outlet pressure distributions at different positions.
4. Results and Discussion
4.1. Outlet Temperature Distribution Characteristics
To investigate the effect of rotational speed on the outlet pressure and temperature of the RWRC, the rotor speed was varied to assess its influence on the working sequence. Adjusting the rotational speed alters the timing at which the channel gas enters the exhaust port, significantly impacting the internal flow dynamics. In this study, the rotational speed n was varied from 2000 r/min to 3000 r/min and 4000 r/min, while all other boundary conditions were kept constant.
Figure 11 illustrates the temporal variation in temperature fluctuations at the outlet of the RWRC under operating conditions of 2000 r/min, 3000 r/min, and 4000 r/min. In the figure, t/T denotes the dimensionless time. The analysis reveals that the outlet temperature fluctuation exhibits a periodic trend, while the uniformity coefficient does not present a distinct pattern. As time progresses, the RWRC outlet parameters stabilize, with the average instantaneous temperature fluctuation across all cases ranging between 0.35 and 0.45, and the average uniformity coefficient ranging from 0.85 to 0.9. Notably, the average values of these parameters do not vary significantly with changes in rotational speed. To gain further insight into the temporal behavior of outlet parameters, a single cycle of the fluctuation curve was selected for analysis. The results indicate the presence of a temperature development phase within each cycle, during which thermal energy exchange occurs in the outlet region as defined by the instantaneous fluctuation metric. The rising portion of the curve corresponds to the rotor channel rotating toward the exhaust port, during which high-temperature gas flows into the RWRC outlet, resulting in an increase in instantaneous temperature fluctuation. This process is shown to be associated with rotor speed n. However, the evolution of the uniformity coefficient does not synchronize with that of the temperature fluctuation, suggesting that rotor speed is not the sole factor influencing temperature variation at the RWRC outlet. To further investigate the spatial characteristics of temperature distribution, the circumferential parameter gradient intensity introduced earlier is employed for analysis.
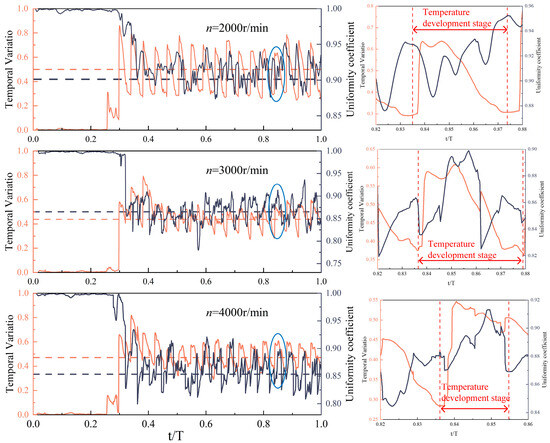
Figure 11.
Pressure variation curves under different operating conditions during a single cycle.
Due to the operating characteristics of the RWRC, its outlet temperature exhibits a non-uniform distribution. While the circumferential uniformity coefficient serves as a global indicator of the temperature distribution uniformity at the RWRC outlet, it is inadequate for capturing the detailed circumferential variations. Therefore, the parameter of circumferential temperature gradient is introduced to calculate the monitoring points with a circumferential interval of 8.8°, so as to realize a refined analysis of the circumferential temperature distribution at the RWRC outlet. Figure 12 presents the circumferential temperature gradient distributions under various rotational speeds. For each operating condition, Zone 1 corresponds to the initial opening location of the channel, where high-temperature gas first exits the rotor and undergoes intense thermal exchange, resulting in a relatively large temperature gradient in this region. However, with increased rotor speed, the gradient intensity in Zone 1 decreases by approximately 40%. This reduction is attributed to the shorter residence time of the channel at a given position as the rotational speed increases, thereby weakening the thermal exchange intensity and subsequently reducing the temperature gradient. While the gradient distributions in Zone 1 remain relatively consistent across different speeds, Zone 2 exhibits notable variations. At 2000 r/min, the gradient intensity is concentrated around monitoring points 4, 5, 6, and 7. As the speed increases to 3000 r/min, the region of significant gradient intensity expands to include point 8, with overall values increasing as well. At 4000 r/min, the region of strong gradient variation becomes dispersed across the entire Zone 2. Combined with contour visualizations, this indicates that the high-temperature region progressively expands with increasing speed and gradually covers the full outlet area of the RWRC. According to the operating mechanism of the RWRC, Zone 2 corresponds to the high-temperature region formed during the scavenging process, which also affects both the temperature variation and its spatial distribution. Therefore, the temperature field at the RWRC outlet is not only influenced by rotor speed but is also closely tied to the inherent unsteady operating characteristics of the rotor. It is worth noting that, with increasing rotational speed, a low-temperature region emerges near monitoring point 8. This phenomenon may result from a reduced thermal exchange gradient in that area, coupled with ineffective scavenging airflow failing to reach the location, leading to localized cooling. The presence of such a low-temperature zone may potentially have adverse effects on the performance or durability of downstream components within the system.
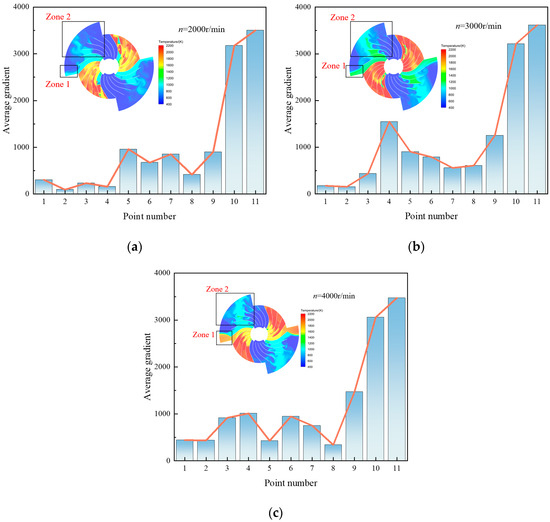
Figure 12.
Circumferential temperature distribution under different operating conditions. (a) n = 2000 r/min; (b) n = 3000 r/min; (c) n = 4000 r/min.
The previous section analyzed the circumferential temperature gradient at the RWRC outlet. In this section, attention is turned to the radial temperature gradient, which is equally important, particularly considering that the RWRC must interface with a downstream transition section in practical applications. Non-uniform temperature distributions across the radial direction may negatively affect the performance and thermal management of the transition section. The radial temperature gradient is used to analyze the monitoring points with a distance of 12 mm. Figure 13a presents the average uniformity coefficients at different radial positions under various operating conditions. As shown, the uniformity coefficients remain below 0.95 across all conditions as radial distance increases. For high-speed cases, such as n = 4000 r/min, the average uniformity coefficient is approximately 0.85, indicating that significant radial temperature variation persists even at larger radius. Moreover, under n = 3000 r/min and n = 4000 r/min, a decline in temperature uniformity is observed with increasing radial distance. This suggests that the thermal non-uniformity across the RWRC outlet persists in the radial direction, especially under high-speed conditions. Combined with the previous analysis, it can be inferred that the larger the expansion of the high-temperature zone, the more pronounced the overall outlet temperature non-uniformity becomes. To further investigate the radial variation in temperature uniformity, the radial gradients at selected monitoring points under n = 4000 r/min were analyzed. The results show that, in Zone 1, the radial gradient at the corresponding monitoring point decreased by approximately 50% with increasing radial distance. In contrast, monitoring points 2, 4, and 6 in Zone 2 exhibited increased gradient values, indicating that the scavenging process and associated flow behavior in Zone 2 significantly influence the radial temperature gradient.
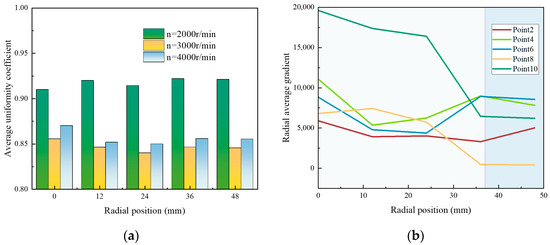
Figure 13.
Average uniformity coefficient and average radial gradient at different radial positions. (a) Average uniformity coefficient at different radial positions; (b) average radial gradient strength at n = 4000 r/min.
In general, the temperature gradient intensity tends to decrease with radial distance. However, due to the intrinsic unsteady and periodic operation of the wave rotor, radial temperature non-uniformity remains a persistent issue. This poses a noteworthy engineering challenge, particularly in ensuring consistent thermal conditions for downstream components and mitigating thermal stress across the transition section.
4.2. Outlet Pressure Characteristics
Compared with temperature variation, pressure fluctuation is a more critical focus in the study of the RWRC. Based on the working principle of the RWRC, pressure distribution is often localized and may only occur within a limited portion of the outlet. Figure 14 illustrates the temporal evolution of the instantaneous pressure fluctuation and the corresponding uniformity coefficient at the RWRC outlet. Unlike the case of temperature, where no clear correlation is observed between instantaneous fluctuation and uniformity coefficient, pressure fluctuation and uniformity exhibit a notable correlation. Specifically, under different operating conditions, the instantaneous pressure fluctuation value tends to increase before the uniformity coefficient shows a subsequent decrease, indicating that both parameters may be driven by a common physical mechanism. A detailed examination of the periodic behavior of the two curves reveals that the fluctuation period of the instantaneous pressure aligns with the rotational speed of the wave rotor. As the rotor speed increases, the duration of the pressure fluctuation troughs shortens, while the recovery time of the uniformity coefficient becomes longer. This suggests that increasing rotor speed has a significant impact on outlet pressure characteristics. From a mechanistic perspective, this behavior can be attributed to the cyclical interaction between the rotor channels and the exhaust port. When a channel periodically aligns with the exhaust port, initiating the discharge of high-pressure gas, it triggers a sudden change in local pressure. This interaction is the primary reason behind the periodic fluctuations in both instantaneous pressure and the uniformity coefficient observed at the RWRC outlet. In summary, rotor speed plays a key role in modulating the pressure characteristics at the RWRC outlet, and the pressure non-uniformity is directly linked to the timing and frequency of channel-exhaust port interaction, highlighting the need for optimized control strategies in high-performance applications.
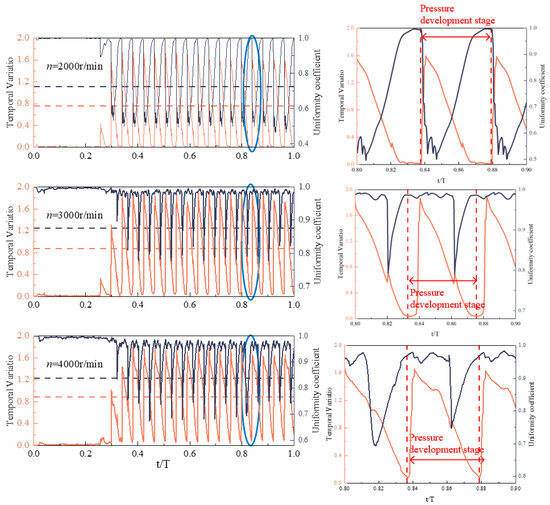
Figure 14.
Temporal variation in outlet pressure fluctuation and uniformity coefficient.
Based on the above analysis, the circumferential gradient intensity of pressure exhibits more pronounced variations compared to that of temperature. Due to the singular nature of the influencing factor—namely, the periodic opening of the channel—the circumferential pressure gradient displays distinct characteristics from those of the temperature field. Figure 15 illustrates the variation in circumferential pressure gradients under different operating conditions. As shown in the figure, with the increase in rotational speed, the gradient values at monitoring points 10 and 11 exhibit a clear upward trend. Concurrently, some changes are also observed at monitoring points 8 and 9, where the pressure gradient begins to intensify. In contrast, the gradient values at other monitoring locations remain relatively small and can be considered negligible. This observation is attributed to the expansion waves generated by the sudden change in gas properties when the channel opens, which subsequently propagate through the RWRC outlet. Overall, despite the increase in rotational speed, the spatial pattern of the circumferential pressure distribution remains concentrated near the channel opening location (Zone 1), with no significant redistribution across the outlet. This localized concentration of pressure fluctuations is detrimental to the downstream component performance, as it may introduce flow distortion, mechanical stress, or thermal fatigue. Therefore, effective regulation of pressure distribution is a key technical challenge in the application of the RWRC. Future design efforts should consider implementing transition sections, geometric modifications, or timing optimization strategies to mitigate localized pressure gradients and ensure more uniform flow delivery to downstream systems.
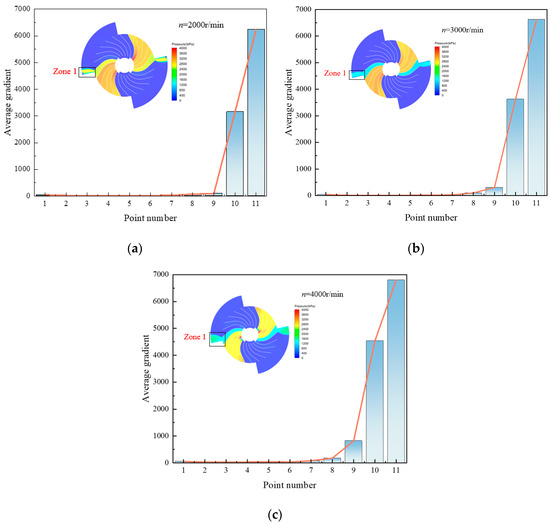
Figure 15.
Distribution of circumferential pressure under different operating conditions. (a) n = 2000 r/min; (b) n = 3000 r/min; (c) n = 4000 r/min.
In the radial direction, since the RWRC must be connected to a transition section, the radial distribution of pressure is also a critical parameter requiring close attention. Figure 16 presents the relationship between the average radial pressure gradient and radial distance for selected monitoring points at a rotational speed of 4000 r/min. As shown, due to the uneven pressure distribution, the pressure is concentrated near the channel opening, also resulting in a non-uniform radial distribution. However, with increasing radial distance, the pressure gradient generally decreases, dropping by approximately 70% at a radial distance of 48 mm. Meanwhile, the pressure gradient at Monitoring Point 8 shows an increasing trend, indicating that although the pressure varies with radial distance, the problem of uneven pressure distribution remains unresolved. Addressing this issue requires further in-depth investigation by researchers to develop effective mitigation strategies.
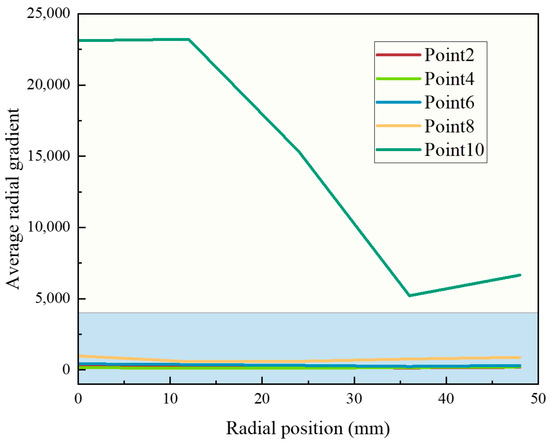
Figure 16.
Average gradient at different radial positions at n = 4000 r/min.
5. Conclusions
By establishing a three-dimensional simplified numerical model of the radial wave rotor combustor (RWRC), this study analyzes the variation and distribution characteristics of temperature and pressure at the rotor outlet. Quantitative evaluation metrics such as relative standard deviation and Christiansen Uniformity Coefficient were introduced to systematically investigate the distribution patterns of temperature and pressure at the RWRC outlet. The main conclusions are as follows:
- Both temperature and pressure at the RWRC outlet exhibit periodic fluctuations over time, with pulsation periods correlated to the rotational speed of the RWRC. Specifically, the pressure variation is primarily dominated by a single factor—rotor speed—while temperature fluctuations are influenced by both rotor speed and the working process. The two instantaneous evaluation parameters introduced in this study also show periodic variations with time.
- The temperature distribution at the RWRC outlet is relatively more uniform. Under the operating condition of 4000 r/min, the temperature distribution region roughly covers the entire exhaust port. The average temperature pulsation amplitude and the mean uniformity coefficient are approximately 0.5 and 0.8, respectively. As rotational speed increases, the temperature distribution pattern changes significantly, characterized by a gradual expansion of the temperature distribution area.
- The pressure distribution at the RWRC outlet presents a pronounced localized concentration, with large pressure gradients near the channel opening and negligible gradients elsewhere. From the uniformity coefficient (Christiansen Uniformity Coefficient, CUC) and pulsation amplitude (Relative Standard Deviation, RSD) perspectives, the average pressure pulsation (RSD) amplitude is above 0.65 and the uniformity coefficient (CUC) exceeds 0.75. Moreover, the pressure distribution pattern does not show significant changes with increasing rotational speed.
- The circumferential temperature distribution at the RWRC outlet changes with increasing speed, showing an expansion of the temperature distribution area to cover the entire outlet region. The radial temperature gradient decreases with radial distance and exhibits certain variations in distribution patterns. The circumferential pressure gradient remains essentially unchanged with speed increase, while the radial pressure gradient gradually decreases with radial distance but maintains a stable distribution pattern.
Looking forward, the focus of future work will shift to the experimental validation of the numerically predicted outlet pressure field, which will be achieved by employing high-frequency pressure transducers to capture its dynamic characteristics. Building upon this validated model, subsequent research will then explore and develop design strategies for an optimized transition duct, aiming to effectively mitigate the identified non-uniformity and its adverse effects on the performance and longevity of downstream turbine components.
Author Contributions
Conceptualization, E.G., J.L. (Jianzhong Li), Q.Y. and W.J.; Methodology, E.G.; Formal analysis, J.L. (Jize Liang); Investigation, J.L. (Jize Liang) and E.G.; Resources, J.L. (Jianzhong Li), Q.Y. and W.J.; Writing—original draft, J.L. (Jize Liang); Writing—review & editing, E.G.; Visualization, J.L. (Jize Liang); Supervision, E.G. and J.L. (Jianzhong Li); Project administration, E.G.; Funding acquisition, J.L. (Jianzhong Li), Q.Y. and W.J. All authors have read and agreed to the published version of the manuscript.
Funding
This work was supported by National Defense Technology Basic Research Project (Grant No. 1002TJA22010).
Data Availability Statement
The datasets presented in this article are not readily available because the dataset is part of an ongoing, unfinished research project and still has room for optimization. Requests to access the datasets should be directed to the corresponding author via email (gongel@czu.cn).
Conflicts of Interest
The authors declare no conflicts of interest.
References
- Lin, Y.Z.; Xu, Q.H.; Liu, G.E. Gas Turbine Combustor; National Defense Industry Press: Beijing, China, 2008. [Google Scholar]
- Kim, I.; Jin, H.; Ri, K.; Hyon, S.; Huang, C. Design methodology for combustor in advanced gas turbine engines: A review. Aircr. Eng. Aerosp. Technol. 2024, 96, 285–296. [Google Scholar] [CrossRef]
- Ergin, C.C.; Verstraete, T.; Saracoglu, B.H. The Design and Optimization of Additively Manufactured Radial Compressor of a Miniature Gas Turbine Engine. J. Fluids Eng. 2024, 146, 071108. [Google Scholar] [CrossRef]
- Haque, M.A.; Nemitallah, M.A.; Abdelhafez, A.; Mansir, I.B.; Habib, M.A.M. Review of Fuel/oxidizer-flexible Combustion in Gas Turbines. Energy Fuels 2020, 34, 10459–10485. [Google Scholar] [CrossRef]
- Parraga-Ramirez, P.F. Practical Power and Combustion Investigations on First Wave Disk Engine Prototypes. Ph.D. Thesis, Michigan State University, East Lansing, MI, USA, 2013. [Google Scholar]
- Iancu, F.; Zhu, X.; Tang, Y.; Alsam, D.; Müller, N. Design and fabrication of microchannel test rig for ultra-micro wave rotors. Microsyst. Technol. 2008, 14, 79–88. [Google Scholar] [CrossRef]
- Lu, F.K.; Braun, E.M. Rotating Detonation Wave Propulsion: Experimental Challenges, Modeling, and Engine Concepts. J. Propuls. Power 2014, 30, 1125–1142. [Google Scholar] [CrossRef]
- Pezhman, A.; Razi, N.; Norbert, M. A Review of Wave Rotor Technology and Its Applications. J. Eng. Gas Turbines Power 2006, 128, 717–735. [Google Scholar] [CrossRef]
- Zheng, R.; Li, J.; Gong, E.; Qin, Q.; Feng, Z. Numerical Investigation of The Unsteady Flow and Wave Dynamics in A Wave Rotor Combustor. Shock Waves 2024, 34, 257–271. [Google Scholar] [CrossRef]
- Sun, G.; Akbari, P.; Gower, B.; Mueller, N. Thermodynamics of The Wave Disk Engine. In Proceedings of the 48th AIAA/ASME/SAE/ASEE Joint Propulsion Conference & Exhibit, Atlanta, Georgia, 30 July–1 August 2012. [Google Scholar] [CrossRef]
- Sun, G. Numerical Study of the Aerodynamic Characteristics of a Wave Disc Engine. Ph.D. Thesis, Michigan State University, East Lansing, MI, USA, 2011. [Google Scholar]
- Zheng, R.; Gong, E.; Li, J.; Yao, Q.; Nie, Z. Performance Analysis of Wave Rotor Combustor Integration into Baseline Engines: A Comparative Study of Pressure-Gain and Work Cycles. Energies 2024, 17, 2074. [Google Scholar] [CrossRef]
- Wilson, J.; Paxson, D.E. Wave Rotor Optimization for Gas Turbine Engine Topping Cycles. J. Propuls. Power 1996, 12, 778–785. [Google Scholar] [CrossRef]
- Nagashima, T.; (Department of Aeronautics and Astronautics, The University of Tokyo, Tokyo, Japan); Okamoto, K.; (Department of Aeronautics and Astronautics, The University of Tokyo, Tokyo, Japan). Experimental Investigation of The Wave Discs. Private communication, 2005. [Google Scholar]
- Akbari, P.; Nalim, R.; Li, H. Analytic Aerothermodynamic Cycle Model of The Combustion Wave Rotor in A Gas Turbine Engine. In Proceedings of the 4th International Energy Conversion Engineering Conference and Exhibit, San Diego, CA, USA, 26–29 June 2006. [Google Scholar] [CrossRef]
- Akbari, P.; Agoos, I. Two-Stage Wave Disk Engine Concept and Performance Prediction; SAE Technical Paper No. 2017-01-2046; SAE International: Warrendale, PA, USA, 2017. [Google Scholar] [CrossRef]
- Piechna, J.; Akbari, P.; Iancu, F.; Müller, N. Radial-Flow Wave Rotor Concepts, Unconventional Designs and Applications. In Proceedings of the ASME International Mechanical Engineering Congress & Exhibition, IMECE2004-59022, Anaheim, CA, USA, 16–18 November 2004. [Google Scholar]
- Akbari, P.; Polanka, M.D. Performance of An Ultra-compact Disk-shaped Reheat Gas Turbine for Power Generation. In Proceedings of the 2018 Joint Propulsion Conference, Cincinnati, OH, USA, 9–11 July 2018. [Google Scholar] [CrossRef]
- Brun, K.; McKee, R.J.; Moore, J.; Gernentz, R.S.; Hollingsworth, J.R.; Smalley, A.J. Prototype Development of A Novel Radial Flow Gas Turbine. In Proceedings of the ASME Turbo Expo 2005: Power for Land, Sea, and Air, Reno, NV, USA, 6–9 June 2005. [Google Scholar]
- Nalim, M.R. Longitudinally Stratified Combustion in Wave Rotors. J. Propuls. Power 2000, 16, 1060–1068. [Google Scholar] [CrossRef]
- Pekkan, K.; Nalim, M.R. Two-Dimensional Flow and NOx Emissions in Deflagrative Internal Combustion Wave Rotor Configurations. J. Eng. Gas Turbines Power 2003, 125, 720–733. [Google Scholar] [CrossRef]
- Wijeyakulasuriya, S.; Nalim, R. Multidimensional Modeling of Gas Mixing in Transient Translating Confined Turbulent Jets. In Proceedings of the 49th AIAA Aerospace Sciences Meeting including the New Horizons Forum and Aerospace Exposition, Orlando, FL, USA, 4–7 January 2011. [Google Scholar] [CrossRef]
- Wijeyakulasuriya, S.; Nalim, R. Gas Injection Strategies in Confined Subsonic Cross-flow for Wave Rotor Fueling. In Proceedings of the 44th AIAA/ASME/SAE/ASEE Joint Propulsion Conference & Exhibit, Hartford, CT, USA, 21–23 July 2008. [Google Scholar] [CrossRef]
- Matsutomi, Y.; Meyer, S.; Wijeyakulasuriya, S.; Izzy, Z.; Nalim, M.; Shimo, M.; Kowalkowski, M.; Snyder, P. Experimental investigation on the wave rotor constant volume combustor. In Proceedings of the 46th AIAA/ASME/SAE/ASEE Joint Propulsion Conference & Exhibit, Nashville, TN, USA, 25–28 July 2010; p. 7043. [Google Scholar] [CrossRef]
- Khalid, S.; Banerjee, A.; Akbari, P.; Nalim, M. Two-dimensional numerical modeling of mixture inflow in a combustion wave rotor. In Proceedings of the 4th International Energy Conversion Engineering Conference and Exhibit (IECEC), San Diego, CA, USA, 26–29 June 2006; p. 4125. [Google Scholar] [CrossRef]
- Feng, Z.; Li, J.; Gong, E.; Yao, Q.; Chen, X.; Chen, Y. Numerical Study on the Effect of Channel Configuration on Mixture Formation of an Axial Flow Wave Rotor Combustor. J. Fluids Eng. 2024, 146, 121202. [Google Scholar] [CrossRef]
- Karimi, A. Numerical Study of Hot Jet Ignition of Hydrocarbon-Air Mixtures in a Constant-Volume Combustor. Ph.D. Thesis, Purdue University, West Lafayette, IN, USA, 2014. [Google Scholar]
- Kiran, R.; Wijeyakulasuriya, S.; Mueller, N.; Piechna, J. Thermodynamic Cycle Efficiency Enhancement in A Wave Disk Engine by Re-injection of Combusted Gas for Pre-compression. In Proceedings of the 48th AIAA/ASME/SAE/ASEE Joint Propulsion Conference & Exhibit, Atlanta, GA, USA, 30 July–1 August 2012. [Google Scholar] [CrossRef]
- Najim, M.Y.; Mueller, N.; Wichman, I.S. On Premixed Flame Propagation in a Curved Constant Volume Channel. Combust. Flame 2015, 162, 3980–3990. [Google Scholar] [CrossRef]
- Hariharan, A. Experimental and Numerical Study of Premixed Flame Propagation in a Constant Volume Combustion Chamber. Ph.D. Thesis, Michigan State University, East Lansing, MI, USA, 2012. [Google Scholar]
- He, R.; Zhang, F.; Li, J.; Gong, E.; Yao, Q.; Jin, W. Experimental study on propagation characteristics and instability of premixed flames in radial wave rotor combustor channel. Fuel 2025, 386, 134142. [Google Scholar] [CrossRef]


Disclaimer/Publisher’s Note: The statements, opinions and data contained in all publications are solely those of the individual author(s) and contributor(s) and not of MDPI and/or the editor(s). MDPI and/or the editor(s) disclaim responsibility for any injury to people or property resulting from any ideas, methods, instructions or products referred to in the content. |
© 2025 by the authors. Licensee MDPI, Basel, Switzerland. This article is an open access article distributed under the terms and conditions of the Creative Commons Attribution (CC BY) license (https://creativecommons.org/licenses/by/4.0/).