1. Introduction
Insulated gate bipolar transistors (IGBTs) are key components in power electronic systems and are widely deployed in electric vehicles, renewable energy systems, industrial automation, and consumer electronics [
1,
2]. Their main features include high efficiency, low saturation voltage, high current density, and simple drive control, which make them central to modern power applications. However, the performance of IGBTs gradually degrades over time. Under high current and high switching frequency, thermal and mechanical stresses accumulate, altering measurable electrical quantities such as the collector-to-emitter voltage and the gate-to-emitter voltage. The resulting drift increases the risk of system failure and unplanned downtime. Despite advances in packaging and thermal management, failures remain possible. Early prediction of degradation trends, accurate estimation of remaining useful life, and timely fault warnings are therefore essential for safe and reliable operation.
Existing approaches to IGBT degradation prediction can be categorized into three main groups: physical modeling, statistical reliability modeling, and data-driven modeling. Physical modeling relies on stress–strain and thermo-mechanical analyses to describe internal mechanisms. Complex material properties and variable operating conditions limit its accuracy. For example, Ahsan [
3] studied the impact of switching frequency and power loss on IGBT reliability, while Li [
4] and Wang [
5] reported physics-based models for battery aging. Although theoretically rigorous, these models often show limited generalization due to material heterogeneity and unpredictable environments, which has reduced interest in purely physical approaches. Statistical modeling uses historical failure data and lifetime distributions. Thebaud et al. applied Weibull distributions to predict IGBT damage levels [
6], and Zio et al. combined particle filtering and Monte Carlo simulation in a Bayesian framework to assess battery health [
7]. However, methods grounded in reliability statistics depend on probability density fitting and may yield insufficient accuracy when data are scarce or heterogeneous.
Data-driven methods have emerged as a promising alternative because they capture complex degradation patterns directly from measurements [
8]. Neural networks, in particular, have shown potential. Ahsan [
9] developed models based on neural networks and adaptive neuro-fuzzy inference systems; however, their performance was limited at the early stage of degradation. Ismail et al. [
10] proposed a feed-forward neural network with principal component analysis and reported a prediction accuracy of 60.4%. To better model temporal dependence, recurrent neural networks and their variants have been introduced. Reference [
11] utilized the collector-to-emitter conduction voltage as a feature for an LSTM-based remaining life prediction model, demonstrating that the early trend can be captured and updated as aging progresses. Xie Feng [
12] proposed a GRU-based model that handles changing operating conditions. In practice, data-driven approaches can learn latent degradation patterns from large datasets. Nevertheless, conventional neural networks still struggle in the early stage, where feature changes are subtle. Additionally, selecting LSTM architectures and hyperparameters can be computationally expensive, which limits their practical deployment [
13]. Recent work on physics-informed machine learning (PIML) formalizes how domain knowledge can regularize learning objectives and architectures in prognostics and health management. Surveys from 2023 and 2024 summarize integration patterns, including physics-guided feature construction, constrained losses, and hybrid gray-box structures, for condition monitoring, and highlight the benefits under small-data regimes, along with deployment considerations [
14,
15,
16,
17]. This literature provides the broader context for device-centric IGBT prognostics and motivates the use of lightweight physics checks alongside data-driven forecasting.
Recent studies have explored optimized LSTM variants for predicting IGBT health. CNN-LSTM combines convolutional layers for spatial correlations with LSTM layers for temporal dynamics, which is helpful for multivariate inputs and has shown promise in tracking IGBT aging under varying conditions [
18]. EMD-LSTM utilizes empirical mode decomposition to extract intrinsic mode functions from nonlinear, non-stationary signals, and then feeds them to an LSTM to enhance accuracy for complex waveforms [
19]. LSTM-AE integrates autoencoding into LSTM to learn compact representations when labeled data are limited, which can help detect early degradation [
20]. Convolutional-LSTM augments LSTM with convolutional feature extraction for scenarios that involve both spatial and temporal structure, as in multi-sensor configurations [
21]. Related optimization and learning strategies, such as improved swarm-based algorithms and gray-code-inspired search for feature selection and model tuning, have been reported in broader machine learning contexts and motivate automated model configuration for predictive maintenance [
22,
23].
Although these models provide value, many require manual architecture design and extensive tuning. This paper proposes a practical alternative for IGBT degradation forecasting: an extended short-term memory network configured through a simple, budgeted genetic algorithm search. The search selects depth and width within a predefined space by validation loss under a shared protocol. The focus of the study is not a new optimizer. The contribution is an IGBT-specific formulation that links failure mechanisms to measurable indicators and then to forecasting suitable for maintenance planning. Bond-wire and solder-layer fatigue progressively modify the current path, parasitics, and thermal state. During fast turn-off with a high current fall rate, these changes appear as a larger and more variable turn-off overvoltage. In contrast, during conduction, the on-state collector-to-emitter voltage (denoted ) reflects the evolution of temperature and the conduction path. These indicators are measurable in power-cycling experiments and motivate short, cycle-aligned input windows. All models in this work employ identical preprocessing, normalization based on the training set, device-stratified splits, and a consistent window length to ensure reproducibility and fair comparison.
The remainder of the paper is organized as follows.
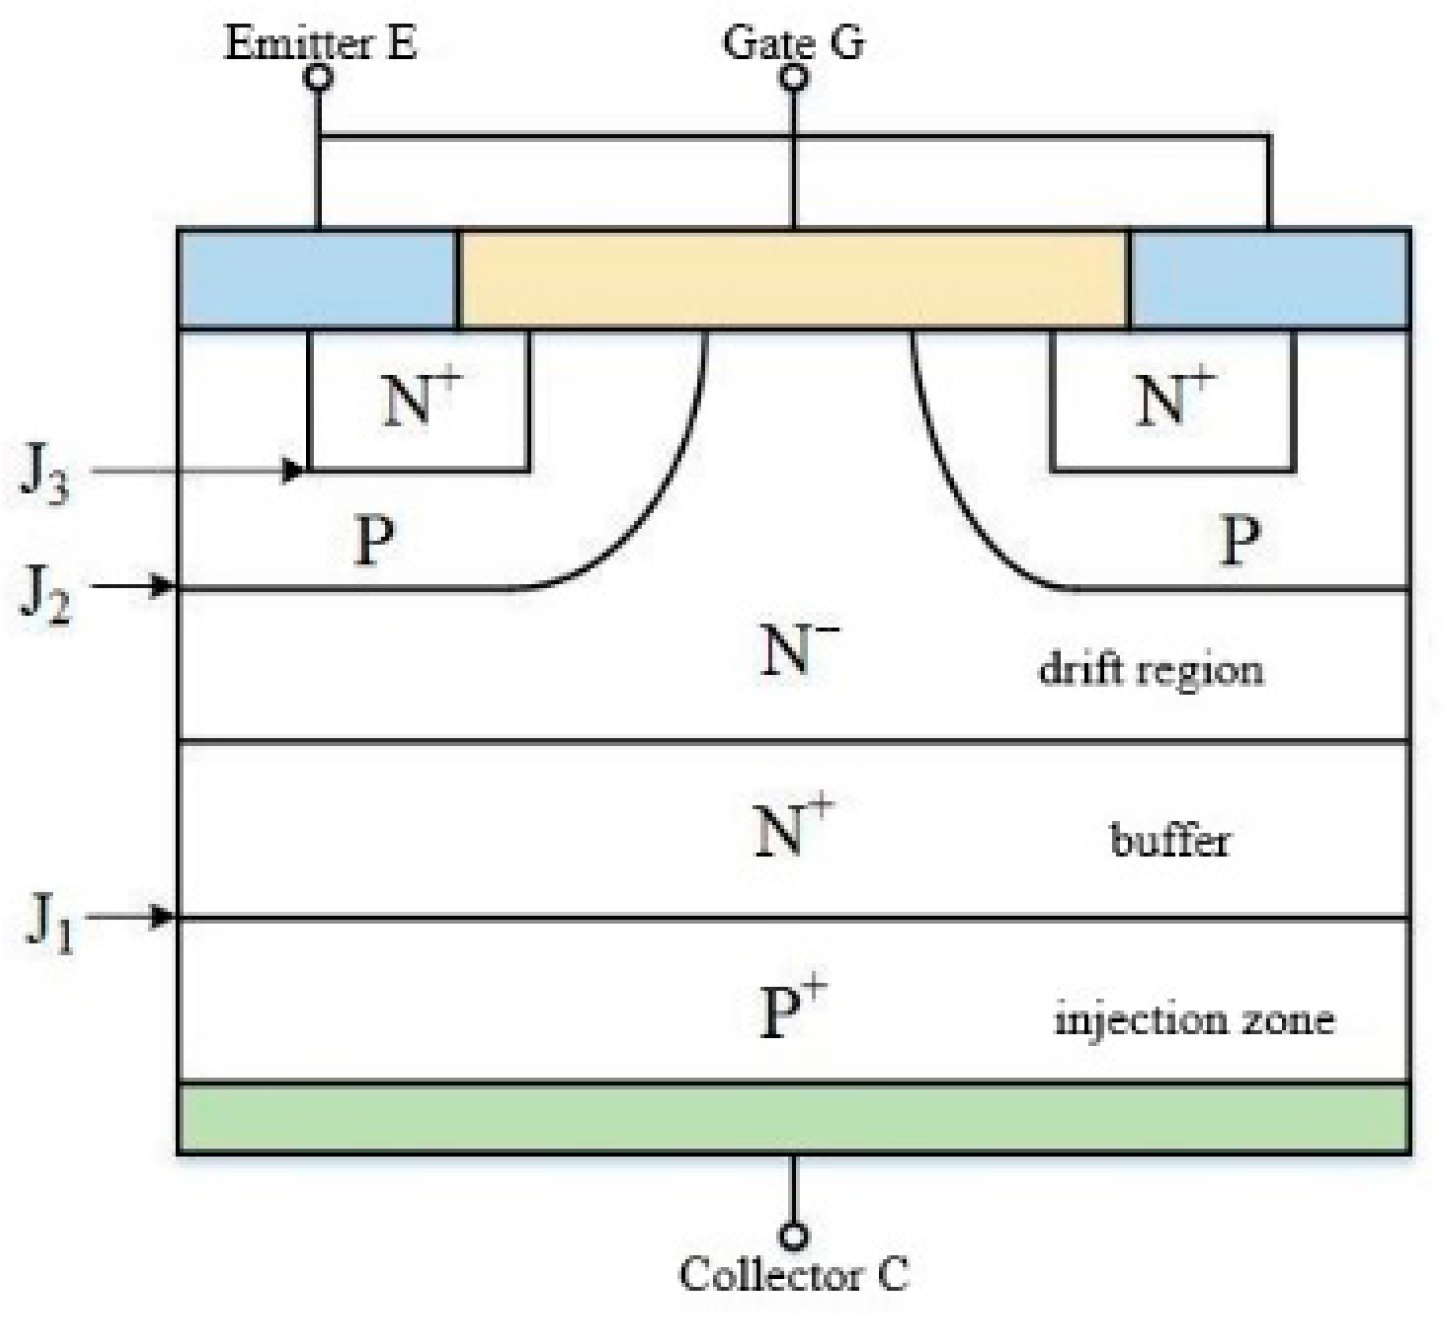
Section 2 summarizes the IGBT structure and failure mechanisms, explaining the link between these mechanisms and observables.
Section 3 describes the dataset, indicator extraction, and construction of cycle-aligned inputs.
Section 4 presents the forecasting model and the validation-based search used to set its configuration.
Section 5 presents the results and discusses robustness, runtime, and improvements to figures and captions.
Section 6 concludes and outlines directions for multivariate indicators and hybrid physics-informed modeling.
3. Aging Dataset and Feature Parameter Selection
Accurately predicting IGBT degradation requires the acquisition of high-quality aging datasets and well-defined feature parameters. This section details the source of the aging dataset, the feature selection process, and the rationale for the selection of feature parameters used in predictive modeling.
3.1. Source of Aging Dataset
This study uses the NASA Prognostics Center of Excellence IGBT Accelerated Aging Data Set (original release 2009) for packaged half-bridge IGBT modules (type YBTM600F07) [
29]. The repository description documents aging data from six devices, with one device aged under DC gate bias and the remainder under a squared-signal gate bias, and includes high-speed measurements of gate voltage, collector–emitter voltage, and collector current.
Power-cycling experiments are conducted under controlled conditions to accelerate degradation, using a gate-drive frequency of 10 kHz and a PWM duty cycle of 40%. Junction-temperature setpoints range from 329 to 345 °C. The test sequence lasts about 170 min until latch failure and yields 418 transient switching records. Each cycle contains 100,000 samples that include gate voltage,
,
, and collector current. Waveforms are processed to extract two indicators used throughout this study: the turn-off overvoltage and the
. A cycle-aligned sliding window constructs input sequences, and a simple window-based augmentation generates 5- to 20-step variants to mitigate overfitting and represent short-term fluctuations. The train, validation, and test partitions are stratified by device and operating condition to prevent leakage. Normalization statistics are computed on the training set and then applied to the validation and test sets.
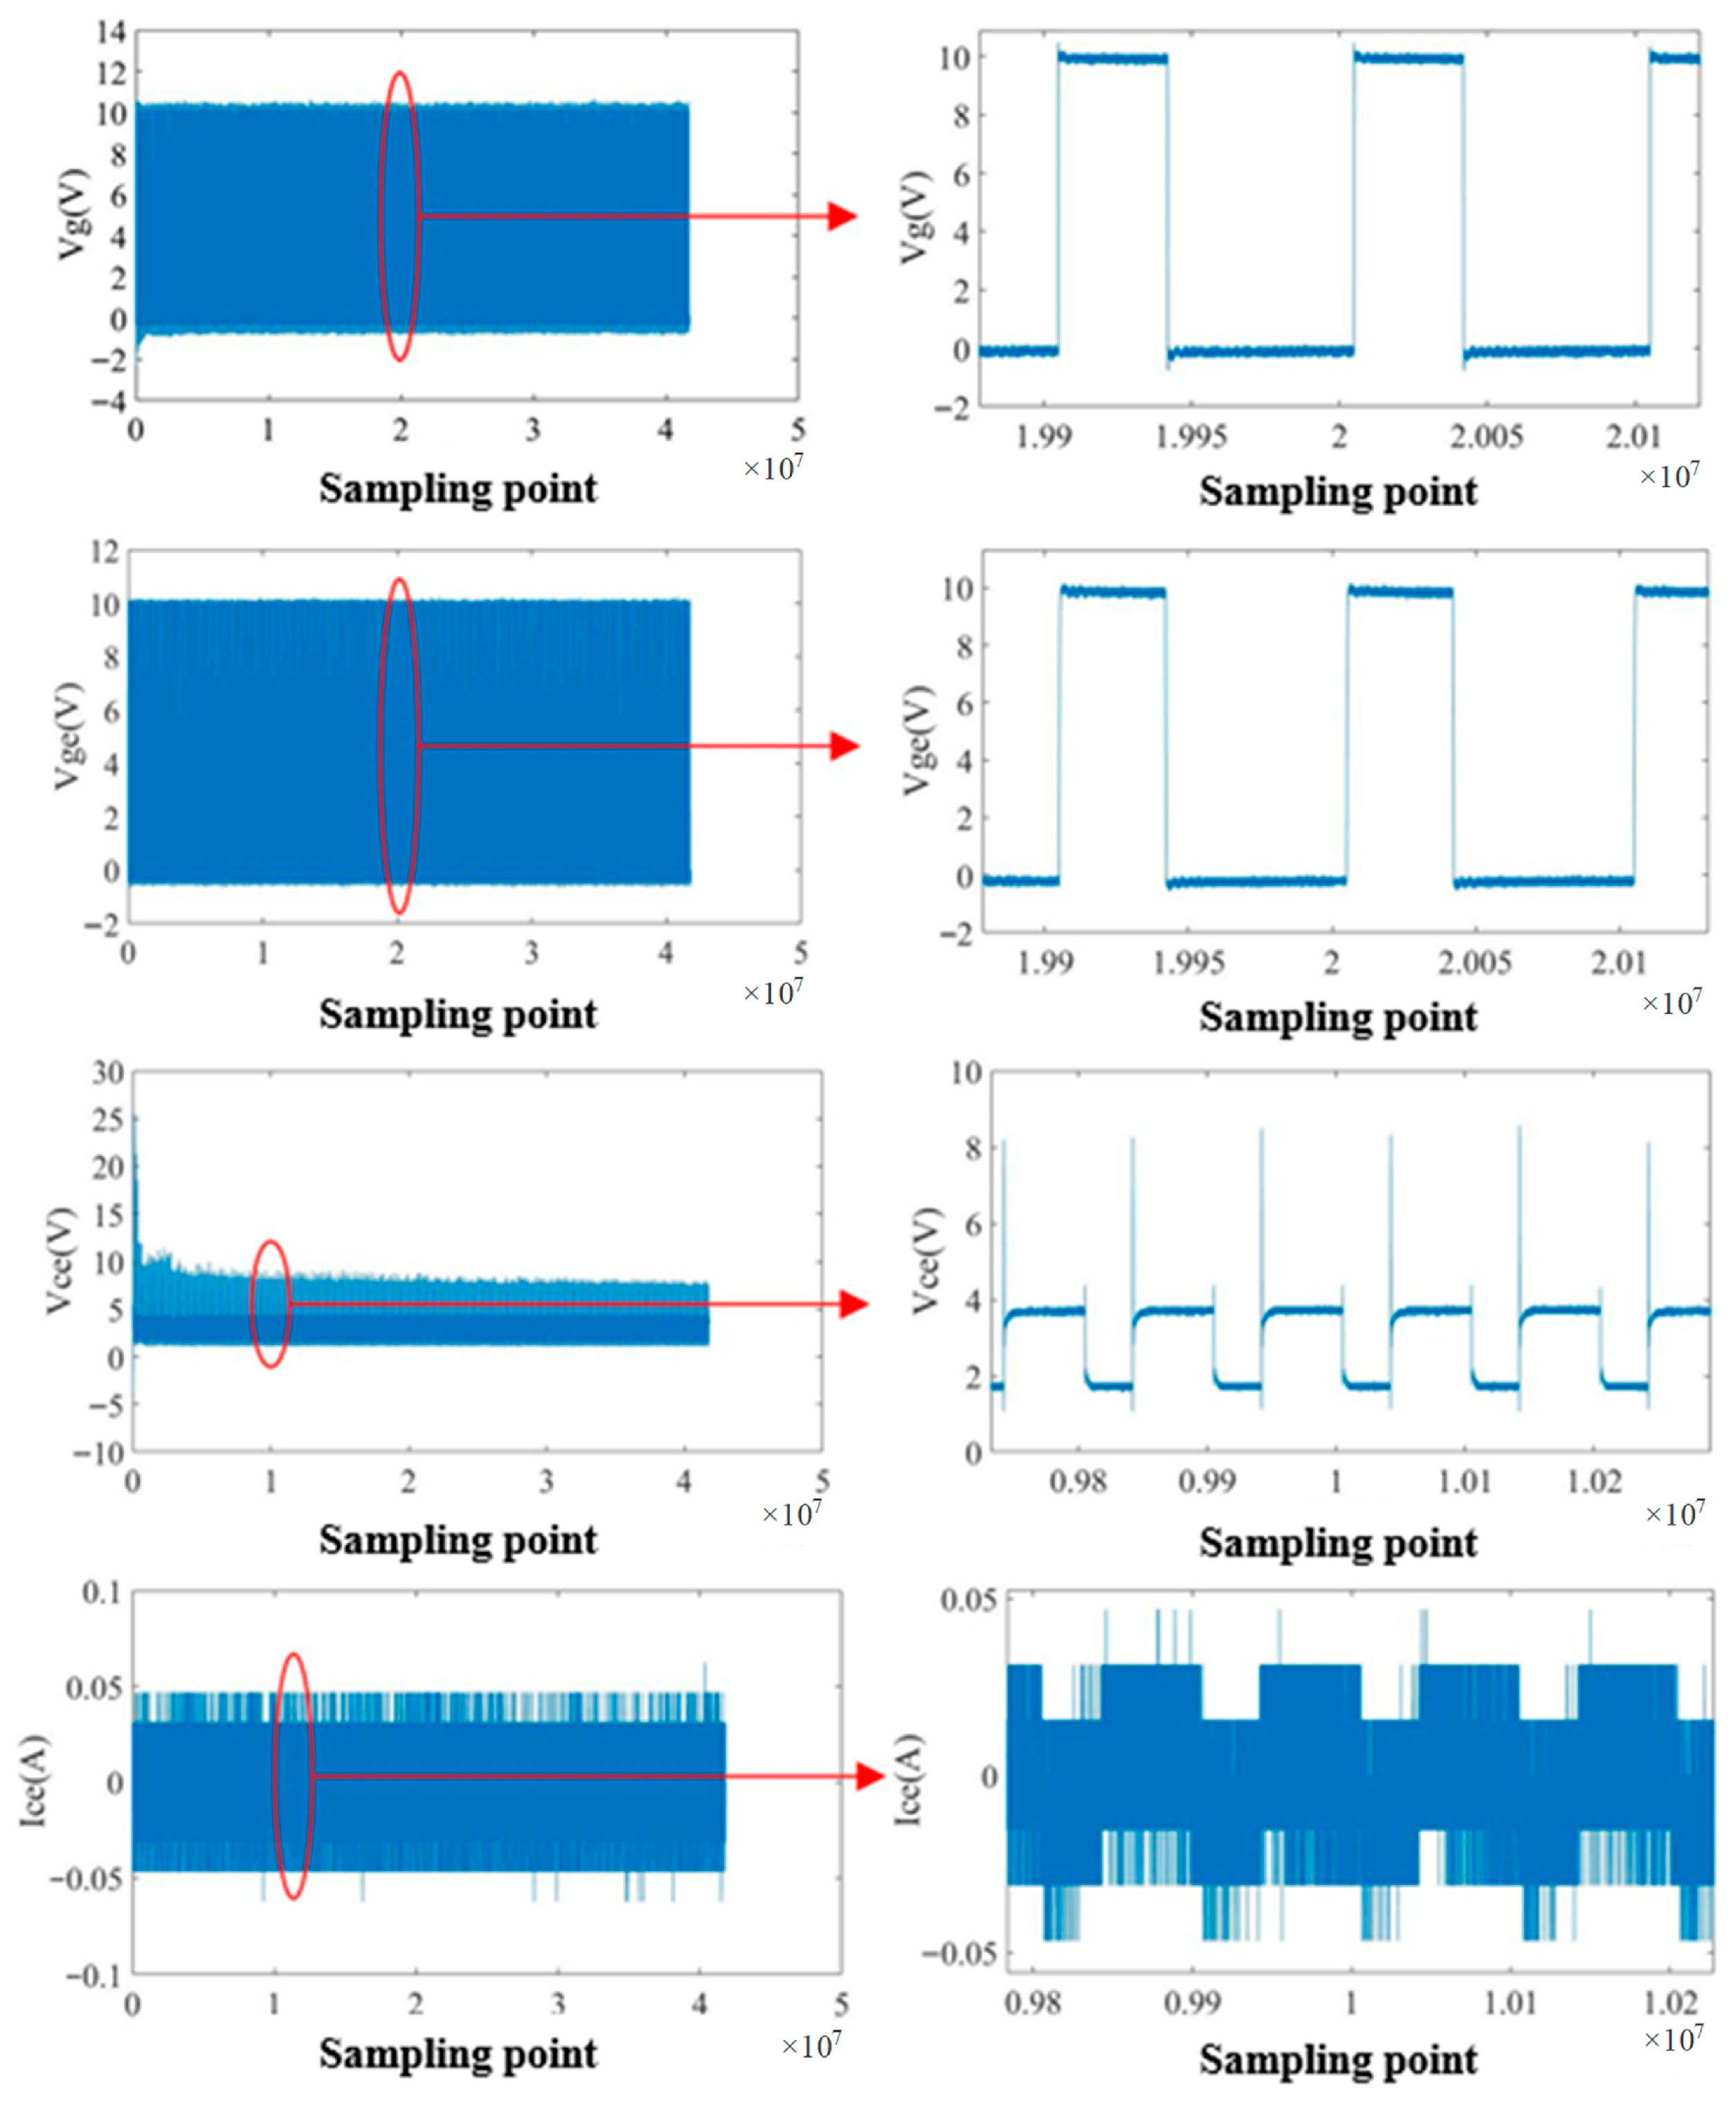
Table 1 summarizes the operating settings for the power-cycling experiments, and
Figure 3 presents representative switching records.
Table 1 shows a fixed 10 kHz gate drive and a 40% duty cycle across conditions, with junction temperatures set between 329 and 345 °C. The settings accelerate degradation while maintaining consistent acquisition, so models are compared under the same preprocessing and windowing conditions.
Figure 3 shows cycle-aligned waveforms with clear turn-off events and sufficient sampling density. The records preserve cycle-to-cycle variability, which supports the extraction of the turn-off overvoltage and the
for forecasting. The window-based augmentation preserves cycle alignment and label semantics, does not alter the class of operating conditions, and prevents device-level information from leaking across the train/validation/test splits.
3.2. Selection and Processing of Failure Characteristic Parameters
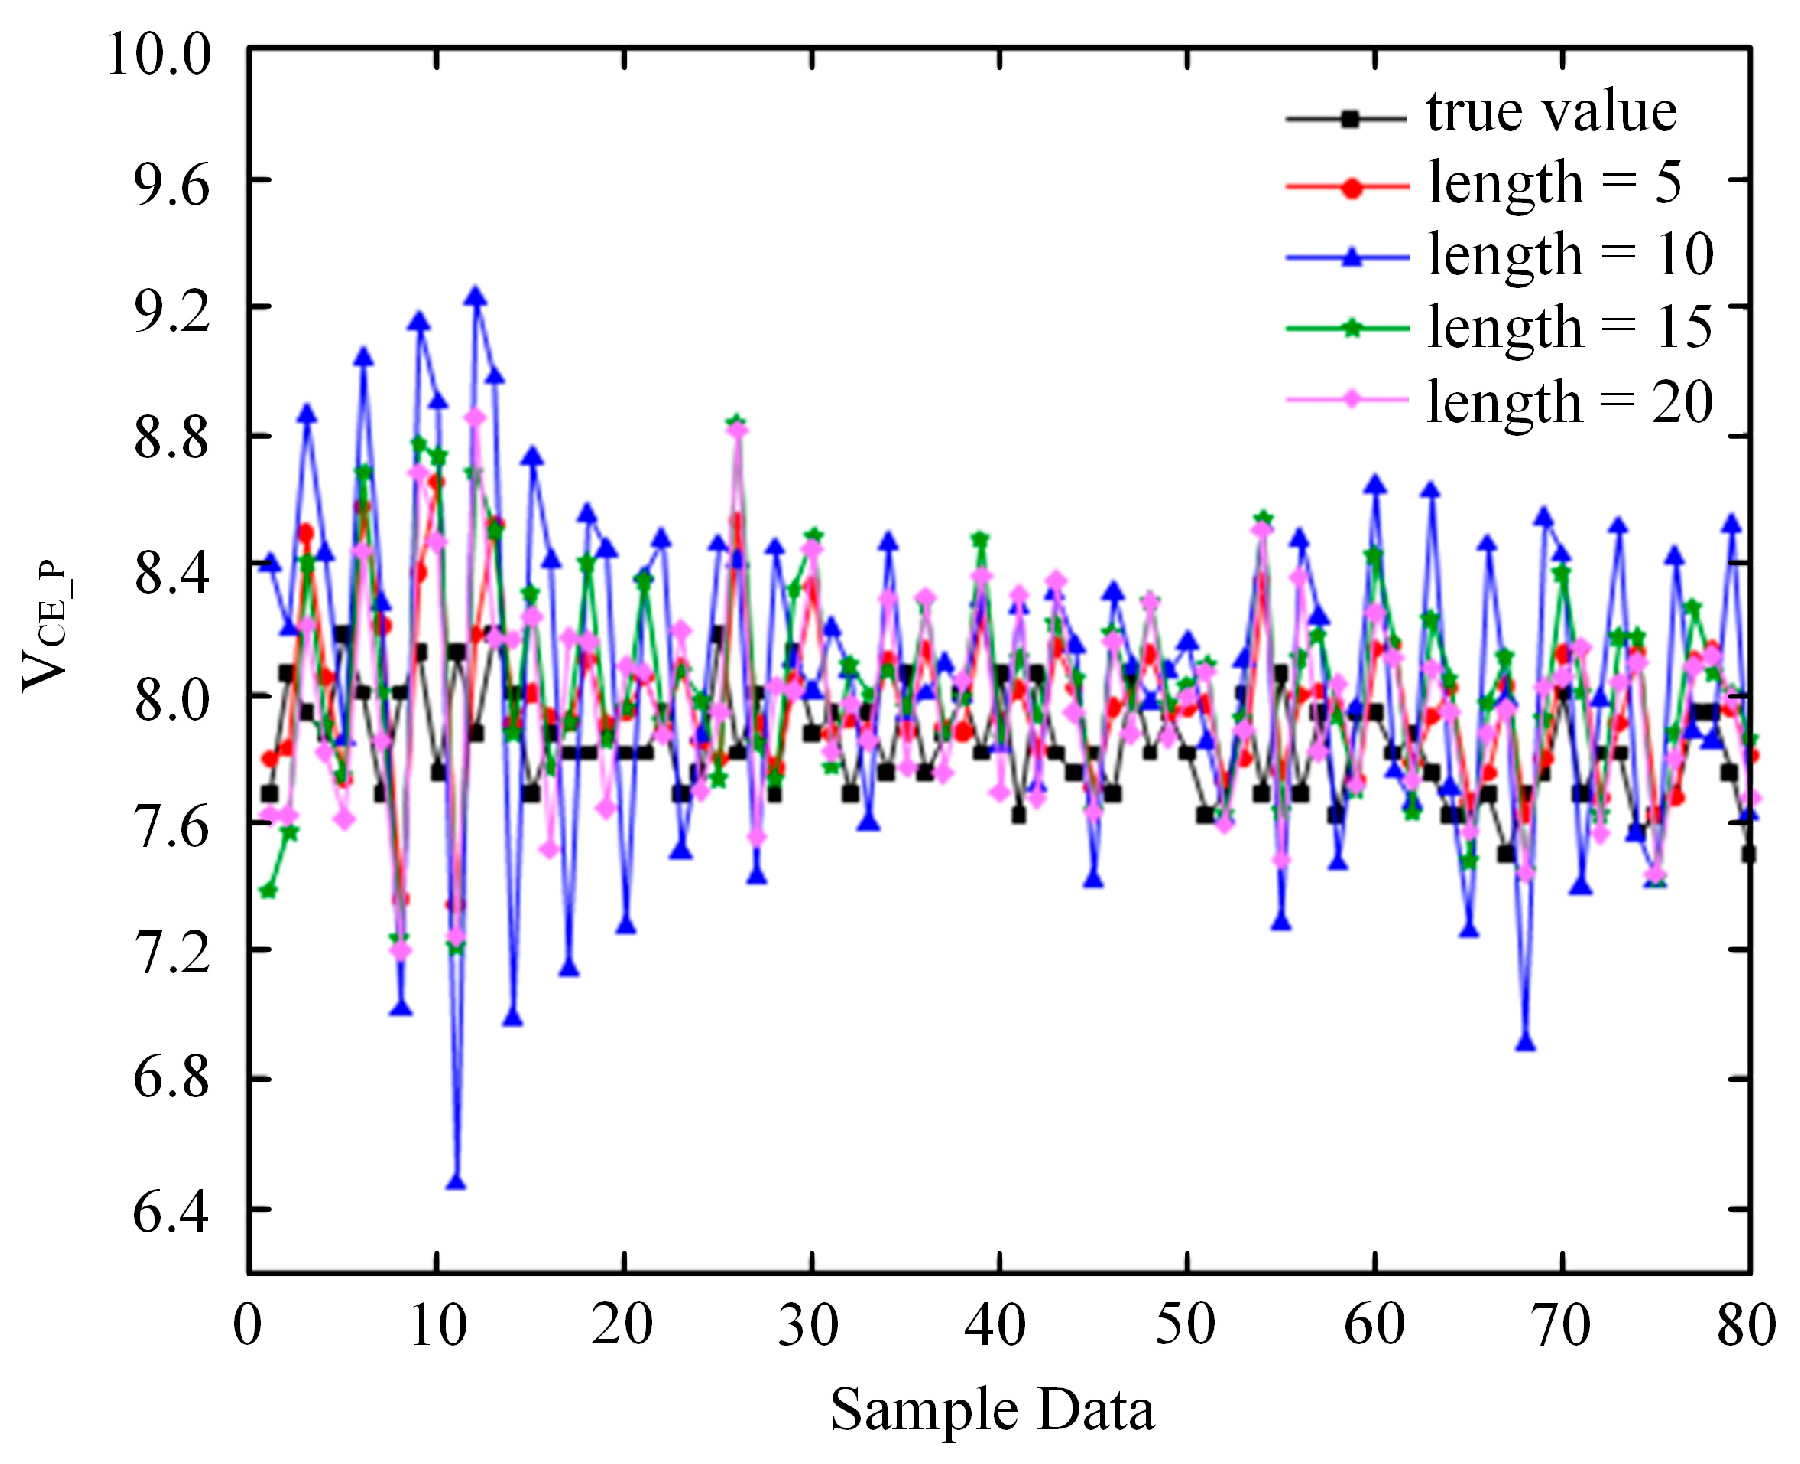
Degradation of internal structures in IGBT modules produces gradual changes in measurable electrical quantities. Indicator choice, therefore, focuses on signals that are sensitive to early deterioration and practical to obtain in power cycling. Two indicators are used throughout: turn-off overvoltage and . The former responds to parasitic and electrothermal shifts around the turn-off event, the latter tracks conduction path and temperature evolution. A five-point cubic smoothing removes high-frequency fluctuations while preserving the global trend. Time-series inputs are built by a cycle-aligned sliding window centered on the turn-off event. Window lengths of 5, 10, 15, and 20 steps are evaluated under identical preprocessing. Short windows emphasize local transients and better capture incipient changes, whereas longer windows introduce noise accumulation and reduce the number of usable sequences for a dataset of about 850 training samples. This trade-off is evident in the window study, where the 20-step setting yields a higher error than the 5-step setting (for example, RMSE 0.405 for 20 steps). All inputs are min-max normalized to the range [0, 1] using the training set statistics.
The same smoothing, cycle-aligned windowing, normalization, and device-stratified splits apply across all models. These steps stabilize indicator extraction, preserve local transients near the turn-off event, and prevent leakage between devices and operating conditions. In addition to the primary indicator, the framework allows for the inclusion of , gate-to-emitter threshold voltage when measurable, and a thermal-resistance proxy derived from the transient thermal response. These quantities are concatenated into a multivariate, cycle-aligned window under the same normalization and splits. This construction preserves the protocol while providing complementary information for stability under fluctuating conditions.
A long short-term memory (LSTM) architecture is employed to model the short, cycle-aligned sequences. Network depth and hidden-unit width are selected by a genetic algorithm search within a predefined space, using validation loss under the shared protocol described in
Section 4.3. The baseline uses a single-layer LSTM with a dense output. The GA-selected configuration increases capacity within bounds and is used for subsequent experiments under an identical evaluation protocol. As shown in
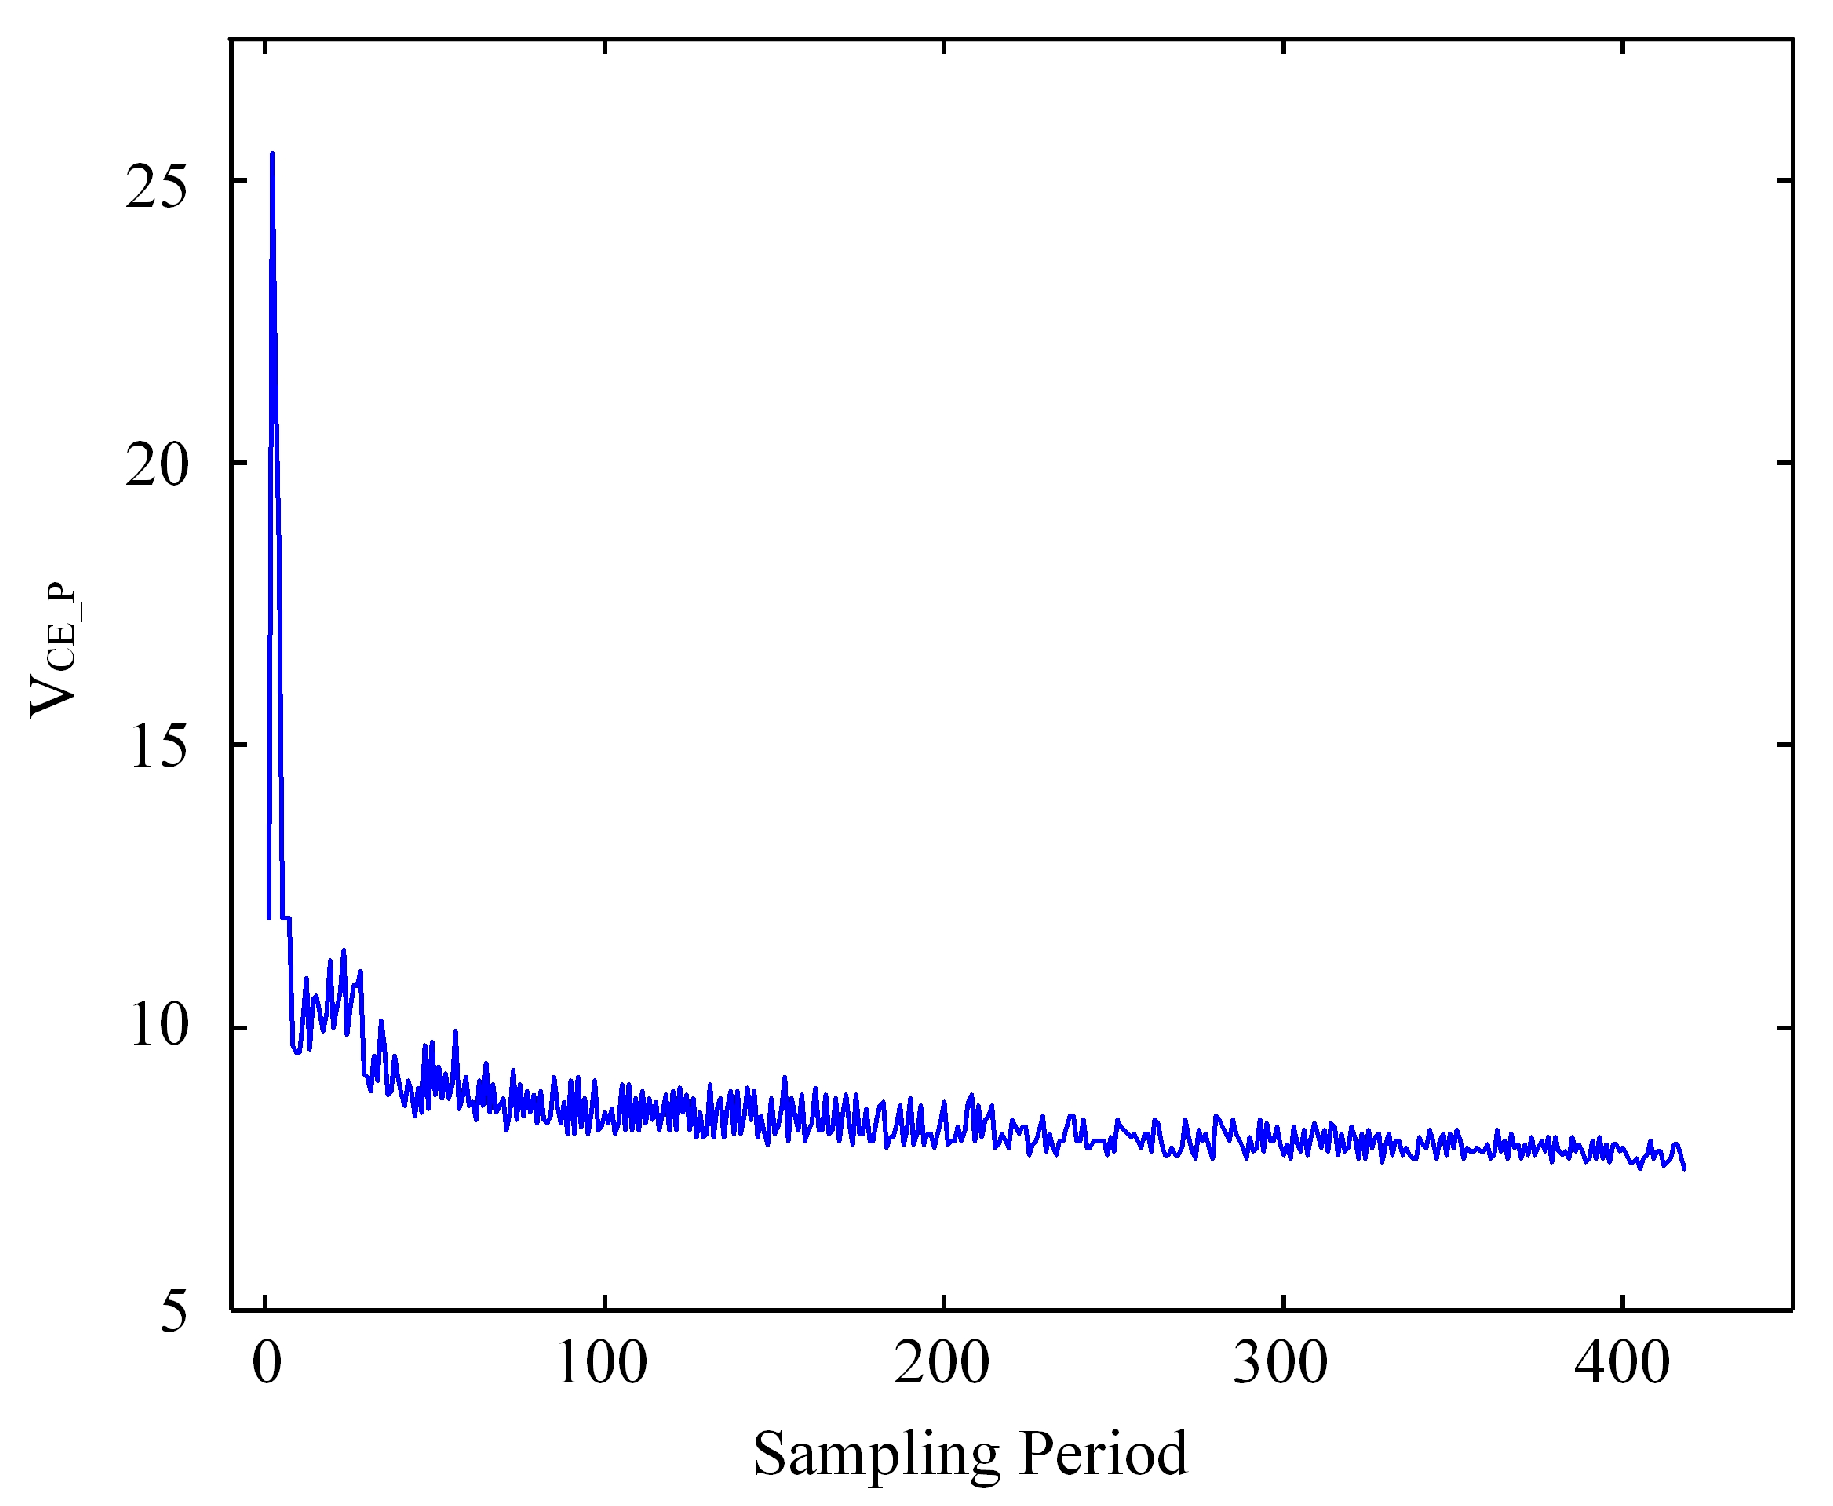
Figure 4, the trajectory of the turn-off overvoltage versus cycle index. The global trend is monotonic with mid-term fluctuations, which supports the use of event-centered windows for forecasting.
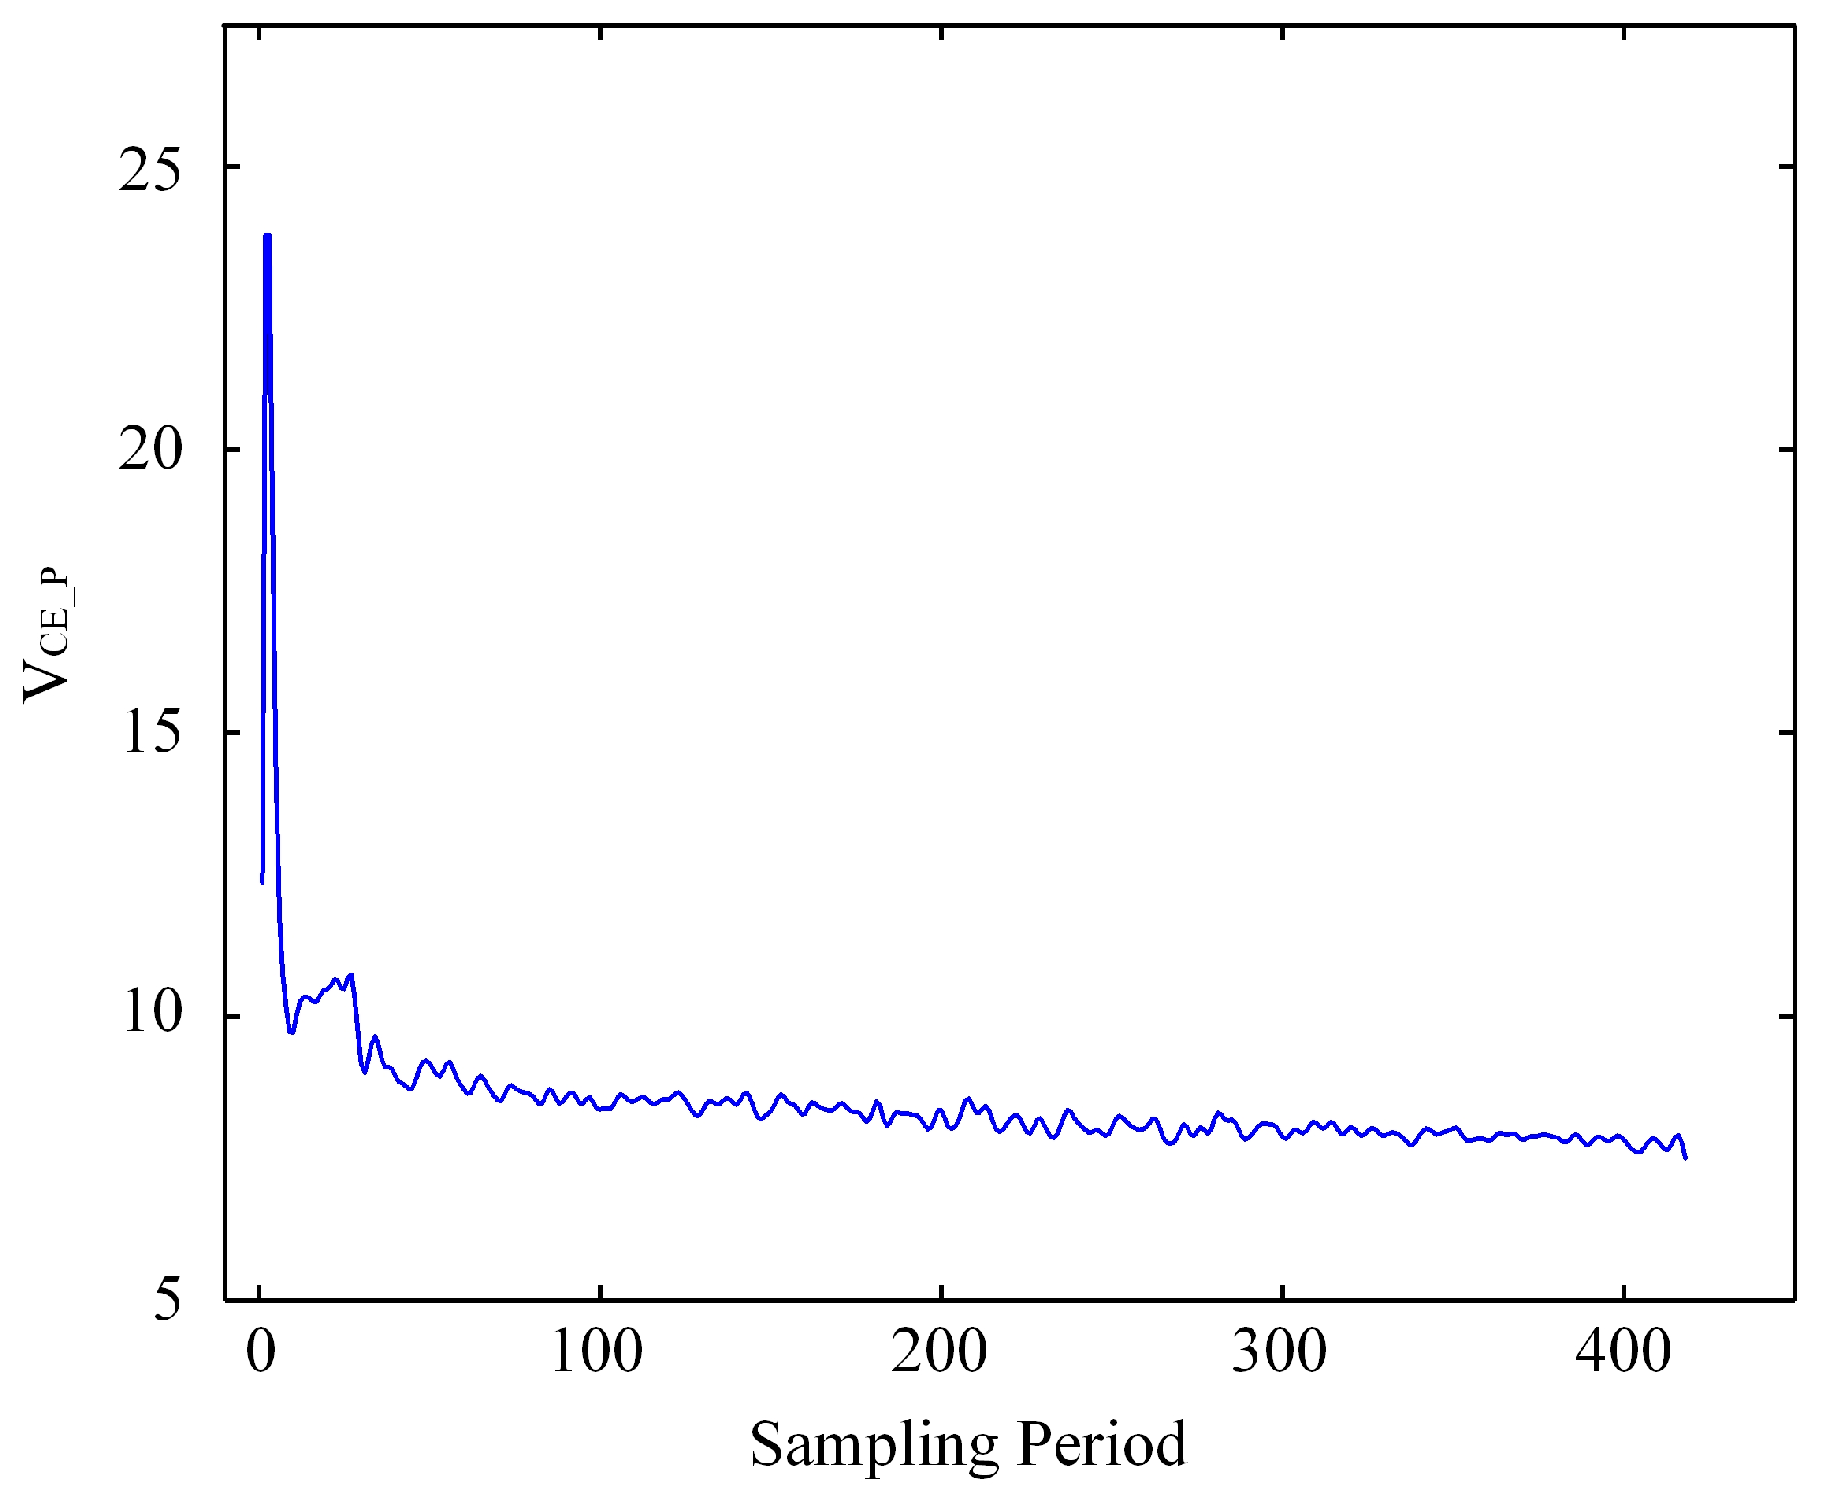
Figure 5 illustrates the effect of five-point cubic smoothing. Short-term noise is reduced while the overall tendency is preserved, which stabilizes indicator extraction and input construction.
In summary, the turn-off overvoltage serves as the primary indicator, complemented by smoothing, normalization, and cycle-aligned windowing. These preparations provide consistent inputs to the GA-tuned LSTM, emphasizing the early stage of degradation that is most relevant for maintenance.
4. GA-LSTM Prediction Model
Accurately predicting IGBT degradation requires a prediction model that can capture long-term dependencies in time series data and optimize model parameters to improve prediction accuracy. To achieve this, this study proposes an LSTM model optimized by a GA. This section provides a detailed description of the LSTM model’s working principle and the GA optimization process, accompanied by comprehensive flowcharts and diagrams.
4.1. LSTM Principle
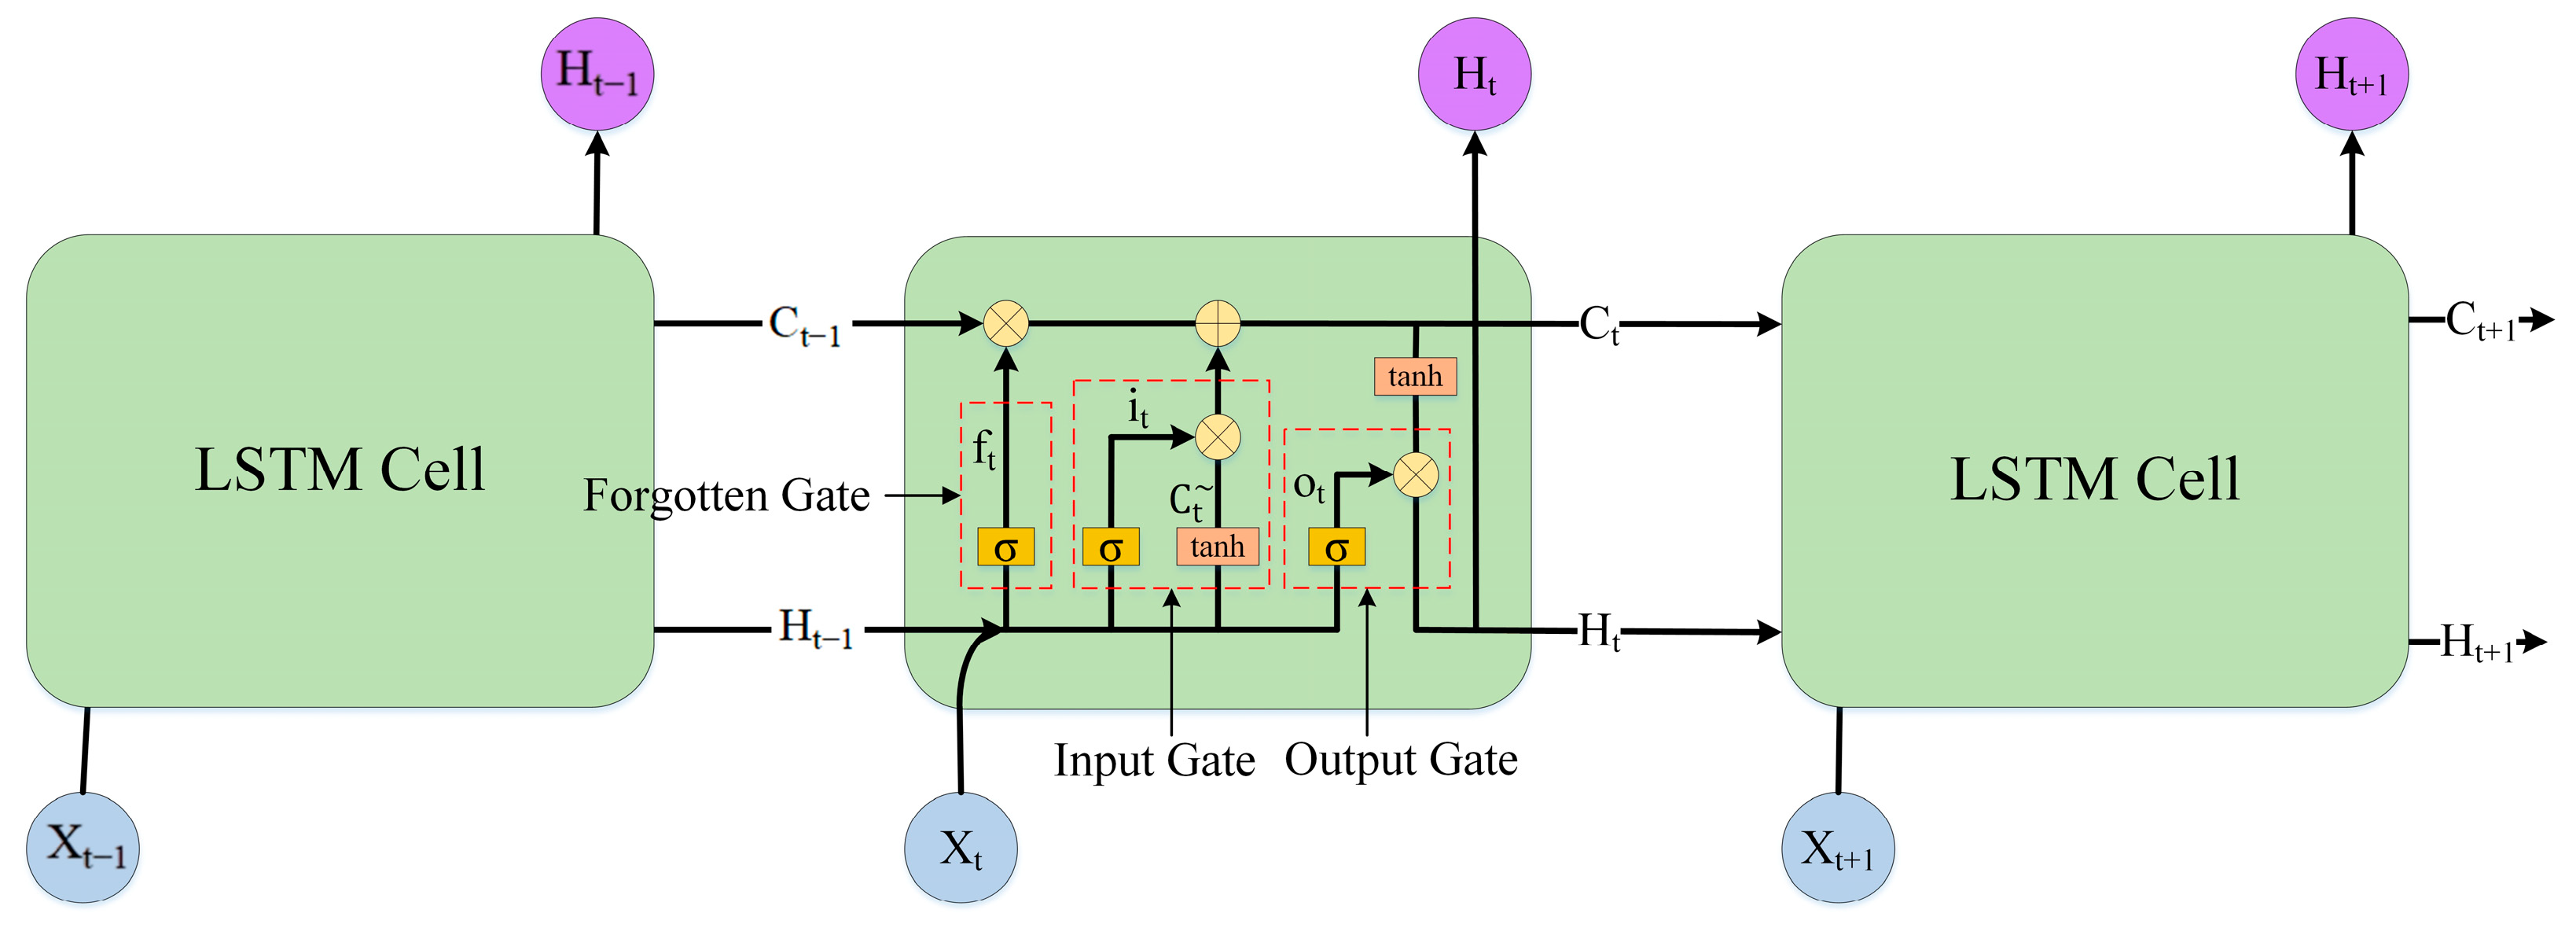
LSTM networks are a special type of recurrent neural network (RNN) designed to overcome the vanishing and exploding gradient problems that typically affect RNNs during long-term sequence modeling. The LSTM structure consists of three main components: the forget gate, the input gate, and the output gate. These components work together to selectively retain or discard information as data propagates through time steps. The structure of an LSTM cell is shown in
Figure 6.
Forgetting stage: long-term and short-term memory unit data from the previous moment
,
and the input data
at that time enters the unit structure together, and then filters through the forgetting gate important information in
. Forgotten Gate
can be expressed as:
The input-gate operation determines which information from the candidate input is written to the cell state.
Information update stage: through input gate
processes the short-term memory unit data
of the previous moment and the input data
. Determine which information is stored in the long-term memory unit. Before the input gate operates, the current input and the previous hidden state are first passed through a tanh layer to form the candidate input. The input gate and the candidate input are then given by (2) and (3).
Through
operation determines which information in the input data is stored. After determining the information that needs to be forgotten and stored, the data of the long-term memory unit is updated. This process can be represented by Equation (4):
Output stage: Data based on long-term memory units passes through output gate
determine final output, output gate
and this process can be represented as:
where
denotes element-wise multiplication between the output gate and the cell activation. By using forget gates, input gates, and output gates, LSTM can selectively remember important information while discarding irrelevant data. This makes LSTM an ideal choice for predicting time series data with long-term dependencies.
4.2. Integration of GA and LSTM
The Genetic Algorithm (GA) is a widely used optimization technique that mimics the natural process of survival of the fittest [
13]. GA is well-suited to discrete or mixed search spaces, does not require gradients, and is less prone to getting trapped in local minima. It is easy to parallelize, works under a fixed compute budget, and provides a reproducible way to discover strong configurations. This work proposes a GA-LSTM prediction model for forecasting IGBT degradation. The choice is motivated by two constraints of the problem: the architectural space is discrete and modest in size, and the dataset is limited with a fixed evaluation budget. Under these conditions, the automatic selection of depth and width by a genetic algorithm provides a reproducible and straightforward method for configuring the forecaster. At the same time, all preprocessing, cycle-aligned inputs, and device-stratified splits remain identical to those used for the baselines. The goal is to achieve a configuration that matches short, event-centered sequences without altering the shared protocol.
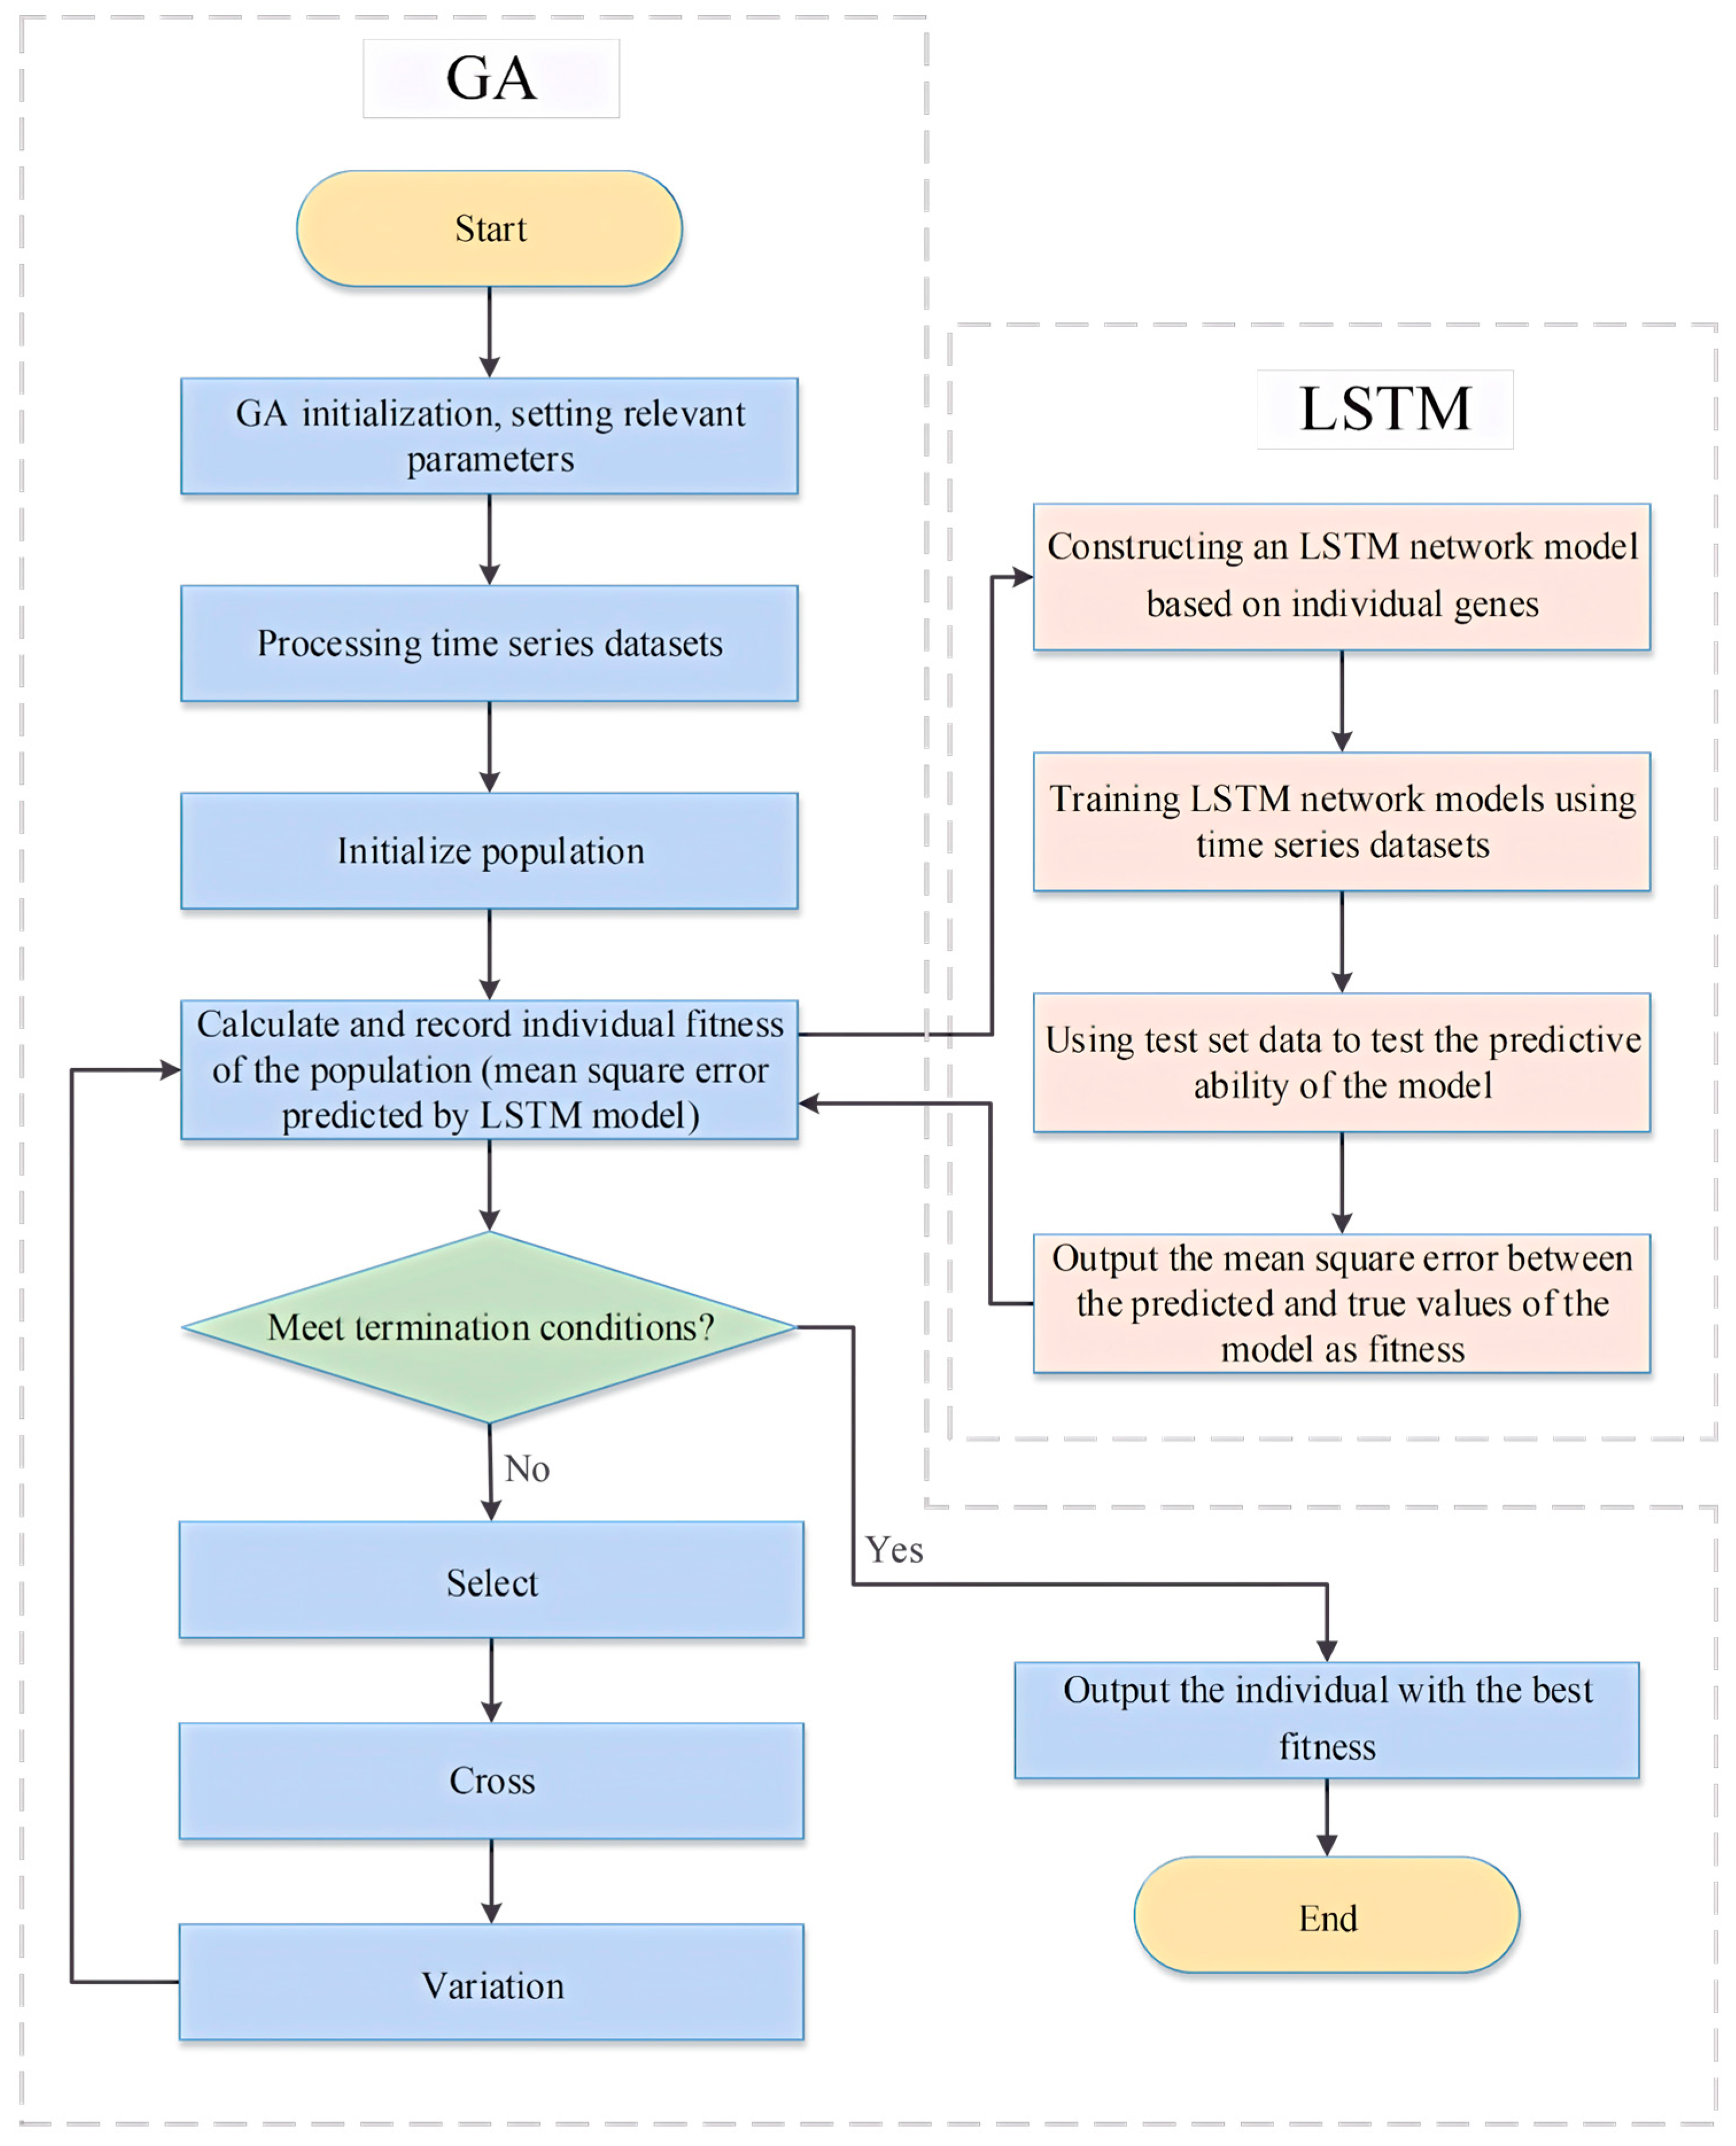
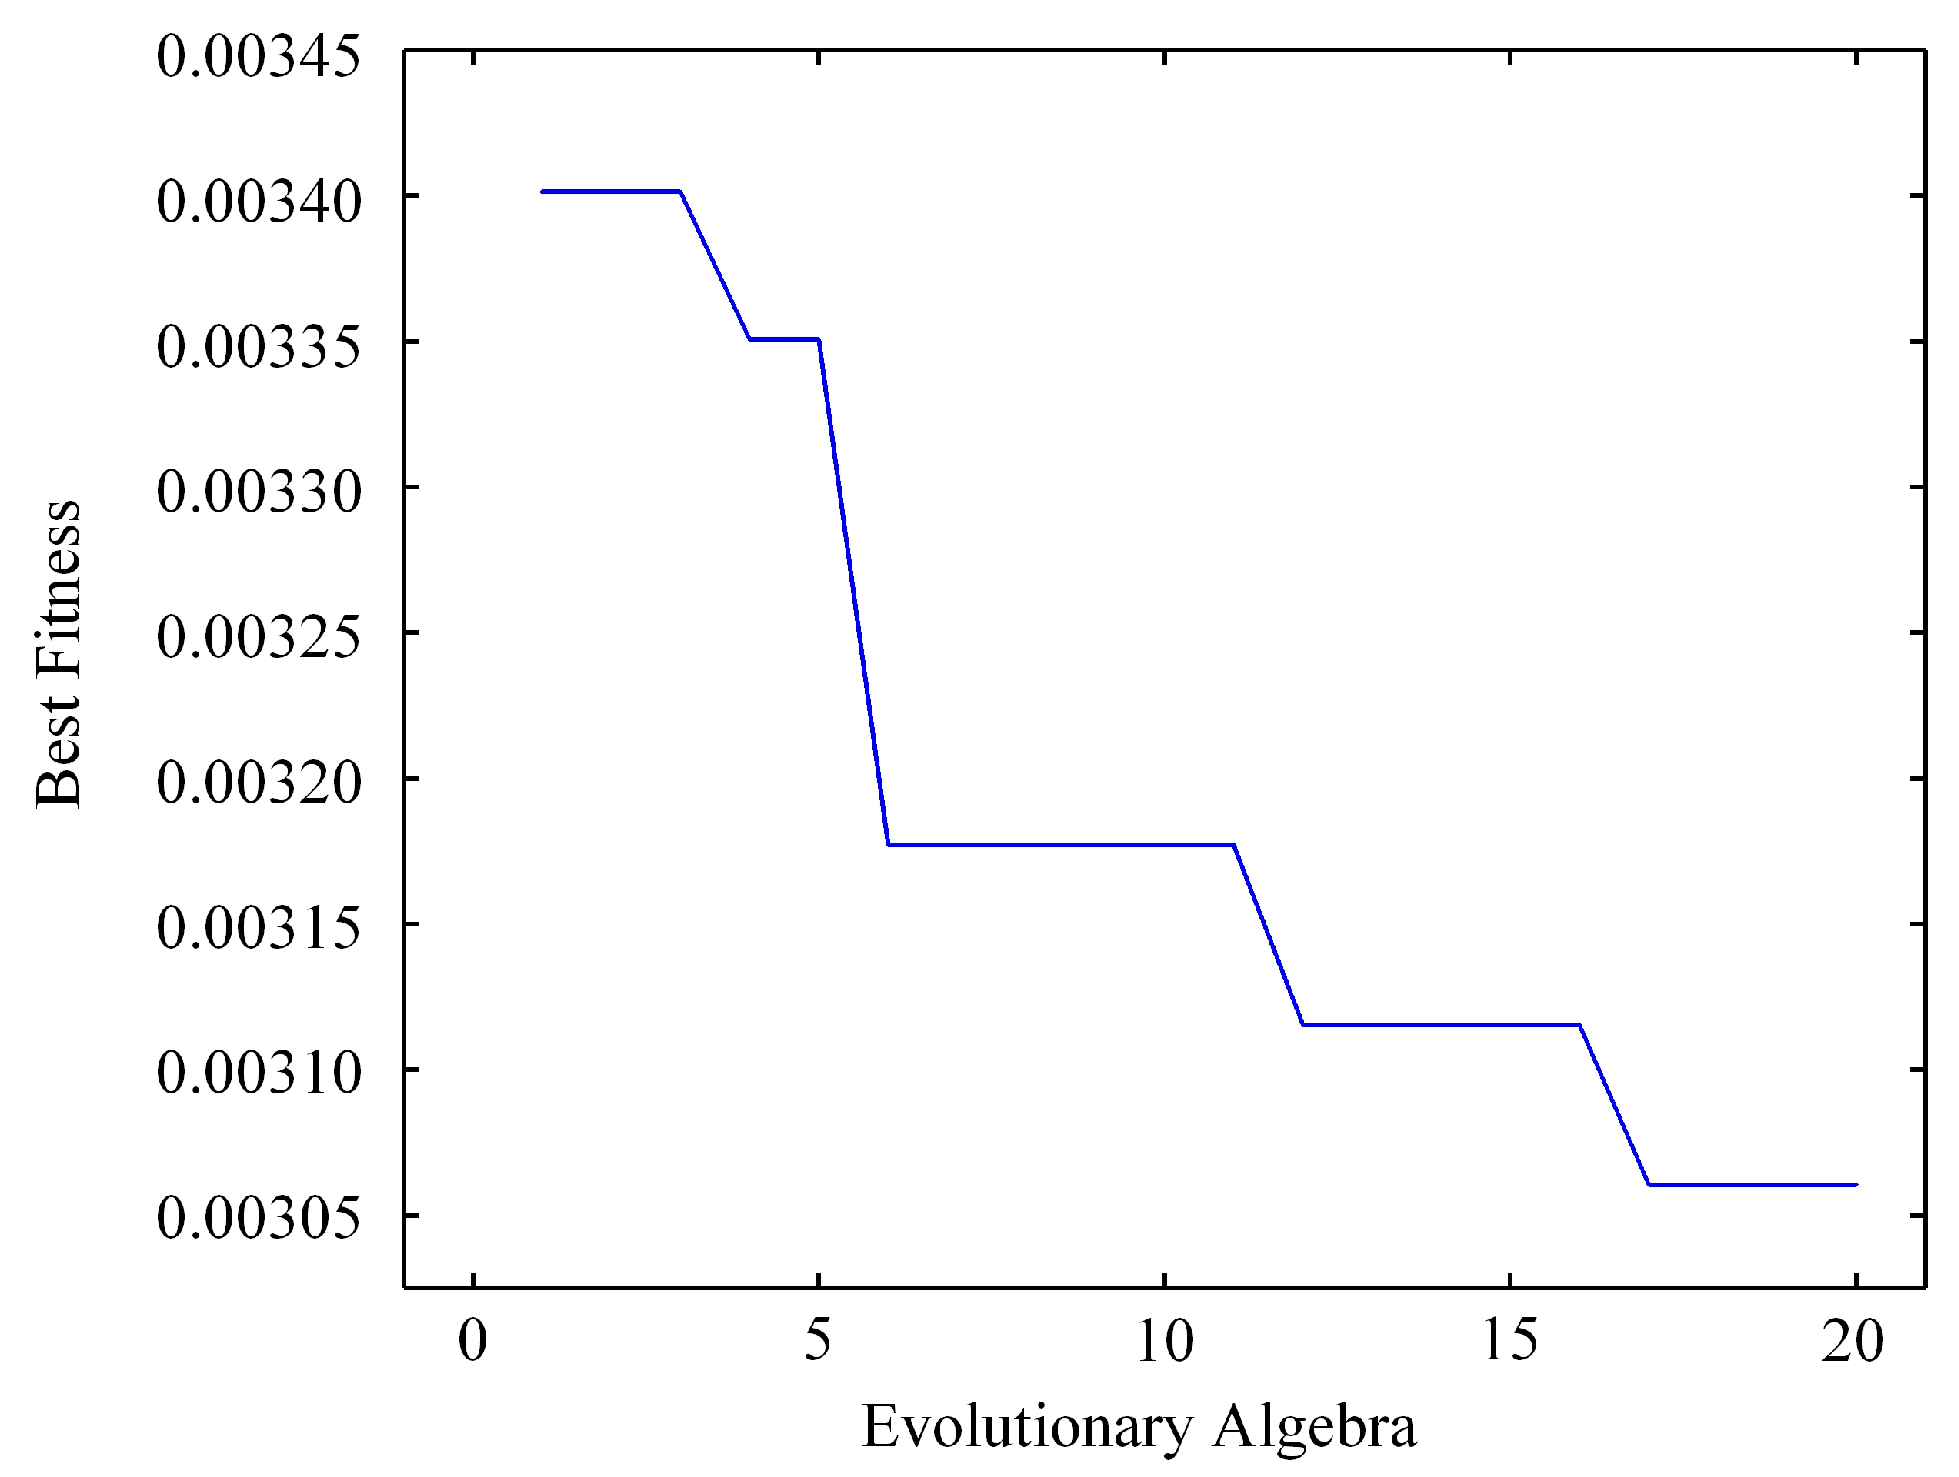
The model combines an LSTM forecaster with a GA search over a predefined architecture space. Each candidate network is encoded as a chromosome that records the number of LSTM layers, the number of hidden units per layer, the number of dense layers, and the number of neurons in each dense layer. Feasible ranges are specified in advance to reflect implementable designs. The search considers one to three LSTM layers with 10 to 50 units per layer and one to three dense layers with 10 to 50 neurons. The budget uses a population of 40 and 20 generations, with a crossover probability of 0.5 and a mutation probability of 0.05. These settings strike a balance between exploration and computational cost on this dataset. For a given chromosome, the corresponding network is trained under the same normalization, cycle-aligned window length, early-stopping rule, and device-stratified train, validation, and test splits. Fitness is the validation loss computed on the shared validation set. Selection adopts tournament sampling; crossover exchanges architectural fields; mutation perturbs one field within its allowed range. After the fixed number of generations, the best configuration, as determined by validation loss, is retrained on the training set and then evaluated once on the test set without further adjustment.
Compared to a plain LSTM tuned by hand, GA-LSTM eliminates the guesswork about depth and width, reducing the risk of over- or under-parameterization on a small dataset. The baseline LSTM in this study consists of one recurrent layer with 20 units and a single-neuron dense output; all other elements of preprocessing and evaluation remain the same, isolating the effect of architectural selection. The final GA-selected configuration, two LSTM layers with 40 units per layer, reflects a compromise between capacity and robustness under noisy, limited data.
Table 2 records the architectural ranges for LSTM and GA-LSTM, along with the GA budget and baseline settings, allowing for configuration and capacity to be traced under the shared protocol.
Figure 7 summarizes the workflow from population initialization to fitness evaluation and population update, explicitly stating that selection depends only on validation loss, while test data are not used. The detailed step sequence is provided in
Appendix A. The role of the GA here is configurational rather than methodological. Alternatives, such as particle swarm optimization or Bayesian optimization, could operate in the same architectural space, but they are outside the present scope. Reported results should be interpreted within the context of this fixed-budget, validation-based protocol.
The forecaster operates on a short window of scalar or low-dimensional indicators. Let denote the input window length, the input dimension (e.g., for alone, or small if auxiliary indicators are used), and the number of units in each LSTM layer selected by the GA. A single forward pass requires on the order of () multiply–accumulate operations, plus a small output head. Under the configurations selected in this study and the short windows evaluated, the parameter count and compute scale linearly with and quadratically with . These properties make per-sequence inference lightweight relative to data acquisition and feature extraction.
4.3. Baseline Models: Provenance, Tuning, and Disclosure
All experiments follow a shared protocol: identical preprocessing, cycle-aligned input windows, and device-stratified train, validation, and test splits. Normalization statistics are computed on the training set and applied to the validation and test sets. Model selection relies exclusively on validation loss on the shared validation split, and test data are not used for selection. Early stopping with a fixed patience is used where applicable. Model selection is performed on the validation set under this shared protocol. Test data are not used for selection. For readers implementing the physics-informed extension,
Section 5.5 specifies how electro-thermal consistency terms can be added to the loss while keeping preprocessing, cycle-aligned windowing, device-stratified splits, and validation-based selection unchanged.
For transparency,
Table 3 reports, for each baseline, the implementation provenance, the training budget, the validation-based selection rule, and the final hyperparameters that produced the results in
Section 5.3. Parameter counts are also listed to indicate model capacity.
For statistical assessment, the protocol specifies k = 10 independent runs per model with different random seeds, followed by paired tests on RMSE/MAE/MAPE across runs and a 1000-sample nonparametric bootstrap to report 95% confidence intervals on the test set. The present submission reports single-run descriptive numbers due to the compute budget; the multi-run plan is retained for reproducibility and can be executed without changing the preprocessing, splits, or selection rule.
To support future significance testing without changing the evaluation design, we pre-register the following procedure: train each model multiple times with independent random seeds under the same preprocessing, cycle-aligned windows, device-stratified splits, and validation-based selection; compare models using paired tests on RMSE, MAE, and MAPE computed on the identical test sequences; and estimate two-sided 95% confidence intervals via a nonparametric bootstrap on the fixed test residuals, with paired bootstraps for between-model deltas. This plan preserves parity and reproducibility and can be executed when resources become available; in the present revision, we report single-run descriptive results only.
6. Conclusions
This study frames IGBT health prediction as a device-centric short-sequence task and reports a sequence model that uses measurable, event-centered indicators. The practical implication is that routine monitoring can focus on the turn-off instant and a small, cycle-aligned window, which reduces data volume while preserving the information most relevant to early degradation. In maintenance planning, the recommended use is to track the peak turn-off overvoltage as the primary indicator and the as a complementary indicator of conduction path and temperature.
For predictive maintenance scheduling, forecasts can be used to trigger actions based on anticipated threshold crossings of the primary indicator. When the predicted trajectory approaches a predefined health limit within the planning horizon, operators can schedule inspection, tighten thermal management, or temporarily derate the converter. When the forecast uncertainty widens or the residuals show a sustained upward drift at the beginning of the trajectory, a preventive check of bond-wire and solder-layer interfaces is advised. These rules translate the descriptive accuracy gains into earlier interventions without adding training cost under the reported environment. For early failure prevention, the sequence model supports condition-aware thresholds. Event-centered inputs emphasize the first portion of the trajectory, where small changes are most informative for impending faults. Maintenance teams can assign higher weight to early-segment deviations and use conservative trigger margins when the operating regime changes or when ambient cooling is reduced. This approach allows conservative protection without frequent false alarms. For deployment, three requirements are recommended. First, acquire cycle-aligned records with sufficient sampling density around the turn-off to ensure consistent extraction of indicators. Second, ensure that preprocessing and normalization remain stable across devices and time, and utilize training-set statistics when applying the model in production. Third, use a simple calibration when the operating band shifts, and validate on a held-out subset before rolling out changes. These steps keep the workflow reproducible and compatible with existing data pipelines. The thermo-mechanical chain from solder-layer voiding to junction-temperature rise and altered turn-off transients [
27], together with the demonstrated sensitivity of the thermal field to cooling-channel design [
28], supports event-centered acquisition around turn-off and clarifies why the stability of
and
in field monitoring depends on local thermal management. The same event-centered acquisition and short windows enable a physics-informed variant by adding minor electro-thermal consistency penalties to the forecasting loss, which can improve plausibility without changing the data interface or deployment workflow.
Real-time use relies on event-centered buffering around turn-off, indicator computation, and a single forward pass on a short window. With low-dimensional inputs and short windows, inference cost follows the configuration-dependent form. It is typically dominated by data capture rather than the model itself, making per-cycle evaluation feasible on microcontroller- or SoC-class CPUs. This guidance leaves the shared protocol unchanged and clarifies how the model can be used in practice.
The reported results are single-run and descriptive under a fixed budget. To support fleet-level decisions, future work will add multi-run statistics and extend the inputs to multivariate indicators within the same protocol. A lightweight physics-informed selection objective will also be explored to discourage unphysical oscillations and to improve stability under condition shifts. These extensions keep the evaluation consistent while improving robustness for predictive maintenance in electric vehicles, renewable-energy conversion, and industrial drives.
