1. Introduction
In transmission and distribution networks, reliable voltage transformation is essential for efficient energy transfer and grid stability. Power transformers, as key components of this infrastructure, play a central role in maintaining continuous and secure power delivery [
1]. Dry-type transformers have become increasingly important with the growing integration of renewable energy sources, such as solar and wind power, into the electrical grid. In practice, dry-type transformers are typically employed in small to medium-sized solar and wind installations, offering advantages such as reduced maintenance and improved safety in indoor or environmentally sensitive locations, while oil-immersed transformers are generally preferred for larger installations, where higher power ratings and enhanced cooling capabilities are required.
Like all transformers, dry-type units are exposed to operational stresses caused by power system transients, such as those resulting from switching operations, lightning strikes, or fault conditions [
2]. Such events can impose significant dielectric and mechanical stresses on transformer components, leading to accelerated aging, internal faults, or failure [
3,
4,
5]. Therefore, ensuring the reliability of dry-type transformers, especially under dynamic operational conditions, is essential for the continued efficiency of the power grid.
Internal resonances in transformer windings, induced by electromagnetic transients, represent a significant operational risk, potentially leading to overvoltages that can compromise insulation integrity [
6,
7,
8,
9,
10]. Some studies have reported cases where resonant overvoltages contributed to insulation breakdown and transformer failure. In [
9], an internal winding failure in a distribution transformer caused by resonance overvoltage during a lightning event is reported. In [
10], several cases are reported in which internal overvoltages, caused by winding resonance during remote energization of transformers, led to dielectric faults and insulation breakdown. These findings underscore the importance of considering resonance effects in transformer design and operation to prevent potential failures.
Therefore, accurately modeling the transformer behavior across a wide frequency range is essential for the reliable assessment of these resonance phenomena. While white-box models offer detailed representation, their reliance on proprietary design data often limits their applicability in studies where such information is unavailable. Consequently, black-box modeling techniques, based on frequency response measurements, have gained importance as a practical alternative for characterizing transformer performance [
11,
12,
13,
14,
15,
16,
17].
In [
18], the authors investigated high-frequency resonant overvoltages in transformer regulating windings caused by external disturbances, such as ground faults, to estimate internal voltages within a single-phase three-winding transformer. The results demonstrate that tap changer settings affect overvoltage behavior and that, under certain conditions, internal resonant overvoltages can exceed standard lightning impulse test levels, indicating a potential vulnerability in these components.
Measurement of a frequency response is used to assess the mechanical integrity of the active part of power transformers. The analysis of the results, so-called Frequency Response Analysis (FRA), is based on comparison with a reference measurement which is either a previous measurement on the same unit, a measurement on an identical transformer or a measurement on another phase of a three-phase transformer [
19].
In [
20], a black-box modeling methodology based on Sweep Frequency Response Analysis (sFRA) was proposed for evaluating internal resonances in a high-voltage (HV) winding. By measuring admittance and voltage transfer functions, the approach effectively identified critical resonance frequencies, particularly the first mode, without depending on proprietary design details. However, the method was applied to a standalone winding, not placed into a transformer tank, and therefore did not consider the influence of components such as the low-voltage winding and insulation medium, which can affect the resonance behavior in practical applications.
The present study extends a previously established black-box modeling technique to analyze internal resonances in the high-voltage winding of a three-phase dry-type distribution transformer. By applying the methodology to a complete transformer assembly, this work considers the influence of the magnetic core, adjacent windings, and structural elements specific to dry-type transformers. The main objective is to identify the internal resonance frequencies of the HV winding in its assembled state and evaluate their potential impact on dielectric stresses, thereby providing a more comprehensive understanding of resonance behavior under realistic operating conditions. Although the fundamental phenomena of internal resonance in transformer windings are well known, the black-box modeling approach presented here offers a practical tool for evaluating these effects in real transformers without requiring proprietary design information.
This paper is organized as follows:
Section 2 describes the main characteristics of the transformer under investigation.
Section 3 outlines the black-box modeling approach as applied to the high-voltage winding of the dry-type distribution transformer.
Section 4 details the experimental setup used for sFRA measurements.
Section 5 and
Section 6 present the model development and its validation, respectively.
Section 7 discusses the identified internal resonances, while
Section 8 addresses methodological considerations. Finally,
Section 9 summarizes the main conclusions of the study.
2. The Dry-Type Transformer
The transformer used in this study is a three-phase cast resin dry-type distribution transformer with rated voltages of 10/0.4 kV, a rated power of 160 kVA, and a rated frequency of 50 Hz. Under normal operating conditions, it is configured in a delta-star connection. However, for the purposes of this study, it was connected in a star-star configuration to facilitate the evaluation of an individual HV winding.
The HV windings have four tap connections, allowing operation at three primary voltages: 10.0 kV, 10.25 kV, or 10.5 kV. In this study, the HV winding of the central phase was modeled using the 10.5 kV tap setting. This configuration was implemented by connecting tap positions 4 and 5 with a jumper. As a result, three internal tap connections were included in both the measurement and modeling procedures: tap 3 (T3), the combined taps 4 and 5 (T4), and tap 6 (T6). The HV winding was therefore represented by one external terminal (H1) and three internal terminals (T3, T4, and T6), with terminal H0, corresponding to the grounded lower end of the HV winding, kept at ground potential throughout the measurements.
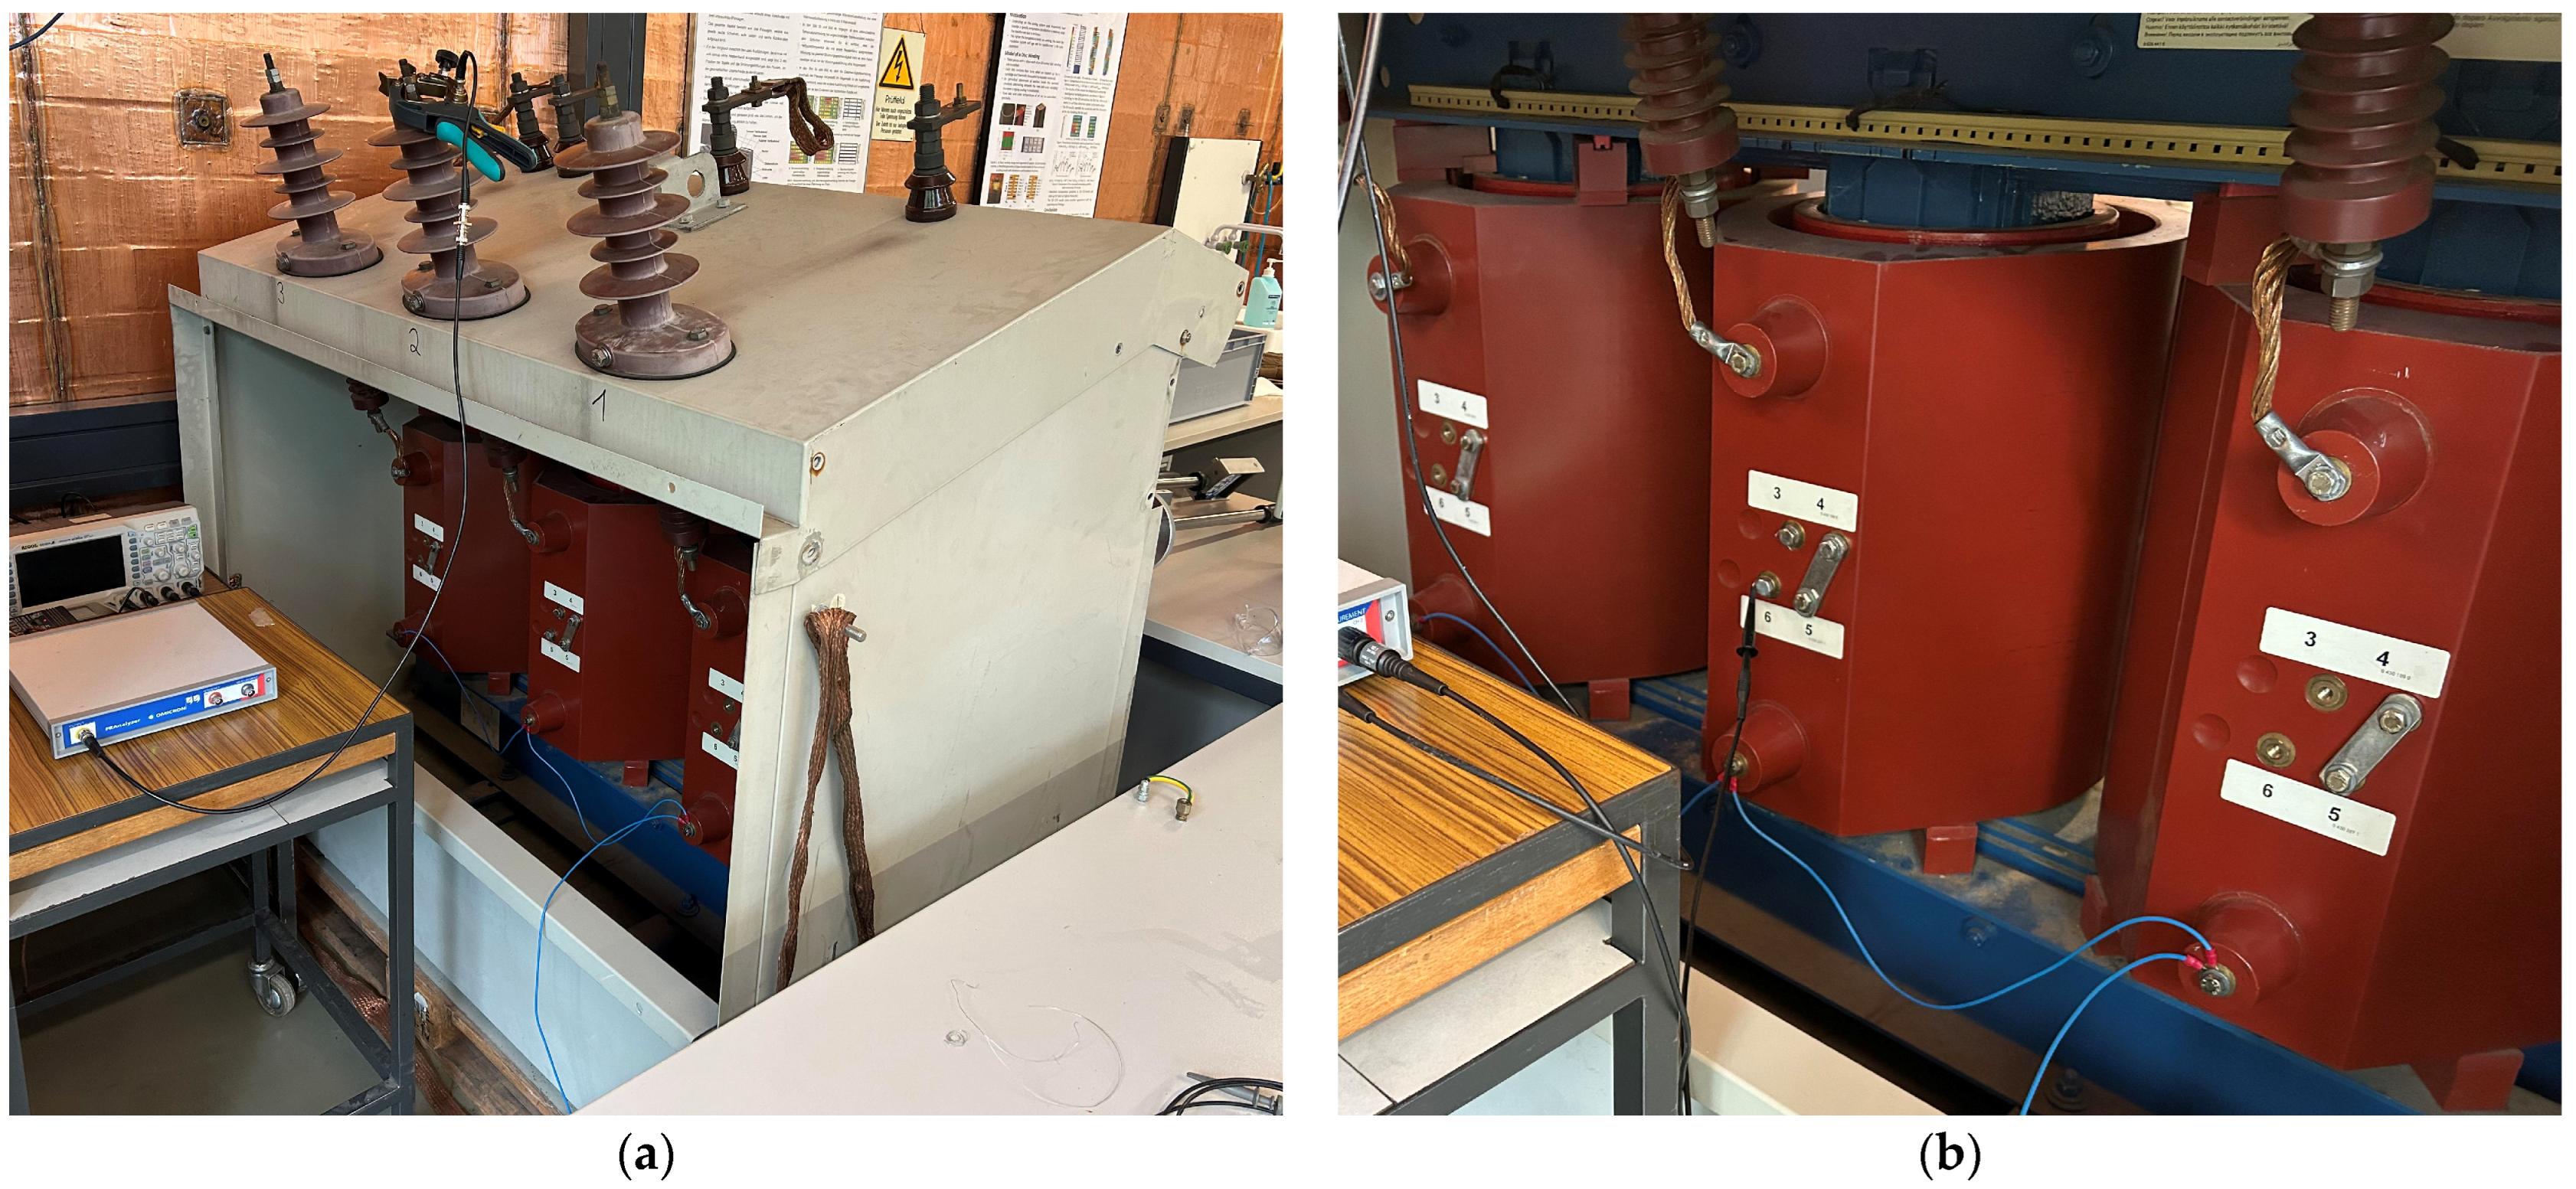
Figure 1 shows the transformer and provides a detailed view of the tap connections.
No information was available regarding the construction type, number of turns, or internal geometry of the HV winding. To estimate the positions of tap connections T3, T4, and T6 along the winding, the output voltages at these points were measured while applying a 50 Hz voltage to the external terminal H1. A variable autotransformer was used as the voltage source, and the voltages at T3, T4, and T6 were recorded using an oscilloscope. With an applied rms voltage of 200 V at H1, the measured voltages at T3, T4, and T6 were 119 V, 115 V, and 110 V, respectively. Assuming a linear voltage distribution along the winding at 50 Hz, the positions of T3, T4, and T6 were estimated to be located at 40%, 42.5%, and 45% of the total winding length, measured from terminal H1. This information is essential for estimating the voltage distribution along the winding under different resonance modes.
3. Black-Box Modeling of a High-Voltage Winding Installed in the Transformer
For characterizing the behavior of power transformers under transient conditions, black-box modeling techniques offer a practical and accurate alternative to geometry-dependent white-box models. In this study, a black-box modeling approach is applied to a high-voltage winding integrated within a three-phase cast resin dry-type distribution transformer. This configuration considers the influence of the magnetic core, adjacent windings, insulation materials, and structural elements, thereby providing a realistic condition for analyzing internal resonance phenomena.
The black-box methodology used here relies on frequency-domain measurements of admittance and voltage transfer functions at accessible winding terminals, as detailed in [
20]. This approach enables accurate characterization of the winding’s electrical behavior without requiring information about its internal geometry, number of turns, or physical construction.
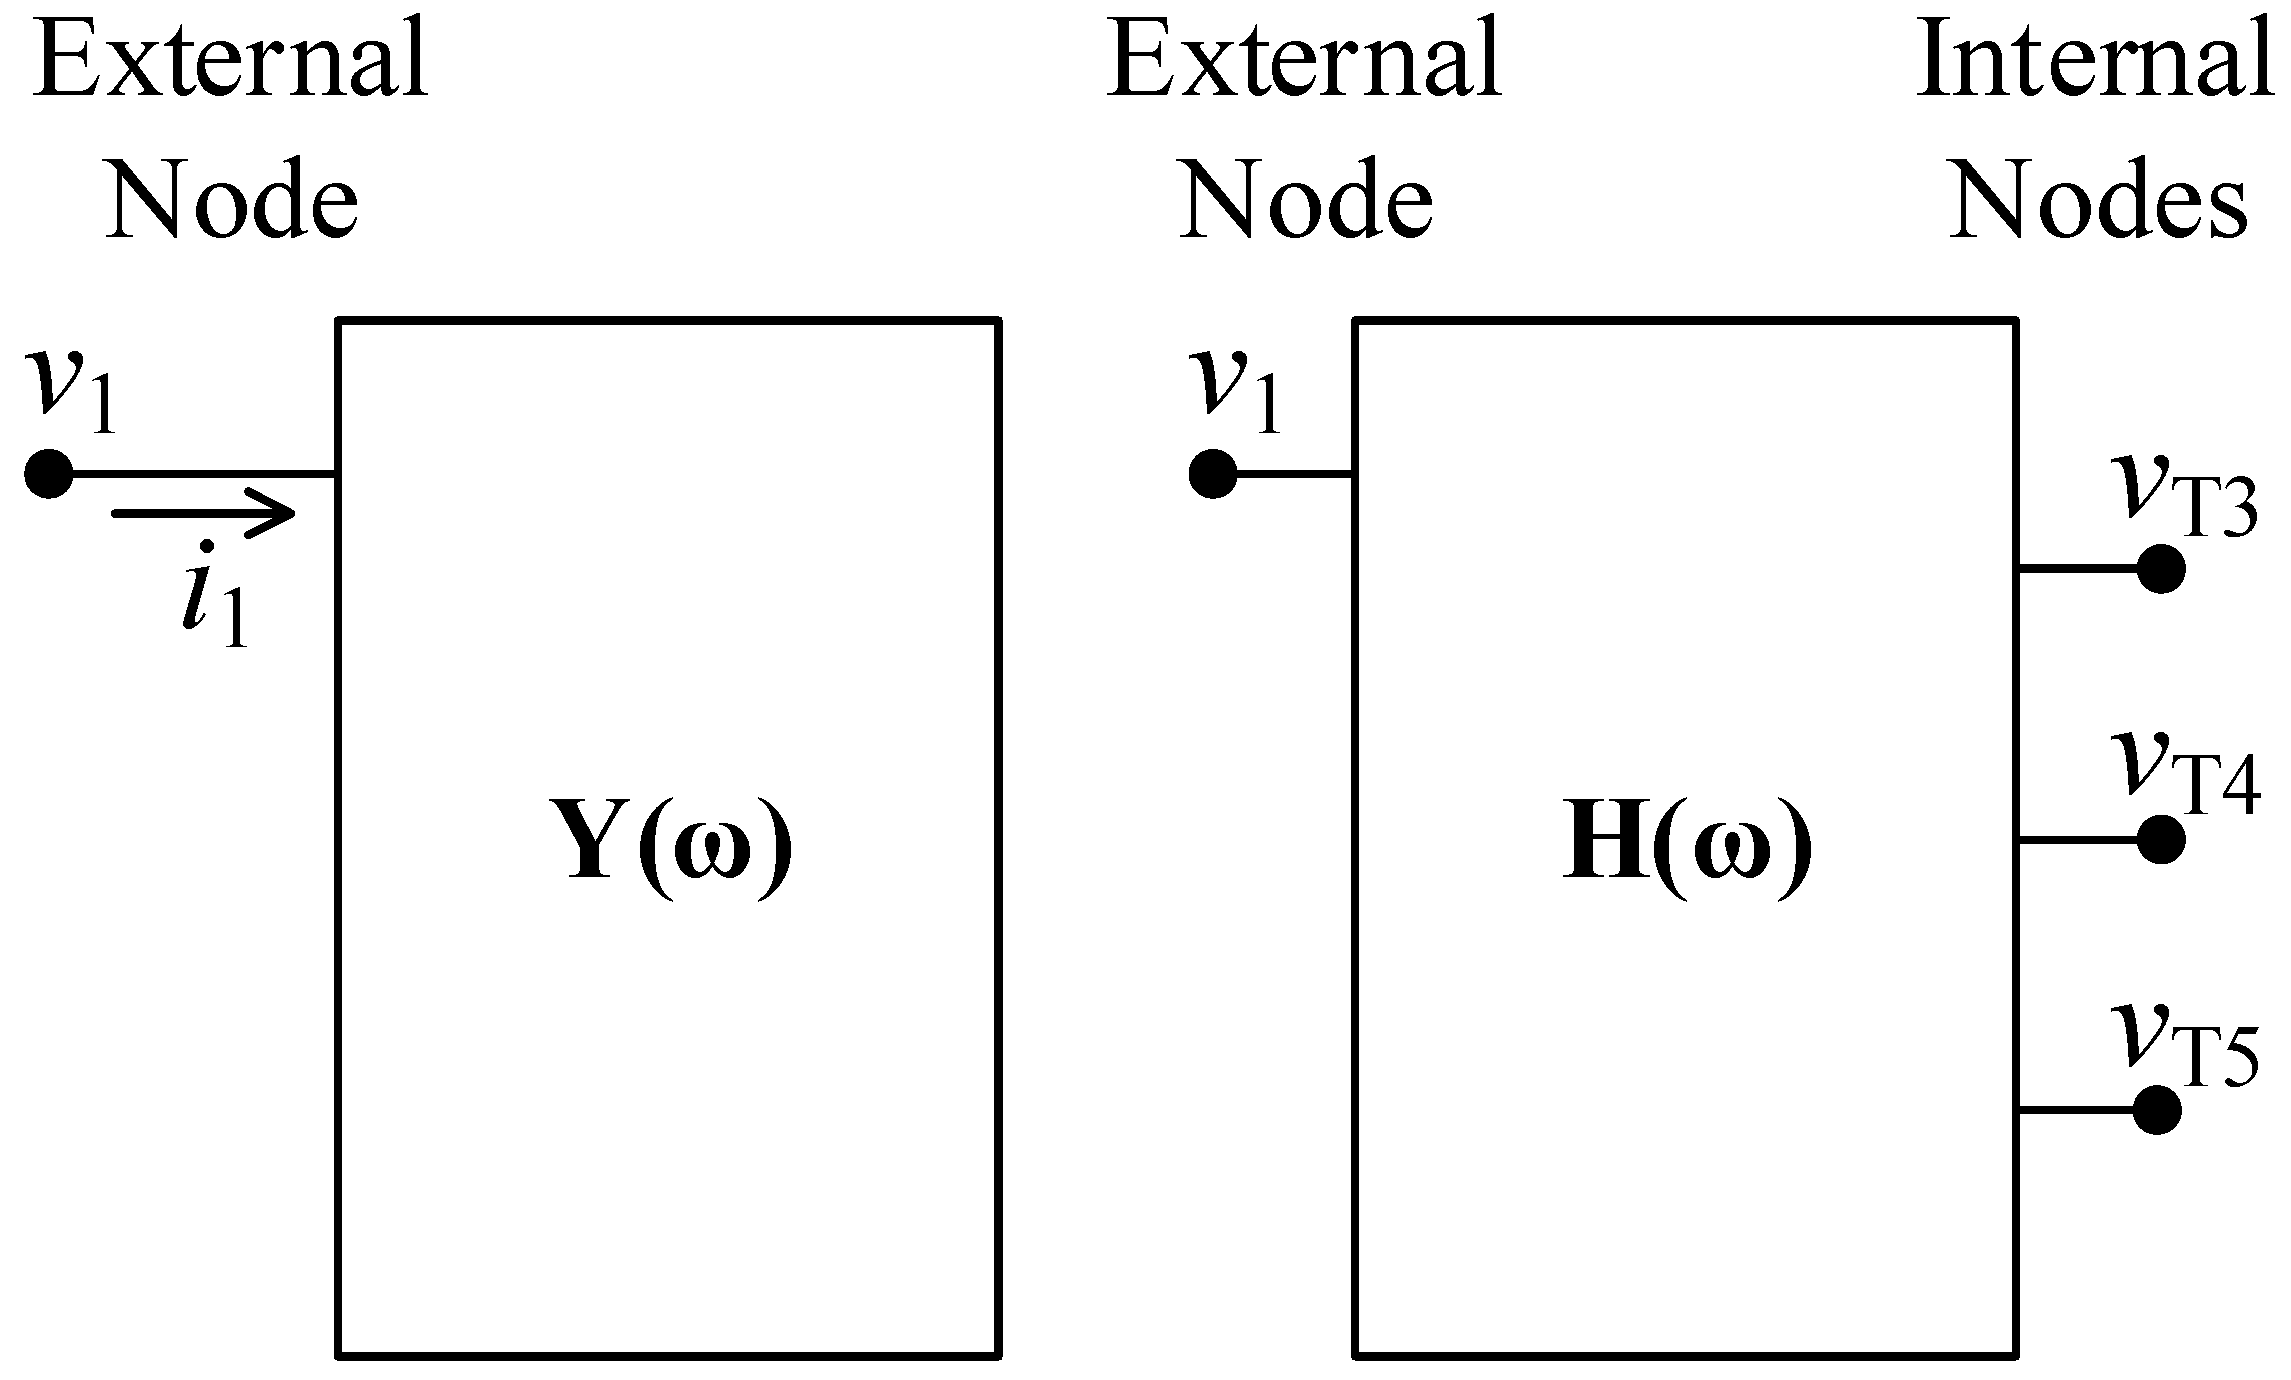
Two models are developed from the frequency-domain measurements: the Y-matrix model and the H-matrix model. Both are derived from sweep frequency response measurements conducted at the external and internal terminals of the HV winding. The Y-matrix model characterizes the relationship between terminal voltages and currents and is suitable for time-domain simulations using EMTP (Electromagnetic Transients Program) tools via equivalent circuit representation. In contrast, the H-matrix describes the internal voltage response at selected tap connections resulting from an excitation applied at the external terminal. Unlike the Y-matrix, the H-matrix does not interact with external circuits, offering a more efficient solution when the focus is on internal voltage behavior.
In this study, the HV winding is represented by one external terminal and three internal tap connections. The Y-matrix must be square and symmetric, with dimensions equal to the total number of modeled terminals. Accordingly, it is represented by a single admittance vector Y(ω). The H-matrix, H(ω), is a 3 × 1 matrix of voltage transfer functions from the external terminal H1 to the internal tap connections T3, T4, and T6. The modeling assumes linear and passive behavior, and the measurements are performed on the complete assembled winding under no-load conditions.
The combined use of the Y-matrix and H-matrix models reduces the number of required frequency response measurements. Using this approach, only four measurements are needed: one to determine the admittance and three to obtain the voltage transfer functions. In contrast, a purely admittance-based model considering all four terminals would require a 4 × 4 Y-matrix, which would involve 16 measurements.
Figure 2 illustrates the representation of both the Y-matrix and H-matrix models.
The Y-matrix model must satisfy stability, passivity, and symmetry conditions, while the H-matrix model is only constrained by stability [
11]. Therefore, the rational approximation of the admittance data is performed using the vector fitting algorithm in MATLAB R2023b [
21], followed by a passivity enforcement step to ensure numerical stability of the resulting equivalent circuit [
22,
23,
24]. This rational function is then converted into an equivalent circuit and implemented in ATPDraw for time-domain simulations [
25]. The H-matrix model is not converted into an equivalent circuit and therefore does not require passivity enforcement, as it is used exclusively to evaluate internal voltage responses without interacting with external circuits. After rational approximation of the voltage transfer functions, the linear model is transformed into the time domain, enabling time-domain simulations to be performed directly in MATLAB.
4. Frequency-Domain Measurement of Admittance and Voltage Transfer Functions
To develop representative black-box models of the high-voltage winding under realistic conditions, frequency-domain measurements were performed with the winding installed in the transformer. The measurements were performed using a sweep frequency response analyzer (Omicron FRAnalyzer) over a frequency range of 20 Hz to 1 MHz. Before each measurement session, a calibration procedure was performed to eliminate the influence of the connecting cables, thereby ensuring the accuracy of the results. Two types of measurements were done: admittance at the external terminal and voltage transfer functions between the external terminal and internal tap connections. These data are the basis for the Y-matrix and H-matrix models, respectively. The following subsections describe the test configurations and key observations from the frequency-domain results.
4.1. Admittance
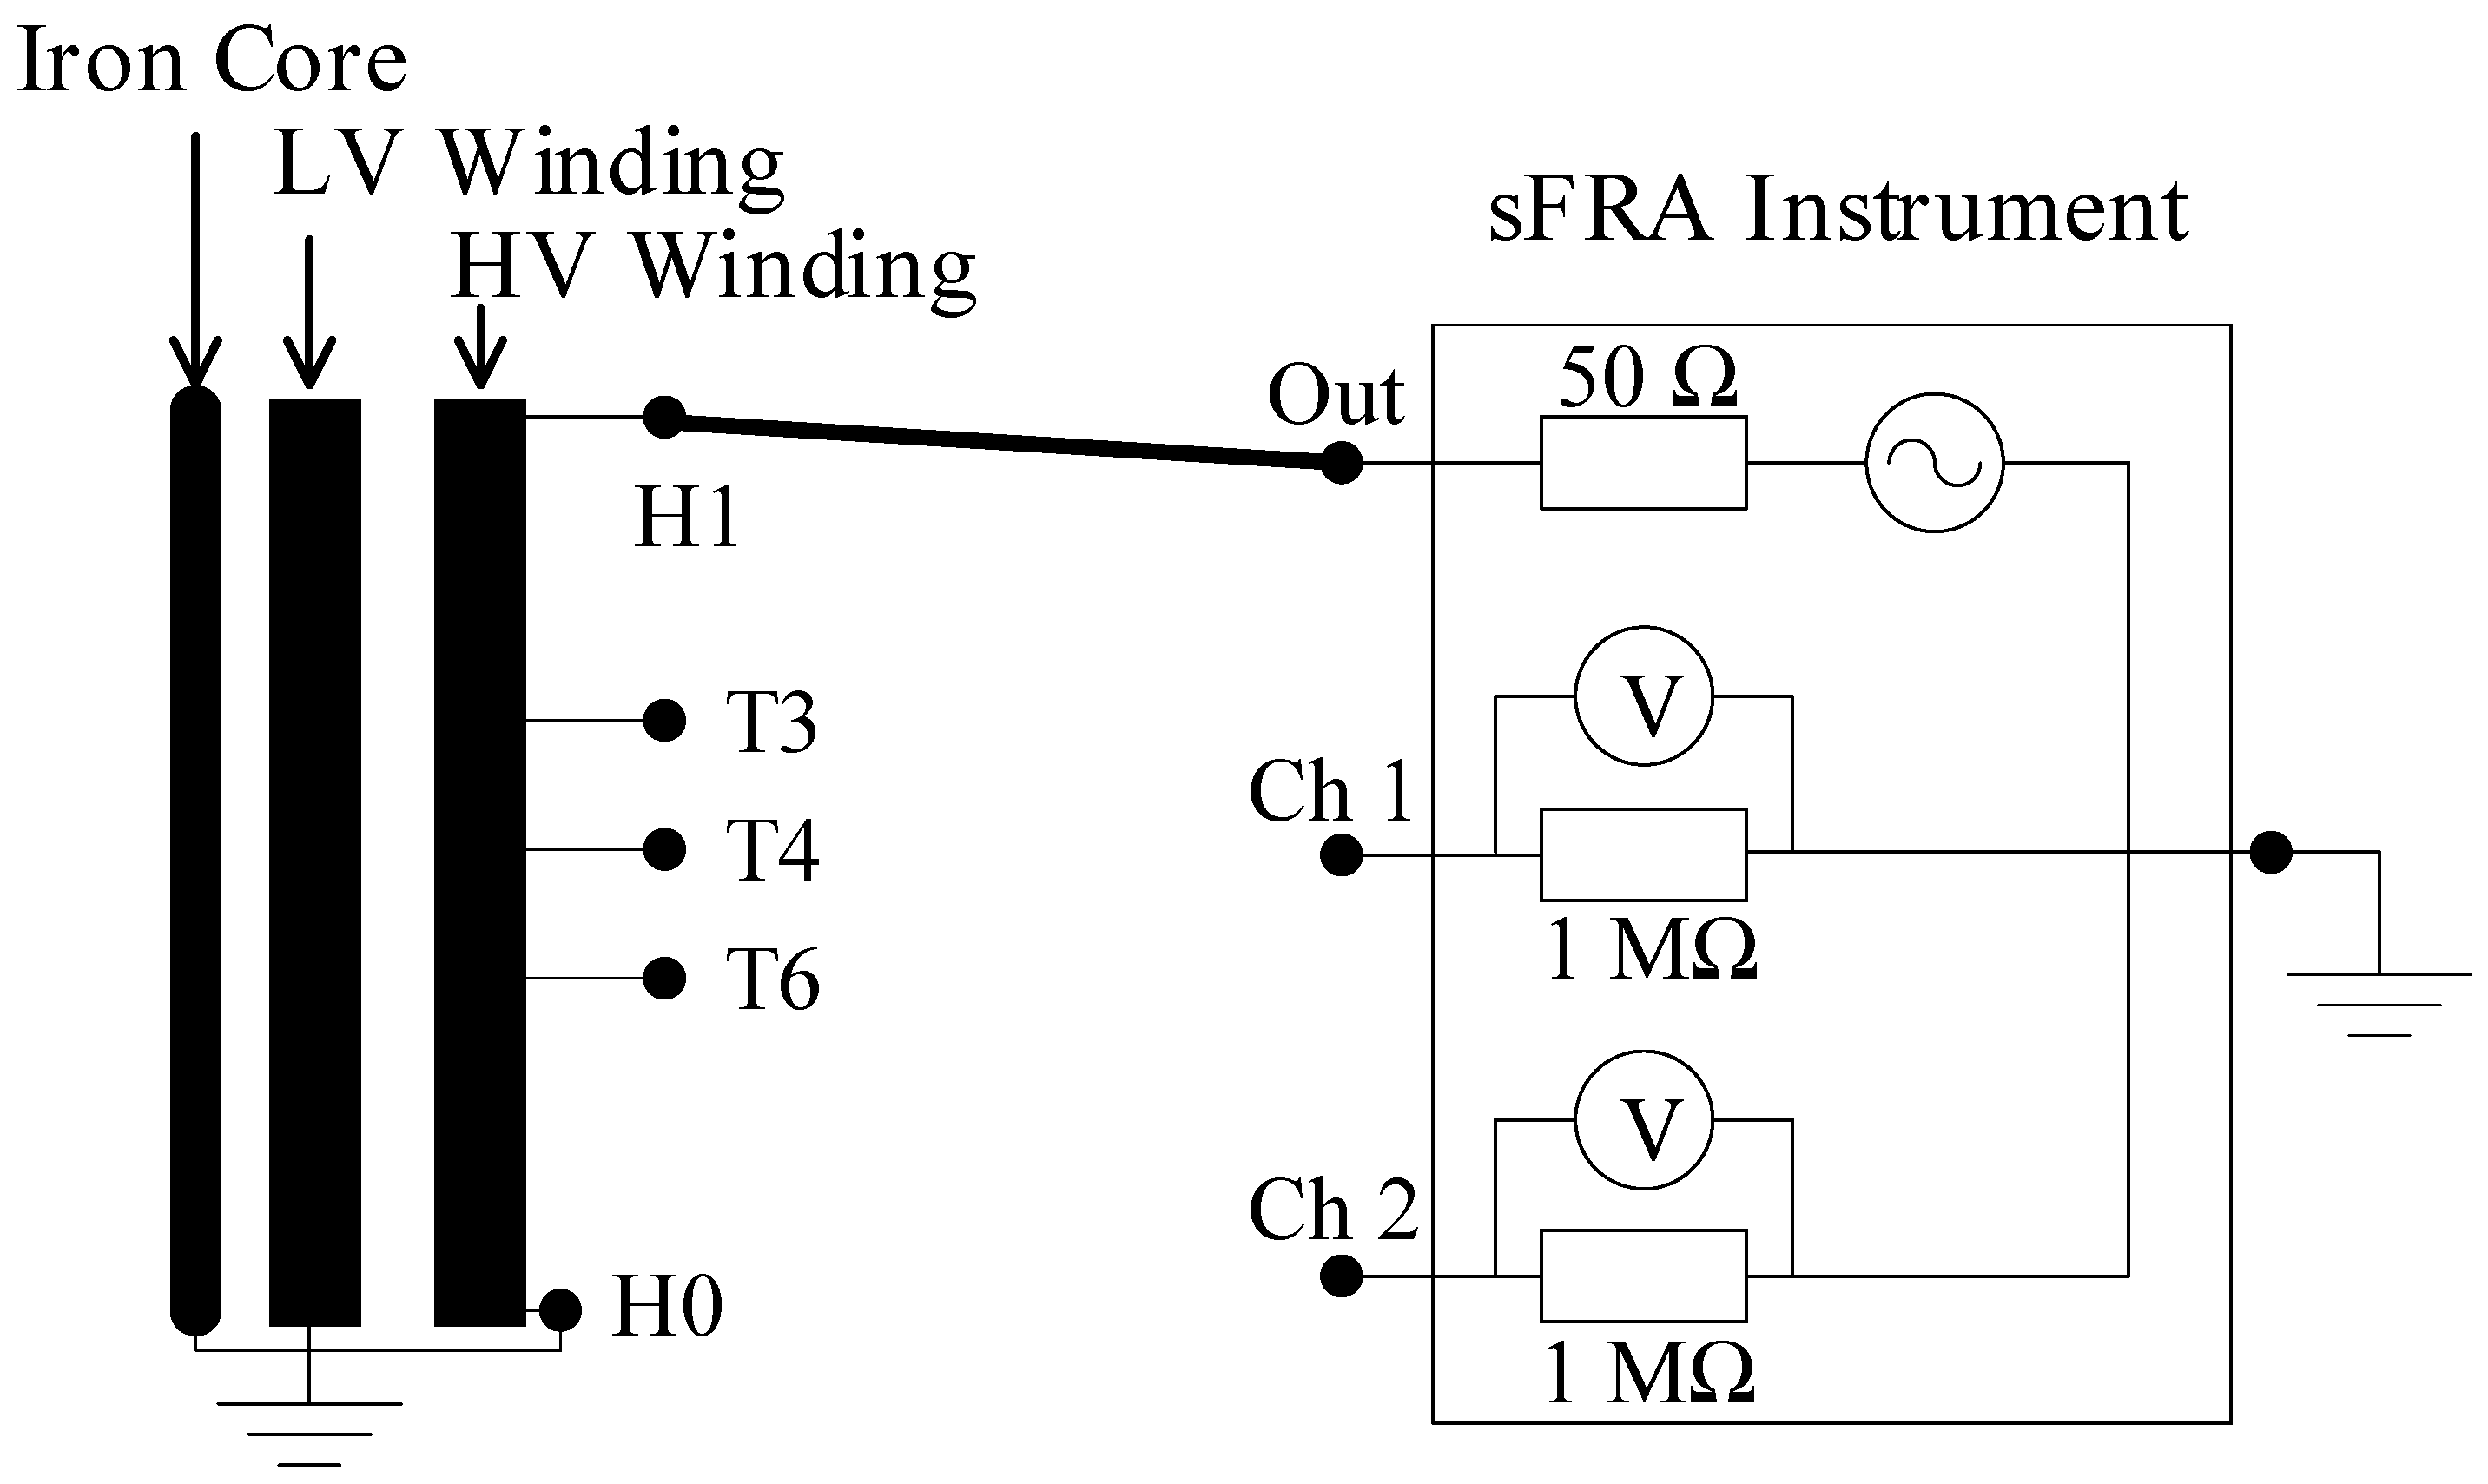
The admittance measurements were done using the impedance mode of the FRAnalyzer. The instrument’s output was connected to the external terminal H1 via a coaxial cable with grounded shielding, while terminal H0 was kept connected to ground. The applied voltage and resulting current were measured using the instrument’s built-in 50 Ω source impedance, from which the frequency-dependent admittance was computed as:
where
v1(ω) is the applied voltage and
i1(ω) is the measured current.
Figure 3 shows the test configuration, and
Figure 4 presents the measured admittance.
The admittance curve presents distinct resonance and anti-resonance frequencies. Resonance peaks (series resonances) correspond to points of internal voltage amplification, while anti-resonance frequencies (parallel resonances) indicate points of minimal voltage response [
7]. As noted in the IEC Standard 60076-18 [
26], the low-frequency region, up to approximately 2 kHz, is predominantly influenced by the interaction between the core’s magnetizing inductance and the transformer’s bulk capacitances. This interaction results in the first anti-resonance frequency, observed at 1.2 kHz.
The IEC Standard also defines an intermediate frequency region between 2 kHz and 20 kHz, which is predominantly affected by electromagnetic coupling between windings. Therefore, the resonance observed at 9.6 kHz is attributed to interactions with adjacent windings. In contrast, the high-frequency region, from 20 kHz to 1 MHz, is influenced mainly by the winding leakage inductance in combination with series and ground capacitances [
26]. This frequency range is particularly relevant for evaluating internal resonances within the winding. Accordingly, resonance peaks observed above 40 kHz are likely associated with internal resonance modes, a hypothesis that can be further validated through model implementation and analysis. Among these, the most prominent resonances occur at approximately 51 kHz and 59 kHz.
4.2. Voltage Transfer Functions
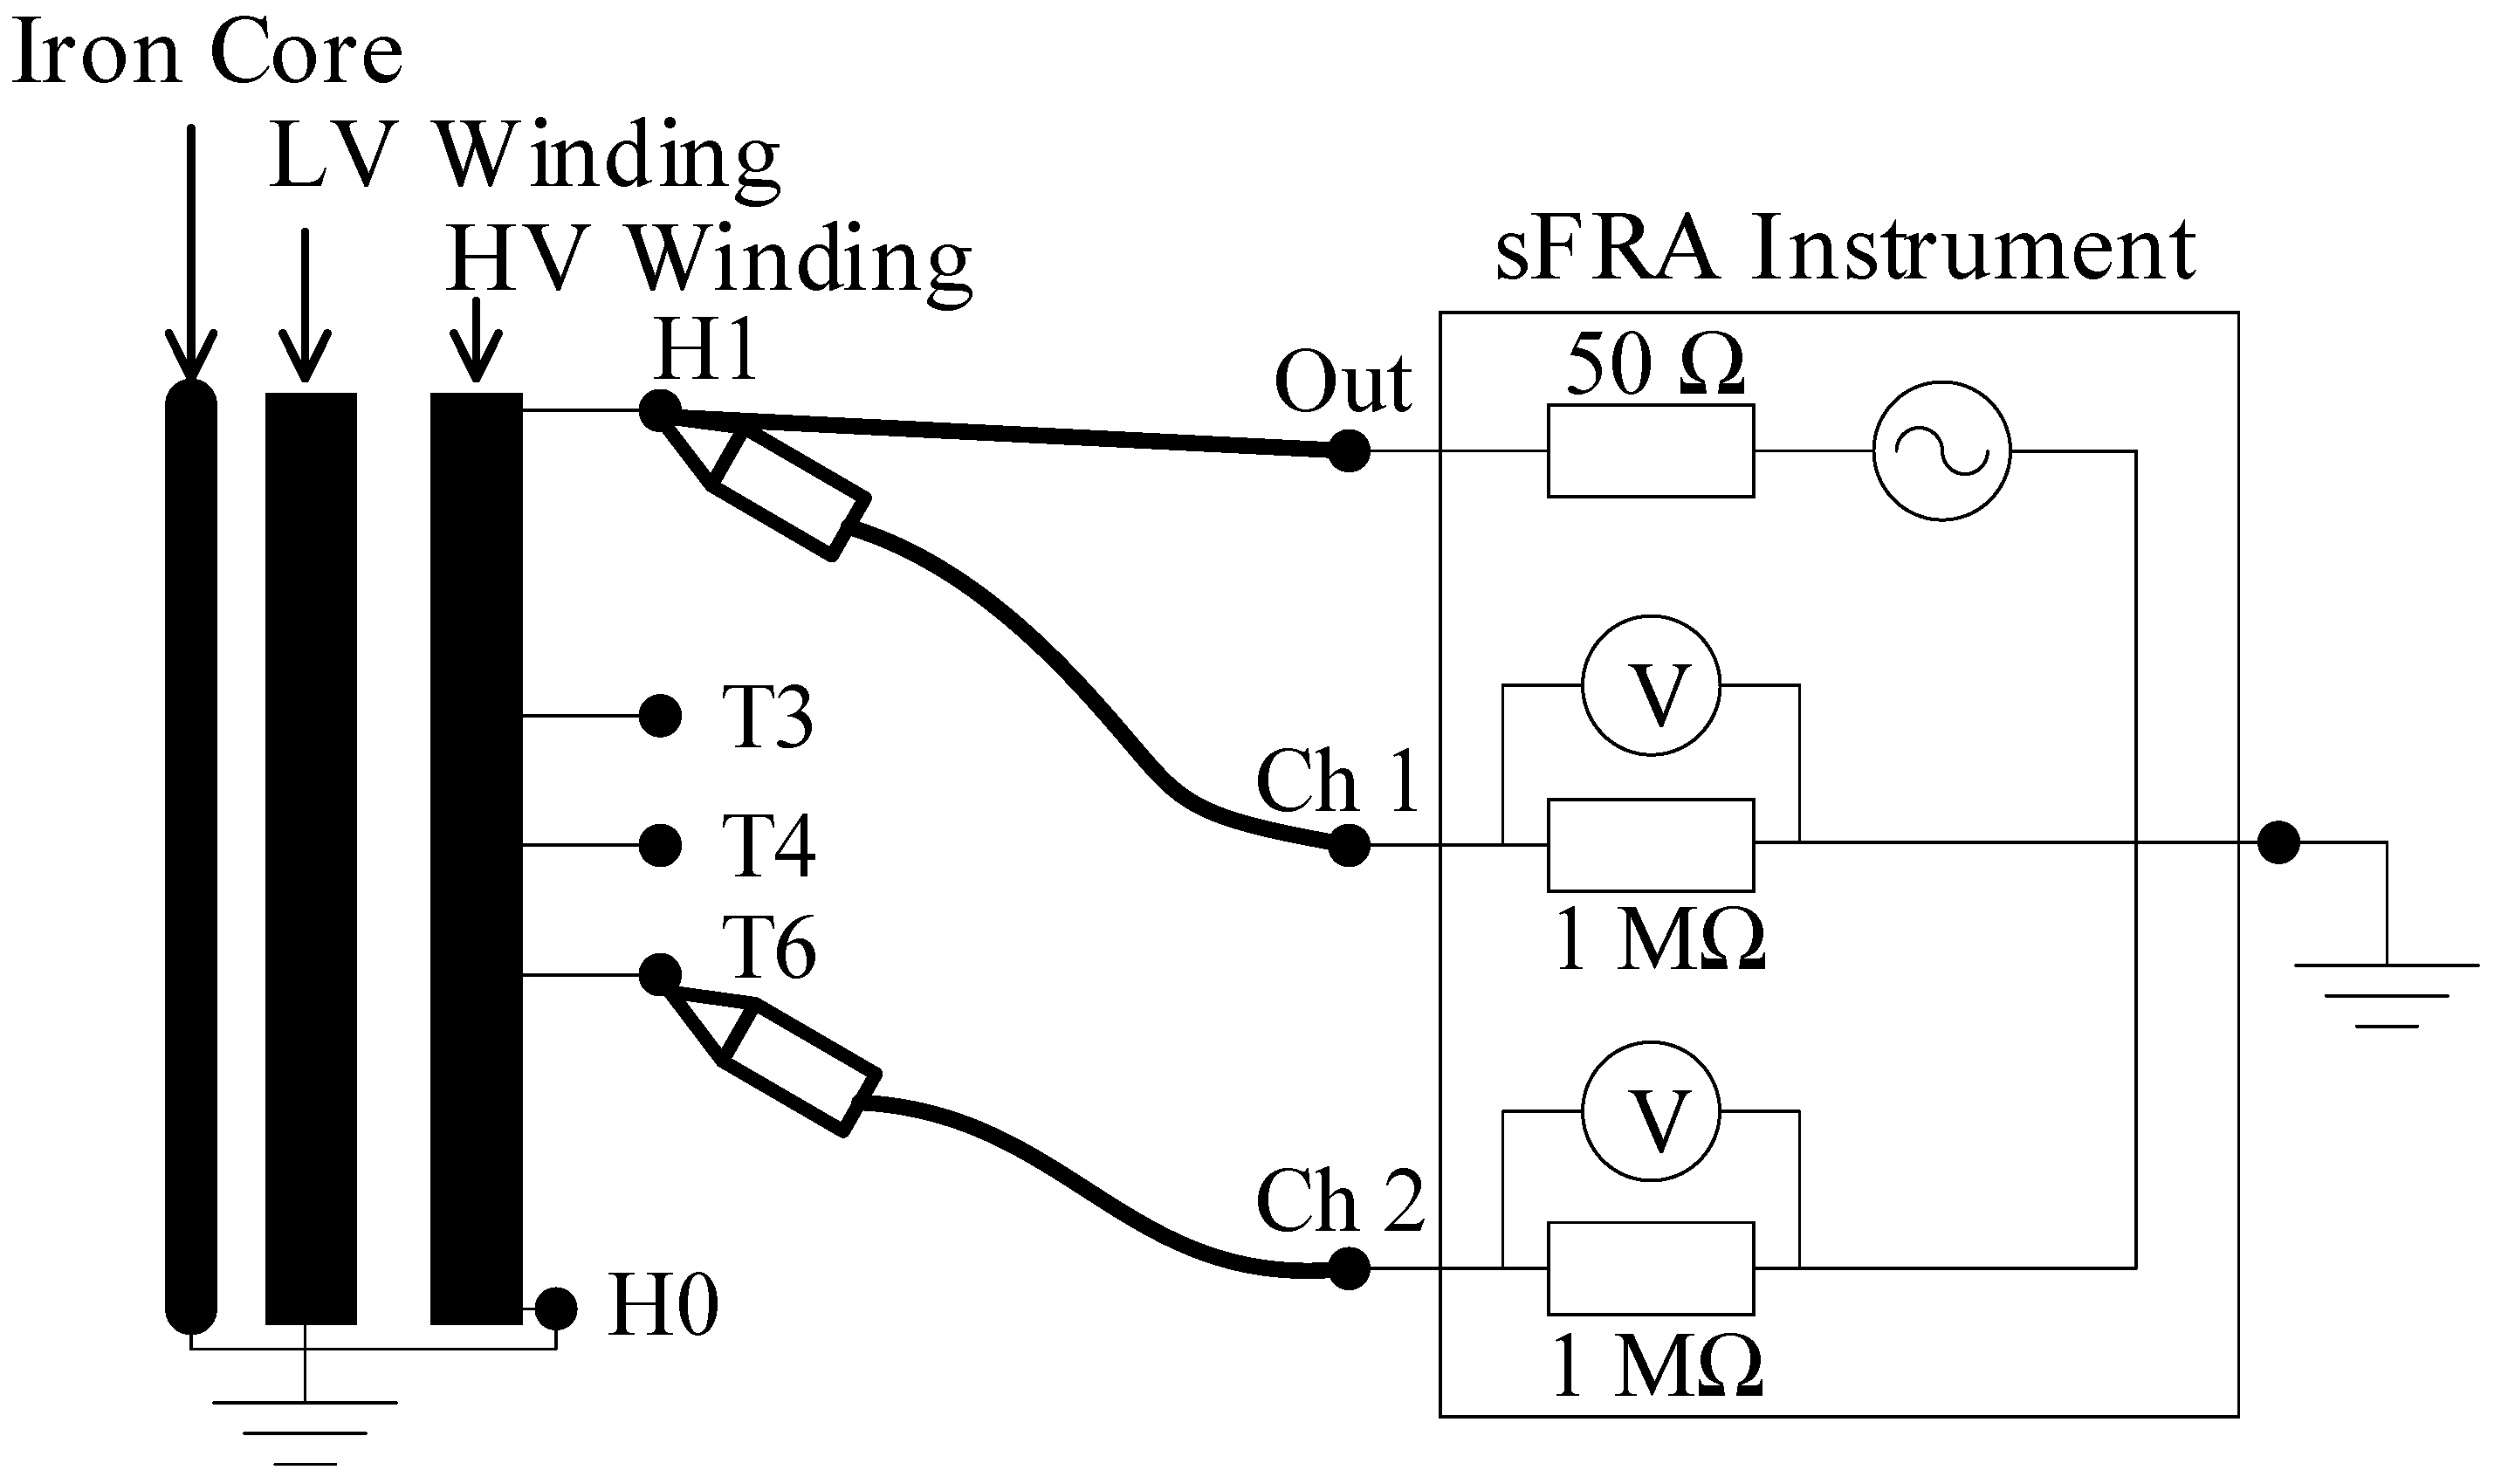
To assess the voltage distribution within the winding across a range of excitation frequencies, voltage transfer functions were measured between the external terminal H1 and the three internal tap connections T3, T4, and T6. These measurements were conducted using the same sFRA instrument, but configured in gain mode. In this setup, both the output and reference (Ch 1) channels were connected to terminal H1, while the second measurement channel (Ch 2) was sequentially connected to each internal tap. The measurement configuration is illustrated in
Figure 5.
In this configuration, the voltage transfer function H(ω) is computed by dividing the voltage measured at channel 2 (the response at the internal tap) by the voltage measured at channel 1 (the applied voltage), as expressed by:
where
v1(ω) is the applied voltage and
vj(ω) is the voltage measured at tap connection
j.
To minimize capacitive loading effects on the winding and preserve signal fidelity across the frequency range, voltage measurements were performed using 10:1 passive voltage probes (LeCroy PP005). Their input resistance of 10 MΩ and input capacitance of 11 pF increase the overall input impedance relative to the measurement instrument (1 MΩ), ensuring precise measurement of the internal voltage responses. The resulting H-matrix comprises a 3 × 1 set of transfer functions corresponding to taps T3, T4, and T6.
Figure 6 shows the measured transfer functions for these internal connections.
Analysis of the voltage transfer functions reveals no resonance peaks below 20 kHz, confirming that the observed resonances at 1.2 kHz and 9.6 kHz are not associated with internal winding resonance modes. Likewise, no significant resonances are detected above 200 kHz. The dominant resonance frequencies in this case, indicating significant amplification of the applied voltage, are observed at 51 kHz and 59 kHz. These local voltage maxima correspond closely with the resonance peaks identified in the admittance response, reinforcing the consistency of the measurements. The voltage responses at tap connections T3, T4, and T6 exhibit very similar behavior, which is expected due to their proximity within the winding.
5. Model Development and Implementation
This section describes the development and implementation of the winding models based on the frequency-domain measurements presented in
Section 4. Two complementary models were created: the Y-matrix model for simulating terminal behavior, and the H-matrix model for evaluating internal voltage distribution.
5.1. Y-Matrix Model
The Y-matrix model was developed based on the measured admittance at the external terminal H1. As shown in
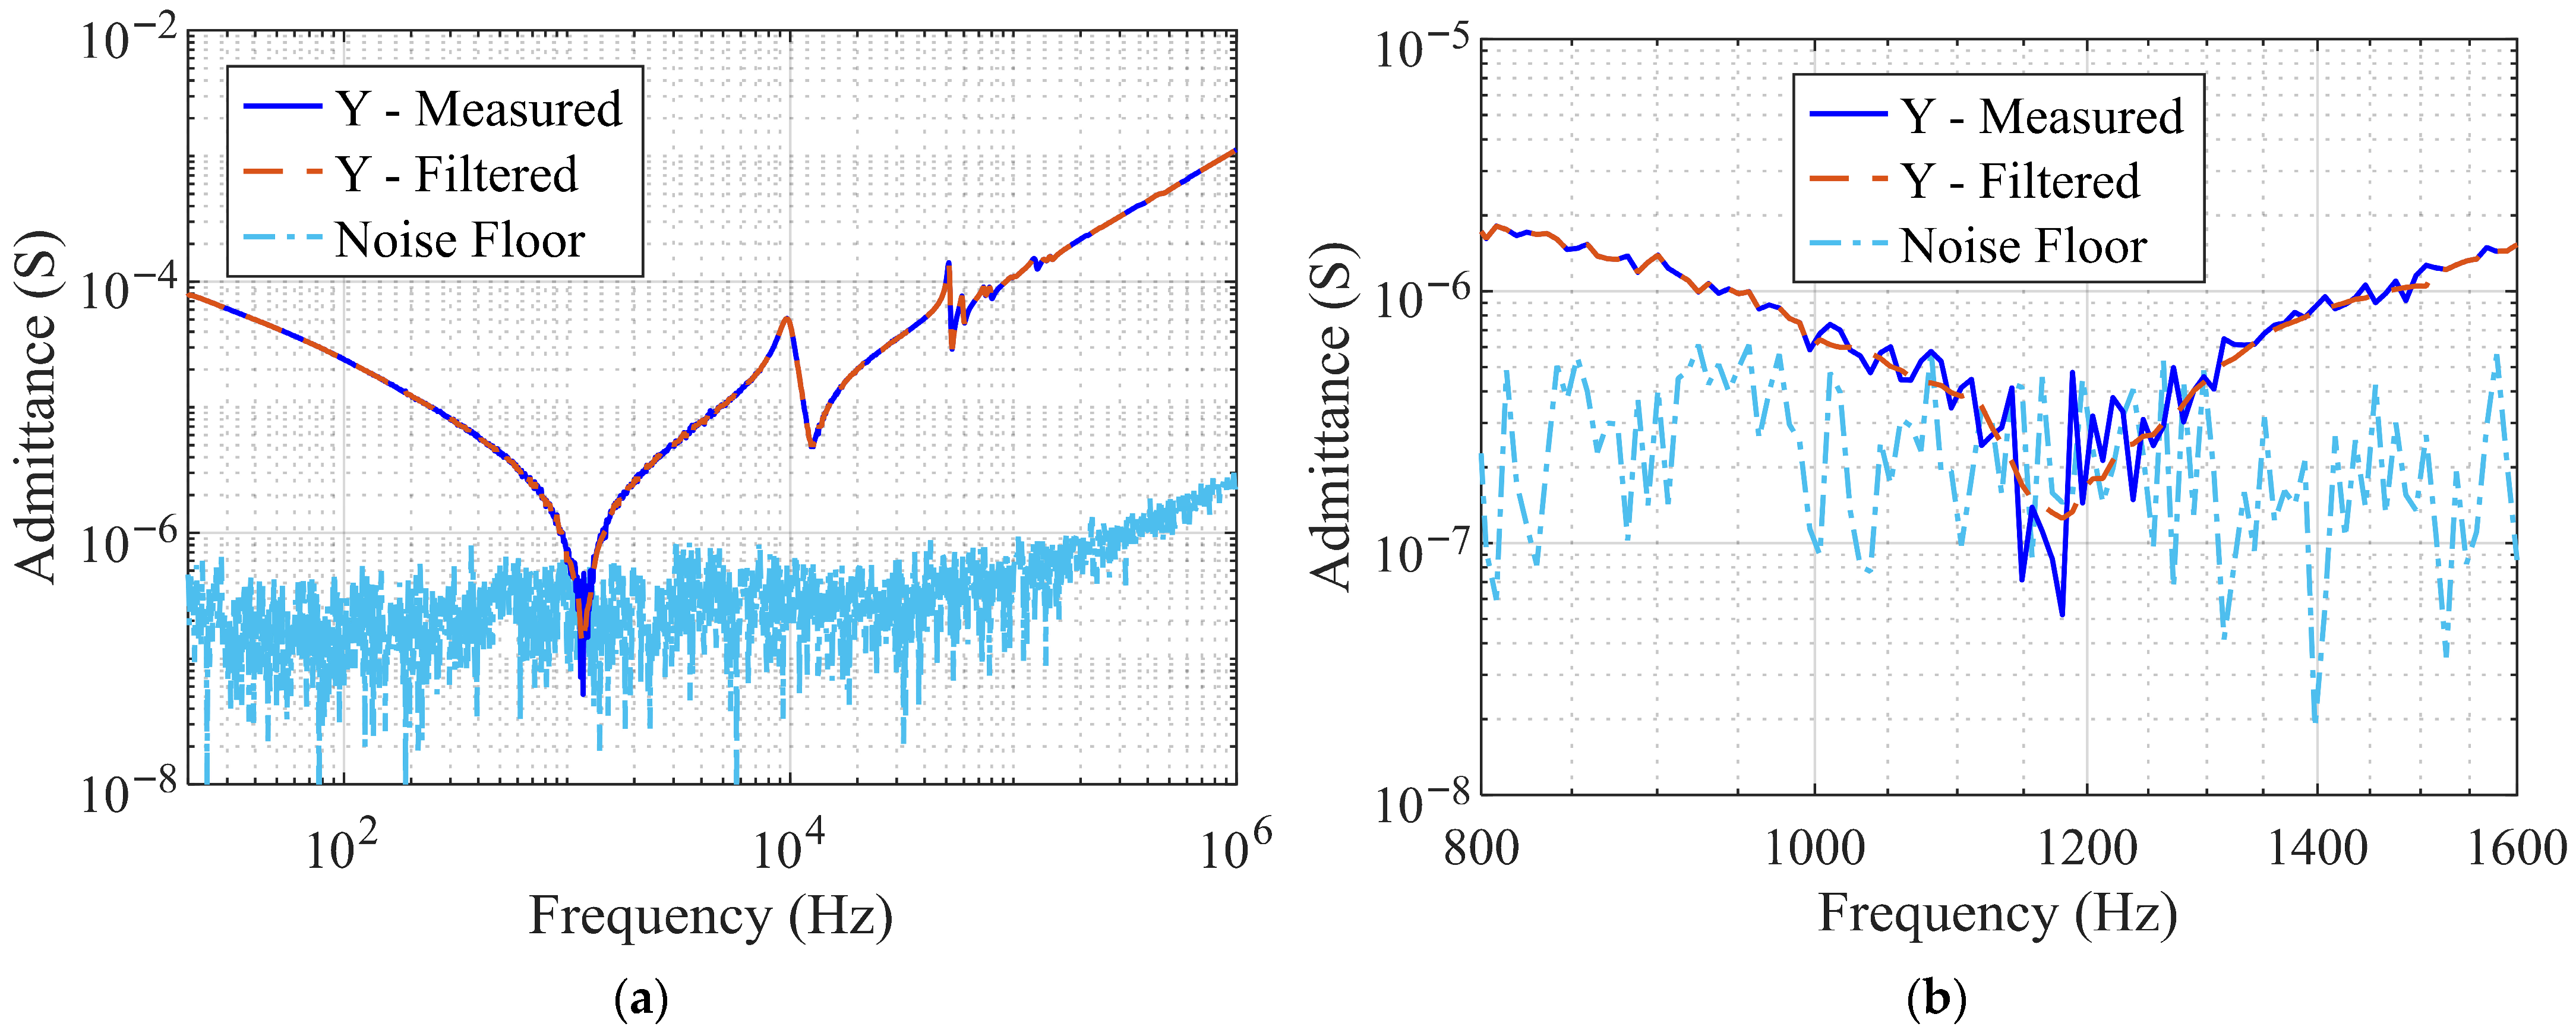
Figure 4, the region around the first anti-resonance frequency, approximately 1.2 kHz, exhibits noticeable noise. This behavior is attributed to the very low admittance (i.e., high impedance) in this frequency range due to parallel resonance, resulting in a minimal current measured by the instrument and a correspondingly low signal-to-noise ratio. To ensure robust application of the vector fitting algorithm, a smoothing process was applied to the data. Specifically, a moving average filter with a window length of 10 points was used between 1 kHz and 1.5 kHz.
Figure 7 presents the original and smoothed admittance curves, together with the noise floor obtained from an open-circuit measurement.
After filtering, the rational approximation was performed in MATLAB using the vector fitting algorithm with 80 poles. The number of poles was determined by optimizing the mean square error between the fitted and smoothed admittance curves.
Figure 8 shows the filtered admittance and the fitted response.
The fitting process resulted in a good agreement between the filtered admittance curve and the fitted model, with only minor deviations below 100 Hz and above 500 kHz, both within acceptable limits.
Since the Y-matrix model interacts with external systems, it cannot generate power and must therefore remain passive, which is essential to ensure stability in time-domain simulations [
11]. The passivity assessment revealed violations that could compromise stability, which were corrected using a passivity enforcement procedure, ensuring both physical consistency and numerical robustness.
Figure 9 presents the model response before and after the passivity enforcement.
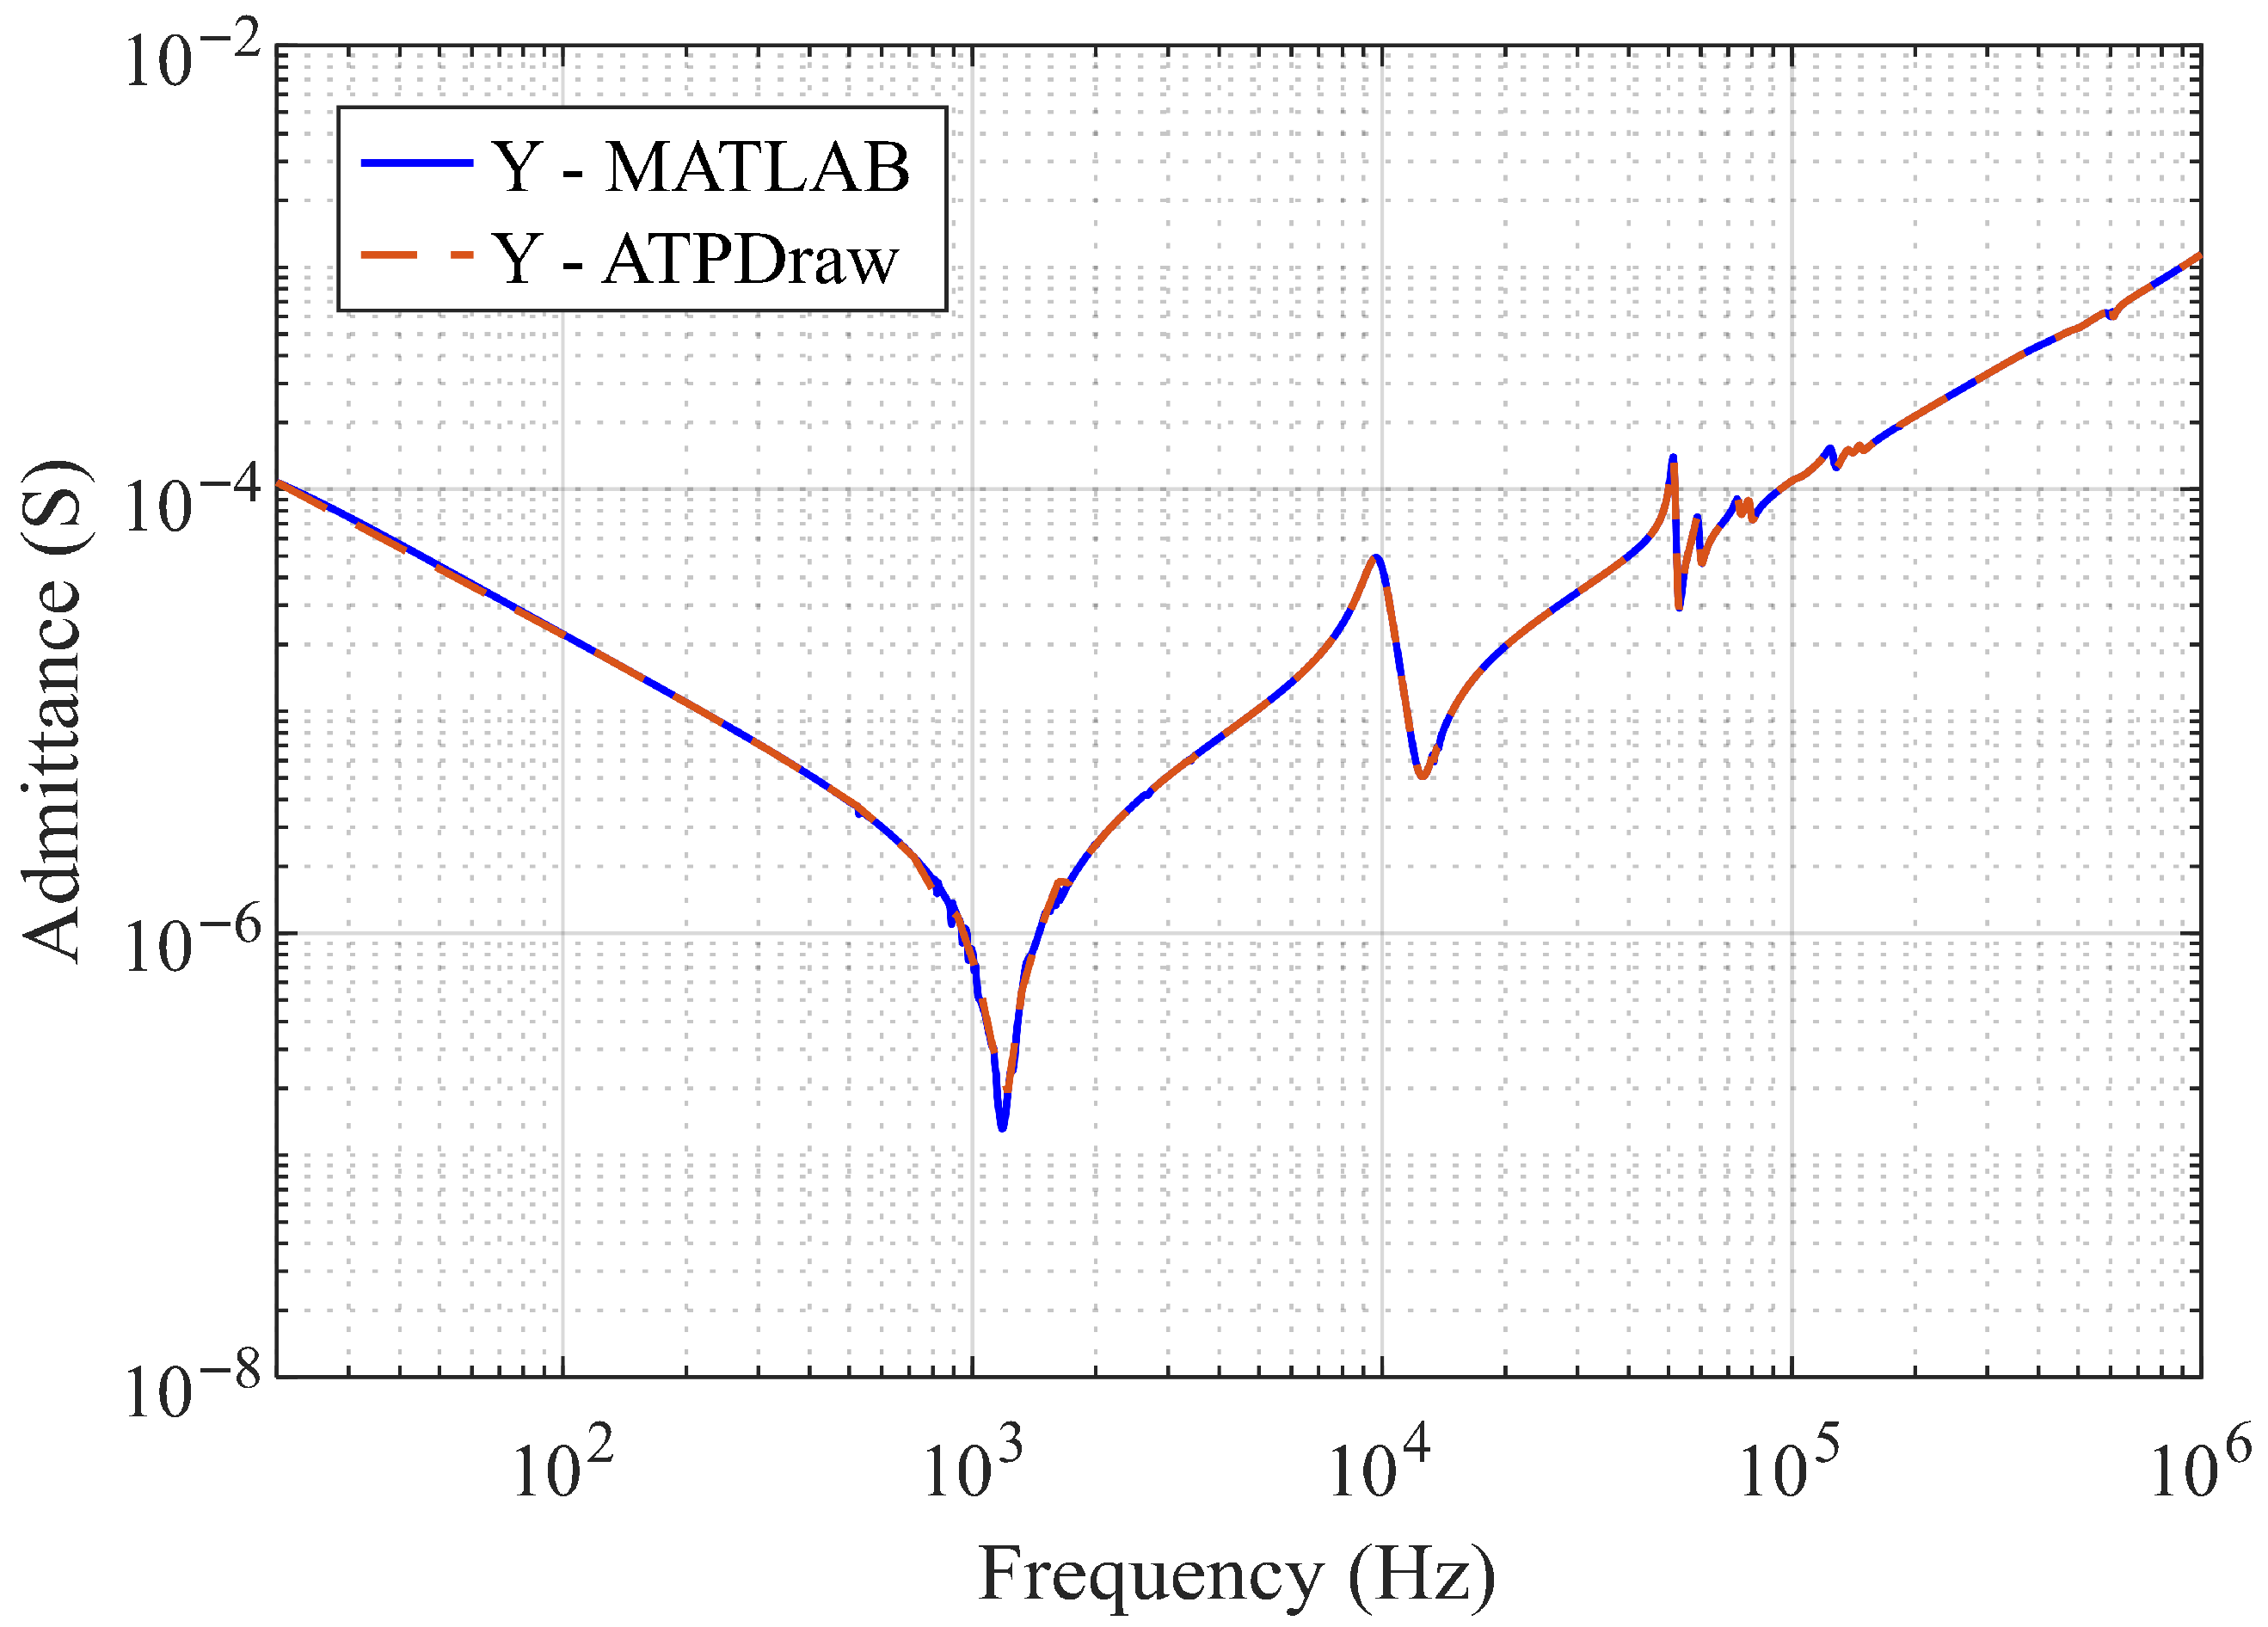
The admittance responses before and after passivity enforcement are nearly identical, confirming that the enforcement procedure successfully corrected non-passive behavior without compromising the model’s accuracy. After validating the final rational approximation, it was converted into an equivalent RLC circuit using the vector fitting toolbox in MATLAB. This circuit was then exported and implemented in ATPDraw for time-domain simulations. Since the model can interact with external networks, it is well suited for various time-domain studies, including analyses of transformer winding behavior during switching events. To verify the accuracy of the implementation, the frequency-domain admittance of the ATPDraw circuit was compared with the MATLAB model over the 20 Hz to 1 MHz range. As shown in
Figure 10, the two responses are nearly identical, confirming that the ATP model accurately replicates the behavior of the fitted model.
5.2. H-Matrix Model
The H-matrix model was developed to analyze the internal voltage response at tap positions T3, T4, and T6. Each corresponding voltage transfer function was fitted using the vector fitting algorithm with 230 poles. This high number of poles was chosen to reduce approximation error, as circuit complexity is not a concern in this case since the model is not converted into an equivalent circuit.
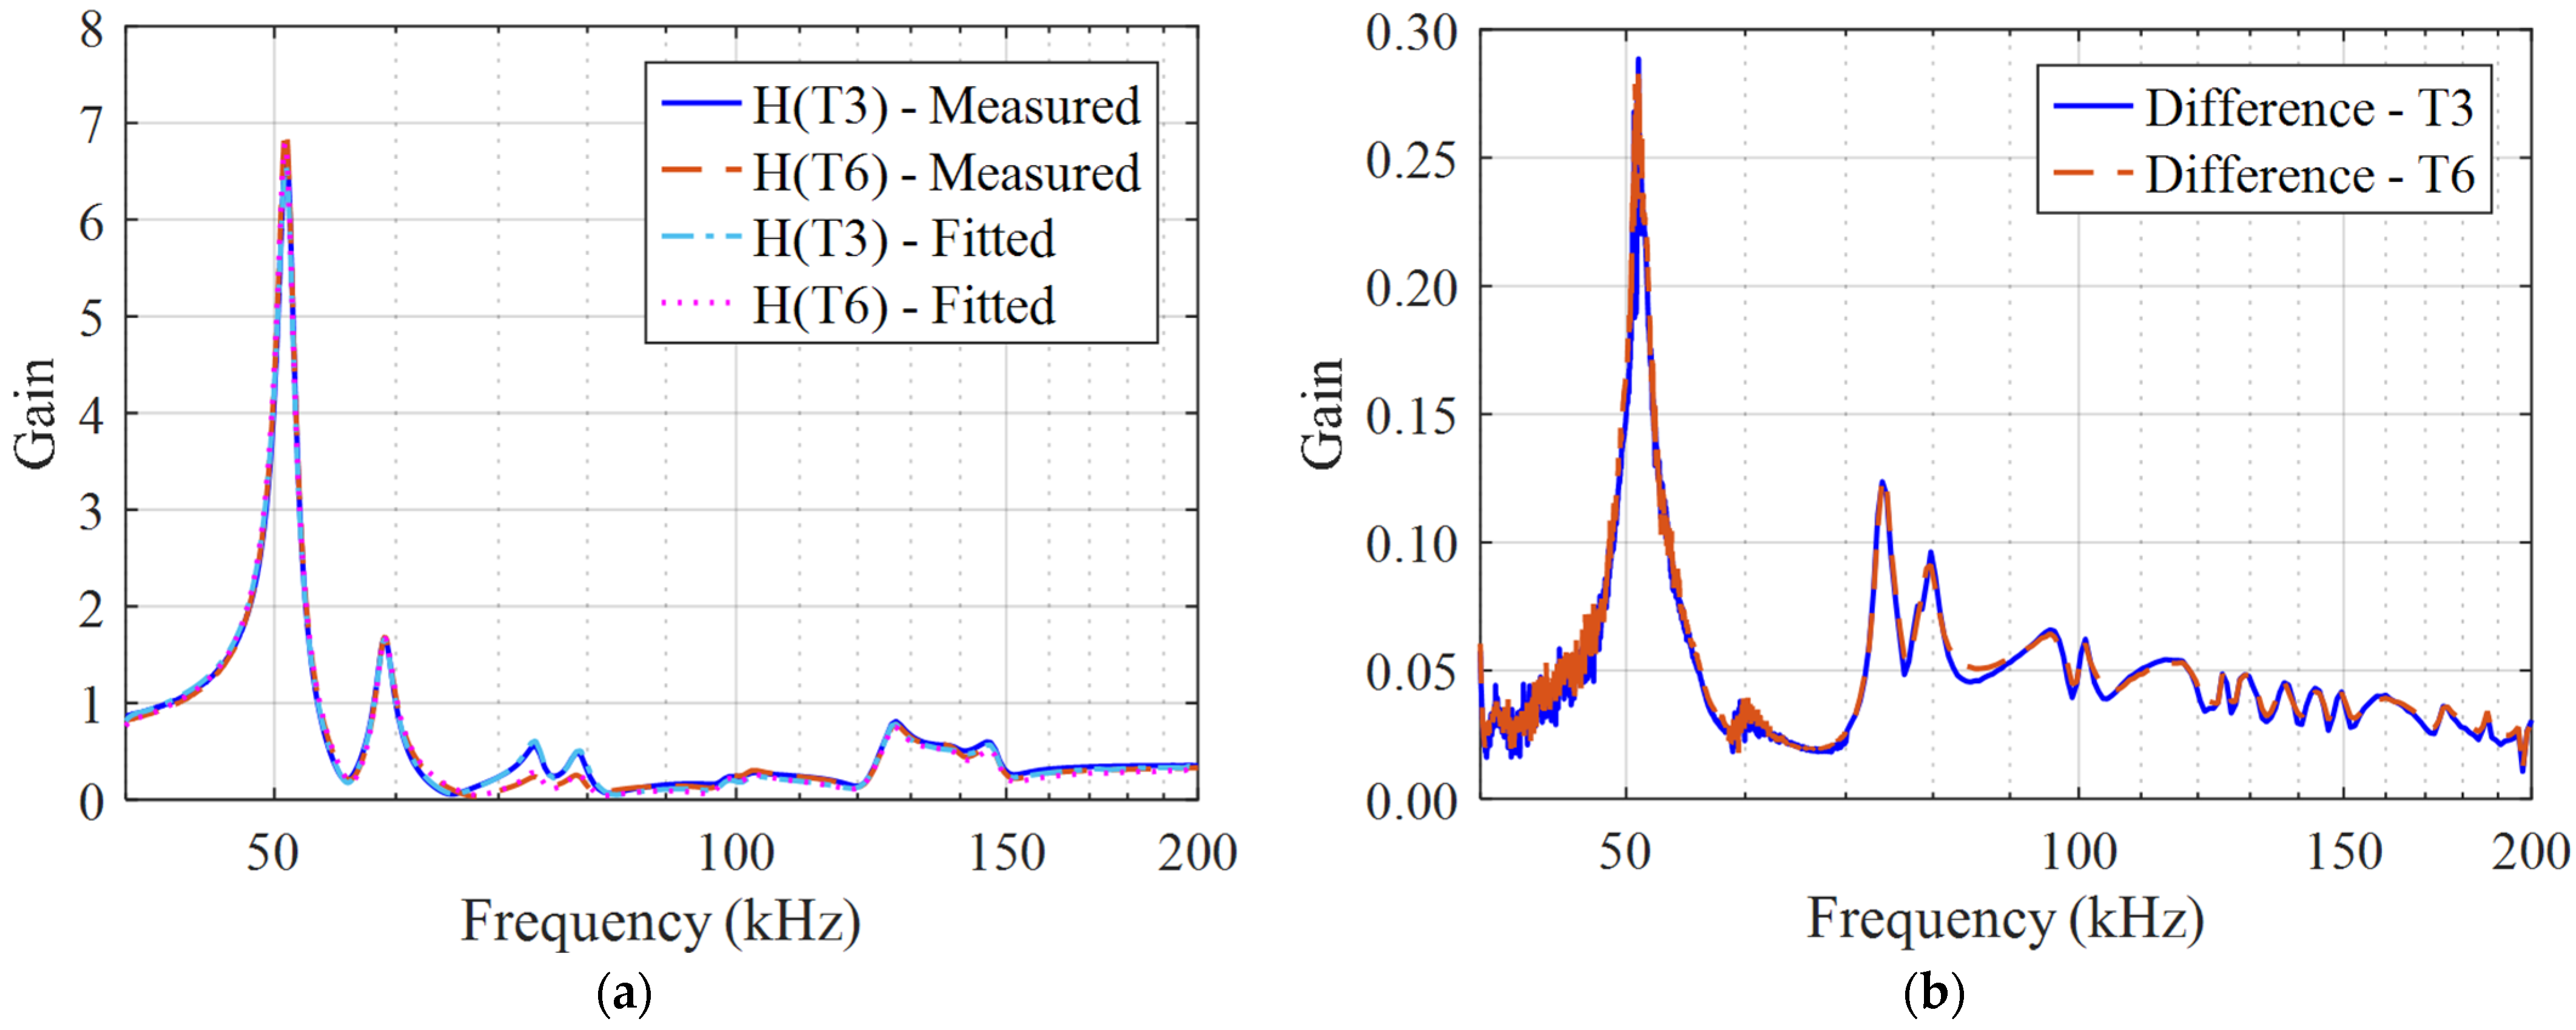
Figure 11 presents the measured and fitted voltage transfer functions for taps T3 and T6 over the frequency range 40 kHz to 200 kHz, along with the corresponding difference curves. The rest of the frequency spectrum is omitted because the response remains effectively constant, as previously shown in
Figure 6. Results for tap T4 are also excluded to preserve clarity in the graphical representation, since they are similar to those obtained for taps T3 and T6.
Overall, the fitted curves closely match the measured voltage transfer functions. The maximum gain difference of 0.29 occurs at the 51 kHz resonance and corresponds to approximately 4% of the peak gain at this frequency, which is considered acceptable. Since the H-matrix model does not interact with external circuits, passivity enforcement is not necessary. The rational transfer functions are converted into the time domain, allowing simulation of internal voltages in MATLAB under different excitations applied at the terminal H1.
5.3. Combined Use of Y-Matrix and H-Matrix Models
Although developed independently, the Y-matrix and H-matrix models are applied sequentially for time-domain analysis of internal resonances. First, an electromagnetic transient (EMT) simulation is performed in ATPDraw using the Y-matrix equivalent circuit to obtain the terminal voltage response under a specified excitation. This terminal voltage is used as input to the H-matrix model in MATLAB, which calculates the corresponding internal voltage distribution at the tap connections. This two-step approach enables efficient and accurate assessment of resonance behavior and potential overvoltages within the winding, without requiring detailed internal modeling in ATPDraw.
6. Time-Domain Validation
To validate the developed model in the time domain, its response was compared with measurements under sinusoidal excitation at the first resonance frequency (51 kHz). The excitation was applied to terminal H1, and the resulting internal voltages at taps T3 and T6, as well as the terminal current, were recorded and compared to simulation results. The voltage source consists of a signal generator (Tabor WW5064, Tabor Electronics, Nesher, Israel) connected to a power amplifier (Rohrer Hero-Power PA2023E, Rohrer Mess- & Systemtechnik, Munich, Germany). Voltage measurements were done using 10:1 passive probes (Lecroy PP005, Teledyne LeCroy, Chestnut Ridge, NY, USA), and the input current was measured with a current probe (Pearson 2100, Pearson Electronics, Palo Alto, CA, USA). All signals were acquired using a digital oscilloscope.
Figure 12 illustrates the experimental setup used for the time-domain validation.
A 51 kHz sinusoidal voltage was applied, corresponding to the first internal resonance frequency identified in the voltage transfer function analysis. This signal was applied to terminal H1, and the internal voltages at taps T3 and T6, as well as the input current at terminal H1, were measured. The same excitation was applied to the model by combining the Y-matrix equivalent circuit in ATPDraw with the H-matrix model in MATLAB.
Figure 13 presents a comparison between the measured and simulated internal voltages at terminals T3 and T6, and
Figure 14 compares the input current.
Considering a peak input voltage of 20.3 V, the maximum measured voltages at taps T3 and T6 were 140 V and 141.7 V, respectively. Under the same excitation, the simulated peak voltages at T3 and T6 were 133.2 V and 137.7 V, corresponding to relative differences of 4.9% and 2.8%. The measured peak current was 2.50 mA, while the simulated peak current reached 2.58 mA, resulting in a deviation of 3.2%. These results demonstrate a good agreement between the measurements and simulation outputs, confirming that the model effectively captures the internal resonance behavior. Therefore, the combined Y-Matrix and H-Matrix models reliably capture the winding’s dynamic response, making it suitable for detailed analysis of internal voltage distribution and potential overvoltages during resonance events.
7. Internal Resonances
The frequency-domain voltage transfer functions revealed two significant resonance frequencies at 51 kHz and 59 kHz, with respective gains of 6.9 and 1.7. Using the developed model, the voltage distribution along the winding can be estimated. Since the internal taps are located near the midpoint of the winding, as described in
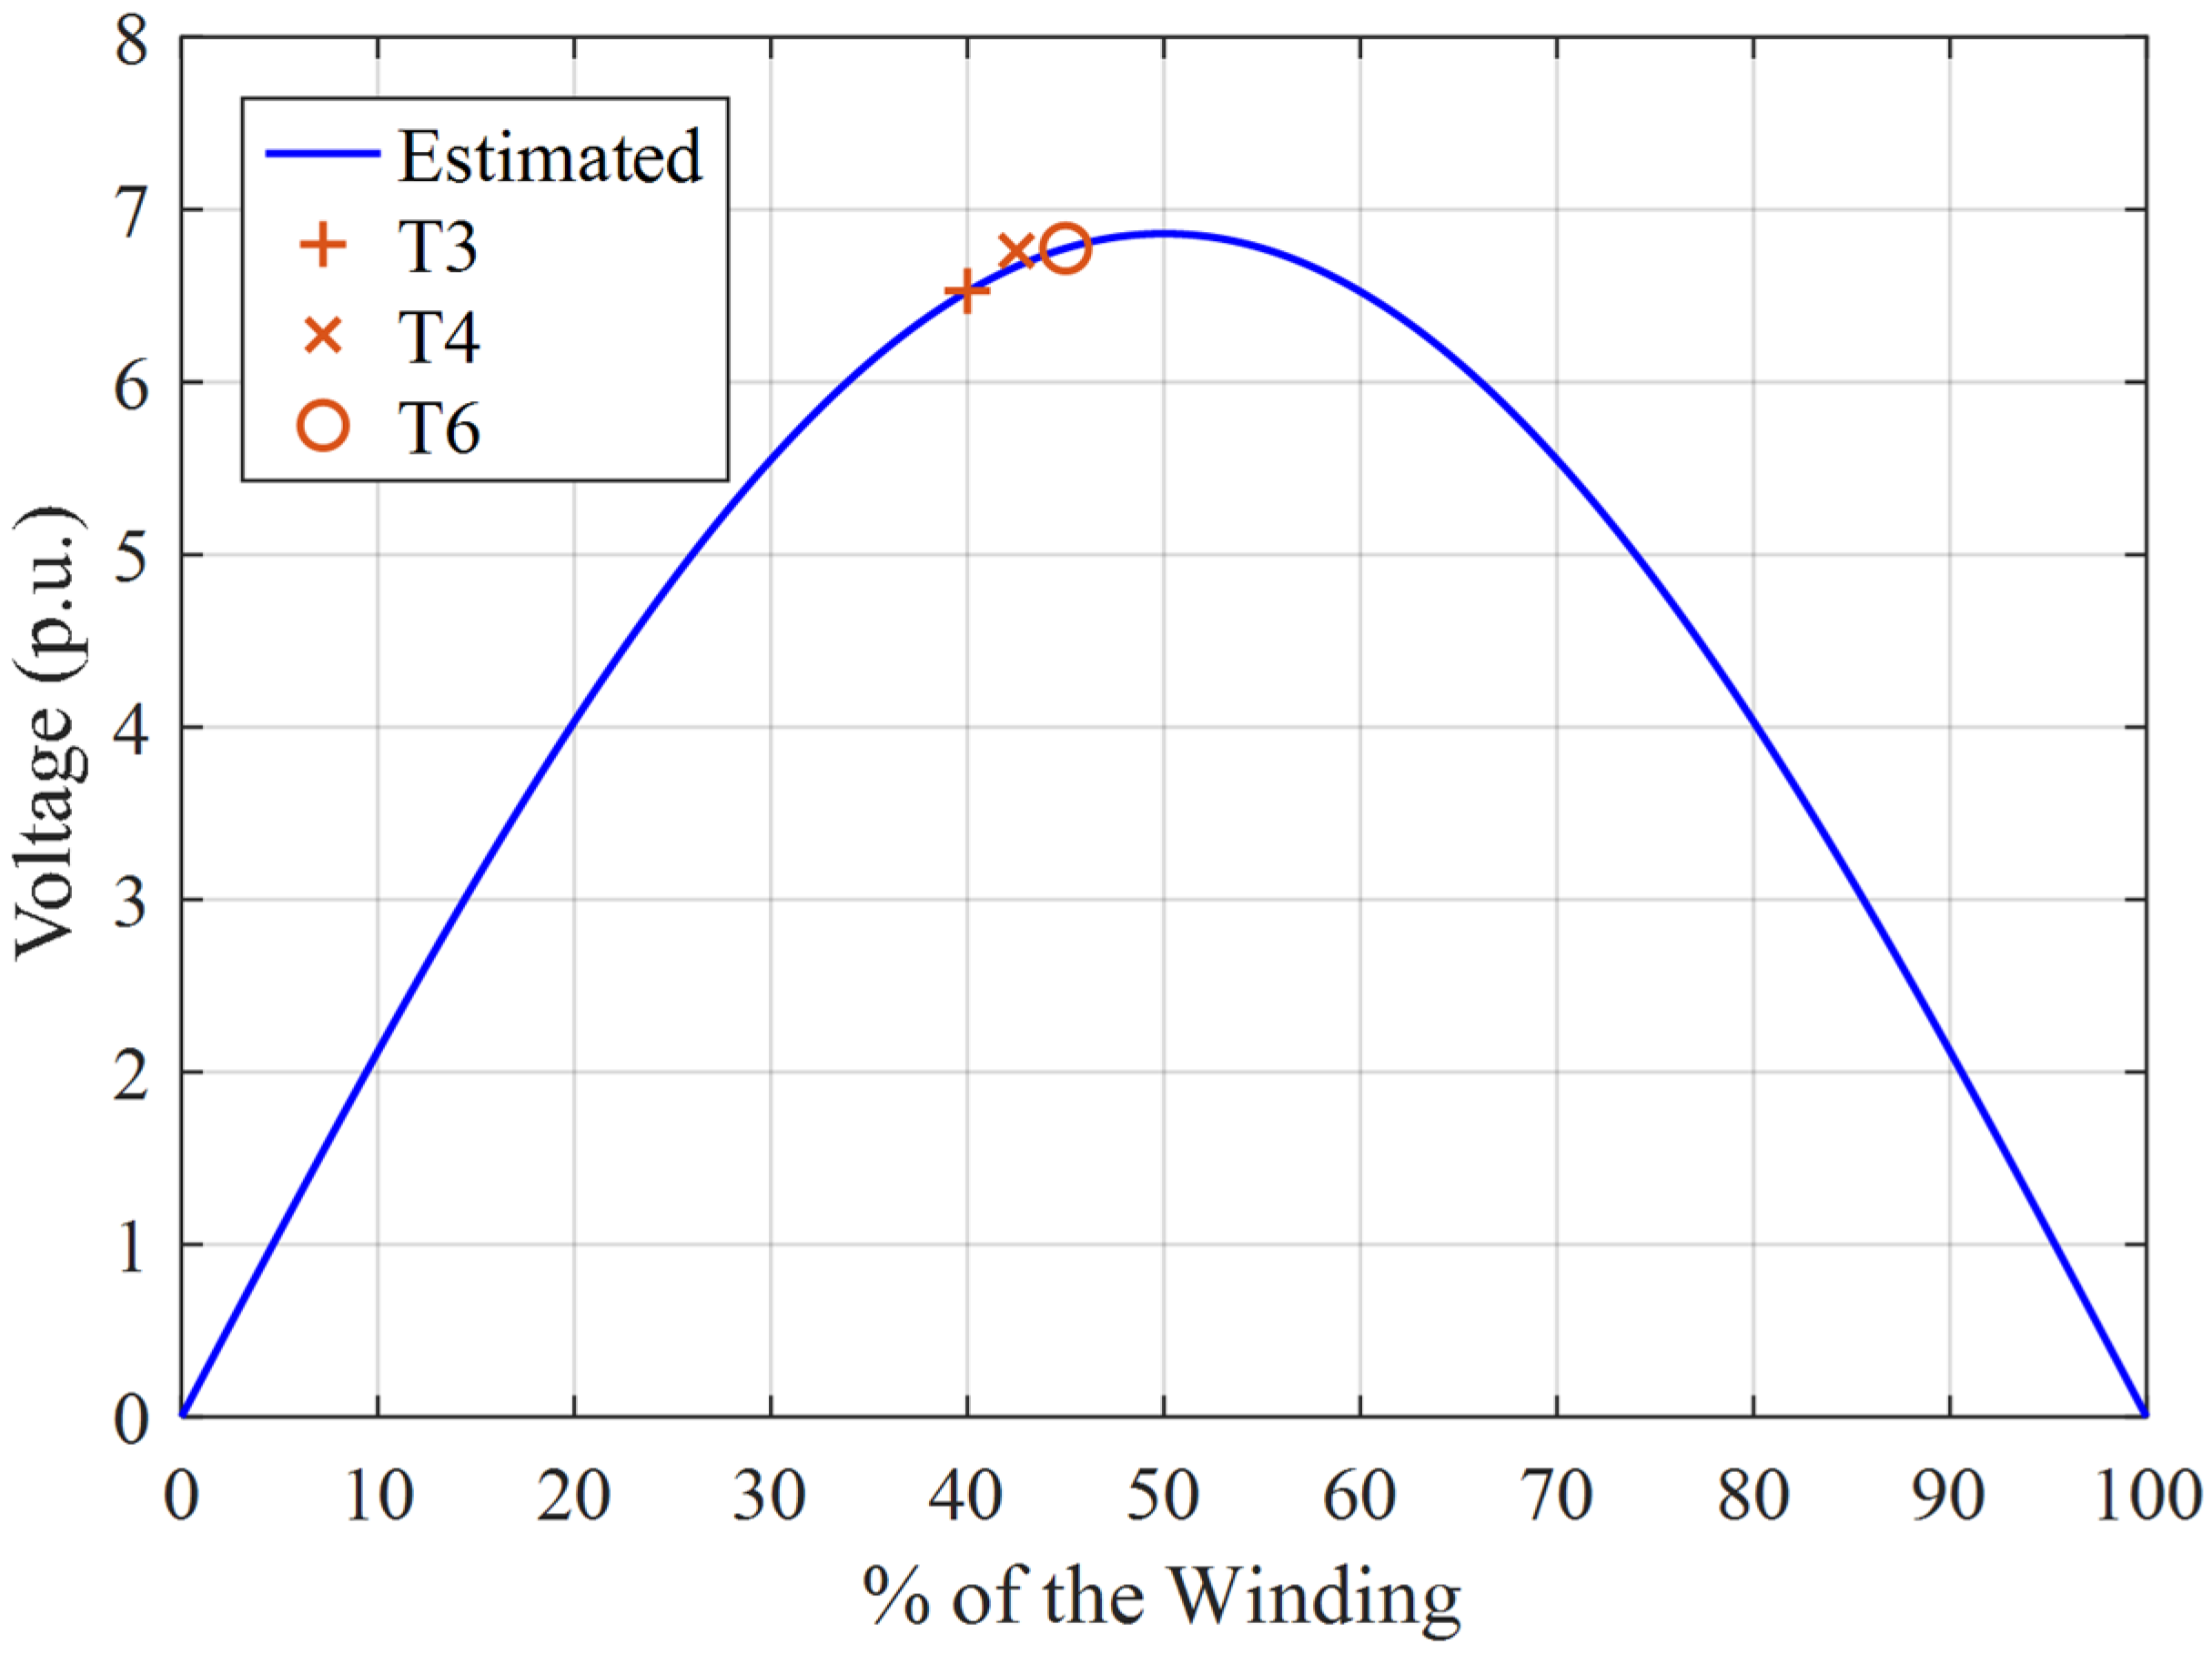
Section 2, the voltages at these points are used to approximate the distribution for the first-mode resonance, critical for evaluating insulation failure risk. Assuming a half-cycle sine wave pattern for this mode, the voltage at tap T6 is used to estimate the distribution along the entire winding.
Figure 15 presents the estimated voltage distribution along the winding with a reference input voltage of 1 p.u. and frequency of 51 kHz.
At the first-mode resonance, the model estimates a peak overvoltage of 6.86 p.u. at the winding midpoint. The calculated voltages at taps T3, T4, and T6 were 6.53 p.u., 6.76 p.u., and 6.78 p.u., respectively, which is in close agreement with the results obtained from frequency response measurements. These overvoltage magnitudes pose a serious risk to the winding insulation, potentially leading to dielectric failure between the winding and ground.
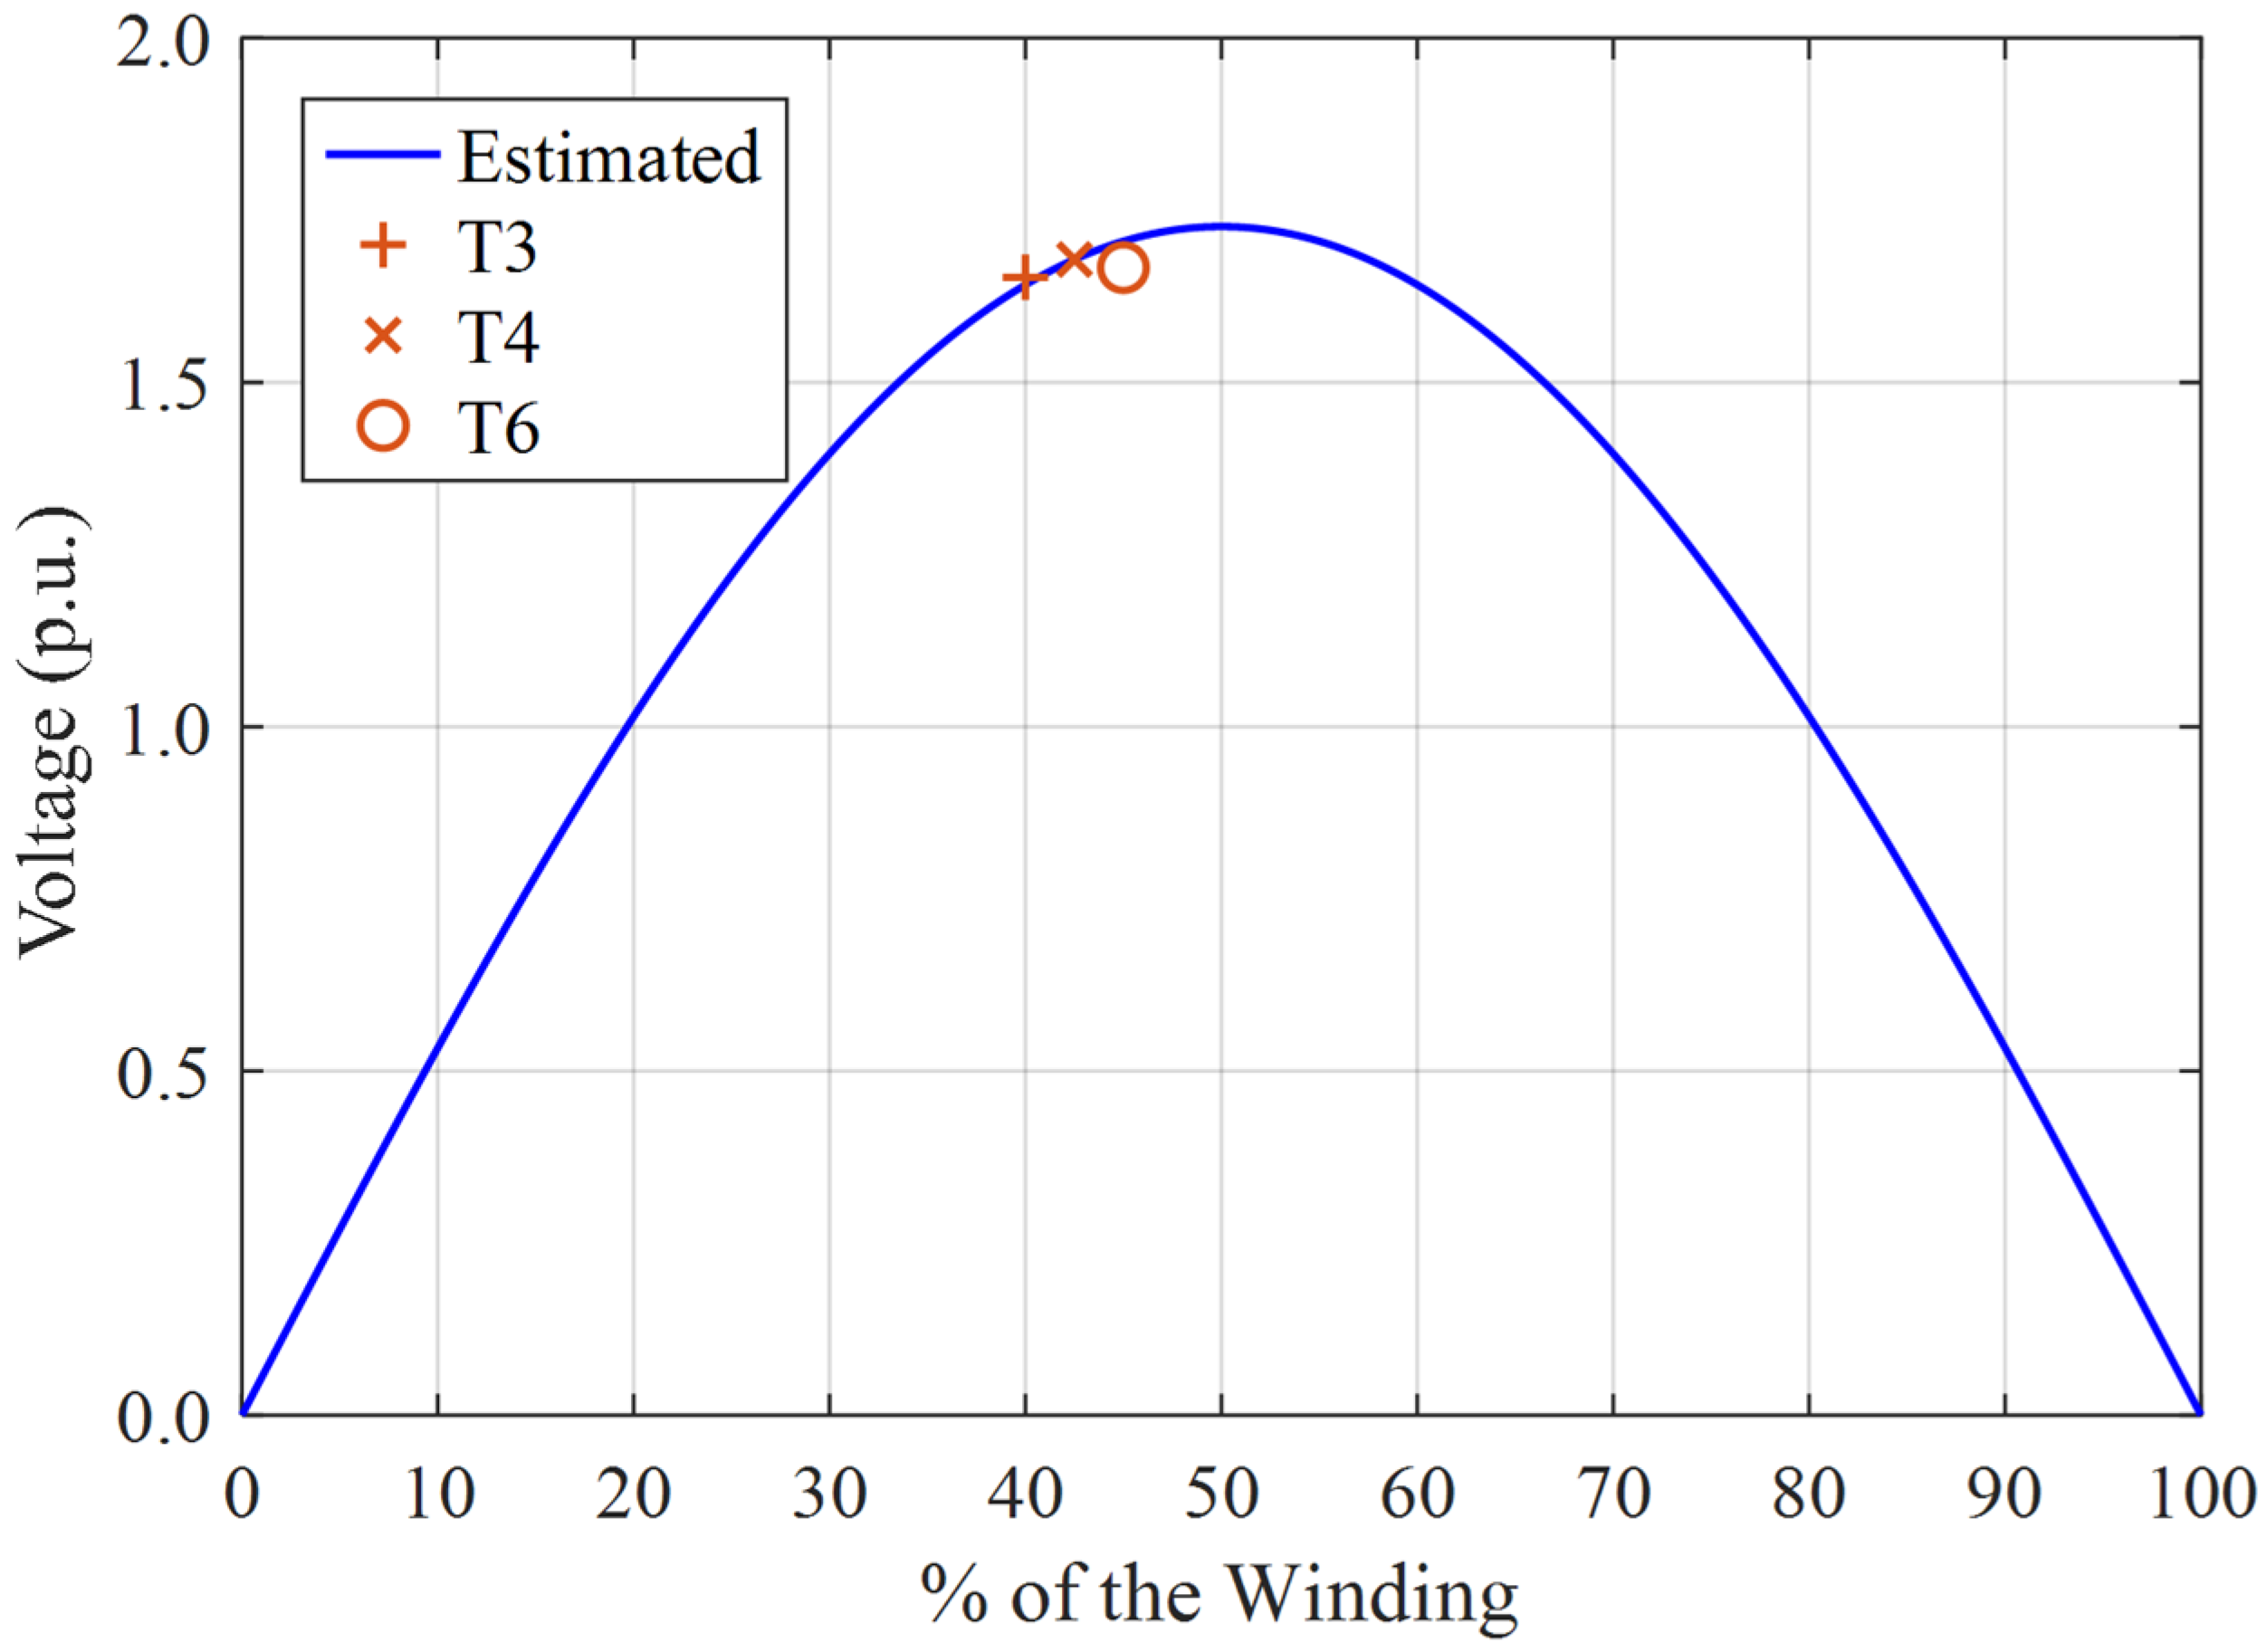
The second resonance frequency, observed at 59 kHz, was also examined in detail. Analysis of the voltages calculated at taps T3, T4, and T6 under excitation at this frequency suggests that it corresponds to another first-mode resonance. To estimate the voltage distribution along the entire winding, the voltage at tap T4 was taken as a reference.
Figure 16 presents the resulting voltage profile, assuming a 1 p.u. input voltage at 59 kHz.
The maximum voltage at the winding midpoint is 1.73 p.u., while the calculated voltages at taps T3, T4, and T6 are 1.65 p.u., 1.68 p.u., and 1.67 p.u., respectively. Further analysis indicated that this resonance frequency is related to the mutual inductive coupling between the central phase and the two outer phases. In other words, it reflects the influence of adjacent phases on the HV winding of the central phase. When the same voltage is simultaneously applied to the HV windings of the three phases, the amplification at this frequency becomes more pronounced, as shown in
Figure 17.
When the same voltage (with equal amplitude and phase) is applied simultaneously to all three phases, the resonance at 51 kHz is suppressed, while the resonance originally observed at 59 kHz in single-phase measurements becomes dominant. However, due to the connection of the three phases, the inductances and capacitances are modified, shifting this resonance slightly to a lower frequency, approximately 58 kHz, with a maximum amplification of 7.5. This behavior is attributed to the magnetic coupling between the central phase and the adjacent phases. Therefore, the analysis identified two critical resonance frequencies for the evaluated winding, 51 kHz and approximately 59 kHz, both of which can lead to severe overvoltages. Excitation at these frequencies may exceed insulation limits, potentially resulting in dielectric breakdown and complete failure of the transformer.
8. Discussion
This study focused on the characterization and modeling of internal resonances in a high-voltage winding assembled in a distribution transformer. The black-box modeling approach enabled accurate reproduction of internal voltage distributions and resonance phenomena based on external and internal terminal measurements. While this approach proved effective for analyzing the selected winding, the investigation also revealed that interactions with adjacent phases significantly affect internal resonance behavior.
In particular, the presence of a secondary resonance at 59 kHz, which became dominant when the same excitation was applied simultaneously to all three phases, highlights the influence of mutual coupling between phases. This observation indicates that magnetic interactions between phases significantly influence the resonance characteristics of the transformer. As a result, conducting a more comprehensive analysis that includes all three phases and considers their mutual interactions would provide a clearer understanding of the internal electromagnetic behavior of the transformer.
Therefore, extending the modeling approach to include all phases of the transformer could offer additional insight into multi-phase coupling effects and further improve the accuracy of internal resonance assessments. Such an extension would support more comprehensive insulation coordination studies and contribute to a deeper understanding of the factors influencing internal overvoltages in complex transformer designs.
Beyond the influence of multi-phase coupling, resonance behavior is also defined by a broader set of factors. Electromagnetic aspects such as winding capacitances, leakage and magnetizing inductances, and mutual coupling between windings establish the fundamental resonance modes. Furthermore, constructive features, including the transformer tank, winding arrangement, and insulation, also influence the overall response.
Finally, a star-star configuration was used in this study for practical reasons, whereas in actual operation, the delta–star connection can affect the excitation and damping of resonance modes. In delta-connected windings, internal resonance peaks, such as the 6.86 p.u. observed at the winding midpoint, represent relative overvoltages within the winding rather than absolute phase-to-ground voltages, indicating local dielectric stresses that may compromise insulation. Additionally, both the magnitude of voltage amplification and the resonance frequencies could change in the delta configuration due to variations in inductances and capacitances. Extending the analysis to delta-connected windings is therefore an interesting topic for future investigation.
9. Conclusions
This work presented a detailed methodology for modeling and analyzing internal resonances in transformer windings using a black-box approach based on frequency-domain measurements. The developed model, comprising a terminal Y-matrix implemented in ATPDraw and internal voltage transfer functions (H-matrix) implemented in MATLAB, enables accurate time-domain analysis of winding behavior under various excitations. Time-domain validation under resonant conditions (51 kHz) confirmed the model’s accuracy in capturing internal resonance phenomena.
Analysis revealed two critical resonance frequencies at 51 kHz and 59 kHz, each capable of generating significant overvoltages within the winding. The first-mode resonance at 51 kHz results in a peak voltage of 6.86 p.u. at the winding midpoint, posing a serious risk to insulation integrity. Moreover, mutual inductive coupling with adjacent phases was shown to change the dominant resonance behavior, highlighting the importance of three-phase interactions in high-voltage systems.
The results highlight the importance of considering internal resonances in insulation coordination studies and indicate that conventional protection strategies may be inadequate when based solely on terminal responses. The proposed approach is particularly well-suited for post-failure investigations, as it enables the identification and assessment of resonance frequencies and their potential role in transformer failures. In addition, it provides a reliable tool for evaluating and mitigating resonance-induced overvoltages, thereby enhancing the reliability and safety of power transformer operation.
Moreover, this methodology can serve as a complement to studies carried out with the transformer connected to the power grid. While grid-connected analyses capture the interaction with system dynamics during events such as switching operations, the present approach provides detailed insight into the internal resonance characteristics of the transformer itself. Combining both perspectives offers a more comprehensive understanding of resonance phenomena under realistic operating conditions.
