Article

Toward Reliable FOWT Modeling: A New Calibration Approach for Extreme Environmental Loads

1
Center for Offshore Wind & Green Hydrogen Ammonia Research, Korea Maritime and Ocean University, Busan 49112, Republic of Korea
2
Sustainable Energy Engineering Department, College of Engineering, University of Mosul, Mosul 41002, Iraq
*
Author to whom correspondence should be addressed.
Energies 2025, 18(20), 5545; https://doi.org/10.3390/en18205545
Submission received: 15 September 2025 / Revised: 12 October 2025 / Accepted: 18 October 2025 / Published: 21 October 2025

Abstract

The current paper presents a comparative analysis between a high-fidelity simulation tool and computational fluid dynamics (CFD) in evaluating the behavior of a fully coupled floating offshore wind turbine (FOWT) system subjected to three distinct design load cases, with a particular emphasis on extreme weather scenarios. While both approaches yielded comparable results under standard operational conditions, noticeable discrepancies emerged in surge drift and mooring line tension during typhoon conditions. The present work highlighted a significant limitation of standard calibration methods based on free-deck motion that are not reflective of the unique features of extreme environmental responses. To address this limitation, a novel calibration methodology is suggested that uses drag coefficients derived from direct measurement of extreme load cases. The prediction accuracy of the high-fidelity simulation model was significantly improved by refining the transverse component of the drag coefficients of major structural components, decreasing prediction accuracy of surge and mooring tension responses from almost 30% error to about 5%. Further, despite increasing the fidelity of calibration under extreme environmental conditions, it is primarily contingent on high-fidelity measurements corresponding to the use of the most conventional calibration approach under normal environmental conditions. Ultimately, the results demonstrate the need for accurate calibration approaches to provide reliable performance predictions of FOWT systems under varying extreme environmental conditions.

1. Introduction

Wind energy has been harnessed in shallow coastal waters for some time now, which has contributed to the development of Floating Offshore Wind Turbines (FOWTs) designed to economically capture wind energy in deeper, more inaccessible waters of the ocean. Over the last few decades, researchers have explored various designs for fixed-bottom foundations for offshore wind turbines, including monopile [1,2,3] and jacket-type [4,5,6] substructures. Most offshore turbines from these designs are installed in shallow waters, where monopile foundations are driven into the seabed or where concrete gravity bases are moored to the ocean floor. However, these matured systems become economically unfeasible when used in deeper waters. In the last ten years, approaches for deep sea wind energy capture, involving turbines set on buoyant foundations that are anchored to the seabed, have become more common and advanced. Floating turbine platforms are primarily classified into three categories based on their stability configuration and depth of installation. The first type of platform, the spar buoy platform, makes use of a substantial submerged ballast to ensure stability and avoid capsizing [7]. The second type, a tension-leg platform, describes a vertically oriented, floating system of which the legs and tendons are anchored at each corner of the structure to the sea floor, thus ‘permanently’ fixing the structure in place [8]. The third type, a semi-submersible platform, uses horizontally spaced pontoons to interconnect a system of numerous cross beams and bracings. The pontoons are designed and configured in such a way to provide positive buoyancy to counter the combined weight of the wind turbine and the mooring system. The platform’s positive buoyancy assists in maintaining the platform’s stability, counteracting platform motion in the pitch and roll axes, which are critical to maintaining the position of the tower and Rotor-Nacelle Assembly (RNA) [9].
Designing a floating offshore wind turbine (FOWT) system plays a vital role in addressing multiple issues due to complexities in structural makeup and the interacting and ever-changing environmental constraints. The turbine, floating platform, and mooring system have strong interactions. Understanding these interactions and avoiding costly and time-consuming large-scale experiments and field testing has led to the prominence of numerical simulations in the design process. Specialized design codes and computational modeling have advanced to assist integrated simulation frameworks, which provide multiple coupled simulation environments and level subsystems. These integrated simulation environments provide an coupled simulation hydrodynamics and mooring for control, structural elasticity for control, and embedded to the design for system behavior assessment in realistic operating environments. Each of these tiers is informed through system dynamics design. Much of the simulation literature uses experimental validation and steps, particularly the rest of the power BEM. Potential flow simulation has coupled hydrodynamics to control the system. For FOWT simulation, Yang et al. [10] developed a new coupling called F2A, which connects the aerodynamic (FAST) and hydrodynamics and mooring (AQWA) models. The comparisons with OpenFAST validates F2A and illustrates its enhanced capability to model the intricate nonlinear and multi-body interactions inherent within FOWT systems. Kvittem et al. [11] analyzed the dynamic response of a semi-submersible wind turbine to wind and ocean waves by using two hydrodynamic modeling techniques: potential flow theory and Morison’s equation. As described in the study, while both methods predict the platform motion with a comparison degree, the differences in added mass and drag and control parameters create a disparity in their effects on power generation and blade loading.
Inaccurate assessments of floating wind energy potential highlight the need for more high-fidelity CFD models for FOWT development. Yang et al. [12] analyzed the accuracy of a mid-fidelity simulation tool for floating offshore wind turbines by benchmarking it against CFD results under extreme operating conditions. The results showed the largest errors in predicted surge and pitch loads due to the omission of wind-induced currents, confirming the complexity of hull geometry as the primary reason CFD models are preferred. Tran et al. [13] presented a new simulation model that deeply analyzes the interaction of wind, waves, and internal structural motion of floating offshore wind turbines. The predicted results corresponded to both the experiments and the established codes, confirming the model’s potential to capture the complex aerodynamic and hydrodynamic interactions accurately. Yang et al. [14] assessed the accuracy of a potential-based tool predicting load responses for a floating offshore wind turbine (FOWT) with a rectangular pontoon. The authors evidenced the accuracy of the prediction under extreme conditions by calibrating the potential-based model along with CFD, demonstrating the integration of both damping and Morison drag coefficients. An integrated aero-hydrodynamic modeling framework that combines nonlinear potential flow theory, a high-order boundary element approach, blade element momentum aerodynamics, catenary mooring dynamics, and mooring dynamics. Deng et al. [15] introduced a unified aero-hydrodynamic modeling framework that integrates nonlinear potential flow theory, a high-order boundary element method, blade element momentum aerodynamics and catenary mooring analysis. The integrated model showed a good agreement with experimental data and compares to CFD simulations when compared to the NREL 5-MW DeepCwind semisubmersible reference system. In connection with the NREL 5-MW DeepCwind semisubmersible reference system, the model attained findings that matched the experimental data and CFD simulations. Wang et al. [16] performed simulations of motion, mooring loads, and structural response of the platform considering the impacts of varying wind speeds and hydrodynamic sea conditions. In a high-resolution CFD study, Alkhabbaz et al. [17] assessed NREL 5-MW turbine wind surge motion impacts on the aerodynamics and wake in the surge region of an OC4 semisubmersible platform. This study employed DFBI+VOF methods with overset grids and was validated with results from FAST and OrcaFlex simulation environments while the simulation data were also compared with OrcaFlex.
Some researchers have tried to evaluate and compare the predictive capabilities of engineering models with results from computational fluid dynamics (CFD) simulations and corresponding experimental measurements. Using CFD to evaluate the response of the DeepCwind semisubmersible platform to regular wave conditions, Burmester et al. [18] noted the importance of viscous forces in affecting low-frequency motions and concluded that CFD reliably captures the movement behavior of the platform. Li et al. [19] improved an engineering model by incorporating nonlinear second-order wave forces, along with frequency-dependent added mass and damping, which were obtained from CFD-derived estimations. The improved model showed better agreement with the experimental results, primarily in predicting the fatigue loads on the mooring lines and base of the tower. In Phase I of the OC6 project, the OpenFAST models were further refined by modifying the viscous drag coefficient, which improved the prediction of low-frequency motions, especially in surge and pitch [20]. Wang et al. [21] performed CFD on the same platform under irregular wave conditions and reported a comparison of their results to experimental data. According to the analysis, the CFD model does indeed reproduce the nonlinear low frequency behavior. However, the model does underpredict the platforms response near the pitch resonance range, most likely due to inconsistencies during the wave input parameters or numerical inaccuracies during the simulation. Additionally, there are large gaps the study provides that can be focused on to improve high level modeling. Tran et al. [22] explained how the surge motion of floating offshore wind turbines (FOWTs) impacts unsteady aerodynamics. They analyze surge amplitudes on the CFD with an overset moving grid method, and surge frequency interplays with aerodynamic forces and flow and BEM analysis to the momentum and wind turbine blade. Yang et al. [23] studied the impact of the number of columns on the stability and hydrodynamic performance of semi-submersible floating platforms.
Considering the points discussed above, several theoretical perspectives must be taken into account regarding how viscosity and structural complexity influence irregular geometries, such as rectangular pontoons, when evaluating floating offshore wind turbines (FOWTs). Most computational approaches, including the BEM, often produce inaccurate predictions of aerodynamic forces because they rely heavily on adjustment and correction schemes [24,25,26,27]. These simplified models do not adequately represent the complex interaction between the rotor and its wake. For floating wind turbines in particular, BEM-based rotors tend to yield the poorest estimations of wind behavior under motion and are therefore generally dismissed [28]. Moreover, the BEM significantly underestimates the effects of viscosity and the influence of blade-tip vortices [29]. From a hydrodynamic perspective, most numerical simulation tools rely on potential-flow theory, which inherently neglects viscous effects [30,31]. Consequently, simplified models such as the Morison equation or experimental correlations are typically used to approximate additional damping coefficients. To compute hydrodynamic parameters such as added mass, hydrostatics, damping, and radiation or diffraction forces external solvers like WAMIT [32] and OrcaWave [33] are often coupled with other platforms. These tools can be integrated with software such as FAST or OrcaFlex; however, they still fail to capture certain real-world phenomena, including wave run-up, wave breaking, vortex-induced motions caused by currents, impacts from sea ice or floating debris, and viscous flow separation around the floating structure [34,35,36,37,38].
Because of these limitations, the application of CFD in floating offshore wind turbine (FOWT) studies is typically restricted, with its main role being the free-decay simulations used to estimate damping coefficients. Damping behavior can be represented through either linear and nonlinear damping coefficients or drag coefficients. Nevertheless, coefficients derived from free-decay tests often fail to adequately capture current-induced or wave-drift effects. In contrast, drag coefficients provide a better representation of these influences but do not replicate free-decay behavior with the same accuracy. As a result, combining both approaches, while carefully weighing their respective contributions, is essential. At present, correction factors used in high-fidelity numerical tools are mostly established from CFD-based or experimental free-decay results, complemented by conventional drag coefficient values derived from body geometry. Insufficient integration of damping or drag effects; however, can compromise the operational safety of FOWT systems. Furthermore, the absence of reliable empirical coefficients continues to limit the robustness of high-fidelity analyses, and research directed toward developing optimized correction factors for specific environmental conditions remains underexplored. Therefore, the present work aimed to address and enhance the shortcomings of correction techniques derived from free-decay analyses. To overcome the inability of conventional approaches to capture current-induced effects, a fully coupled FOWT system comprising the floater, tower, rotor-nacelle assembly (RNA), and mooring system was examined for code verification using both high-fidelity analysis tools and CFD simulations. In contrast to commonly investigated configurations, the study employed a newly designed semisubmersible platform in combination with the DTU 10 MW turbine. Three design load case (DLC) simulations were carried out with a high-fidelity tool calibrated against free-decay time series, and the resulting load responses were compared with CFD outputs. Based on these comparisons, correction factors within the high-fidelity framework were refined using CFD load responses that included current effects. Finally, the updated tool’s performance was validated against additional CFD results, confirming the extent to which the proposed modifications improved predictive accuracy.
Due to these constraints, the use of CFD in floating offshore wind turbine (FOWT) research is generally limited. Its primary function is often confined to free-decay simulations, which are employed to estimate damping characteristics. These characteristics may be described using linear or nonlinear damping coefficients, or alternatively through drag coefficients. However, results from free-decay tests do not effectively account for current-related or wave-drift phenomena. Drag coefficients, on the other hand, capture these influences more accurately but fail to reproduce free-decay behavior as precisely. Consequently, a balanced combination of both methods is necessary to obtain reliable results. At present, correction factors used in high-fidelity numerical models are commonly based on CFD or experimental free-decay outcomes, and are further refined using traditional drag coefficient values derived from body geometry. When damping or drag influences are not properly incorporated, the safety and stability of FOWT operations may be compromised. Additionally, the lack of dependable empirical coefficients continues to limit the accuracy of high-fidelity simulations, highlighting the need for more focused research on developing improved correction factors tailored to specific environmental conditions.
To address these gaps, the present study focused on refining correction methods obtained from free-decay analyses. To compensate for the limitations of conventional techniques in capturing current effects, a fully coupled FOWT model including the floater, tower, rotor-nacelle assembly (RNA), and mooring system was analyzed for code verification using both CFD and high-fidelity simulation tools. Unlike most previous works, this research employed a newly designed semisubmersible platform combined with the DTU 10 MW turbine. Three design load cases (DLCs) were simulated using a high-fidelity tool calibrated against free-decay time-series data, and the corresponding load responses were compared with CFD predictions. Based on these comparisons, the correction factors within the high-fidelity framework were updated using CFD results that accounted for current effects. Finally, the revised model was validated against additional CFD simulations, demonstrating significant improvements in predictive accuracy.

2. Numerical Framework

2.1. Simulation Tools Employing Potential Flow Principles

To perform dynamic analyses of floating offshore wind turbines (FOWTs) with potential flow-based methods, one must first express the hydrodynamic properties by assessing the interaction between waves and structure over a bank of frequency ranges this is performed through the potential flow theory which considers the fluid to be incompressible, inviscid, and irrotational as shown in Equation (1). Accordingly, the velocity potential function (ϕ) describing the flow field is required to satisfy the Laplace equation.
2 ϕ = 0
where 2 is the Laplacian operator representing the sum of second derivatives in space, and ϕ is the velocity potential function of the flow field. As the fluid is assumed to be incompressible and inviscid, we must ensure that velocity is continuous between the fluid domain and the structural interface. Thus, the boundary condition for velocity at the structural interface is obtained from Equation (2).
ϕ n = V n
where ϕ n represents the normal derivative of the potential function at the surface, and V n denotes the normal velocity at the surface. This relationship is used to model the motion of the structure, calculate surface velocities, and derive added mass and damping coefficients.
The free surface boundary condition describes the dynamics of the fluid upper surface in the flow field around a structure. Based on the processes involved, the free surface between fluid and air is categorized into a dynamic form, and a kinematic form. The dynamic condition, which is based on Bernoulli’s equation and the principle of conservation of energy is defined in Equation (3). Within potential flow theory, the velocity field can be defined through the velocity potential function with a time-dependent component to model unsteady flow behavior.
ϕ t + 1 2 ϕ 2 + g η = 0
where η is the free surface displacement.
The kinematic boundary condition states that fluid particles located at the free surface follow its profile and remain consistent with its motion, as expressed in Equation (4).
η t + V · η = v z
Here, η t represents the temporal rate of change in the free surface, V is the velocity vector of the fluid, η denotes the free surface slope, and v z is the vertical velocity component of the fluid at the free surface.
According to these theoretical concepts, the Laplace equation is numerically addressed through the Boundary Element Method (BEM), where the structural surface is divided into discrete panels. This technique enables the evaluation of hydrodynamic responses, including restoring and radiation forces, as well as added mass and damping coefficients. The method further yields response amplitude operator (RAO) data, which serve as a valuable basis for examining fluid–structure interactions. Nonetheless, certain important physical effects present in real-world environments are not captured. For example, potential flow theory excludes viscous influences, despite viscous damping being a dominant contributor to low-frequency motion dissipation. Likewise, the framework accounts only for linear damping, thereby neglecting nonlinear contributions that become significant under large wave conditions, slamming events, or substantial structural motions. Limiting the analysis to linear damping alone may therefore lead to underestimation of energy dissipation.

2.2. Computational Fluid Dynamic

The CFD is an important tool that can be used for the design and validation of FOWTs since it properly factors in factors, such as fluid viscosity, compressibility, and nonlinear effects. This study employed CFD as a means of performing free-decay analysis and evaluating load response for FOWTs in different environmental states. The CFD was modeled based on fundamental governing equations as seen in Equations (5) and (6).
Continuity equation:
ρ t + · ( ρ u ) = 0
where u represents the velocity vector of the fluid, the Momentum Equation (Navier–Stokes equation):
ρ u t + u · u = p + μ 2 u + f
where ρ is the fluid density, μ is the dynamic viscosity, p is the pressure, and f represents external body forces. In the momentum equation, the first term on the left-hand side corresponds to the time-dependent variation in velocity, whereas the following term is the convective component, capturing the spatial changes in velocity as the fluid is transported. This component becomes especially important in nonlinear flow phenomena, including turbulence and vortex formation. On the right-hand side, the initial term reflects the pressure gradient, representing the influence of spatial pressure differences on the fluid. The subsequent term accounts for viscous effects, and the final term incorporates external influences such as gravity and mooring loads.
In CFD simulations of floating body motions, the Volume of Fluid (VoF) approach was employed. This technique captures free-surface dynamics by assigning a volume fraction ( α ) to each computational cell. Depending on the α value, the corresponding density and viscosity within the momentum equation are updated to differentiate fluid phases. Accordingly, the continuity and momentum equations are modified to represent the correct material properties, as expressed in Equations (7) and (8). Furthermore, surface tension effects at the fluid interface are accounted for through the external force term (f).
ρ = ρ w a t e r + ( 1 α ) ρ a i r
μ = μ w a t e r + ( 1 α ) μ a i r
In CFD, the wave model represents defined wave conditions by integrating wave motion with the momentum equation. In the present work, first-order regular waves were applied, with their properties determined using linear wave theory. The model accounts for the pressure gradient generated by wave forces, along with the wave-induced momentum, within the momentum formulation. According to linear wave theory, the resulting pressure distribution is expressed as a gradient term and incorporated into the momentum equation, as illustrated in Equation (9).
p w a v e = ( ρ g η ρ ω 2 A k cosh ( k z + h ) cos k x ω t )
where p w a v e represents the pressure due to wave forces, η is the free surface displacement, ω is the angular frequency, k is the wave number, and h is the water depth. The distribution of wave velocity, reflecting the momentum imparted by waves, is embedded within the convective term, as formulated in Equation (10).
u w a v e , x = ω A sinh k h cosh k z + h cos k x ω t
u w a v e , y = ω A sinh k h cosh k z + h cos k y ω t
u w a v e , z = ω A sinh k h sinh k z + h sin k x ω t
The velocity components are incorporated into the governing momentum equation, leading to a unified form that couples the VoF model with the wave model, as presented in Equation (11).
ρ u t + u · u = p w a v e + · μ u + ρ g + f s u r f a c e
Through this approach, CFD provides data that account for viscous and nonlinear damping effects, which can be used to derive empirical correction coefficients for potential flow-based analysis tools, thereby complementing their limitations.

3. Methodology and Model Description

In the present work, a Free Decay-Extreme Condition Fully Coupled Simulation (FD-EFCS) framework was established to generate universally applicable correction coefficients. Conventionally, coefficients for Potential-Based Dynamic Codes (PBDC) are estimated using only the floater’s free-decay motion responses together with current-induced load data. The Hybrid Analysis Model, which incorporates the corrected coefficients obtained through an iterative optimization process. This procedure is explicitly described to rely on three-degree-of-freedom (3-DOF) free-decay time series data derived from CFD simulations. The iterative methodology was utilized to continuously improve the PBDC damping coefficients in order to increase the accuracy of dynamic response predictions. The technical aspects of data transfer, time-step synchronization, and error control to manage coupling and synchronization between the CFD and PBDC have been elaborated on. In particular, the time-step matching between STAR-CCM+ and OrcaFlex was orchestrated to maintain time consistency for data transfer, while an error control procedure was designed to eliminate numerical errors after evaluating reasonable levels of iterative convergence. In addition, two quantitative error parameters, Amplitude Error within the Damping Zone (AE_DZ) and Amplitude Error within the Quasi-Equilibrium Zone (AE_QEZ)—were developed in order to quantify the model performance. These error measures were particularly established to provide quantified evaluations of damping, albeit under different flow conditions and degrees of motion.
Such a method overlooks the influence of loads on the turbine and tower, as well as contributions from zero-frequency waves, thereby limiting the reliability of the resulting coefficients. The FD-EFCS approach addresses these shortcomings by incorporating both free-decay and extreme load simulations within a fully coupled system, explicitly accounting for superstructure loads and zero-frequency wave effects. Consequently, the method produces empirical coefficients derived from the integrated system’s load response, ensuring broader applicability and greater confidence in PBDC analyses. The FD-EFCS approach was developed to utilize the property that drag coefficients, when applied as correction factors, exert negligible impact in low-load environments but become highly influential under extreme loading conditions. The methodology for deriving these empirical coefficients through FD-EFCS is presented in Figure 1. To assess its robustness, the FD-EFCS method was benchmarked against a PBDC, where coefficients were determined exclusively from free-decay tests. Prior to extracting drag coefficients from extreme load evaluations, two initial estimates were considered: one derived from shape-based coefficients reported in prior experimental and numerical studies, and another based on the values prescribed by DNV standards.
A comparative study was performed by implementing two distinct drag coefficients within the PBDC framework, contrasting values prescribed by ship regulations with those obtained from prior research. To further assess the influence of damping coefficients on motion responses in PBDC, several methodologies were adopted for their estimation, as elaborated in Section 5.1 on Free Decay Simulation. Utilizing three PBDC models, each defined by unique sets of empirical coefficients, the robustness of the FD-EFCS approach was verified through comparison with CFD simulations across three varying environmental scenarios.
In this investigation, three load scenarios, as outlined in Table 1, were considered for evaluation. Load Case (01) reflects the operating condition at the rated wind speed, whereas Load Case (02) corresponds to the condition immediately prior to the cut-out wind speed. Load Case (03) simulates a typhoon scenario, during which the system remains stationary. For this case, the external load acts from the 270-degree direction, with the rotor positioned at 240 degrees, and an ocean current of 0.77 m/s is incorporated. Across all scenarios, a first-order regular wave model was employed to represent wave conditions.
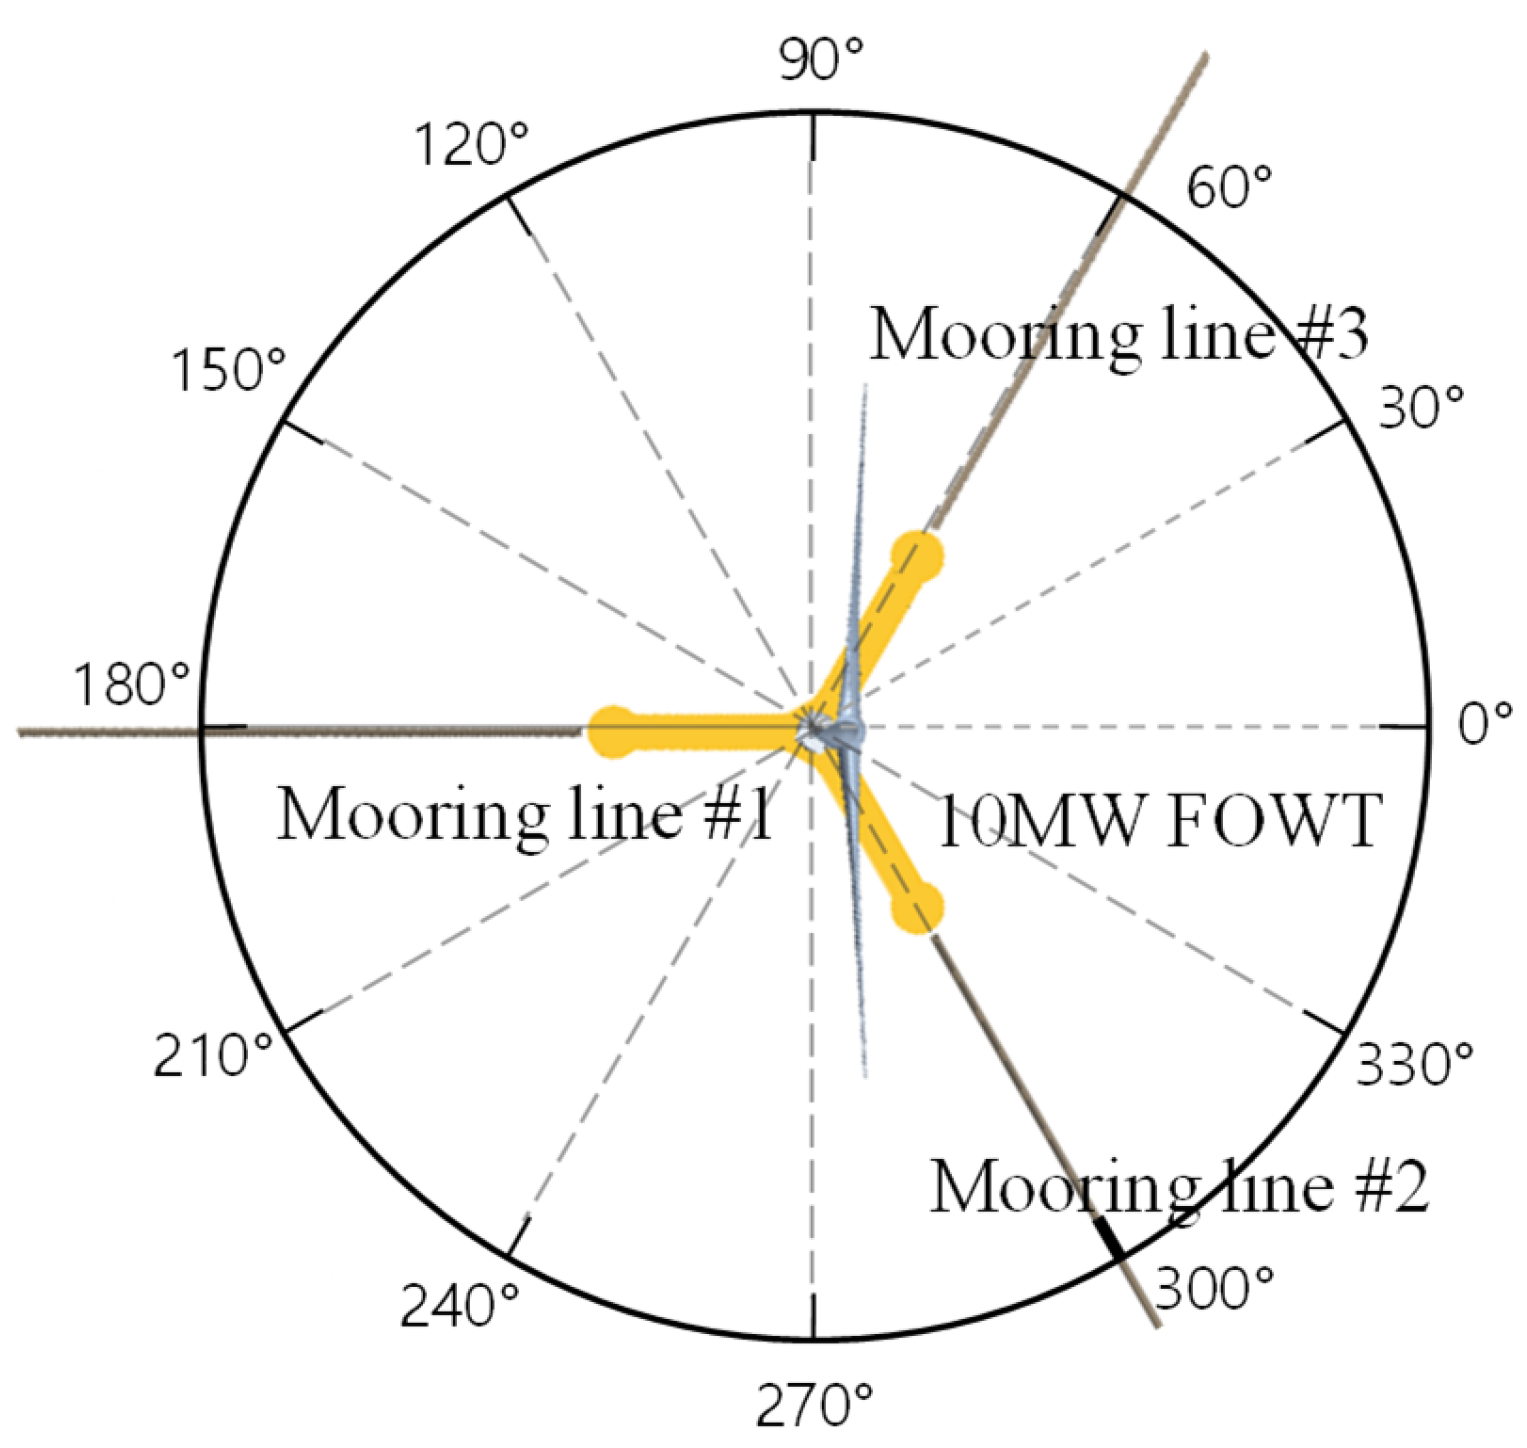
The FOWT configuration applied in this study is illustrated in Figure 2. Aerodynamic inputs for the turbine were derived from the DTU 10 MW reference report [39,40], whereas the tower and mooring system were specifically designed for this application. To ensure platform stability, three mooring lines were connected to the superstructure and evenly distributed at 120° intervals. A summary of the fully integrated system’s characteristics is provided in Table 2.
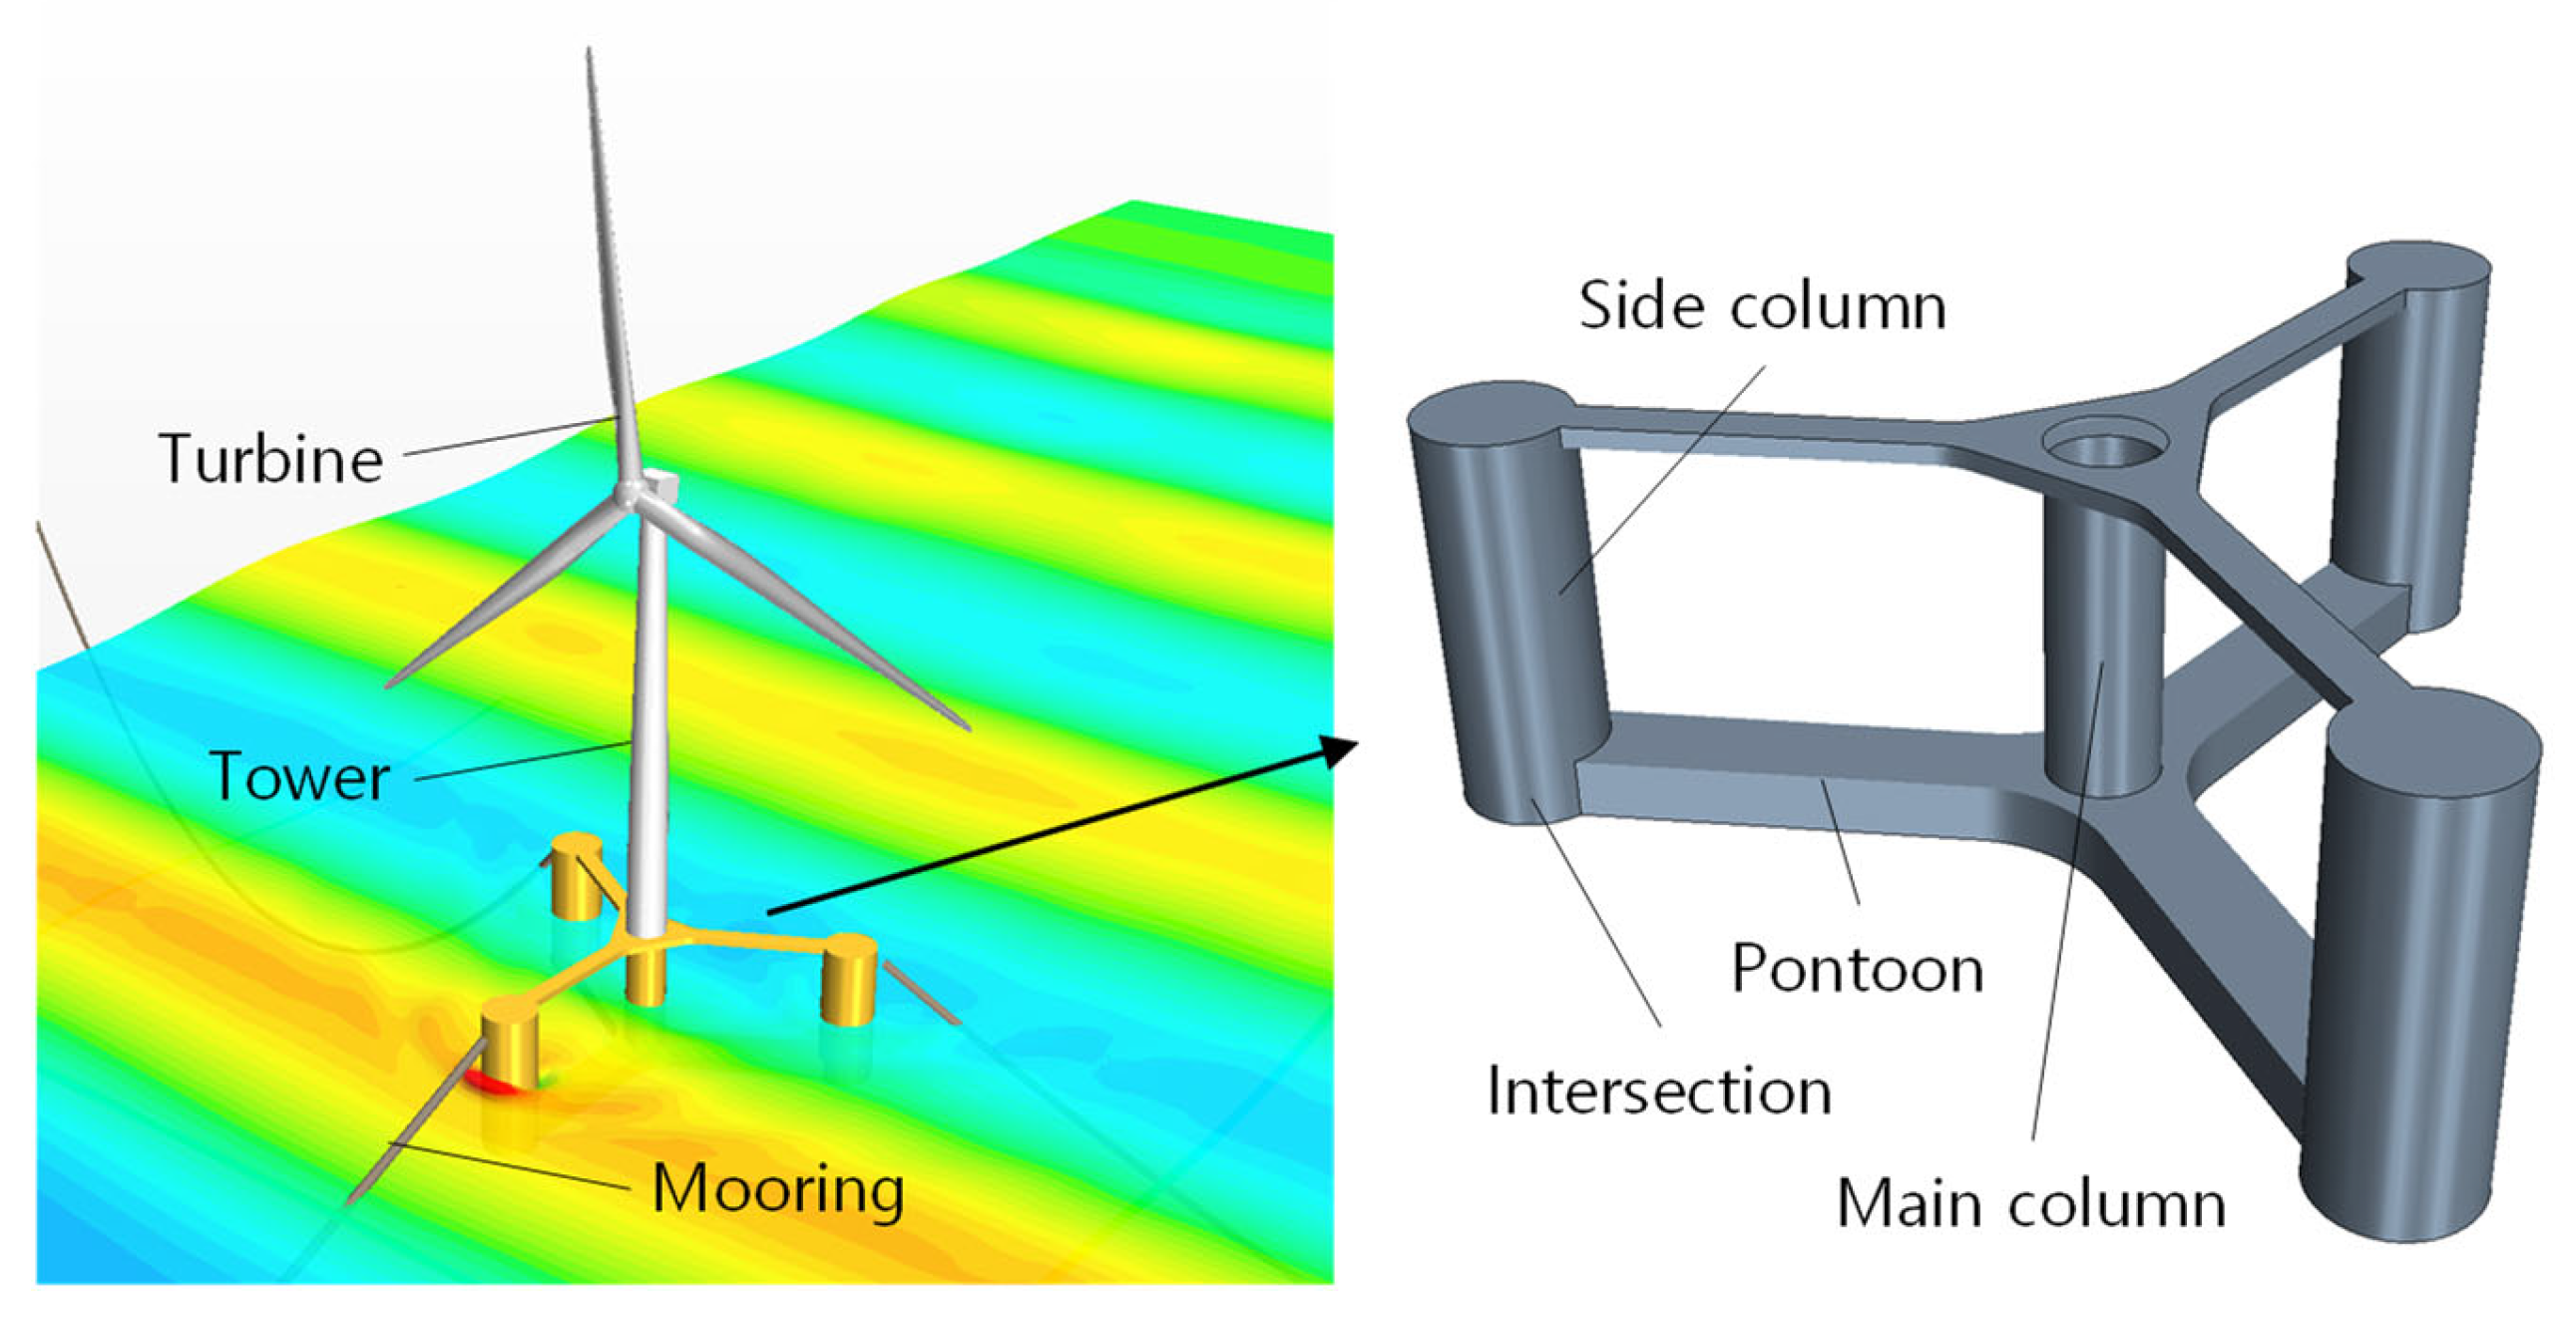
The OrcaFlex [33] served as the high-fidelity analysis tool for code verification, while STAR-CCM+ [41] was employed to perform the CFD-based comparisons and evaluations. Prior to executing the fully coupled simulations, a mesh sensitivity assessment was carried out within the CFD framework to evaluate the floater and turbine performance under applied loading conditions [42]. The OrcaFlex is a time-domain simulation tool widely employed for dynamic load assessment of FOWTs. In this work, hydrodynamic characteristics obtained from OrcaWave were utilized as input parameters for the system’s dynamic load evaluation. OrcaWave performs frequency-domain analysis to estimate the floater’s hydrodynamic properties, which are subsequently transferred to OrcaFlex to enable time-domain simulations. Through this integration, OrcaFlex can effectively model the motions and structural loads acting on the floater and its superstructure. The CFD and OrcaFlex models applied in this study are presented in Figure 3.
In OrcaFlex, two hybrid correction strategies were employed to incorporate damping, wave drift, and current effects. The first approach, Hybrid (1), estimates Morison coefficients by calibrating drag values for different structural shapes using findings from earlier studies [43,44]. This calibration is validated against CFD-based free-decay simulations, where damping coefficients are derived from both the damping and quasi-equilibrium zones. The damping zone corresponds to the initial decay stage following an offset, while the quasi-equilibrium zone represents the stabilized phase of oscillation. In contrast, Hybrid (2) begins by assigning drag coefficients in accordance with DNV-RP-C205 [45], followed by calculating damping coefficients exclusively from the damping zone of CFD free-decay simulations, omitting the quasi-equilibrium zone. Once damping values are determined, Morison coefficients are adjusted to better represent wave drift and current influences, ensuring consistency with floater geometry. A summary of the drag and damping coefficients applied in both methods is provided in Table 3, with this study offering a comparative assessment of the two approaches in capturing CFD-based damping properties alongside environmental effects.

4. Numerical Simulation Statement

4.1. Flow Doamin and Applied Boundary Conditions

Figure 4 presents the computational domain and boundary conditions applied for the CFD simulation of a floating platform. The overall domain is defined as a rectangular box with dimensions of 800 m in length, 500 m in width, and 250 m in depth. The floating platform is positioned at the center of this domain, and a smaller control volume is illustrated around it to emphasize the localized mesh refinement in the immediate vicinity of the structure. The boundaries of the computational domain are chosen sufficiently far from the platform to minimize the influence of artificial reflections and ensure the accuracy of wave structure interaction modeling. Symmetry conditions are applied along the lateral vertical boundaries, effectively reducing the computational effort by exploiting the physical symmetry of the problem. The logarithmic wind profile (Equation (12)) was set as inlet velocity and pressure outlet are placed at the rear face of the domain, to control the generation and propagation of incident waves and the dissipation of outgoing waves. The top boundary represents the free surface where atmospheric pressure is imposed, while the bottom boundary is modeled as velocity inlet condition to account for the seabed approximation at a depth of 250 m. A non-slip wall condition was imposed for all surfaces of the FOWT structure. These boundary treatments are carefully selected to ensure a realistic representation of hydrodynamic behavior while maintaining computational efficiency in the numerical simulations.
Figure 4. Computational domain and applied boundary conditions for CFD simulation of the floating platform.
Energies 18 05545 g004
u z = u * k ln z z o
where u * is the friction velocity (related to surface shear stress), k : von Kármán constant (for offshore 0.4), and z o : surface roughness length (offshore: 0.0002–0.01 m).
In rigid body motion simulations, the computational mesh is displaced in space according to the prescribed motion, which may be translational, rotational, or a combination of both. The side boundaries of the computational domain are treated as symmetry planes. It is important to highlight that the inlet, outlet, and lateral boundaries are influenced by the characteristics of the two-phase flow, where cells may be completely occupied by water, entirely by air, or partially filled depending on the local volume fraction. To capture this behavior accurately, the Eulerian multiphase approach is adopted, as it effectively models the immiscible interface between water and air. Within this framework, the free surface is represented as the interface separating the two phases. Various multiphase strategies have been developed to simulate fluid-induced motions and evaluate hydrodynamic forces acting on floating platforms. Among them, the Volume of Fluid (VOF) method offers a simplified version of the Eulerian model, specifically designed for continuous-continuous phase interactions. Such interactions occur when two fluids form a distinct interface, such as that between water and air. In this formulation, flow properties including velocity, pressure, and temperature are shared across the phases, allowing the governing mass and momentum conservation equations to be applied consistently to the two-phase system.

4.2. Overset Mesh Topology

The overset mesh approach was employed to address the complex motions of a full-scale floating platform. This method utilizes multiple overlapping grids to discretize the computational flow field. Based on their location within the domain, the grid cells are categorized as active, passive, or acceptor cells. A fully structured mesh composed of trimmed hexahedral cells was adopted for the present work. Since the Volume of Fluid (VOF) method was used to resolve the position and geometry of the free surface waves, an appropriate local mesh refinement was necessary at the free surface. Specifically, refinement in the direction normal to the undisturbed free surface was achieved by discretizing each wave height into approximately 10–30 cells, while refinement parallel to the free surface was performed with about 80–120 cells per wavelength. To capture sharp gradients in the boundary layer flow near structural surfaces, ten prism layers were introduced with a controlled growth ratio normal to the wall, and initial layer thicknesses of 1.2 mm and 0.3 mm were applied. The computational domain was divided into three finite-volume zones: the background region, the overset region, and the wave refinement mesh. Figure 5 illustrates the mesh resolution across the domain, along with sectional views highlighting these regions.

4.3. Model Validation

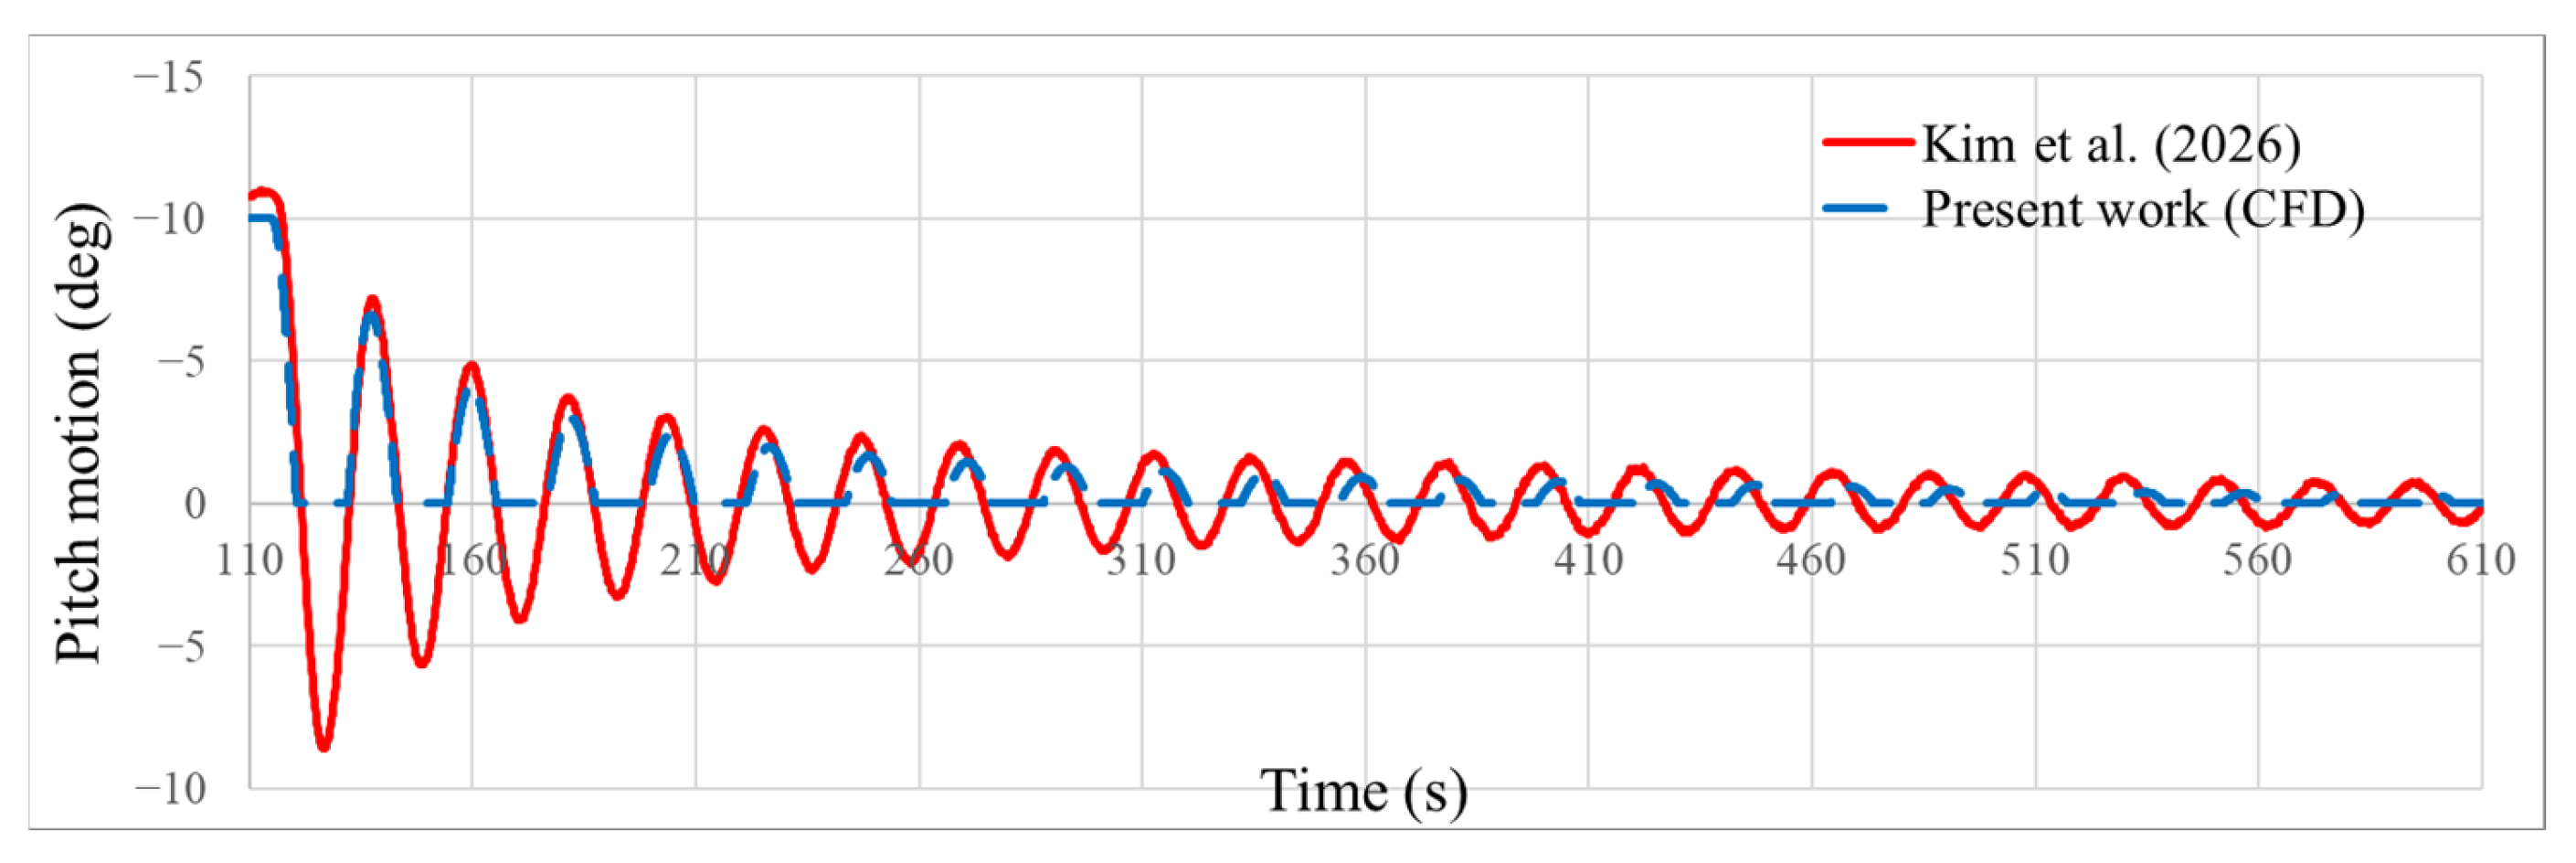
Prior to the CFD-based validation, a comparison with experimental results was carried out, as illustrated in Figure 6, to confirm the credibility of the numerical simulations. The reference data for validation were obtained from the pitch free-decay test reported by Kim et al. [46]. Detailed information regarding the experimental apparatus is available in the cited work [46,47] and is therefore not repeated here. In the comparative CFD analyses, the turbine and tower components were excluded, differing from the physical test setup. Nevertheless, essential characteristics influencing free-decay behavior, such as mass, center of gravity, and moment of inertia, were matched to the experimental configuration to preserve accuracy. Furthermore, to reduce uncertainties associated with external forces, the comparison was limited to free-decay responses of a floating system without mooring restraints.
A comparison of the pitch free-decay motion time series shows a strong correlation between CFD simulations and experimental observations. As depicted in Figure 7, both approaches reflect the oscillatory decay with comparable frequency and phase responses, confirming the capability of CFD in replicating the system’s dynamic behavior. Nonetheless, minor differences are observed in amplitude reduction, with experiments indicating a faster decay than the numerical results. This variation may stem from unaccounted physical phenomena in the CFD model, including subtle viscous damping, turbulence, or uncertainties in the experimental setup. Overall, the analysis demonstrates that CFD is a reliable approach for predicting damping characteristics in floating offshore wind turbine dynamics, while also underlining the critical role of experiments in capturing complex damping effects under real operating conditions.
Table 4 presents a numerical comparison of CFD simulations with experimental observations. The period discrepancy was only 1.29%, indicating a strong agreement between the two approaches. For the logarithmic decrement, the error across the first five cycles, representing the dominant damping phase, was −3.88%, whereas in the secondary damping phase it reached 6.79%. Overall, these findings demonstrate that the CFD-based pitch free-decay analysis provides results consistent with experimental measurements.

5. Results and Discussions

5.1. Free Decay Test

The simulations were carried out over a 500 s period, with Figure 8 presenting a comparison of the three design load cases evaluated using CFD and PBDC. For Hybrid (2), the damping coefficient was obtained by dividing the CFD free-decay response into two regions: the damping region and the quasi-equilibrium region. The damping region covers the time until the initial displacement diminishes to within 10% of twice its starting value, corresponding to the phase where the crest-to-trough difference steadily reduces. Beyond this point, the response enters the quasi-equilibrium region, where the system behavior becomes more stable. As explained earlier, the damping coefficient for Hybrid (2) was calculated solely from the damping region, whereas for Hybrid (1), it was estimated by incorporating results from both the damping and quasi-equilibrium regions.
The simulation spanned a total of 500 s, with the comparative outcomes of the three design load cases using CFD and PBDC illustrated in Figure 8. For Hybrid (2), the damping coefficient was obtained by dividing the CFD free-decay response into two distinct regions: the damping zone and the quasi-equilibrium zone. The damping zone was defined as the interval up to the point where the initial displacement diminished to within 10% of twice its starting value, corresponding to the stage where the crest-to-trough difference consistently narrowed to below 10%. Beyond this stage, the response was considered to have reached the quasi-equilibrium zone, where the data stabilized. In line with this approach, the damping coefficient for Hybrid (2) was calculated exclusively from the damping zone, whereas for Hybrid (1), both the damping and quasi-equilibrium zones were used to derive the coefficient. The findings illustrated in Figure 6 reveal that both Hybrid (1) and Hybrid (2) align well with the CFD free-decay tests in the damping region. In the surge motion analysis, the two approaches also demonstrated strong consistency with the CFD results in the quasi-equilibrium range. Nonetheless, for pitch and heave responses, Hybrid (2) tended to settle into equilibrium more quickly than the CFD predictions. On the other hand, Hybrid (1), which incorporated the full quasi-equilibrium zone when calculating correction factors, achieved closer overall agreement with the CFD outcomes across all three free-decay cases over the 500 s duration.

5.2. Hybrid Correction Framework Adapted for Advanced Potential Engineering Tool Applications

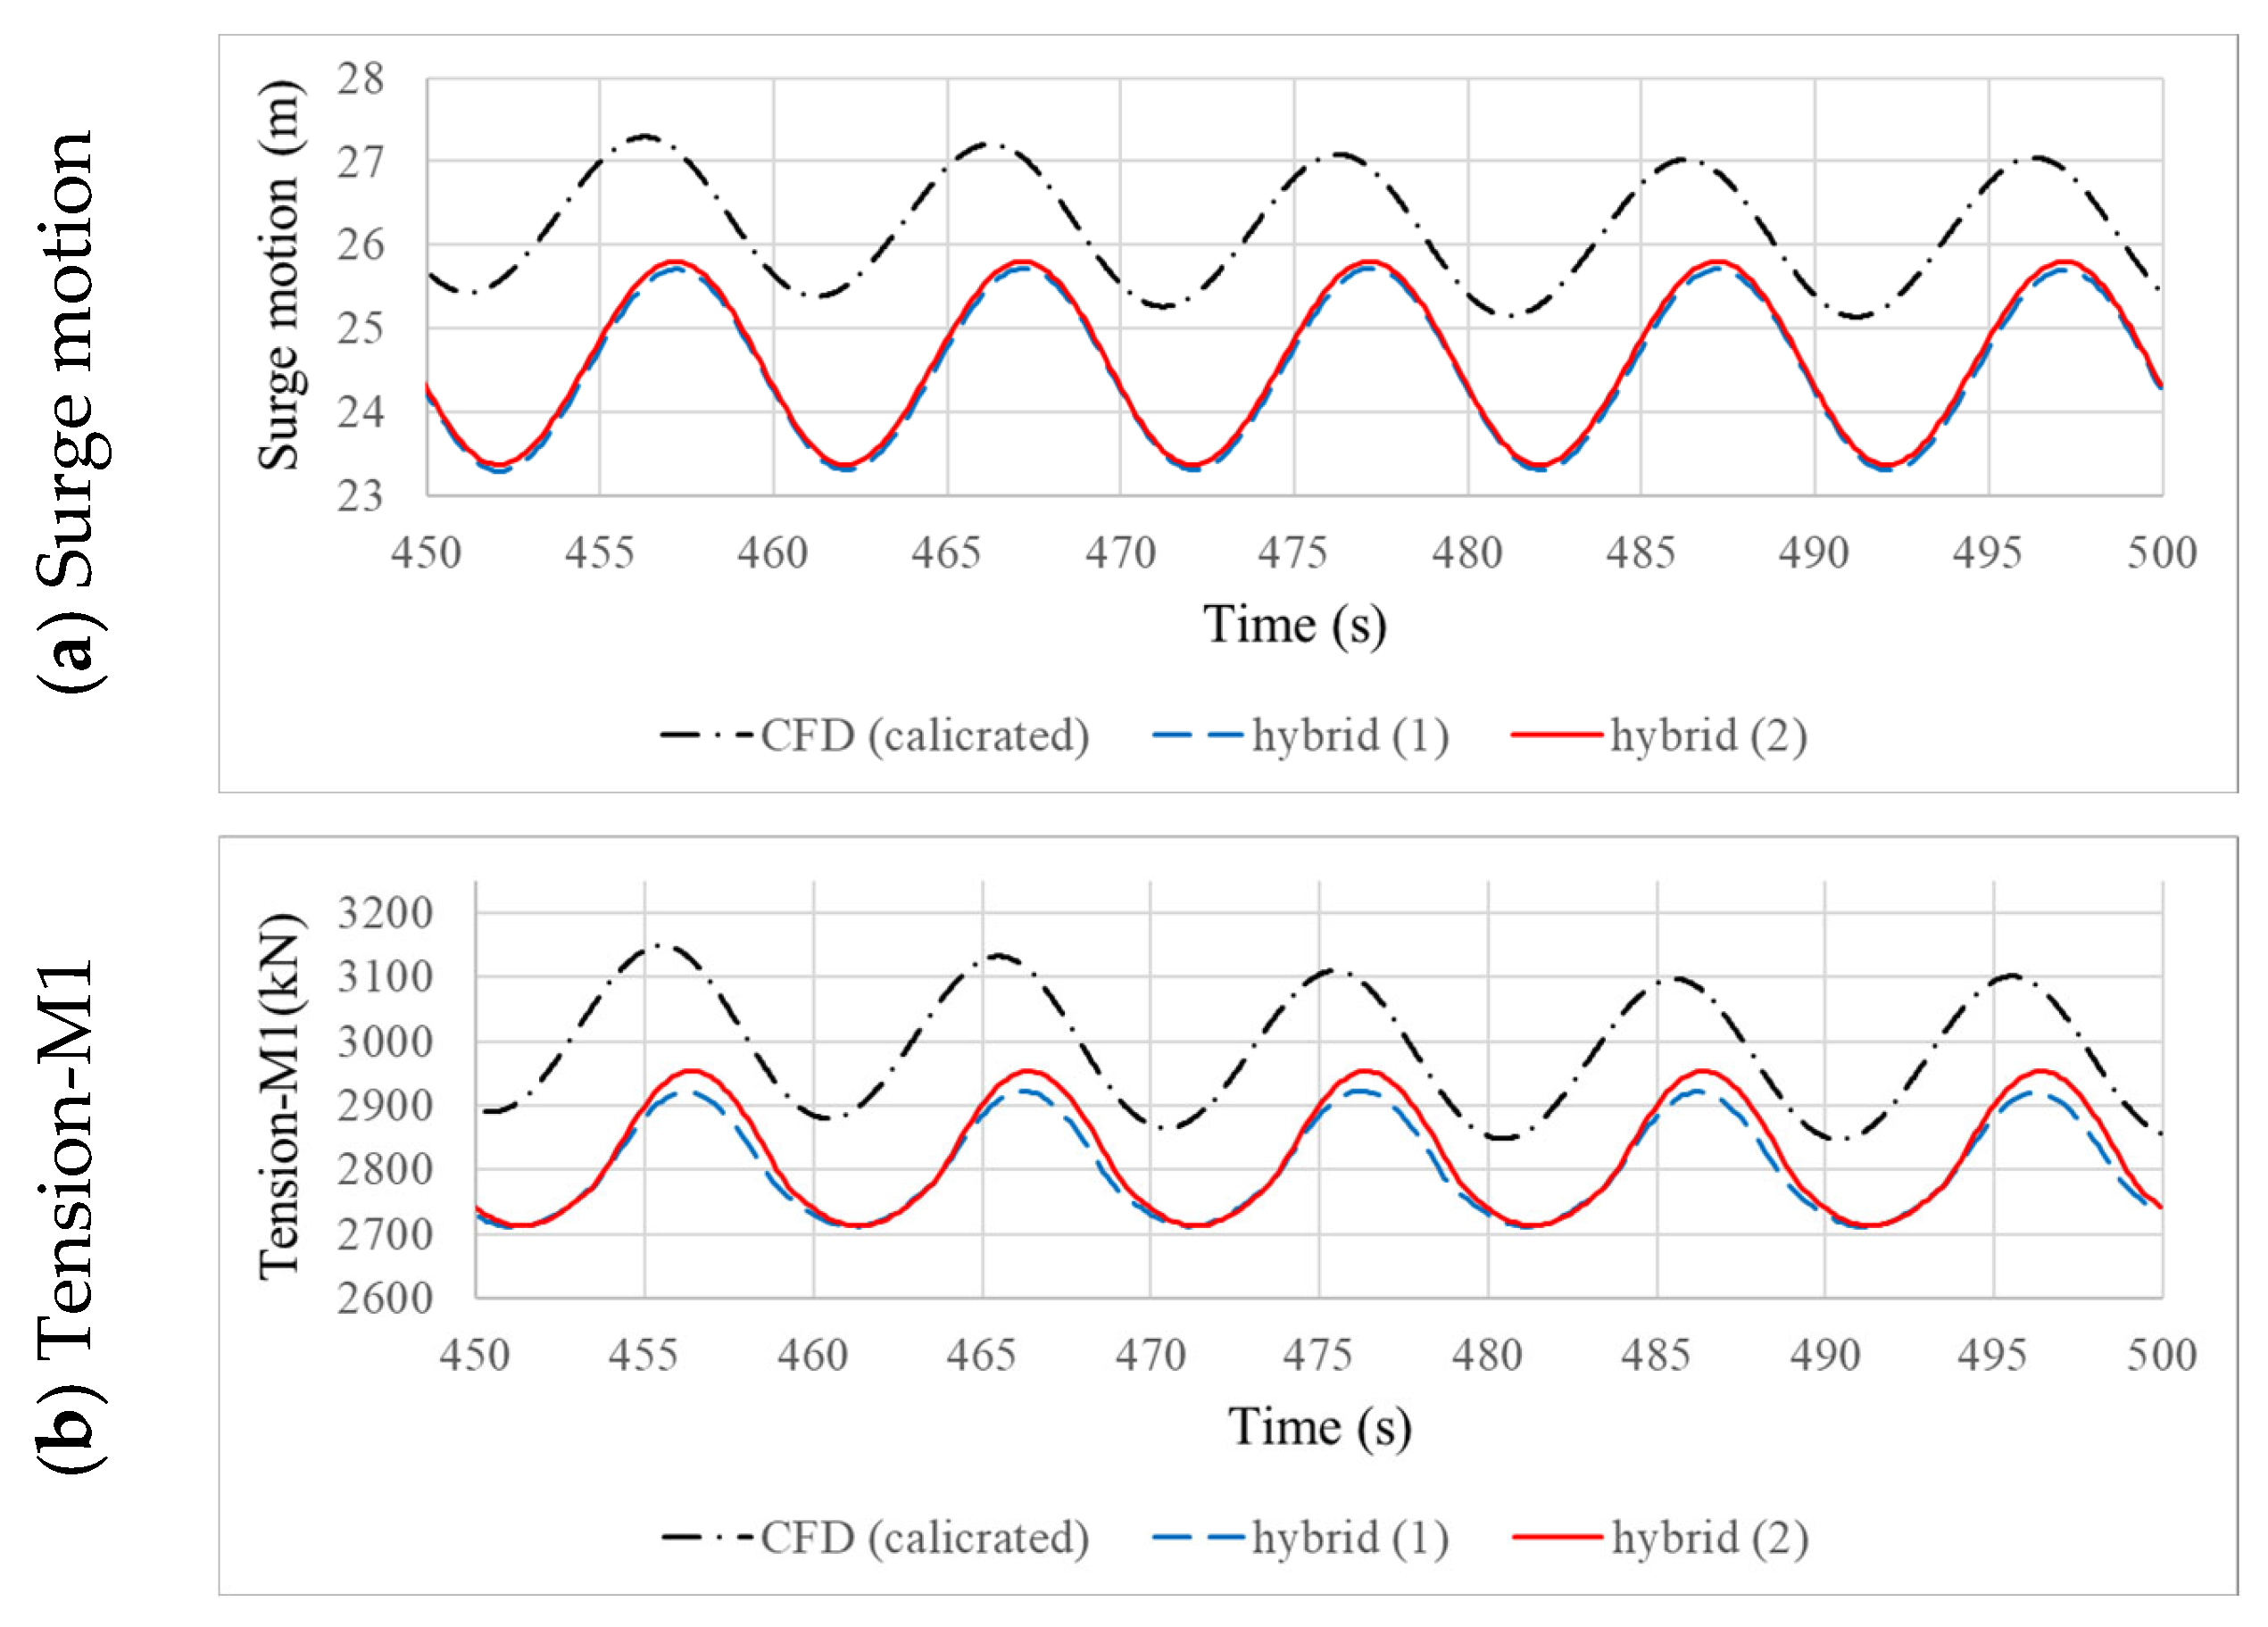
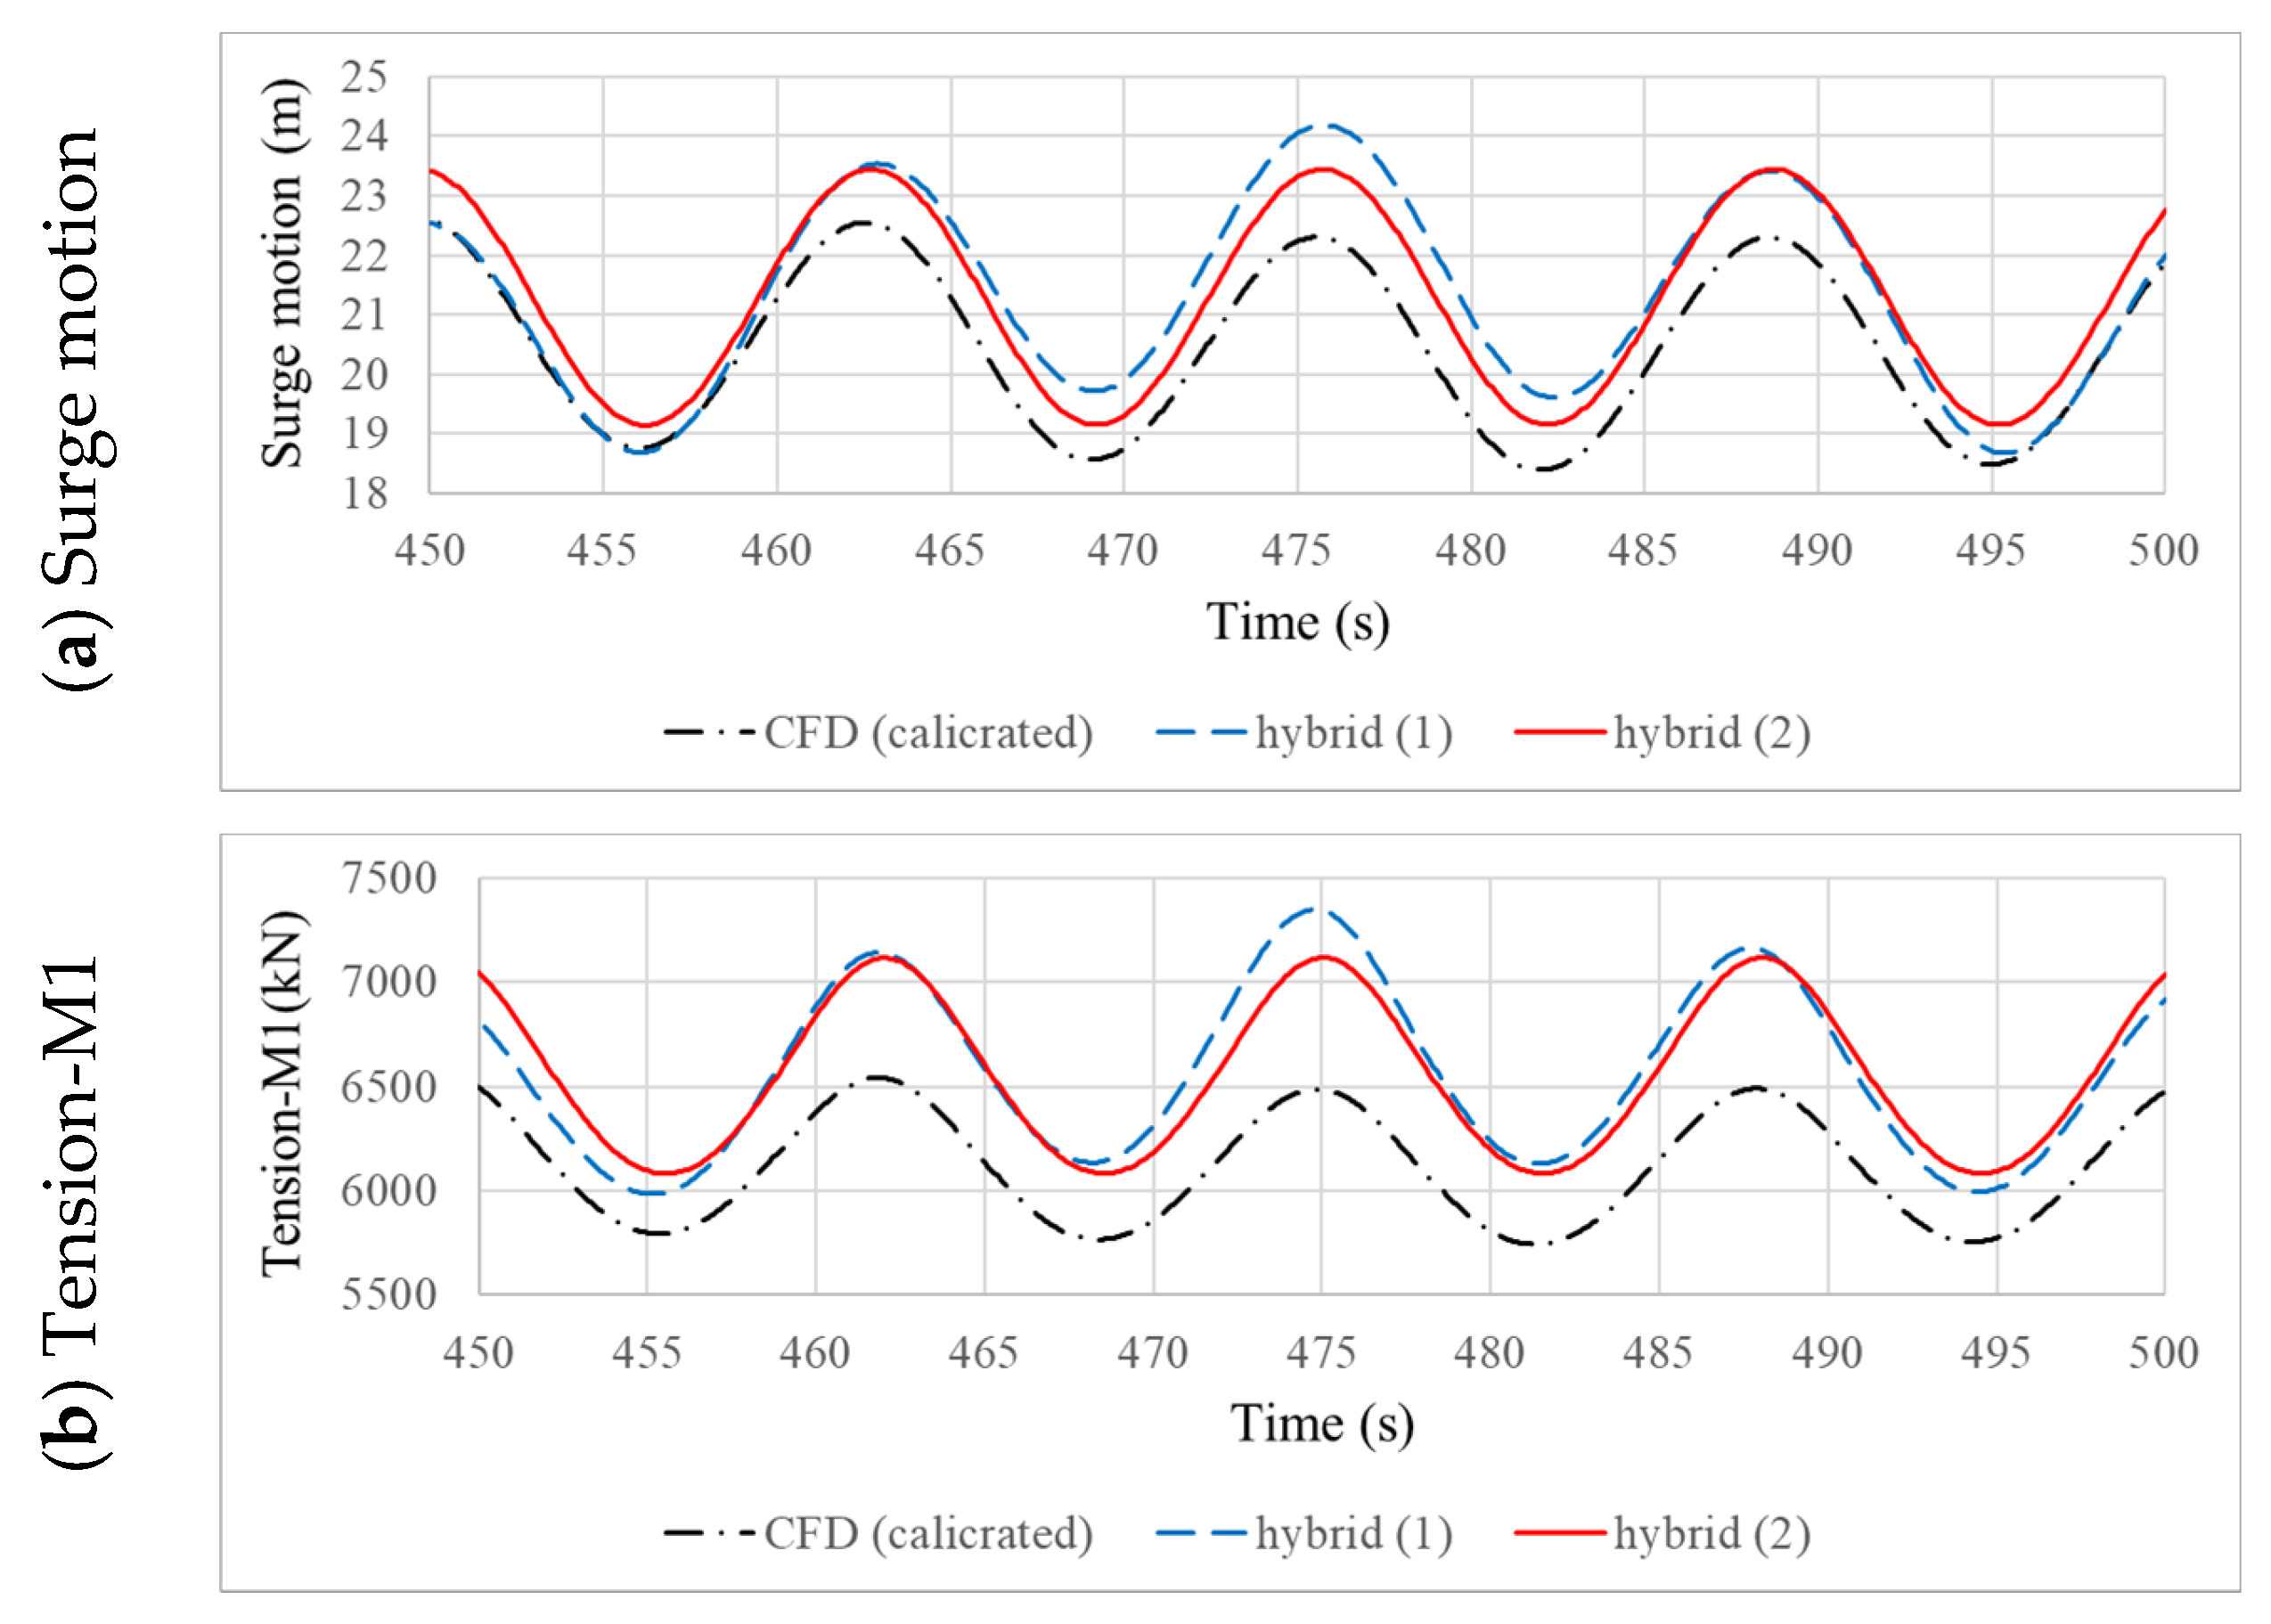
Figure 9, Figure 10 and Figure 11 illustrate the surge motion and mooring line tension responses for the three design load cases, analyzed using CFD and PBDC in conjunction with the Hybrid (1) and Hybrid (2) correction approaches. As it can be seen, Figure 9 presents the time histories of surge motion and mooring line tension for the floating offshore wind turbine under rated wind speed conditions, comparing results from three numerical approaches: CFD and two PBDC hybrid models. The CFD predictions exhibit larger surge amplitudes and higher mooring tensions compared to both hybrid tools, reflecting CFD’s ability to capture nonlinear hydrodynamic loading and viscous damping effects more comprehensively. In contrast, the hybrid methods yield slightly reduced oscillation amplitudes and smoother decay trends, indicating that potential-flow formulations, while computationally efficient, underestimate certain damping and loading contributions. The phase agreement among all approaches confirms their consistency in predicting oscillatory frequency, but the differences in amplitude and tension response highlight the sensitivity of coupled dynamics to hydrodynamic modeling fidelity. These discrepancies illustrate the trade-off between numerical accuracy and computational cost, demonstrating that, while CFD offers higher fidelity in reproducing physical processes, hybrid methods remain valuable for rapid system-level simulations where efficiency is prioritized.
In Figure 10, the comparison of CFD with the two hybrid models at cut-out wind speed reveals distinct differences compared to the rated condition shown in Figure 9. At this higher wind speed, the surge motion predicted by CFD tends to be slightly lower in amplitude than both hybrid approaches, while the potential-flow-based solvers, particularly hybrid (1), show an overestimation of the surge excursions. This deviation becomes more evident in the corresponding mooring line tension, where both hybrid models predict higher peak loads than CFD, with hybrid (1) showing the largest discrepancy. Despite these differences, the cyclic nature of the responses remains well aligned across the three methods, confirming that all approaches capture the coupling between surge displacement and mooring line tension. The increase in wind speed from rated to cut-out condition amplifies both the surge motion and mooring line tension, with the latter showing a particularly pronounced rise due to the stronger restoring forces required to counteract larger platform excursions. Comparing Figure 9 and Figure 10 demonstrates that CFD consistently provides a more moderated and physically consistent response, while the hybrid models tend to either underpredict (at rated speed) or overpredict (at cut-out speed) the system dynamics. This highlights the greater reliability of CFD for capturing nonlinear effects and extreme load scenarios, while also emphasizing the direct proportional relationship between surge motion and mooring line tension as wind forcing intensifies.
In Figure 11, the CFD and hybrid results are compared under extreme typhoon conditions, showing clear distinctions in both surge motion and mooring line tension when contrasted with the previous rated and cut-out cases. The CFD simulations predict substantially larger surge excursions than the hybrid solvers, while both hybrid (1) and hybrid (2) provide consistently lower estimates, indicating that potential-flow-based methods are unable to fully capture the nonlinear hydrodynamic loads under severe environmental forcing. Similarly, in the mooring line tension response, CFD shows a higher baseline and fluctuating values, whereas the hybrid models underestimate the dynamic range. The phase alignment between surge motion and mooring line tension is again evident, reinforcing their strong coupling: larger surge excursions directly translate into increased line tension. Comparing across Figure 9, Figure 10 and Figure 11, a progressive trend emerges as wind speed rises from rated to cut-out and finally to typhoon conditions. At rated wind speed, the hybrid solvers tended to underpredict motions and loads, at cut-out speed they tended to overpredict relative to CFD, while under typhoon conditions, they again underestimate the extreme responses. This pattern highlights that CFD provides more consistent and physically reliable results across different wind regimes, especially in capturing nonlinearities and extreme loads. It also demonstrates that as wind forcing intensifies, the surge motion amplifies significantly, leading to correspondingly higher mooring line tensions, emphasizing the importance of accurate CFD-based modeling for assessing platform survivability under extreme weather conditions.
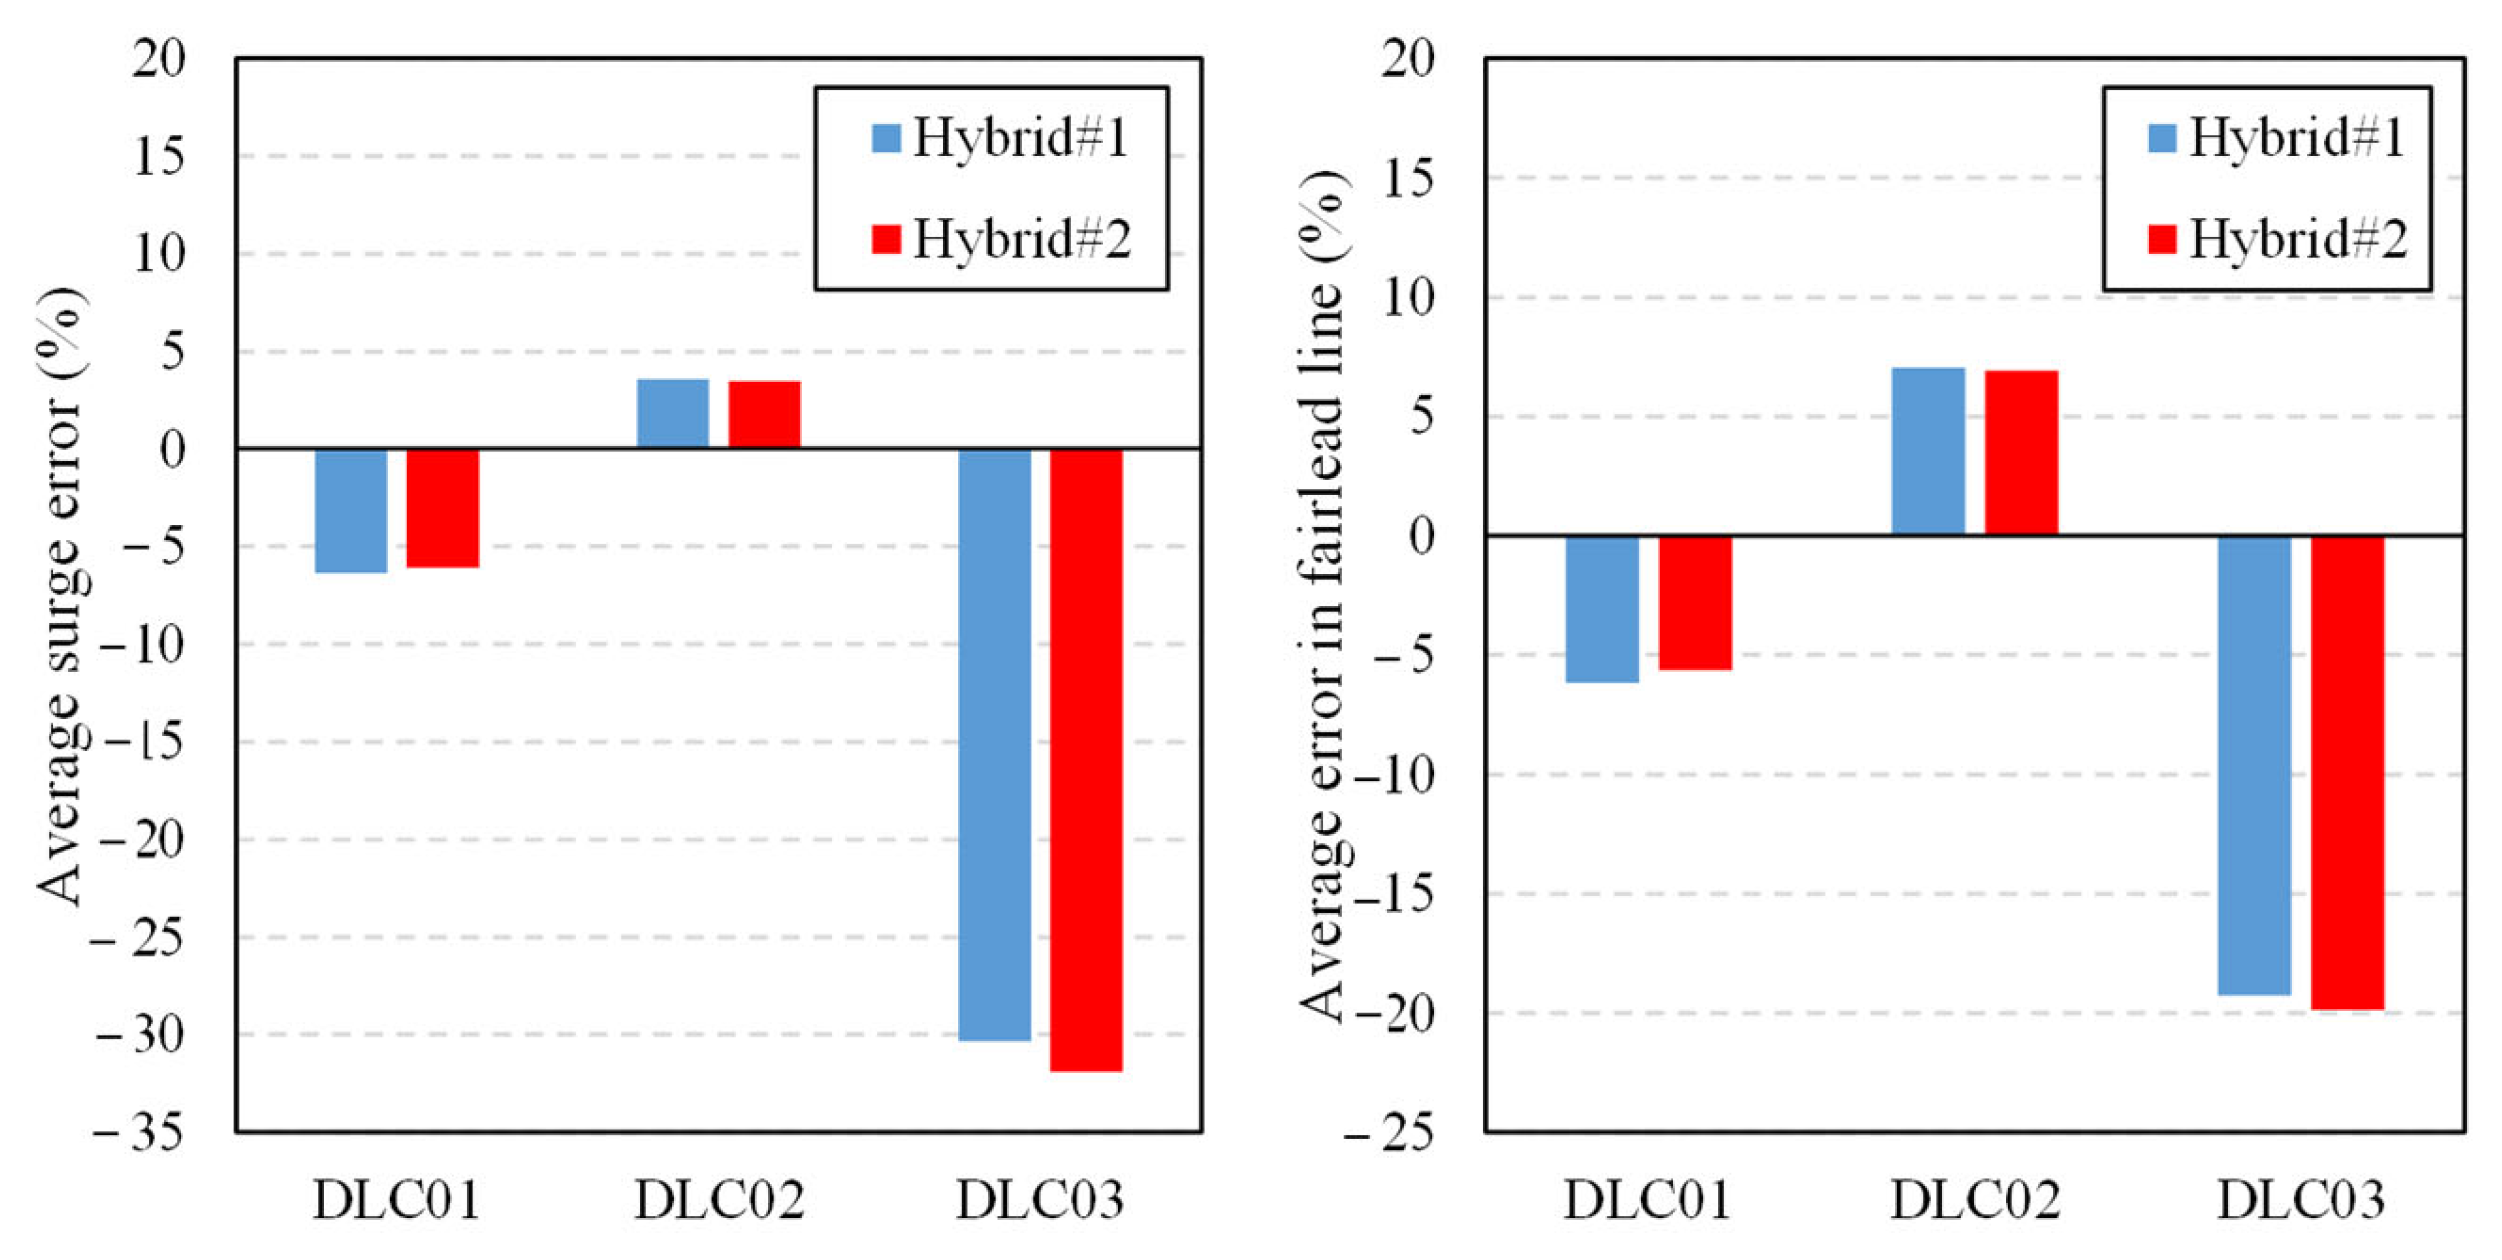
Figure 12 and Figure 13 illustrate the outcomes of the error evaluation by comparing CFD results with those obtained from the PBDC approach. The analysis indicates that Hybrid (1) and Hybrid (2) produce very similar motion predictions, regardless of the correction strategy applied. For the mean surge response, both methods yielded nearly identical error levels under the rated wind speed condition (DLC01) as well as near the cut-out wind speed condition (DLC02). In contrast, when subjected to extreme wind conditions (DLC03), the error increased substantially, exceeding 30%. Regarding the mean fairlead load of the mooring line, the two correction methods showed relatively small discrepancies of about 5% for DLC01 and DLC02, but the error rose to around 20% under DLC03, highlighting greater deviations in more severe environments. When examining the mean error in response amplitudes, both correction methods again produced comparable results across all DLCs. For surge motion, the difference in mean amplitude was consistently within 0.7 m, while for the fairlead load the difference reached as much as 250 kN. Under DLC01 and DLC02, the surge amplitude differences were modest, around 0.2 m, but under the extreme wind and high wave conditions of DLC03, a much larger deviation was evident. For the fairlead response amplitude, as the intensity of the loading conditions increased, the mean response amplitude difference in the fairlead load also tended to increase.

5.3. Improved Hybrid Correction Strategy for Potential Engineering Tool Applications

When the correction relied only on free-decay test outcomes, the surge drift response under severe loading was not captured accurately, which in turn, lowered the reliability of mooring line tension estimations. To overcome this limitation, the present work recalibrated the correction factors by incorporating insights from the DLC03 case. In particular, the transverse drag coefficient of the side columns, identified as the dominant contributor to lateral loading was revised to a value of 3.5, while all other coefficients were kept identical to those applied in Hybrid (2). A summary of the modified coefficients is provided in Table 5.
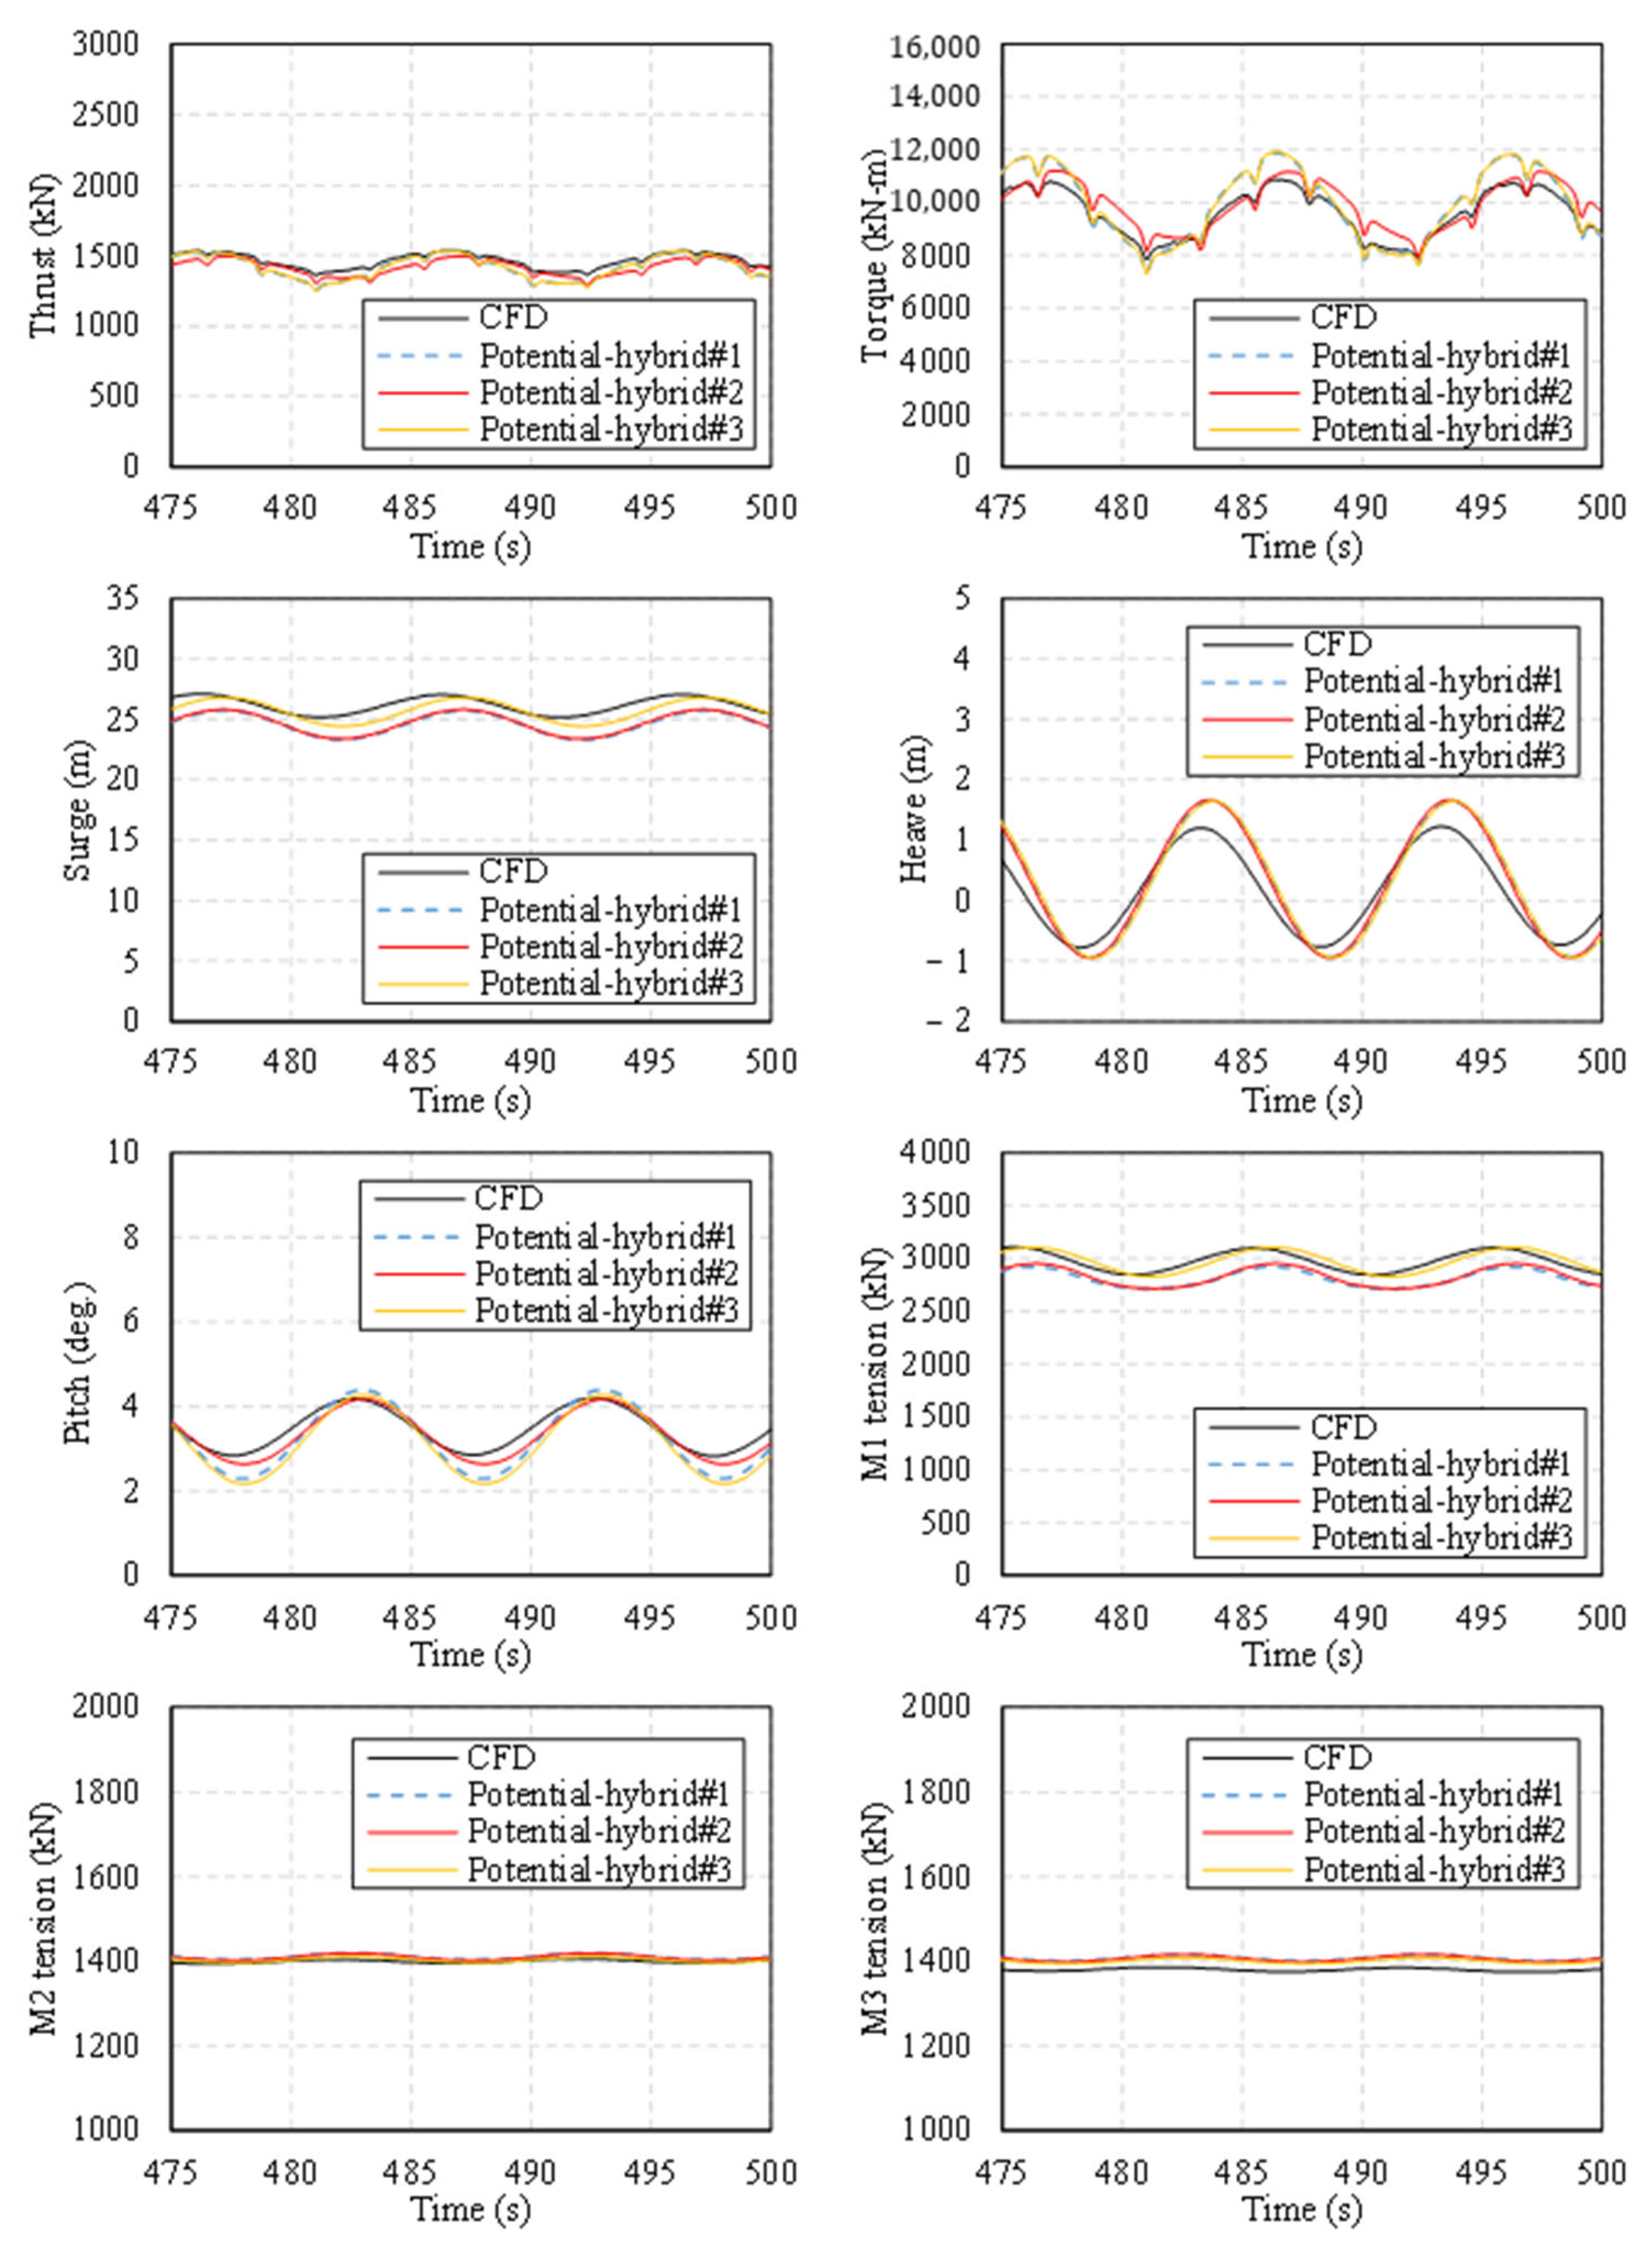
The outcomes of the analysis are illustrated in Figure 14, Figure 15 and Figure 16, which display the thrust, torque, key three-degree-of-freedom motions, and mooring line forces of the system. The results are compared using PBDC calibrated with Hybrid (1), Hybrid (2), and Hybrid (3) correction schemes. Figure 14 focuses on the performance under rated wind speed conditions. For thrust, all three correction methods produced results with excellent consistency. In the case of torque, the mean values obtained from Hybrid (1) and Hybrid (3) were in close agreement, although their response amplitudes were marginally larger. A similar trend was observed in the pitch motion, where slightly higher amplitudes appeared when these correction methods were applied, indicating that the increased torque amplitude had a direct effect on the pitch behavior.
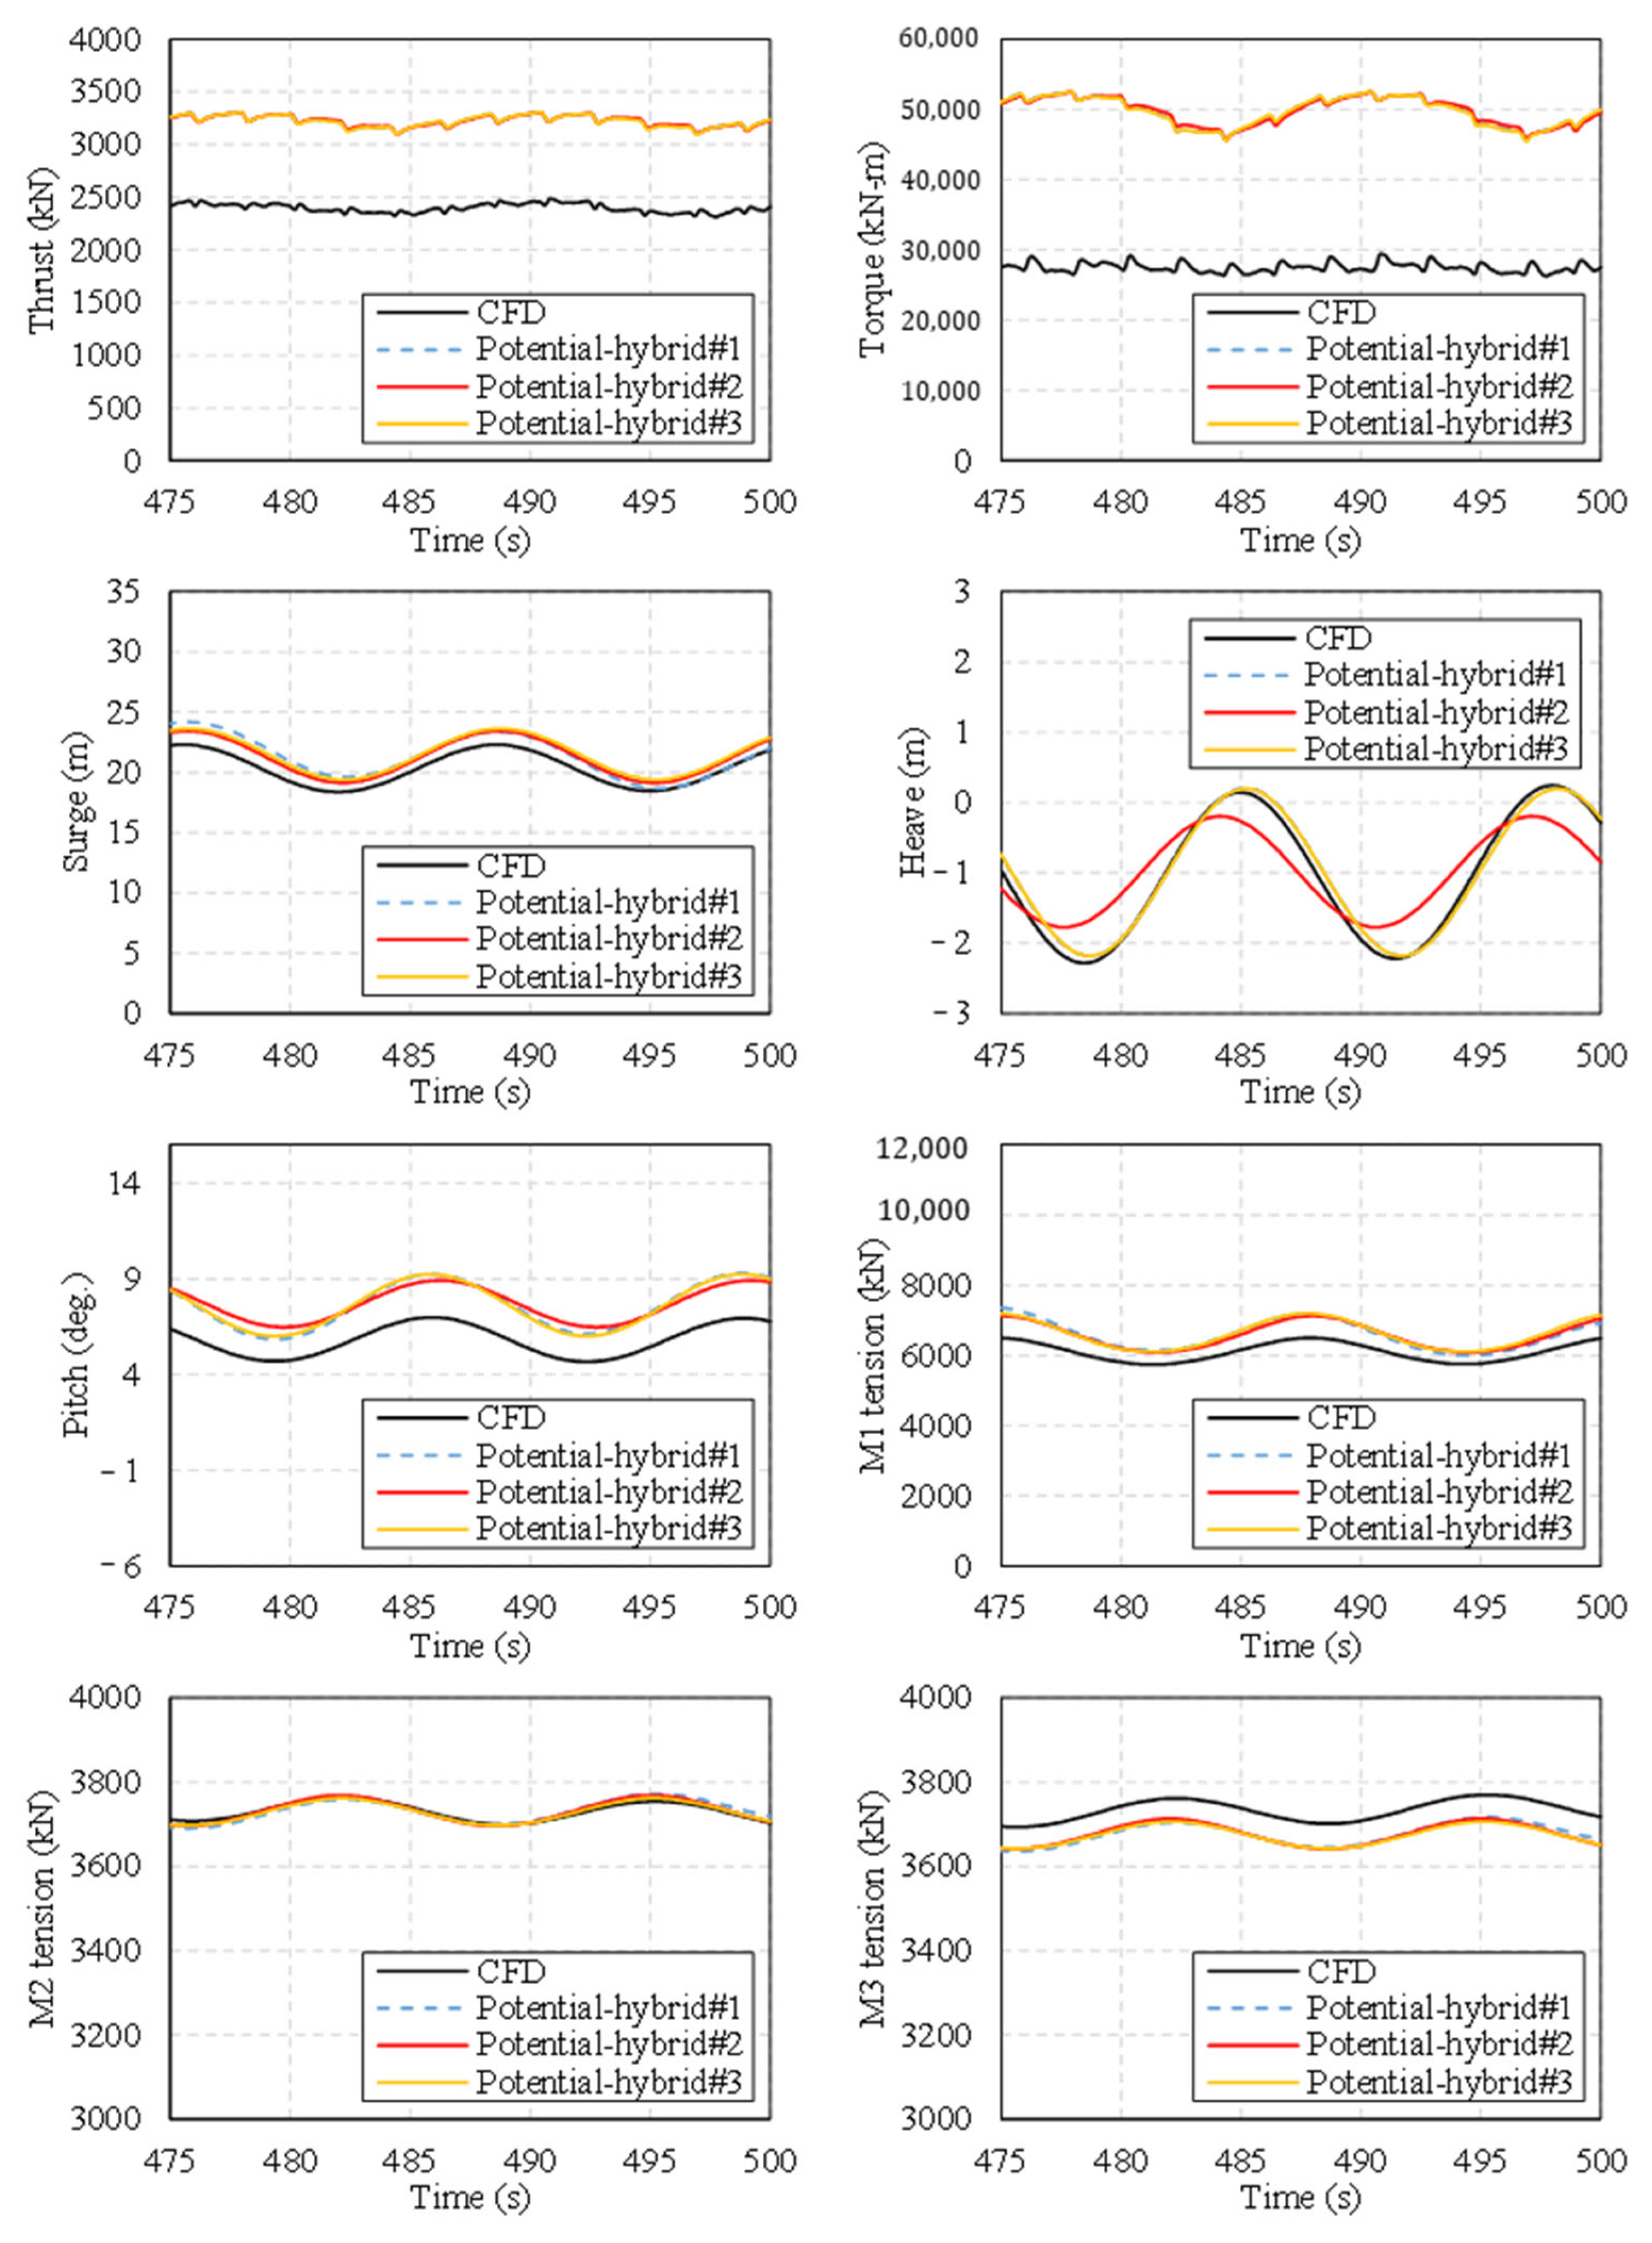
Figure 15 presents the load response results under cut-out wind speed conditions, which represent a more severe operating scenario compared to the rated case. According to the turbine design specifications, the blades should pitch to nearly 22.5 degrees at this wind speed; however, in this investigation, the pitch angle was kept constant at 0 degrees throughout the simulation. Consequently, both numerical approaches produced unrealistically high torque levels. This test case was carried out to evaluate the differences in power generation and thrust prediction between the two models under off-design conditions. The outcomes indicated that the potential-based dynamic code (PBDC) produced larger power and thrust responses than CFD. Nevertheless, the considerable variation in thrust estimates did not influence the accuracy of the surge drift prediction, as confirmed by the comparison of surge time histories. Since surge drift was consistently reproduced with good accuracy, the resulting mooring line tension responses showed close agreement between the two methods. Furthermore, the surge drift predictions aligned well with CFD across all hybrid correction approaches, which in turn yielded a high level of consistency in the tension results. On the other hand, due to the thrust discrepancy, PBDC predicted a larger mean pitch response compared to CFD. For the heave motion, the Hybrid (2) calibration produced lower amplitudes relative to CFD, while Hybrid (1) and Hybrid (3) provided results that closely matched the CFD predictions.
Figure 16 illustrates the platform behavior under extreme typhoon conditions. In this scenario, the applied wind speed was significantly higher than in the previous load cases, and the turbine was kept idle, meaning that rotor torque was not considered in the comparison. Because Hybrid (3) was tuned using the CFD outcomes from DLC03, its predictions aligned more closely with the CFD results than those obtained with PBDC calibrated using Hybrid (1) and Hybrid (2). For thrust response, all correction approaches produced nearly identical results, showing minimal deviation. In contrast, the pitch motion displayed notable differences depending on the correction strategy: a higher column drag coefficient increased the pitch amplitude but simultaneously reduced the mean pitch, bringing it into close agreement with the CFD reference. Regarding heave response, some phase shifts were observed across the correction methods; however, both the mean values and oscillation amplitudes matched well with CFD regardless of the chosen correction. Furthermore, Hybrid (3) consistently demonstrated strong agreement between PBDC and CFD in DLC01 and DLC02, while for DLC03 it provided marked improvements in capturing surge motion and mooring line tension by refining the column drag coefficient.
Figure 17 presents the error rate comparison between CFD and PBDC calibrated using three different correction methods. The analysis results indicate that under DLC03 conditions, Hybrid (3) demonstrated significantly improved performance compared to the other two correction methods. In particular, for the surge response, while the other methods showed an error of approximately 30%, Hybrid #3 reduced the error significantly to within 5%. Similarly, in the main loaded fairlead tension, the other methods recorded an error rate of about 20%, whereas Hybrid (3) achieved a highly precise result with an error below 2%. By applying the correction coefficients derived from DLC03, Hybrid (3) also showed improved or comparable responses in other load cases such as DLC01 and DLC02 compared to Hybrid (1) and Hybrid (2). In terms of mean thrust response, similar load responses were observed regardless of the correction method, with a low error rate of within 5% under rated wind speed conditions. However, under near cut-out wind speeds and typhoon conditions, all correction methods exhibited slightly higher error rates at similar levels.
These errors are less likely to result from discretization differences in hydrodynamic calculations and may instead be related to the fact that DLC02 and DLC03 represent conditions where strong stall effects occur, in contrast to DLC01. Specifically, in this study, the turbine pitch angle was set to 0 degrees instead of the designed pitch angle of 22.5 degrees for DLC02 to impose excessive loads during the analysis. This could be linked to the limitations of the blade element method (BEM) used for aerodynamic analysis in PBDC. BEM calculates loads based on lift and drag coefficient data representing the airfoil characteristics of the turbine blades. However, during this process, it is possible that data beyond the accurate prediction range were used, leading to errors. Additionally, in CFD analysis, the computational grid was designed with slightly lower precision to reduce simulation time, which may have contributed to uncertainties in turbine performance prediction. This factor is considered one of the reasons for discrepancies in turbine performance response error rates between CFD and PBDC in certain load cases.
A detailed comparative validation between the two codes for turbine performance responses under these load conditions is necessary, but this was not performed in the present study. Nevertheless, despite significant differences in turbine performance response error rates between the codes in some load cases, the mean thrust response differences among the correction methods remained minimal across all load cases. Therefore, in the analysis of load responses based on correction methods, the mean thrust response error was evaluated to have no significant impact on the overall analysis results.
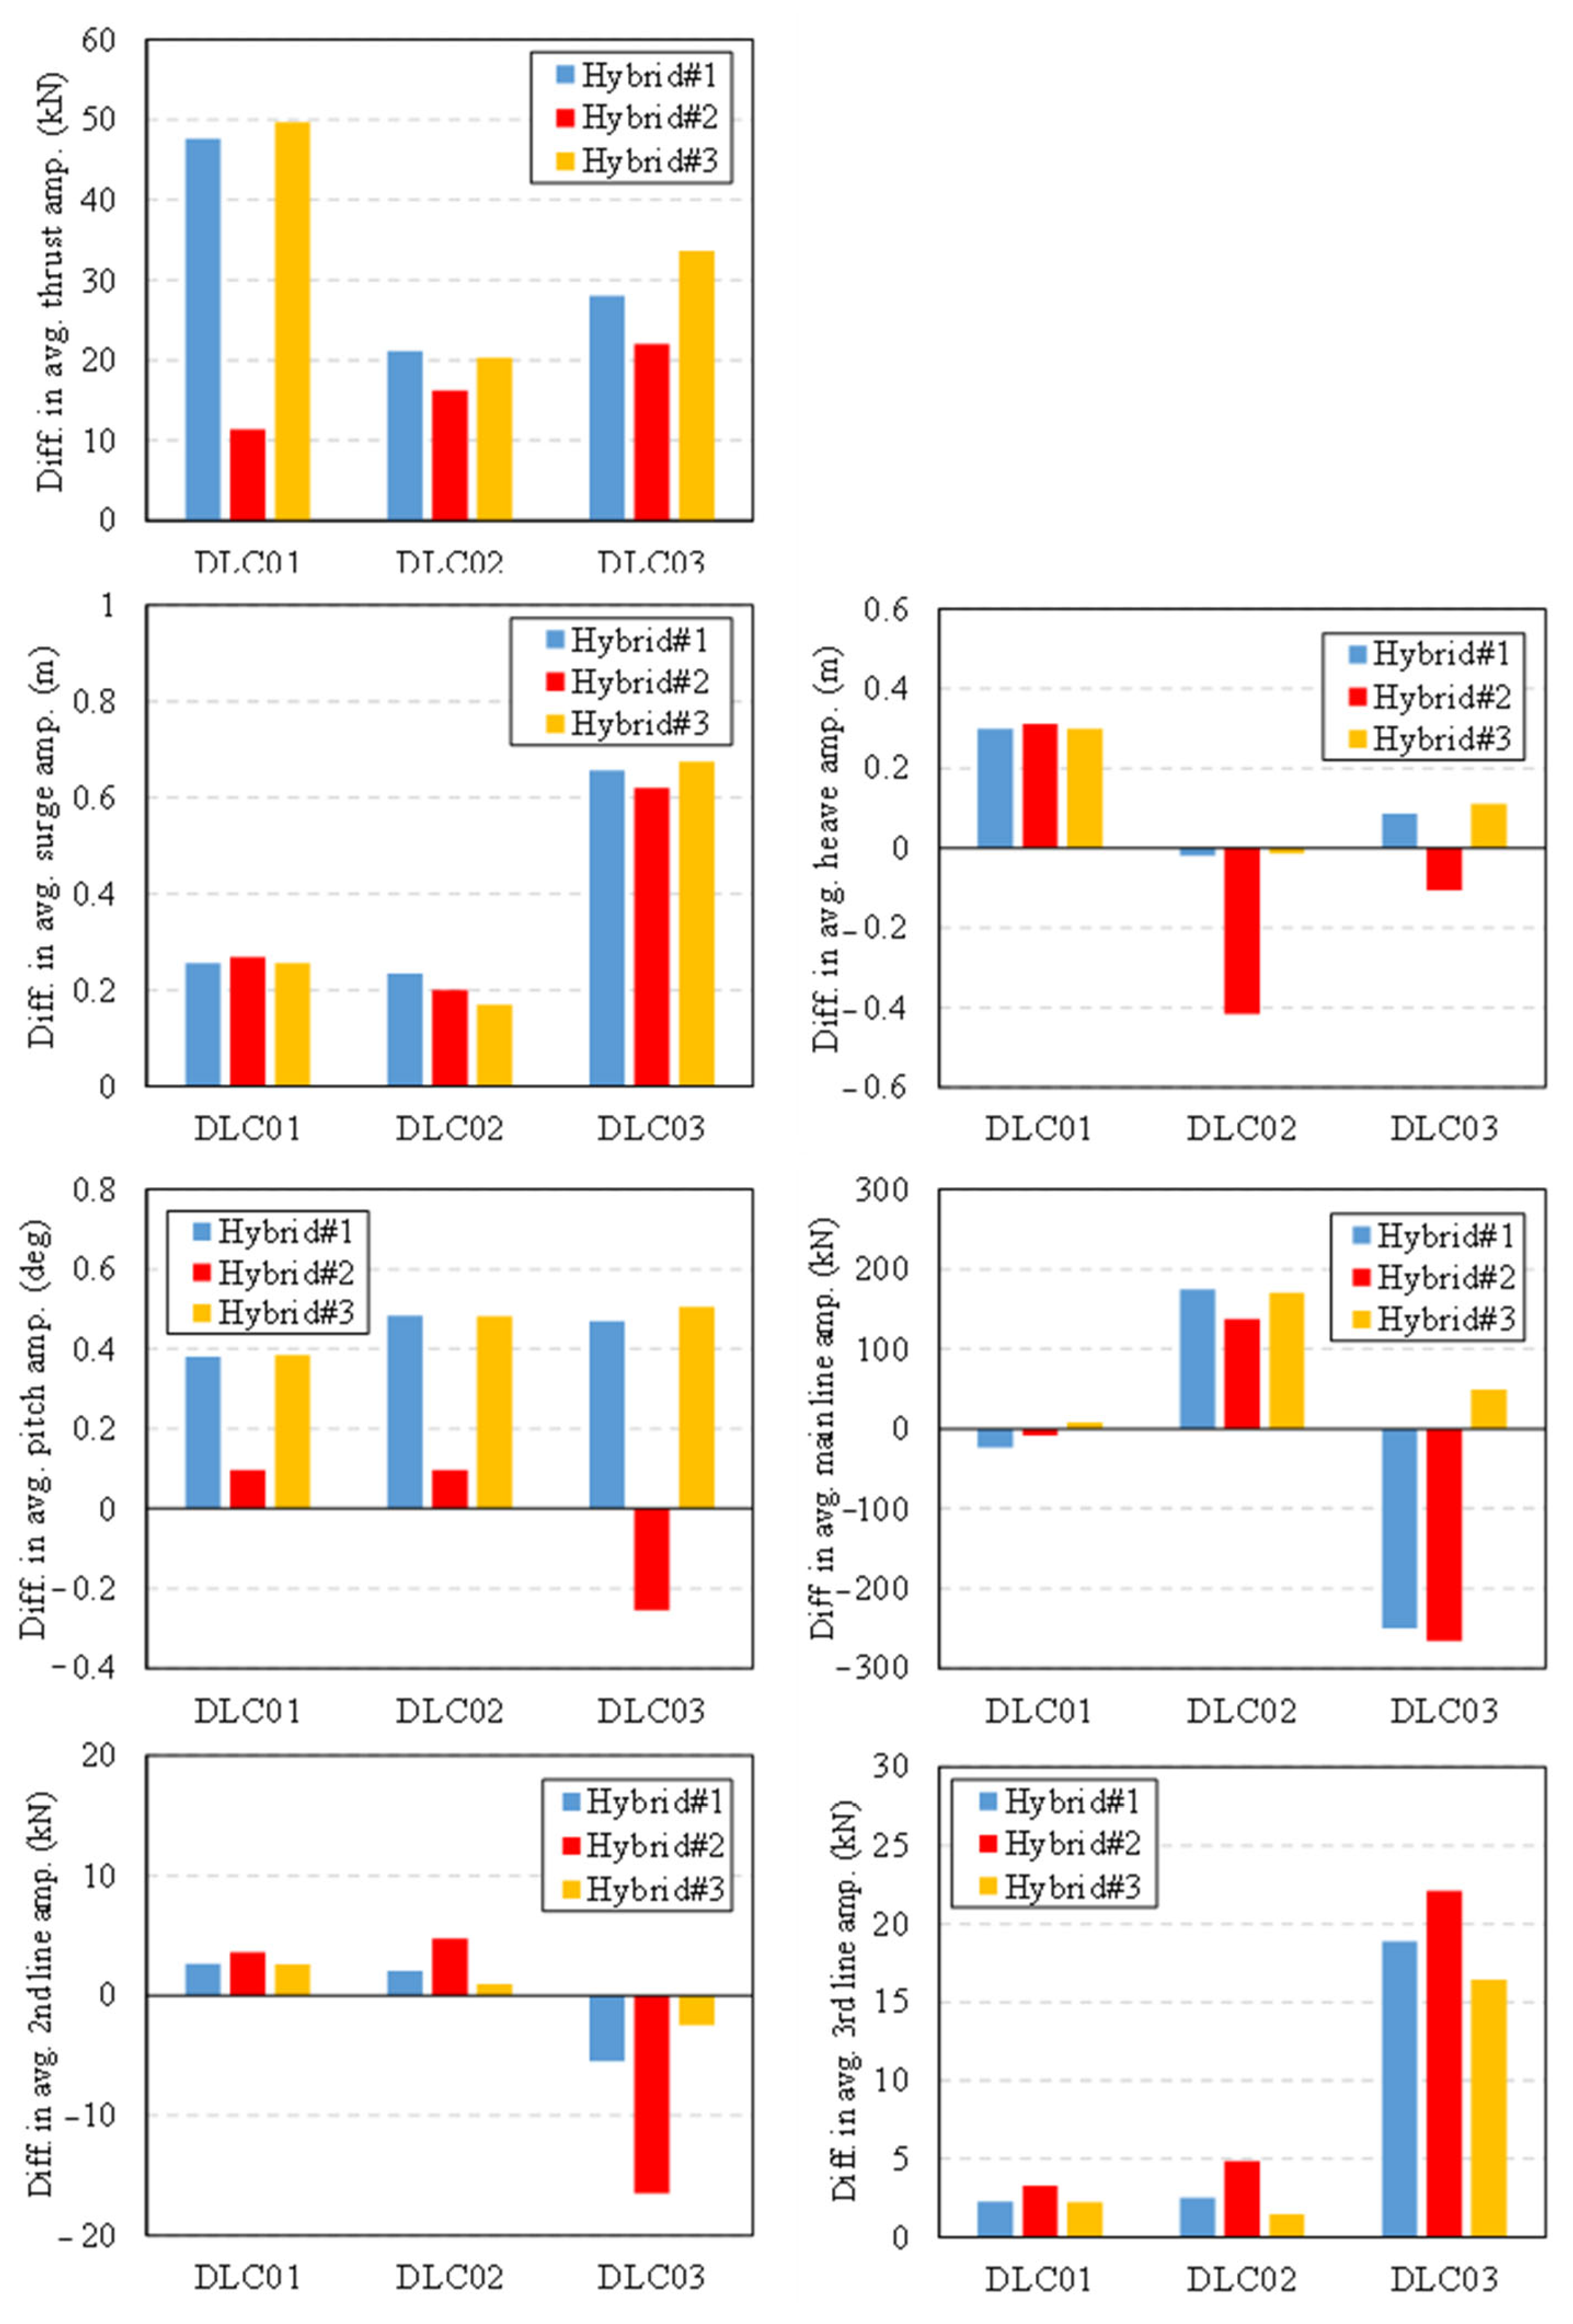
Figure 18 presents the comparison of the mean amplitude of load responses. The analysis results indicate that the mean response amplitude differences between PBDC and CFD were relatively small in most cases, and the improvements due to the correction methods were also minimal. The mean amplitude difference in thrust remained within 50 kN across all cases, while surge response differences were within 0.6 m, heave within 0.2 m, and pitch within approximately 0.4 degrees. The fairlead tension showed a maximum response amplitude difference of 200 kN. Overall, Figure 18 demonstrates that the mean amplitude differences between PBDC and CFD were not significant under most conditions. Under extreme conditions (DLC03), Hybrid (3) provided the most improved results. However, under operational conditions (DLC01 and DLC02), the differences in load responses due to the correction methods were not significant.

6. Conclusions

This study focused on a comparative analysis between a high-fidelity simulation tool and CFD for a fully coupled floating offshore wind turbine (FOWT) system on three design load cases. Although PBDC, which was only calibrated using free-decay data, was on par with CFD under the Operating Normal Conditions, there were differences between the two under extreme mooring system boundary conditions, especially in the responses of surge drift and mooring line tension. This showed the limitations of PBDC’s high-fidelity tool for capturing physical phenom under extreme conditions like typhoons.
This study developed and applied a modified hybrid correction approach to overcome the limitations of conventional damping and drag estimation methods. By fine-tuning the transverse drag coefficient of the side columns subjected to major lateral loading, the predictive accuracy of the high-fidelity analysis tool was notably enhanced. The improved alignment between high-fidelity simulations and CFD results, particularly in surge motion and mooring line tension under extreme conditions, demonstrates the method’s capability to serve as a reliable design aid for floating offshore wind turbines (FOWTs) in realistic marine environments. Beyond methodological improvements, the proposed correction framework holds substantial engineering value. It enables more accurate hydrodynamic load prediction, offering practical support for optimizing FOWT configurations and informing potential revisions to offshore design standards. With further validation across a wider range of sea states and turbine configurations—including pitch, heave, and aerodynamic effects—the method could evolve into a standardized correction tool that bridges numerical modeling with field application. Ultimately, this advancement contributes to safer, more efficient FOWT design and promotes its broader adoption in engineering practice.

Author Contributions

Methodology, A.A.; Software, H.-S.Y. and A.A.; Validation, A.A.; Investigation, H.-S.Y.; Resources, Y.-H.L.; Writing—original draft, A.A.; Supervision, Y.-H.L.; Funding acquisition, Y.-H.L. All authors have read and agreed to the published version of the manuscript.

Funding

This research was supported by Korea Institute of Energy Technology Evaluation and Planning (KETEP) grant funded by the Korean government (MOTIE) (20213000000030), Development of disconnectable mooring system for A MW class floating offshore wind turbine.

Data Availability Statement

The original contributions presented in this study are included in the article. Further inquiries can be directed to the corresponding author.

Conflicts of Interest

The authors declare no conflict of interest.

Abbreviations

B E M Blade element momentum
C F D Computational Fluid Dynamic
D L C Design load case
F O W T Floating Offshore Wind Turbine
RNARotor-Nacelle Assembly

References

  1. Zhou, L.; Li, Y.; Liu, F.; Jiang, Z.; Yu, Q.; Liu, L. Investigation of dynamic characteristics of a monopile wind turbine based on sea test. Ocean Eng. 2019, 189, 106308. [Google Scholar] [CrossRef]
  2. Jung, S.; Kim, S.-R.; Patil, A.; Hung, L.C. Effect of monopile foundation modeling on the structural response of a 5-MW offshore wind turbine tower. Ocean Eng. 2015, 109, 479–488. [Google Scholar] [CrossRef]
  3. Frick, D.; Achmus, M. An experimental study on the parameters affecting the cyclic lateral response of monopiles for offshore wind turbines in sand. Soils Found. 2020, 60, 1570–1587. [Google Scholar] [CrossRef]
  4. Häfele, J.; Gebhardt, C.G.; Rolfes, R. A comparison study on jacket substructures for offshore wind turbines based on optimization. Wind Energy Sci. 2019, 4, 23–40. [Google Scholar] [CrossRef]
  5. Häfele, J.; Hübler, C.; Gebhardt, C.G.; Rolfes, R. A comprehensive fatigue load set reduction study for offshore wind turbines with jacket substructures. Renew. Energy 2018, 118, 99–112. [Google Scholar] [CrossRef]
  6. Shi, W.; Han, J.; Kim, C.; Lee, D.; Shin, H.; Park, H. Feasibility study of offshore wind turbine substructures for southwest offshore wind farm project in Korea. Renew. Energy 2015, 74, 406–413. [Google Scholar] [CrossRef]
  7. Rodriguez, S.N.; Jaworski, J.W. Strongly-coupled aeroelastic free-vortex wake framework for floating offshore wind turbine rotors. Part 2: Application. Renew. Energy 2020, 149, 1018–1031. [Google Scholar] [CrossRef]
  8. Wu, H.; Zhao, Y.; He, Y.; Shao, Y.; Mao, W.; Han, Z.; Huang, C.; Gu, X.; Jiang, Z. Transient response of a TLP-type floating offshore wind turbine under tendon failure conditions. Ocean Eng. 2021, 220, 108486. [Google Scholar] [CrossRef]
  9. Bagherian, V.; Salehi, M.; Mahzoon, M. Rigid multibody dynamic modeling for a semi-submersible wind turbine. Energy Convers. Manag. 2021, 244, 114399. [Google Scholar] [CrossRef]
  10. Yang, Y.; Bashir, M.; Michailides, C.; Li, C.; Wang, J. Development and application of an aero-hydro-servo-elastic coupling framework for analysis of floating offshore wind turbines. Renew. Energy 2020, 161, 606–625. [Google Scholar] [CrossRef]
  11. Kvittem, M.I.; Bachynski, E.E.; Moan, T. Effects of Hydrodynamic Modelling in Fully Coupled Simulations of a Semi-submersible Wind Turbine. Energy Procedia 2012, 24, 351–362. [Google Scholar] [CrossRef]
  12. Yang, H.-S.; Tongphong, W.; Ali, A.; Lee, Y.-H. Comparison of different fidelity hydrodynamic-aerodynamic coupled simulation code on the 10 MW semi-submersible type floating offshore wind turbine. Ocean Eng. 2023, 281, 114736. [Google Scholar] [CrossRef]
  13. Tran, T.T.; Kim, D.-H. Fully coupled aero-hydrodynamic analysis of a semi-submersible FOWT using a dynamic fluid body interaction approach. Renew. Energy 2016, 92, 244–261. [Google Scholar] [CrossRef]
  14. Yang, H.-S.; Alkhabbaz, A.; Tongphong, W.; Lee, Y.-H. Cross-comparison analysis of environmental load components in extreme conditions for pontoon-connected semi-submersible FOWT using CFD and potential-based tools. Ocean Eng. 2024, 304, 117248. [Google Scholar] [CrossRef]
  15. Deng, S.; Liu, Y.; Ning, D. Fully coupled aero-hydrodynamic modelling of floating offshore wind turbines in nonlinear waves using a direct time-domain approach. Renew. Energy 2023, 216, 119016. [Google Scholar] [CrossRef]
  16. Wang, W.; Hu, J.; Zhao, C.; Xie, Y.; Gong, X.; Jiang, D. Multi-Column Semi-Submersible Floating Body Hydrodynamic Performance Analysis. Energies 2025, 18, 1884. [Google Scholar] [CrossRef]
  17. Alkhabbaz, A.; Hamza, H.; Daabo, A.M.; Yang, H.-S.; Yoon, M.; Koprulu, A.; Lee, Y.-H. The aero-hydrodynamic interference impact on the NREL 5-MW floating wind turbine experiencing surge motion. Ocean Eng. 2024, 295, 116970. [Google Scholar] [CrossRef]
  18. Burmester, S.; Vaz, G.; el Moctar, O. Towards credible CFD simulations for floating offshore wind turbines. Ocean Eng. 2020, 209, 107237. [Google Scholar] [CrossRef]
  19. Li, H.; Bachynski-Polić, E.E. Validation and application of nonlinear hydrodynamics from CFD in an engineering model of a semi-submersible floating wind turbine. Mar. Struct. 2021, 79, 103054. [Google Scholar] [CrossRef]
  20. Wang, L.; Robertson, A.; Jonkman, J.; Yu, Y.-H. OC6 phase I: Improvements to the OpenFAST predictions of nonlinear, low-frequency responses of a floating offshore wind turbine platform. Renew. Energy 2022, 187, 282–301. [Google Scholar] [CrossRef]
  21. Wang, L.; Robertson, A.; Kim, J.; Jang, H.; Shen, Z.-R.; Koop, A.; Bunnik, T.; Yu, K. Validation of CFD simulations of the moored DeepCwind offshore wind semisubmersible in irregular waves. Ocean Eng. 2022, 260, 112028. [Google Scholar] [CrossRef]
  22. Tran, T.T.; Kim, D.-H. A CFD study into the influence of unsteady aerodynamic interference on wind turbine surge motion. Renew. Energy 2016, 90, 204–228. [Google Scholar] [CrossRef]
  23. Yang, H.-S.; Alkhabbaz, A.; Edirisinghe, D.S.; Tongphong, W.; Lee, Y.-H. FOWT Stability Study According to Number of Columns Considering Amount of Materials Used. Energies 2022, 15, 1653. [Google Scholar] [CrossRef]
  24. Tran, T.T.; Kim, D.-H. The coupled dynamic response computation for a semi-submersible platform of floating offshore wind turbine. J. Wind Eng. Ind. Aerodyn. 2015, 147, 104–119. [Google Scholar] [CrossRef]
  25. Dose, B.; Rahimi, H.; Herráez, I.; Stoevesandt, B.; Peinke, J. Fluid-structure coupled computations of the NREL 5 MW wind turbine by means of CFD. Renew. Energy 2018, 129, 591–605. [Google Scholar] [CrossRef]
  26. Hansen, M.O.L.; Sørensen, J.N.; Voutsinas, S.; Sørensen, N.; Madsen, H.A. State of the art in wind turbine aerodynamics and aeroelasticity. Prog. Aerosp. Sci. 2006, 42, 285–330. [Google Scholar] [CrossRef]
  27. Hansen, M. Aerodynamics of Wind Turbines; Routledge: Abingdon, UK, 2015. [Google Scholar] [CrossRef]
  28. Sebastian, T.; Lackner, M.A. Characterization of the unsteady aerodynamics of offshore floating wind turbines. Wind Energy 2013, 16, 339–352. [Google Scholar] [CrossRef]
  29. Alkhabbaz, A.; Yang, H.-S.; Weerakoon, A.H.S.; Lee, Y.-H. A novel linearization approach of chord and twist angle distribution for 10 kW horizontal axis wind turbine. Renew. Energy 2021, 178, 1398–1420. [Google Scholar] [CrossRef]
  30. Jonkman, J.M. Dynamics of offshore floating wind turbines model development and verification. Wind Energy 2009, 12, 459–492. [Google Scholar] [CrossRef]
  31. Masciola, M.; Robertson, A.; Jonkman, J.; Goupee, A.; Coulling, A. Assessment of the Importance of Mooring Dynamics on the Global Response of the DeepCwind Floating Semisubmersible Offshore Wind Turbine. In Proceedings of the Twenty-Third (2013) International Offshore and Polar Engineering Conference, Anchorage, Alaska, 30 June–5 July 2013; pp. 359–368. [Google Scholar]
  32. Rongé, É.; Peyrard, C.; Venugopal, V.; Xiao, Q.; Johanning, L.; Benoit, M. Evaluation of second and third-order numerical wave-loading models for floating offshore wind TLPs. Ocean Eng. 2023, 288, 116064. [Google Scholar] [CrossRef]
  33. Orcina, Ltd. OrcaFlex Manual; Version 9.6a; Orcina, Ltd.: Ulverston, UK, 2012; pp. 1–376. [Google Scholar]
  34. Shan, T.; Yang, J.; Li, X.; Xiao, L. Experimental Investigation on Wave Run-up Characteristics Along Columns and Air Gap Response of Semi-Submersible Platform. J. Hydrodyn. 2011, 23, 625–636. [Google Scholar] [CrossRef]
  35. Li, H.; Bachynski, E.E. Experimental and numerical investigation of nonlinear diffraction wave loads on a semi-submersible wind turbine. Renew. Energy 2021, 171, 709–727. [Google Scholar] [CrossRef]
  36. Butterfield, S.; Musial, W.; Jonkman, J.; Sclavounos, P. Engineering Challenges for Floating Offshore Wind Turbines; NREL/CP-500-38776; National Renewable Energy Laboratory (NREL): Golden, CO, USA, 2007.
  37. Carlson, D.W.; Modarres-Sadeghi, Y. Vortex-induced vibration of spar platforms for floating offshore wind turbines. Wind Energy 2018, 21, 1169–1176. [Google Scholar] [CrossRef]
  38. Kim, I.C.; Alkhabbaz, A.; Jeong, H.; Lee, Y.H. Optimization Methodology Of Small Scale Horizontal Axis Shrouded Tidal Current Turbine. In Proceedings of the 2019 IEEE Asia-Pacific Conference on Computer Science and Data Engineering (CSDE), Melbourne, VIC, Australia, 9–11 December 2019. [Google Scholar] [CrossRef]
  39. Bak, C.; Zahle, F.; Bitsche, R.; Kim, T.; Yde, A.; Henriksen, L.C.; Hansen, M.H.; Blasques, J.P.A.A.; Gaunaa, M.; Natarajan, A. The DTU 10-MW Reference Wind Turbine; DTU Wind Energy, Technical University of Denmark: Kongens Lyngby, Denmark, 2013. [Google Scholar]
  40. Muggiasca, S.; Taruffi, F.; Fontanella, A.; di Carlo, S.; Giberti, H.; Facchinetti, A.; Belloli, M. Design of an aeroelastic physical model of the DTU 10MW wind turbine for a floating offshore multipurpose platform prototype. Ocean Eng. 2021, 239, 109837. [Google Scholar] [CrossRef]
  41. Siemens PLM Software, Version 13.06.012; Siemens Industry Software Inc.: Plano, TX, USA, 2018.
  42. Yang, H.-S.; Alkhabbaz, A.; Lee, Y.-H. Integrated CFD and hydrodynamic correction approach for load response analysis of floating offshore wind turbine. Ocean Eng. 2025, 328, 121007. [Google Scholar] [CrossRef]
  43. Srinivas, A.; Robertson, B.; Gadasi, J.B.; Simpson, B.G.; Lomónaco, P.; Ilzarbe, J.M.B. Impact of Limited Degree of Freedom Drag Coefficients on a Floating Offshore Wind Turbine Simulation. J. Mar. Sci. Eng. 2023, 11, 139. [Google Scholar] [CrossRef]
  44. Venugopal, V.; Varyani, K.S.; Westlake, P.C. Drag and inertia coefficients for horizontally submerged rectangular cylinders in waves and currents. Proc. Inst. Mech. Eng. Part M J. Eng. Marit. Environ. 2009, 223, 121–136. [Google Scholar] [CrossRef]
  45. Det Norske Veritas. Environmental Conditions and Environmental Loads; DNV-RP-C2025; Det Norske Veritas: Bærum, Norway, 2010. [Google Scholar]
  46. Kim, B.W.; Sim, K.; Lee, K.; Hong, S.Y. Experimental and Numerical Evaluation of Hydrodynamic Behavior of 10 MW Floating Offshore Wind Turbine. In Advanced and Emerging Marine Engineering Technologies; Springer: Singapore, 2025; pp. 802–813. [Google Scholar] [CrossRef]
  47. Alkhabbaz, A.; Hamzah, H.; Hamdoon, O.M.; Yang, H.-S.; Easa, H.; Lee, Y.-H. A unique design of a hybrid wave energy converter. Renew. Energy 2025, 245, 122814. [Google Scholar] [CrossRef]
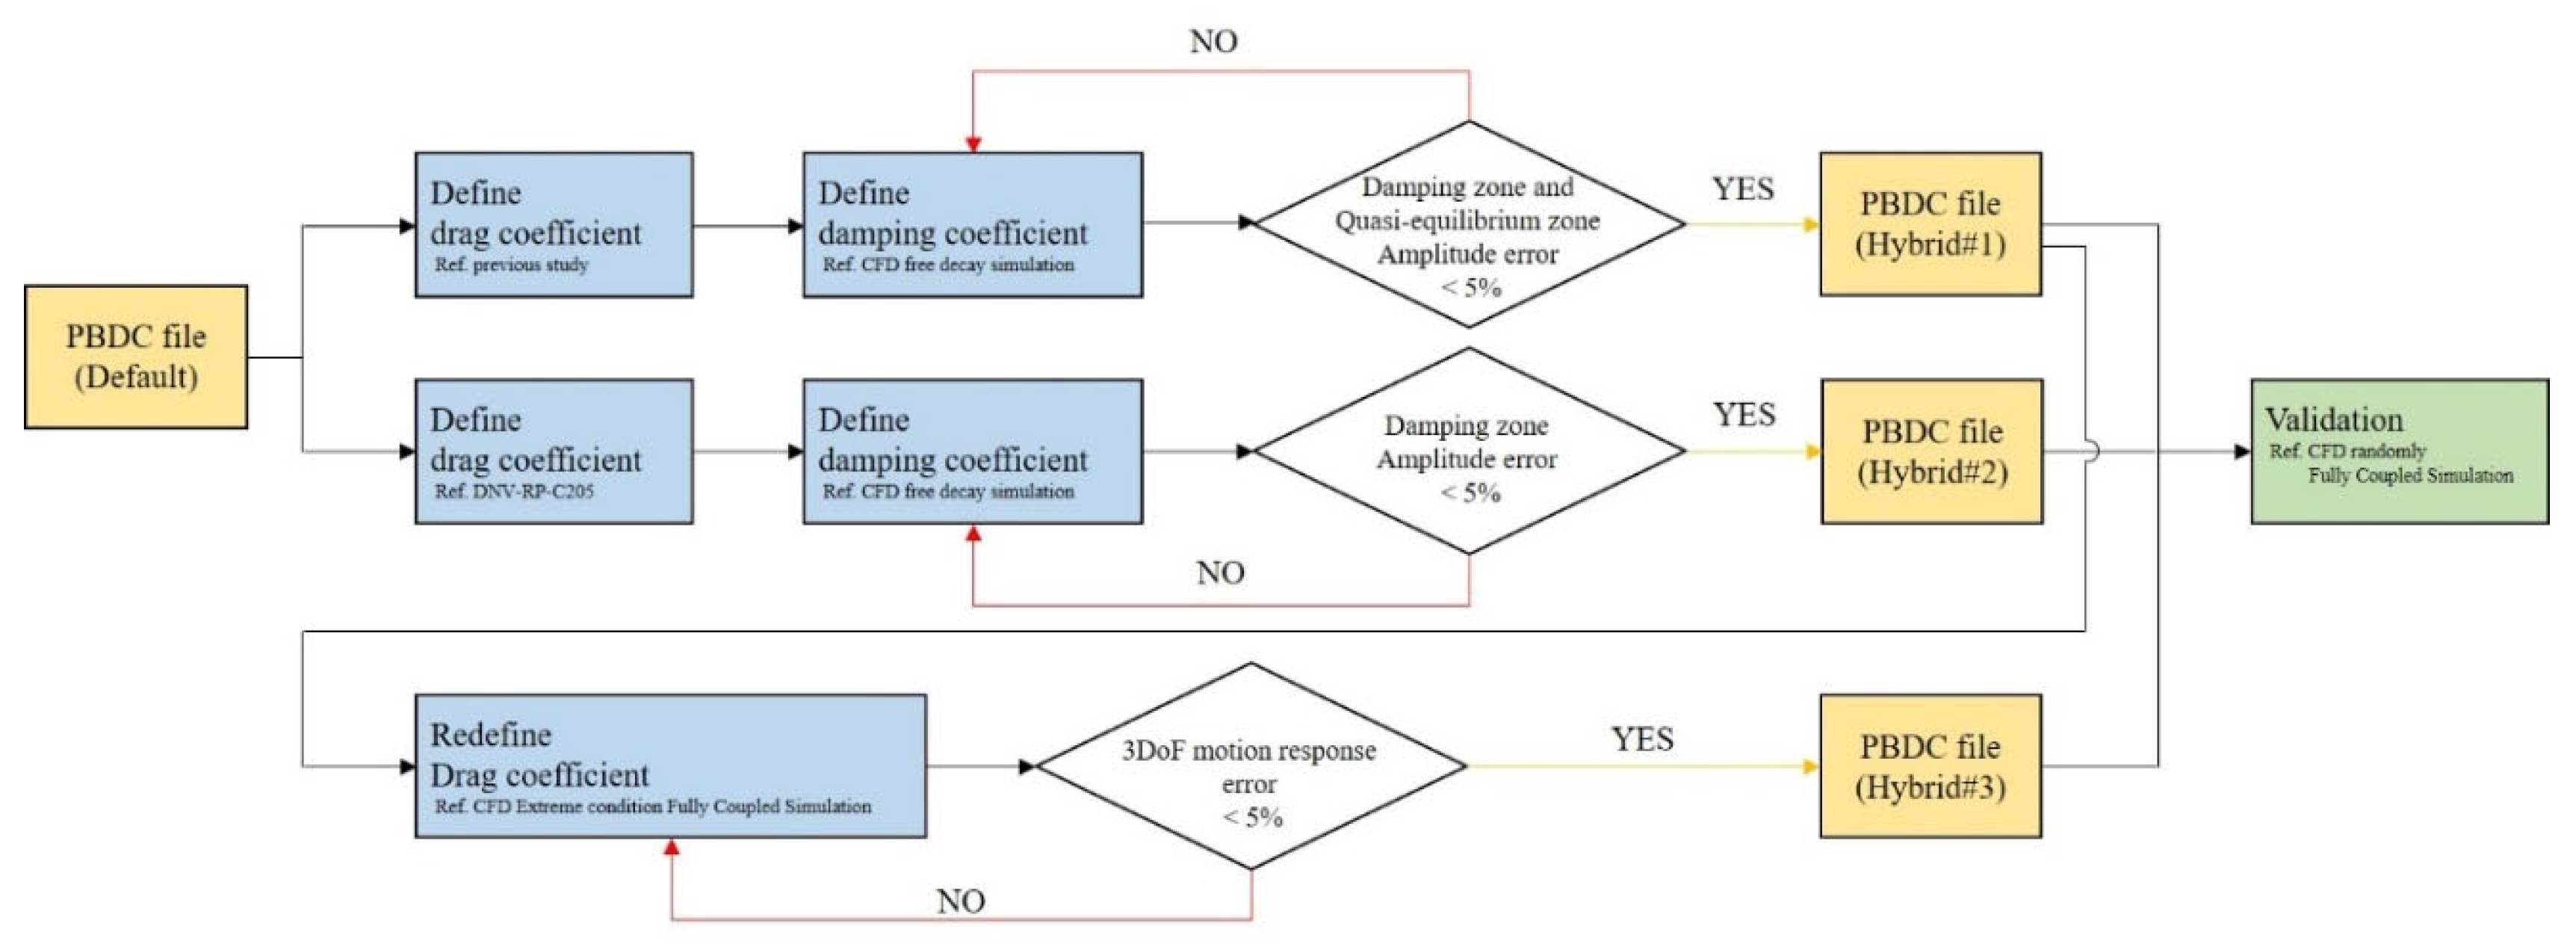
Figure 1. Simulation procedure for validating the FD-EFCS method.
Energies 18 05545 g001
Figure 2. Schematic depiction of the fully integrated FOWT system.
Energies 18 05545 g002
Figure 3. A fully integrated 10 MW FOWT along with its floater configuration.
Energies 18 05545 g003
Figure 5. Mesh structure illustrating overset region and refinement zones.
Energies 18 05545 g005
Figure 6. Illustration of the pitch free-decay experimental setup (left) [46] alongside the corresponding CFD simulation model (right).
Energies 18 05545 g006
Figure 7. Comparison of pitch free-decay responses between experimental work [46] and the present CFD simulation.
Energies 18 05545 g007
Figure 8. The comparison of free-decay simulations using CFD and potential-based engineering tools, each incorporating different correction approaches, is illustrated for surge (top), pitch (middle), and heave (bottom) motions.
Energies 18 05545 g008
Figure 9. Comparison of fully coupled simulation under rated wind speed condition.
Energies 18 05545 g009
Figure 10. Comparison of fully coupled simulation under cut-out speed condition.
Energies 18 05545 g010
Figure 11. Comparison of fully coupled simulation under typhoon condition.
Energies 18 05545 g011
Figure 12. Mean error evaluation of PTET versus CFD (surge on the left, fairlead tension of main mooring line on the right).
Energies 18 05545 g012
Figure 13. Average difference comparison of PTET and CFD (surge on the left, fairlead tension of main mooring line on the right).
Energies 18 05545 g013
Figure 14. Load response comparison of three correction methods using a potential-flow-based engineering tool and CFD (Wind: 11 m/s, Wave Height: 6 m, Wave Period: 10 s).
Energies 18 05545 g014
Figure 15. Load response comparison of three correction methods using a potential-flow-based engineering tool and CFD (wind: 24 m/s, Height: 6 m, Period: 13 s).
Energies 18 05545 g015
Figure 16. Load response comparison of three correction methods using a potential-flow-based engineering tool and CFD (wind: 40.28 m/s, Height: 8.34 m, Period: 13.1 s, current: 0.77 m/s).
Energies 18 05545 g016
Figure 17. Load and motion response Average error comparison of PTETs and CFD.
Energies 18 05545 g017
Figure 18. Load and motion response amplitude average difference comparison of PTETs and CFD.
Energies 18 05545 g018
Table 1. Applied load conditions and turbine orientation specified for each defined load case.
Load Case No.WaveCurrentWindTurbine Direction
ConditionDir.HeightPeriodDir.SpeedConditionDir.Speed
01Regular180°6.0 m10.0 s--Constant180°11.0 m/s180°
02Regular180°6.0 m13.0 s--Constant180°24.0 m/s180°
03Regular270°8.34 m13.1 s270°0.77 m/sConstant270°40.28 m/s240°
Table 2. Integrated characteristics of floating offshore wind turbine systems and their mooring configurations.
PropertiesValues
Overall (w/o mooring)
Mass1.025 × 107 kg
Displacement volume10,728 m3
Center of mass (from SWL)Xyz
−0.04 m0 m4.185 m
Draft15.5 m
Moment of inertiaIxxIyyIzz
1.967 × 10⁷ kg2-m1.961 × 107 kg2-m1.298 × 107 kg2-m
Mooring
Unstretched length850 m
DLC01DLC02DLC03
Stiffness1.845 × 106 kN1.845 × 106 kN1.568 × 109 kN
Mooring mass162.51 kg/m432 kg/m373.87 kg/m
Fairlead and Anchor positionx (m)y (m)z (m)
Anchor0.00−852.69−150.0
738.45426.35−150.0
−738.45426.35−150.0
Fairlead0.0052.6913.08
45.63126.34513.08
−45.63126.34513.08
Table 3. Coefficient values associated with drag and damping in FOWT systems.
Hydride (1)Hybrid (2)
Drag coefficient
CDside col_trans.0.81
CDside col_verti.0.80
CDinter_trans.0.611
CDinter_verti.2.40
CDmain col_trans.0.81
CDmain col_verti.2.40
CDpootoon_trans.2.01.72
CDpootoon_verti.3.00
Damping coefficient
Linear surge (kN/(m/s))1300
Linear heave (kN/(m/s))01960
Linear pitch (kN/(rad/s))0629 × 103
Quadra surge (kN/(m/s)2)−4000
Quadra heave (kN/(m/s)2)15000
Quadra pitch (kN/(rad/s)2)−20 × 1060
Table 4. Deviation in CFD predictions of pitch free-decay behavior.
ExperimentCFDCFD Error (%)
Period (avg.)21.757 s22.039 s1.29
Logarithmic decrement
(1th~5th avg.)
0.2410.231−3.88
Logarithmic decrement
(6th~15th avg.)
0.0890.0946.79
Table 5. Modified drag and damping coefficient values of FOWT system.
Drag CoefficientHybrid (3)
CDside col_trans.3.5
CDside col_verti.0.8
CDinter_trans.0.61
CDinter_verti.2.4
CDmain col_trans.3.5
CDmain col_verti.2.4
CDpootoon_trans.2.0
CDpootoon_verti.3.0
Damping coefficient
Linear surge (kN/(m/s))130
Linear heave (kN/(m/s))0
Linear pitch (kN/(rad/s))0
Quadra surge (kN/(m/s)2)−400
Quadra heave (kN/(m/s)2)1500
Quadra pitch (kN/(rad/s)2)−20 × 106
Disclaimer/Publisher’s Note: The statements, opinions and data contained in all publications are solely those of the individual author(s) and contributor(s) and not of MDPI and/or the editor(s). MDPI and/or the editor(s) disclaim responsibility for any injury to people or property resulting from any ideas, methods, instructions or products referred to in the content.