Article

Techno-Economic Analysis of Marine Hybrid Clusters for Use in Chile and Mexico

by
Emiliano Gorr-Pozzi
1,*,
Jorge Olmedo-González
2,
Diego Selman-Caro
3,
Manuel Corrales-González
1,
Héctor García-Nava
4,
Fabiola García-Vega
3,
Itxaso Odériz
5,
Giuseppe Giorgi
1,
Rosa de G. González-Huerta
2,
José A. Zertuche-González
4 and
Rodolfo Silva
3
1
Marine Offshore Renewable Energy Lab (MOREnergy Lab), Department of Mechanical and Aerospace Engineering (DIMEAS), Politecnico di Torino, Corso Duca degli Abruzzi 24, 10129 Turin, Italy
2
Electrochemistry Laboratory, Instituto Politécnico Nacional-ESIQIE, Professional Leadership Acquisition and Improvement Unit (UPALM), Av. Instituto Politécnico Nacional S/N, Mexico City 07738, Mexico
3
Instituto de Ingeniería, Universidad Nacional Autónoma de Mexico, Ciudad Universitaria, Circuito Exterior S/N, Coyoacán, Mexico City 04510, Mexico
4
Instituto de Investigaciones Oceanológicas, Universidad Autónoma de Baja California, Carretera Ensenada-Tijuana No. 3917, Fraccionamiento Playitas, Ensenada 22860, Mexico
5
Instituto de Hidráulica Ambiental, Universidad de Cantabria, 39011 Santander, Spain
*
Author to whom correspondence should be addressed.
Energies 2025, 18(20), 5543; https://doi.org/10.3390/en18205543
Submission received: 4 August 2025 / Revised: 27 September 2025 / Accepted: 13 October 2025 / Published: 21 October 2025
(This article belongs to the Special Issue Advanced Technologies for the Integration of Marine Energies)

Abstract

This study assesses the feasibility and profitability of marine hybrid clusters, combining wave energy converters (WECs) and offshore wind turbines (OWTs) to power households and marine aquaculture. Researchers analyzed two coastal sites: La Serena, Chile, with high and consistent wave energy resources, and Ensenada, Mexico, with moderate and more variable wave power. Two WEC technologies, Wave Dragon (WD) and Pelamis (PEL), were evaluated alongside lithium-ion battery storage and green hydrogen production for surplus energy storage. Results show that La Serena’s high wave power (26.05 kW/m) requires less hybridization than Ensenada’s (13.88 kW/m). The WD device in La Serena achieved the highest energy production, while PEL arrays in Ensenada were more effective. The PEL-OWT cluster proved the most cost-effective in Ensenada, whereas the WD-OWT performed better in La Serena. Supplying electricity for seaweed aquaculture, particularly in La Serena, proves more profitable than for households. Ensenada’s clusters generate more surplus electricity, suitable for the electricity market or hydrogen conversion. This study emphasizes the importance of tailoring emerging WEC systems to local conditions, optimizing hybridization strategies, and integrating consolidated industries, such as aquaculture, to enhance both economic and environmental benefits.

1. Introduction

The search for innovative solutions to meet energy demand, mitigate climate change, and reduce pressure on ecosystem services has driven technological developments in renewable energy (RE) [1]. The main research areas in the quest to increase the competitiveness and global installed capacity of RE facilities have sought to enhance their technological readiness and supply chain resilience, and reduce commissioning costs [2].
Reducing the levelized cost of energy (LCoE) of RE below the cost range of fossil fuels is also a key aim [3]. However, the commercial viability of RE technologies is irregular, and all are in different stages of commercialization. Their cost effectiveness needs to be improved to accelerate their deployment and therefore their contribution to climate quotas [4].
Diversification and modernization of the energy mix through affordable, secure, and sustainable harvesting of marine renewable energies (MRE) are possible means to improve the well-being of coastal communities [5]. MRE includes ocean currents, tides, thermal and salinity gradients, waves, and offshore wind. Driven by the accumulated experience and technological maturity in the onshore wind sector, with a global 83 GW of cumulative installed capacity in 2024, offshore wind is considered the most competitive source of MRE and crucial in the drive towards energy transition and decarbonizing the power sector [6]. With its rapidly increasing role in electricity generation, offshore wind energy has advantages over onshore wind energy, such as greater wind power availability, larger areas to install wind farms, and lower generation variability [7]. Shadman et al. [8] conducted a comprehensive review of the current status and future perspectives of MRE in South America. By surveying the existing scientific literature, national electricity grids and infrastructure, and assessing resource potential, the study highlighted the critical need to increase investment, establish appropriate legal frameworks, launch full-scale demonstration projects, and consider the synergies and conflicts associated with ocean space utilization in the region. The study by Hernandez-Fontes et al. [9] performed a comprehensive assessment of Mexico’s potential for MRE. By analyzing global datasets and establishing availability thresholds, the study offered a prospective coastal zone with consistent energy availability while also considering environmental and socioeconomic constraints. This innovative approach revealed that Mexico has substantial and sustainable marine energy resources, which could contribute significantly to diversifying the nation’s energy portfolio.
Wave energy is another promising source of MRE that is expected to be exploited soon. The energy in ocean waves has been estimated to be approximately the same as the world’s electricity consumption [10]. The high energy density of wave power per unit area, its predictability, and the fact that waves naturally flow toward our coasts make harnessing it profitable [11]. However, most wave energy converter (WEC) projects are still in the developing stage [12,13]. The wide range of LCoE, 75 - 500 USD/MWh, translates into low competitiveness in the electricity market, and non-representative economic models translate into low competitiveness in the electricity market and uncertainties in the performance of the WEC at the commercial scale [14,15,16]. Corrales-González et al. [17] conducted an unstructured wave hindsight, assessing wave energy availability and its exploitation through WECs in the Central American Pacific region using high-resolution wave data. The resulting dataset laid the groundwork for diversifying WEC portfolios tailored to Exclusive Economic Zone conditions, highlighting the need for sound regulatory and economic frameworks that boost profitability and support the sustainable development of WEC projects in the region. A study by Meneses et al. [18] assessed the long-term techno-economic potential of integrating WECs into the isolated power system of the Galapagos archipelago. Using a comprehensive OSeMOSYS model, the research projected that while WECs are not currently cost-competitive, their LCoE is expected to decline over time. This suggests that by 2050, these devices could become a vital component of a diversified, low-carbon energy portfolio, thereby reducing fossil fuel reliance and improving the resilience of the region’s energy infrastructure. The study of Sánchez and Mendoza [19] assessed the techno-economic feasibility of WEC farms along the southwest coast of Baja California, Mexico. The study determines the theoretical installed capacity and the LCoE for a farm configuration. Sensitivity analysis confirmed that site selection was the most significant factor influencing LCoE, where Archimedes Wave Swing farms provided a more economically viable and competitive option than Wave Dragon WEC arrays.
Although previous work focused on high-resolution assessment of wave energy resources at a single site in Chile [20] or techno-economic analyses of standalone WECs in the region [21], a need persists for a holistic analysis of hybrid systems. This research gap drives the growing interest in marine hybrid clusters (MHCs), which integrate diverse coastal industries with multiple MRE sources [22]. This symbiotic approach enhances overall system performance by mitigating electrical intermittency and maximizing annual energy production (AEP). Consequently, hybridization makes renewable energy more competitive than traditional sources, ensuring a sustainable and reliable energy supply. Furthermore, it facilitates the production of high-value commercial by-products, promoting the blue economy and strengthening the resilience of coastal communities [23,24,25]. Furthermore, the joint coupling of emerging WEC and offshore wind turbine (OWT) sectors with the established marine aquaculture sector (e.g., the farming of fish, mollusks, crustaceans, or seaweed in commercial floating cultures) can generate symbiotic benefits based on energy and food security and increase the profitability of projects [26,27]. During the last decade, marine aquaculture has experienced the highest growth rate among all food production systems [27]. With an annual production of 32.4 million tons (wet weight) in 2018, valued at USD 11.80 billion, it is projected that the seaweed sector will grow to USD 22.13 billion by 2024 [28,29]. Gorr-Pozzi et al. [30] analyzed the techno-economic feasibility of integrated MHCs with WECs, seawater desalination, and marine aquaculture modules to create a sustainable water–energy–food nexus in the arid coastal regions of Baja California, Mexico. The finding indicated that while an individual WEC was not profitable, the economic scaling of the WEC array enhanced its viability. Although the desalination component was not economically viable on its own, the seaweed aquaculture module was identified as the main driver of profitability.
However, hybrid systems that integrate MRE face challenges associated with integrating, coordinating, and synchronizing the different renewable systems. These require complex engineering and control mechanisms for a reliable power supply and sophisticated energy management [31]. Moreover, high upfront investment costs and regulatory and policy frameworks do not incentivize or support deployment [32]. Naderipour et al. [33] developed MHC integrating tidal, photovoltaic, and wind energy with a hydrogen energy storage system. Their study assessed three sites, comparing the RE potential at each location. The findings revealed that the combined contribution of these energy sources effectively minimized the net present cost of the hybrid system while enhancing reliability and reducing load deficits. Petracca et al. [34] conducted a techno-economic analysis of a novel hybrid concept based on the Nautilus semi-submersible platform, integrated with OWT and four-point absorber WECs in the deep waters of Belmullet, Ireland. Diversification through hybrid OWT and WEC configurations offered a promising solution for the future of the MRE sector, representing a crucial step towards the energy transition by enabling a more robust and cost-effective energy mix. The hybrid systems were able to significantly reduce power fluctuations and investment costs, enhancing the economic competitiveness of MRE with a 10% reduction in LCoE, improved performance indicators, and hydrodynamic stability compared to stand-alone systems. Coles et al. [35] developed a hybrid tidal stream and wind energy system with short-term battery storage and backup oil generators. The tidal and wind hybrid systems reduce annual carbon emissions by 77% and 68%, respectively. Additionally, the performance of the tidal hybrid system improves significantly as battery storage capacity increases from 1 MWh to 3 MWh, enabling energy discharge to meet demand during most low-water periods in spring.
The stability and reliability of the power supply are greater if the MHC includes energy storage technology. Batteries or hydrogen can be used as storage options during periods of low renewable energy generation or high demand. While these technologies’ storage improves the stability, reliability, and sustainability of energy production and distribution, this will also increase capital, operating, and maintenance costs [29,36]. Other research, such as that of Sanchez-Dirzo et al. [37], describes the technical feasibility of hydrogen generation using wave energy. The Blow-Jet device converts wave energy into electricity using an impulse turbine with an electric generator and can produce hydrogen in an electrolyzer with an efficiency of 90.58%.
The geopolitical context has driven the uneven technological maturity of WECs. Developed countries lead the sector, with devices designed and adapted to generate maximum performance in high-wave energy conditions [17,38]. This creates uncertainties in the flexibility and performance of WECs in regions with different climatic conditions, with generally lower energy availability. Diverse studies have demonstrated the need to adapt WECs in developing countries to give better performance in local conditions, different from design conditions [11,17,18]. In turn, performance outside of the WEC design conditions can decrease the capacity factor and profitability of a WEC project. Therefore, accelerating the commercial deployment of the emerging WEC sector requires innovative solutions to improve performance, viability, and competitiveness in the electricity market. Optimizing hybridization and storage strategies, integrating complementary consolidated coastal industries, assessing the diversification of electricity uses, and supporting public policy instruments and regulatory frameworks are novel strategies designed to help boost the WEC sector among developing countries with similar social, economic, and electricity consumption conditions.
Although this study focuses on Mexico and Chile, it provides a comprehensive proof of concept for hybrid MRE production integrated with aquaculture, establishing a critical baseline for future regional expansion throughout the American continent and other global coastal areas. Although previous investigations have explored similar concepts at latitudes with a high potential for wave and offshore wind energy, this research distinguishes itself due to the specific environmental and oceanographic conditions of the study sites, including local marine seaweed cultures. As such, this analysis contributes novel data that significantly diverges from the existing literature. Specifically, this paper presents the first explicit, comparative techno-economic analysis of MHCs across two different Latin American coastal regions: La Serena, Chile (a high-energy, consistent wave regime), and Ensenada, Mexico (a moderate, more variable regime). This approach allows us to demonstrate the critical importance of tailoring WEC selection to the local wave climate, finding that the WD device is most profitable in Chile’s high-energy conditions and the PEL device shows enhanced adaptability and superior economic performance in Mexico’s moderate wave climate.
A major innovation of this research is the shift from evaluating mere energy production viability to a holistic assessment of market profitability by evaluating two distinct energy consumption scenarios: household electrification and marine seaweed aquaculture. The investigation yields a pivotal strategic finding for MRE deployment: in most scenarios, especially in La Serena, powering marine seaweed aquaculture offers greater profitability than household energy supply. This outcome highlights a symbiotic deployment pathway whose potential has been significantly underestimated in the existing literature. Furthermore, this study includes a detailed economic viability assessment of BES and HES solutions for managing energy surpluses in these Latin American markets. This analysis not only quantifies monthly energy surpluses but also compares the economic return of BES versus HES across sites and WEC types, concluding that BES often yields higher returns than HES for aquaculture in La Serena. In summary, this work moves beyond foundational technical studies to provide a robust, comparative, and market-oriented framework that directly informs the commercial strategy and policy decisions required to unlock the potential of wave energy in diverse coastal regions.
This study examines the techno-economic feasibility of an MHC of WEC and OWT systems at two potential sites in Latin America. The paper is structured as follows: The Materials and Methods section provides a detailed description of the MHC components and associated by-products, the selected study areas, the market potential for MHC systems, and the methodology employed for the techno-economic assessment. This assessment uses data from several existing markets to evaluate the performance, cost-effectiveness, and the proposed hybrid system’s scalability. The Results and Discussion sections present and analyze the profitability of MHC scenarios, while the Conclusions summarize the findings.

2. Materials and Methods

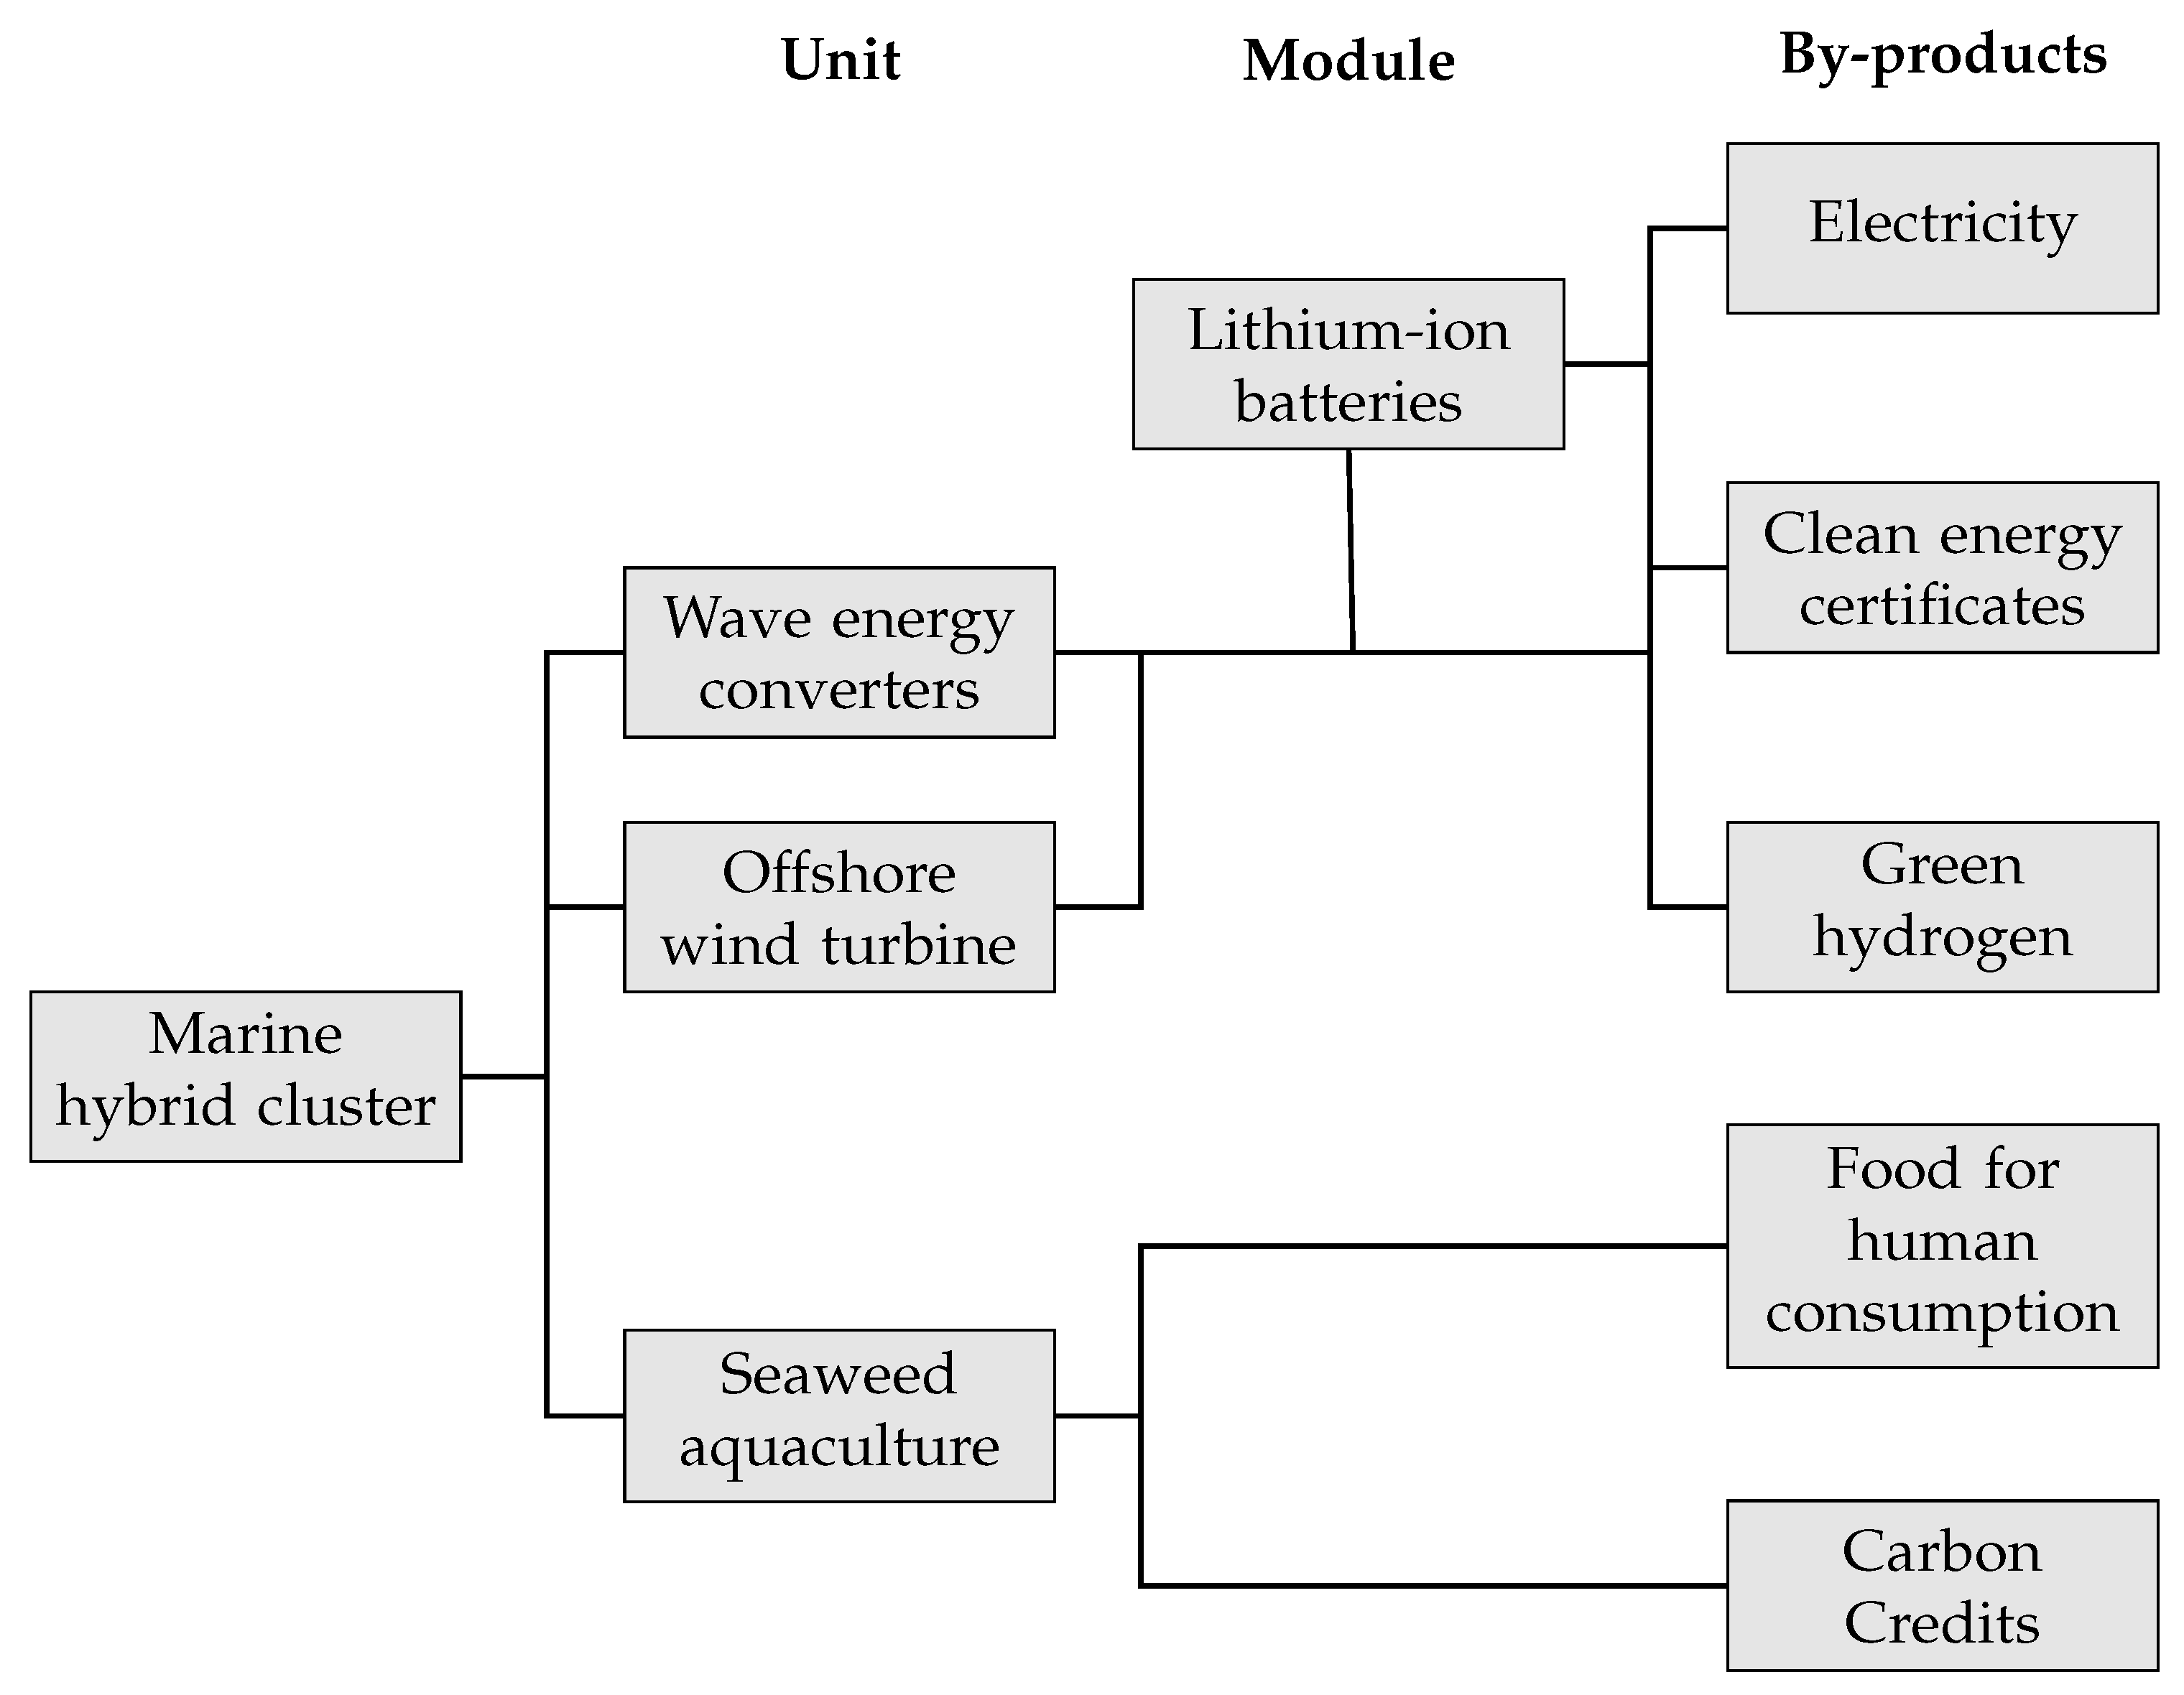
A techno-economic analysis was carried out to assess the feasibility of marine hybrid clusters (MHCs) by evaluating wave and offshore wind energy through Pelamis (PEL) and Wave Dragon (WD) WECs and offshore wind turbines (OWT). The MHC was analyzed for two locations, La Serena, Chile, and Ensenada, Mexico, to compare the influence of the location on the wave and offshore wind potential. The electricity assessment was divided into two scenarios (Figure 1), which were used for aquaculture production or household electrification. In those scenarios, the feasibility of surplus energy was also evaluated through battery energy storage (BES) or hydrogen energy storage (HES).
The analysis considered an interconnected microgrid capable of supplying electricity to 5000 households or 68 hectares of aquaculture production, with a maximum monthly electricity consumption of 620 MWh. The household consumption profile for La Serena was obtained from an electricity company, while the consumption profile for Ensenada was sourced from the Baja California INEGI statistical yearbook [39,40]. The aquaculture consumption profile for both locations was based on information provided by Productos Marinos de las Californias S. de R.L. de C.V., an experienced company specializing in seaweed aquaculture [41].
Numerical simulations were used to evaluate the performance of the WEC and OWT technologies at La Serena and Ensenada. The third-generation wave model SWAN Cycle IV version 41.20AB [42] was used to determine wave characteristics and evaluate wave energy availability and extraction capacity. The SWAN model was forced at the boundaries with directional wave spectra from the IOWAGA wave hindcast [43].
The model was run in a non-stationary two-dimensional mode from 1 January 2008, to 31 December 2018, with hourly output data. The spatial domain was discretized in a regular grid, with a spatial resolution of 0.0025° (approximately 280 m). A logarithmically spaced frequency resolution with 41 frequencies, from 0.04 to 0.7 Hz, and a directional resolution of 5° were used.
The numerical results were validated using wave data from GlobalWavedata satellite data for La Serena and Acoustic Doppler Current Profilers (ADCPs) for Ensenada. Further details of the wave model setup and validation can be found in [11,44].
Based on previous studies evaluating the performance of various wave WECs [11,44], the present study selected the PEL and WD devices for their suitable designs, performance, and maximum wave energy extraction capacity under the specific sea state conditions of the chosen sites. The PEL device was chosen for its efficiency in mild wave conditions, while the WD device was selected for its performance under high-energy sea states. The harvested wave power ( H P ) was computed as
H P = H R ( H s , T p ) · P W E C ( H s , T p )
where H R is the availability matrix, which represents the probability of occurrences of the different sea states, expressed as a fraction of the total number of observations, using the hourly significant wave height ( H s ) and spectral peak period ( T p ), and where P W E C is the power matrix of the PEL and WD devices. Power matrices for PEL and WD were obtained from [45], respectively, and the PWEC for WEC farms was computed as in [11].
The wind power was evaluated using wind speeds from the ERA5 reanalysis [46]. ERA5 has a global coverage from 1940 to date, with a spatial resolution of around 30 km. Here, we used hourly data from 2000 to 2019 from the closest node to each site. Available wind power, P w , was estimated as
P w = 1 2 ρ U 3
where U is wind speed and ρ is air density. The mean extractable wind power P w e x t was computed as
P w e x t = n C p
where n is the wind speed distribution ( U z ) at the turbine height (z), and C p is the wind turbine power curve. Several estimations for P w e x t were obtained using various wind turbines with nominal capacities of 225 kW–3.3 MW. The C p was obtained from the NREL wind power curve archive. U z was estimated from ERA5-wind speed at a height of 100 m, assuming a wind profile power law with an exponent of α equals to 0.14 [47].
U z U 100 = z 100 α
The energy generation profiles were obtained from the energy production of the WECs and OWTs analyzed. Since the WD device at La Serena generated the maximum monthly energy production (close to 875 MWh), it was taken as the reference capacity to size the rest of the scenarios (Table 1).
For the remaining scenarios, a 3.3 MW OWT was combined with a varying number of PEL devices (0.75 MW nominal power, with an installed capacity of 4.5 MW for La Serena and 3.75 MW for Ensenada) or WD devices (7 MW nominal power, corresponded to an installed capacity of 7 MW for La Serena and 21 MW for Ensenada) to meet the energy consumption demands of the microgrid or aquaculture production.
The MHC was designed using the load analysis method, which involved balancing energy consumption and generation profiles to meet the maximum monthly electricity consumption for each scenario. The analysis considered an electricity-generating (synchronous generator) efficiency of 90% and an electricity transmission efficiency of 78% [44]. The MHC systems were conceptualized and designed to assess the feasibility of wave energy deployment, with a key design criterion being the minimization of OWT devices. The term “hybridization” quantifies the contribution of wave energy relative to offshore wind energy within the system [32,34]. In this study, hybridization is defined as the percentage of energy supplied by WECs to the MHC. Load analysis was also used to calculate the monthly energy surpluses for energy storage, with BES and HES, considering the power balance between the electricity generation and power demand profiles.
The profitability of the MHC was analyzed by adapting the methodology of Vega and Michaelis [48]. Capital (CapEx) and operating (OpEx) expenditures for each MHC module were adjusted and updated to the value of the USD in 2024 based on similar projects and economic data available in the literature. A projected useful life of 20 years was considered for the project, with expenses corresponding to cash flow from CapEx and OpEx and revenues from by-product sales. Specific employee benefits and taxes for Chile and Mexico were also considered to generate an accurate cash flow model. The CapEx of WEC farms was calculated from Astariz and Iglesias [14]. The impacts of operation and maintenance aspects were considered, and the OpEx of WECs was defined as 8% of CapEx, as suggested in several studies [49,50].
The CapEx of the PEL and WD devices was calculated by considering and adapting the costs of pre-operation, individual devices, and their installation from [14,51], the mooring systems from [51,52], the underwater cables from [53], the electricity substation from [14], underground cables from [54], and decommissioning from [55]. The CapEx and OpEx of the OWT module were adapted from the Annual Technology Baseline of the National Renewable Energy Laboratory (NREL) [56].
For each scenario, the cluster cost for its 20-year life cycle was estimated through LCoE, as in the work of [57]. A cash flow model was used, and financial indicators were calculated to provide a first-order approximation of the profitability of the MHC in each scenario. The cash flow model (Figure 2) includes the income generated by the sale of the by-products (electricity, clean energy certificates, dried seaweed, and carbon credits) and the expenses associated with the operating and financial costs, depreciation, and taxes. The financial analysis included the net present value (NPV) and the Internal Rate of Return (IRR) economic indicators.
The selling price of the electricity produced was strategically determined to ensure the project’s economic feasibility and market competitiveness within the renewable energy sector. Electricity distributed within the microgrid was priced at approximately 0.8 USD/kWh, whereas electricity sold to the grid commanded a price of 0.22 USD/kWh. These distinct pricing structures highlight the critical balance between cost-effectiveness and market competitiveness necessary for widespread renewable energy adoption [58,59,60,61]. Furthermore, the project leveraged renewable energy certificates, valued at 7 USD/MWh, underscoring the significant role of policy mechanisms in incentivizing and promoting renewable energy generation.
Regarding seaweed cultivation, the annual seaweed crop of one effective hectare (or 10,000 m2) was taken as a substantial dry-weight production of 63.6 tons per hectare per year. The seaweed crop also plays a crucial role in carbon sequestration, with a carbon sequestration rate of 19 tons per hectare per year, assuming a 30% carbon content [62]. This highlights the environmental significance of seaweed cultivation as a potential solution for mitigating carbon emissions.
The energy consumption for seaweed cultivation was estimated to be 85.1 MWh ha−1 year−1, underscoring the energy-intensive nature of this form of aquaculture. The sales revenue from Ulva sp. seaweed for human consumption, set at 10,000 USD/ton, indicates the economic value and market demand for this sustainable and nutritious food source. The pricing of carbon credits, at 12 USD/ton, emphasizes the recognition and economic potential of carbon sequestration through seaweed cultivation, promoting sustainable practices and providing financial incentives for climate change mitigation [23].
The MHC system is sized based on the minimum seasonal generation and the maximum monthly energy demand. The economic feasibility of utilizing surplus energy is assessed through two storage technologies: batteries for grid sales and green hydrogen for commercial use. An energy storage system was integrated to manage the intermittent nature of the renewable energy output of the MHC system. It allows surplus electricity to be stored and used later, when demand is high or generation is low. To mitigate the high costs and inherent efficiency losses of storage systems, our main objective is to optimize the hybridization of WEC and OWT. This strategy minimizes the system’s reliance on storage to satisfy the electricity demand of aquaculture farms and household consumption. A BES based on lithium-ion batteries with a storage efficiency 90% was selected, as it provides an effective solution to store excess electricity generated by the MHC. The BES was sized and modeled using the methodology detailed in a previous study [63]. A CapEx of 2800 USD/kW and an OpEx of 70 USD/kW per year ensures a reliable electricity supply during periods of low generation or high demand [64]. The HES, based on water electrolysis where hydrogen is produced by water splitting using an alkaline electrolyzer, has an efficiency of 68%, the CapEx is 1,460 USD/kW, and the OpEx is 21.9 USD/kW per year [65,66]. The selling price of green hydrogen was set at 8 USD/kg to compare the revenue in the different MHC scenarios [67].
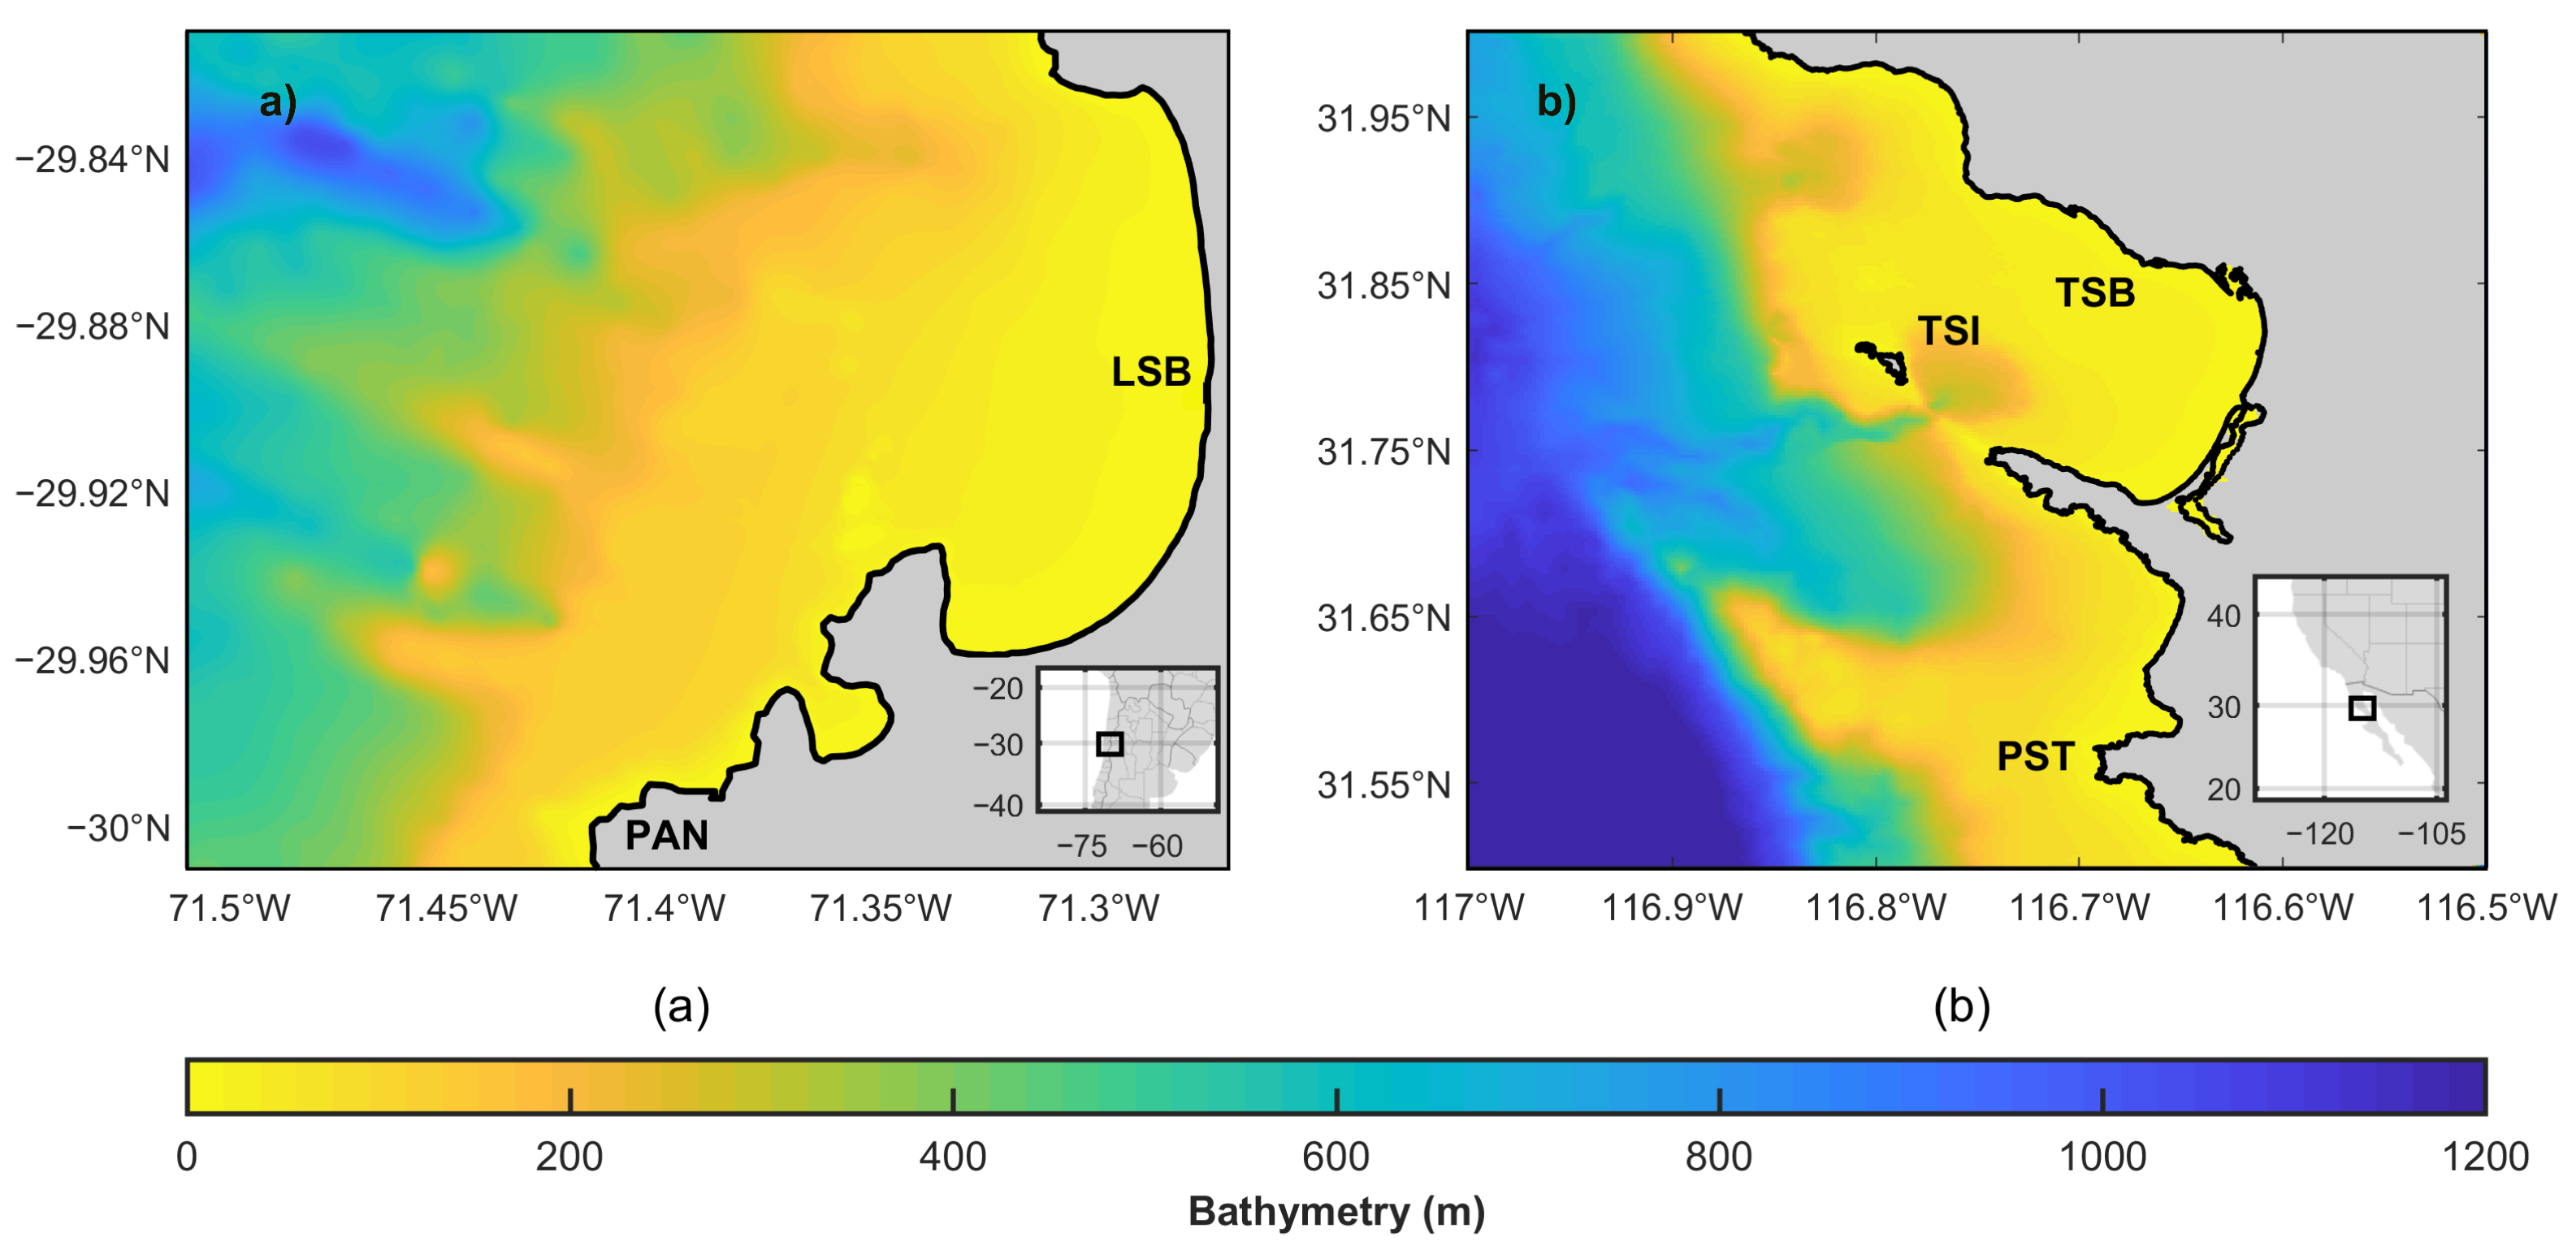
The analysis focuses on two study sites located on the Pacific coast (Figure 3). La Serena in northern Chile, and Ensenada on the east of the Baja California peninsula, in Mexico. The two coastal locations were selected based on their dual potential of sufficient mean annual wave power availability and significant local energy needs. Both regions face challenges in meeting local electricity demand due to their isolation from the national power grid, constraining local energy security and industrial development [11,20,30]. Harnessing wave energy through WEC deployments can offer a direct solution to mitigate electricity shortages, enhance energy resilience, foster the growth of new markets in the blue economy, and contribute to the sustainable development of their coastal communities.
The wave climate at both sites is dominated by simultaneously coexisting high-energy extratropical and low-energy local wave systems [11,68]. La Serena, in the southern hemisphere, is exposed to energetic swell propagating from the extratropical South Pacific region in the southern winter (June–August) and from the North Pacific region in the summer months (December–January) [69]. The most energetic swell reaching Ensenada in the northern hemisphere comes from the extratropical region of the North Pacific and from the boreal winter and summer in the South Pacific, respectively. Storms associated with the subtropical low-level coastal atmospheric jets and extratropical winds occur at both sites. At both sites, storms are related to low-level subtropical coastal atmospheric jets and extratropical winds.
Ensenada has moderate mean wave power availability ( P ¯ ), and an annual mean close to 10 kW/m [11]. There is marked seasonal variability, with a maximum in the boreal winter (16 kW/m) and a minimum in the boreal summer (5.3 kW/m) [11]. La Serena has a high P ¯ , close to 24 kW/m [44]. The intra- and inter-annual variability of the resource is medium-moderate, with a maximum P ¯ in the austral winter (27 kW/m) and a minimum in the austral summer (19.5 kW/m). For the analyses in this work, the small communities of Panul (La Serena) and Punta Santo Tomás (Ensenada) were selected (PAN and PST in Figure 2, respectively), as they were identified as wave energy availability hotspots in previous works [44]. The mean annual offshore wind speed at Ensenada is almost 3.5 m/s, predominantly from the northwest, with a marked seasonality and higher speeds in spring-summer [70]. La Serena is one of the most suitable areas for offshore wind exploitation worldwide, with an average annual wind power density of 730 W m−2 and a capacity factor of 45% [71]. It has marked seasonality, with maximum wind speeds in November (12.8 m/s) and minimums in May (1.15 m/s).

3. Results

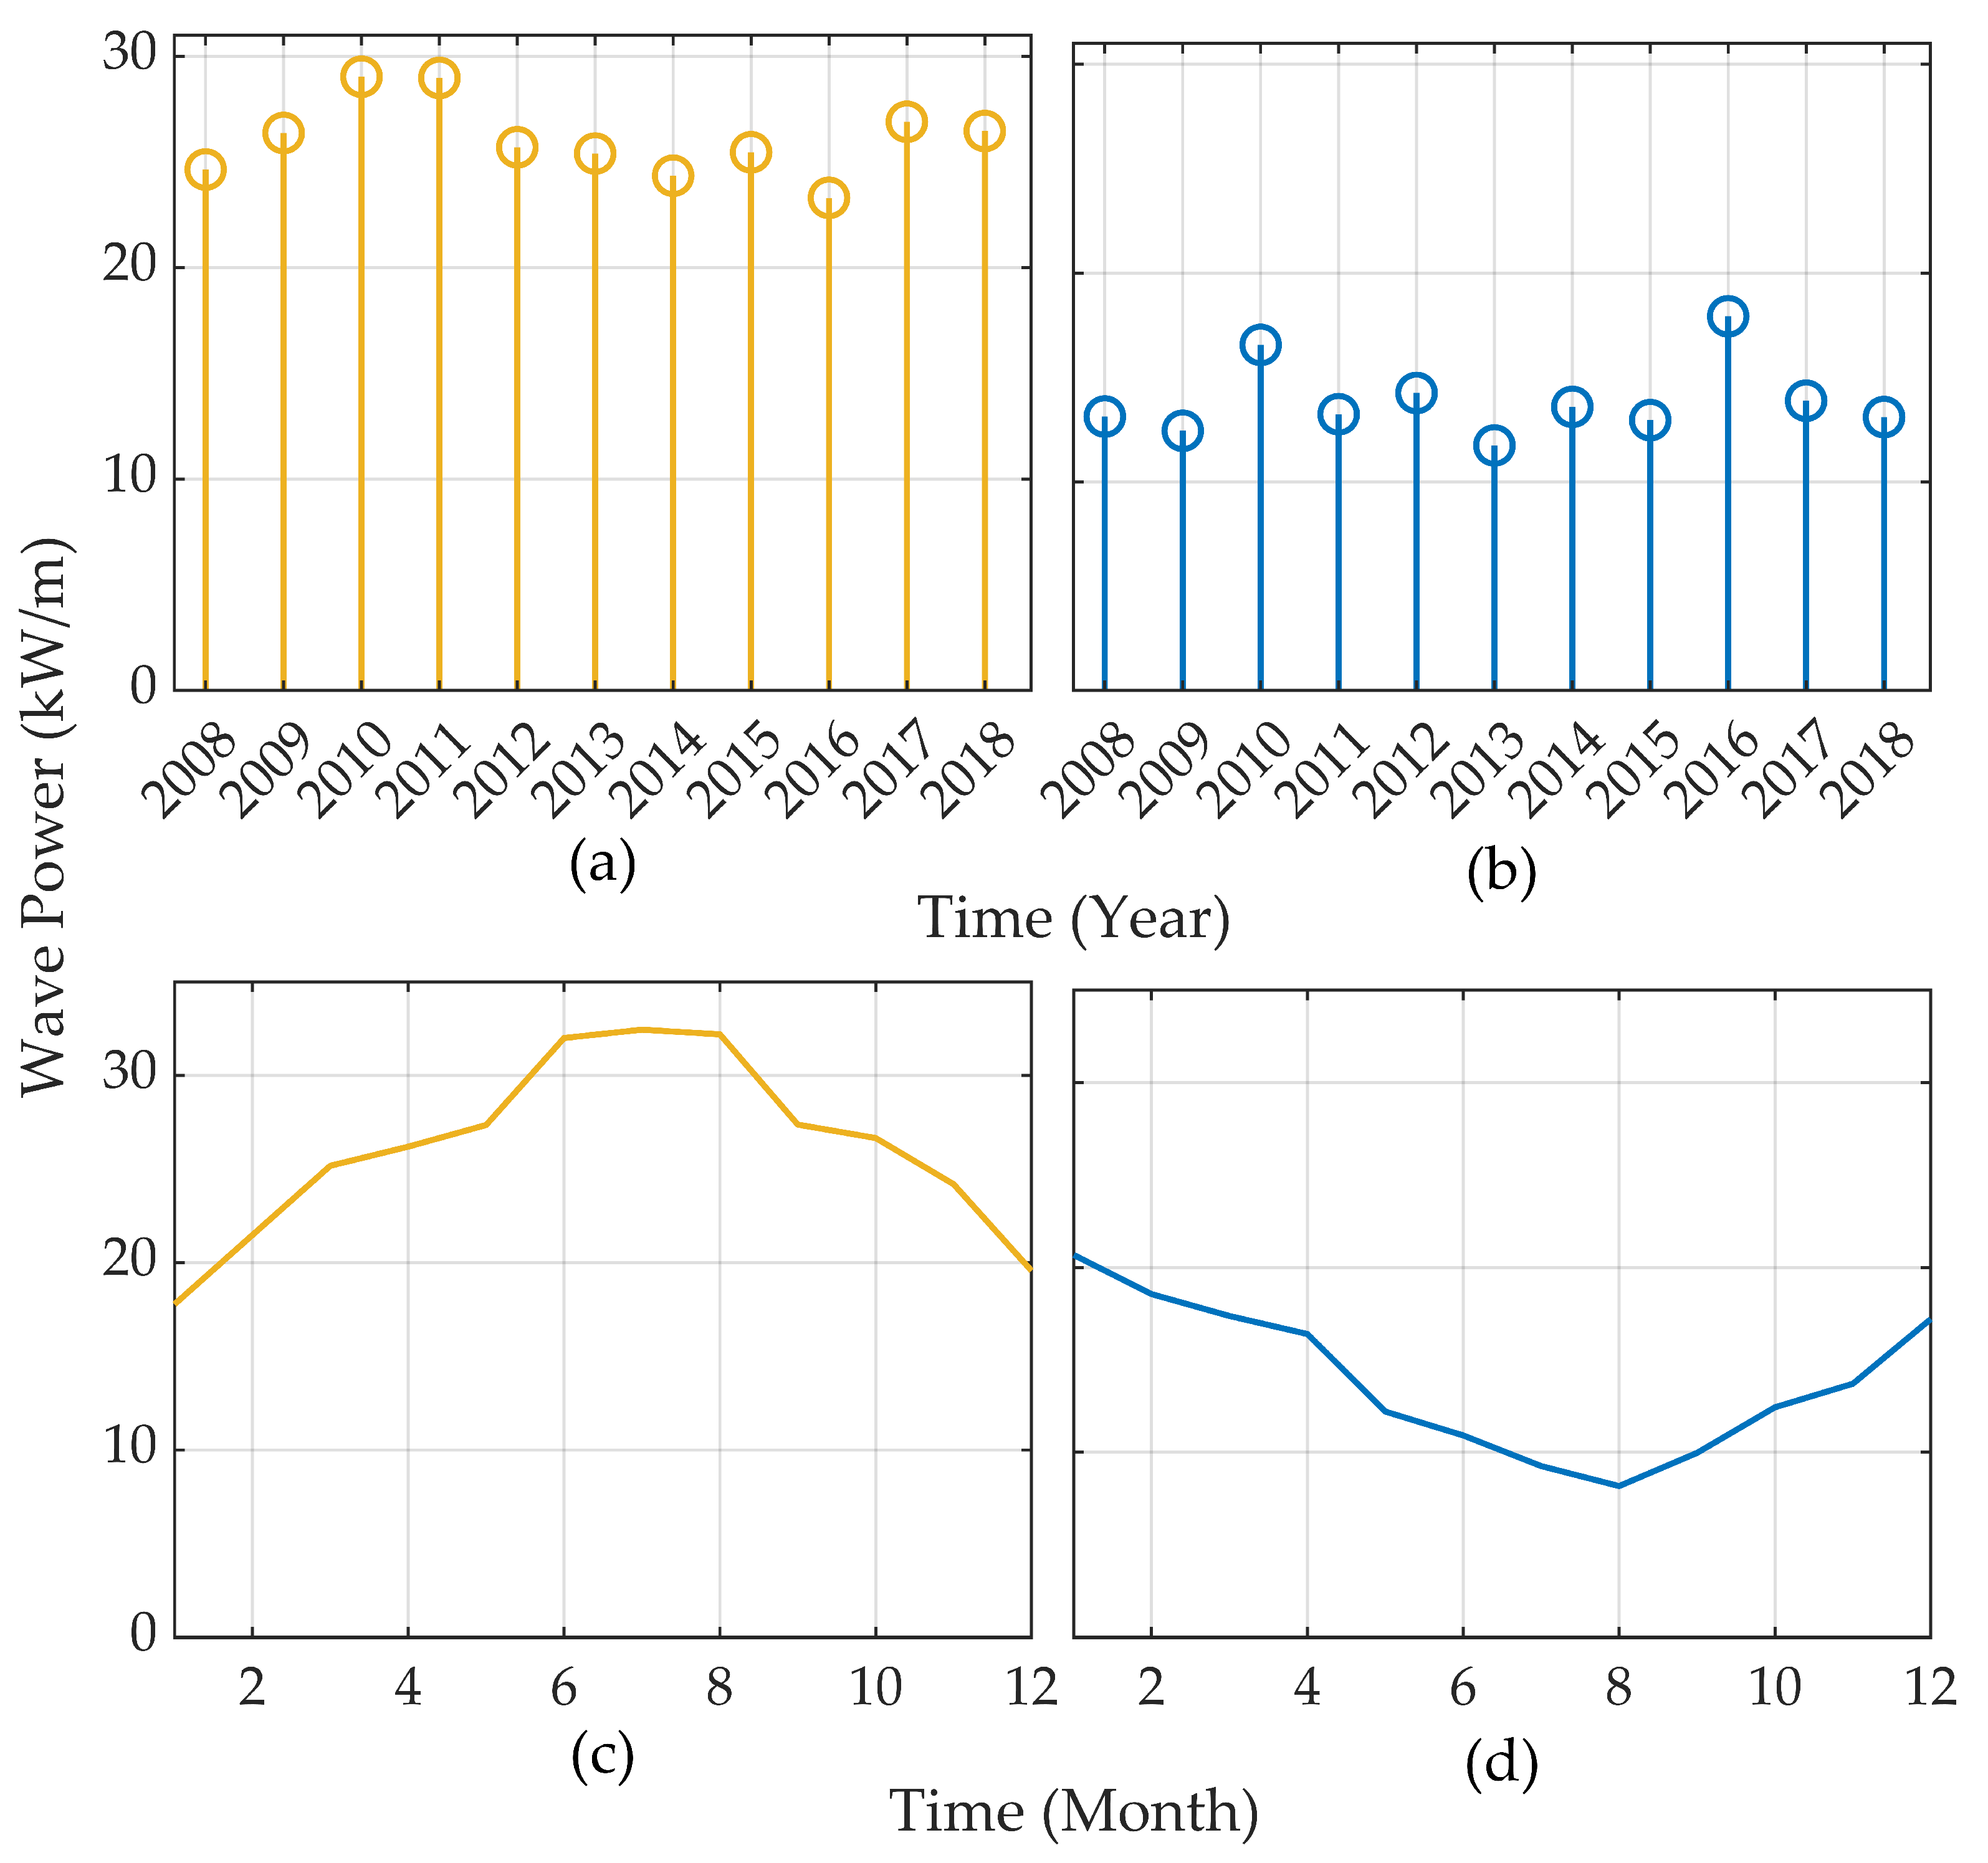
The inter- and intra-annual mean wave power ( P ¯ ) at the sites chosen is shown in Figure 4. A higher intra-annual (Figure 4c,d) than inter-annual (Figure 4a,b) P ¯ variability is observed at both sites. The influence of extratropical generation zone geolocations generates a high mean annual P ¯ availability of 26.05 kW/m at La Serena (Figure 4a), 88% higher than at Ensenada, with a moderate P ¯ availability of 13.88 kW/m (Figure 4b). A marked seasonal trend, higher in Ensenada than in La Serena, is observed with a maximum P ¯ during winter and a minimum during summer for both sites. The month with the most P ¯ in La Serena is July (32.44 kW/m, Figure 4c), and in Ensenada, January Boreal (20.68 kW/m, Figure 4d). The month with the lowest at La Serena is January Austral (17.78 kW/m, Figure 4c), and at Ensenada, August Boreal (8.17 kW/m, Figure 4d). The spring and autumn seasons have an intermediate P ¯ availability between winter and summer, with spring being more energetic than autumn.
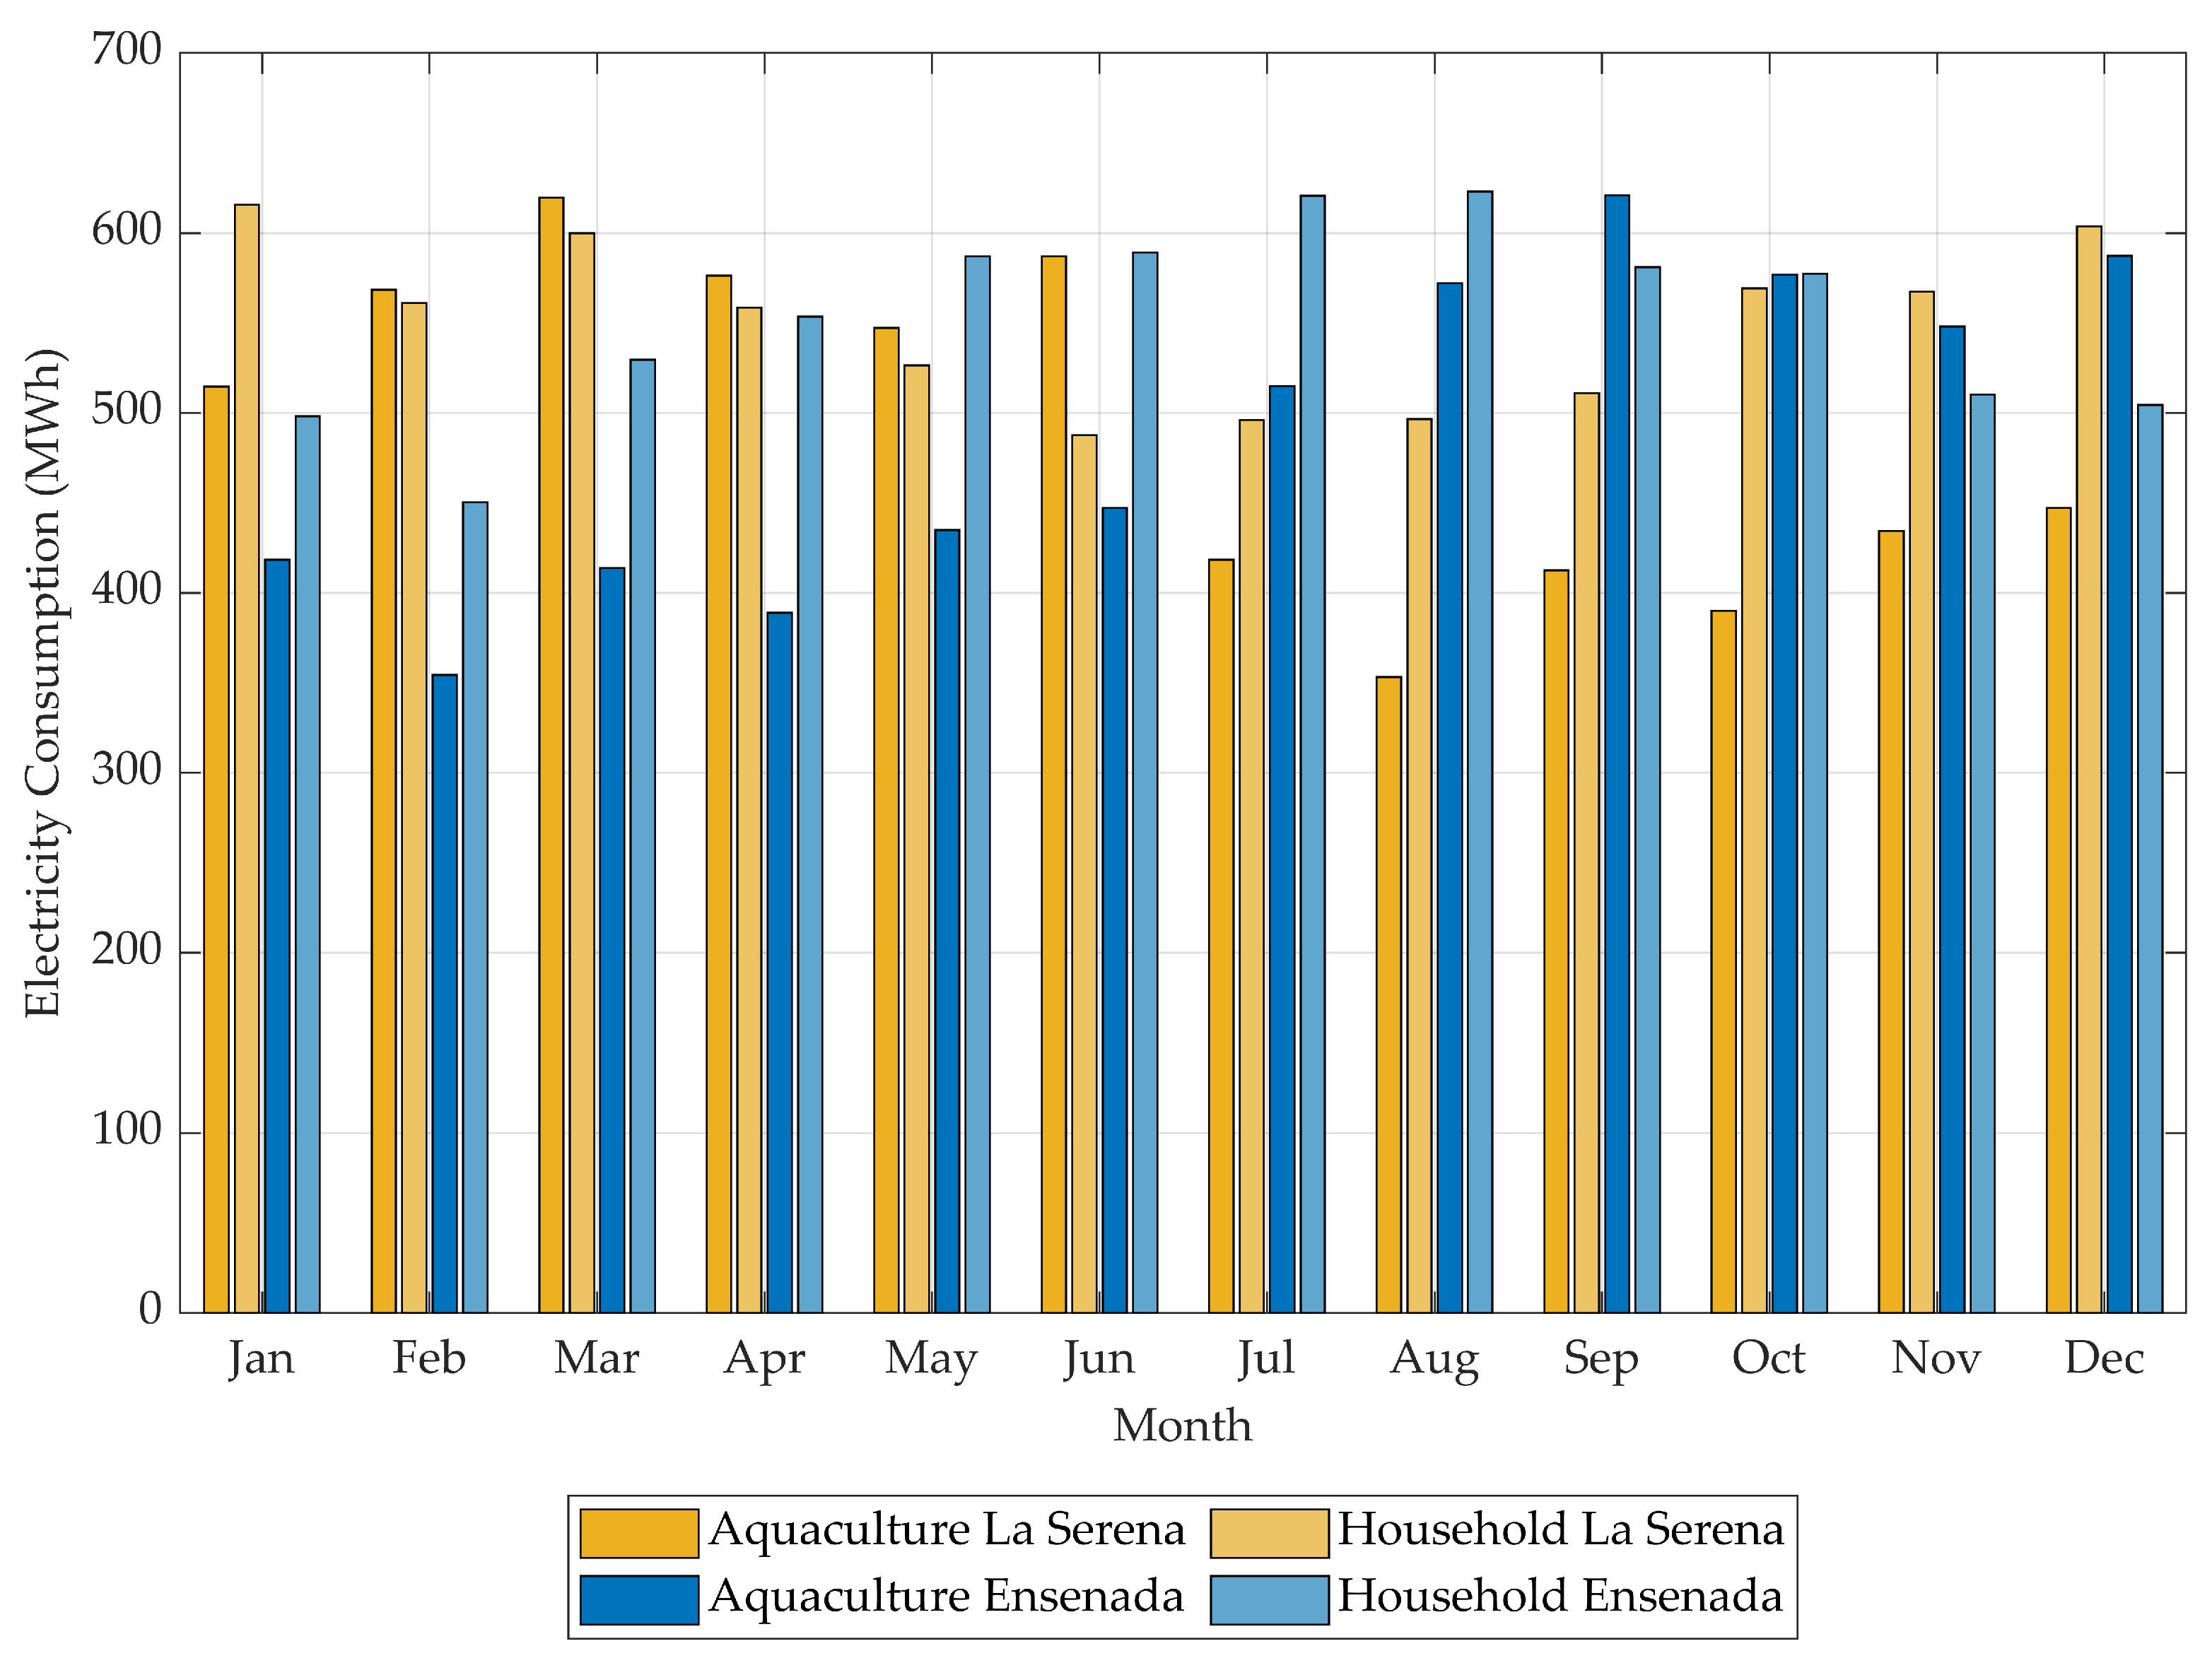
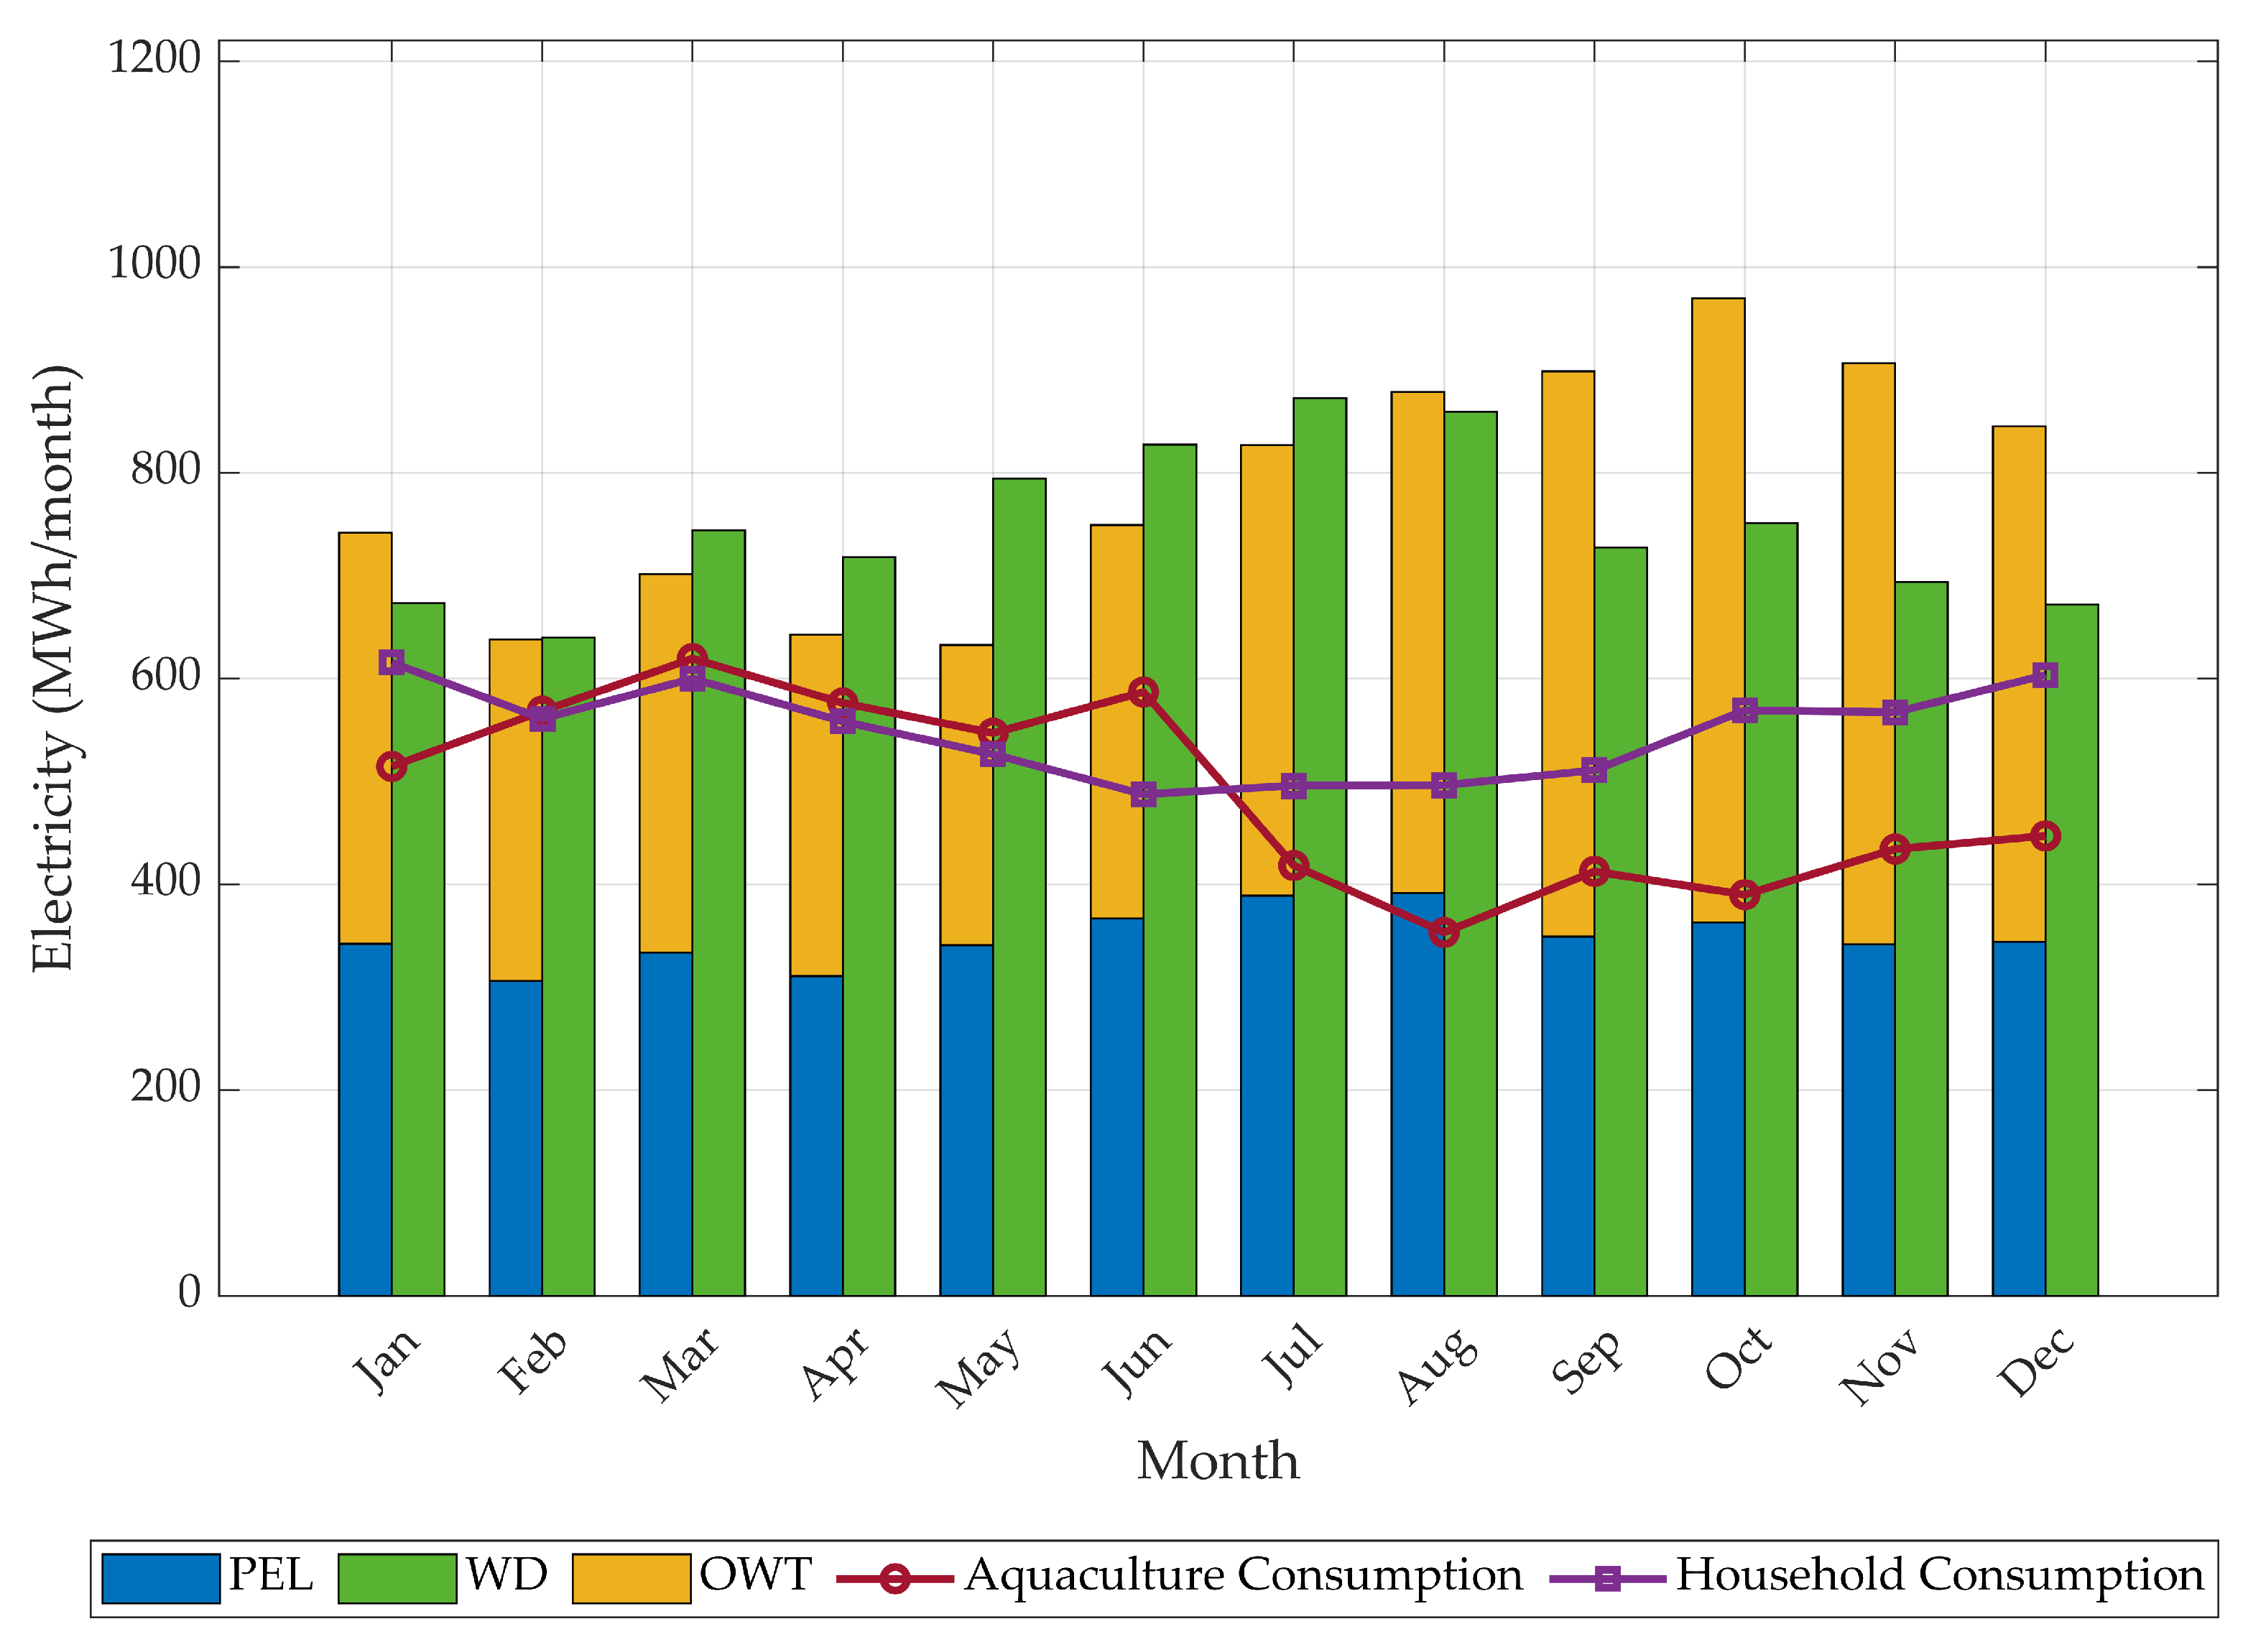
The monthly electricity consumption of households and aquaculture in La Serena and Ensenada (Figure 5) shows that households demand more electricity in summer than in winter. In contrast, for aquaculture, the electricity consumption profiles show that there is more electricity consumption in the autumn, and the lowest is in winter. The average annual electricity consumption of households is also higher than for aquaculture at both sites, while the average monthly variability is higher in aquaculture consumption.
The design parameters for MHC scenarios are summarized in Table 1. It is observed that La Serena requires less hybridization than Ensenada to satisfy the energy demands of both aquaculture and household scenarios. Even some La Serena scenarios with a single WD device demonstrate self-sufficiency and unnecessary hybridization requirements. Conversely, all scenarios in Ensenada necessitate a higher installed WEC capacity relative to OWT capacity, with hybridization levels approaching 60%. All hybrid WEC-OWT system configurations consistently show a greater demand for PEL than WD devices. This disparity is more pronounced in La Serena, where a significantly higher number of PEL devices are required, while in Ensenada, the systems tend to incorporate a relatively higher number of WD devices.
Power generation of the WEC and OWT devices in Ensenada and La Serena, based on the MHC design, is determined through energy and power balance analysis. Figure 6 presents the energy balance of the MHC scenarios at La Serena, detailing its electricity consumption and generation. For PEL devices, the maximum monthly generation reaches 391 MWh (65.2 MWh per device). However, the highest annual energy production comes from the WD devices at La Serena, which generate 8990 MWh, with a single device capable of producing a maximum of 875 MWh. The monthly electricity production for OWT peaks at 607 MWh during the spring, while the lowest production is recorded in the fall. The maximum monthly electricity consumption for aquaculture and household scenarios occurs during the austral autumn and summer, respectively, coinciding with periods of minimal energy generation from the WEC-OWT hybrid system. To meet the electricity demands of these scenarios, PEL devices require hybridization with OWT. In contrast, a single WD demonstrates self-sufficiency, providing 100% of the electricity required throughout the year. For both scenarios analyzed, the maximum monthly electricity generation from hybrid PEL-OWT systems occurs during the austral spring, while that from WD devices peaks in the austral winter. The OWT constitutes the largest contribution to the MHC’s energy supply, fulfilling 51% and 75% of the annual electricity demand in the aquaculture and household-PEL scenarios, respectively.
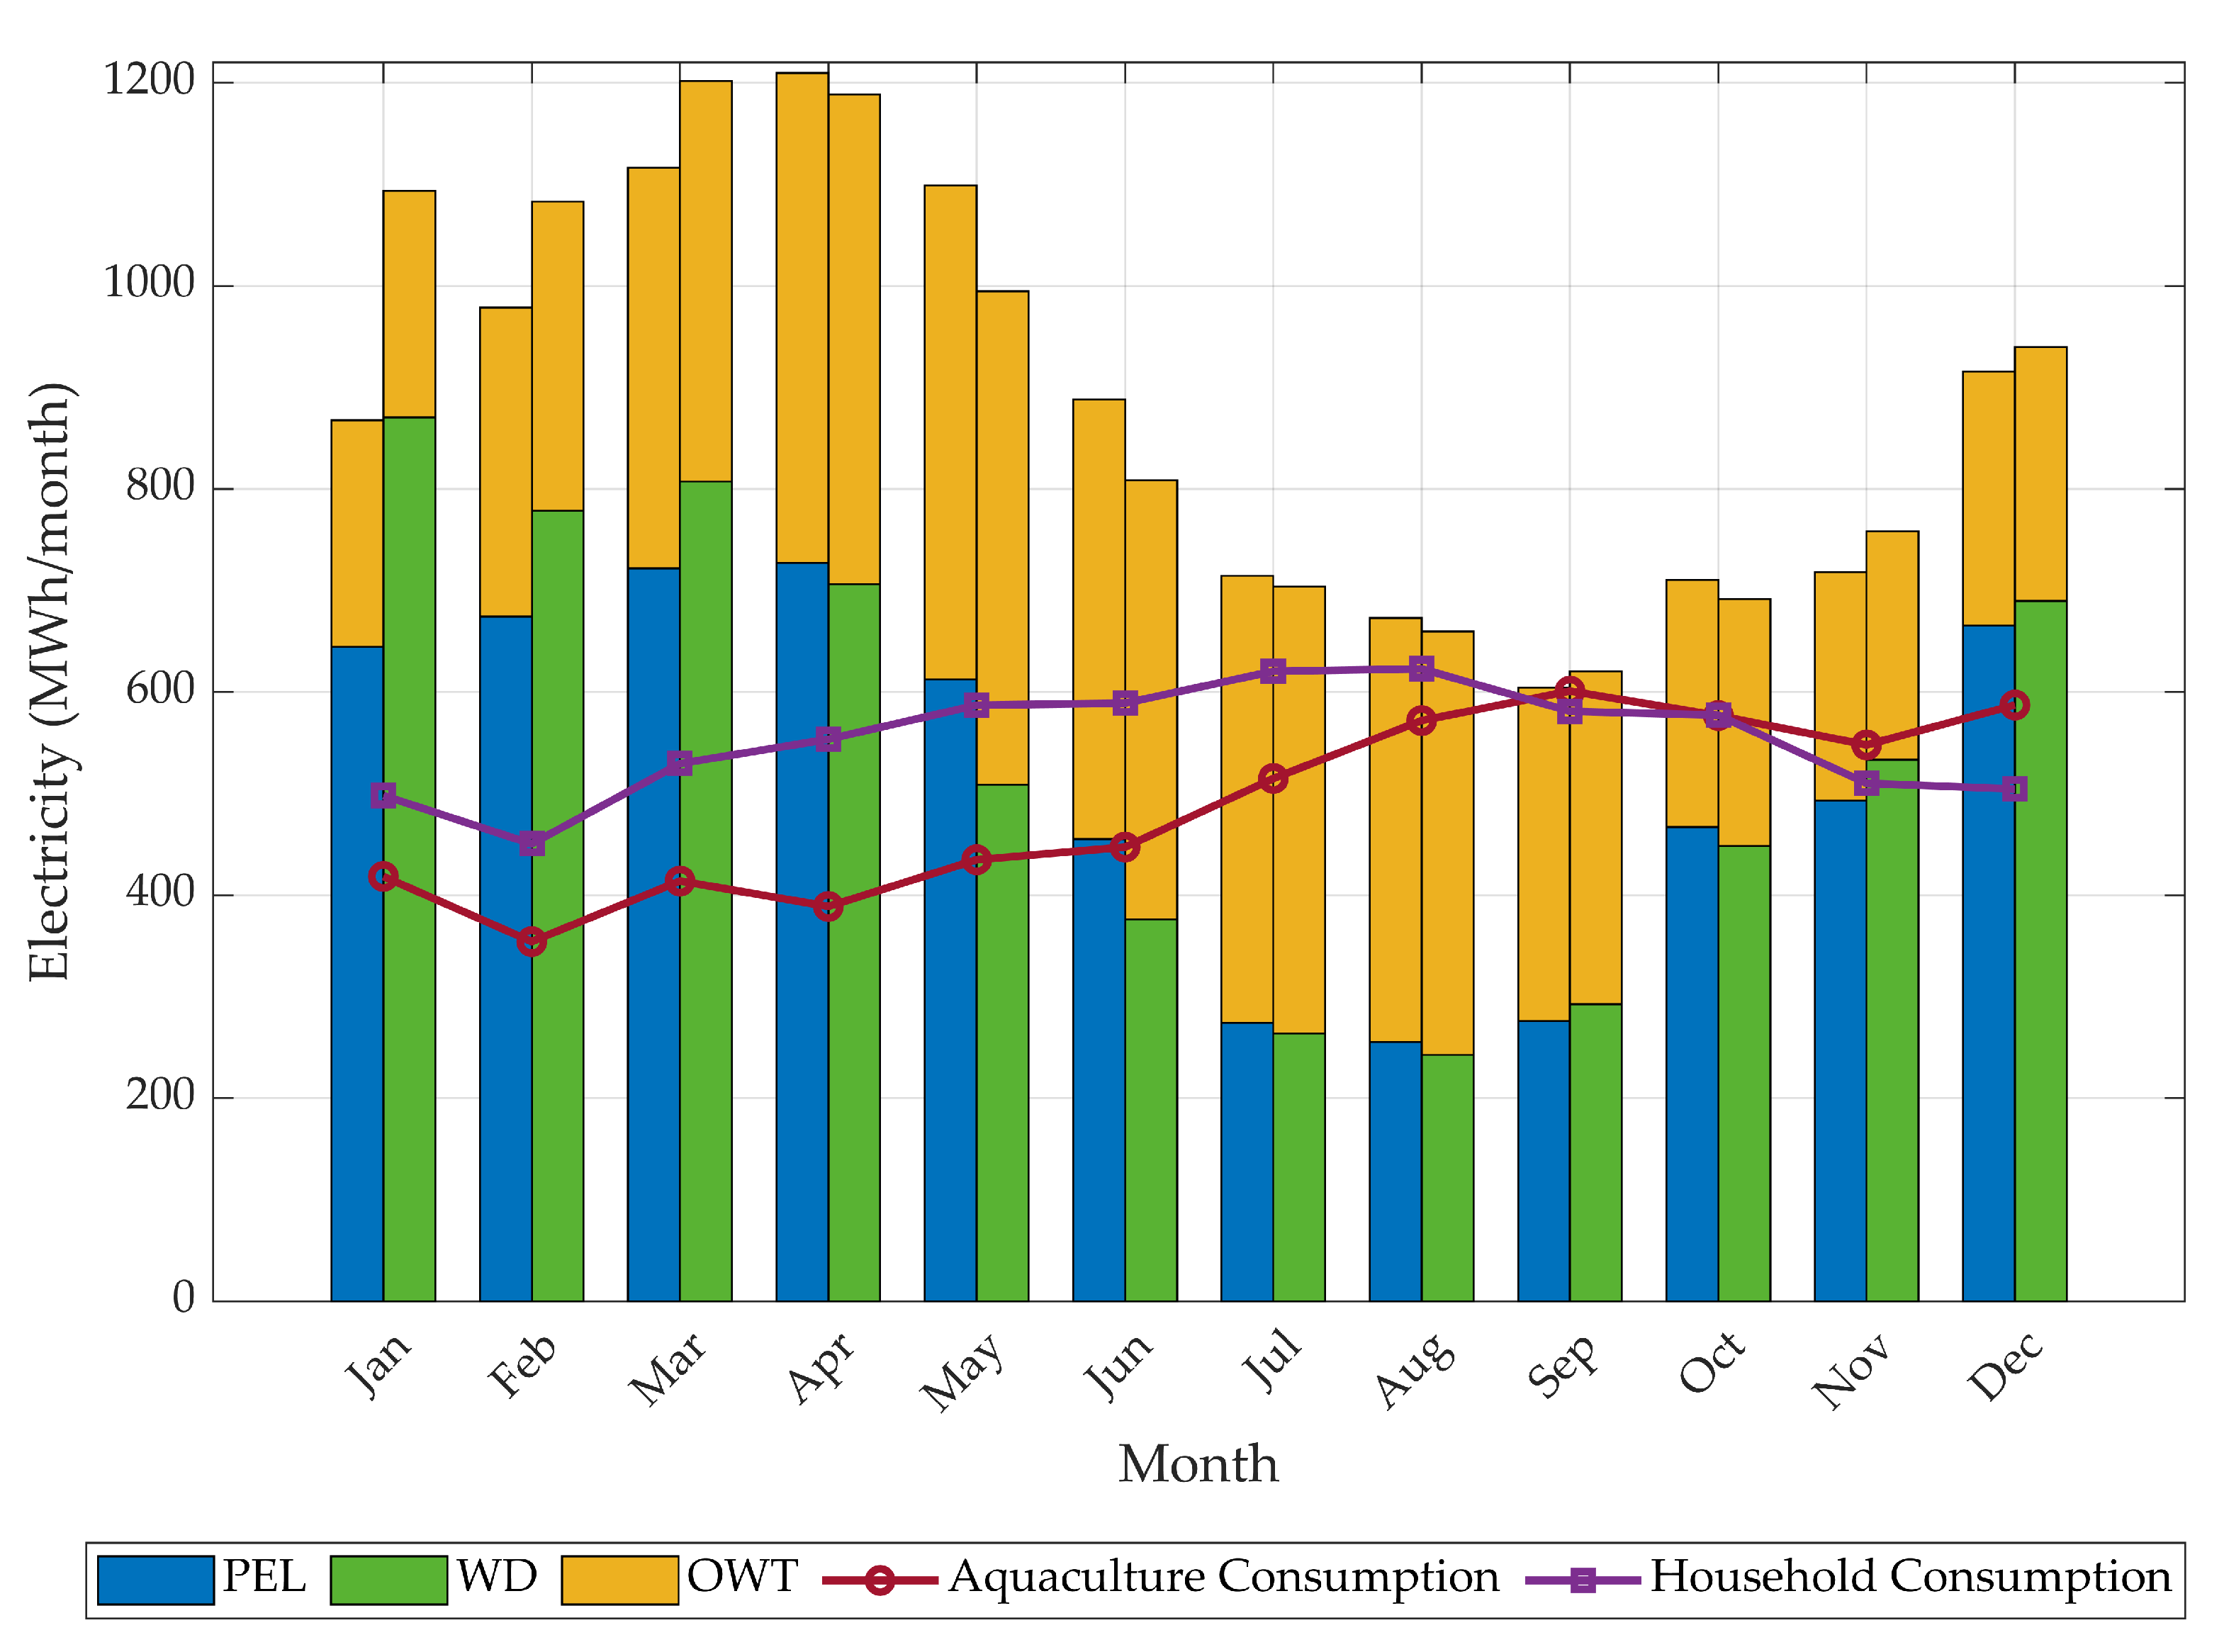
The energy balance between electricity consumption and generation for the MHC at Ensenada is presented in Figure 7. The maximum monthly generation for PEL devices is found at Ensenada, equal to 730 MWh, which breaks down to 146 MWh per device. The maximum output for a single WD device is approximately 292 MWh per month. Meanwhile, the OWT monthly electricity production peaks in the spring at 475 MWh, with the lowest production occurring in the fall. The scenarios at Ensenada show an inverse trend, with peak electricity consumption during the boreal summer–autumn months coinciding with the lowest energy generation. There is surplus energy generation during the boreal winter and spring for both aquaculture and household scenarios. In all scenarios, the WEC-OWT hybrid system achieves maximum electricity generation during the boreal spring months. The WECs provide the highest contribution to electricity generation in the hybrid system at Ensenada. The OWT-WEC hybrid system with five PEL devices meets 58.4% of the annual electricity demand for both scenarios. In contrast, hybrid systems with three WD devices supply 58.4% of the annual electricity demand for aquaculture and 51% for household scenarios. WEC farms at Ensenada require more PEL devices than WD devices.
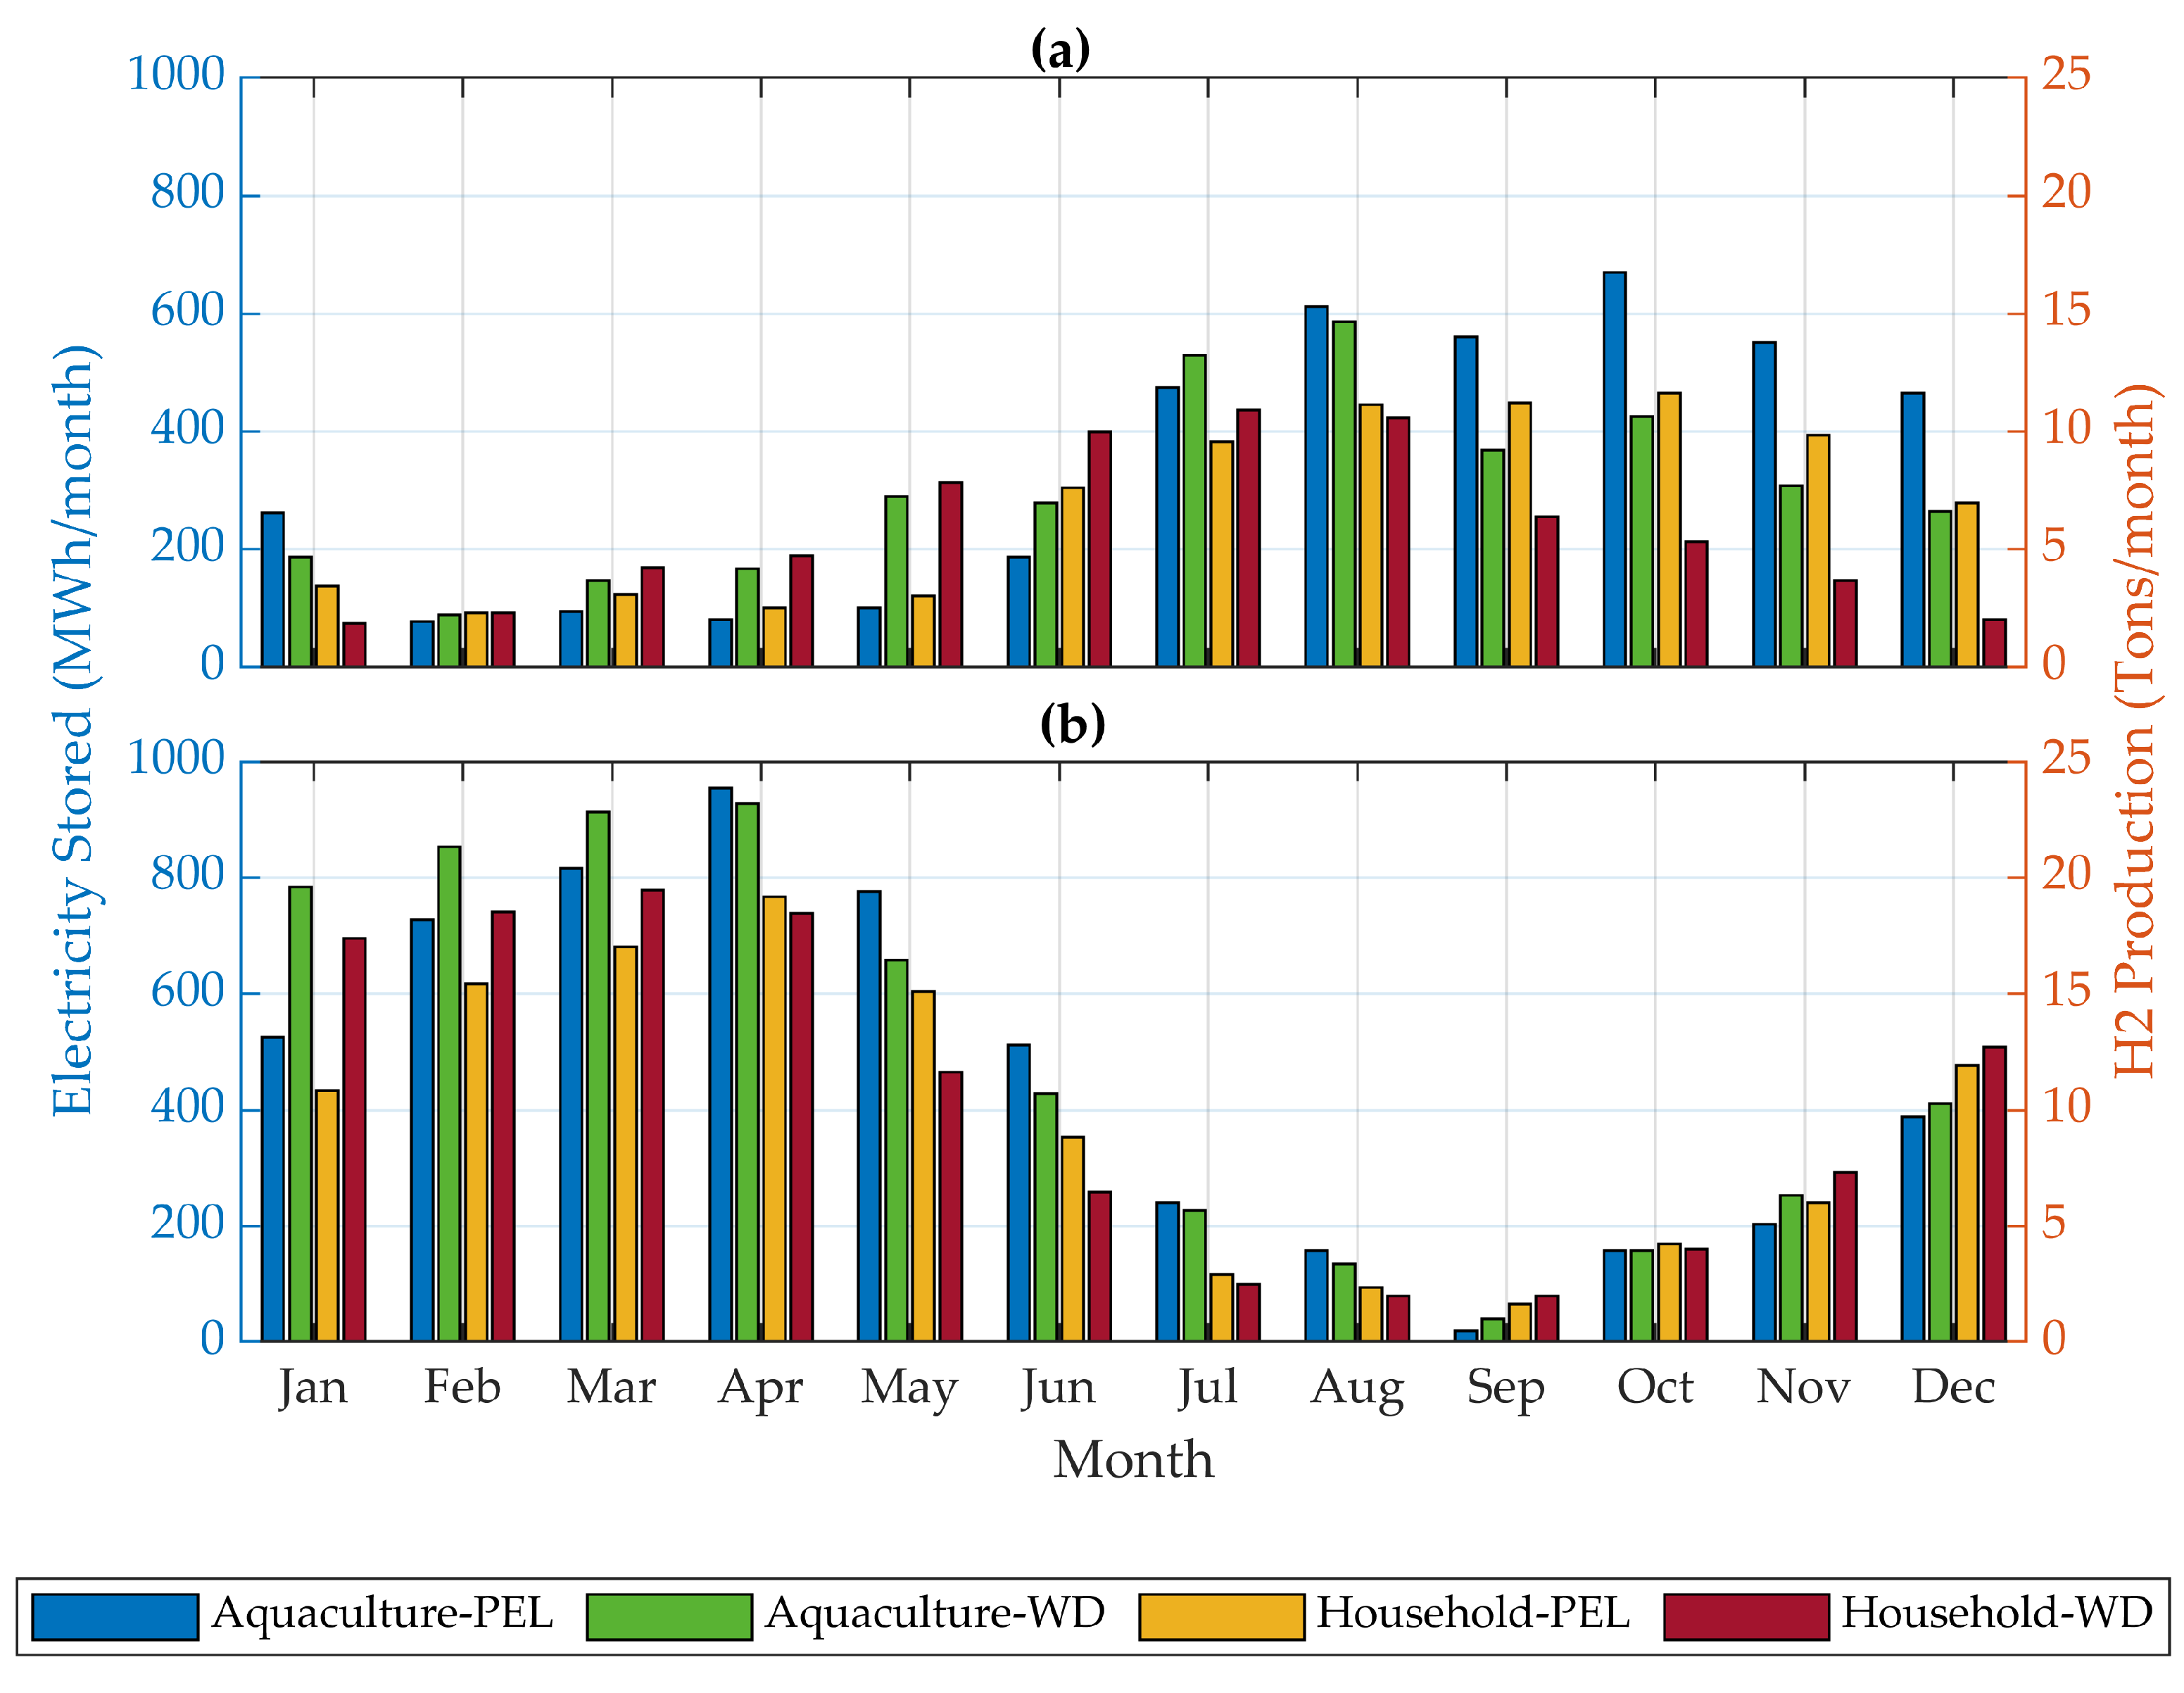
Figure 8 illustrates the energy surpluses available for storage in battery energy storage (BES) and hydrogen energy storage (HES) systems. A marked intra-annual variability in energy surplus can be observed, with this fluctuation being more pronounced in Ensenada than in La Serena. During the spring, surpluses in Ensenada (Figure 8b) reach up to 980 MWh/month for BES and approximately 22 Tons/month for HES. In contrast, La Serena (Figure 8a) exhibits lower spring surpluses, with BES reaching 600 MWh/month and HES near 15.1 × 10⁴ Tons/month. Conversely, during the summer and autumn, surpluses significantly decline. For Ensenada, BES surpluses drop to approximately 50 MWh/month, and HES surpluses decrease to about 1 Tons/month. Similarly, in La Serena, BES surpluses fall to around 80 MWh/month, while HES surpluses are close to 2 Tons/month.
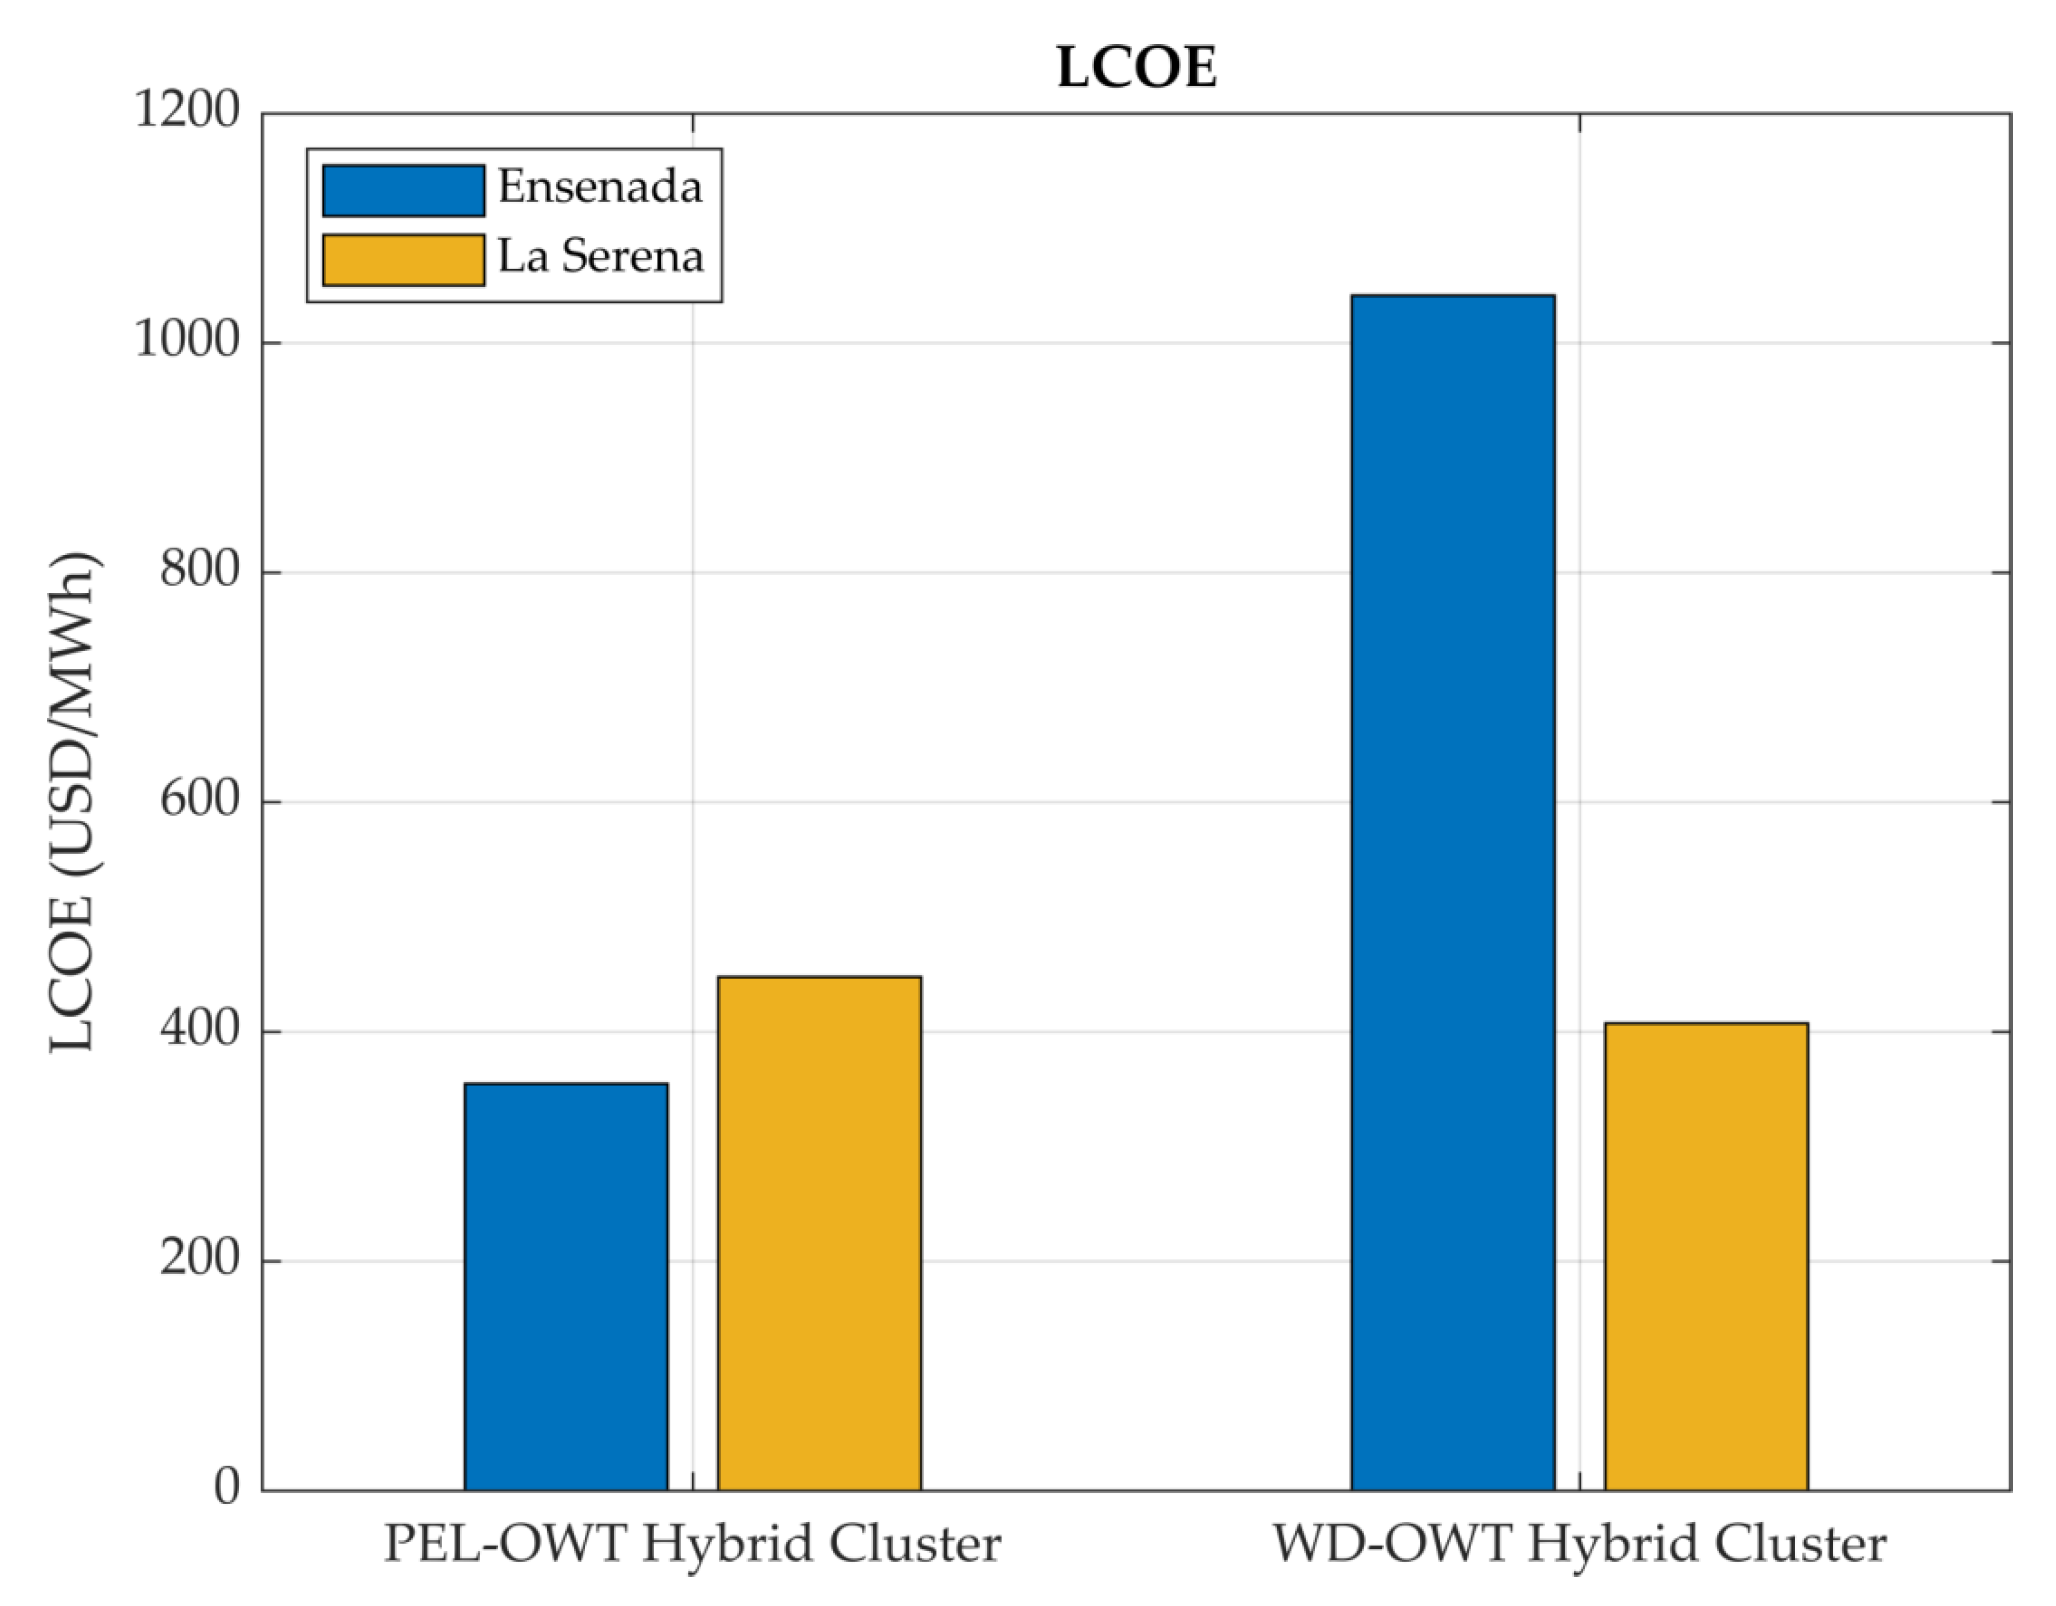
The levelized costs of energy (LCoEs) generated by the WEC-OWT hybrid systems are presented in Figure 9. The LCoE exhibits a clear dependence on the adaptive flexibility of the WEC-OWT hybrid systems on the climatic conditions of each specific deployment site. While in La Serena, the LCoE values are slightly similar, in Ensenada, they diverge significantly. The PEL-OWT system demonstrated superior performance in Ensenada, yielding the lowest LCoE of 390 USD/MWh, lower than the 420 USD/MWh achieved in La Serena. However, the WD-OWT systems exhibit a more significant LCoE variation between sites. The WD hybrid system at La Serena exhibits a more favorable production cost of energy (400 USD/MWh) compared to Ensenada (1020 USD/MWh), reflecting site-specific differences in performance and wave energy potential.
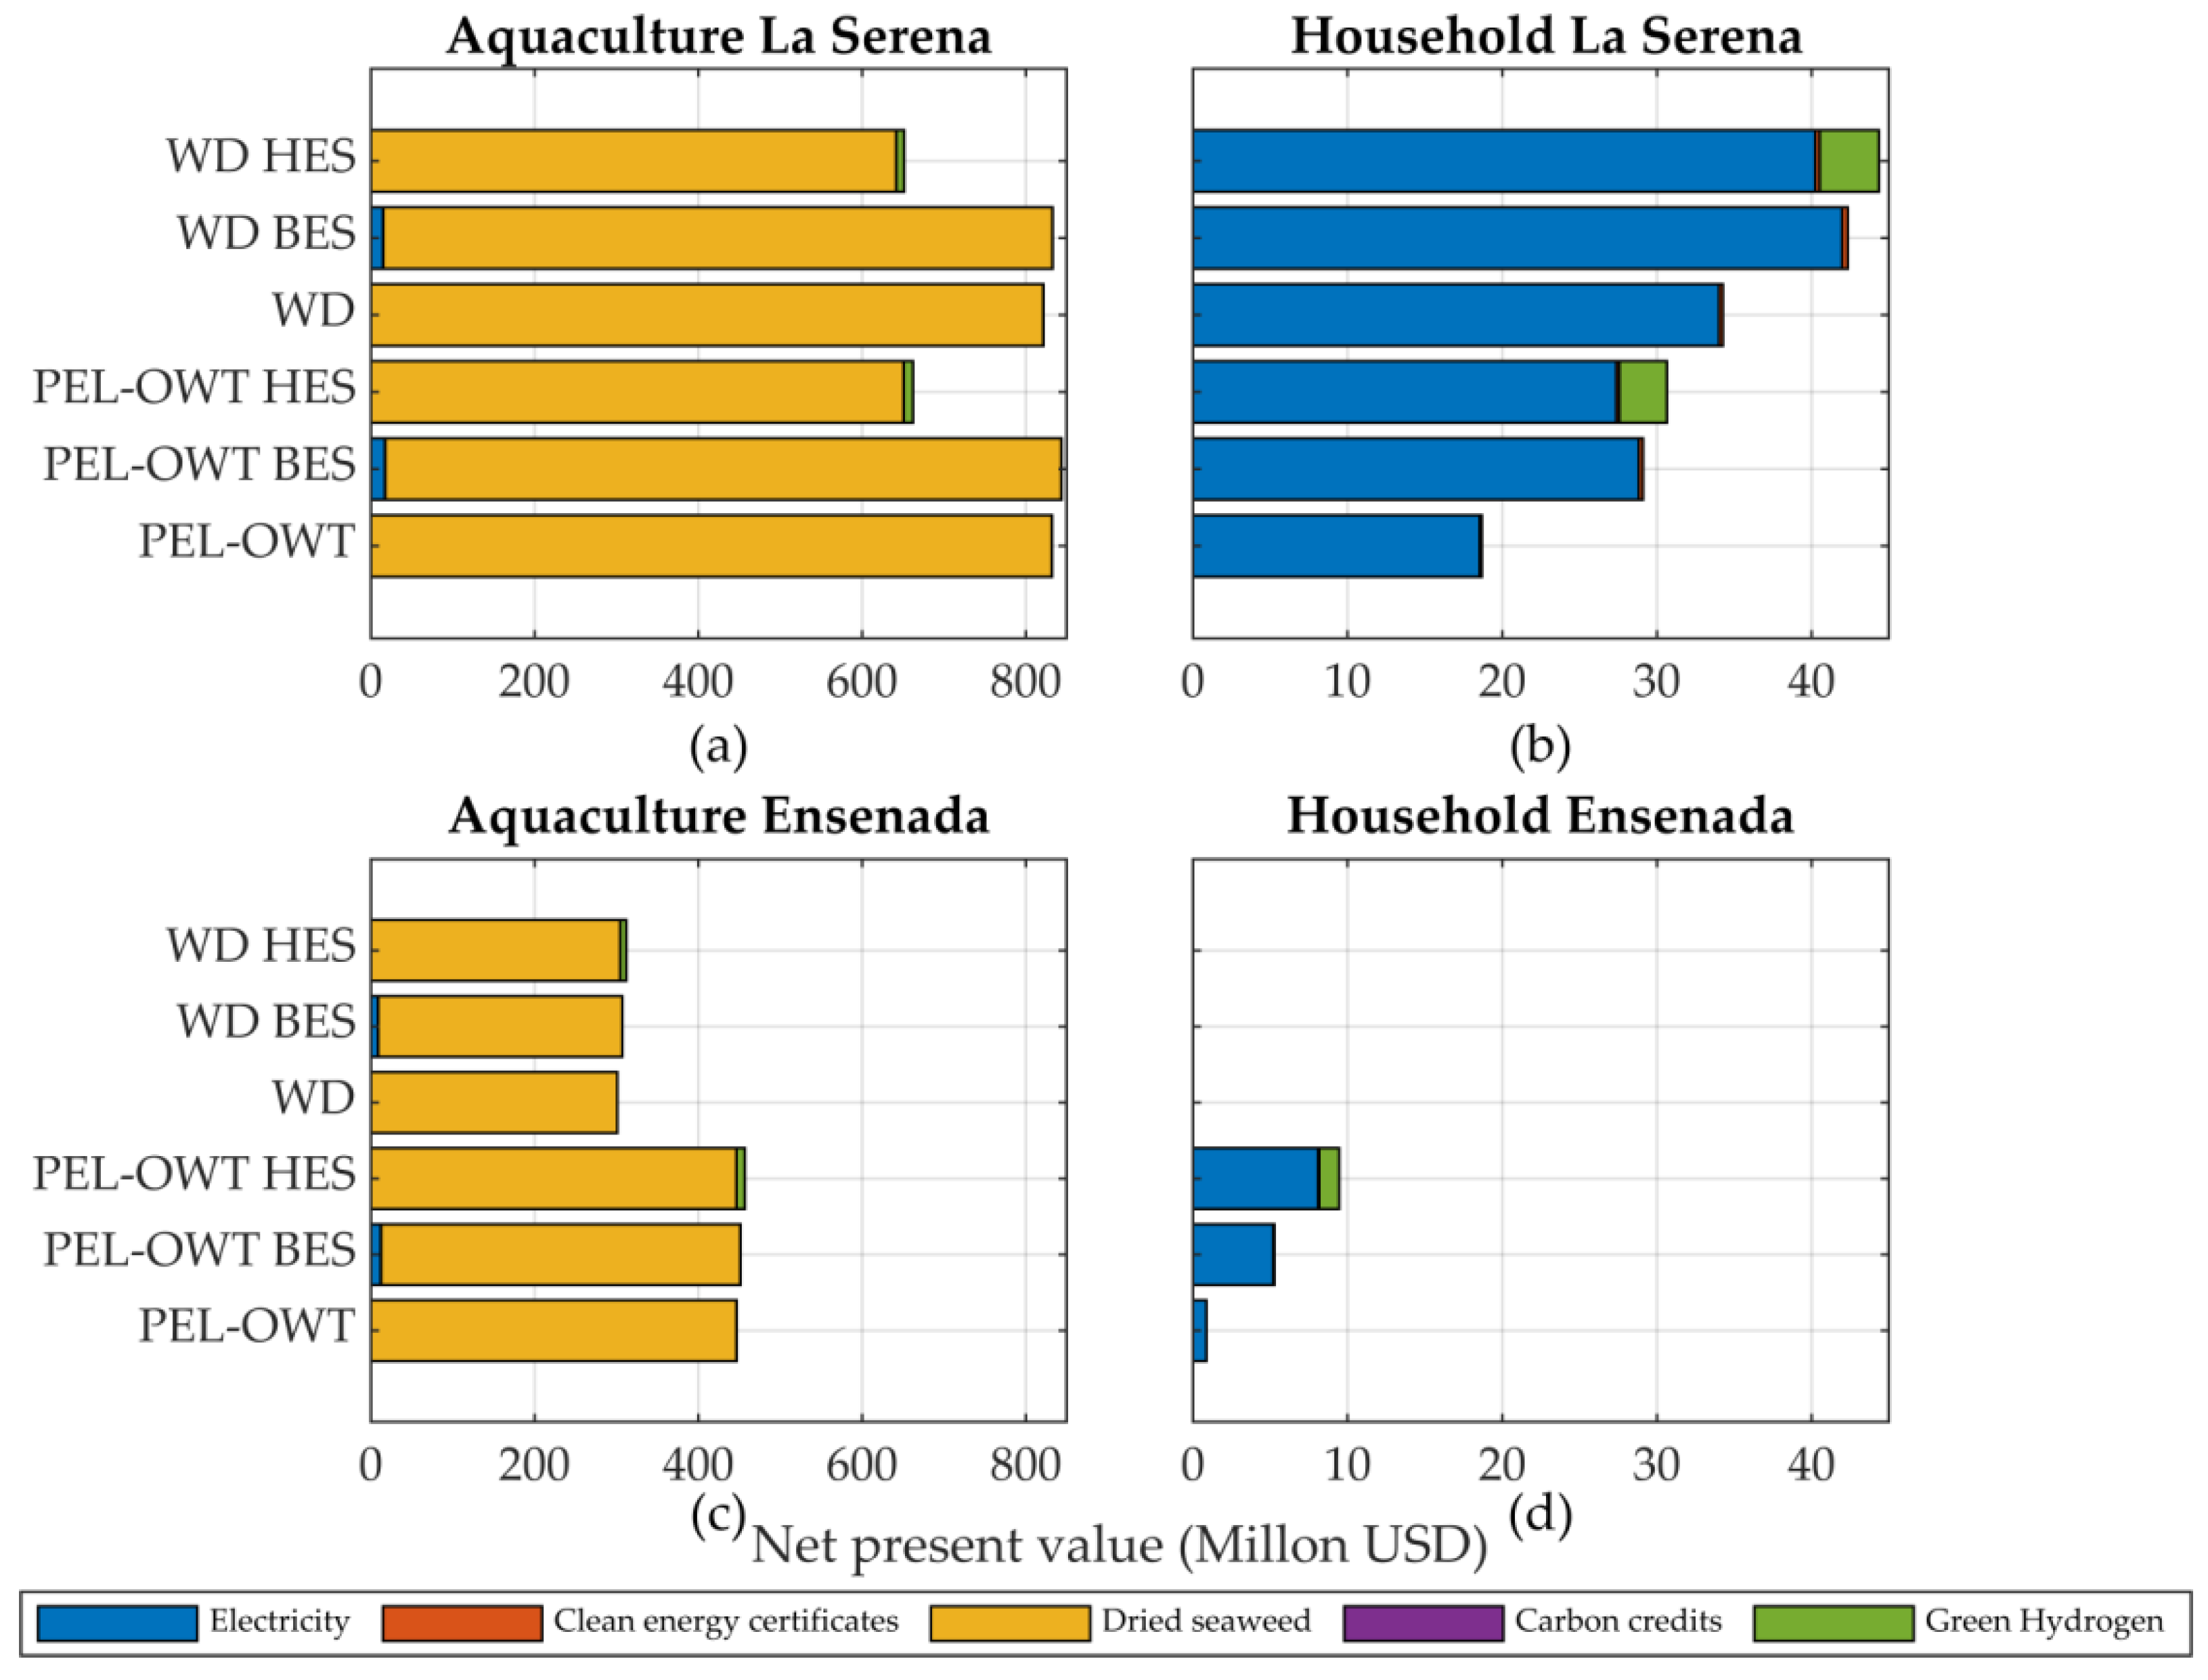
The net present value (NPV) of various MHC scenarios at La Serena and Ensenada is presented in Figure 10. Using energy to meet the demands of the seaweed aquaculture sector yields higher profits than serving households; note that the NPV scale used for aquaculture (panels a and c) is different from households (panels b and d), and La Serena shows significantly higher profitability compared to Ensenada. Among the revenue streams, the sale of dried seaweed consistently generates the highest profits across all scenarios. For the seaweed aquaculture industry in La Serena, scenarios involving storage systems deliver similar NPV yields, regardless of whether PEL or WD devices are used. However, in Ensenada, PEL farms outperform those using WD devices in terms of returns. In Ensenada, the presence or absence of electrical storage systems has minimal impact on NPV values. In contrast, at La Serena, BES configurations yield higher returns than HES, and scenarios without storage often outperform those incorporating HES. Electricity offers the highest returns for household energy supply among all by-products, higher at La Serena than at Ensenada. In Ensenada, however, only PEL farms generate profits. Furthermore, MHC incorporating energy storage systems generally exhibit higher NPV values than those without storage, with HES providing greater returns than BES in specific scenarios, particularly in La Serena.
Figure 11 shows the Internal Rate of Return (IRR) for the La Serena and Ensenada scenarios. Across all scenarios, hybrid systems consistently demonstrate higher IRR values in La Serena than in Ensenada. Furthermore, at both sites, aquaculture scenarios prove more profitable than household scenarios. All hybrid system configurations incorporating PEL devices generated positive IRR values at both sites and in all scenarios analyzed. In contrast, hybrid systems utilizing WD devices only yielded positive IRRs in aquaculture scenarios. Specifically, for household scenarios, WD-based hybrid systems are only profitable in La Serena. For aquaculture applications at both sites, PEL-based hybrid systems achieved slightly higher profitability than WD-based systems. However, the household scenarios exhibited the opposite trend, with WD-based hybrid systems demonstrating greater profitability than those using PEL devices.
Regarding electrical storage, both sites and WEC types showed a slight improvement in profitability for household scenarios when storage systems were integrated, with HES providing a greater improvement over BES. Conversely, in La Serena’s aquaculture scenarios, the integration of electrical storage systems led to a reduction in IRR values, with HES yielding lower returns than BES. No clear pattern is observed for electrical storage in Ensenada’s aquaculture scenarios.

4. Discussion

4.1. Site-Specific Wave Energy Resource Availability and Power Production of WECs and OWT

The availability of mean inter-annual and intra-annual wave power ( P ¯ ), higher in La Serena (Figure 4a,c) than in Ensenada (Figure 4b,d), could be associated with the geolocation of both study sites analyzed. La Serena has a more energetic wave regimen associated with its more exposed and closer proximity to the extratropical South Pacific generation zone. While at Ensenada, the Southern California Bight, the California Channel Islands, and the Coronado Islands of Baja California produce a shadow effect and provide increased protection from incoming swell coming from the extratropical North Pacific [72,73]. These results are consistent with the study of Gunn et al. [10] for the Chilean Pacific and Hernández-Fontes et al. [9] for the northwestern Baja California P ¯ shore zone values. According to these studies, the mean annual P ¯ availability in La Serena is high, near 25 kW/m, and in Ensenada is moderate, between 10 to 20 kW/m. This indicates that both sites have sufficient mean annual P ¯ availability greater than 10 kW/m, the minimum required for commercial-scale wave energy projects [74]. A comparison of Figure 4c,d reveals that both sites exhibit similar annual trends in wave energy, higher during winter than summer. It is worth remembering that the opposite effects of seasonality are due to the sites in the northern and southern hemispheres, respectively. The seasonal wave regime that predominates in these areas has a high wave power activity during the Boreal and Austral winters, associated with the presence of more energetic North and South Pacific swells, respectively. During the summer, the opposite regime takes place, where the sea states in the Northern and Southern Pacific regions are dominated by swells originating from the extratropical South and North Pacific regions, respectively [20,75]. As for the high and relatively more regular P ¯ resources at La Serena (Figure 4a,c), it suggests that this site is more stable and has a reliable and constant energy supply throughout the year than Ensenada (Figure 4b,d), with moderate and more variable wave energy availability.
Based on the power balance analysis for the design of the MHC system, an inverse trend can be observed in the WEC and OWT production profiles, more pronounced in Ensenada (Figure 7) than in La Serena (Figure 6). While both sites exhibit a similar monthly trend in WEC electricity production, with a maximum in winter and a minimum in summer, WEC performance varies significantly between sites. It is seen that the same type of WEC performs differently at the two sites. The highest monthly production is generated for PEL devices in Ensenada (Figure 7) and for WD in La Serena (Figure 6). This highlights the adaptive capacity of the WEC to generate different performance based on different sea-state conditions. Although the mean availability and annual regularity of P ¯ is higher in La Serena than in Ensenada (Figure 4c,d), it can be observed that the PEL device develops a higher adaptability and efficiency under mild local climatology in Ensenada than the WD device under high swell conditions in La Serena. In contrast, there is a lower difference in OWT monthly electricity production performance between sites, with higher production in the spring and summer months at La Serena than at Ensenada. Thus, the minimum monthly WEC electricity production in summer can be counterbalanced by the increase in OWT electricity production during the spring–summer months, which can reduce electricity intermittency and ensure greater regularity in the electricity production of the MHC system.
The findings of this work build significantly upon prior resource assessments and techno-economic benchmarks in the region [20,21]. Our holistic, site-specific techno-economic analysis of WEC-OWT hybrid systems provides two critical advancements. First, the results emphatically show the need to tailor the selection of the WEC device to specific local wave conditions to maximize annual energy production (AEP), since the WD device performs better in La Serena. In contrast, the PEL device is more suitable for Ensenada. Second, by assessing the economic viability of supplying electricity to consolidated markets, we found that supplying electricity to marine seaweed aquaculture yields greater profitability than supplying households, thereby highlighting a symbiotic and economically robust model for MRE development.

4.2. Electricity Generation of Hybrid MRE Systems and Consumption by the Analyzed Scenarios

Electricity consumption for both household and aquaculture scenarios (Figure 5) varies across the year. Household electricity demand is highest in summer and lowest in winter, while aquaculture energy consumption peaks in autumn. The annual household electricity consumption surpasses that of aquaculture in both locations, though aquaculture consumption exhibits greater monthly variability. These consumption trends influence the energy system’s hybridization requirements, representing the proportion of wave energy to offshore wind energy, which differs between the two sites.
The reduced or absent need for hybridization in La Serena can be attributed to its high wave energy availability, low intra-annual variability P ¯ , and consistently high wave energy production. These characteristics enable the system to achieve self-sufficiency for both aquaculture and domestic scenarios with the integration of a single WD (Table 1). In contrast, the moderate and less constant monthly P ¯ resource in Ensenada necessitates a higher requirement for WEC installed capacity relative to OWT, with hybridization levels reaching the upper end of the MHC production contributed by WECs. The observed disparity in WEC requirements between sites, specifically the lower number of WD compared to PEL devices, can be attributable to the WD system’s significantly higher nominal extractive capacity (being an order of magnitude greater than PEL devices). Furthermore, the WD’s enhanced adaptability to high P ¯ conditions, as exemplified by La Serena (Figure 4a), contributes to its reduced deployment numbers. However, despite La Serena’s lower hybridization requirement, it exhibits a greater demand for PEL devices compared to Ensenada, which, conversely, necessitates a higher number of WD devices. This pattern highlights the PEL device’s enhanced adaptability to the moderate P ¯ condition of Ensenada.
While the research by Petracca et al. [34] has focused on the design and techno-economic analysis of novel hybrid platforms for a specific location, demonstrating a lower LCoE and improved hydrodynamic stability, the current study introduces a distinct and complementary set of contributions. Petracca et al. [34] focused on a specific hybrid platform, while the present work offers a site-specific comparative analysis across two distinct markets in Latin America, focusing on the techno-economic performance of different WEC technologies (PEL and WD) when coupled with OWTs and integrated with established coastal industries. Notably, our results provide two key contributions: first, we find that the WD device performs better in La Serena, while the PEL device is more suitable for Ensenada, underscoring the necessity of tailoring WEC device selection to specific local wave conditions to maximize AEP and overall system performance. Second, we demonstrate that supplying electricity for marine seaweed aquaculture is more profitable than supplying it to households, highlighting a symbiotic approach to MRE development.
Figure 6, which illustrates the energy balance for La Serena, reveals distinct electricity consumption and generation for both aquaculture and household scenarios. The maximum monthly electricity generation from the WEC-OWT hybrid system using PEL devices occurs during the austral spring season, correlating with peak OWT electricity production in October. Conversely, maximum generation from the WD device is observed during July, associated with the high austral winter P ¯ availability. These profiles indicate whether hybridization with OWT is required, a dependency directly linked to the type of WEC deployed. The larger contribution of OWT to meet the annual energy demand using PEL devices indicates its critical role in hybrid configurations for smaller-scale energy requirements. The OWT remains the primary energy source even with a WEC array of six PEL devices. The energy generation by six PEL devices at La Serena reflects the characteristics of the WEC design and the wave energy availability.
Each PEL is designed to convert wave motion into electricity with a moderate rated capacity of around 750 kW per device. This PEL array provides a combined capacity of approximately 4.5 MW, which is significant but insufficient to fully meet the energy demands of aquaculture scenarios without additional support from OWT. While the P ¯ availability at La Serena is high (Figure 4a), PEL devices are optimized for moderate wave conditions (Figure 4b and Figure 5b). They may underperform in more energetic environments, where higher waves could exceed their design capabilities. In contrast, the WD device, with larger rated capacities and better adaptability to high-energy conditions, is better suited to harness the site’s P ¯ resources, and a non-hybridized configuration is required. This demonstrates that the WD device outperforms the PEL device, mainly due to the higher P ¯ at La Serena, which aligns better with the WD’s design and capacity.
Similar to the energy balance at La Serena, the Ensenada scenarios exhibit inverse trends between electricity consumption and generation (Figure 7). This highlights the critical need for energy storage or complementary generation to ensure system reliability, particularly during periods of high demand. Seasonal discrepancies primarily drive this imbalance. The surplus energy generated during the winter–spring period could be strategically utilized for secondary applications. Potential uses include energy storage, desalination, or powering ancillary equipment in aquaculture operations, with specific implementation depending on local needs and existing infrastructure. In contrast to La Serena, WECs provide the highest contribution to electricity generation within the hybrid system at Ensenada, reflecting the distinct wave energy characteristics prevalent at this location. Due to Ensenada’s moderate P ¯ availability, a larger installed capacity is required compared to La Serena. Furthermore, the performance of WECs is slightly diminished under these conditions, necessitating a higher device count to meet energy demands. However, it is notable that PEL devices are better suited to moderate P ¯ than WD devices. Consequently, only five PEL devices are required at Ensenada, whereas six are necessary at La Serena, despite its higher wave energy potential, which is more demanding on device capacity and durability.

4.3. Energy Storage Solutions

A key aspect considered in this study is the variability of wave energy generation throughout the year. As shown in Figure 6 and Figure 7, wave energy generation at Ensenada exhibits higher variability than La Serena, resulting in higher energy surpluses. These surpluses and their potential utilization for energy storage in the BES and HES systems are further detailed in Figure 8. Figure 8b illustrates that the aquaculture and household scenarios at Ensenada allow for greater annual BES and HES utilization than those at La Serena, as shown in Figure 8a. Energy storage systems, specifically BES and HES, are more critical in Ensenada than at La Serena. This heightened importance is directly linked to the marked intra-annual energy surplus variability observed in Ensenada (Figure 8). Energy surpluses peak during spring, a period characterized by maximum electricity generation and lowest consumption. Conversely, summer and autumn surpluses are significantly lower due to diminished electricity generation. While these storage solutions can substantially enhance energy system reliability, their economic viability requires a more detailed assessment to fully determine their overall feasibility and broader impact on the energy system.

4.4. MHC Profitability and Blue Economy Opportunities

The levelized cost of energy (LCoE) varies based on the WEC-OWT hybrid systems and deployment sites (Figure 9). The differences in the LCoE values produced by the WEC-OWT hybrid systems among the evaluated sites highlight the importance of the availability and intra-annual regularity of the P ¯ resource in annual energy production (AEP) [76]. It can be observed how La Serena, with high availability and lower intra-annual variability P ¯ (Figure 4c), enables a lower capacity requirement for the evaluated hybrid systems adaptation, generating similar LCoE values. In contrast, Ensenada, with a lower and more variable P ¯ (Figure 4d), highlights a greater adaptability requirement for the hybrid systems, producing LCoE values 2.6 times lower for the PEL-OWT hybrid system than for the WD-OWT. These results are consistent with Lavidas and Blok [50], who found that the AEP is a major parameter that determines the LCoE behavior. Furthermore, the lowest LCoE of the PEL-OWT hybrid systems in Ensenada is attributed to their lower CapEx and higher efficiency under moderate wave conditions [30]. While the annual electricity generation of the PEL and WD farms in Ensenada is similar (Figure 5), the PEL devices perform more cost-effectively due to these factors. WD-OWT hybrid systems at La Serena demonstrate lower LCoE than at Ensenada due to site-specific advantages, and fewer units are required to meet energy demands (Table 1). Additionally, the WD farm benefits from a higher AEP than the PEL farm, thanks to its suitability for higher wave energy conditions. Except for the WD-OWT hybrid system in Ensenada, the remaining hybrid configurations exhibited LCoE ranges comparable to those reported by [14,15,16]. However, it is important to note that these LCoE values (390-420 USD/MWh) are higher than and fall outside the 2023 LCoE range for fossil fuels, solar photovoltaic, and onshore and offshore wind renewable energies (less than 100 USD/MWh) [77,78]. This difference underscores the importance of continued innovation and development of new generations of WECs that generate higher performance, adapted to the local sea state conditions, to strengthen competitiveness and penetration in the electricity market.
The net present value (NPV) analysis indicates that seaweed aquaculture scenarios yield higher profitability than serving households, underscoring its commercial significance, particularly at La Serena (Figure 10). This is mainly due to the higher selling price of dried Ulvasp. seaweed for human consumption on the market compared to electricity [23,58,59]. As expected, the WD device exhibits superior economic performance at La Serena (Figure 10a,b), while PEL farms are more viable at Ensenada (Figure 10c,d). Regarding the integration of storage systems, their application for household purposes generally improves profitability compared to aquaculture. In La Serena, no significant differences in profitability are observed between PEL or WD hybrid storage systems. Conversely, in Ensenada, PEL-OWT hybrid systems consistently yield greater economic benefits across all cases, likely due to their higher efficiency under the local wave energy conditions.
While WEC-OTW hybrid systems incorporating battery energy storage (BES) typically offer higher returns for aquaculture than those utilizing hydrogen energy storage (HES) or no storage, the opposite trend is observed for household scenarios. Notably, in Ensenada, the indifference in net present value (NPV) values for electrical storage systems within the same WEC-OWT hybrid configuration suggests that added storage costs may not significantly enhance overall profitability.
Among all by-products, electricity consistently generates the highest profitability for households, particularly at La Serena, where the WD device demonstrates superior performance over the PEL device. In contrast, only PEL-OWT hybrid systems are profitable in Ensenada, highlighting this device’s superior adaptability to the region’s specific wave energy potential. These findings underscore the critical role of site-specific conditions and device performance in determining the economic viability of hybrid energy systems.
The Internal Rate of Return (IRR) analysis (Figure 11) is consistent with the NPV trends, confirming that seaweed aquaculture is the most profitable scenario. The IRR values are highest at La Serena, a result driven by the market price of Ulva sp. and the high local availability of P ¯ resources at that location. Notably, the aquaculture configuration without energy storage delivers the highest IRR at both sites, indicating potentially strong returns on investment. Hybrid systems with PEL devices achieve positive IRR values in both locations, demonstrating flexibility across different P ¯ conditions.
A critical insight from this analysis is the economic impact of energy storage. The analysis consistently shows that systems without storage have comparable or superior profitability, suggesting that the capital and operational costs of storage often outweigh its energy management benefits. This trade-off is location-dependent; for instance, the WD household scenario is entirely unfeasible in Ensenada but modestly profitable in La Serena. This underscores the need for a nuanced evaluation of energy storage, as its economic justification is not guaranteed. Future work should, therefore, develop affordable storage technologies and establish policy incentives to support the integration of wave energy.

5. Conclusions

This study underscores the significant potential of marine hybrid clusters (MHCs), which co-locate WECs and OWTs, as a viable pathway to diversify the energy mix and enhance the resilience of coastal communities. The techno-economic analysis reveals several key insights applicable to the broader MRE sector.
The success of MHCs depends on local environmental conditions. The geolocation and proximity to the extratropical generation zones of the Pacific result in differences in the annual and monthly mean wave power availability at the selected sites. La Serena has a yearly mean wave power 87% higher than Ensenada, equal to 26.05 kW/m and 13.88 kW/m, respectively. High-energy wave climates offer a more consistent resource, potentially reducing the need for extensive hybridization with other renewable energy sources. Conversely, locations with mild and more variable wave resources benefit significantly from a hybrid approach, where the complementary nature of offshore wind and wave power can smooth out intermittency and ensure a more reliable yearly energy supply.
The same type of WECs individually generate different yields at the two sites analyzed. The PEL device produces a mean annual electricity of 120% more in Ensenada than in La Serena, while the WD generates 200% more in La Serena. The latter has a lower mean inter- and intra-annual variability in electricity generated by the WECs and OWT than Ensenada. La Serena, Chile, emerged as a highly favorable location due to its high wave energy potential, which supports the effective use of WD WECs. Due to their capacity to operate in energetic wave conditions, these devices achieved remarkable energy production and lower levelized cost of energy (LCoE), making them ideal for this location. Ensenada, Mexico, performed better with PEL WEC farms, which are optimized for less dynamic wave environments. Despite requiring higher hybridization with OWTs, Ensenada’s configuration achieved economic feasibility by maximizing the performance of PEL devices in these conditions. This highlights the strategic imperative of tailoring WEC selections and hybrid system design to the specific characteristics of a deployment site rather than adopting a one-size-fits-all approach.
Integrating capital-intensive hybrid systems with established marine industries boosts their economic viability and environmental value. Supplying power to the commercial seaweed aquaculture sector proves to be a more profitable end-use than household electrification alone, creating a powerful synergy that supports both energy and food security and offering significant carbon sequestration benefits under the blue economy framework.
The strategic management of surplus energy through storage solutions, such as batteries or green hydrogen production, presents an additional revenue stream and improves the overall financial viability, particularly in regions with significant seasonal variations in energy generation. Hybridization of WEC and OWT systems was more critical at Ensenada, where the greater variability in wave energy required more integration. Ensenada also had higher variability in wave energy production, leading to more significant energy surpluses in periods of off-peak consumption, particularly in spring. These surpluses make energy storage systems more necessary in Ensenada than in La Serena. However, the economic viability of storage options is increasingly reliable and improves the IRR and NPV in Ensenada scenarios. The technical evaluation shows that using BES (battery energy storage) or HES (hydrogen energy storage), 25% and 40% of surplus energy can be utilized at La Serena and Ensenada, respectively, in the months of higher generation. However, for the aquaculture scenario, due to the CapEx and OpEx of energy storage, this accounts for less than 5% of the NPV at La Serena, and less than 6% at Ensenada. In contrast, for the household scenario, the sale of electricity from BES, or of green hydrogen, could play a more significant role, contributing approximately 10% to La Serena and 17% to Ensenada.
This research demonstrates that while the technological components for MHC exist, their successful commercial deployment hinges on strategic planning. Optimizing the configuration of WECs and OWTs, selecting appropriate energy storage solutions, and identifying high-value end-users are all critical factors for success. As the marine renewable energy sector matures, moving beyond technology-specific assessments to holistic, site-specific system designs that integrate multiple energy sources and economic sectors will be crucial for unlocking the vast, untapped potential of our oceans. Future analyses should comprehensively consider ecosystem resource availability, project feasibility, operating costs, and environmental factors to ensure well-informed and sustainable decision-making.

Author Contributions

Conceptualization, E.G.-P., J.O.-G., H.G.-N., R.S. and J.A.Z.-G.; methodology, E.G.-P., J.O.-G., D.S.-C., M.C.-G., H.G.-N., F.G.-V. and J.A.Z.-G.; software, E.G.-P., J.O.-G., D.S.-C., M.C.-G., H.G.-N. and F.G.-V.; validation, E.G.-P., J.O.-G., D.S.-C. and J.A.Z.-G.; formal analysis, E.G.-P., J.O.-G., D.S.-C., F.G.-V., I.O., G.G. and R.S.; investigation, E.G.-P., J.O.-G., D.S.-C., M.C.-G., F.G.-V., H.G.-N. and J.A.Z.-G.; resources, E.G.-P., J.O.-G., D.S.-C., G.G., H.G.-N. and I.O.; data curation, E.G.-P., J.O.-G., D.S.-C., M.C.-G. and H.G.-N.; writing—original draft preparation, E.G.-P. and J.O.-G.; writing—review and editing, E.G.-P., J.O.-G., D.S.-C., M.C.-G., H.G.-N., F.G.-V., I.O. G.G., R.d.G.G.-H., J.A.Z.-G. and R.S.; visualization, E.G.-P. and J.O.-G.; supervision, E.G.-P. and J.O.-G.; project administration, E.G.-P. and J.O.-G.; funding acquisition, G.G. and R.S. All authors have read and agreed to the published version of the manuscript.

Funding

This research was funded by the European Union – NextGenerationEU Award Number: Project code PE0000021, Concession Decree No. 1561 of 11.10.2022 adopted by Ministero dell’Universitá e della Ricerca (MUR), Italy, CUP, Italy E13C22001890001, Project title “Network 4 Energy Sustainable Transition – NEST”. Additionally, this project has received funding from the European Union’s Horizon Europe Research and Innovation Programme of Blue Energy Offshore Installation Accelerator (Blue-X) under Grant Agreement No 101131527, as well as from the Fondo Sectorial CONACYT-SENER-Sustentabilidad energética, project 249795. The latter is a contribution of the Centro Mexicano de Innovación en Energía del Océano (CEMIE-Océano).

Institutional Review Board Statement

Not applicable.

Informed Consent Statement

Not applicable.

Data Availability Statement

The original contributions presented in this study are included in the article. Further inquiries can be directed to the corresponding author.

Acknowledgments

We are grateful to the European Union’s Horizon Europe Research and Innovation Programme of Blue Energy Offshore Installation Accelerator (Blue-X) for the funding Grant Agreement No 101131527, the Marine Offshore Renewable Energy Lab (MOREnergy) Lab-DIMEAS (Politecnico di Torino) for infrastructure support, and the Centro Mexicano de Innovación en Energía-Océano (CEMIE-Océano) for supporting this research. We also thank the Servicio Hidrográfico y Oceanográfico de la Armada de Chile (SHOA) for providing the bathymetric data, and IH-Cantabria, for the propagation nearshore wave model. Wave data is from the European Centre for Medium-Range Weather Forecasts, operator of Copernicus Climate Change Service (C3S). The climate index is from NOAA (https://psl.noaa.gov/data/climateindices/list/ (accessed on 10 June 2024)). Thanks to Blue Evolution Company and José A. Zertuche-González, for providing the seaweed culture data. Thanks also to Rebeca Zertuche-Chanes, for her contribution to revising the manuscript.

Conflicts of Interest

The authors declare no conflict of interest.

Abbreviations

The following abbreviations are used in this manuscript:
ACDPsAcoustic Doppler Current Profilers
AEPAnnual energy production
BESBattery energy storage
CapExCapital Expenditures
ENSOEl Niño-Southern Oscillation
ERA5European Centre for Medium-Range Weather Forecasts Reanalysis v5
HESHydrogen energy storage
HPHarvested wave power
HRAvailability matrix
INEGIInstituto Nacional de Estadística y Geografía
IOWAGAIntegrated Ocean Waves for Geophysical and other applications model
IRRInternal Rate of Return
LCoELevelized cost of energy
LSBLa Serena Bay
MHCsMaritime hybrid clusters
MREMarine renewable energies
MWhMegaWatt-hour
NRELNational Renewable Energy Laboratory
NPVNet present value
OpExOperational Expenditures
OWTsOffshore wind turbines
PANPanul
PELPelamis device
PSTPunta Santo Tomas
RERenewable energy
SWANSimulating WAves Nearshore model
TSBTodos Santos Bay
TSITodos Santos Islands
USDUnited States Dollar
WDWave Dragon device
WECWave energy converter

References

  1. McCarthy, J.J. Climate Change 2001: Impacts, Adaptation, and Vulnerability: Contribution of Working Group II to the Third Assessment Report of the Intergovernmental Panel on Climate Change; Cambridge University Press: Cambridge, UK, 2001; Volume 2, Available online: https://www.ipcc.ch/site/assets/uploads/2018/03/WGII_TAR_full_report-2.pdf (accessed on 20 June 2024).
  2. International Energy Agency. World Energy Outlook 2023. 2023. Available online: https://www.iea.org/reports/world-energy-outlook-2023 (accessed on 21 June 2024).
  3. International Renewable Energy Agency. Renewable Power Generation Costs in 2021. 2022. Available online: http://large.stanford.edu/courses/2022/ph240/cruz2/docs/irena-2021.pdf (accessed on 23 June 2024).
  4. Rogelj, J.; Den Elzen, M.; Höhne, N.; Fransen, T.; Fekete, H.; Winkler, H.; Schaeffer, R.; Sha, F.; Riahi, K.; Meinshausen, M. Paris Agreement climate proposals need a boost to keep warming well below 2 C. Nature 2016, 534, 631–639. [Google Scholar] [CrossRef]
  5. Bahaj, A.S. Generating Electricity from the Oceans. Renew. Sustain. Energy Rev. 2011, 15, 3399–3416. [Google Scholar] [CrossRef]
  6. Global Wind Energy Council. Global Offshore Wind Report 2024. 2024. Available online: https://www.connaissancedesenergies.org/sites/connaissancedesenergies.org/files/pdf-actualites/GOWR-2024_digital_final_2.pdf (accessed on 21 July 2024).
  7. Costoya, X.; DeCastro, M.; Carvalho, D.; Gómez-Gesteira, M. On the Suitability of Offshore Wind Energy Resource in the United States of America for the 21st Century. Appl. Energy 2020, 262, 114537. [Google Scholar] [CrossRef]
  8. Shadman, M.; Roldan-Carvajal, M.; Pierart, F.G.; Haim, P.A.; Alonso, R.; Silva, C.; Osorio, A.F.; Almonacid, N.; Carreras, G.; Maali-Amiri, M.; et al. A Review of Offshore Renewable Energy in South America: Current Status and Future Perspectives. Sustainability 2023, 15, 1740. [Google Scholar] [CrossRef]
  9. Hernández-Fontes, J.V.; Felix, A.; Mendoza, E.; Cueto, Y.R.; Silva, R. On the Marine Energy Resources of Mexico. J. Mar. Sci. Eng. 2019, 7, 191. [Google Scholar] [CrossRef]
  10. Gunn, K.; Stock-Williams, C. Quantifying the Global Wave Power Resource. Renew. Energy 2012, 44, 296–304. [Google Scholar] [CrossRef]
  11. Gorr-Pozzi, E.; García-Nava, H.; Larrañaga, M.; Jaramillo-Torres, M.G.; Verduzco-Zapata, M.G. Wave Energy Resource Harnessing Assessment in a Subtropical Coastal Region of the Pacific. J. Mar. Sci. Eng. 2021, 9, 1264. [Google Scholar] [CrossRef]
  12. Ocean Energy Europe. Ocean Energy Key Trends and Statistics 2022. 2023. Available online: https://www.oceanenergy-europe.eu/wp-content/uploads/2023/03/Ocean-Energy-Key-Trends-and-Statistics-2022.pdf (accessed on 11 July 2024).
  13. IEA-OES. Annual Report: An Overview of Ocean Energy Activities in 2023. 2024. Available online: https://www.ocean-energy-systems.org/publications/oes-annual-reports/document/oes-annual-report-2024/ (accessed on 12 March 2025).
  14. Astariz, S.; Iglesias, G. The Economics of Wave Energy: A Review. Renew. Sustain. Energy Rev. 2015, 45, 397–408. [Google Scholar] [CrossRef]
  15. The Executive Committee of IEA Ocean Energy Systems. Annual Report: An Overview of Ocean Energy Activities in 2021. 2022. Available online: https://www.ocean-energy-systems.org/publications/oes-annual-reports/document/oes-annual-report-2021/ (accessed on 10 June 2024).
  16. Giglio, E.; Petracca, E.; Paduano, B.; Moscoloni, C.; Giorgi, G.; Sirigu, S.A. Estimating the Cost of Wave Energy Converters at an Early Design Stage: A Bottom-Up Approach. Sustainability 2023, 15, 6756. [Google Scholar] [CrossRef]
  17. Corrales-Gonzalez, M.; Lavidas, G.; Lira-Loarca, A.; Besio, G. Wave Energy Assessment and Wave Converter Applicability at the Pacific Coast of Central America. Front. Energy Res. 2024, 12, 1454275. [Google Scholar] [CrossRef]
  18. Meneses, E.; Soria, R.; Portilla, J.; Guachamín-Acero, W.; Álvarez, R.; Paredes, R.; Arias-Hidalgo, M. The Potential of Wave Energy Converters in the Galapagos Islands. Energy Strategy Rev. 2024, 54, 101457. [Google Scholar] [CrossRef]
  19. Sánchez, A.; Mendoza, E. Wave energy converter farm feasibility assessment in southwest Baja California, Mexico. Renew. Energy 2024, 227, 120589. [Google Scholar] [CrossRef]
  20. Selman-Caro, D.; Gorr-Pozzi, E.; Odériz, I.; Díaz-Hernández, G.; García-Nava, H.; Silva, R. Assessing wave energy for possible WEC installations at La Serena, central Chile. Ocean Eng. 2024, 295, 116854. [Google Scholar] [CrossRef]
  21. Gorr-Pozzi, E.; Olmedo-González, J.; Selman-Caro, D.; García-Nava, H.; García-Vega, F.; Odériz, I.; González-Huerta, R.G.; Zertuche-González, J.A.; Silva, R. Techno-economic analysis of marine hybrid clusters in two potential Latin American markets. In Proceedings of the 15th European Wave and Tidal Energy Conference, Bilbao, Spain, 3–7 September 2023. [Google Scholar] [CrossRef]
  22. Clemente, D.; Rosa-santos, P.; Taveira-pinto, F. On the Potential Synergies and Applications of Wave Energy Converters: A Review. Renew. Sustain. Energy Rev. 2021, 135, 110162. [Google Scholar] [CrossRef]
  23. Tobal-Cupul, J.G.; Garduño-Ruiz, E.P.; Gorr-Pozzi, E.; Olmedo-González, J.; Martínez, E.D.; Rosales, A.; Navarro-Moreno, D.D.; Benítez-Gallardo, J.E.; García-Vega, F.; Wang, M.; et al. An Assessment of the Financial Feasibility of an OTEC Ecopark: A Case Study at Cozumel Island. Sustainability 2022, 14, 4654. [Google Scholar] [CrossRef]
  24. Gorr-Pozzi, E.; Olmedo-González, J.; Silva, R. Deployment of Sustainable Off-Grid Marine Renewable Energy Systems in Mexico. Front. Energy Res. 2022, 10, 1047167. [Google Scholar] [CrossRef]
  25. Hemmati, R.; Saboori, H. Emergence of Hybrid Energy Storage Systems in Renewable Energy and Transport Applications—A Review. Renew. Sustain. Energy Rev. 2016, 65, 11–23. [Google Scholar] [CrossRef]
  26. Fletcher, Z.J. Aquaculture in Multiple Use of Space for Island Clean Autonomy. In WCFS2020; Piątek, Ł., Lim, S.H., Wang, C.M., de Graaf-van Dinther, R., Eds.; Springer: Singapore, 2022. [Google Scholar]
  27. Ahmed, M.; Lorica, M.H. Improving Developing Country Food Security through Aquaculture Development—Lessons from Asia. Food Policy 2002, 27, 125–141. [Google Scholar] [CrossRef]
  28. Grand View Research. Commercial Seaweed Market Analysis by Product (Brown Seaweed, Red Seaweed, Green Seaweed), by Form (Liquid, Powdered, Flakes), by Application (Agriculture, Animal Feed, Human Consumption) and Segment Forecasts to 2024. 2024. Available online: https://www.industryarc.com/Research/Commercial-Seaweeds-Market-Research-504442 (accessed on 14 March 2025).
  29. Pellow, M.A.; Emmott, C.J.M.; Barnhart, C.J.; Benson, S.M. Hydrogen or Batteries for Grid Storage? A Net Energy Analysis. Energy Environ. Sci. 2015, 8, 1938–1952. [Google Scholar] [CrossRef]
  30. Gorr-Pozzi, E.; García-Nava, H.; García-Vega, F.; Zertuche-González, J.A. Techno-Economic Feasibility of Marine Eco-Parks Driven by Wave Energy: A Case Study at the Coastal Arid Region of Mexico. Energy Sustain. Dev. 2023, 76, 101299. [Google Scholar] [CrossRef]
  31. Zimmermann, T.; Keil, P.; Hofmann, M.; Horsche, M.F.; Pichlmaier, S.; Jossen, A. Review of System Topologies for Hybrid Electrical Energy Storage Systems. J. Energy Storage 2016, 8, 78–90. [Google Scholar] [CrossRef]
  32. Bartolucci, L.; Cordiner, S.; Mulone, V.; Rocco, V.; Rossi, J.L. Hybrid Renewable Energy Systems for Renewable Integration in Microgrids: Influence of Sizing on Performance. Energy 2018, 152, 744–758. [Google Scholar] [CrossRef]
  33. Naderipour, A.; Abdul-Malek, Z.; Nowdeh, S.A.; Kamyab, H.; Ramtin, A.R.; Shahrokhi, S.; Klemeš, J.J. Comparative Evaluation of Hybrid Photovoltaic, Wind, Tidal and Fuel Cell Clean System Design for Different Regions with Remote Application Considering Cost. J. Clean. Prod. 2021, 283, 124207. [Google Scholar] [CrossRef]
  34. Petracca, E.; Faraggiana, E.; Ghigo, A.; Sirigu, M.; Bracco, G.; Mattiazzo, G. Design and Techno-Economic Analysis of a Novel Hybrid Offshore Wind and Wave Energy System. Energies 2022, 15, 2739. [Google Scholar] [CrossRef]
  35. Coles, D.; Angeloudis, A.; Goss, Z.; Miles, J. Tidal Stream vs. Wind Energy: The Value of Cyclic Power When Combined with Short-Term Storage in Hybrid Systems. Energies 2021, 14, 1106. [Google Scholar] [CrossRef]
  36. Bocklisch, T. Hybrid Energy Storage Systems for Renewable Energy Applications. Energy Procedia 2015, 73, 103–111. [Google Scholar] [CrossRef]
  37. Sánchez-Dirzo, R.; González-Huerta, R.G.; Mendoza, E.; Silva, R.; Sandoval Pineda, J.M. From Wave to Jet and from Jet to Hydrogen: A Promising Hybrid System. Int. J. Hydrogen Energy 2014, 39, 16628–16636. [Google Scholar] [CrossRef]
  38. Ocean Energy Systems. Wave Energy Developments Highlights 2023. 2023. Available online: https://www.ocean-energy-systems.org/publications/oes-brochures/document/wave-energy-developments-highlights-2023/ (accessed on 23 July 2024).
  39. Instituto Nacional de Estadística y Geografía (INEGI). Anuario Estadístico y Geográfico de Baja California 2017. 2017. Available online: https://www.inegi.org.mx/contenido/productos/prod_serv/contenidos/espanol/bvinegi/productos/nueva_estruc/anuarios_2017/702825094874.pdf (accessed on 24 July 2024).
  40. Energía Región. Energía Región de Coquimbo. 2023. Available online: https://energiaregion.cl/region/COQ (accessed on 26 July 2024).
  41. Energía Alternativa. Energía Alternativa Estudio Técnico de Las Fuentes de Energía Alterna Disponibles Para Su Implementación En La Planta de Producción de Alga Ulva Sp. de Productos Marinos de Las Californias S. de R.L. de C.V. 2020. Available online: https://blueevolution.com/category/blog/press-release/ (accessed on 26 June 2024).
  42. SWAN Team. SWAN Cycle III Version 40.51 User Manual; Delft University of Technology, Faculty of Civil Engineering and Geosciences, Environmental Fluid Mechanics Section: Delft, The Netherlands, 2006; Available online: https://falk.ucsd.edu/modeling/swanuse.pdf (accessed on 21 April 2024).
  43. Janssen, P. The Interaction of Ocean Waves and Wind; Cambridge University Press: Cambridge, UK, 2004. [Google Scholar]
  44. Selman-Caro, D.A. Cuantificación del Recurso EnergéTico Undimotriz en Diferentes Escales de Tiempo en la Serena, Chile. Ph.D. Thesis, Universidad Nacional Autónoma de México, Mexico City, Mexico, 2023. Available online: https://repositorio.unam.mx/contenidos/cuantificacion-del-recurso-energetico-undimotriz-en-diferentes-escalas-de-tiempo-en-la-serena-chile-3698632?c=%7B (accessed on 12 July 2024).
  45. Lavidas, G.; Venugopal, V. A 35 Year High-Resolution Wave Atlas for Nearshore Energy Production and Economics at the Aegean Sea. Renew. Energy 2017, 103, 401–417. [Google Scholar] [CrossRef]
  46. Hersbach, H.; Bell, B.; Berrisford, P.; Hirahara, S.; Horányi, A.; Muñoz-Sabater, J.; Nicolas, J.; Peubey, C.; Radu, R.; Schepers, D.; et al. The ERA5 Global Reanalysis. Q. J. R. Meteorol. Soc. 2020, 146, 1999–2049. [Google Scholar] [CrossRef]
  47. Shu, Z.R.; Li, Q.S.; Chan, P.W. Statistical Analysis of Wind Characteristics and Wind Energy Potential in Hong Kong. Energy Convers. Manag. 2015, 101, 644–657. [Google Scholar] [CrossRef]
  48. Vega, L.; Michaelis, D. First Generation 50 MW OTEC Plantship for the Production of Electricity and Desalinated Water. In Proceedings of the Annual Offshore Technology Conference, Houston, TX, USA, 3–6 May 2010; pp. 2979–2995. [Google Scholar] [CrossRef]
  49. de Andres, A.; MacGillivray, A.; Guanche, R.; Jeffrey, H. Factors Affecting LCOE of Ocean Energy Technologies: A Study of Technology and Deployment Attractiveness. In Proceedings of the 5th International Conference on Ocean Energy, Halifax, NS, Canada, 4–6 November 2014; pp. 1–11. Available online: https://tethys-engineering.pnnl.gov/sites/default/files/publications/andresetal.pdf (accessed on 12 April 2024).
  50. Lavidas, G.; Blok, K. Shifting Wave Energy Perceptions: The Case for Wave Energy Converter (WEC) Feasibility at Milder Resources. Renew. Energy 2021, 170, 1143–1155. [Google Scholar] [CrossRef]
  51. Dalton, G.J.; Alcorn, R.; Lewis, T. Case Study Feasibility Analysis of the Pelamis Wave Energy Convertor in Ireland, Portugal and North America. Renew. Energy 2010, 35, 443–455. [Google Scholar] [CrossRef]
  52. Allan, G.; Gilmartin, M.; McGregor, P.; Swales, K. Levelised Costs of Wave and Tidal Energy in the UK: Cost Competitiveness and the Importance of “Banded” Renewables Obligation Certificates. Energy Policy 2011, 39, 23–39. [Google Scholar] [CrossRef]
  53. Dalton, G.J.; Alcorn, R.; Lewis, T. A 10 Year Installation Program for Wave Energy in Ireland: A Case Study Sensitivity Analysis on Financial Returns. Renew. Energy 2012, 40, 80–89. [Google Scholar] [CrossRef]
  54. Li, G. Feasibility of Large Scale Offshore Wind Power for Hong Kong—A Preliminary Study. Renew. Energy 2000, 21, 387–402. [Google Scholar] [CrossRef]
  55. Climate Change Capital. Offshore Renewable Energy Installation Decommissioning Study. 2010. Available online: https://assets.publishing.service.gov.uk/media/5a8235afed915d74e340250e/900-offshore-renewable-installation-decom.pdf (accessed on 21 April 2024).
  56. National Renewable Energy Laboratory (NREL). Annual Technology Baseline. 2023. Available online: https://atb.nrel.gov/electricity/2023/technologies (accessed on 25 July 2024).
  57. Previsic, M.; Chozas, J. International Levelised Cost of Energy for Ocean Energy Technologies. Ocean. Energy Syst. 2015. [Google Scholar] [CrossRef]
  58. Comisión Federal de Electricidad (CFE). Tarifas. 2024. Available online: https://www.cfe.mx/hogar/tarifas/Pages/Acuerdosdetarifasant.aspx (accessed on 15 March 2025).
  59. SASIPA SpA. Tarifas de Electricidad. 2023. Available online: https://www.sasipa.cl/tarifas-electricas/ (accessed on 14 June 2024).
  60. Energía Estratégica. Precios a la Baja y Rol de la CFE: Estas Son las Tendencias de los Certificados de Energías Limpias en México. 2023. Available online: https://www.energiaestrategica.com/precios-a-la-baja-y-rol-de-la-cfe-estas-son-las-tendencias-de-los-certificados-de-energias-limpias-en-mexico/ (accessed on 17 June 2024).
  61. Facultad de Economía y Negocios Universidad Alberto Hurtado. ¿Cómo Funciona El Mercado de Certificados Verdes En Chile? 2023. Available online: https://fen.uahurtado.cl/2015/articulos/observatorio-economico/como-funciona-el-mercado-de-certificados-verdes-en-chile/ (accessed on 18 July 2024).
  62. Chung, I.K.; Beardall, J.; Mehta, S.; Sahoo, D.; Stojkovic, S. Using Marine Macroalgae for Carbon Sequestration: A Critical Appraisal. J. Appl. Phycol. 2011, 23, 877–886. [Google Scholar] [CrossRef]
  63. Olmedo-González, J.; Ramos-Sánchez, G.; Garduño-Ruiz, E.P.; González-Huerta, R.G. Analysis of Stand-Alone Photovoltaic—Marine Current Hybrid System and the Influence on Daily and Seasonal Energy Storage. Energies 2022, 15, 468. [Google Scholar] [CrossRef]
  64. National Renewable Energy Laboratory (NREL). Utility-Scale Battery Storage. 2023. Available online: https://atb.nrel.gov/electricity/2022/utility-scale_battery_storage (accessed on 13 April 2024).
  65. Lazard. Levelized Cost of Hydrogen Analysis. 2021. Available online: https://www.lazard.com/media/12qcxl1j/lazards-levelized-cost-of-hydrogen-analysis-vf.pdf (accessed on 22 June 2024).
  66. Almar Water Solutions. Desalination Technologies and Economics: CAPEX, OPEX & Technological Game Changers to Come. 2016. Available online: https://kh.aquaenergyexpo.com/wp-content/uploads/2022/09/Desalination-technologies-and-economics-capex-and-opex.pdf (accessed on 10 July 2024).
  67. Clean Hydrogen Partnership. Hydrogen Cost and Sales Prices. 2023. Available online: https://h2v.eu/analysis/statistics/financing/hydrogen-cost-and-sales-prices (accessed on 24 June 2024).
  68. Aguirre, C.; Rutllant, J.A.; Falvey, M. Wind Waves Climatology of the Southeast Pacific Ocean. Int. J. Climatol. 2017, 37, 4288–4301. [Google Scholar] [CrossRef]
  69. Alves, J.H.G.M. Numerical Modeling of Ocean Swell Contributions to the Global Wind-Wave Climate. Ocean Model. 2006, 11, 98–122. [Google Scholar] [CrossRef]
  70. Gross, M.S.; Magar, V. Offshore Wind Energy Potential Estimation Using UPSCALE Climate Data. Energy Sci. Eng. 2015, 3, 342–359. [Google Scholar] [CrossRef]
  71. Mattar, C.; Guzmán-Ibarra, M.C. A Techno-Economic Assessment of Offshore Wind Energy in Chile. Energy 2017, 133, 191–205. [Google Scholar] [CrossRef]
  72. Ilyas, A.; Kashif, S.A.R.; Saqib, M.A.; Asad, M.M. Wave Electrical Energy Systems: Implementation, Challenges and Environmental Issues. Renew. Sustain. Energy Rev. 2014, 40, 260–268. [Google Scholar] [CrossRef]
  73. Wilson, D.G.; Weaver, W.W.; Bacelli, G.; Robinett, R.D. WEC Array Electro-Mechanical Drivetrain Networked Microgrid Control Design and Energy Storage System Analysis. In Proceedings of the 2018 International Symposium on Power Electronics, Electrical Drives, Automation and Motion (SPEEDAM), Amalfi, Italy, 20–22 June 2018; pp. 1278–1285. [Google Scholar] [CrossRef]
  74. Spaulding, M.L.; Grilli, A.R.; Damon, C.; Fugate, G.J. Application of Technology Development Index and Principal Component Analysis. Mar. Technol. Soc. J. 2010, 44, 8–23. [Google Scholar] [CrossRef]
  75. Ahn, S.; Neary, V.S. Wave Energy Resource Characterization Employing Joint Distributions in Frequency-Direction-Time Domain. Appl. Energy 2021, 285, 116407. [Google Scholar] [CrossRef]
  76. Corrales-Gonzalez, M.; Lavidas, G.; Besio, G. Feasibility of wave energy harvesting in the ligurian sea, Italy. Sustainability 2023, 15, 9113. [Google Scholar] [CrossRef]
  77. Zachary, J. Integrated Solar Combined Cycle (ISCC) Systems. In Combined Cycle Systems for Near-Zero Emission Power Generation; Rao, A.D., Ed.; Woodhead Publishing: Sawston, UK, 2012; pp. 283–305. [Google Scholar] [CrossRef]
  78. International Renewable Energy Agency. Renewable Power Generation Costs in 2023. 2024. Available online: http://large.stanford.edu/courses/2024/ph240/lutz1/docs/irena-2024.pdf (accessed on 21 March 2025).
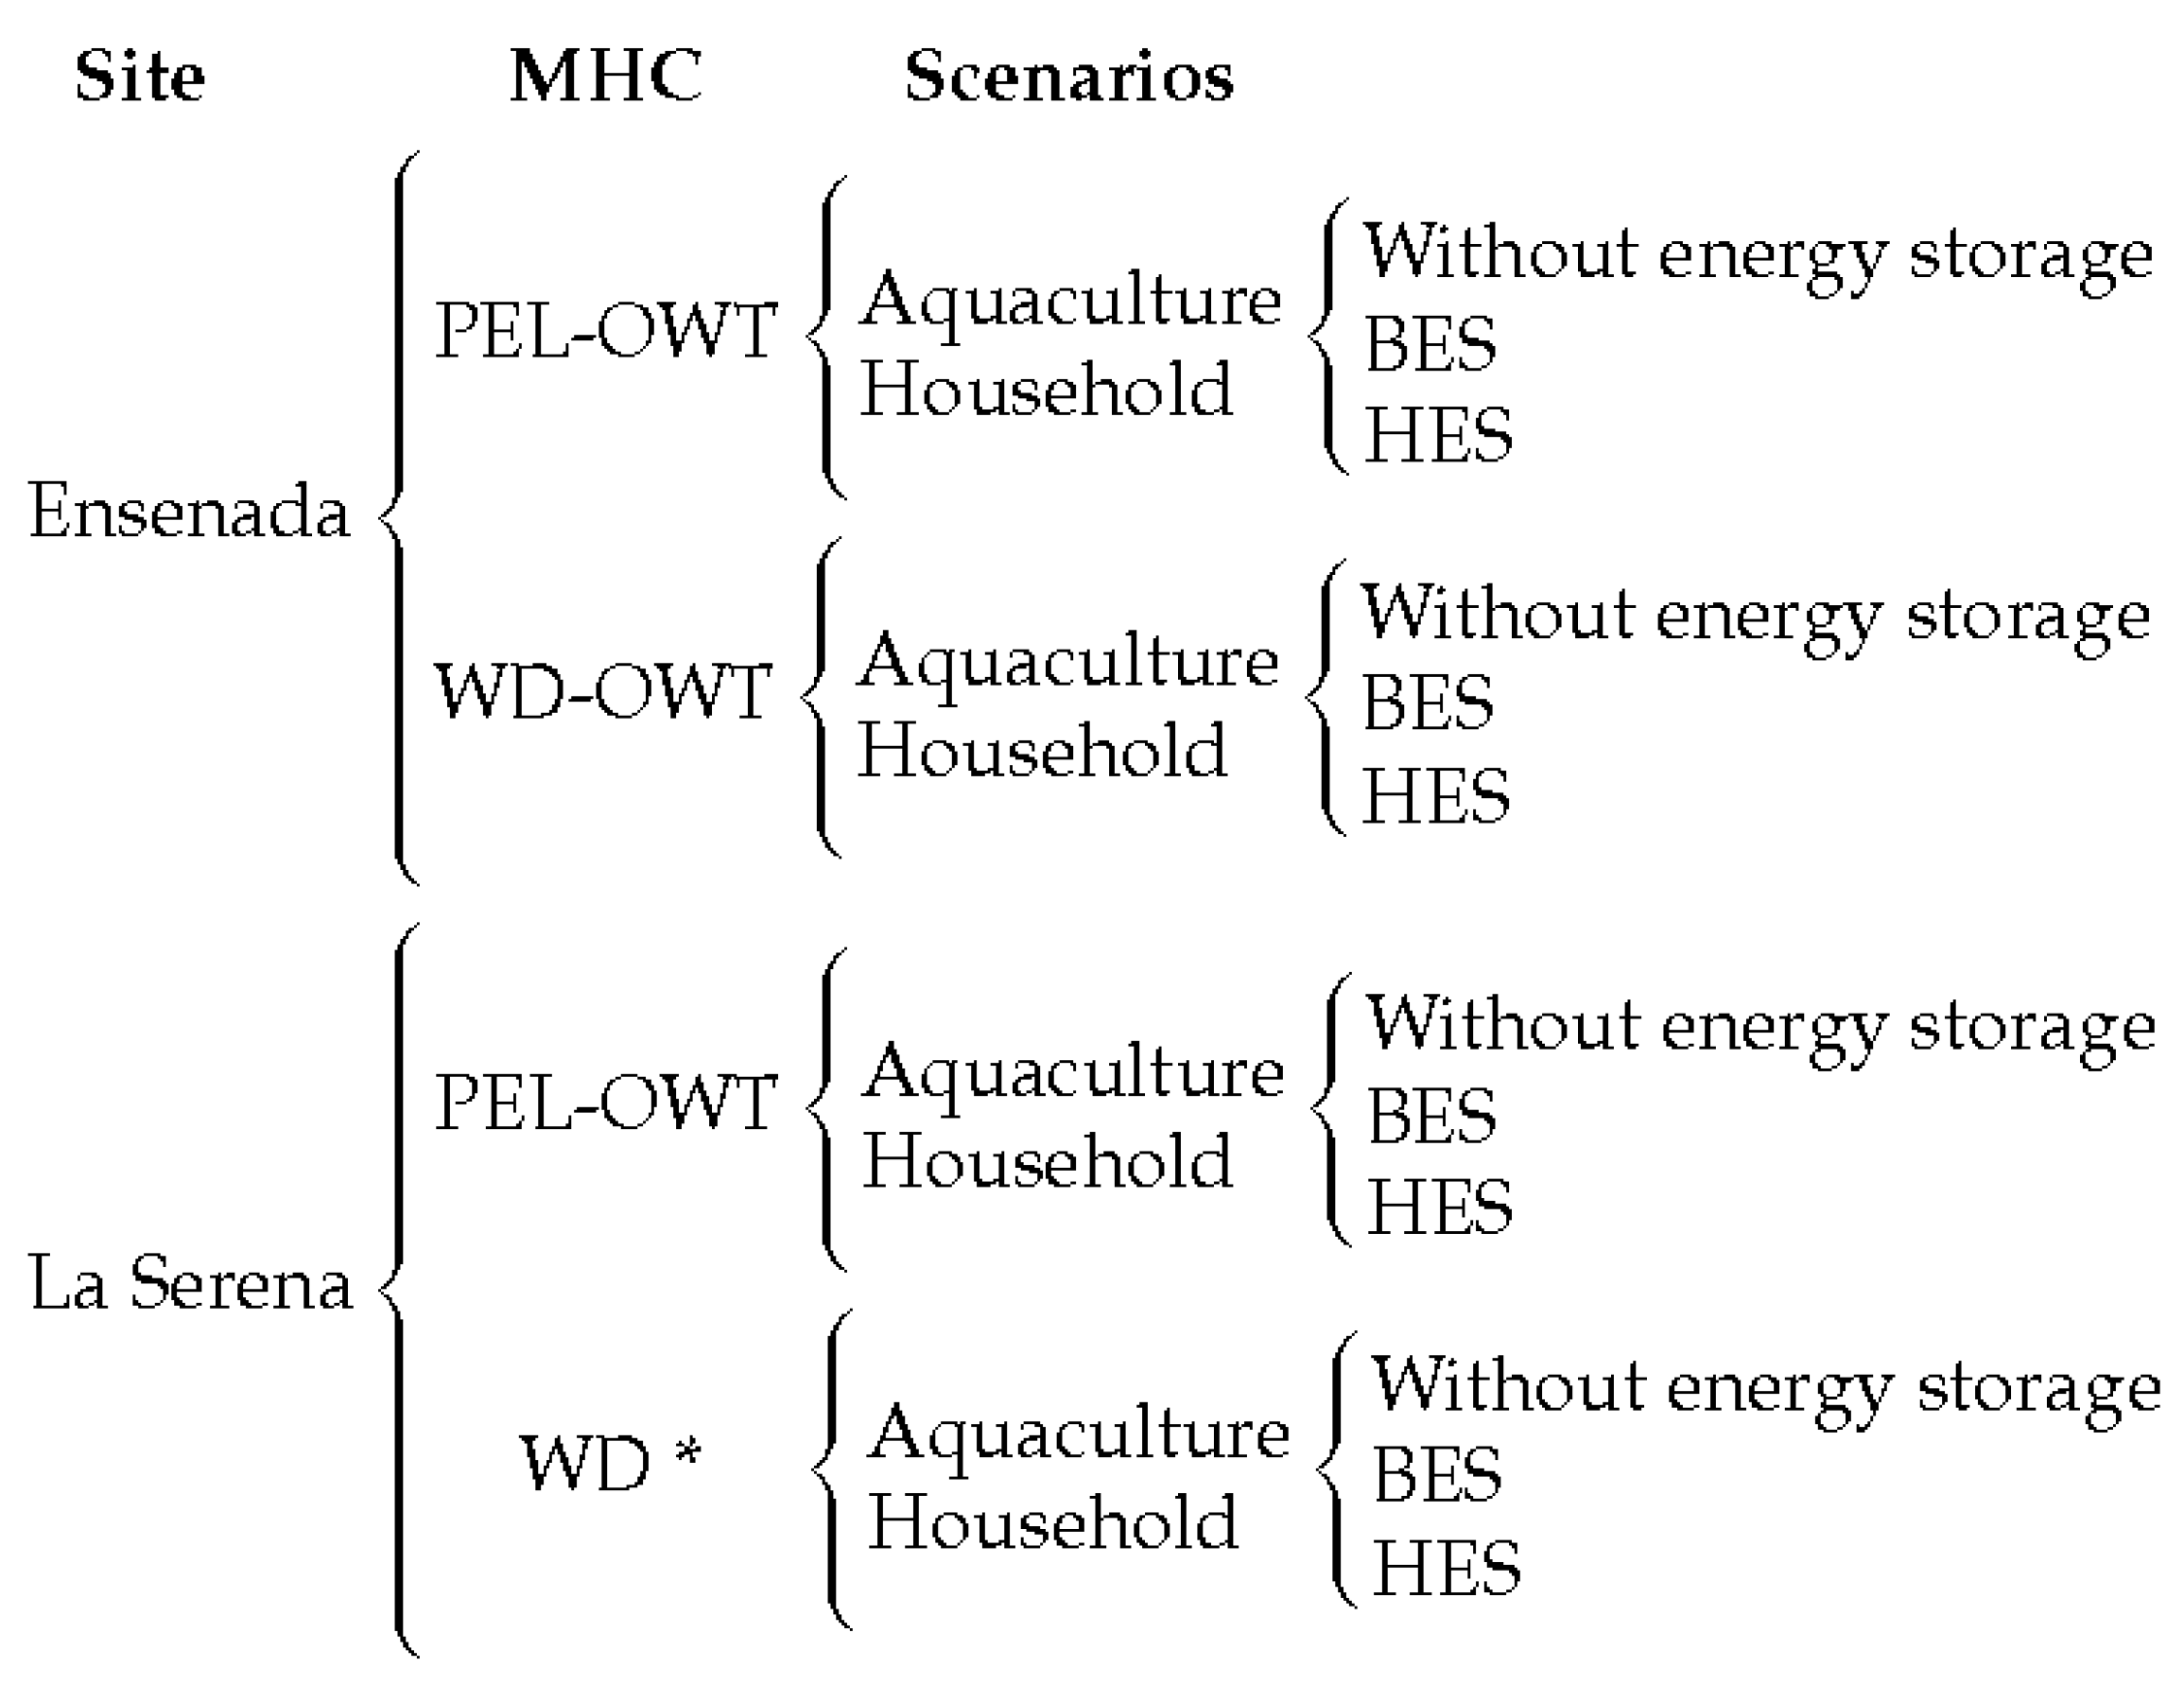
Figure 1. Scenarios for evaluating the feasibility of marine hybrid clusters (MHCs) integrating wave and offshore wind energy for aquaculture production and household electrification. PEL and WD are the Pelamis and Wave Dragon WECs, respectively, and OWT is the offshore wind turbine. BES and HES are the battery and hydrogen energy storage systems. WD* represents an MHC that could supply energy with a single WEC device, without the need for hybridization, used as a baseline for designing other scenarios.
Energies 18 05543 g001
Figure 2. Marine hybrid cluster components and by-products.
Energies 18 05543 g002
Figure 3. Study areas: (a) La Serena, Chile, and (b) Ensenada, Mexico. The color bar represents the bathymetry, with values expressed in meters. The test sites at Panul ( P A N ) and Punta Santo Tomas ( P S T ) coincide with the wave power hotspots. The text legends are La Serena Bay ( L S B ) and Todos Santos Bay ( T S B ), and Todos Santos Islands ( T S I ).
Energies 18 05543 g003
Figure 4. Mean annual and monthly wave power availability at La Serena (a,c) and Ensenada (b,d) over the full hindcast period.
Energies 18 05543 g004
Figure 5. Electricity consumption for aquaculture and domestic use in La Serena and Ensenada.
Energies 18 05543 g005
Figure 6. Electricity generation and consumption for La Serena. Blue and yellow bars represent power generation from the PEL-OWT systems and green ones from the WD systems. The red and purple profiles represent the consumption of aquaculture and household, respectively.
Energies 18 05543 g006
Figure 7. Electricity generation and consumption for Ensenada. Blue and yellow bars represent power generation from the PEL-OWT systems and green ones from the WD systems. The red and purple profiles represent the consumption of aquaculture and household, respectively.
Energies 18 05543 g007
Figure 8. Surplus energy for battery energy storage (BES) and hydrogen energy storage (HES) systems for aquaculture and household use in La Serena (a) and Ensenada (b).
Energies 18 05543 g008
Figure 9. Levelized cost of energy (LCoE) for the marine hybrid clusters at La Serena and Ensenada.
Energies 18 05543 g009
Figure 10. Net present value (NPV) for the marine hybrid clusters at La Serena (a,b) and Ensenada (c,d). Only positive values are shown.
Energies 18 05543 g010
Figure 11. Internal Rate of Return (IRR) for the marine hybrid cluster scenarios in La Serena and Ensenada.
Energies 18 05543 g011
Table 1. Design parameters for marine cluster scenarios.
ScenariosEnergy ConsumptionEnergy GenerationHybridizationNumberNumber
GWh/yearMWh/month (average)GWh/yearMWh/month (average) of WECsof OWT
La Serena PEL-OWT Aquaculture5.87489.069.43785.9844.23%61
La Serena PEL-OWT Household6.59549.399.43785.98
La Serena WD Aquaculture5.87489.068.98747.93N/A10
La Serena WD Household6.59549.398.98747.93
Ensenada PEL-OWT Aquaculture5.88489.8110.49874.5559.56%51
Ensenada PEL-OWT Household6.62552.0310.49874.55
Ensenada WD-OWT Aquaculture5.88489.8110.74895.4060.48%31
Ensenada WD-OWT Household6.62552.0310.74895.40
Disclaimer/Publisher’s Note: The statements, opinions and data contained in all publications are solely those of the individual author(s) and contributor(s) and not of MDPI and/or the editor(s). MDPI and/or the editor(s) disclaim responsibility for any injury to people or property resulting from any ideas, methods, instructions or products referred to in the content.