Review

Sustainable Aviation Fuels: A Review of Current Techno Economic Viability and Life Cycle Impacts

by
Md Nasir Uddin
1,2 and
Feng Wang
1,*
1
School of Science, Computing and Emerging Technologies, Swinburne University of Technology, Hawthorn, Melbourne, VIC 3122, Australia
2
Victorian Hydrogen Hub, Swinburne University of Technology, Hawthorn, Melbourne, VIC 3122, Australia
*
Author to whom correspondence should be addressed.
Energies 2025, 18(20), 5510; https://doi.org/10.3390/en18205510
Submission received: 6 September 2025 / Revised: 29 September 2025 / Accepted: 14 October 2025 / Published: 19 October 2025
(This article belongs to the Special Issue Advances in Hydrogen and Carbon Value Chains in Green Electrification)

Abstract

Australia has set a new climate target of reducing emissions by 62–70% below 2005 levels by 2035, with sustainable aviation fuel (SAF) central to achieving this goal. This review critically examines techno-economic analysis (TEA) and life cycle assessment (LCA) of Power-to-Liquid (PtL) electrofuels (e-fuels), which synthesize atmospheric CO2 and renewable hydrogen (H2) via Fischer-Tropsch (FT) synthesis. Present PtL pathways require ~0.8 kg of H2 and 3.1 kg of CO2 per kg SAF, with ~75% kerosene yield. While third-generation feedstocks could cut greenhouse gas emissions by up to 93% (as low as 8 gCO2e/MJ), real world reductions have been limited (~1.5%) due to variability in technology rollout and feedstock variability. Integrated TEA–LCA studies demonstrate up to 20% energy efficiency improvements and 40% cost reductions, but economic viability demands costs below $3/kg. In Australia, abundant solar resources, vast transport networks, and supportive policy frameworks present both opportunities and challenges. This review provides the first comprehensive assessment of PtL-FT SAF for Australian conditions, highlighting that large-scale development will require technological advancement, feedstock development, infrastructure investment, and coordinated policy support.

1. Introduction

Since the advent of the industrial revolution, there has been a notable escalation in the utilization of fossil fuels, resulting in atmospheric carbon dioxide concentrations exceeding 400 parts per million (ppm) and perpetuating climate change issues [1,2]. In light of this, a total of 175 nations formalized their commitment to the Paris Agreement in 2016, which aims to constrain global temperature increases to 1.5 °C through a comprehensive reduction of emissions across all sectors by 43% by the year 2030 [3,4]. Although road transport continues to be the predominant source of emissions within the transportation sector, both the aviation and maritime industries also significantly contribute to overall emissions [5,6]. Following the pandemic, the commercial air travel sector has experienced a resurgence, with an anticipated growth rate of 3.6% annually through 2042, thus underscoring the critical necessity for decarbonization strategies in these challenging sectors [7,8]. The aviation sector, integral to global transportation and commerce, nonetheless casts a considerable environmental impact through its carbon emissions [9,10], as it directly releases carbon dioxide into the atmosphere. Consequently, there exists a pressing need for innovative solutions that reconcile the operational demands of the industry with the ecological integrity of the planet [11,12]. Attaining net-zero emissions within the aviation sector necessitates the utilization of exclusively Sustainable aviation fuel (SAF) adoption, demanding dramatic production increases of 57% annually through 2030, succeeded by a sustained growth rate of 13% per annum from 2030 onwards [13].
The decarbonization efforts within the aviation sector are being navigated through multiple technological trajectories, each characterized by unique attributes concerning readiness, cost implications, and operational ramifications [14,15]. These advancements are increasingly pivotal as the aviation industry endeavours to explore all feasible avenues toward sustainability, such as the implementation of electrification technologies and hydrogen propulsion systems for short-haul flights as alternatives to conventional carbon-intensive methods [16,17]. SAF is the only near-term, long-distance commercial drop-in solution compatible with existing aircraft, with the potential to reduce lifecycle GHG emissions by up to 86% [18,19]. Notwithstanding, its scalability is predicated on factors such as availability, economic viability, and the considerable primary energy demands associated with its production. Fundamentally, the sustainability of SAF is contingent upon a closed-loop carbon cycle, wherein the carbon dioxide emitted during fuel combustion is demonstrably sequestered from the atmosphere during its synthesis [13,20].
Large-scale commercial deployment in aviation depends on transformative advancements in energy density, which are anticipated to emerge after 2040–2050 [21,22]. SAF is emerging as the most practical pathway for the decarbonization of commercial aviation in the short to medium term (2025–2050), providing immediate drop-in compatibility with existing aircraft and airport infrastructure while achieving a lifecycle CO2 reduction of 70–85%, through advanced biofuel and synthetic fuel production methodologies [23,24]. Although battery electric propulsion holds long-term promise, the current limitations of lithium-ion technology providing only 250–300 Wh/kg compared to aviation fuel’s ~12,000 Wh/kg severely restrict its use to short-haul flights under 500 km and urban air mobility. This inadequate gravimetric energy density means that, before 2050, battery-electric propulsion will remain viable only for niche applications such as urban air mobility or ultra-short regional routes [25,26,27]. Hydrogen-powered aviation faces formidable near-term barriers, including the need for complete aircraft redesigns to accommodate cryogenic storage at −253 °C [28], extensive airport infrastructure upgrades with global transition costs exceeding $1.4 trillion, and unresolved safety risks arising from hydrogen’s wide flammability range and low ignition energy. While hydrogen propulsion offers long-term potential for carbon emission reductions, substantial technical, economic, and safety issues must be resolved first. These include cryogenic storage requirements, fire hazards, and large-scale infrastructure development. Furthermore, fuel cell aircraft currently incur operational costs up to 30% higher and consume more fuel than conventional aircraft due to persistent technological limitations [21,29,30,31,32,33].
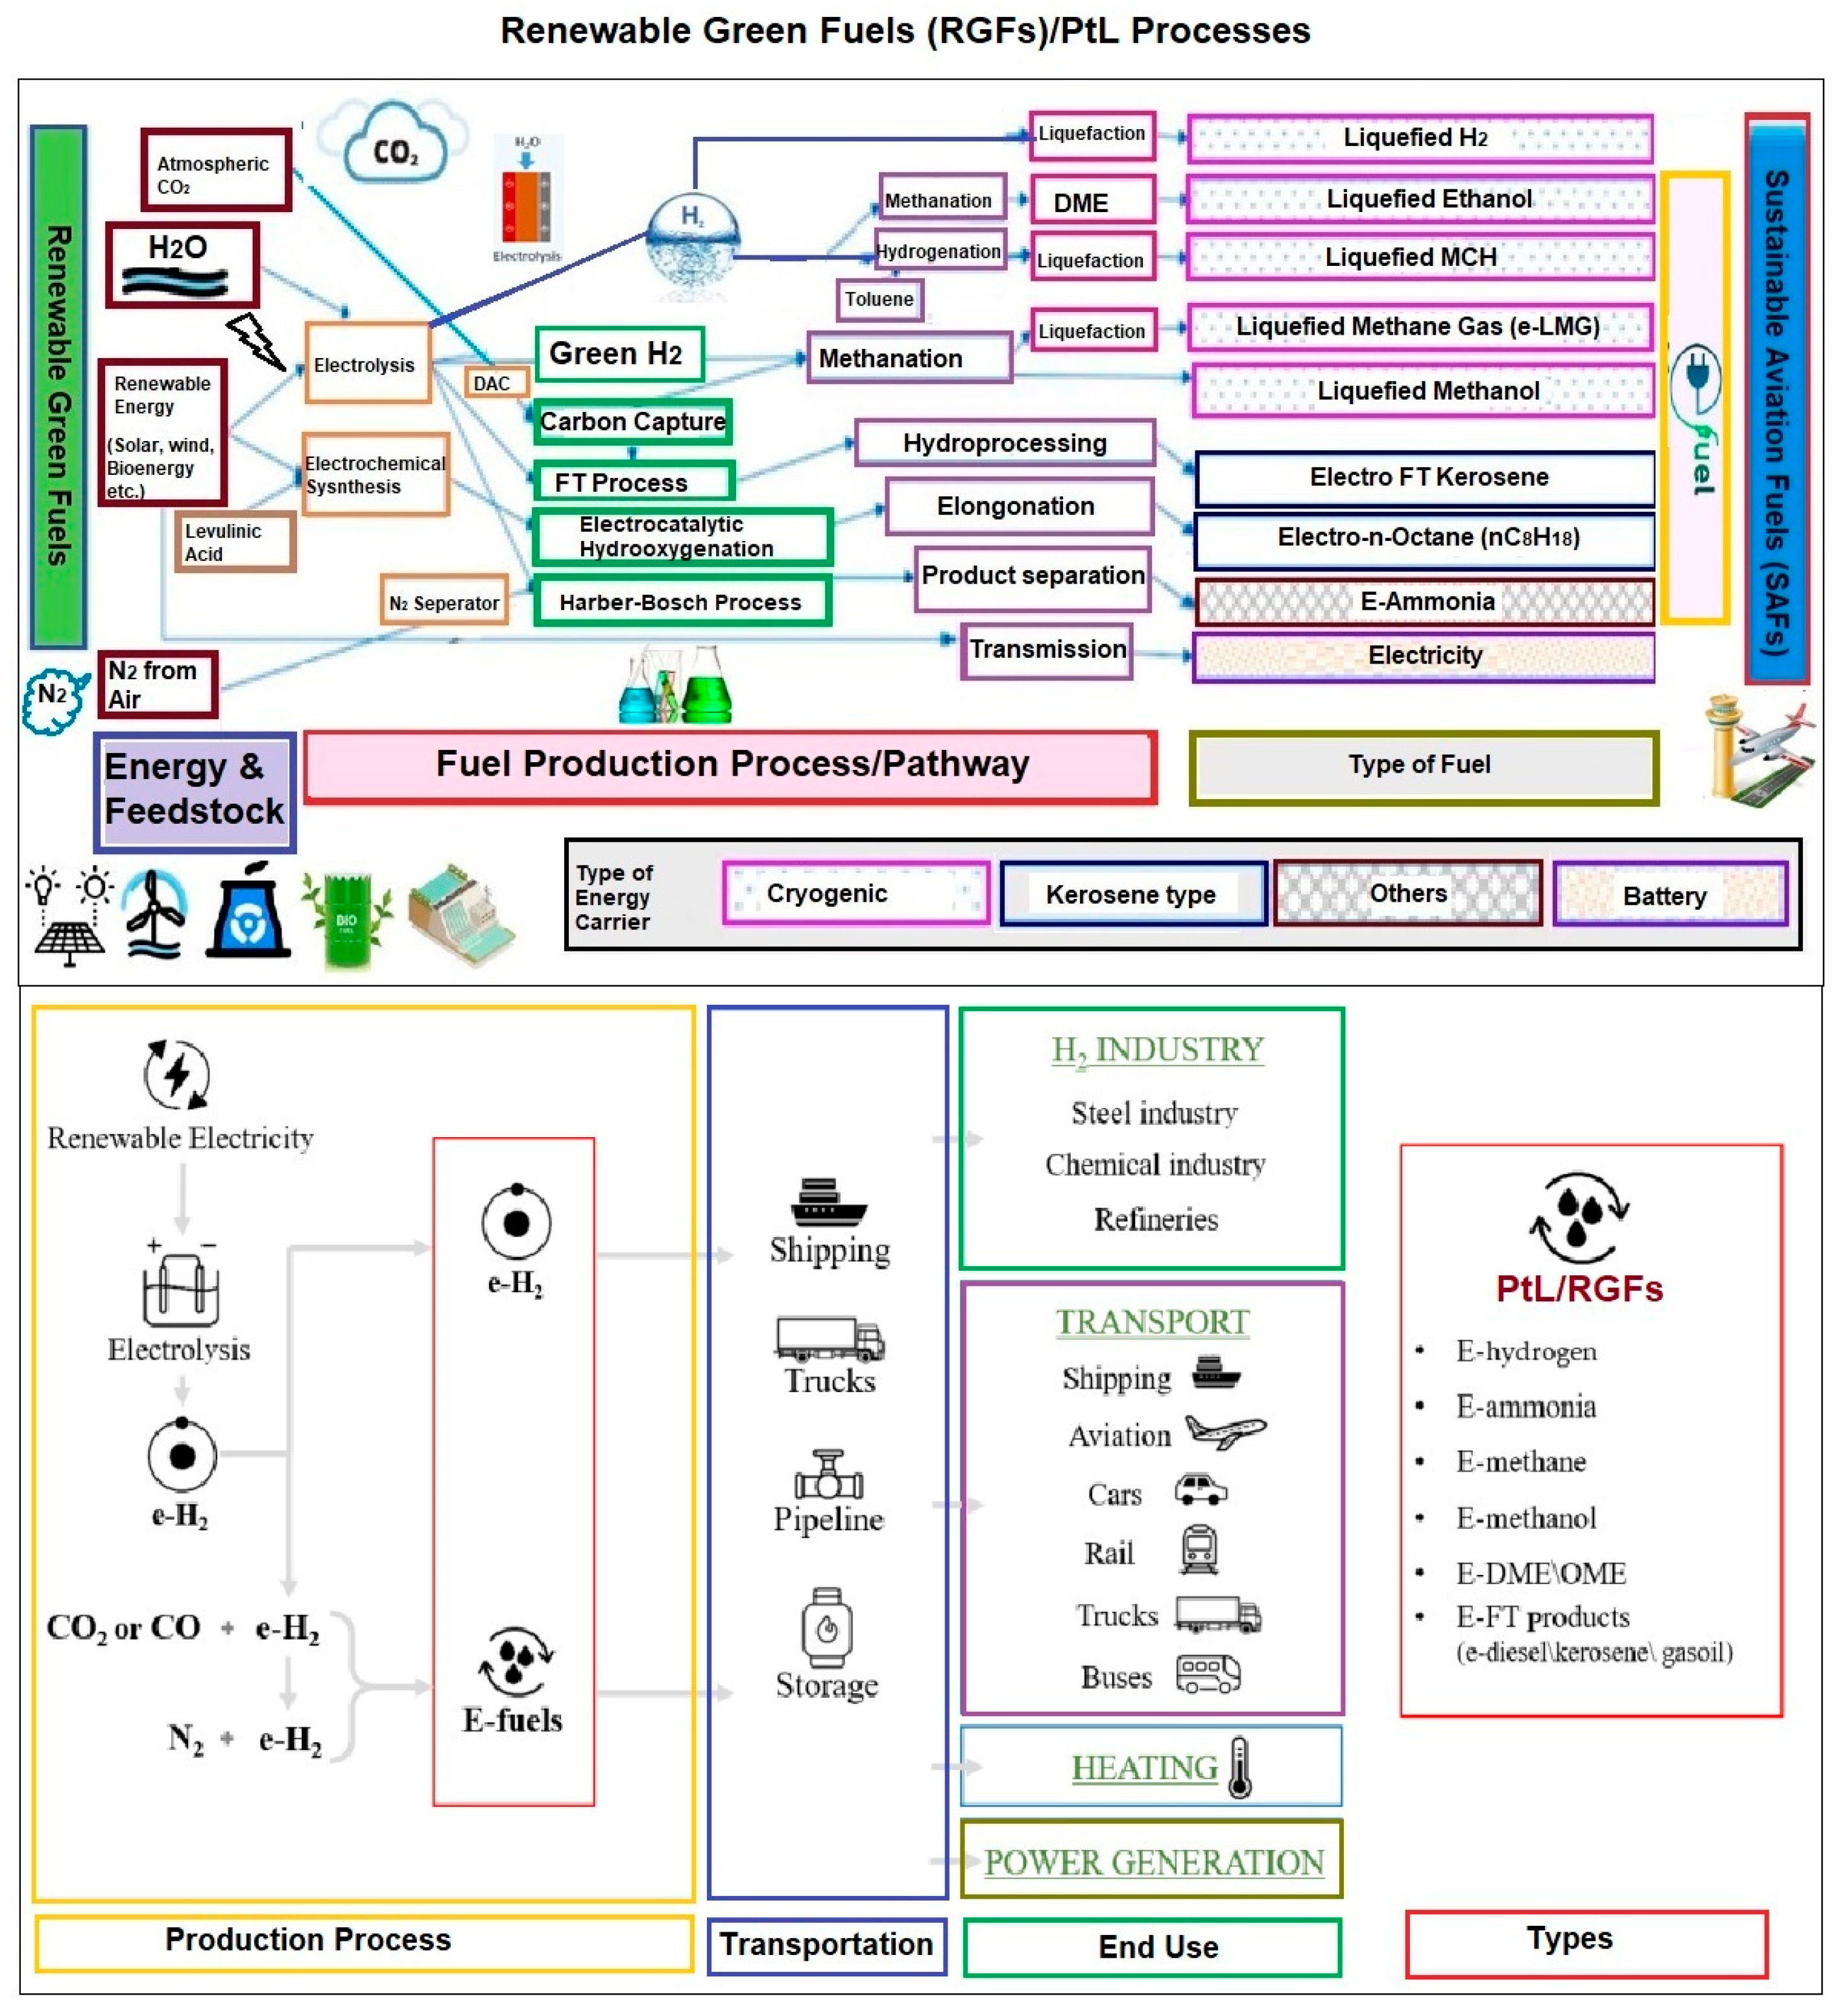
The deployment of SAFs is currently the most effective strategy for reducing carbon emissions in the aviation sector [34,35,36], primarily because they can be used within existing aircraft and airport infrastructure without major modifications. Depending on the feedstock and production pathway, SAFs can achieve up to an 85% reduction in life-cycle GHG emissions [37,38,39,40]. They can be produced from a diverse range of renewable and waste-derived feedstocks, including lipids, municipal solid waste, agricultural residues, and captured CO2 [41,42]. using certified conversion technologies such as Fischer Tropsch synthesis (FT-SPK, FT-SPK/A), alcohol-to-jet (ATJ-SPK), catalytic hydrothermolysis jet (CHJ), and synthetic iso-paraffins (SIP) [43,44]. Figure 1 illustrates the general production process of SAF.
Given their ASTM certification, feedstock flexibility, and compatibility with existing aviation infrastructure, SAFs are positioned as the critical bridging solution toward net-zero targets, enabling meaningful emissions reductions while battery-electric and hydrogen propulsion technologies mature [45]. By contrast, hydrogen and electric aircraft face 30–40% aerodynamic efficiency penalties and 40–70% increases in operational costs, making large-scale adoption economically and technically unfeasible in the next two decades [46,47]. Current SAF scale up efforts, reinforced by policy measures such as the EU’s ReFuelEU Aviation mandatewhich requires 70% SAF integration by 2050 [46,48,49], and similar global commitments, will be central to decarbonizing aviation until alternative propulsion technologies overcome their inherent limitations [22,50].
Among SAF production pathways, the PtL route produces SAF by synthesizing hydrocarbons from renewable hydrogen and captured CO2, offering a pathway toward near-carbon-neutral fuels. Unlike bio-based routes, PtL is not limited by biomass availability, enabling large-scale deployment wherever renewable electricity and CO2 sources are accessible, while delivering drop-in fuels fully compatible with existing aviation infrastructure [51]. In the PtL process, proton exchange membrane (PEM) and alkaline electrolyzers use renewable electricity to split water (H2O) into hydrogen (H2) and oxygen (O2) [52]. Carbon dioxide can be sourced either from industrial point sources or directly from the atmosphere via direct air capture (DAC). The Reverse Water–Gas Shift (RWGS) reaction then converts H2 and CO2 into carbon monoxide (CO), which is fed into a Fischer–Tropsch (FT) synthesis reactor to produce synthetic hydrocarbons [53]. Such processes are essential for achieving deep carbon reductions and advancing the environmental performance of the transportation sector. Beyond lowering lifecycle emissions [54]. SAFs also reduce particulate matter emissions, improving air quality and mitigating health risks associated with aviation [55]. They can help stabilize fuel costs by reducing dependence on volatile oil markets and support economic growth through job creation in regions involved in feedstock supply and processing [56,57]. However, large-scale PtL deployment requires substantial CO2 sourcing [58]. By 2050, global e-fuel production is projected to require approximately 6.1 Gt of CO2 annually far exceeding the estimated 2.8 Gt available from point sources [59,60]. This shortfall underscores the critical need to combine point-source CO2 capture with DAC to scale e-fuel production [61,62]. Ultimately, SAFs, and particularly PtL-derived fuels, offer a compelling route toward a cleaner, more sustainable, and economically resilient aviation sector.
Multiple techniques and pathways exist for producing synthetic SAF, each with distinct chemical reactions and process routes. Aviation fuels can be grouped into synthetic fuels, biofuels, and traditional jet fuels. Each has its own set of attributes that impact their performance and the environment [63]. A well-established supply chain exists for conventional jet fuels derived from crude oil, although their production generates substantial GHG emissions [64]. In contrast, biofuels are produced from sustainable biogenic resources, which can significantly reduce GHG emissions across their entire life cycle. However, biofuel production may compete with food crops and land use and often requires long growth periods. SAF, while promising, faces challenges related to scalability and cost. Generally, feedstocks such as biomass are insufficient to meet the aviation industry’s large-scale demand, and agricultural sources risk competing with food production. The PtL pathway and other synthetic technologies convert captured CO2 into aviation fuel [65], offering the potential to further reduce carbon intensity and lessen reliance on biomass feedstocks. Synthetic fuels particularly those produced using renewable energy can substantially lower greenhouse gas emissions while minimizing competition with food crops [66]. However, their production is highly energy-intensive and economically viable only when abundant, low-cost renewable energy is available [67].
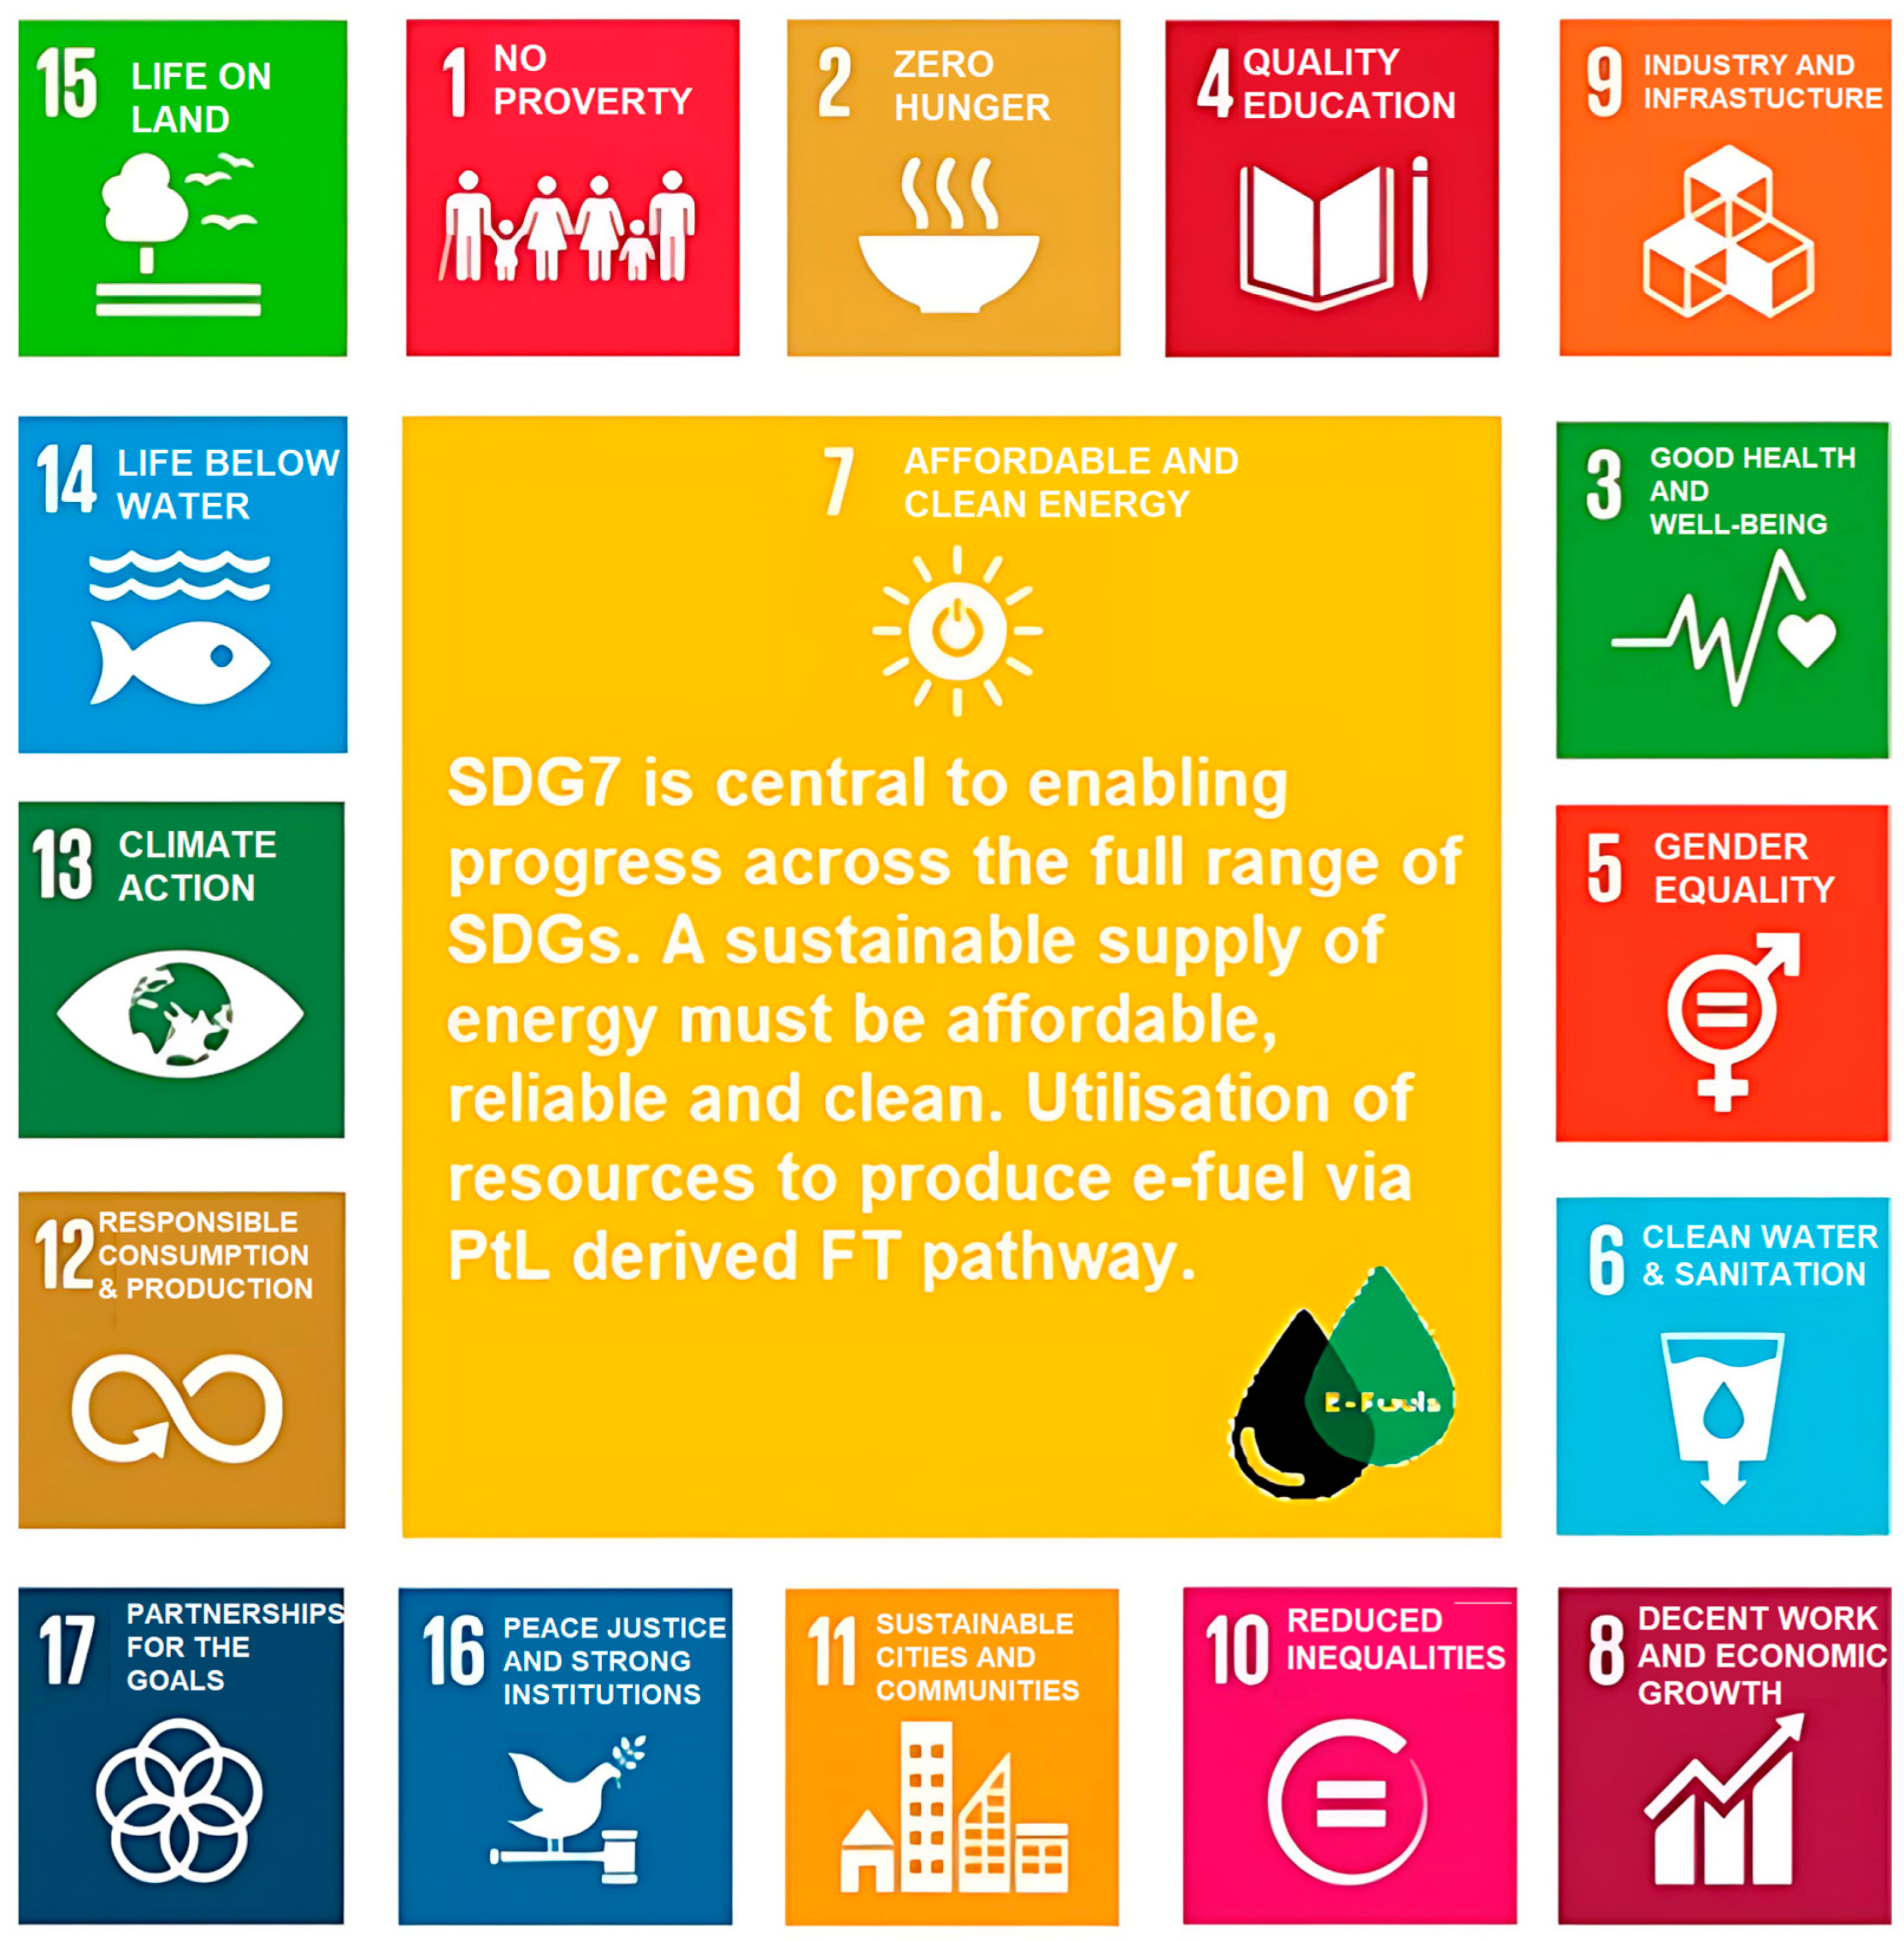
As the aviation industry seeks to reduce its environmental footprint, SAF has emerged as a key solution [21,68]. Among the production methods, synthetic e-fuels created by combining hydrogen with captured CO2 offer promising potential. These fuels can be evaluated using two essential analytical frameworks: technoeconomic analysis (TEA) and life cycle assessment (LCA), which help determine their feasibility and environmental impact [69]. Despite growing interest and development, SAF still faces considerable challenges. Figure 2 presents the United Nations Sustainable Development Goals (UNSDGs) provide a comprehensive roadmap for addressing the global need for long-term, sustainable energy solutions [70]. As illustrated in Figure 2, several SDGs can be directly advanced through the application of LCA and TEA to e-fuel production via the Fischer Tropsch (FT) pathway. The caption within the figure stresses the need for energy that is affordable, reliable, and clean, and mentions the use of resources to produce e-fuel via the PtL derived FT pathway as a sustainable solution. It is always challenging to make sure that feedstock is accessible, set up cost-competitive manufacturing, and meet tight certification standards, such those specified by ASTM International for the use of SAF in commercial aircraft [71]. A notable innovation comes from the U.S. startup Aircela, which has developed a mini device that converts air and water into usable fuel. This system, powered by renewable energy and based on direct air capture (DAC) based PtL, is designed for easy deployment in homes, businesses, and industrial facilities. Now is a critical time to consider both the opportunities and challenges facing SAF particularly those derived from CO2 as technological innovation and policy frameworks continue to evolve. On World Environment Day, 5 June 2025, the Australian Defence Force (ADF) reaffirmed its commitment to national climate goals, pledging to reduce emissions by 43% by 2030 and achieve net zero by 2050 through a series of impactful programs.
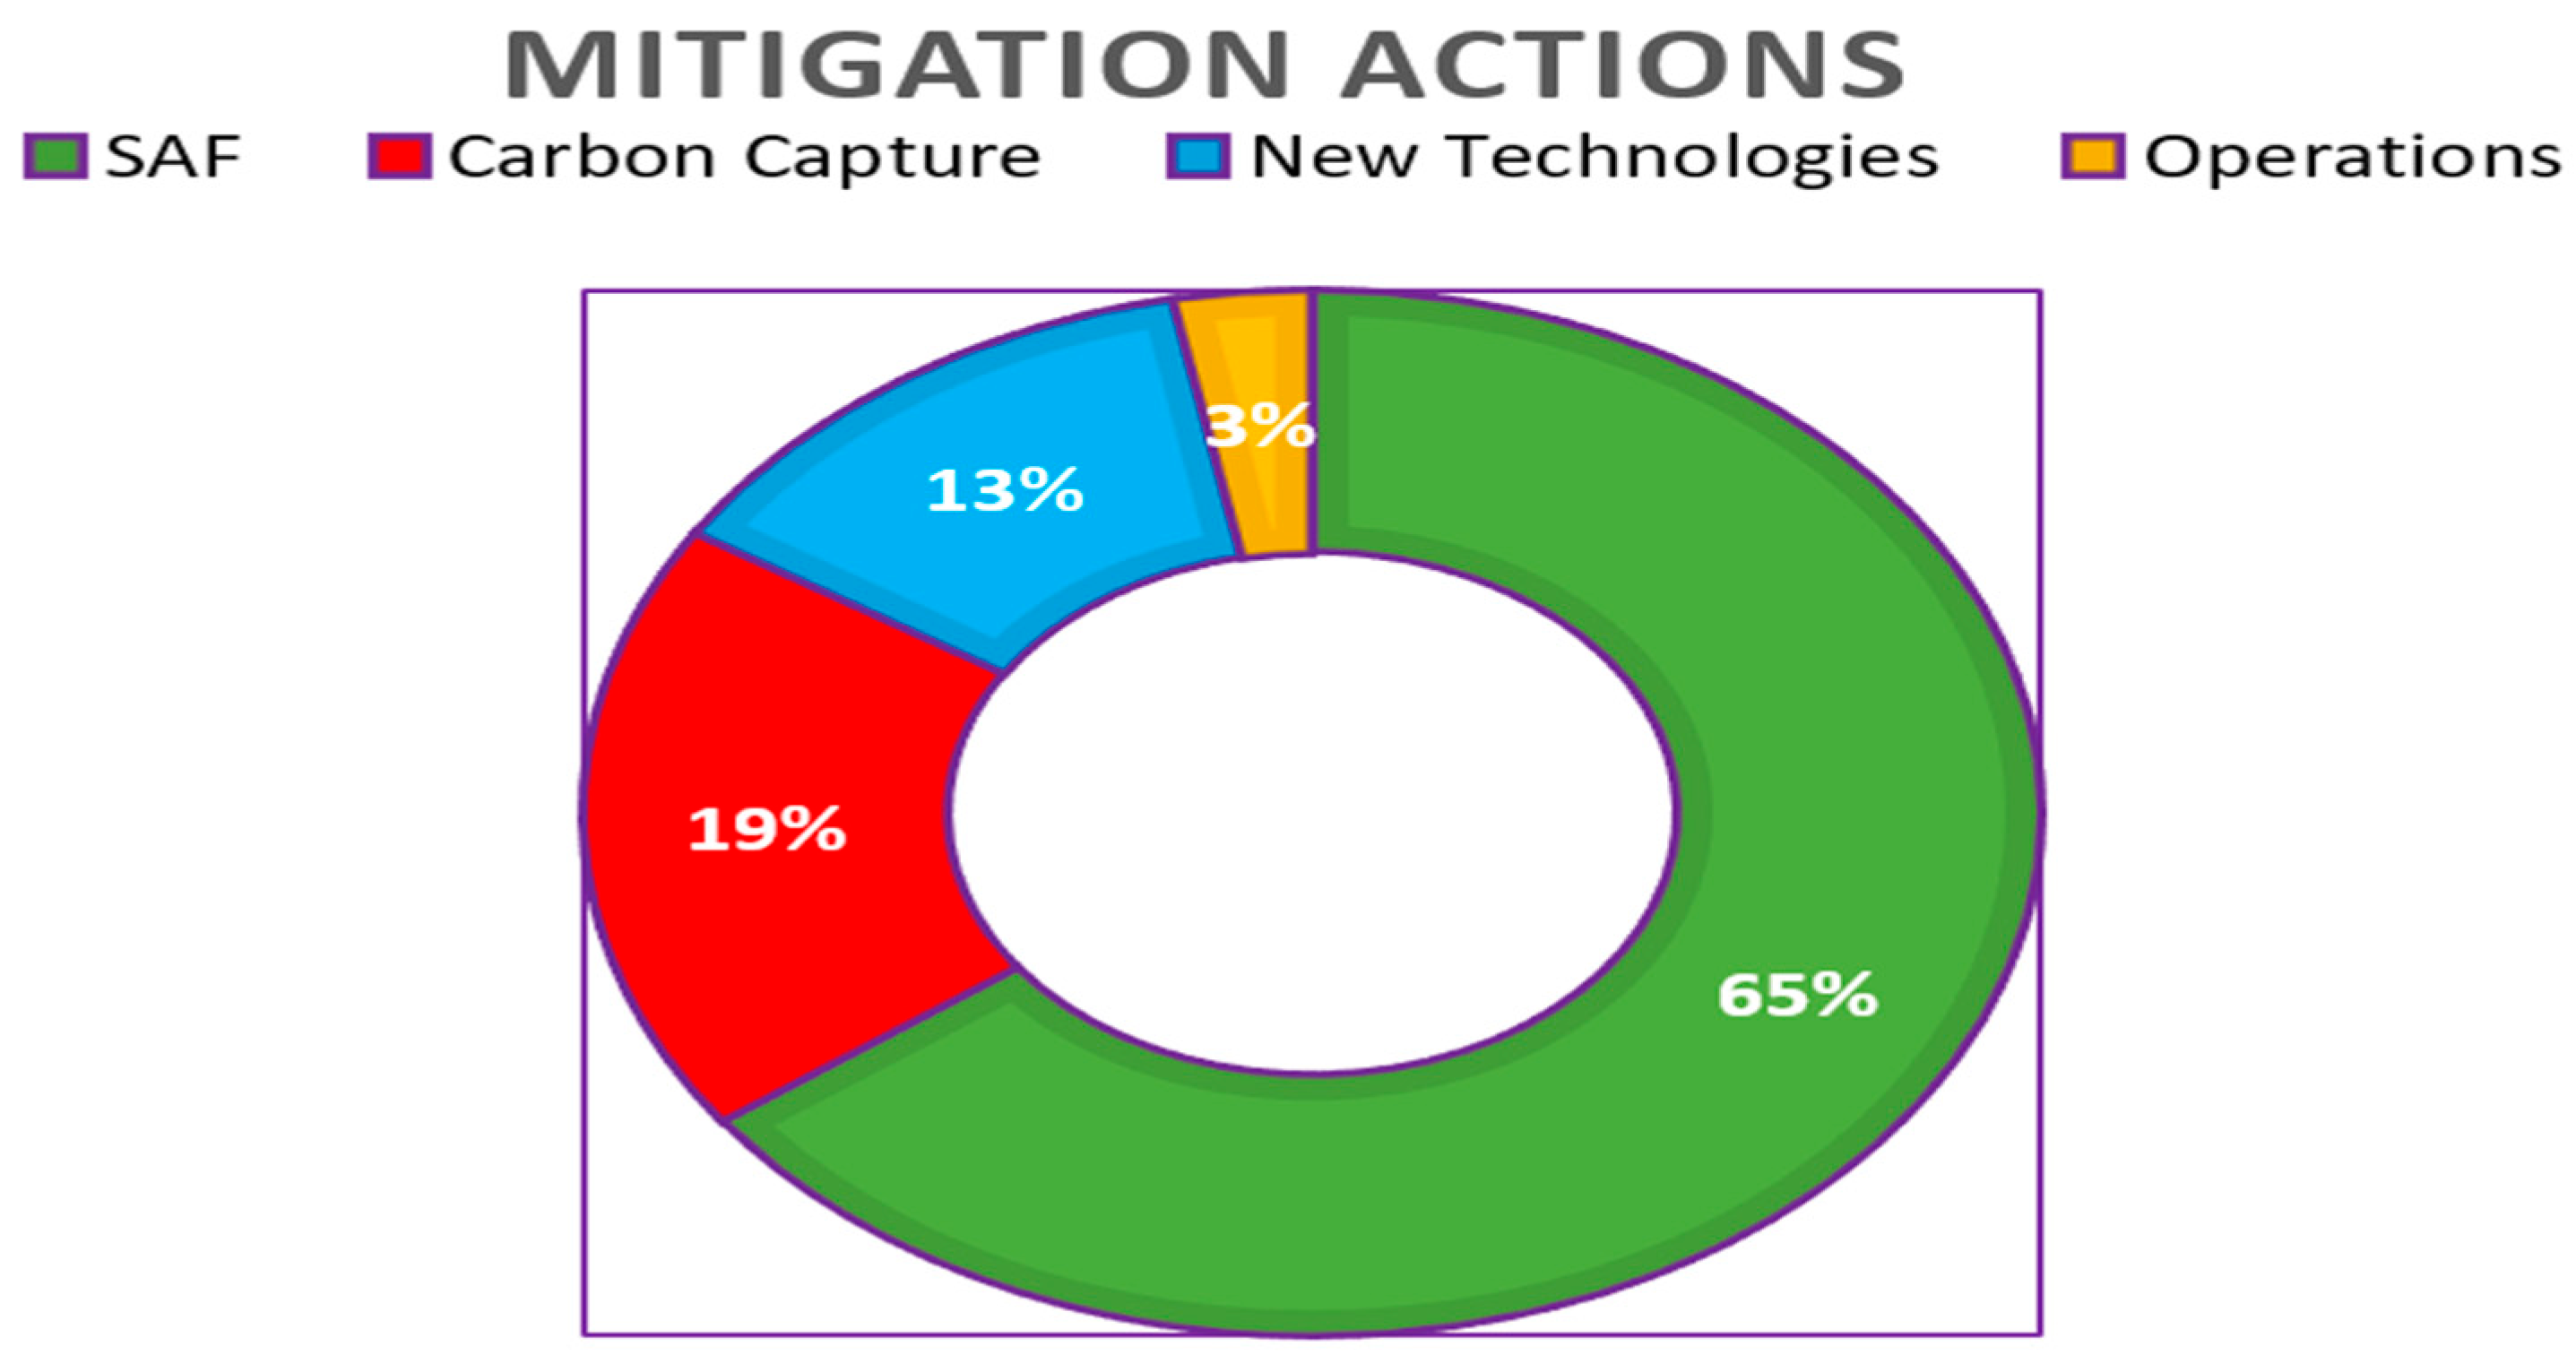
Figure 3 illustrates the emissions reduction pathway for achieving the International Air Transport Association (IATA) target for CO2 mitigation [72]. Meeting this objective requires a multifaceted approach, including the development and deployment of SAFs, the implementation of carbon offsets and carbon capture and storage (CCS), the advancement of novel technologies such as electric and hydrogen-powered aircraft, and enhancements in infrastructure and operational efficiency [73]. While the substitution of fossil fuels with SAFs has the potential to significantly reduce CO2 emissions, it is not sufficient on its own to GHG emissions entirely. LCAs have shown that although SAFs exhibit a lower global warming potential (GWP) compared to conventional jet fuels, their impact remains positive. Consequently, carbon offsets and CCS are essential to address the residual emissions that persist even with widespread SAF adoption [74]. Figure 3 delineates the anticipated contributions of various mitigation strategies towards the attainment of net-zero emissions by the year 2050. Sustainable Aviation Fuel (SAF) is recognized as the preeminent contributor, representing 65% of the overall mitigation potential. Following this, carbon capture technologies contribute 19%, the implementation of new technologies, including advanced aircraft designs and propulsion systems, accounts for 13%, while operational enhancements yield a contribution of 3% [75].
Table 1 summarizes the differences between fossil fuel and e-fuel’s properties. It delineates the comparative analysis of the fundamental characteristics of e-fuels in juxtaposition with conventional fossil fuels. E-fuels, encompassing FTD, FTG, MtG, FTK, MtJ, DME, OME, and MCH, exhibit a range of densities (from gaseous states to 1100 kg/m3) and extensive variations in boiling point ranges, contingent upon the specific fuel type; conversely, fossil fuels such as gasoline, diesel, kerosene, and LPG are characterized by more confined conventional ranges. The lower heating values (LHV) of e-fuels are typically analogous to or marginally inferior to those of fossil fuels, with the exception of DME, OME, and MCH, which present diminished energy densities. The octane and cetane numbers demonstrate considerable variability: certain e-fuels (for instance, OME and MCH) possess exceptionally high octane ratings, whereas others, such as FTD, exhibit elevated cetane values. The miscibility characteristics also diverge, with e-fuels corresponding to particular fossil fuel analogs (for example, FTD aligns with diesel, while FTK corresponds with jet fuel). The chart elucidates the diverse physicochemical properties inherent in e-fuels, thereby affirming their potential as viable alternatives for a variety of fossil fuels in transportation and energy sectors.
Following Japan’s confirmation of two primary SAF production pathways lipid-based hydroprocessed esters and fatty acids (HEFA) and alcohol-to-jet (AtJ) as its main national SAF strategies, Australia is also adopting these two pathways as key national priorities, as outlined in the recently released Asia-Pacific (APAC) Low Carbon Fuels and CCUS Summit White Paper [80]. HEFA fuels, derived from renewable sources such as vegetable oils, can readily replace conventional jet fuels. Fischer Tropsch synthetic kerosene (FTSK), produced from natural gas or biomass, offers high energy density but remains expensive and technically challenging to manufacture. ATJ fuels, produced from renewable alcohols such as ethanol, can help reduce particulate emissions, though they may compete with feedstocks [81]. Biomass-to-liquid (BtL) SAFs from lignocellulosic materials hold promise, but their production must become more scalable and cost-effective [82]. Power-to-liquid (PtL) SAFs, synthesised from renewable electricity and captured CO2, avoid land competition but require further technological advancements to reduce costs [83].
The existing SAF literature reveals significant methodological and geographic limitations that have hindered comprehensive understanding of production viability, particularly within the Australian context. Previous research has predominantly concentrated on North American and European frameworks, with minimal Australia-specific investigation [84], creating a substantial knowledge gap for Australia’s distinctive renewable energy landscape and extensive transportation infrastructure. Most existing studies have relied on national or global averages rather than employing high-resolution spatial analysis, thereby undermining their relevance for regional policy development [85]. These geographic biases are compounded by critical methodological deficiencies that permeate the field: limited integration of geospatial TEA-LCA frameworks despite their demonstrated effectiveness in US case studies; insufficient utilization of primary process data with over-reliance on secondary databases [86]; absence of multi-criteria decision frameworks that adequately combine environmental, economic, and social objectives [87]; and inadequate treatment of uncertainty and sensitivity analyses across both TEA and LCA dimensions.
PtL technology assessments have particularly under-explored critical system dependencies, including electricity sourcing variability, direct air capture capital costs, and regional water resource requirements, with most studies remaining confined to single-case analyses without systematic comparison of renewable energy integration options such as offshore versus onshore systems or grid-connected versus dedicated renewable installations. The literature consistently lacks temporal dynamics modeling, failing to capture seasonal feedstock yield variations, hourly energy supply fluctuations, and long-term land-use trajectory implications, while frequently excluding flight-level operational differences and short-lived climate forcers that bias mitigation estimates for specific routes and fleet operations [88]. Most critically, no comprehensive, spatially-resolved national TEA-LCA synthesis exists for Australia despite identified production potential [89], leaving value-chain constraints including port infrastructure capacity, industrial cluster development, water availability, and regulatory frameworks unquantified compared to their international counterparts [90]. This research addresses these fundamental gaps by providing the first comprehensive, quantitative assessment of PtL derived FT SAF viability specifically tailored to Australian conditions, incorporating advanced geospatial analysis, integrated TEA-LCA methodology, and region-specific renewable energy resource evaluation.
This review provides an update outlining a variety of issues of the development and use of SAF with two main goals to (1) synthesize existing knowledge on SAFs into a coherent overview of the field, and (2) examine the technical, economic, and environmental challenges that currently hinder their widespread adoption. The study wants to start a more educated and nuanced global discourse about the future of SAFs by looking at these things. The review also talks about distinct regional strategies and the issues and solutions that have been found in different parts of the world. A lot of the research that has been done so far has looked at only one part of sustainable fuel, such how to get the raw materials or how to make the fuel. However, there are still not enough studies that look at all these factors together and how they affect each other.

2. SAF Development in Australia

For Australia vast, remote, and geographically isolated aviation is not a convenience but a lifeline, and often the only viable connection to the rest of the world. Aviation is part of its national security and infrastructure because it connects its scattered population and makes it possible for important services like transporting people and goods, responding to emergencies, evacuating sick people, and protecting the country. It also has a big impact on the economy because it helps tourism, trade, and business [91]. Given this reliance, decarbonizing aviation is a national priority, and SAFs offer the most immediate and scalable pathway to maintain connectivity while significantly reducing GHG emissions, responsible for 2.5% of global carbon emissions, faces challenges as passenger demand and fuel consumption are projected to rise sharply in Australia, with domestic emissions doubling from 1990 to 2019 and fuel demand expected to grow by 75% by 2050 [48,92].
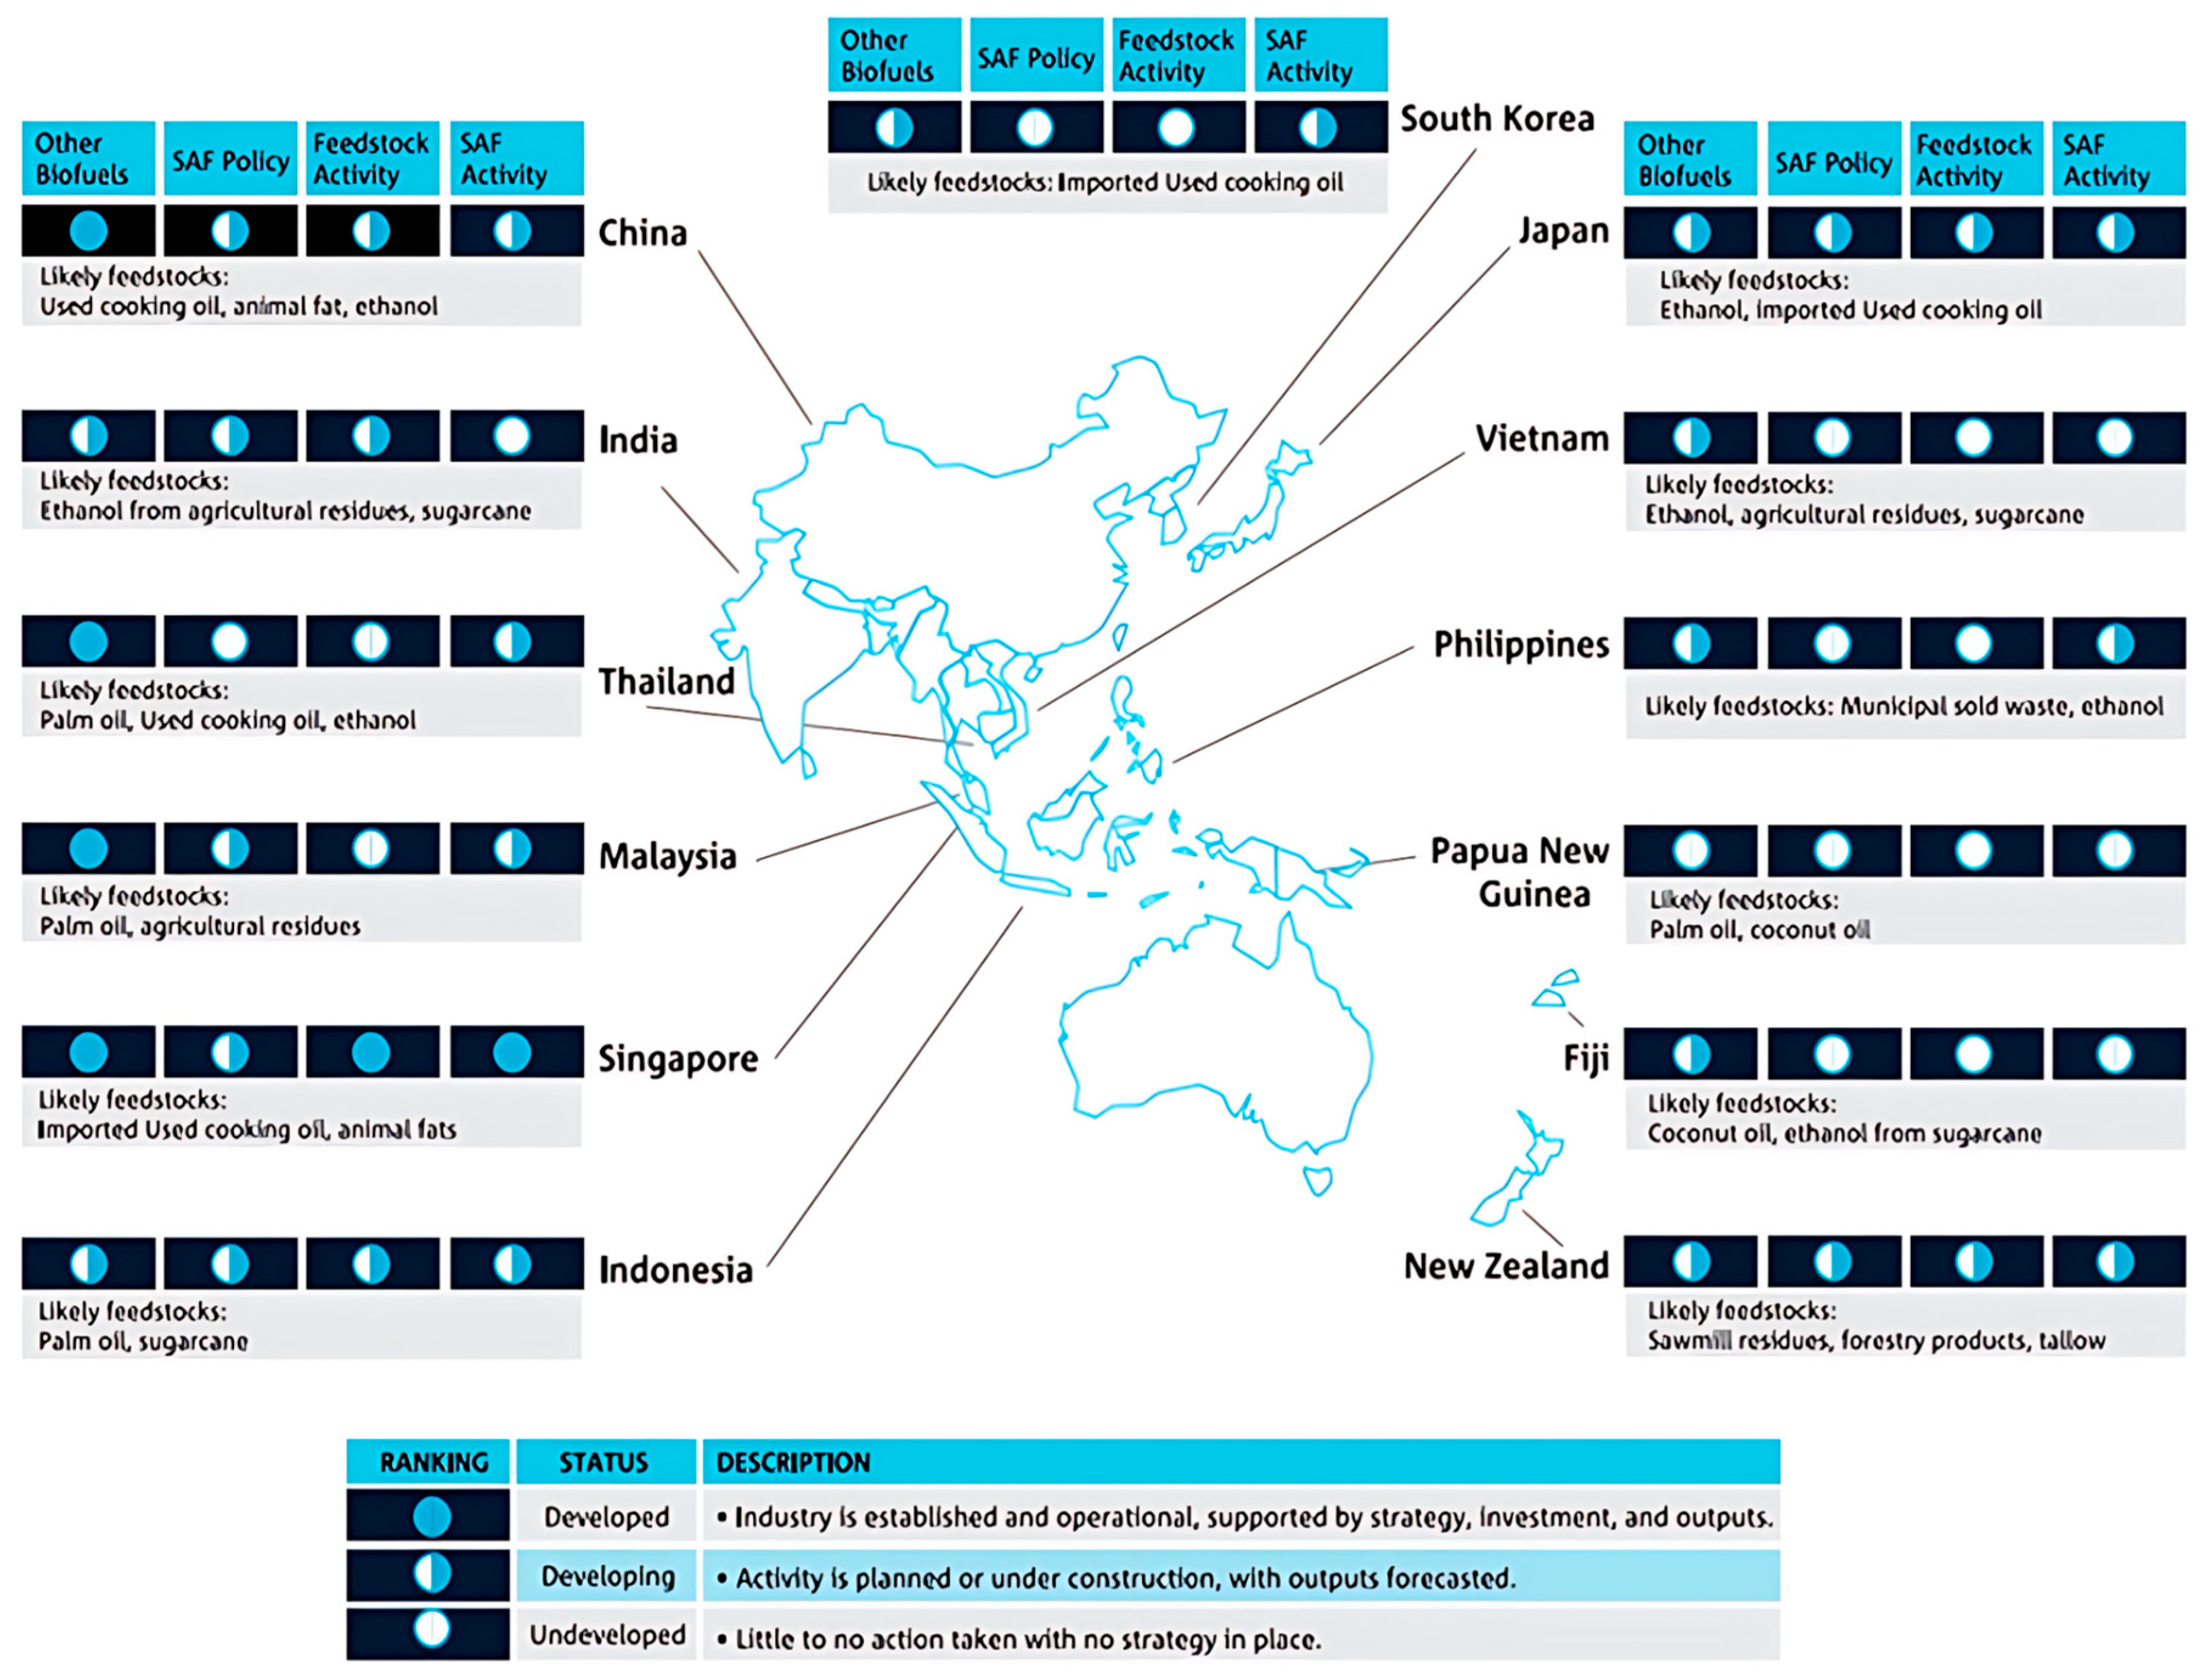
Figure 4 illustrates SAF activities across the Asia Pacific (APAC) region. Singapore and Japan are emerging as key SAF refining hubs, relying primarily on imported feedstocks. Meanwhile, major agricultural producers such as China, Malaysia, and Thailand are positioning themselves to lead in feedstock supply while also expanding their refining capabilities [93]. For Australia, developing a domestic SAF industry is both a strategic necessity and an opportunity to enhance environmental and economic resilience [94]. At present, approximately 90% of Australia’s liquid fuels including aviation jet fuel are imported, creating a heavy dependence that heightens exposure to geopolitical instability and supply chain disruptions, while contributing to more than 14% of the nation’s total carbon emissions [90].
Australia’s unique geography an isolated continent with no land borders and a widely dispersed population makes aviation indispensable for domestic connectivity, international trade, emergency response, and national sovereignty. The APAC region offers distinct advantages for SAF production, and Australia is well-placed to capitalise on them. The country possesses abundant solar resources for renewable energy generation [95], substantial feedstock availability from agricultural waste, municipal residues, and canola (much of which is currently exported), as well as surplus biomass. These factors position Australia to scale SAF production efficiently across its diverse states and territories.
Australia has strong potential to meet a substantial share of its jet fuel demand with domestic feedstocks and emerging conversion technologies potentially supplying 60% of demand by 2025 and up to 90% by 2050 through expanded biogenic resources and hydrogen production [96]. The federal government, primarily through the Australian Renewable Energy Agency (ARENA), has funded feasibility studies for bio-refineries using sugarcane waste in Queensland, as well as infrastructure trials at Brisbane Airport. Parallel private-sector investment is also advancing: HAMR Energy is assessing a methanol-to-SAF plant in South Australia/Victoria that could produce 125 million litres annually by 2030, generating significant employment and regional economic benefits [97]. Major airlines, fuel suppliers, and airports—including Qantas, Virgin Australia, Ampol, and Sydney Airport are calling for federal regulation and investment incentives to accelerate domestic SAF production. Economic modelling suggests that replacing feedstock exports with value-added local SAF production could add $13 billion to GDP and create thousands of jobs by 2040 [94].
Figure 4. Biofuels and SAF Activities Across Asia and Oceania (APAC) [96]. The map highlights country-level engagement in biofuels and SAF, showing feedstock types and activity status across four categories: Other Biofuels, Feedstock Activity, SAF Policy and Activity. Countries are ranked as Developed, Developing, or Undeveloped based on industry maturity and strategic progress.
Energies 18 05510 g004
Australia’s demand for aviation fuel and the number of air passengers is expected to grow substantially in the coming decades, driving a corresponding rise in GHG emissions. Between 1990 and 2019, domestic aviation emissions doubled, and by 2050, fuel demand is projected to increase by 75% [94]. This trend underscores the urgent need for low-carbon alternatives such as SAF. Australia possesses a diverse range of feedstocks for SAF production, spanning both biogenic sources and PtL pathways. However, at present, SAF is available only on flights departing from airports with dedicated supply. Developing domestic biorefineries and the supporting supply chains would not only strengthen Australia’s energy security but also create employment across rural and urban areas advancing the nation’s broader goals of economic growth and a low-carbon transition.
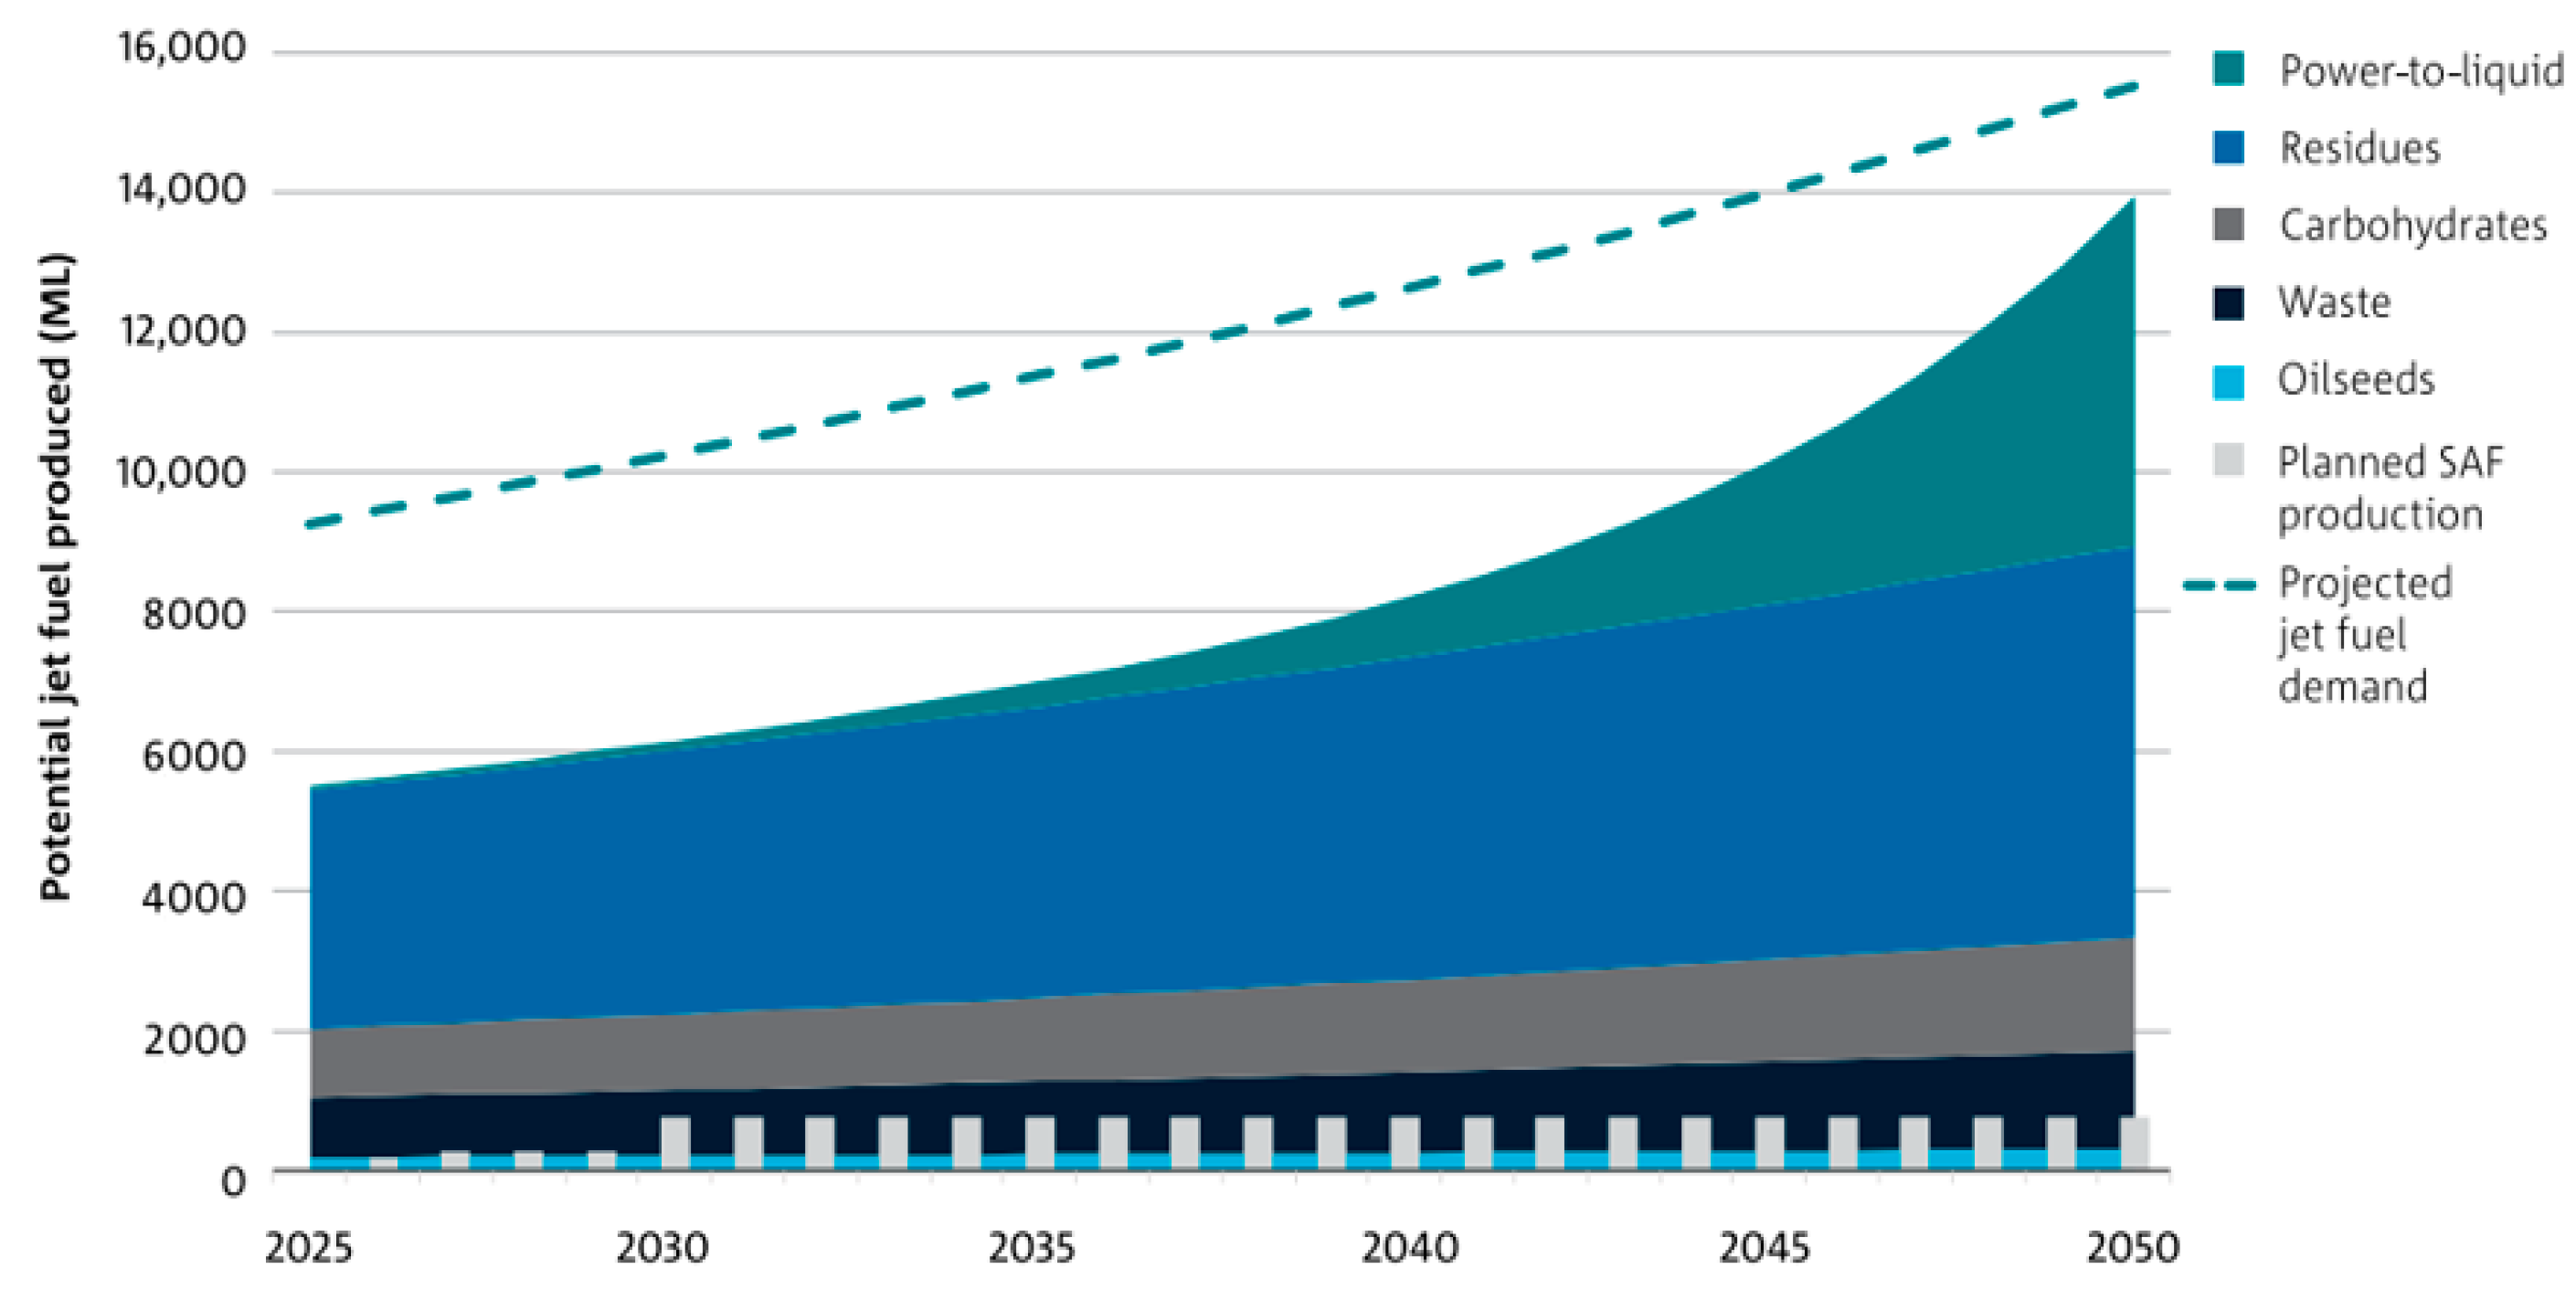
Figure 5 illustrates the potential volume of jet fuel that could be produced from various feedstocks in Australia, compared against the projected national demand. The dashed line represents projected jet fuel demand, which is expected to rise steadily over the next 25 years, remaining well above the total potential production from available feedstocks for most of the period. While all feedstock categories residues, carbohydrates, waste, and oilseeds are projected to grow only gradually, the PtL pathway stands out as the dominant growth driver. PtL production capacity is projected to expand dramatically, from under 6000 ML in 2025 to nearly 14,000 ML by 2050, positioning it as the key technology for closing the supply demand gap. This reflects both the scalability of PtL when powered by abundant renewable energy and its independence from biomass feedstock limitations. Australia’s diverse resource base including agricultural residues, municipal waste, oilseeds, and abundant renewable electricity provides a strong foundation for SAF production. With targeted policy support, infrastructure investment, and industry partnerships, Australia could meet a substantial share of its jet fuel needs domestically by 2050. This shift would significantly reduce reliance on imported fossil jet fuel, enhance national energy security, and contribute to deep decarbonisation of the aviation sector.
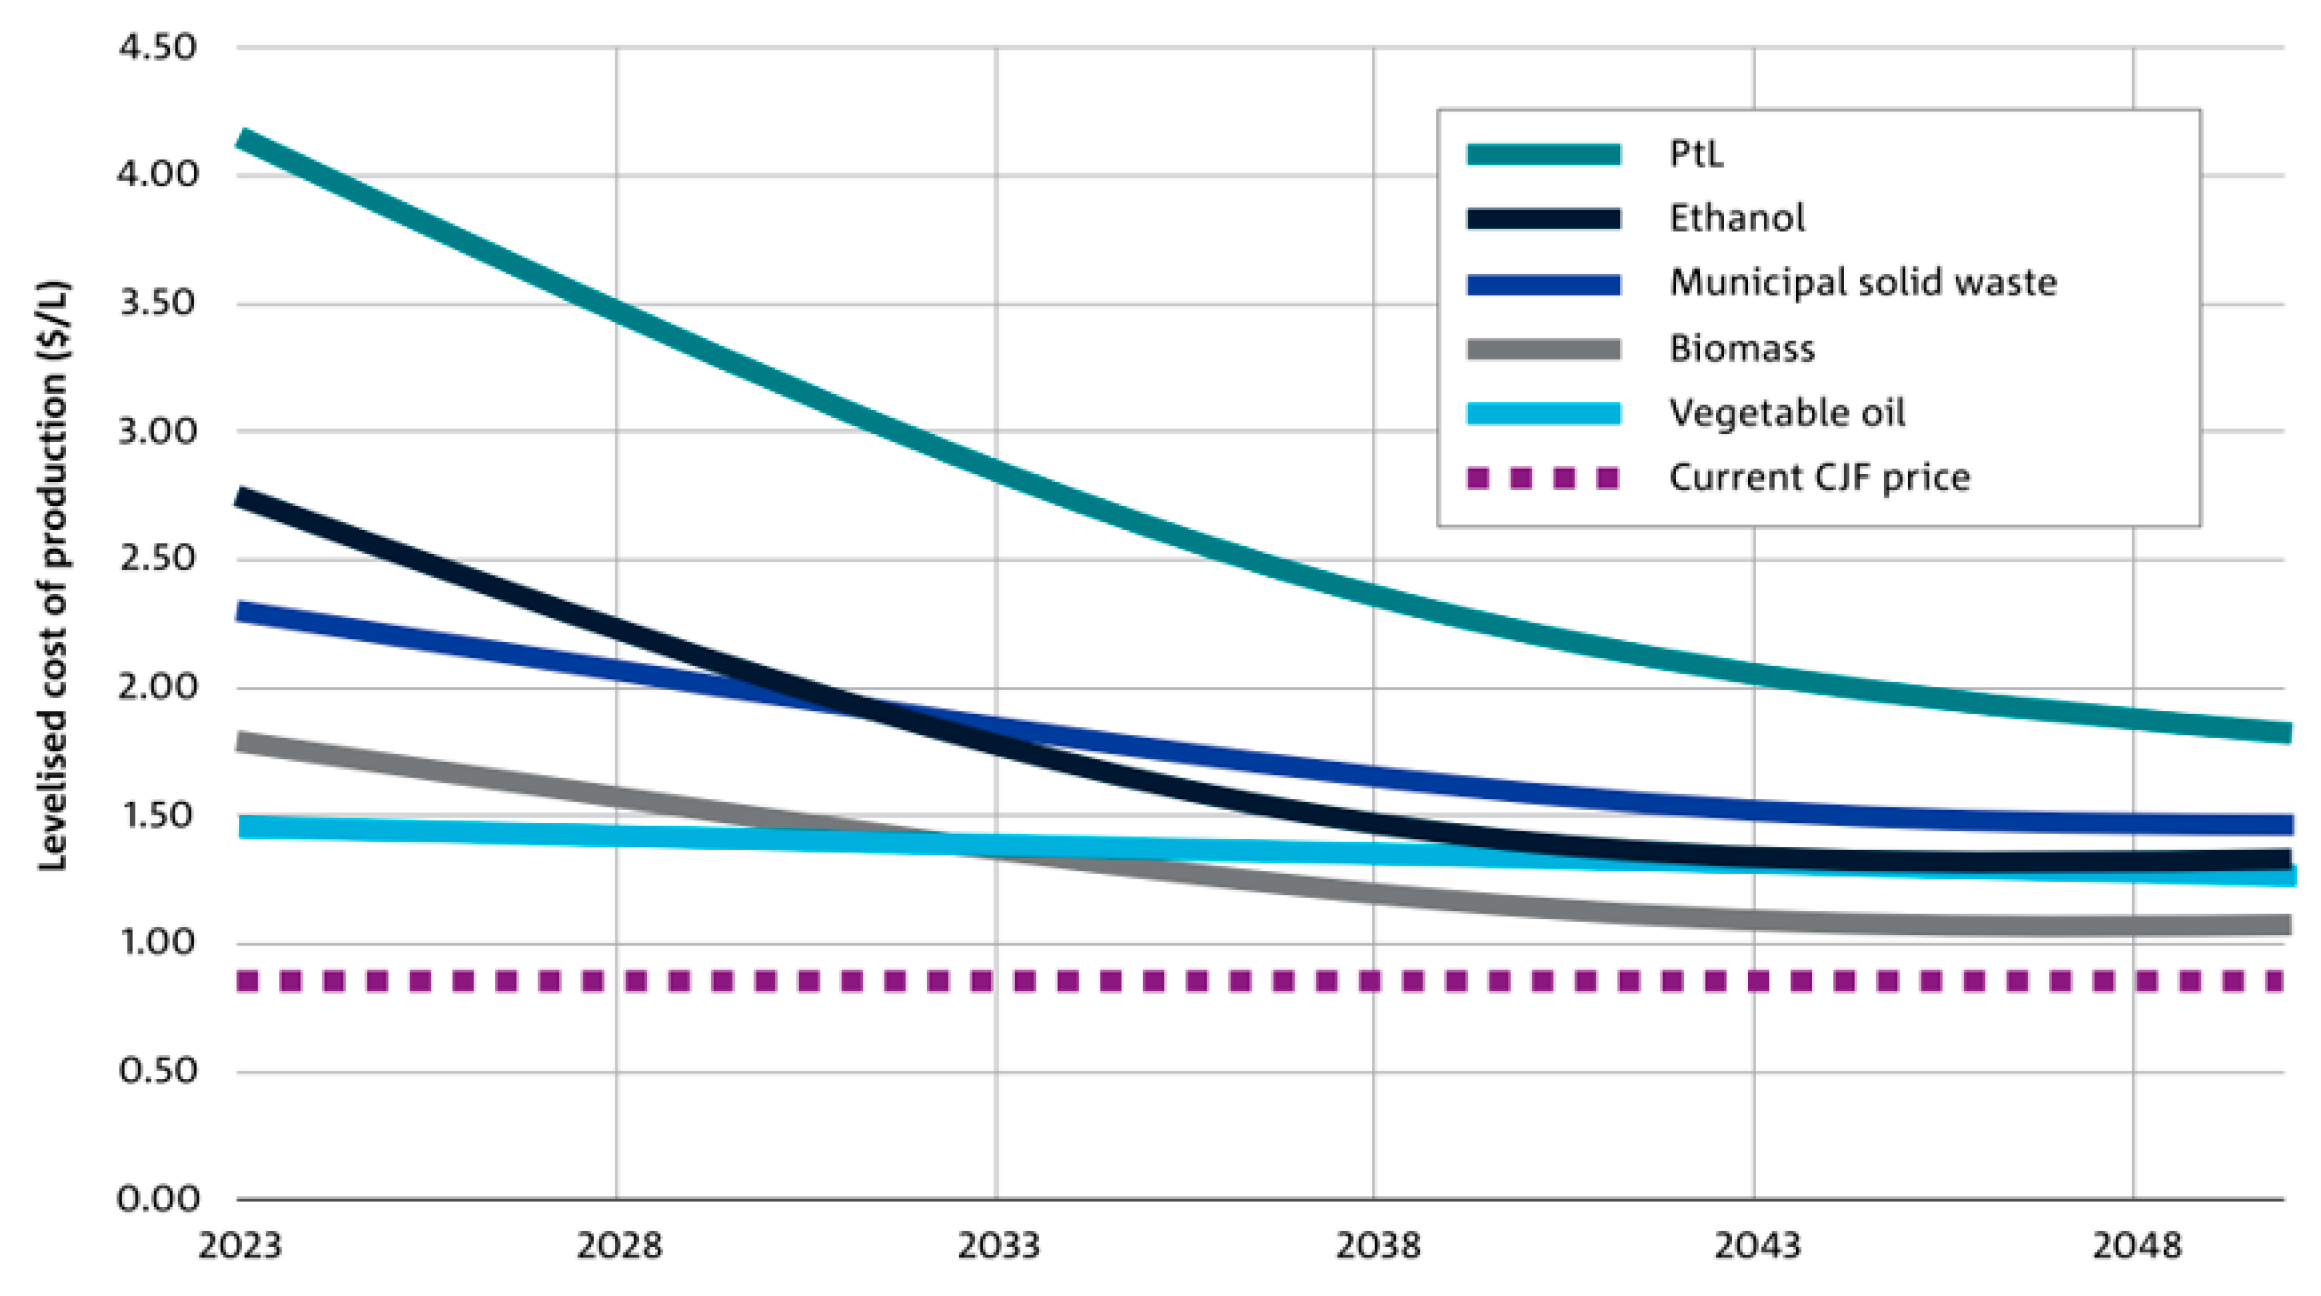
The economic viability of different SAF production pathways is heavily influenced by feedstock availability, market trends, and technological maturity. Feedstock exports and prices are fluctuating, driven by increasing SAF investments and government policies abroad, which risk diverting resources away from domestic refining opportunities. Figure 6 shows the projected levelized cost of production for five major feedstocks. In the near term, biogenic SAF derived from sources such as vegetable oil and biomass offers the most cost-effective option before 2030. However, its price trajectory flattens thereafter, leaving little room for further reductions and exposing it to volatility from global demand shifts. Advances in fermentation technologies could reduce ethanol costs and help lower biogenic SAF prices, but these methods introduces trade-offs, such as longer production times, and still offer limited cost-reduction potential after 2024. By contrast, PtL SAF pathways, while initially more expensive at over $4.0/L in 2023, is projected to become increasingly competitive as the hydrogen economy becomes more mature and renewable energy costs fall. For example, PtL SAF production costs could approach $2.0/L∙bar by around 2045. In summary, biogenic feedstocks provide an immediate but constrained short term solution, whereas PtL represents a longer-term pathway with greater scalability for large-volume SAF production.

3. SAF Production Pathways

3.1. ASTM-Approved SAF Pathway

Carbon capture, utilization and storage (CCUS) is a widely investigated technology. Despite being established in the scientific community for almost three decades, its high investment and operating expenses make growth and industrial adoption challenging [98]. Thus, research is concentrating on Carbon Capture and Utilization (CCU) as an alternative to justifying the high capital expenditure of CO2 capture, which is viewed as a feedstock for the synthesis of chemicals and fuels [99]. CCU is known as PtL for the process of producing liquid hydrocarbons. The raw hydrocarbon mixture is upgraded and refined to meet aviation fuel specifications, including those outlined by ASTM D7566 [100]. That need to be upgraded or converted to attain aviation fuel required properties [54,72,101].
The ASTM approved pathways form the foundation for producing drop in SAF that can be blended seamlessly with conventional jet fuels. At present, blends are limited to 50 vol%, though the industry is gradually moving toward higher proportions, with some future technologies expected to enable 100% SAF use. Table 2 provides a concise overview of each pathway, outlining their feedstocks, blend limits, and a brief description of their production processes. By examining how different SAF pathways perform on short, medium, and long haul flights, it becomes possible to identify the conditions under which SAF delivers the greatest benefits and where alternative decarbonization strategies may be more effective [54,69,72].
SAF has strong potential for decarbonizing medium-haul routes, but its limited availability and the energy density constraints of current technology make it challenging to apply effectively on long haul flights. This raises important questions about the strategic allocation of scarce SAF resources, underscoring the need to prioritize deployment where they can deliver the greatest emissions reductions [102]. Building on these considerations, this research provides a detailed examination of the future of sustainable aviation, with a particular focus on how SAF and emerging propulsion technologies can work in tandem to enhance the sector’s long-term sustainability. Among these pathways, HEFA, FT, PtL and AtJ are the identified leading SAF technologies towards the targeted fuel transition of the aviation sector [103].

3.2. Power-to-Liquids (PtL)

Australia is well-positioned to become a global leader in PtL SAF production, thanks to its abundant renewable energy resources. Figure 7 illustrates the PtL pathway, in which renewable electricity, water, and captured carbon dioxide (CO2) are converted into synthetic aviation fuels. Multiple chemical routes exist to transform hydrogen and carbon into jet-compatible fuels, each offering unique benefits, technical characteristics, and levels of commercial maturity.
The PtL process starts with producing renewable electricity, typically from offshore wind farms, large-scale solar photovoltaic arrays, or other clean energy sources. This electricity powers an electrolyser, which splits water into hydrogen and oxygen via electrolysis as
2H2O → 2H2 + O2
Hereby producing H2 for synthesis hydrocarbon fuel. The carbon component of the fuel is obtained using Direct Air Capture (DAC) technology, which extracts CO2 directly from the atmosphere [67]. This step is crucial for achieving a closed carbon cycle. The captured CO2 is reacted with the hydrogen through the Reverse Water-Gas Shift (RWGS) reaction to form carbon monoxide (CO): [66,67],
CO2 + H2 ⇌ CO + H2O
The CO and H2 mixture (syngas) [104] is fed into a Fischer–Tropsch (FT) reactor, where they are catalytically converted into liquid hydrocarbons (CxHy). The general FT reaction is:
nCO + (2n+1)H2 → CnH2n + 2 + nH2O
For example, methane and octane can be produced as
Methane (CH4): CO + 3H2 → CH4 + H2O
Octane (C8H18): 8CO + 17H2 → C8H18 + 8H2O
The raw FT hydrocarbons are then upgraded through processes such as hydrotreatment, hydrocracking, and isomerisation to meet aviation fuel quality and safety standards, including ASTM D7566. This ensures the final PtL SAF is fully compatible with existing aircraft engines and infrastructure.
The PtL technologies are already being advanced by a number of business and government projects in Australia. Funding for pilot-scale initiatives combining green hydrogen and CO2 collection for the creation of synthetic fuel has been provided by the Australian Renewable Energy Agency (ARENA). For example, techno-economic frameworks for the establishment of PtL facilities close to CO2 point sources and renewable energy hubs are being studied by the Future Energy Exports Cooperative Research Centre (FEnEx CRC) and its industry partners. Interest from the business sector is also rising at the same time. For instance, Wagner Corporation’s proposed $1.7 billion SAF refinery near Brisbane intends to show how waste and renewable resources can be converted on a large scale into aviation fuels [80]. While it is primarily focused on biomass at the moment, it indicates that the infrastructure is ready to integrate PtL modules in the future. Due to high capital costs for electrolyzers, CO2 collection units, and synthesis reactors, as well as operating expenses associated with variable renewable power supply, PtL SAF is still costly internationally, usually four to eight times the price of fossil-based jet fuel. Nonetheless, levelized prices of PtL fuels are anticipated to decrease significantly over the next ten years due to the falling costs of solar and wind power as well as notable advancements in electrolyzer efficiency. There are many advantages of the PtL-FT Pathway such as, when powered by renewable energy, the PtL FT pathway can achieve near-zero carbon emissions, making it a viable option for decarbonizing the aviation sector [67]. The process achieves high conversion efficiencies, with carbon conversion efficiency at 88%, hydrogen conversion efficiency at 39.16%, and an overall Power-to-Liquids efficiency of 25.6% [68]. The resulting SAF is a drop-in fuel, meaning it can be used in existing aircraft engines and infrastructure without requiring significant modifications [69].
Furthermore, lifecycle assessment studies demonstrate that when powered exclusively by renewable energy sources and combined with atmospheric CO2 capture, PtL SAF can reduce greenhouse gas emissions by up to 90–95% when compared to conventional jet fuels, meeting the strictest sustainability requirements under the ICAO CORSIA framework. For long-haul and international flights where electrification or hydrogen combustion are unlikely to be practical soon, the PtL pathway therefore provides a feasible long-term answer for profound decarbonization of aviation. Despite ongoing scientific and financial obstacles, Australia is a strong contender for the early implementation and expansion of PtL SAF technologies because to its combination of renewable resources, new legislative backing, industrial infrastructure, and academic know-how. The full potential of this approach will require cross-sector cooperation, strategic investment, and supporting regulatory frameworks to convert Australia’s plentiful solar and wind energy into a high-value, exportable, and climate-neutral aviation fuel.
Australia is uniquely positioned to lead PtL production. This process simultaneously tackles two major climate objectives: cutting aviation emissions and repurposing captured carbon into high–energy-density fuels. PtL pathways currently struggle to present affordable production costs, but projections for rapid reductions in hydrogen and green electricity prices form a promising future [103]. Recent advances such as more selective catalysts operating at lower temperatures, improvements in solid oxide electrolysis cells, and catalyst surface modifications are improving efficiency, lowering energy use, and increasing carbon conversion rates [79]. As a result, PtL pathway was highlighted at the most recent SAF APAC Summit 2025 (16–17 July 2025, Melbourne, Australia), where one of the four key themes “Future plans for SAF production and commercialisation” focused on e-fuels, PtL, and hydrogen. Discussions centred on advancing eSAF from innovation to deployment, supported by the creation of a standardised and enabling SAF framework.

3.3. Alcohol-to-Jet (AtJ)

The Alcohol-to-Jet (AtJ) category in ASTM-approved SAF pathways encompasses processes that convert alcohols primarily ethanol or iso-butanol into jet-range hydrocarbons through several unit operations, including dehydration, oligomerisation, hydrogenation, and fractionation [103]. The AtJ process chain can be broadly divided into three stages: thermochemical, biological, and thermocatalytic. In the first stage, bio-based feedstocks such as sugarcane, cassava, grains, and corn stover are converted into ethanol (EtJ) or butanol (BtJ) via fermentation or gasification. In contrast, the methanol-to-jet (MtJ) route produces methanol from renewable hydrogen and captured CO2, or from syngas derived from biomass gasification [104]. Once the alcohols are obtained, they undergo a series of refining steps: dehydration to form olefins, oligomerisation to extend carbon chains, hydrogenation to produce paraffinic hydrocarbons, and fractional distillation to yield a jet fuel fraction meeting ASTM standards. Ethanol can also be synthesised directly from CO2 and H2 via specialised catalyst systems. Alternatively, methanol can be carbonylated to acetic acid, which is then hydrogenated to ethanol. Figure 8 shows the pathways for SAF and Renewable Diesel (RD) Production as Ethanol-to-Jet (EtJ), Butanol-to-Jet (BtJ), and Methanol-to-Jet (MtJ) routes. The flowchart illustrates biochemical and thermochemical routes from biomass and renewable energy (RE) to SAF and renewable diesel via fermentation, gasification, and alcohol-to-jet (AtJ) processes [103,104].
EtJ is currently the most commercially mature AtJ pathway. Leading technology providers include Honeywell UOP, Axens, Lummus Technology, LanzaJet, Byogy, and SAFFiRE Renewables. In 2024, LanzaJet commissioned the world’s first commercial-scale EtJ facility in Soperton, Georgia, with a capacity of 10 million gallons per year (MGPY). By 2025, global EtJ-based SAF capacity is projected to reach approximately 1.23 billion gallons annually [105]. BtJ remains less developed. KBR is the primary technology licensor, with Gevo and Swedish Biofuels spearheading commercialization. Gevo operates a 10 MGPY facility in Texas and is building a 55 MGPY SAF plant in South Dakota [106]. Swedish Biofuels is developing three plants in Sweden, each with a capacity of 130 MGPY. Global BtJ-based SAF capacity is expected to reach about 245 MGPY by 2025. MtJ is not yet ASTM-approved, unlike EtJ and BtJ, but is emerging as a promising addition to the AtJ technology family [69]. At the 28th UN Climate Change Conference (COP28), companies such as TotalEnergies and Masdar demonstrated the potential of methanol as an aviation fuel blendstock. Technology developers including Honeywell UOP, Axens, Topsoe, and ExxonMobil are adapting existing methanol synthesis and conversion platforms for MtJ production [107]. Projects led by Metafuels and SPIC aim to deliver approximately 4 MGPY by 2025 [107,108]. The MtJ process involves converting methanol to hydrocarbons via methanol-to-gasoline (MtG) or methanol-to-olefins (MtO) pathways, followed by oligomerization and hydroprocessing. Optimized catalytic systems can achieve 90–95% carbon conversion efficiency for methanol synthesis [109]. Due to its ease of storage, methanol offers better compatibility with intermittent renewable energy sources than hydrogen or syngas [86].

3.4. Comparison of the SAF Pathways

Hydroprocessed esters and fatty acids (HEFA) is the most established SAF pathway, benefiting from commercial readiness and direct drop-in compatibility with existing aviation fuel systems [110]. It can use various renewable oils and fats as feedstocks, ensuring relatively straightforward integration into current supply chains. However, its dependence on edible oils and animal fats raises concerns over food–fuel competition and indirect land-use change. Furthermore, the GHG savings are moderate compared to more advanced synthetic pathways, especially if the feedstocks are sourced unsustainably. Table 3 shows the advantages and disadvantages of different SAF pathways where, FT fuels offer versatility in feedstock use from biomass to natural gas and deliver high-quality, sulfur-free fuel compatible with current aviation infrastructure [111]. The process also enables deep carbon conversion into high-energy-density hydrocarbons. The downside lies in its high capital and operational costs, as well as significant energy requirements. Moreover, the GHG footprint depends heavily on the feedstock: coal- or natural gas based FT can be highly carbon-intensive unless paired with carbon capture.
AtJ can leverage multiple alcohol feedstocks such as ethanol, butanol, and methanol, some of which can be produced from renewable sources, offering potential for reduced particulate emissions in combustion [112]. While promising, AtJ faces feedstock competition with other sectors (e.g., transport fuels, chemicals) and is only beginning to achieve commercial scale [113]. This limits current market impact despite growing interest in pathways like ethanol-to-jet and methanol-to-jet. Biomass-to-Liquid (BtL) can utilize a wide variety of biomass, including lignocellulosic residues, offering the potential for sustainable feedstock sourcing and high-quality fuel output with low sulfur [114]. However, BtL is hindered by complex, multi-step processing that often requires substantial energy input, contributing to higher production costs. Commercial deployment remains limited, with projects mostly at the pilot or demonstration stage. Algae based SAF has unique advantages: cultivation on non-arable land, use of saline or wastewater, and very high biomass productivity [115]. It minimizes competition with food crops and can be a sustainable carbon sink. Yet, significant technical and economic barriers remain, including the cost of cultivation, harvesting, and lipid extraction. These challenges have kept algal SAF largely in the research and pilot phases.
PtL stands out for its capacity to produce truly carbon-neutral fuels when powered by renewable electricity and supplied with captured CO2 [116]. It offers a clear long-term decarbonization pathway for aviation, free from biomass supply constraints. The key drawbacks are its high energy intensity, capital cost, and limited current scale. Infrastructure for large-scale renewable electricity and CO2 capture will be critical to its growth.
Table 3. Summary of advantages and disadvantages of different SAF pathways from literature *.
SAF PathwayTechnology MaturityScalability PotentialGHG Reduction Potential Production Cost TrendKey AdvantagesKey Limitations
HEFAHigh (commercial)Moderate (feedstock-limited)Medium (40–70%)MediumCommercially available; drop-in fuelFeedstock competition; limited GHG gains if unsustainable sourcing
FT Synthetic KeroseneMedium (some commercial plants)High (with sustainable feedstocks)High (up to 90% with biomass + CCUS)HighFlexible feedstocks; high-quality fuelHigh CAPEX/OPEX; energy-intensive
AtJ (EtJ, BtJ, MtJ)Low–Medium (early scale-up)MediumMedium–HighHighCan use multiple alcohol sources; low particulate emissionsFeedstock competition; limited current capacity
BtLLow (pilot/demo)High (abundant biomass)High (up to 90% with residues)HighUses lignocellulosic waste; low sulfurComplex process; high energy input
Algal BiofuelsLow (R&D/pilot)High (non-arable land use)HighVery HighMinimal land competition; high yield High production cost; cultivation challenges
PtLLow (demo projects)Very High (renewables + DAC)Very High (>90%)Very HighNo biomass limits; true carbon-neutral potentialHigh energy demand; expensive
* Information from [110,111,112,113,114,115,116].

4. Techno-Economic Evaluation (TEA) and Life Cycle Assessment (LCA)

Techno-Economic Assessment (TEA) and Life-Cycle Assessment (LCA) are essential tools for evaluating the feasibility and sustainability of various SAF production pathways. TEA provides insight into the economic viability of SAF technologies by analyzing costs, scalability, and market competitiveness, while LCA examines the environmental impacts across the entire fuel life cycle from feedstock sourcing to end use. Together, these assessments offer a comprehensive understanding of both the practical and ecological dimensions of SAF development, helping stakeholders identify the most promising pathways and make informed decisions that align with climate goals and industry standards.
More and more people are realizing that the Fischer Tropsch (FT) synthesis process, especially the Power-to-Liquid (PtL) pathway, is a viable and scalable solution to make Sustainable Aviation Fuel (SAF) and reduce carbon emissions in the aviation industry. When carbon dioxide from the air reacts with green hydrogen, which comes from renewable energy sources through electrolysis, this process makes liquid hydrocarbons. Techno-Economic Analysis (TEA) and Life Cycle Assessment (LCA) must be used together to provide a full picture of how viable and sustainable this new way of making fuel is. Technoeconomic research shows that Power-to-Liquid (PtL) Fischer-Tropsch (FT)-based fuel for sustainable aviation fuel (SAF) in Australia has a lot of potential but also a lot of problems to solve. The Direct Air Capture (DAC) unit’s high initial cost and ongoing running costs, largely because of energy needs, make it much less likely that Sustainable Aviation Fuel (SAF) production can be economically viable. In order for SAF to compete with fossil fuels, it needs a lot of money to make it worth it. The minimum selling price for jet fuel is expected to be £5.16/kg [66]. The global warming potential of 21.43 gCO2eq/MJSAF shows that it has much less carbon emissions than regular jet fuels, as shown by life cycle analysis [67].

4.1. Techno-Economic Analysis (TEA)

TEA uses a quantitative way to look at how well the PtL process works technically and how feasible it is economically along its value chain. According to estimates, the cost of making PtL fuels ranges from AUD 1.50 to AUD 3.00 per liter, depending on the feedstock and technology used [67]. The main parts and properties of TEA are shown in Table 4 as follows:
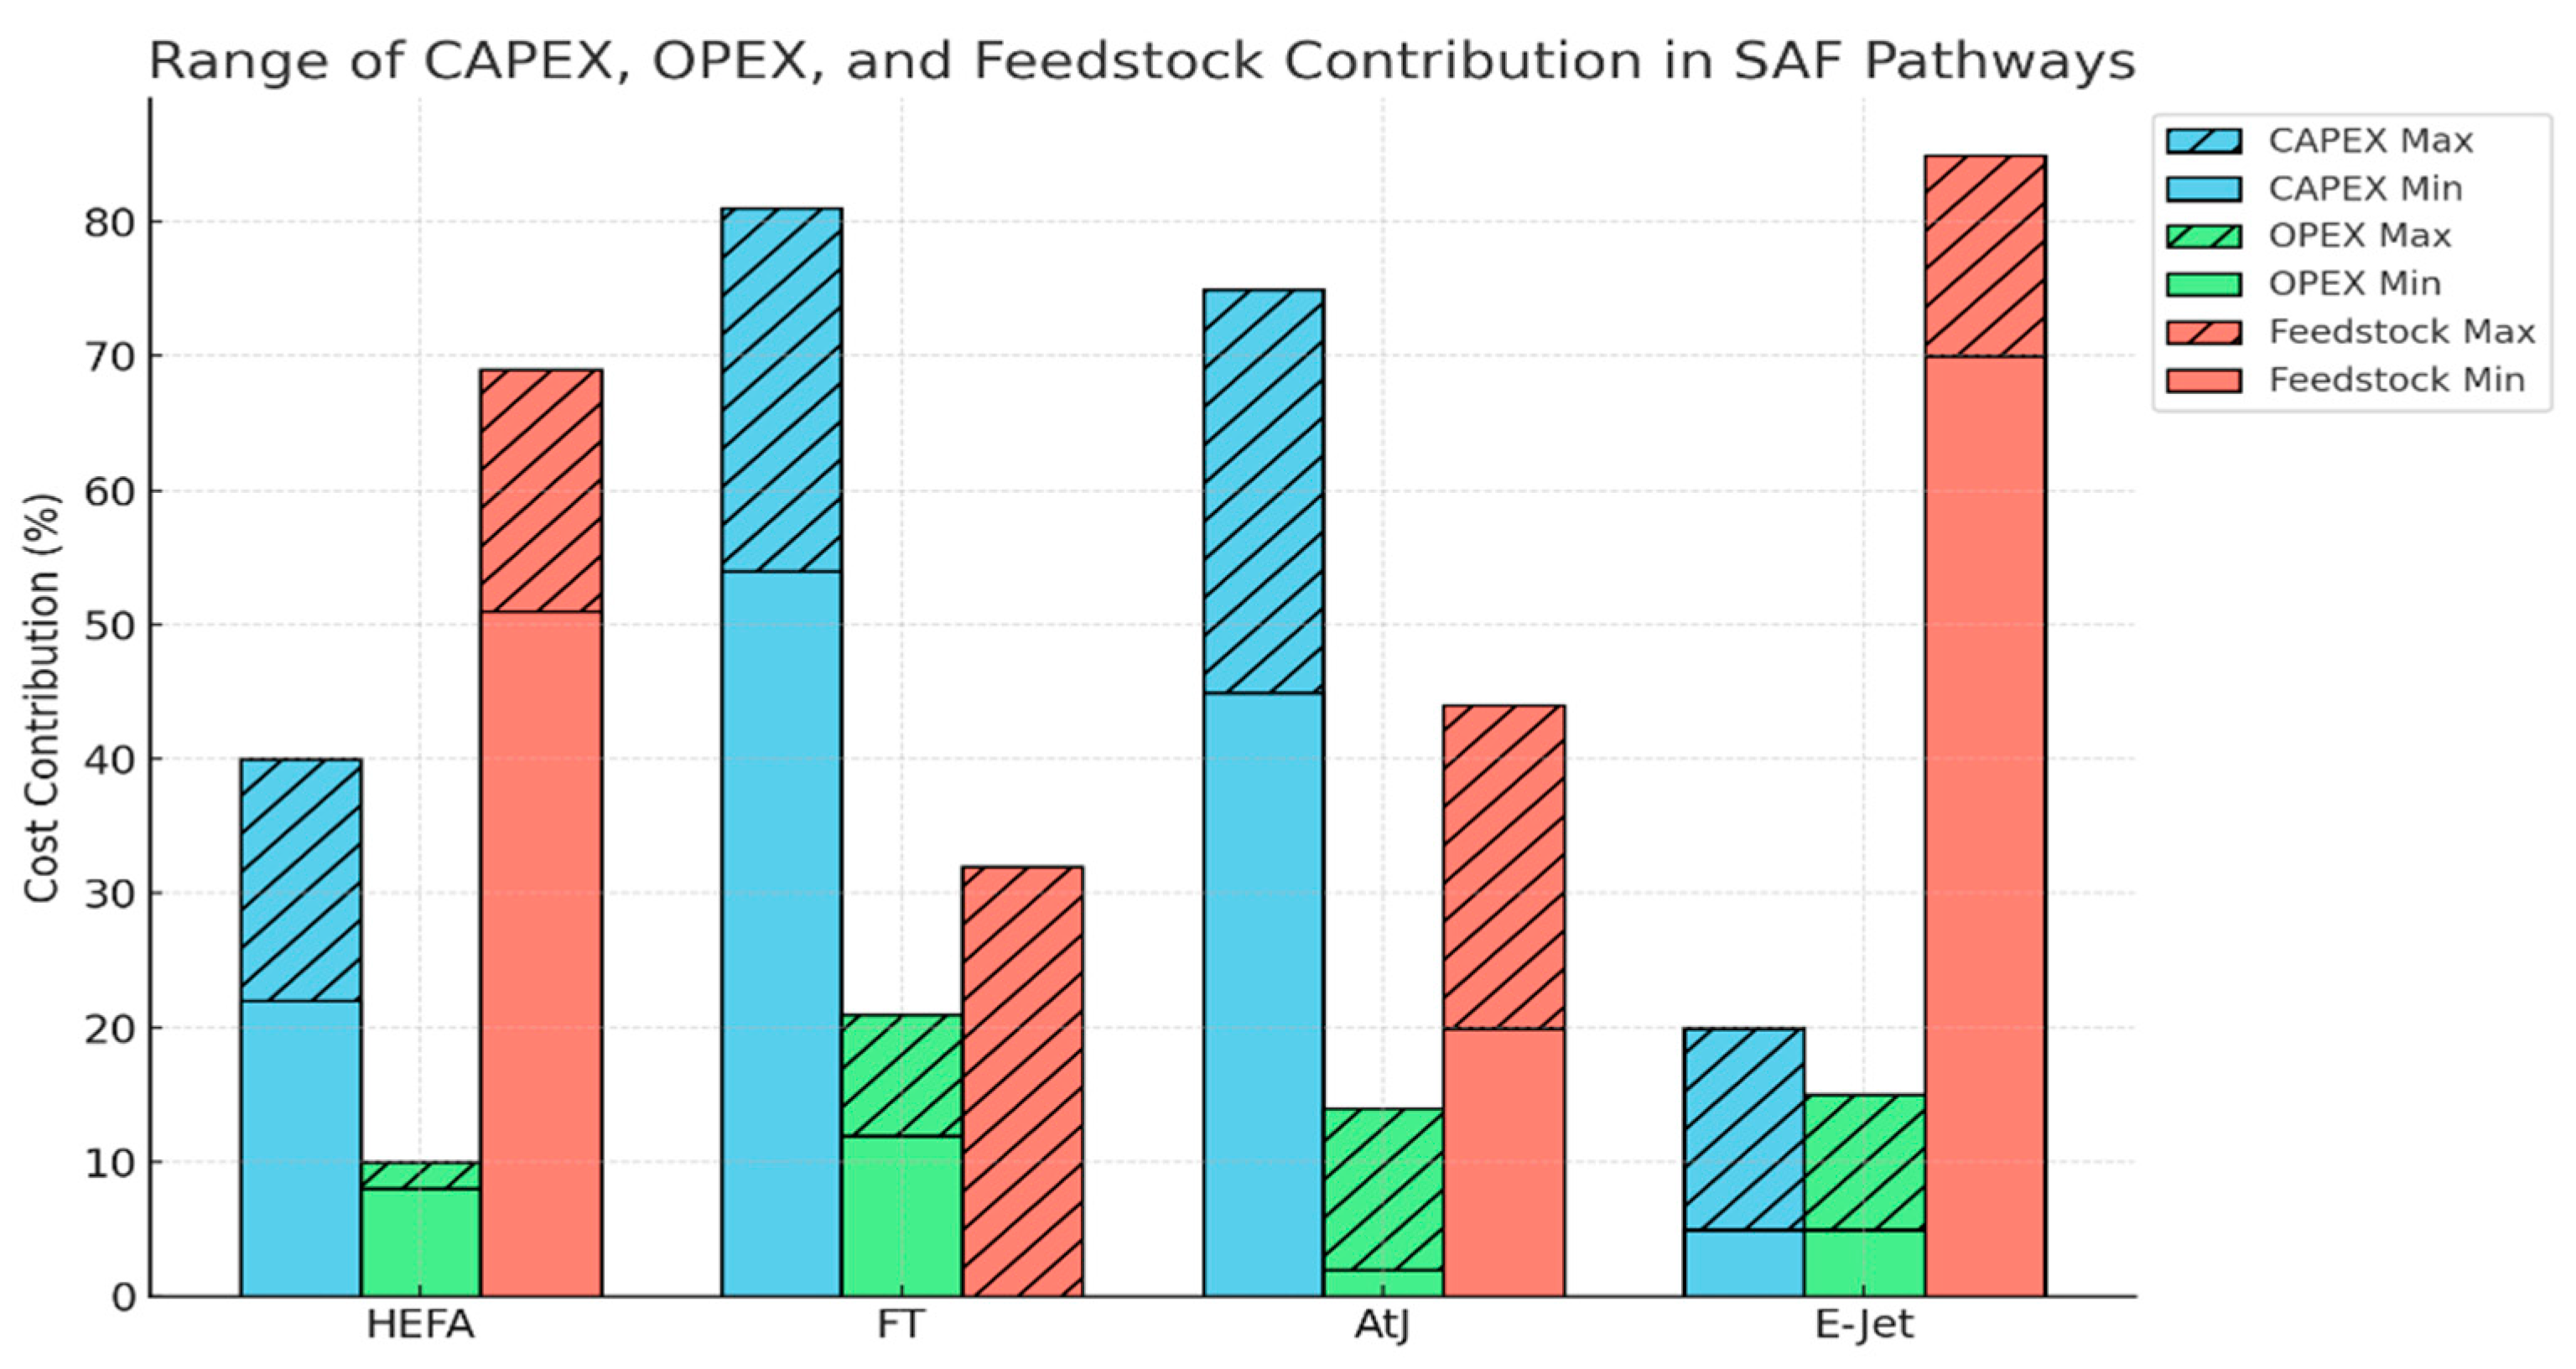
Capital Expenditures (CAPEX): This includes the first money spent on important parts including Fischer-Tropsch reactors, Direct Air Capture (DAC) systems, Alkaline Electrolysers, Proton Exchange Membrane (PEM) systems, gas purification units, and the infrastructure needed to improve or refine fuel. The cost of making Sustainable Aviation Fuel (SAF) is between 0.81 and 5.00 EUR/L, depending on how it is made. This is much more than the cost of fossil fuels [68]. The DAC unit is a key part of the PtL process, but it costs a lot of money to build [69]. To meet the needs of the aviation industry, switching to PtL fuels requires a lot of money to be spent on production facilities, which is anticipated to be several hundred million AUD [70]. Investing in renewable energy infrastructure is vital to lower costs of doing business and make the economy more stable. The fact that SAF costs at least 5.4 times more to make than fossil jet fuel makes it hard to make it economically viable [72]. Possible carbon credits and laws that encourage lower emissions help the economy stay strong in the long run, even when they cost more in the short term.
OPEX (Operating cost): Labor, CO2 feedstock, maintenance, catalyst replacement, water for electrolysis and cooling, and electricity, which is the main cost driver, are all part of this set of continuing costs. The cost of energy, which powers the electrolyser, is the main factor that affects the OPEX for PtL FT-based SAF production. CO2 capture, labor, and maintenance are other costs that come up while running a business. The cost of renewable energy is one of the main things that affects OPEX. Electricity in Australia may be cheap, especially when businesses use renewable energy sources on their own property because there are so many of them. The cost of using direct air capture equipment to store CO2 is another major operational expense. But as DAC technology gets better, these expenses should go down over time.
Energy and Mass Balance: Find out the flow rates of hydrogen, carbon dioxide (CO2), and hydrocarbons, as well as the energy needs at each stage. This includes energy losses across systems, the possibility of heat integration, and the stoichiometric ratios of syngas (H2:CO). The balance of mass and energy is very important for figuring out how efficient the conversion process is. The solid oxide semi-closed CO2 cycle can be up to 68.9% efficient in larger buildings [74]. Energy intake from renewable sources has a big effect on the whole energy balance and the sustainability of the fuel manufacturing process.
Levelized Cost of Fuel (LCOF): It is the average cost of making one unit of SAF (for example, USD/L or USD/GJ) across the plant’s operational life. It is based on CAPEX, OPEX, efficiency, and capacity factor. Technological progress and economies of scale may help cut costs [72]. The LCF is an important factor in determining if PTL FT fuel is economically viable. According to research, economies of scale and new technologies might greatly lower the LCF. In the best case, the cost of producing CO could drop to as low as 53 €/GJ [73].
Conversion efficiency: The term for how well energy inputs like CO2 or electricity can be turned into fuel. This includes heat losses, the amount of energy used to directly capture air (kWh/kg-CO2), the efficiency of the electrolyzer (kWh/kg-H2), and the efficiency of Fischer-Tropsch synthesis. Conversion efficiency has a direct effect on how long it takes to get back the money spent on PTL FT technology. Investors are more likely to invest in technology that has shorter payback times since it is more efficient. For instance, the effectiveness of the SOS-CO2 cycle makes it possible to have competitive power pricing, which can also be used in situations where fuel generation is needed.
The internal rate of return (IRR), payback time, and net present value (NPV): All are important ways to figure out how long PTL FT projects will last. A high IRR means that an investment is likely to be profitable, whereas a positive NPV means that expected profits will be greater than costs. Higher carbon prices can make renewable fuels more competitive, which makes PTL FT fuels more economically viable through carbon pricing. These financial measures are used to see if initiatives can work in different price and policy situations. Changes to policies and incentives are needed to make SAF production better and more profitable [73].
The size and capacity of the plant: It affect economies of scale and the payback period for capital expenditures. To lower the Levelized Cost of Energy (LCOE), you need a high capacity factor. To figure out how well the facility is doing economically, you need to know its size and capacity factor. Larger facilities have lower LCFs and better financial indicators because they benefit from economies of scale [74]. Capacity factors have an effect on operational efficiency, and bigger factors lead to better financial results.
Sensitivity analysis: How changes in important elements like power costs, electrolyzer costs, CO2 capture efficiency, and catalyst life affect the LCOF and the project’s potential to make money. This helps finding the main ways to cut costs. Sensitivity analyses show that capital expenditures and operating hours are two important factors that affect LCF [75]. This shows how important it is to design plants well.
Carbon Intensity: To have emissions that are the same as those of conventional fuels, at least 84.6% of the energy must come from renewable sources [76]. Scenario modeling and policy integration are used to look at how carbon pricing, SAF blending rules, renewable energy subsidies, and tax breaks affect the finances of projects. Table 4 shows the aspects and properties of TEA for e-fuel production pathways.

4.2. Life Cycle Assessment (LCA)

LCA makes TEA better by looking at the environmental effects of PtL SAF over its whole life cycle, from getting the resources to burning the fuel. The PtL FT-based SAF manufacture is an excellent approach to cut down on the carbon footprint of flying, but it is still challenging to make it work economically. LCA reveals that PtL fuels can cut greenhouse gas emissions by a lot more than normal jet fuels over the course of their whole life. Using renewable energy sources might lower emissions by as much as 80%. New technology and rules need to be put in place to make enterprises more competitive because production costs are so high. The environmental advantages depend on using renewable energy sources, which highlights how crucial it is to use a mix of sustainable energy sources in the production process.
The Global Warming Potential (GWP): This tells how much greenhouse gases (CO2e) are released during the whole life cycle, from burning fuel to running direct air capture (DAC) to making power upstream to refining. PtL technologies for generating SAF cut carbon emissions by more than half compared to fossil fuels [76]. When they come from renewable sources, PTL-FT fuels can lower lifecycle emissions by up to 80% compared to normal jet fuels [77].
Source of Energy: The cumulative energy demand (CED) is the total amount of primary energy needed to generate one unit of SAF. This comprises both direct and indirect energy sources, such as heating in FT reactors, compressing hydrogen, and DAC power. Using renewable energy sources to create power is what helps the environment the most. The LCA of PTL-FT e-fuels for Sustainable Aviation Fuel generation reveals that using renewable energy might considerably lessen the amount of pollution that planes produce in Australia.
Water footprint, Land Use and Resource Depletion: A lot of people don’t pay attention to how much water cooling and electrolysis consume, which is especially essential for regions like Australia that are dry. The water footprint and how resources are used are highly essential. The refinery’s need for cooling water is a big element of this [78]. Land Use and Resource Depletion looks at how mining and modifying land for things like electrolysers and other infrastructure influence the ecosystem. Making things takes a lot of energy, much of which comes from renewable sources. This could change how resources are used and how long they persist [79]. LCA employs data that is current, location-specific, and process-specific. It also looks at how the process will affect the environment in the long run.
Waste Management: Good waste management procedures are vital for making PtL in a way that has less of an impact on the environment [80]. It explains how to grant credits for waste heat or by-products and how to deal with operations that create more than one product, like naphtha or diesel. Air pollutants such NOx, SOx, CO, VOCs, and particulate matter are emitted during both the making and using of the product.
System boundaries: Finding the allocation and system boundaries is highly crucial since they determine how the LCA will be carried out. It’s challenging to compare research since the approach you chose has a large impact on the outcomes [81]. Different techniques of distributing resources, such as mass-based or energy-based methods, could result in different assessments of how they affect the environment. This means that you need to choose carefully to make sure that resource use and emissions are shown correctly.
Sensitivity analysis: It checks how trustworthy LCA conclusions are when the basic assumptions change, such as the grid’s makeup, how advanced the technology is, and how well it collects data. Sensitivity analysis looks at the things that have the most impact on the LCA outcomes. This enables you adjust how things are made and how resources are shared in precise ways [82]. Stakeholders may make sensible decisions about technical investments and policy initiatives for SAF development if they know how sensitive different aspects are.
Uncertainty analysis: The conclusions of a LCA are sometimes imprecise since the input data can change, such as the availability of feedstock and the efficiency of conversion. This uncertainty can have a large impact on how sustainable PtL FT fuel is [83]. Modeling things using real-world data can make things unclear. This highlights how crucial it is to have strict procedures for gathering and studying data to make LCA more accurate.

4.3. The Power-to-Liquid (PtL) Method for Generating SAF

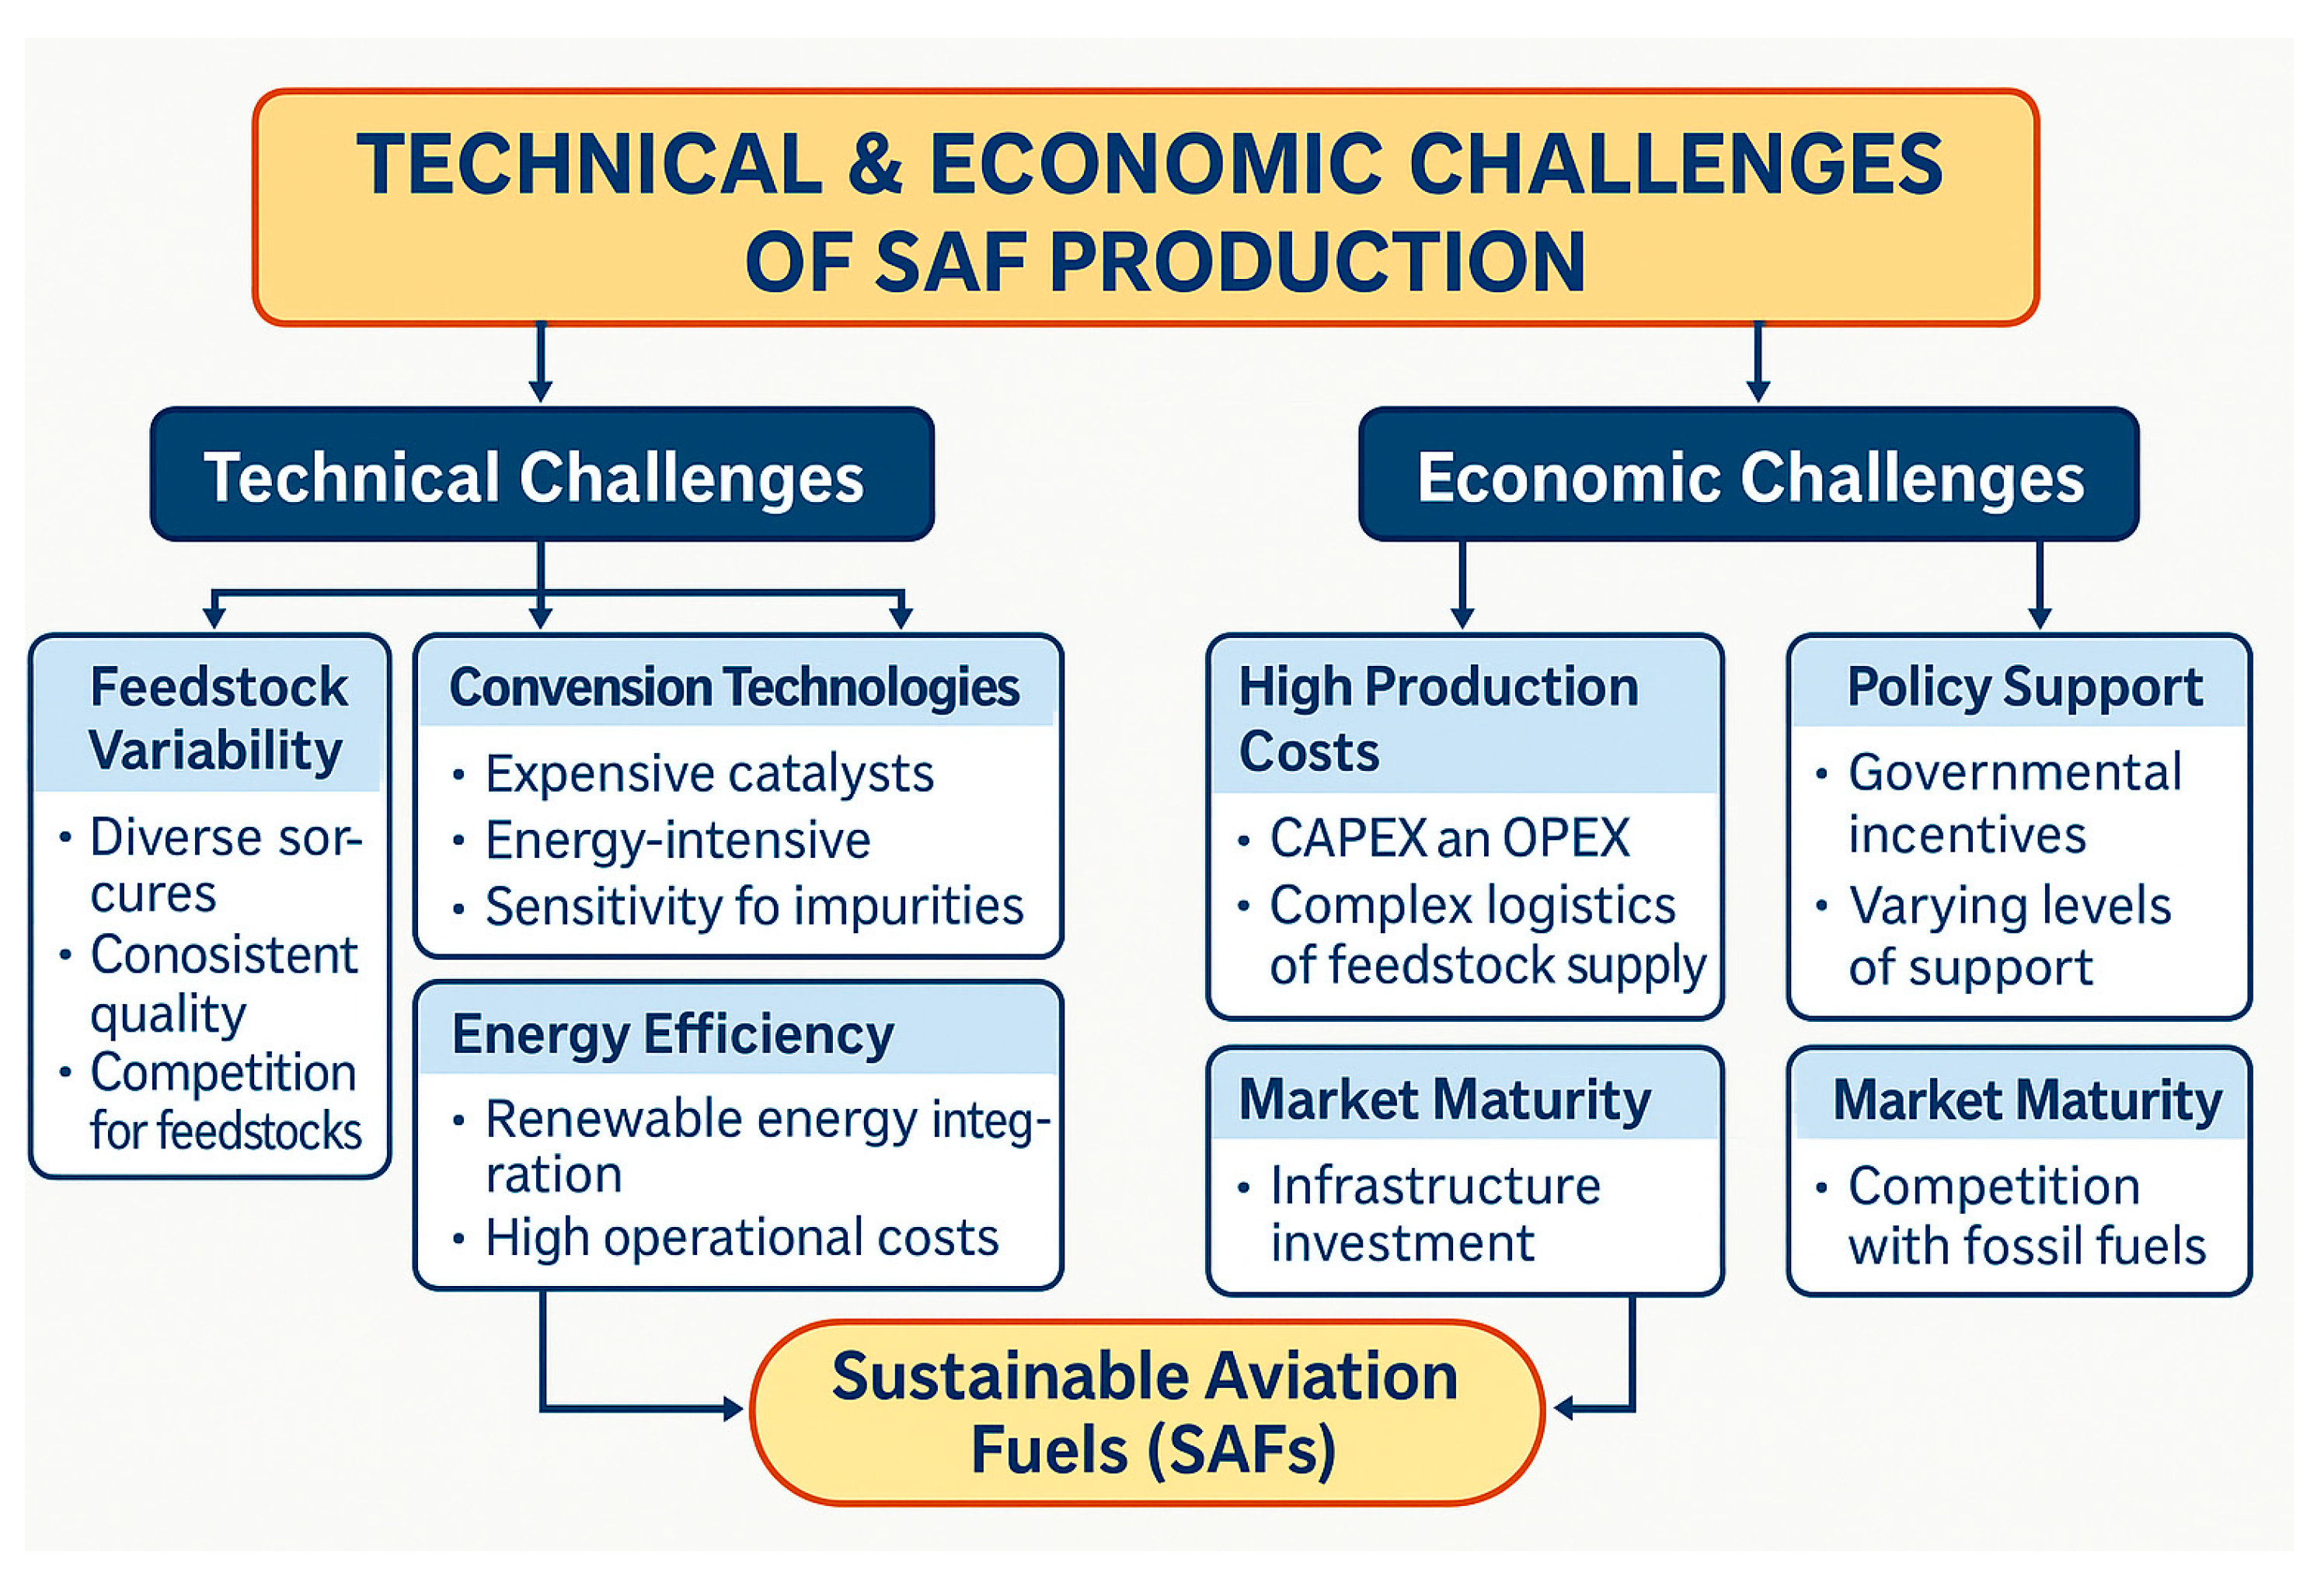
Figure 9 highlights the technical and economic challenges of SAF production. A comprehensive assessment of PtL e-fuels requires integrating TEA and LCA. TEA evaluates economic feasibility by identifying cost barriers and proposing regulatory or investment measures to enhance production, while LCA ensures that these pathways deliver real environmental benefits consistent with climate goals. In the Australian context, techno-economic studies of PtL-FT SAF examine project costs, capital requirements, and overall viability, whereas LCA assesses environmental impacts. Together, these analyses indicate that PtL-FT fuels represent a promising alternative to conventional jet fuels, with the potential to significantly reduce carbon emissions while remaining compatible with existing aviation infrastructure.
Cost of producing alternative fuels, the availability of raw materials, and the speed of technological growth are just a few of the things that can make them economically and environmentally viable. It costs a lot of money to make SAF, especially PtL FT-based fuels, because it demands specialized technologies and infrastructure. Now, SAF isn’t as competitive in terms of price because it costs more to create than standard jet fuels. Investing in SAF manufacturing capacity is particularly crucial because the existing supply barely fulfills 0.1% of the demand for aviation fuel. Production needs to go higher to make a large difference in emissions [81]. Changing oil prices and the need to lower manufacturing costs make SAF less economically viable. The IATA says that SAFs, such PtL FT-based fuels, might lower emissions from planes by as much as 65% by 2050. Adding SAFs to existing infrastructure without making major changes to aircraft technologies makes them more affordable. SAFs are commercially viable since they can help the aviation sector attain its carbon neutrality targets and cut emissions over the course of their lives.
Sustainable aviation fuels (SAFs) emit significantly lower carbon emissions than conventional jet fuels, making them a critical pathway for aviation decarbonization. In particular, Power-to-Liquid Fischer–Tropsch (PtL–FT) fuels are attractive long-term options because they are derived from renewable energy sources. When produced from biomass-based or carbon-storing feedstocks, SAFs could even enable climate-neutral long-haul flights. However, their long-term success depends on the availability of renewable feedstocks and the efficiency of production methods. Current challenges—such as high production costs, limited feedstock access, and the need for advanced technologies—must be addressed to ensure both economic and environmental viability.
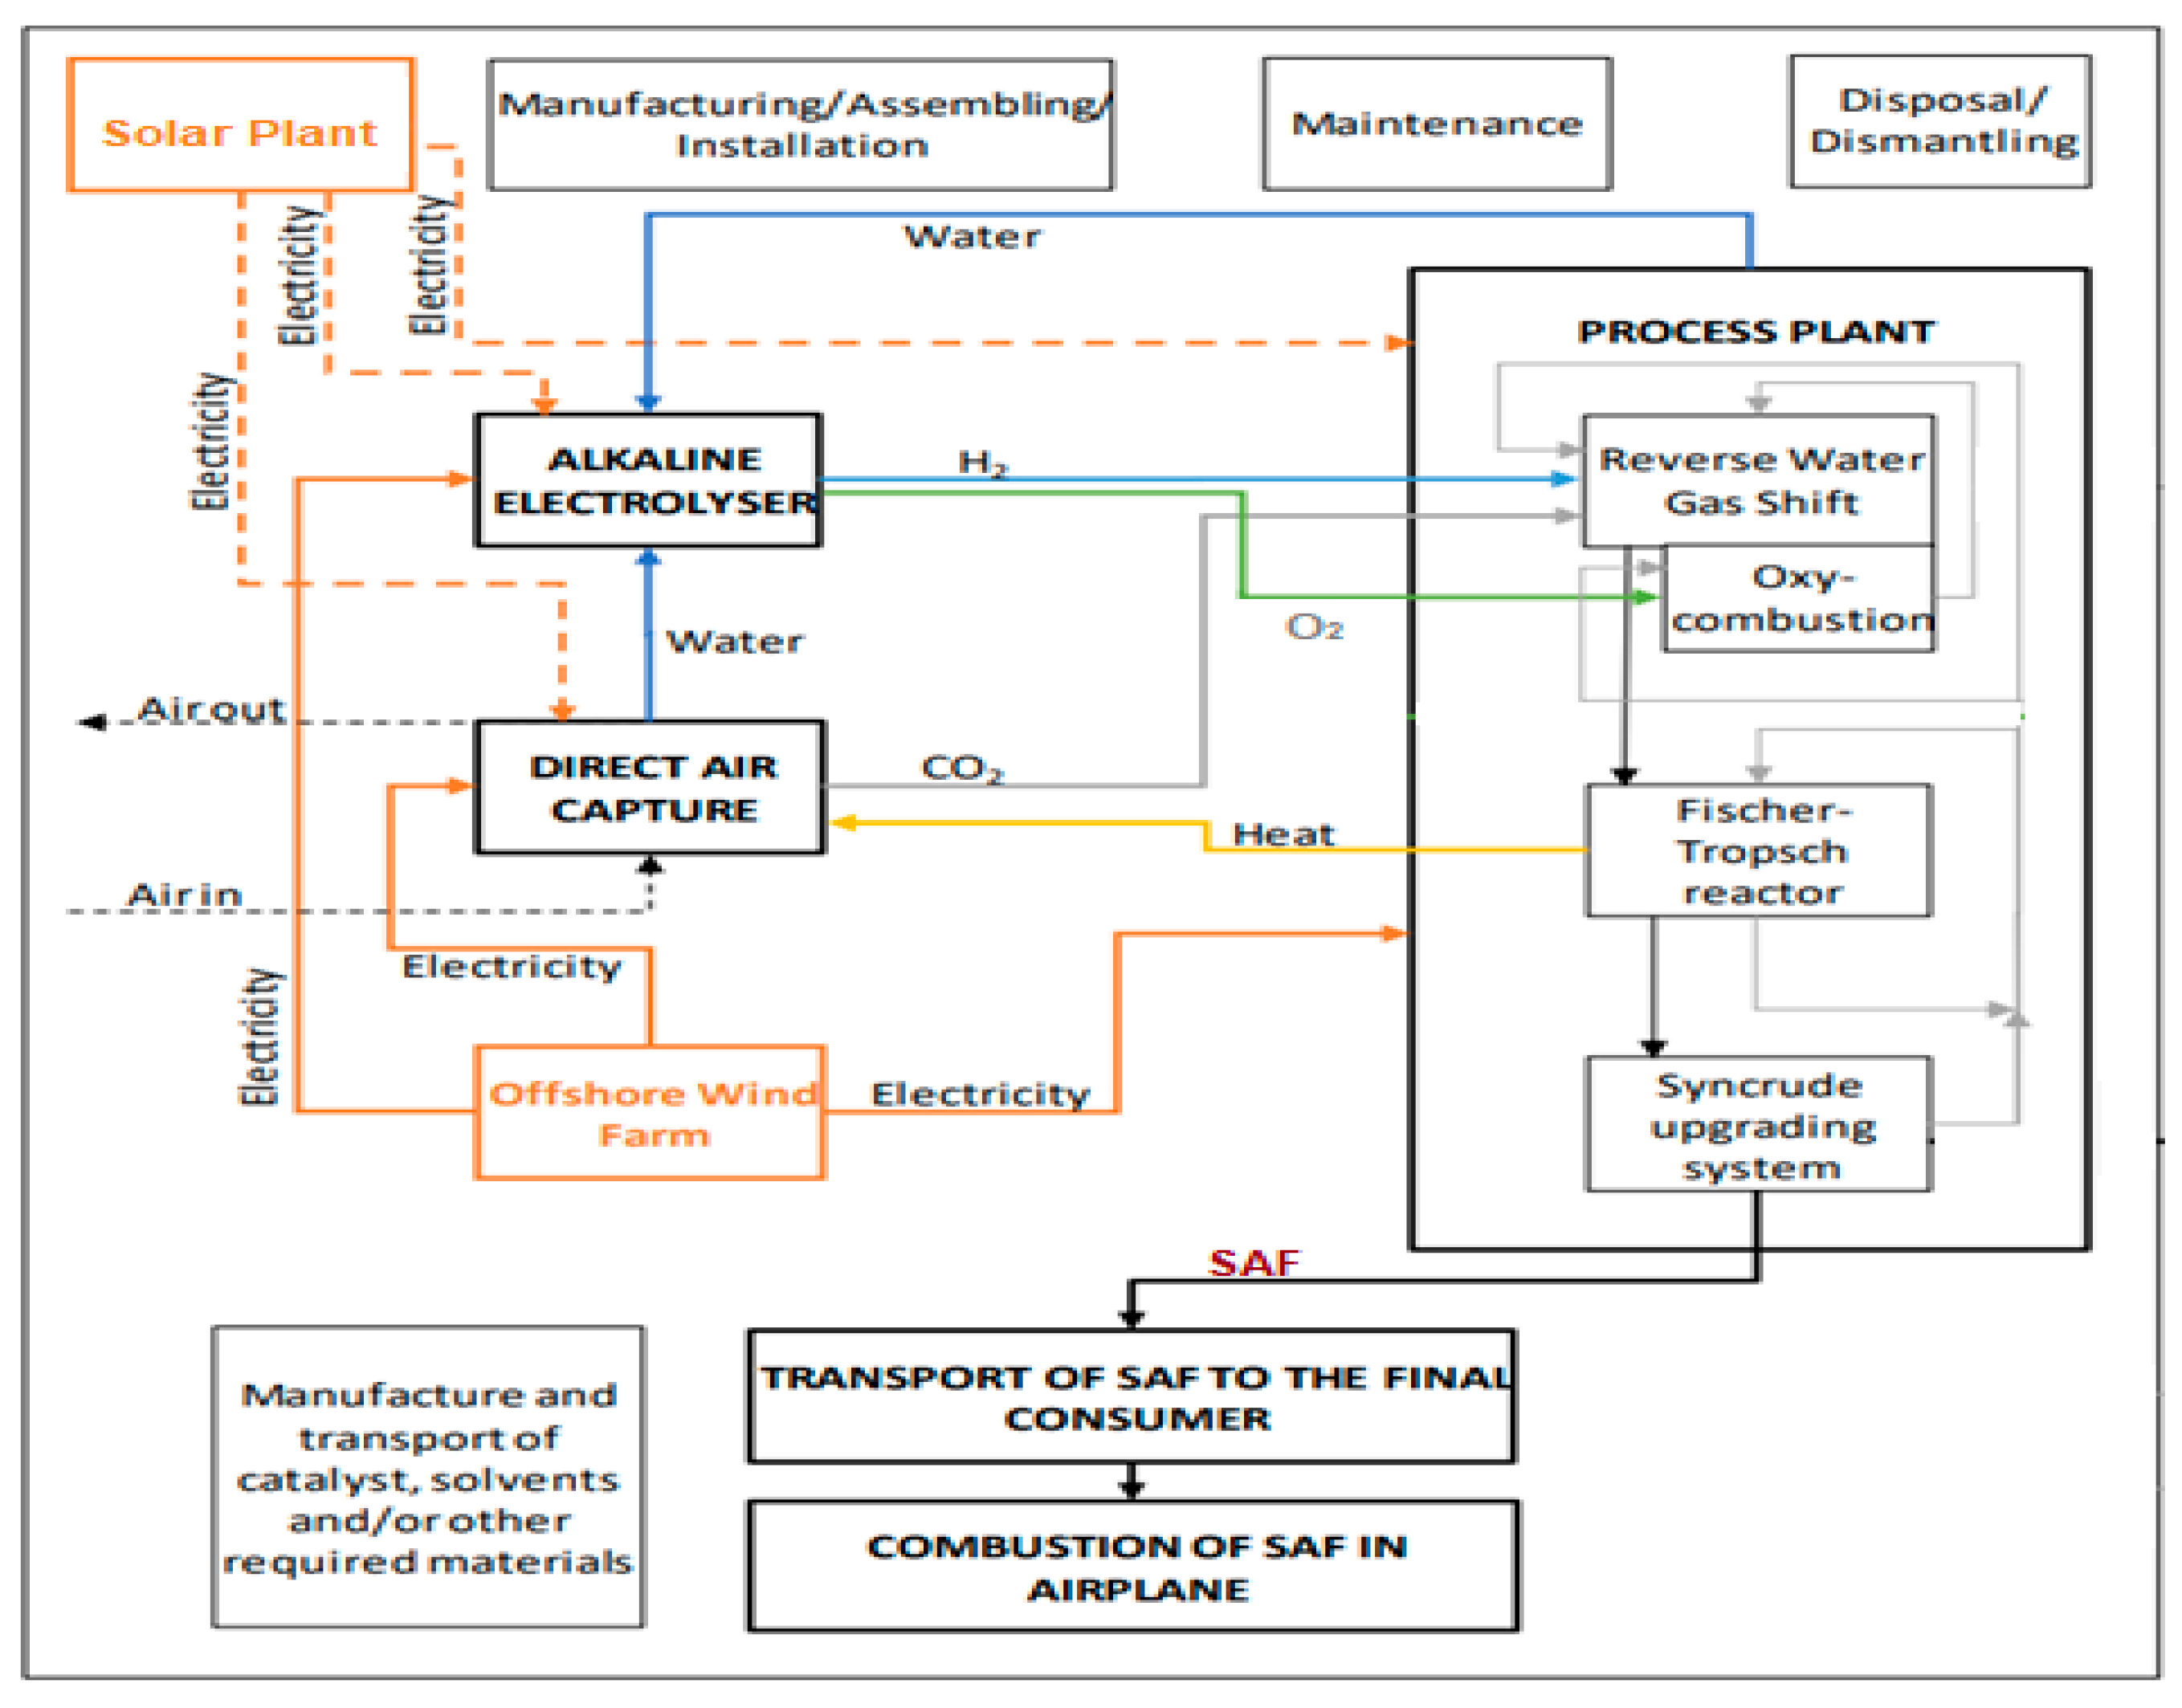
The PtL–FT process offers a promising pathway to generate SAF by converting renewable electricity into hydrogen, which is subsequently combined with CO2 to form synthetic hydrocarbons. These hydrocarbons can then be refined into SAF, providing a low-carbon alternative to fossil-derived jet fuels. This pathway is particularly relevant for Australia, given its abundant solar and wind resources that can support large-scale green hydrogen production through electrolysis. Life Cycle Assessment (LCA) ensures that PtL SAF pathways align with global sustainability standards such as CORSIA and ASTM D7566 certification, while TEA evaluates economic feasibility, including the potential for SAF exports [84]. Figure 10 illustrates the boundary system of TEA and LCA in PtL SAF production, highlighting how the integration of these complementary approaches enables comprehensive system optimization. Table 5 further details the specific parameters and requirements considered within the TEA and LCA processes of this boundary system. Through detailed mass and energy balances, as well as sensitivity and uncertainty analyses, TEA and LCA together ensure that PtL SAF development is safe, profitable, and environmentally sound. This integration accelerates the aviation sector’s progress toward net-zero emissions.

5. Methodologies

This study looks at technoeconomic and life cycle evaluations of making FT-based e-fuels from hydrogen and carbon dioxide in the air using electrolysis and direct air capture (DAC). We carefully followed a review process that included making an exact search string, setting up selection criteria, and carefully extracting data.

5.1. Search String

A thorough search was done in four major databases-Google Scholar, Web of Science, Scopus, and PubMed to make sure the conclusions were strong and based on science. The goal of this search was to gather titles, abstracts, and keywords from journal articles and international conference proceedings that were published between January 2023 and June 2025. The carefully chosen set of keywords in the table guided the data collection. We chose these keywords carefully after looking at a lot of papers and journal articles that focused on the techno-economic and life cycle assessments of PtL-based FT-derived e-fuel production using hydrogen and carbon dioxide from the atmosphere. Table 6 delineates the search strings, where only used peer-reviewed journal articles, technical reports, and relevant conference papers that were published in academic journals to keep our review honest. Table 6 delineates the search strings, where only used peer-reviewed articles, technical reports, and relevant conference papers that were published in academic journals to keep our review honest.
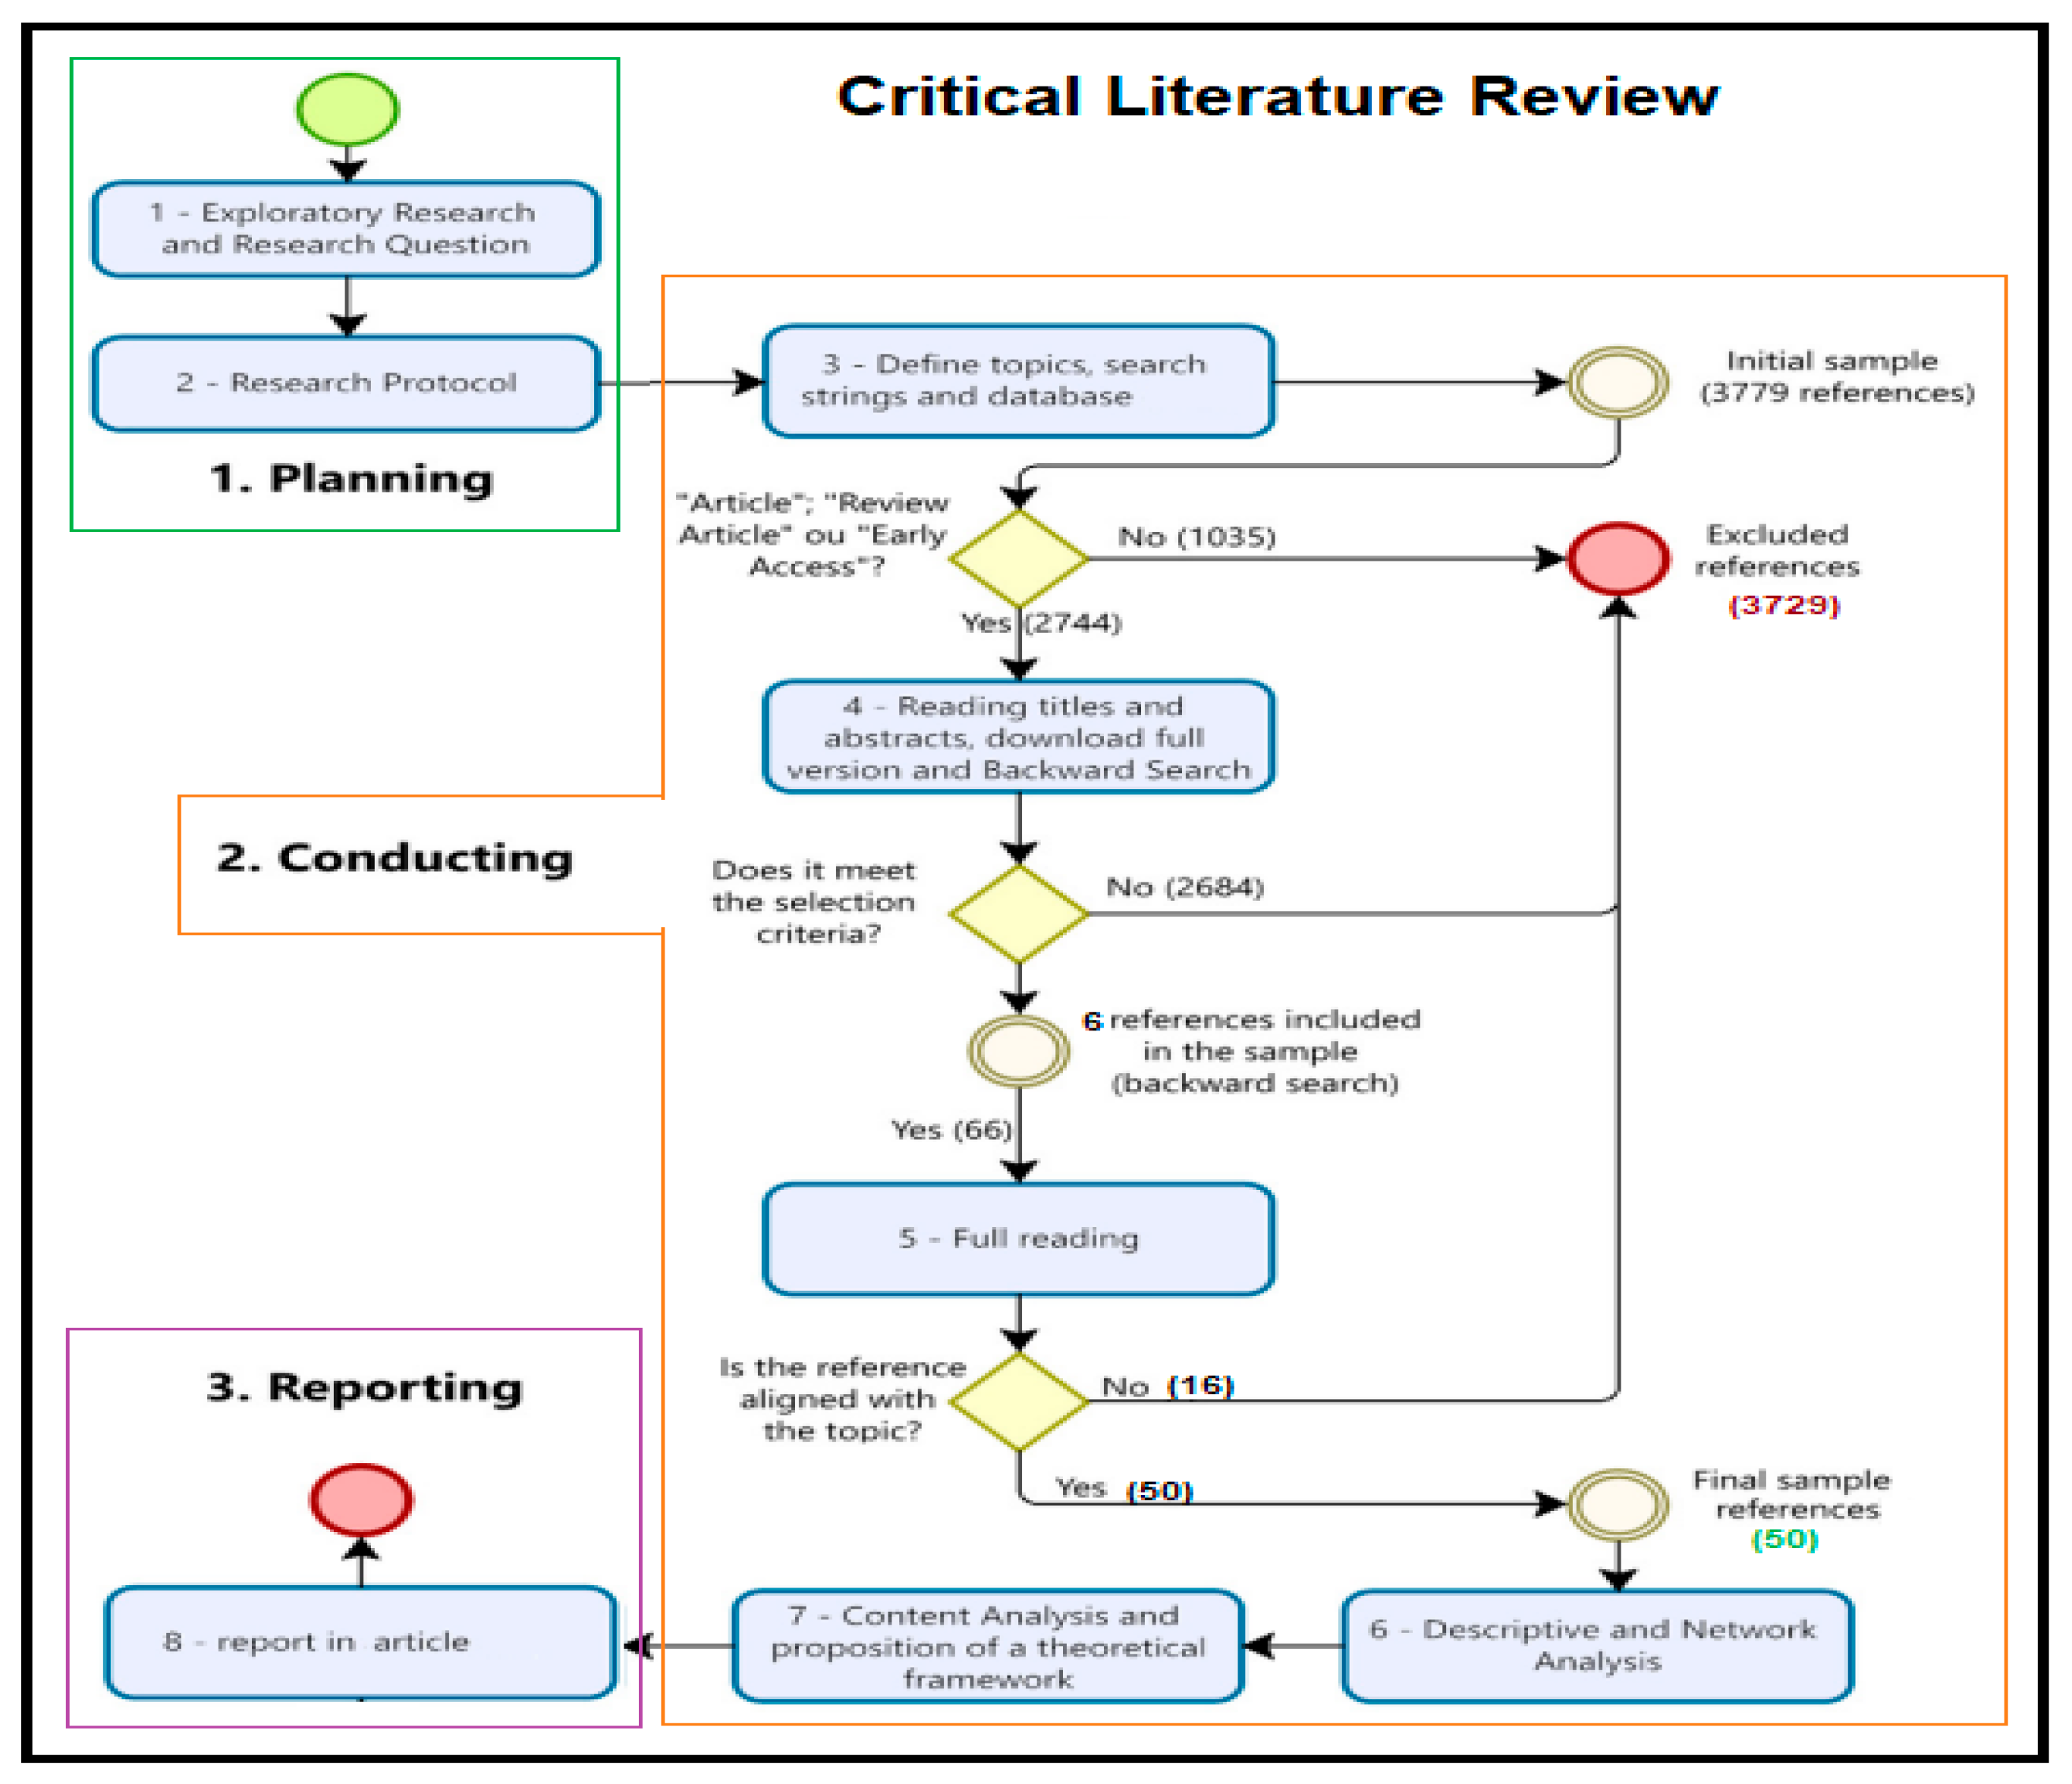
The literature search and the presentation of findings were conducted in alignment with the directives laid out in Figure 11. In the initial search phase, 3779 scientific articles were identified from the database query. After eliminating 1035 duplicates and disqualifying records along with others for various reasons, were left with 2744 publications for closer examination. From these, 2684 were further excluded, and efforts were made to retrieve the remaining 60 reports. Also 6 are included from the backward search of recent publications. Of these, 16 could not be retrieved, leaving 50 for detailed eligibility assessment for screening of titles, abstracts, and keywords led to the inclusion of scientific articles. Subsequent in-depth full-text eligibility screening culminated in 50 articles being selected for comprehensive analysis.
The inclusion criteria for publications were as follows:
  • Articles that specifically explored FT based e-fuel production for SAF utilizing green hydrogen and atmospheric CO2.
  • Studies offering a techno-economic analysis or a life cycle assessment of the PtL derived synthetic e-fuel production process.
  • Works that were published in English during the years January 2023 to June 2025.
Conversely, exclusions were made based on the following:
  • Articles that mainly focused on alternative aviation fuels without specifically addressing FT based e-fuels.
  • Publications that were deficient in substantial data or lacked clarity in their methodology.

5.2. Data Analysis

Compared the synthesis data from the TEA and LCA to get a full picture of how the PtL-derived FT-based e-fuels production process works for SAF use. This meant organizing data based on how it was made. Putting the most cost-effective methods first. Finding the methods that are best for the environment. Looked at the chosen papers to find out about production technologies and how well they work, as well as their costs, break-even points, and return on investment calculations. Got LCA data that focused on getting raw materials, making things, emissions during use, and problems at the end of life. Used statistical software to combine the data from both analyses and get a single result. Based on the combined data, areas with too little research or results that didn’t agree were found. This gap analysis is very important for finding areas that need more research and for guiding future research.
TEA, a vital instrument in the development of e-fuels, evaluates the viability, economic viability, and environmental impact of several production routes. This section examines pertinent TEA evaluations pertaining to e-fuel development. It encompasses several techniques to produce green hydrogen gas from water, studied the use of DAC in conjunction with FT of CO2 to produce e-fuels; and Rojas-Michaga and Michailos [84] combined DAC, offshore wind farms, and electrolysis to produce PtL e-SAF in the United Kingdom. By assessing e-fuels complete life cycle, from the extraction of raw materials to the disposal of them at the end of their useful life, LCA, is essential to comprehending the environmental effects of these fuels. The LCA research on e-fuels is methodically reviewed in this area, including information on their energy usage, greenhouse gas emissions, and general sustainability. This review highlights the potential environmental benefits and challenges associated with e-fuels by looking at different production pathways, such as electrolysis, DAC, and FT synthesis. This will help guide future research and policy decisions that aim to reduce the energy sector’s carbon footprint.
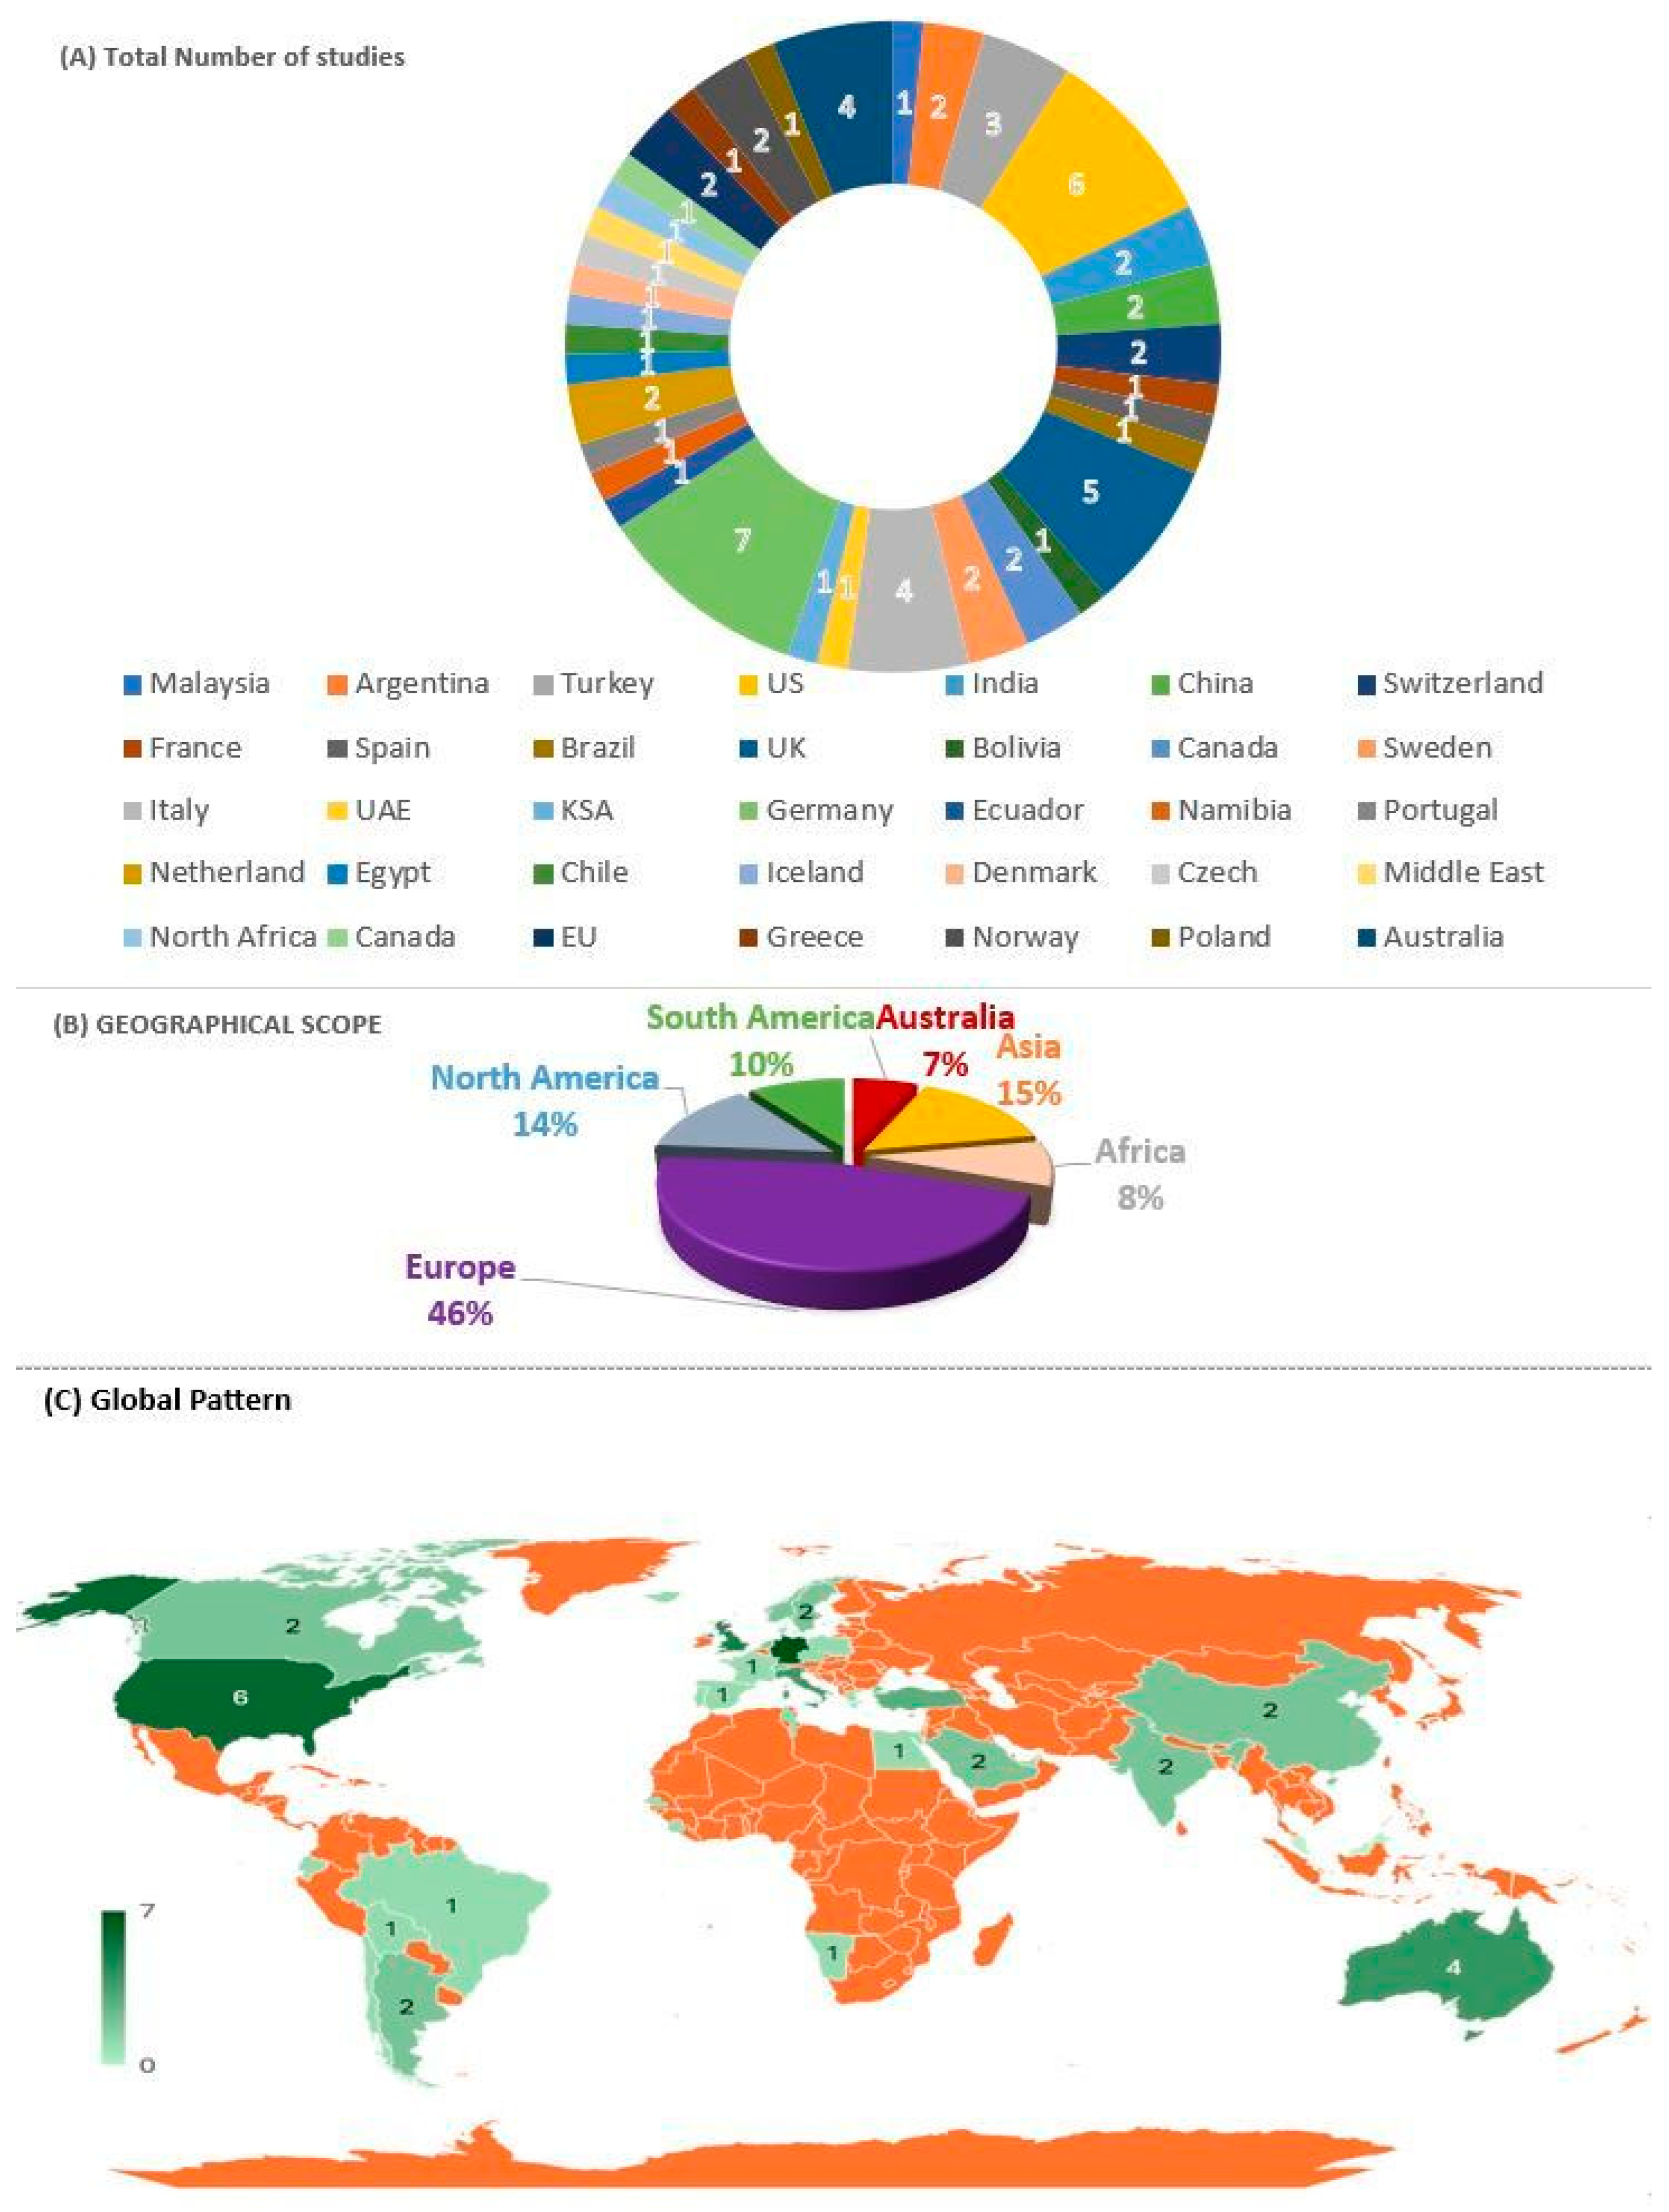
For our bibliographic collection, 50 articles from 35 countries and the results are illustrated through Table 7 and Figure 12C denoted by color intensity, which were mostly about countries in Europe (46% of the total publications) is as shown in Figure 12A,B. The Germany publishing the highest number of publications (7), UK (5), Italy (4), Turkey (3) [22], Netherland (2), Sweden (2), Norway (2), Switzerland (2), Iceland (1), Czech (1) [39], Portugal (1) and rest of them from others European countries [43,63]. This is followed Asia (9/50 publications), 15%, with 5 countries as follows: China (2/9), Saudi Arabia (2/9) [13], UAE (2/9), India (2/9) and Malaysia (1/9) and that of the North American continent is (8/50), including USA (6/8) and Canada (2/8). South America (6/50) contributed for 10% as follows: Chile (1/6), Argentina (2/6), Brazil (1/6), Bolivia (1/6) [115] and Ecuador (1/6). However, the contribution from Australia (4), 7% is comparatively small [35]. In addition, very few African (8%) countries have made contributions to the study [116]. Table 7 represents the Summary of the findings of the previous research on the technoeconomic and life cycle analysis of E-fuel production from 35 countries [117,118,119,120,121,122,123,124,125,126,127,128,129,130,131,132,133,134,135,136,137,138,139,140] in total contributed to the study of TEA and LCA of FT SAF. The scientific production of a country in one field is an index to evaluate the impact the country has on that specific academic field.
Table 7 represents the Summary of the findings of the previous research on the technoeconomic and life cycle analysis of E-fuel production in total contributed to the study of TEA and LCA of FT SAF.

5.3. Techno-Economic Viability and Life Cycle Impacts of SAF

In the study conducted in 2025 by SA Ali et al. [19]. an in-depth techno-economic and life cycle analysis was undertaken. It provides e-fuel production has achieved 20% efficiency improvements and 30–40% cost reductions, with TEA and LCA studies demonstrating 70–90% carbon reduction potential versus fossil fuels, while pilot projects confirm technical feasibility across sectors, though commercial viability requires costs below $3/kg. In the same year, an Argentain e-fuel plant achieves a kerosene yield of ~75%, supported by effective thermal integration and auxiliary services [116]. The plant uses 0.8 kgH2 and 3.1 kgCO2 per kg kerosene, utilizing H2 from wind energy and captured CO2 from a gas turbine [117]. Since FY 2017, a variety of U.S. federal government initiatives have funded R&D efforts related to SAF and begun to address CAPEX, OPEX and production cost premiums [118,119].
Wang, M et al. [36] provides a detailed life cycle emissions assessment, which is crucial for determining the environmental impact of SAF. The LCA discusses the potential of SAF to significantly reduce emissions compared to conventional jet fuels, highlighting its role in achieving sustainability goals [35]. The paper argues for the economic viability of SAF through a techno-economic analysis. This analysis examines the costs and economic conditions surrounding SAF production, which is essential for stakeholders to make informed decisions about investments and development in this sector. With an emphasis on carbon conversion, hydrogen conversion, and power-to-liquids efficiency, Rojas-Michaga, Michailos [114] carried out the study combining techno-economic and life cycle evaluation. A refinery plant, an offshore wind farm, an alkaline electrolyser, and a DAC unit were all incorporated into the system. Power-to-liquid (PtL) fuels were made using these. The efficiency of power-to-liquids was 25.6%, the carbon conversion was 88%, and the hydrogen conversion was 39.16%. It was determined that the Margin Jet Fuel Price (MJSP) was 5.16 £/kg [141].
Caner İlhan conducted the research combined both techno-economic and life cycle assessment [121] with a focus on the aviation industry’s energy consumption, which reached 12.1 MJ/RTK in 2022, with projections indicating a potential increase by 2.8 to 3.9 times by 2040 [142]. This information underscores the need for alternative energy sources to meet future demands [90]. The study forecasts that without a strategic shift, aviation emissions could reach 2000 megatons by mid-century. This projection emphasizes the potential environmental crisis and the necessity for immediate action within the industry. A life-cycle assessment was carried out by Ravi, Mazumder [137] emphasizing life cycle emissions associated with SAF, highlighting that these fuels can reduce carbon dioxide emissions by up to 80% compared to traditional fossil fuels. This positions SAF as a nearly carbon-neutral option when considering the full lifecycle of production and use. Evanthia A. Nanaki in Denmark also conducts a comprehensive LCA to evaluate the environmental impacts of various alternative energy fuels (AEFs) compared to conventional jet fuel. This includes quantifying emissions in terms of carbon dioxide equivalents, acidification, eutrophication, eco-toxicity, human toxicity, and carcinogens [92].
Alexander Barke in 2022, focused on the economic feasibility and environmental impact [143], The study highlights that while SAFs can reduce greenhouse gas emissions during flight operations, their production is often energy-intensive and can have negative environmental effects. The paper emphasizes the importance of using a renewable energy mix in the production of these fuels to achieve significant environmental benefits. The research reveals that, from an economic perspective, fossil kerosene remains more competitive than SAFs due to higher production costs associated with alternative fuels. The paper discusses the need for political measures, such as subsidies or tax incentives, to enhance the market penetration of SAFs [142].
Research encompassed a thorough techno-economic evaluation of the SAF production pathways in Australia. It highlights that, despite higher capital costs associated with the three-step Alcohol-to-Jet pathway, the levelized cost of supply is 14–25% lower than that of the FT process [144]. This finding is essential for stakeholders in the aviation industry to understand the cost-effectiveness of different SAF production methods. The research offers valuable insights into the carbon intensity of SAF production. It establishes that achieving emissions comparable to conventional jet fuel requires at least 84.6% of the power used in SAF production to come from renewable sources [123]. This contribution emphasizes the importance of renewable energy integration in reducing the carbon footprint of aviation fuels.
A. Bernalte García et al. [132] propose a flexible, technology-neutral heuristic to approximate the minimum selling price (MSP) of SAF. This approach allows for easier generalization and application across various emerging technologies, addressing the limitations of current techno-economic methods that can be extensive and complex. The paper demonstrates the use of the heuristic to evaluate strategies aimed at minimizing the cost of CO2 abatement for different SAF processes. This evaluation is crucial for guiding the development of economically viable and environmentally friendly production pathways.
Furthermore, in 2024, Australia underwent a comprehensive technical and economic analysis of the production of new SAFs [35]. This assessment is crucial for evaluating the feasibility and economic viability of implementing these fuels on a larger scale. On the other hand, in 2024, Switzerland and Sweden conduct a LCA of synthetic jet fuel production reveals significant reductions in GHG emissions and cost compared to conventional jet fuel. However, challenges remain in terms of cost and energy demand [125].
Colelli and Segneri conducted a thorough technical and financial study on the production of synthetic kerosene from green H2 and DAC CO2 in Italy in 2023 [138]. They used a combination of FT synthesis, CO2 capture, RWGS, and hydrogen produced by water electrolysis. They carried out process assessments and sensitivity analysis. The production rates from the direct and indirect processes were 38.46 and 66.18 barrels per day, respectively. Furthermore, the cost of the product varied greatly, ranging from 752–2364 €/bbl for the direct process to 460–1435 €/bbl for the indirect method. The analysis identified a significant reliance on the price of hydrogen and electricity generation.
Sweden also conducted a techno-economic analysis in 2024 and 2021 that was anticipated to cover the years 2020–2050 [133]. To produce RJF from lignocellulosic biomass and collected CO2, they employed Fischer-Tropsch (FT), HTL, and PTL (with a Python 3.9 MILP model) techniques [101]. According to the analysis, the blending ratio will lead to a rise in overall RJF output. They predict that RJF output will be between 3.85 and 16.87 TJ by 2030–2050 [35]. Additionally, the cost of producing HTL and PTL jet fuel varies; prices are expected to range from 24.2–25.4 SEK/L for HTL and 16.7–22.0 SEK/L for PTL. Importantly, by-product revenue may enable HTL and PTL approaches to provide competitive prices.
Gençer Zimmermann [136] focuses on TEA in relation to market potential and cost. Notably, the cost of products made per gigajoule (GJ) for OME3-5 e-fuels is substantially greater than that of traditional diesel fuel found at German petrol stations. Based on a reduced heating value, the study shows that e-fuel can effectively retain less than 38.4% of power. Rather than the cost of OME conversion, the most significant economic constraints found are related to energy usage and the price of electrolyzer stacks. The OME3-5 anhydrous route would not be economically viable in the current environment, even if the cost of energy or electrolyzers were significantly reduced. To increase the future economic feasibility of OME3-5 e-fuels, this highlights the necessity of major developments in reaction processes and system enhancements.
Cames and Chaudry [141] draw attention to a serious issue with CO2 storage brought on by IPCC predictions. It highlights the possibility of a scarcity of appropriate, affordable, and easily accessible CO2 storage locations due to the considerable amount of CO2 that has to be stored. The research highlights the cost difference between e-fuels and direct air capture and carbon storage (DACCS) solutions in this context, showing that by 2050, the difference will range from 1.0% to 2.5% of the ticket price. In addition to a techno-economic analysis, a thorough life cycle assessment (LCA) was conducted by [104]. When reliant on offshore wind power, the LCA found a global warming potential (GWP) of 21.43 gCO2eq/MJ synthetic aviation fuel (SAF). Compared to fossil jet fuel, this GWP is far lower than the UK’s target, which calls for a 50% decrease in emissions. Furthermore, the water-to-water adjusted (WtWa) water footprint was calculated to be 0.480 l/MJSAF, illustrating the process’s wider environmental effect.
Pipitone and Zoppi [135] assessed the process’s environmental viability, paying special attention to its carbon impact. A substantial reduction in the environmental effect was demonstrated by the advanced scenario, which had a carbon footprint of 12 g CO2/MJSAF, 54% lower than that of conventional approaches. Habermeyer and Papantoni [137] conducted life cycle analysis (LCA) research to evaluate the approaches’ effects on the environment. According to the findings, it is possible to produce 25 Mt a−1 of fuel utilizing direct renewable power sources and 33% forest waste. This might help the EU reach its target of 32% of SAF’s total aviation fuel usage by 2040.
Zang and Sun [139] carried out LCA research that concentrated on the WTW GHG emissions of FT fuels that come from electrolytic H2 channels and CO2 sources. The results, which considered several process designs and system limits, demonstrated that when combined with corn ethanol production, FT fuels had WTW GHG emissions that are 57–65% lower. Moreover, FT fuel had 58% energy efficiency and fixed 45% of the carbon in CO2. When compared to petroleum fuels, the WTW GHG emissions were drastically reduced by 90–108% using sources such as nuclear, solar, and wind generation. Another research that looked at PtL’s potential and effects on the environment revealed that PtL generated from wind energy might lessen environmental impact by as much as 42% [138].
Break-even points, which are frequently represented by metrics like MFSP, offer vital information on the viability of producing e-fuel in various settings. The importance of the energy source in influencing production costs was shown by the fact that MFSP values in the USA varied according to nuclear power plant capabilities [139]. Comparably, the LCOM in the UAE and Benevento and the LCOe in KSA offer essential standards for evaluating the financial effects of e-fuel manufacturing. Some studies point to the need for further financial incentives or technological advancements, while others present favorable return-on-investment scenarios, such as the e-fuel production costs seen in Turkey in 2022 [140]. For example, the LCOM values were higher than the current methane market price. This discrepancy highlights how crucial it is to put TEA in context and acknowledge the flexibility of its consequences for the market, technology, and policy [141].
Given China’s plentiful agricultural biomass supplies in 2024, the techno-economic analysis shows that manufacturing SAF from crops using the gasification–FT process is economically feasible in China [128]. The study considers the expenses related to the generation of hydrogen through electrolysis, CO2 through direct air capture (DAC), and synthetic natural gas (SNG) through condensation and TEG absorption. According to the study, US tax incentives for the generation of low-carbon hydrogen can drastically lower SNG prices. With a 45 V tax credit and an energy price of 0.03 USD/kWh for water electrolysis, the cost of SNG is comparable to that of fossil NG. By increasing SNG’s economic viability, the 45 V tax credit makes it a viable substitute for fossil fuel NG [128].
The MFSP in Saudi Arabia is USD 2.89/L for e-diesel and USD 3.24/L for e-gasoline. According to an Italian economic analysis, the LCoM is 960 EUR/t, while German research predicts that by 2050, the cost of producing e-fuels will have decreased to 1.8–3.1 EUR/kg [136]. According to UK research, the carbon conversion efficiency is 88% and the power-to-liquids efficiency is 25.6% [123]. Another study conducted in the USA shows that FT has a 70% process energy efficiency. According to Chinese research, ETJ had the lowest energy and GHG emissions, measuring 370.05 KJ/MJ and 31.66 gCO2eq/MJ, respectively. According to research conducted in the USA, e-fuels can cut WTW GHG emissions by 57–65% [114]. Additional research conducted in Norway emphasizes how important the environmental framework is to the adoption of CCU and e-fuels [136].
A study in India, employs LCA methods to evaluate the ecological implications of four types of alternative fuels compared to traditional fossil kerosene. This comprehensive analysis provides insights into the environmental benefits and drawbacks of using SAFs, emphasizing the need for a renewable electricity mix to achieve significant reductions in environmental impacts [124]. However, another study in Australia, highlights the necessity for a TEA of the production of new SAFs. This assessment is crucial for evaluating the feasibility and economic viability of implementing these fuels on a larger scale [117]. SAFs are increasingly becoming a focus of research and development as the aviation industry seeks to reduce its carbon footprint. A critical aspect of assessing the feasibility and viability of SAFs is conducting a techno-economic analysis to evaluate their cost of production and economic competitiveness compared to conventional jet fuels. In this section, we delve into the techno-economic analysis of synthetic E-fuels, which are produced from CO2 and H2, for use as sustainable aviation fuel. Depending on the exact product of interest, CCU may be referred to in literature or various databases as “electrofuels”, “PtL”, “CCU”, “Power-to-Aviation”, and so on. Gathering these names with other keywords, such as “techno-economic analysis”, “environmental analysis” or LCA, different search engines provide a range of publications and studies, the number of which grows year after year. The current level of PtL, TEA and LCA research revolves around 3 major applications:
(i)
storing of intermittent electricity generation (as wind or PV) [105,106],
(ii)
production of 27 transportation fuels [38,39,59,97,107,108,109,110,111,112], and
(iii)
production of chemical substances [95,97,111].
The PtL pathway for producing FT-derived fuels is a relatively novel alternative method. There is no any single drop of SAF produced in Australia from PtL so far. There is an extensive bibliography on methane [113,114,115] and hydrogen synthesis [116,117,118,119,120,121,122]. Similarly, there have been numerous studies on the environmental performance of this manufacturing process, with most of them concentrating on estimating the GWP [123,124,125]. Some study on technical and experimental [126] performances of the PtL process or bottleneck areas of the process is currently being developed. König et al. [110] discovered that the PtL process had a carbon conversion rate of 73.7% and an efficiency of 43.3% using process modelling. High PtX (Power to any product) costs relate to high capital expenses and H2 production costs (mostly impacted by energy and electrolyser capital costs). Tremel et al. [108] examined several fuel/chemical synthesis methods in terms of technology, economics, and acceptance; FT has excellent public acceptance due to its product’s likeness to traditional fossil fuels. Furthermore, they discovered that the high cost of H2 generated by water electrolysis is the primary cause for the high cost of PTX fuels and chemicals. There has been minimal study that explicitly examines the manufacturing of SAF using a PtL technique that is currently accessible. Economic evaluations are often performed to determine the cost and economic viability of such a process, taking into consideration the feedstock, energy, and capital investment requirements. Three separate papers evaluated the economic and environmental performance of PtL-derived SAF. By analysing short- and long-term scenarios, these reports determined whether this method was economically viable. Furthermore, the estimated minimum jet fuel selling price of the SAF is much higher when compared to the gate price of conventional jet fuel.

Critical Analysis

There appears to be a heterogeneity of metrics employed across various studies for the assessment of both techno-economic and environmental dimensions of e-fuels production. Illustrative examples follow. The studies encompass a range of metrics, including “minimum fuel selling price (MFSP)” and “levelised cost of Fuel (LCoF)” for evaluating economic viability, thereby complicating direct comparisons. This divergence underscores the necessity for standardised metrics to establish clearer benchmarks for comparative analyses [136,145]. The research predominantly concentrates on conventional feedstocks such as CO2, H2, and biomass. Nonetheless, the origin of these feedstocks (for instance, direct air capture versus point-source capture for CO2, or various types of biomass) may yield substantial disparities in both economic and environmental results. Investigations that specifically focus on a direct comparison of feedstock sources are relatively scarce [135,138]. Several studies accentuate the advantages of integrated systems, such as the amalgamation of FT synthesis with corn ethanol production or the incorporation of power-to-methanol with MSW gasification. However, the comparative benefits of these integrated systems in relation to standalone processes necessitate more exhaustive research [115,146]. The studies originate from diverse geographical contexts [147,148], each characterized by distinct energy infrastructures, regulatory frameworks, and natural resource endowments. Although some studies offer specific insights pertinent to their respective regions, a holistic comparative analysis regarding the influence of geographical factors on the economic and environmental ramifications of e-fuel production is conspicuously absent. Certain studies [139,149] allude to the significance of technological advancements; however, comprehensive examinations of how emergent technologies (such as advancements in catalysts, electrolysers, or carbon capture methodologies) may transform existing paradigms are relatively limited. While numerous studies [150,151] utilize LCA and primarily concentrate on greenhouse gas emissions, other environmental ramifications, including water consumption, land utilization, or effects on biodiversity, are less frequently addressed. This deficiency in comprehensive environmental assessments may overlook some indirect adverse impacts associated with specific e-fuel production methodologies. The research conducted by Romo Martínez [152] emphasizes the importance of carbon CCU and H2 based e-fuels in consideration of societal acceptance, regulatory factors, and safety protocols. Nevertheless, these socio-political dimensions are infrequently examined in other investigations, indicating a potential lacuna in the research landscape. Regarding economic viability, some studies [151,152,153,154,155] draw attention to the elevated costs linked to the uneven distribution of solar energy, whereas others, such as the research conducted in the UK, suggest comparatively lower costs and favorable outcomes. These contradictory findings indicate that variables such as local conditions, technology selections, and feedstock sources can significantly affect results, thereby underscoring the requirement for more standardized assumptions and scenarios.

5.4. Cost of Production: Current Status and Future Projections

The cost of production is a key factor in determining the feasibility of synthetic E-fuels as a sustainable aviation fuel source. Currently, the cost of producing synthetic E-fuels is higher than that of conventional jet fuels, primarily due to the high cost of hydrogen production and the limited scale of synthetic E-fuel production facilities. Electrochemical reduction and Fischer-Tropsch synthesis are among the primary pro-duction pathways, and both require significant energy inputs. The cost of renewable energy for H2 production is a major component of the overall cost, and advancements in low-cost, green H2 production methods are crucial to reducing the cost of E-fuel production.
The cost distribution for the four main technological pathways, FT, AtJ, HEFA, and E-Jet including feedstock contributions, CAPEX, and OPEX is shown in Figure 13 [153]. The cost structure of the HEFA route is comparatively balanced, with OPEX making up 8–10% and CAPEX accounting for 22–40%, including infrastructure associated to hydrogen. The reliance on lipid-based resources, such as waste oils, is revealed by the fact that feedstocks account for the biggest cost share (51–69%). With CAPEX ranging from 54 to 81% and OPEX comprising 12 to 21% and feedstock prices varying from 0 to 32%, the FT method is notably capital-intensive.
However, it offers considerable flexibility because it may make use of inexpensive or subsidized biomass. AtJ needs to spend heavily in infrastructure for the processing of alcohol, which results in 45–75% CAPEX contributions, comparatively low OPEX (2–14%), and moderate feedstock expenses (20–44%), depending on the kind of alcohol. On the other hand, because hydrogen-related expenses fall under feedstock, which accounts for 70–85% of the cost profile because of the energy-intensive processes required in CO2 collection and green hydrogen synthesis, E-Jet fuels have the lowest CAPEX range (5–20%); OPEX varies from 5 to 15%.
Overall, FT and AtJ are hampered by high capital costs, whereas feedstock costs predominate in HEFA and E-Jet paths. In order to achieve cost-effective deployment and scaling, these findings emphasize the significance of tailored financial and regulatory interventions that consider the unique economic features of each SAF route. In addition to renewable H2, the cost of CO2 capture and storage technologies also plays a significant role in the cost of production. As carbon capture and utilization technologies advance and become more widespread, they have the potential to lower the cost of CO2 feedstock.

5.5. Economic Viability and Challenges

Evaluating the economic viability of synthetic E-fuels involves comparing their cost to that of conventional jet fuels derived from crude oil. Because the aviation industry has very low profit margins, it is very important to keep an eye on fuel costs. Even though the cost of making synthetic E-fuels is high right now, they are expected to become economically viable through better efficiency and economies of scale. Also, as the aviation industry is under pressure to cut carbon emissions, it may be more willing to invest in SAF. The price of crude oil, government incentives, carbon pricing, and the need for SAF all affect how economically viable synthetic E-fuels are. The recovery after COVID-19 gives governments and businesses a chance to invest in the development of SAF, which will make the economy more competitive. Tax reducing, research grants, and low-interest loans for the growth and infrastructure of synthetic E-fuels are all possible ways to help. Carbon pricing mechanisms can make traditional jet fuels more expensive, which can make people more likely to use SAF.
LCA looks at how making synthetic natural gas (SNG) from low-carbon hydrogen and carbon dioxide capture affects the environment. Studies show that SNG can cut greenhouse gas emissions over the course of its life by 52 to 88 percent compared to fossil natural gas, depending on the energy sources used. Using renewable energy to make hydrogen and store CO2 connects SNG to the United States’ goals for sustainable energy.
Combining life cycle assessments with techno-economic evaluations gives us a lot of information about the sustainability of e-fuels. This method is necessary to make sure that long-term ecological results and initial financial evaluations are in agreement. The RWGS reaction and high-temperature electrolysis are two major breakthroughs that improve carbon conversion efficiency, but their economic viability depends on the size of the operation and future technological advances. TEA of synthetic E-fuels show that there are still problems with the cost of making them and their financial viability. Even so, advances in technology and policies that support them make synthetic E-fuels very promising for the aviation industry’s long-term health. For an economy to work, industry, government, and technology need to work together.
In these studies, the TEA of synthetic E-fuels for SAF highlights the current challenges in terms of production costs and economic competitiveness. But better technology and policies that support it suggest that synthetic E-fuels could be a big part of making flying better for the environment. Businesses, governments, and new technologies all need to work together to keep the economy strong. There are big scientific and economic problems with making and using SAFs, so the aviation industry can’t grow. The many types of feedstocks are a big technological problem because they have different properties and aren’t always available. This influences how well fuel works and how well it is made. It is harder to stabilize supplies when other businesses are competing for feedstocks, and conversion methods make things even more complicated. Two big areas of study are making catalysts work better and figuring out how to use renewable energy in PtL processes.
The manufacture and marketing of Sustainable Aviation Fuels (SAFs) confront substantial technological and economic obstacles that limit their scalability and acceptance in global aviation. One of the most significant technical challenges is the variety of feedstock. SAFs can be created from a variety of sources, including biomass, municipal solid waste, industrial pollutants, and agricultural leftovers. However, the uneven quality, availability, and seasonality of these feedstocks have an impact on fuel performance, production efficiency, and scalability. Competition for these feedstocks from other industries challenges their secure and long-term supply. Conversion methods such as FT synthesis, hydrotreatment, and alcohol-to-jet procedures also provide technological challenges. These processes frequently need costly catalysts, run under energy-intensive conditions, and are sensitive to input contaminants. Developing more robust, cost-effective, and selective catalysts is an important research topic. Including renewable energy sources such as solar or wind for green hydrogen generation is critical for Power-to-Liquid (PtL) routes, but present systems remain inefficient and expensive to operate.

Commercialization and Collaborative Efforts of SAF

The commercialization of SAFs is experiencing significant advancement as a pivotal strategy for the decarbonization of the aviation sector, albeit considerable economic and infrastructural obstacles remain. Present production levels constitute approximately 3.5% of the feasible capacity, with expenditures averaging over 120% higher than those of conventional jet fuel [154]. Ambitious policy frameworks, exemplified by the U.S. SAF Grand Challenge which aims for an annual output of 3 billion gallons by 2030 and 35 billion gallons by 2050, emphasize the magnitude of transformation necessary, necessitating a 130 fold escalation in production relative to existing baselines [155]. Certification via ASTM D7566, encompassing HEFA at TRL 9, has established a comprehensive regulatory framework for implementation, while advanced methods such as ATJ and PtL are increasingly demonstrating techno-economic viability [123,156]. Investment dynamics reflect growing confidence, with hydrothermal liquefaction integrated scenarios demonstrating life-cycle greenhouse gas reductions of 73–82% versus fossil jet fuel, positioning waste cooking oil and tallow feedstocks as commercially viable pathways with 2.8–5.8 times greater emissions reductions [157,158]. The commitments from airlines, bolstered by ICAO targets and alignment with UNSDG 13, reflect a growing confidence in SAF [99,104]. With lifecycle assessments indicating potential reductions in GHG emissions of up to 80% and diversification of feedstock contributing to supply resilience [101,102,103], the commercialization of SAF, although constrained by cost, is progressively being recognized as an essential component of the aviation sector’s sustainable transition. Collaborative efforts between industry and academia are propelling advancements in catalyst design, feedstock optimization, and process efficiency, while policy incentives spanning from carbon pricing to renewable fuel credits are attracting private investment and venture capital [96,97,98].
Making SAF is still too expensive compared to regular jet fuel from an economic point of view because of high capital and operational costs. The difference in costs is a big problem for airlines, but government incentives are starting to close the gap in some places. A lot of money needs to be spent on infrastructure to make the SAF market strong. But changes in fossil fuel prices could make the market less competitive. For SAF to be possible in the long run, it needs to be able to compete with fossil fuels on price and get ongoing support from regulators. The only way to solve the problems that are both technological and economic is for the government, businesses, and academics to work together. Need new conversion technologies, a wider range of feedstocks, better energy efficiency, and laws that make it easier to do all of this for SAFs to be a viable option for lowering carbon emissions in aviation.

6. Conclusions and Outlook

The rise in SAFs has been noted worldwide and SAFs are supported by major states and international organisations due to this aviation fuel regulation reform. IATA wants SAFs to make up 10% of aviation fuel by 2030 [21]. The US and EU offer incentives, requirements, and subsidies for SAF production and UN International Civil Aviation Organization (ICAO) is striving to simplify SAF use and define worldwide environmental criteria [23]. All these efforts illustrate that everyone thinks SAFs make flying more sustainable. Pressure is mounting on the aviation industry to reduce its carbon footprint and fulfill international climate goals like the Paris Accord [24]. SAF might reduce named emissions over Palladium compared to fossil-based Jet A fuel. To reduce carbon emissions, the aviation industry must make this decision. Tallow, city waste, and other bio-based products are used to make SAF. Before SAF is extensively deployed, many technological, financial, and regulatory obstacles must be handled. Based on comprehensive literature reviews, several viable production pathways offer promising routes for large-scale SAF deployment.
HEFA represents the most commercially mature pathway, utilizing waste cooking oils, used vegetable oils, and dedicated oil crops through established hydroprocessing technology, though scalability is constrained by sustainable feedstock availability [153]. FT synthesis offers exceptional feedstock flexibility, converting biomass, municipal wastes, or CO2 through gasification and catalytic conversion, with PtL variants showing particular promise when coupled with renewable electricity and electrolytic hydrogen production [159]. ATJ processes present an innovative approach, particularly CO2-derived variants that can achieve 1.6 times higher SAF yields and 14–25% lower production costs compared to conventional FT routes by integrating carbon capture with renewable energy systems [123,160]. Advanced catalytic processes are revolutionizing production efficiency through atomic-scale catalyst design and improved selectivity in syngas conversion and hydroprocessing steps [161,162]. Emerging technologies such as waste tire and plastic pyrolysis-gasification demonstrate competitive economics while addressing waste management challenges, and photocatalytic reforming offers novel pathways for simultaneous hydrogen production and waste valorization [163,164].
For Australia’s unique context, the integration of abundant renewable energy resources with PtL pathways, combined with the country’s strong R&D capabilities in advanced catalysis and waste-to-fuel technologies, positions the nation to develop a competitive and sustainable SAF industry that can meet both domestic aviation needs and export opportunities while contributing to global decarbonization targets. This review examined the environmental impact and technology and economic performance of SAFs throughout their life cycle and their viability in Australian aviation has been the focus.
SAFs, manufactured from biomass and synthetic e-fuels, minimize aviation’s fossil fuel use and greenhouse gas emissions. They reduce particulate pollution, clean the air, and make energy safer. Australia is far from other countries and has many resources, making this crucial. However, many major difficulties remain. Not much biomass can be used to manufacture SAFs, and changing it is expensive. The SAF also competes with food and power. Synthetic e-fuels fit with aviation infrastructure and long-term carbon emission reduction targets instead of, they are energy-intensive and expensive to produce. Government regulations, market incentives, and technology advancements affect the economy in both circumstances. The market struggles to accept these items due to international regulations and the expensive cost of certification methods like ASTM D7566. Despite these challenges, Australian SAFs are doing well. The country has abundant renewable energy, strong R&D, and growing government support for SAF. All these factors make it ideal for a competitive SAF sector. Better power-to-liquid, carbon capture, electrolysis, and catalytic synthesis should cut production costs, especially when scaled up. To balance cost, scalability, and sustainability, research and policymaking should use LCA and TEA frameworks. Government, business, academia, and foreign partners must collaborate to eliminate aviation pollution. Aligning policies, building infrastructure, and changing rules can help SAF spread faster. SAFs, especially synthetic e-fuels, could help the Australian and global aviation sector transition to a low-carbon future with the appropriate backing and fresh ideas.
This study brings together recent SAF research and provides crucial information regarding emerging technologies including carbon capture and PtL synthesis. These innovations could make aviation fuels greener and help the globe become more sustainable. The evaluation emphasizes the need for academia, industry, and the government to collaborate to remove barriers and accelerate innovation. It provides a roadmap for SAF deployment, notably in Australia, where long-distance travel, renewable energy, and strong climate policies coexist.

Author Contributions

M.N.U. wrote, and his supervisor F.W. supervised this manuscript. All authors have read and agreed to the published version of the manuscript.

Funding

Funded by Victorian Hydrogen Hub (VH2) for M.N. Uddin’s Postgraduate Research Program.

Data Availability Statement

No new data were created or analyzed in this study.

Acknowledgments

M.N.U. acknowledges Swinburne University Postgraduate Research Award (SUPRA) to carry out the research project.

Conflicts of Interest

The authors declare that they have no known competing financial interest or personal relationships that could have appeared to influence the work in this paper.

Abbreviations

AbbreviationFull Term
AAcidification
ARENAAustralian Renewable Energy Agency
C6H12O5CH3CH2OH
CECH3OH
CNGCompressed natural gas
COCarbon monoxide
EEutrophication
ECEthyl cellulose
EJExajoules
FTFischer Tropsc
GIEGas Infrastructure Europe
GWhGigawatt hours
H2Hydrogen
H2SHydrogen sulfide
HTHuman toxicity
IRIndustrial revolution
LCALife-cycle assessment
LCIALifecycle inventory analysis
LNGLiquified natural gas
MbtuMega British thermal units
MWMegawatt
N2Nitrogen
NH3Ammonia
O2Oxygen
MSWMunicipal solid waste
RGFRenewable “Green” Fuels
WEWaste Energy
TEATechno-economic analysis
TJTerajoule
TSATemperature swing adsorption
USA/USUnited States of America
AbDAbiotic depletion
OECDOrganization of Economic Co-operation and Development
C6H12O6Glucose
CH4Methane
CO2Carbon dioxide
DEADiethanol amine
EBAEuropean Biogas Association
EEElectrical energy
EMDEarly modern development
GHGGreenhouse gases
GJGigajoule
GWPGlobal warming potential
H2OWater
HPWSHigh pressure water scrubbing
IEAInternational Energy Agency
IRRInternal rate of return
LCCLifecycle costing
LLCALife-cycle cost analysis
MAETMarine aquatic ecotoxicity
MDEAMethyl diethanol amine
MWhMegawatt hours
NCfNet cash flow
NPVNet present value
WWTPWaste Water treatment plant
OLDOzone layer depletion
SO2Sulfur dioxide
STPStandard temperature and pressure
TEThermal energy
TRLTechnological readiness level
TWhTerawatt hours
PTLPower to Liquid

References

  1. Nunes, L.J. The rising threat of atmospheric CO2: A review on the causes, impacts, and mitigation strategies. Environments 2023, 10, 66. [Google Scholar] [CrossRef]
  2. Miao, Q.; Nduneseokwu, C. Global environmental leadership: Addressing the triple planetary crisis. In Environmental Leadership in a VUCA Era: An Interdisciplinary Handbook; Springer: Berlin/Heidelberg, Germany, 2025; pp. 37–119. [Google Scholar]
  3. Fu, B.; Li, J.; Gasser, T.; Ciais, P.; Piao, S.; Tao, S.; Shen, G.; Lai, Y.; Han, L.; Li, B. Climate warming mitigation from nationally determined contributions. Adv. Atmos. Sci. 2022, 39, 1217–1228. [Google Scholar] [CrossRef]
  4. Alghamdi, A.; Alharethi, M.; Leal-Arcas, R. COP30 in Brazil: A Critical Juncture for the Paris Agreement. In Queen Mary Law Research Paper No. 010/2025; Queen Mary University of London: London, UK, 2025; pp. 1–40. [Google Scholar] [CrossRef]
  5. Sulik-Górecka, A.; Strojek-Filus, M. CO2 Emission Reporting of maritime and air transport in the context of sustainable development. Prod. Eng. Arch. 2022, 28, 381–389. [Google Scholar] [CrossRef]
  6. Wang, L.K.; Balasubramanian, R.; He, J.; Wang, M.-H.S. Control and Management of Air Emissions from the Transportation Industry. In Control of Heavy Metals in the Environment; CRC Press: Boca Raton, FL, USA, 2025; pp. 396–420. [Google Scholar]
  7. Leal Filho, W.; Ng, A.W.; Sharifi, A.; Janová, J.; Özuyar, P.G.; Hemani, C.; Heyes, G.; Njau, D.; Rampasso, I. Global tourism, climate change and energy sustainability: Assessing carbon reduction mitigating measures from the aviation industry. Sustain. Sci. 2023, 18, 983–996. [Google Scholar] [CrossRef]
  8. Quaresma, G.; Magalhães, L.B.; Ferreira, A.F.; Silva, A. E-Kerosene Potential for Commercial Aviation Decarbonization. In Proceedings of the 34th Congress of the International Council of the Aeronautical Sciences (ICAS 2024), Florence, Italy, 9–13 September 2024; pp. 9–13. [Google Scholar]
  9. Etchebehere, V. Climate change and aviation. In Handbook of Business and Climate Change; Edward Elgar Publishing: Cheltenham, UK, 2023; pp. 187–207. [Google Scholar]
  10. Mustapha, C. The burden of a ton CO2! Emission trading systems and the air transport business. In The Air Transportation Industry; Elsevier: Amsterdam, The Netherlands, 2022; pp. 27–53. [Google Scholar]
  11. de la Hoz, J.; Martín, H.; Guerrero, J.M. Technologies and policies for decarbonisation of the industrial and transport sectors. Front. Media SA 2023, 11, 1200837. [Google Scholar] [CrossRef]
  12. Edgell, R.; Henao, F.; Durgin, W.W.; Olney, J.; Chappala, R. The Future of Sustainable Aviation: Navigating the Sociotechnical Matters of Concern. In Proceedings of the AIAA Aviation Forum and Ascend 2025, Las Vegas, NV, USA, 21–25 July 2025. [Google Scholar]
  13. Ismael, M.A.; El-Adawy, M.; Farooqi, A.S.; Hamdy, M.; Shahid, M.Z.; Elserfy, Z.; Nemitallah, M.A. Sustainable Aviation Fuel: Operational Challenges, Techno-Economics, and Life Cycle Analysis. Energy Fuels 2025, 39, 13848–13878. [Google Scholar] [CrossRef]
  14. Huete, J.; Nalianda, D.; Zaghari, B.; Pilidis, P. A Strategy to Decarbonize Civil Aviation: A phased innovation approach to hydrogen technologies. IEEE Electrif. Mag. 2022, 10, 27–33. [Google Scholar] [CrossRef]
  15. Belcher, A.; Workman, M.; Jefferson, A.; Ostrovnaya, A. Aviation sector decarbonisation as a case of deep uncertainty: The need for an integrative, exploratory, and interdisciplinary approach. Energy Res. Soc. Sci. 2025, 127, 104158. [Google Scholar] [CrossRef]
  16. Sethi, V.; Sun, X.; Nalianda, D.; Rolt, A.M.; Holborn, P.; Wijesinghe, C.; Xisto, C.; Jonsson, I.; Grönstedt, T.; Ingram, J. Enabling cryogenic hydrogen-based CO2-free air transport: Meeting the demands of zero carbon aviation. IEEE Electrif. Mag. 2022, 10, 69–81. [Google Scholar] [CrossRef]
  17. El-Adawy, M.; Dalha, I.B.; Ismael, M.A.; Al-Absi, Z.A.; Nemitallah, M.A. Review of sustainable hydrogen energy processes: Production, storage, transportation, and color-coded classifications. Energy Fuels 2024, 38, 22686–22718. [Google Scholar] [CrossRef]
  18. López Gómez, M. Value Chain for the Implementation in Use and Production of Sustainable Aviation Fuel (SAF) in Colombia. Ph.D. Thesis, University of the Andes, Bogotá, Colombia, 2024. [Google Scholar]
  19. Koščáková, M.; Korba, P.; Sekelová, I.; Koščák, P.; Pastír, D. Analysis of Sustainable Aviation Fuels Market. In Proceedings of the 2022 New Trends in Aviation Development (NTAD), Novy Smokovec, Slovakia, 24–25 November 2022; IEEE: New York, NY, USA, 2022. [Google Scholar]
  20. Meydani, A.; Shahinzadeh, H.; Gharehpetian, G.B.; Hayati, M.M.; Abapour, M. Power-to-X: Pioneering the Future of Sustainable Energy. In Power-to-X in Regional Energy Systems; CRC Press: Boca Raton, FL, USA, 2025; pp. 1–56. [Google Scholar]
  21. Ambraziejus, L. Towards Safe and Sustainable Aviation Decarbonization: The Case for Fewer Flights on Higher Quality SAF. Master’s Thesis, Utrecht University VET, Utrecht, The Netherlands, 2025. [Google Scholar]
  22. Klimczyk, W.; Jasiński, R.; Niklas, J.; Siedlecki, M.; Ziółkowski, A. Sustainable Aviation Fuels: A Comprehensive Review of Production Pathways, Environmental Impacts, Lifecycle Assessment, and Certification Frameworks. Energies 2025, 18, 3705. [Google Scholar] [CrossRef]
  23. Rahman, A. Battery and Fuel Cell Powertrains for Small Passenger Aircrafts. Bachelor’s Thesis, LUT University, Lappeenranta, Finland, 2025. [Google Scholar]
  24. Raj, C.A. Aerospace technologies and their impact on global climate change: The role of electrical systems in sustainable aviation and space travel. World J. Adv. Res. Rev. 2025, 26, 543–553. [Google Scholar] [CrossRef]
  25. Flüthmann, N.; Schunkert, T.; Gelhausen, M.; Leipold, A. Emission Reduction Potential of Hydrogen-Powered Aviation Between Airports in Proximity of Seaports. Aerospace 2025, 12, 661. [Google Scholar] [CrossRef]
  26. Cardi, D. Sustainable Future of Mobillity: Potential Alternatives to Traditional Fuels for Transportation. Master’s Thesis, University of Bologna, Bologna, Italy, 2025. Advanced Design Program [LM-DM270]. Available online: https://amslaurea.unibo.it/id/eprint/34988 (accessed on 15 August 2025).
  27. Zhang, S.; Lee, D.E.; Qiao, L. Assessing the drag implications of hydrogen fuel utilization in small aircraft: A preliminary numerical analysis. arXiv 2023, arXiv:2310.01265. [Google Scholar] [CrossRef]
  28. Adler, E. Hydrogen-Powered Aircraft Design Optimization. Ph.D. Thesis, University of Michigan, Ann Arbor, MI, USA, 2024. [Google Scholar]
  29. Diaz Tapia, I.V. Challenges of SAF Production Under the Requirements of the ReFuelEU Aviation Initiative. Master’s Thesis, Hasselt University, Hasselt, Belgium, 2024. [Google Scholar]
  30. Cazzola, P.; Murphy, C.; Kang, L.; Ro, J.W.; Wolff, C.; Teter, J. Comparative Assessment of the EU and US Policy Frameworks to Promote Low-Carbon Fuels in Aviation and Shipping; European Transport and Energy Research Centre: Paris, France, 2024. [Google Scholar]
  31. Höwelhans, C. A European Perspective on the Impact of Sustainable Aviation Fuels on Business Models Across the Air Cargo Industry Value Chain. Master’s Thesis, Technology, Policy and Management, Delft, The Netherlands, 2024. [Google Scholar]
  32. Ebrahimi, S.; Chen, J.; Bridgelall, R.; Szmerekovsky, J.; Motwani, J. Unlocking the Commercialization of SAF Through Integration of Industry 4.0: A Technological Perspective. Sustainability 2025, 17, 7325. [Google Scholar] [CrossRef]
  33. Arousell, L.S. Will Sustainable Aviation Fuel (SAF) Be Able to Meet Future Demand for Sustainable Air Travel, and If So, at What Cost? Master’s Thesis, University of Geneva, Geneva, Switzerland, 2025. Available online: https://archive-ouverte.unige.ch/unige:183059 (accessed on 15 August 2025).
  34. Brodzik, Ł.; Prokopowicz, W.; Ciupek, B.; Frąckowiak, A. Minimizing the Environmental Impact of Aircraft Engines with the Use of Sustainable Aviation Fuel (SAF) and Hydrogen. Energies 2025, 18, 472. [Google Scholar] [CrossRef]
  35. Uddin, M.; Wang, F. Fuelling a clean future: A systematic review of Techno-Economic and Life Cycle assessments in E-Fuel Development. Appl. Sci. 2024, 14, 7321. [Google Scholar] [CrossRef]
  36. Wang, M.; Yu, X. An Overview of the Sustainable Aviation Fuel: LCA, TEA, and the Sustainability Analysis. Eng. Proc. 2024, 80, 3. [Google Scholar]
  37. Havle, C.A.; İlhan, C. Analyzing the Requirements for Transitioning to Sustainable Aviation Fuels Using the Spherical Fuzzy AHP Method. In Proceedings of the International Conference on Intelligent and Fuzzy Systems, Istanbul, Turkiye, 29–31 July 2025; Springer: Berlin/Heidelberg, Germany, 2025. [Google Scholar]
  38. Barbosa, F.C. Sustainable Aviation Fuel—An Effective Tool for Complying with the Aviation’s Global Environmental Commitment; SAE Technical Paper; Society of Automotive Engineers (SAE): Warrendale, PA, USA, 2024. [Google Scholar]
  39. Szyc, R.; Lenort, R. Sustainable Aviation Fuels as the Path to Carbon Neutrality in Air Transport. Rocz. Ochr. Srodowiska 2024, 26, 707–715. [Google Scholar] [CrossRef]
  40. Jarin, J.-B.; Champion-Réaud, J.-L.; Sallinen, R.; Steenwinkel, E. Emissions Comparison of 100% SAF with Bio-Aromatics and Conventional (Fossil) Jet Fuel. In Turbo Expo: Power for Land, Sea, and Air; American Society of Mechanical Engineers: New York, NY, USA, 2024. [Google Scholar]
  41. Köse, Y.; Polat, E.O. An Empirical Analysis on the Use of Sustainable Fuels in the Aviation Industry. Int. J. Aviat. Sci. Technol. 2024, 5, 90–100. [Google Scholar] [CrossRef]
  42. Escobar, N.; Seber, G.; Skalsky, R.; Wögerer, M.; Jung, M.; Malina, R. Spatially-explicit land use change emissions and carbon payback times of biofuels under the Carbon Offsetting and Reduction Scheme for International Aviation (CORSIA). Sci. Total Environ. 2024, 948, 174635. [Google Scholar] [CrossRef] [PubMed]
  43. Nanaki, E.A.; Kiartzis, S. Sustainability Assessment of Alternative Energy Fuels for Aircrafts—A Life Cycle Analysis Approach. Fuels 2024, 5, 825–838. [Google Scholar] [CrossRef]
  44. Chen, W.; Ai, Y. Research on the carbon emission prediction and reduction strategies for the civil aviation industry in China: A system dynamics approach. Sustainability 2024, 16, 8950. [Google Scholar] [CrossRef]
  45. Dischl, R.; Sauer, D.; Voigt, C.; Harlaß, T.; Sakellariou, F.; Märkl, R.; Schumann, U.; Scheibe, M.; Kaufmann, S.; Roiger, A. Measurements of particle emissions of an A350-941 burning 100% sustainable aviation fuels in cruise. Atmos. Chem. Phys. 2024, 24, 11255–11273. [Google Scholar] [CrossRef]
  46. Karpuk, S.; Freund, Y.; Hanke-Rauschenbach, R. Potential of Hydrogen Fuel Cell Aircraft for Commercial Applications with Advanced Airframe and Propulsion Technologies. Aerospace 2025, 12, 35. [Google Scholar] [CrossRef]
  47. Suárez, M.Z.; Moreno, F.P.; Jurado, R.D.-A.; Valdés, R.M.A.; Comendador, V.F.G. An overview of the possibilities, current status, and limitations of battery technologies to electrify aviation. In Journal of Physics: Conference Series; IOP Publishing: Bristol, UK, 2024. [Google Scholar]
  48. Münch, M.; Teichmann, F. Australian e-SAF for the German Aviation Sector; Adelphi Consult GmbH: Berlin, Germany, 2025. [Google Scholar]
  49. Pattanayak, T.; Mavris, D. Battery technology for sustainable aviation: A review of current trends and future prospects. Appl. Energy 2025, 397, 126356. [Google Scholar] [CrossRef]
  50. Kurzawska-Pietrowicz, P.; Jasiński, R. A Review of Alternative Aviation Fuels. Energies 2024, 17, 3890. [Google Scholar] [CrossRef]
  51. Batteiger, V.; Ebner, K.; Moser, L.; Penke, C.; Portner, B.; Sizmann, A. Power-To-Liquid (PTL) Kerosene and Opportunities to Introduce Green Hydrogen in Aviation. In Powerfuels: Status and Prospects; Springer: Berlin/Heidelberg, Germany, 2024; pp. 849–878. [Google Scholar]
  52. Nyholm, F.; Toppinen, S.; Saxen, H. Holistic Evaluation Method for Concept-Level Study of Power-to-Liquids Technologies for e-Kerosene Production. Ind. Eng. Chem. Res. 2024, 63, 20264–20286. [Google Scholar] [CrossRef]
  53. Mukherjee, A.; Grahn, M.; Hansson, J.; Boter, T.; Junginger, M.; Rådberg, H.; Wallington, T.J.; de Jong, S.; De Kleine, R. PtL Fuels and Biofuels: A Dream Team? In Powerfuels. Green Energy and Technology; Bullerdiek, N., Neuling, U., Kaltschmitt, M., Eds.; Springer: Cham, Switzerland, 2025; pp. 1127–1156. [Google Scholar] [CrossRef]
  54. Langston, S.E. Sustainable Aviation Fuel. In Inaugural Issue: Energy Convers; Neste: Espoo, Finland, 2025; Volume 1, Available online: https://energyconversions.org/index.php/ecm/article/view/20 (accessed on 15 August 2025).
  55. Uddin, M.N.; Wang, F. Sustainable Aviation Fuels: Addressing Barriers to Global Adoption. Appl. Sci. 2025, 15, 10925. [Google Scholar] [CrossRef]
  56. Mobarezkhoo, H.; Barke, A.; Joormann, I.; Spengler, T.S. Potentials of electrofuels for decarbonizing long-haul flights: A holistic framework for evaluating the impacts of carbon capture strategies in electrofuel production. Procedia CIRP 2025, 135, 744–749. [Google Scholar] [CrossRef]
  57. Fagerström, A.; Abdelaziz, O.; Poulikidou, S.; Lewrén, A.; Hulteberg, C.; Wallberg, O.; Rydberg, T. Economic and environmental potential of large-scale renewable synthetic jet fuel production through integration into a biomass CHP Plant in Sweden. Energies 2022, 15, 1114. [Google Scholar] [CrossRef]
  58. Davoudi, S.; Khalili-Garakani, A.; Kashefi, K. Power-to-X for renewable-based hybrid energy systems. In Whole Energy Systems: Bridging the Gap via Vector-Coupling Technologies; Springer: Berlin/Heidelberg, Germany, 2022; pp. 23–40. [Google Scholar]
  59. Gavril, J. E-Fuels’ Worldwide Production Potential. Master’s Thesis, Technische Universität Wien, Vienna, Austria, 2023. [Google Scholar]
  60. Fasihi, M.; Efimova, O.; Breyer, C. Techno-economic assessment of CO2 direct air capture plants. J. Clean. Prod. 2019, 224, 957–980. [Google Scholar] [CrossRef]
  61. Nilsson, M. ADVANCING CARBON NEUTRALITY: Techno-Economic Analysis of Direct Air Capture at Commercial Scale. Master’s Thesis, Mälardalens University, Västerås, Sweden, 2024; p. 52. Available online: http://www.diva-portal.org/smash/record.jsf?pid=diva2%3A1879970 (accessed on 15 August 2025).
  62. Ueckerdt, F.; Bauer, C.; Dirnaichner, A.; Everall, J.; Sacchi, R.; Luderer, G. Potential and risks of hydrogen-based e-fuels in climate change mitigation. Nat. Clim. Change 2021, 11, 384–393. [Google Scholar] [CrossRef]
  63. Qasem, N.A.; Mourad, A.; Abderrahmane, A.; Said, Z.; Younis, O.; Guedri, K.; Kolsi, L. A recent review of aviation fuels and sustainable aviation fuels. J. Therm. Anal. Calorim. 2024, 149, 4287–4312. [Google Scholar] [CrossRef]
  64. Redda, Z.T.; Manyazewal, D.E.; Gizaw, D.G.; Laß-Seyoum, A.; Periyasamy, S. Biomass Conversion to Synthetic Aviation Fuels. In Agricultural Waste to Value-Added Products: Bioproducts and Its Applications; Springer: Berlin/Heidelberg, Germany, 2024; pp. 183–205. [Google Scholar]
  65. Barbosa, F.C. Power to Liquid (PtL) Synthetic Aviation Fuel—A Sustainable Pathway for Jet Fuel Production; SAE Technical Paper; Society of Automotive Engineers (SAE): Warrendale, PA, USA, 2022. [Google Scholar]
  66. Brynolf, S.; Taljegard, M.; Grahn, M.; Hansson, J. Electrofuels for the transport sector: A review of production costs. Renew. Sustain. Energy Rev. 2018, 81, 1887–1905. [Google Scholar] [CrossRef]
  67. Raj Shah, D.V.M. Recent Advances in the Development and Scalability of Sustainable Aviation Fuels. PIN MONTH/MONTH 2025, Pages 8–11. Available online: https://www.petro-online.com/article/analytical-instrumentation/11/koehler-instrument-company/recent-advances-in-the-development-and-scalability-of-sustainable-aviation-fuels/3593 (accessed on 15 August 2025).
  68. Kroef, A. Towards Neto-Zero Skies: Identifying and Overcoming Barriers to SAF Adoption in Dutch Military and Commercial Aviation; University of Twente: Enschede, The Netherlands, 2024. [Google Scholar]
  69. Rosales Calderon, O.; Tao, L.; Abdullah, Z.; Moriarty, K.; Smolinski, S.; Milbrandt, A.; Talmadge, M.; Bhatt, A.; Zhang, Y.; Ravi, V. Sustainable Aviation Fuel (SAF) State-of-Industry Report: State of SAF Production Process; National Renewable Energy Laboratory (NREL): Golden, CO, USA, 2024.
  70. Gan, K.E.; Taikan, O.; Gan, T.Y.; Weis, T.; Yamazaki, D.; Schüttrumpf, H. Enhancing renewable energy systems, contributing to Sustainable Development Goals of United Nation and building resilience against climate change impacts. Energy Technol. 2023, 11, 2300275. [Google Scholar] [CrossRef]
  71. Zschocke, A.; Quante, G.; Bullerdiek, N.; Pechstein, J. Blending of Aviation Powerfuels. In Powerfuels: Status and Prospects; Springer: Berlin/Heidelberg, Germany, 2024; pp. 791–818. [Google Scholar]
  72. Task, I.B. Progress in Commercialization of Biojet/Sustainable Aviation Fuels (SAF): Technologies and Policies; IEA Bioenergy: Paris, France, 2024. [Google Scholar]
  73. Yoo, E.; Lee, U.; Wang, M. Life-cycle greenhouse gas emissions of sustainable aviation fuel through a net-zero carbon biofuel plant design. ACS Sustain. Chem. Eng. 2022, 10, 8725–8732. [Google Scholar] [CrossRef]
  74. Kurzawska-Pietrowicz, P. Life cycle emission of selected sustainable aviation fuels—A review. Transp. Res. Procedia 2023, 75, 77–85. [Google Scholar] [CrossRef]
  75. Chen, S. Sustainable Aviation and Transportation Fuels. In Sustainable Oil and Gas Using Blockchain; Springer: Berlin/Heidelberg, Germany, 2023; pp. 203–219. [Google Scholar]
  76. Walker III, T.K.; Tatsutani, M.; Lewis, J. Decarbonizing Aviation: Enabling Technologies for a Net-Zero Future; Clean Air Task Force: Washington, DC, USA, 2024. [Google Scholar]
  77. Dieterich, V.; Buttler, A.; Hanel, A.; Spliethoff, H.; Fendt, S. Power-to-liquid via synthesis of methanol, DME or Fischer–Tropsch-fuels: A review. Energy Environ. Sci. 2020, 13, 3207–3252. [Google Scholar] [CrossRef]
  78. Dell’Aversano, S.; Villante, C.; Gallucci, K.; Vanga, G.; Di Giuliano, A. E-fuels: A comprehensive review of the most promising technological alternatives towards an energy transition. Energies 2024, 17, 3995. [Google Scholar] [CrossRef]
  79. Aigner, M. E-fuels for the Energy Transition in the Transport Sector–Properties and Application: Current State of Research. In Proceedings of the 13th International Colloquium Fuels: Conventional and Future Energy for Automobiles, Stuttgart, Germany, 15–16 September 2021. [Google Scholar]
  80. Asia-Pacific (APAC). Low Carbon Fuels and CCUS Summit White Paper. 2025. Available online: https://www.lcfccussummit.com/whitepaper-apac-low-carbon-solutions (accessed on 15 August 2025).
  81. Rony, M.A.; Rangon, M.T.; Uddin, M.N. A Review on the Production of Sustainable Aviation Fuels from Biomass and Wastes using Pyrolysis Technologies: Part I. Johns. Matthey Technol. Rev. 2025, 69, 536–545. [Google Scholar] [CrossRef]
  82. Seymour, K.; Held, M.; Stolz, B.; Georges, G.; Boulouchos, K. Future costs of power-to-liquid sustainable aviation fuels produced from hybrid solar PV-wind plants in Europe. Sustain. Energy Fuels 2024, 8, 811–825. [Google Scholar] [CrossRef]
  83. Arnold, M.M.; Taylor, T.G.; Becker, K.M.; Lant, C.L. Newspaper discourses shore up an unviable energy technology: Algae biofuels in the United States. Energy Res. Soc. Sci. 2024, 114, 103594. [Google Scholar] [CrossRef]
  84. Borrill, E.; Koh, S.L.; Yuan, R. Review of technological developments and LCA applications on biobased SAF conversion processes. Front. Fuels 2024, 2, 1397962. [Google Scholar] [CrossRef]
  85. Davis, C.D.; Sreekumar, S.; Altman, R.; Clarens, A.F.; Lambert, J.H.; Colosi, L.M. Geospatially explicit technoeconomic assessment of sustainable aviation fuel production: A regional case study in Virginia. Fuel Commun. 2024, 19, 100114. [Google Scholar] [CrossRef]
  86. Greene, J.M.; Quiroz, D.; Limb, B.J.; Quinn, J.C. Geographically-resolved techno-economic and life cycle assessment comparing microalgae-based renewable diesel and sustainable aviation fuel in the United States. Environ. Sci. Technol. 2025, 59, 3472–3483. [Google Scholar] [CrossRef]
  87. Limb, B.J.; Smith, J.P.; Simske, S.; Quinn, J.C. Addressing the Sustainable Aviation Fuel Grand Challenge: Economic and Environmental Insights from Feedstock Optimization. Environ. Sci. Technol. 2025, 59, 18628–18640. [Google Scholar] [CrossRef]
  88. Klenner, J.; Muri, H.; Strømman, A.H. Domestic and international aviation emission inventories for the UNFCCC parties. Environ. Res. Lett. 2024, 19, 054019. [Google Scholar] [CrossRef]
  89. Rodrigues, A.J.; Fernandes, T.; Gírio, F.; Vreugdenhil, B.; Watanabe, M.; Güell, B.M.; Janssen, R.; Christus, M. Systemic Constraints in the Entire Value Chains: GAP Analysis. International Cooperation for Sustainable Aviation Biofuels. Ref. Ares(2025)535980—23/01/2025. Available online: https://www.icarus-biojet.eu/events-news/project-spotlights (accessed on 15 August 2025).
  90. Xu, Y.; Zhang, Y.; Deng, X.; Lee, S.-Y.; Wang, K. Developing sustainable aviation fuel to deepen south Australia’s green economy: A BERTopic-enhanced SWOT analysis. Case Stud. Transp. Policy 2025, 21, 101562. [Google Scholar] [CrossRef]
  91. Dossow, M.; Shadravan, V.; Naim, W.; Fendt, S.; Harris, D.; Spliethoff, H. Potentials of Sustainable Aviation Fuel Production from Biomass and Waste: How Australia’s Sugar Industry Can Become a Successful Global Example. Biomass 2025, 5, 21. [Google Scholar] [CrossRef]
  92. Dissanayaka, M.; Ryley, T.; Spasojevic, B.; Caldera, S. Developing airport management practices towards net zero emissions: Experiences from the Australian aviation industry. Heliyon 2025, 11, e41201. [Google Scholar] [CrossRef]
  93. Rony, M.A.; Rangon, M.T.; Uddin, M.N. A Review on the Production of Sustainable Aviation Fuels from Biomass and Wastes using Pyrolysis Technologies: Part II. Johns. Matthey Technol. Rev. 2025, 69, 546–556. [Google Scholar] [CrossRef]
  94. O’Sullivan, C.; Mishra, A.; Mueller, S.; Nadeem, H.; Flentje, W. Opportunities and Priorities for a Low Carbon Liquid Fuel Industry in Australia; Australia’s National Science Agency: Canberra, Australia, 2025. [Google Scholar]
  95. Wang, F.; Swinbourn, R.; Li, C.e. Shipping Australian sunshine: Liquid renewable green fuel export. Int. J. Hydrogen Energy 2023, 48, 14763–14784. [Google Scholar] [CrossRef]
  96. Sanders, M.; O’Brien, G.; de Morton, S.; Byers, D. A roadmap for carbon capture and storage deployment in Australia: Key constraints and opportunities. Aust. Energy Prod. J. 2025, 65, EP24210. [Google Scholar] [CrossRef]
  97. HAMR Energy. 2025. Available online: https://www.hamrenergy.com/news/hamr-energy-announces-plans-for-australias-first-major-methanol-to-jet-fuel-production-facility (accessed on 28 July 2025).
  98. Hochman, G.; Appasamy, V. The case for carbon capture and storage technologies. Environments 2024, 11, 52. [Google Scholar] [CrossRef]
  99. Sen, R.; Mukherjee, S. Recent advances in microalgal carbon capture and utilization (bio-CCU) process vis-à-vis conventional carbon capture and storage (CCS) technologies. Crit. Rev. Environ. Sci. Technol. 2024, 54, 1777–1802. [Google Scholar] [CrossRef]
  100. Nyholm, F.; Toppinen, S.; Saxén, H. Sustainable power-to-liquids aviation fuels: Modelling and comparison of two Fischer-Tropsch upgrading process concepts. Energy Convers. Manag. 2025, 342, 120153. [Google Scholar] [CrossRef]
  101. Boehm, R.C.; Yang, Z.; Bell, D.C.; Faulhaber, C.; Mayhew, E.; Bauder, U.; Eckel, G.; Heyne, J.S. Perspective on Fuel Property Blending Rules for Design and Qualification of Aviation Fuels: A Review. Energy Fuels 2024, 38, 17128–17145. [Google Scholar] [CrossRef]
  102. Ranpati Dewage, A. Sustainable Approach for Future Aviation: Sustainable Aviation Fuel Partnerships and Fleet Modernization. Bachelor’s Thesis, LAB University of Applied Sciences, Lahti, Finland, 2025. [Google Scholar]
  103. Detsios, N.; Maragoudaki, L.; Rebecchi, S.; Quataert, K.; De Winter, K.; Stathopoulos, V.; Orfanoudakis, N.G.; Grammelis, P.; Atsonios, K. Techno-economic evaluation of jet fuel production via an alternative gasification-driven biomass-to-liquid pathway and benchmarking with the state-of-the-art Fischer–Tropsch and alcohol-to-Jet concepts. Energies 2024, 17, 1685. [Google Scholar] [CrossRef]
  104. Swinbourn, R.; Li, C.; Wang, F. A comprehensive review on biomethane production from biogas separation and its techno-economic assessments. ChemSusChem 2024, 17, e202400779. [Google Scholar] [CrossRef]
  105. Uddin, M.M.; Lee, U.; Xu, H.; Li, Y.; Kwon, H.; Zhang, Y.; Smolinski, S.; Cai, H.; Tao, L. Sustainable aviation fuel from ethanol: Techno-economic analysis and life cycle analysis. Appl. Energy 2025, 398, 126373. [Google Scholar] [CrossRef]
  106. Anderson, C.; Anderson, M.; Lackens, S. Assessing the Prospects for Minnesota-Produced Sustainable Aviation Fuel; Minnesota Department of Commerce: Saint Paul, MN, USA, 2025.
  107. Nasr, N.M.Y. Sustainable Design and Analysis for Gasoline Produced from GTL and MTG Processes: Process Simulation, Techno-Economic, and Environment Assessment; Qatar University Digital Hub: Doha, Qatar, 2023. [Google Scholar]
  108. Tony, Harrington. Surge in New Projects Announced by Asia-Pacific Airlines on SAF Production in the Region, 5 April 2023. Available online: https://www.greenairnews.com/?p=4178 (accessed on 15 August 2025).
  109. Rosales Calderon, O.; Tao, L.; Abdullah, Z.; Talmadge, M.; Milbrandt, A.; Smolinski, S.; Moriarty, K.; Bhatt, A.; Zhang, Y.; Ravi, V. Sustainable Aviation Fuel State-of-Industry Report: Hydroprocessed Esters and Fatty Acids Pathway; National Renewable Energy Laboratory (NREL): Golden, CO, USA, 2024.
  110. de Jong, S.; Antonissen, K.; Hoefnagels, R.; Lonza, L.; Wang, M.; Faaij, A.; Junginger, M. Life-cycle analysis of greenhouse gas emissions from renewable jet fuel production. Biotechnol. Biofuels 2017, 10, 64. [Google Scholar] [CrossRef] [PubMed]
  111. Han, G.B.; Jang, J.H.; Ahn, M.H.; Jung, B.H. Recent Application of Bio-Alcohol: Bio-Jet Fuel; IntechOpen: London, UK, 2019; Volume 1. [Google Scholar]
  112. Romero-Izquierdo, A.G.; Gómez-Castro, F.I.; Gutierrez-Antonio, C.; Hernández, S.; Errico, M. Intensification of the alcohol-to-jet process to produce renewable aviation fuel. Chem. Eng. Process. Process Intensif. 2021, 160, 108270. [Google Scholar] [CrossRef]
  113. Habermeyer, F.; Weyand, J.; Maier, S.; Kurkela, E.; Dietrich, R.-U. Power Biomass to Liquid—An option for Europe’s sustainable and independent aviation fuel production. Biomass Convers. Biorefinery 2024, 14, 16199–16217. [Google Scholar] [CrossRef]
  114. Neves, R.C.; Klein, B.C.; da Silva, R.J.; Rezende, M.C.A.F.; Funke, A.; Olivarez-Gómez, E.; Bonomi, A.; Maciel-Filho, R. A vision on biomass-to-liquids (BTL) thermochemical routes in integrated sugarcane biorefineries for biojet fuel production. Renew. Sustain. Energy Rev. 2020, 119, 109607. [Google Scholar] [CrossRef]
  115. Rojas-Michaga, M.F.; Michailos, S.; Cardozo, E.; Akram, M.; Hughes, K.J.; Ingham, D.; Pourkashanian, M. Sustainable aviation fuel (SAF) production through power-to-liquid (PtL): A combined techno-economic and life cycle assessment. Energy Convers. Manag. 2023, 292, 117427. [Google Scholar] [CrossRef]
  116. Tanzil, A.H.; Brandt, K.; Zhang, X.; Wolcott, M.; Stockle, C.; Garcia-Perez, M. Production of sustainable aviation fuels in petroleum refineries: Evaluation of new bio-refinery concepts. Front. Energy Res. 2021, 9, 735661. [Google Scholar] [CrossRef]
  117. Ali, S.A.; Bangash, I.A.; Sajjad, H.; Karim, M.A.; Ahmad, F.; Ahmad, M.; Habib, K.; Nasir Shah, S.; Sami, A.; Laghari, Z.A. Review on the Role of Electrofuels in Decarbonizing Hard-to-Abate Transportation Sectors: Advances, Challenges, and Future Directions. Energy Fuels 2025, 39, 5051–5098. [Google Scholar] [CrossRef]
  118. Izurieta, E.M.; Cañete, B.; Pedernera, M.N.; Lopez, E. Conceptual design, process simulation and economic evaluation for the production of synthetic fuels in Argentina. Chem. Eng. Res. Des. 2025, 214, 377–389. [Google Scholar] [CrossRef]
  119. Doğan, A.; Yüksel, G.; Uğur, A.; Boy, M.; Kayabaşı, E.; Demirsöz, R. Synthetic Fuels as a Cornerstone of Net-Zero Emissions: A Review of Production Methods and Future Prospects. DCE Doğa Bilim. Derg. DCE Doğa Bilim. Derg. 2025, 5, 113–131. [Google Scholar]
  120. Bardon, P.; Massol, O. Decarbonizing aviation with sustainable aviation fuels: Myths and realities of the roadmaps to net zero by 2050. Renew. Sustain. Energy Rev. 2025, 211, 115279. [Google Scholar] [CrossRef]
  121. Wandelt, S.; Zhang, Y.; Sun, X. Sustainable aviation fuels: A meta-review of surveys and key challenges. J. Air Transp. Res. Soc. 2025, 4, 100056. [Google Scholar] [CrossRef]
  122. İlhan, C.; Şahin, A.E. Evaluation of the EU Aviation Sector’s Progress Towards Net-Zero CO2 Emission by 2050. Süleyman Demirel Üniversitesi Vizyoner Derg. 2025, 16, 261–277. [Google Scholar] [CrossRef]
  123. Joshi, J.; Shen, Q.; Garg, S.; Bhatelia, T.; Sun, B. Techno-economic and Carbon Intensity Analysis of CO2-derived Sustainable Aviation Fuel. Res. Sq. 2024, preprint. [Google Scholar]
  124. Saad, D.M.; Terlouw, T.; Sacchi, R.; Bauer, C. Life cycle economic and environmental assessment of producing synthetic jet fuel using CO2/biomass feedstocks. Environ. Sci. Technol. 2024, 58, 9158–9174. [Google Scholar] [CrossRef]
  125. Prakash, R. The Role of Aviation in Economic in Developemnt. Ph.D. Thesis, Dublin Business School, Dublin, Ireland, 2024. [Google Scholar]
  126. Wang, F.; Rijal, D. Sustainable aviation fuels for clean skies: Exploring the potential and perspectives of strained hydrocarbons. Energy Fuels 2024, 38, 4904–4920. [Google Scholar] [CrossRef]
  127. Boilley, J.; Berrady, A.; Shahrel, H.B.; Gürbüz, E.; Gallucci, F. Energy analysis of a power-to-jet-fuel plant. Int. J. Hydrogen Energy 2024, 58, 1160–1176. [Google Scholar] [CrossRef]
  128. Almena, A.; Siu, R.; Chong, K.; Thornley, P.; Röder, M. Reducing the environmental impact of international aviation through sustainable aviation fuel with integrated carbon capture and storage. Energy Convers. Manag. 2024, 303, 118186. [Google Scholar] [CrossRef]
  129. Tian, G.; Zhang, C.; Wei, F. Fueling the future: Innovating the path to carbon-neutral skies with CO2-to-aviation fuel. Carbon Future 2024, 1, 9200010. [Google Scholar] [CrossRef]
  130. Watson, M.J.; Machado, P.G.; Da Silva, A.; Saltar, Y.; Ribeiro, C.; Nascimento, C.A.O.d.; Dowling, A.W. Sustainable aviation fuel technologies, costs, emissions, policies, and markets: A critical review. J. Clean. Prod. 2024, 449, 141472. [Google Scholar] [CrossRef]
  131. Ozkan, M.; Narappa, A.B.; Namboodiri, T.; Chai, Y.; Babu, M.; Jennings, J.S.; Gao, Y.; Tasneem, S.; Lam, J.; Talluri, K.R. Forging a sustainable sky: Unveiling the pillars of aviation e-fuel production for carbon emission circularity. IScience 2024, 27, 109154. [Google Scholar] [CrossRef]
  132. Olumoh, F.A. Converting Carbon Dioxide into Synthetic Aviation Fuels: A Techno-Economic Assessment; Carleton University: Ottawa, ON, Canada, 2024. [Google Scholar]
  133. Bernardi, A.; Casan, D.B.; Symes, A.; Chachuat, B. Enviro-economic assessment of sustainable aviation fuel production from direct CO2 hydrogenation. In Computer Aided Chemical Engineering; Elsevier: Amsterdam, The Netherlands, 2023; Volume 52, pp. 2345–2350. [Google Scholar]
  134. Habermeyer, F.; Papantoni, V.; Brand-Daniels, U.; Dietrich, R.-U. Sustainable aviation fuel from forestry residue and hydrogen–a techno-economic and environmental analysis for an immediate deployment of the PBtL process in Europe. Sustain. Energy Fuels 2023, 7, 4229–4246. [Google Scholar] [CrossRef]
  135. Sollai, S.; Porcu, A.; Tola, V.; Ferrara, F.; Pettinau, A. Renewable methanol production from green hydrogen and captured CO2: A techno-economic assessment. J. CO2 Util. 2023, 68, 102345. [Google Scholar] [CrossRef]
  136. Tregambi, C.; Bareschino, P.; Hanak, D.P.; Mancusi, E.; Montagnaro, F.; Pepe, F. Techno-economic assessment of a synthetic methane production process by hydrogenation of carbon dioxide from direct air capture. Int. J. Hydrogen Energy 2023, 48, 37594–37606. [Google Scholar] [CrossRef]
  137. Ravi, S.S.; Mazumder, J.; Sun, J.; Brace, C.; Turner, J.W. Techno-Economic assessment of synthetic E-Fuels derived from atmospheric CO2 and green hydrogen. Energy Convers. Manag. 2023, 291, 117271. [Google Scholar] [CrossRef]
  138. Delgado, H.E.; Cappello, V.; Zang, G.; Sun, P.; Ng, C.; Vyawahare, P.; Elgowainy, A.A.; Wendt, D.S.; Boardman, R.D.; Marcinkoski, J. Techno-economic analysis and life cycle analysis of e-fuel production using nuclear energy. J. CO2 Util. 2023, 72, 102481. [Google Scholar] [CrossRef]
  139. Colelli, L.; Segneri, V.; Bassano, C.; Vilardi, G. E-fuels, technical and economic analysis of the production of synthetic kerosene precursor as sustainable aviation fuel. Energy Convers. Manag. 2023, 288, 117165. [Google Scholar] [CrossRef]
  140. Raab, M.; Dietrich, R.-U. Techno-economic assessment of different aviation fuel supply pathways including LH2 and LCH4 and the influence of the carbon source. Energy Convers. Manag. 2023, 293, 117483. [Google Scholar] [CrossRef]
  141. Rojas Michaga, M.F. Techno-Economic and Life Cycle Assessment of Jet Fuel Production Through Various Fischer Tropsch Pathways; University of Sheffield: Sheffield, UK, 2023. [Google Scholar]
  142. Cames, M.; Graichen, J.; Kasten, P.; Kühnel, S.; Faber, J.; Nelissen, D.; Shanthi, H.; Scheelhaase, J.; Grimme, W.; Maertens, S. Climate Protection in Aviation and Maritime Transport: Roadmaps for Achieving the Climate Goal; Institute of Air Transport: Montreal, Canada, 2023. [Google Scholar]
  143. Barke, A.; Bley, T.; Thies, C.; Weckenborg, C.; Spengler, T.S. Are sustainable aviation fuels a viable option for decarbonizing air transport in Europe? An environmental and economic sustainability assessment. Appl. Sci. 2022, 12, 597. [Google Scholar] [CrossRef]
  144. Agbo, S. Sustainable Aviation Fuels (SAF) Production. Process and Techno-Economic Assessment Modelling of Gas Fermentation with SCWG Heat Integration; University of Nottingham: Nottingham, UK, 2023. [Google Scholar]
  145. Umenweke, G.C.; Pace, R.B.; Santillan-Jimenez, E.; Okolie, J.A. Techno-economic and life-cycle analyses of sustainable aviation fuel production via integrated catalytic deoxygenation and hydrothermal gasification. Chem. Eng. J. 2023, 452, 139215. [Google Scholar] [CrossRef]
  146. Zang, G.; Sun, P.; Elgowainy, A.; Bafana, A.; Wang, M. Life cycle analysis of electrofuels: Fischer–Tropsch fuel production from hydrogen and corn ethanol byproduct CO2. Environ. Sci. Technol. 2021, 55, 3888–3897. [Google Scholar] [CrossRef]
  147. Cames, M.; Chaudry, S.; Göckeler, K.; Kasten, P.; Kurth, S. E-fuels versus DACCS. Total Costs of Electrofuels and Direct Air Capture and Carbon Storage While Taking into Account Direct and Upstream Emissions and Environmental Risks; Öko-Institut e.V.: Berlin, Germany, 2021; Available online: https://www.oeko.de/fileadmin/oekodoc/2021_08_TE_study_efuels_DACCS.pdf (accessed on 15 August 2025).
  148. Hombach, L.E.; Doré, L.; Heidgen, K.; Maas, H.; Wallington, T.J.; Walther, G. Economic and environmental assessment of current (2015) and future (2030) use of E-fuels in light-duty vehicles in Germany. J. Clean. Prod. 2019, 207, 153–162. [Google Scholar] [CrossRef]
  149. Trinh, J. Techno-Economic Assessment for Optimised Renewable Jet Fuel Production in Sweden. Master’s Thesis, KTH, School of Industrial Engineering and Management (ITM), Stockholm, Sweden, 2021; p. 133. Available online: https://urn.kb.se/resolve?urn=urn:nbn:se:kth:diva-300084 (accessed on 15 August 2025).
  150. Salladini, A.; Borgognga, A.; Agostini, E.; Annesini, M.C.; Iaquaniello, G. Power to liquid through waste as a carbon source: A technical and economic assessment. Int. J. Hydrogen Energy 2020, 45, 24467–24476. [Google Scholar] [CrossRef]
  151. Drünert, S.; Neuling, U.; Zitscher, T.; Kaltschmitt, M. Power-to-Liquid fuels for aviation–Processes, resources and supply potential under German conditions. Appl. Energy 2020, 277, 115578. [Google Scholar] [CrossRef]
  152. Romo Martínez, A.C. The Environmental Governance System Around the Implementation of Sustainable Aviation Fuels in Norway: A Case Study on E-Fuels and Carbon Capture and Utilization Value Chain. Master’s Thesis, Norwegian University of Life Sciences, As, Norway, 2021. [Google Scholar]
  153. Detsios, N.; Theodoraki, S.; Maragoudaki, L.; Atsonios, K.; Grammelis, P.; Orfanoudakis, N.G. Recent advances on alternative aviation fuels/pathways: A critical review. Energies 2023, 16, 1904. [Google Scholar] [CrossRef]
  154. Watson, M.; da Silva, A.V.; Machado, P.G.; de Oliveira Ribeiro, C.; do Nascimento, C.A.O.; Dowling, A. The case for bio-jet fuel from bioethanol in brazil: An optimization-based analysis using historical market data. ChemRxiv 2024. preprint. [Google Scholar]
  155. Grim, R.G.; Tao, L.; Abdullah, Z.; Cortright, R.; Oakleaf, B. The Challenge Ahead: A Critical Perspective on Meeting US Growth Targets for Sustainable Aviation Fuel; National Renewable Energy Laboratory (NREL): Golden, CO, USA, 2024.
  156. Tiwari, S.; Patrizio, P.; Leduc, S.; Stratton, A.; Kraxner, F. Fuel from air: A techno-economic assessment of e-fuels for low-carbon aviation in China. Energy Convers. Manag. 2025, 333, 119796. [Google Scholar] [CrossRef]
  157. Deuber, R.d.S.; Bressanin, J.M.; Fernandes, D.S.; Guimarães, H.R.; Chagas, M.F.; Bonomi, A.; Fregolente, L.V.; Watanabe, M.D.B. Production of sustainable aviation fuels from lignocellulosic residues in Brazil through hydrothermal liquefaction: Techno-economic and environmental assessments. Energies 2023, 16, 2723. [Google Scholar] [CrossRef]
  158. D’Ascenzo, F.; Vinci, G.; Savastano, M.; Amici, A.; Ruggeri, M. Comparative life cycle assessment of sustainable aviation fuel production from different biomasses. Sustainability 2024, 16, 6875. [Google Scholar] [CrossRef]
  159. Shehab, M.; Moshammer, K.; Franke, M.; Zondervan, E. Analysis of the potential of meeting the EU’s sustainable aviation fuel targets in 2030 and 2050. Sustainability 2023, 15, 9266. [Google Scholar] [CrossRef]
  160. Ng, K.S.; Farooq, D.; Yang, A. Global biorenewable development strategies for sustainable aviation fuel production. Renew. Sustain. Energy Rev. 2021, 150, 111502. [Google Scholar] [CrossRef]
  161. Sharma, R.O.; Rantala, T.; Hoggan, P.E. Selective hydrogen production at platinum surfaces investigated by the Quantum Monte Carlo approach to chemical reactions. arXiv 2019, arXiv:1908.10782. [Google Scholar] [CrossRef]
  162. Rogachuk, B.E.; Okolie, J.A. Comparative assessment of pyrolysis and Gasification-Fischer Tropsch for sustainable aviation fuel production from waste tires. Energy Convers. Manag. 2024, 302, 118110. [Google Scholar] [CrossRef]
  163. Papantoni, V.; Linke, F.; Dahlmann, K.; Kühlen, M.; Silberhorn, D.; Brand, U.; Vogt, T. Life cycle assessment of power-to-liquid for aviation: A case study of a passenger aircraft. In E3S Web of Conferences; EDP Sciences: Les Ulis, France, 2022. [Google Scholar]
  164. Nguyen, T.T.; Edalati, K. Impact of high-pressure columbite phase of titanium dioxide (TiO2) on catalytic photoconversion of plastic waste and simultaneous hydrogen (H2) production. J. Alloys Compd. 2024, 1008, 176722. [Google Scholar] [CrossRef]
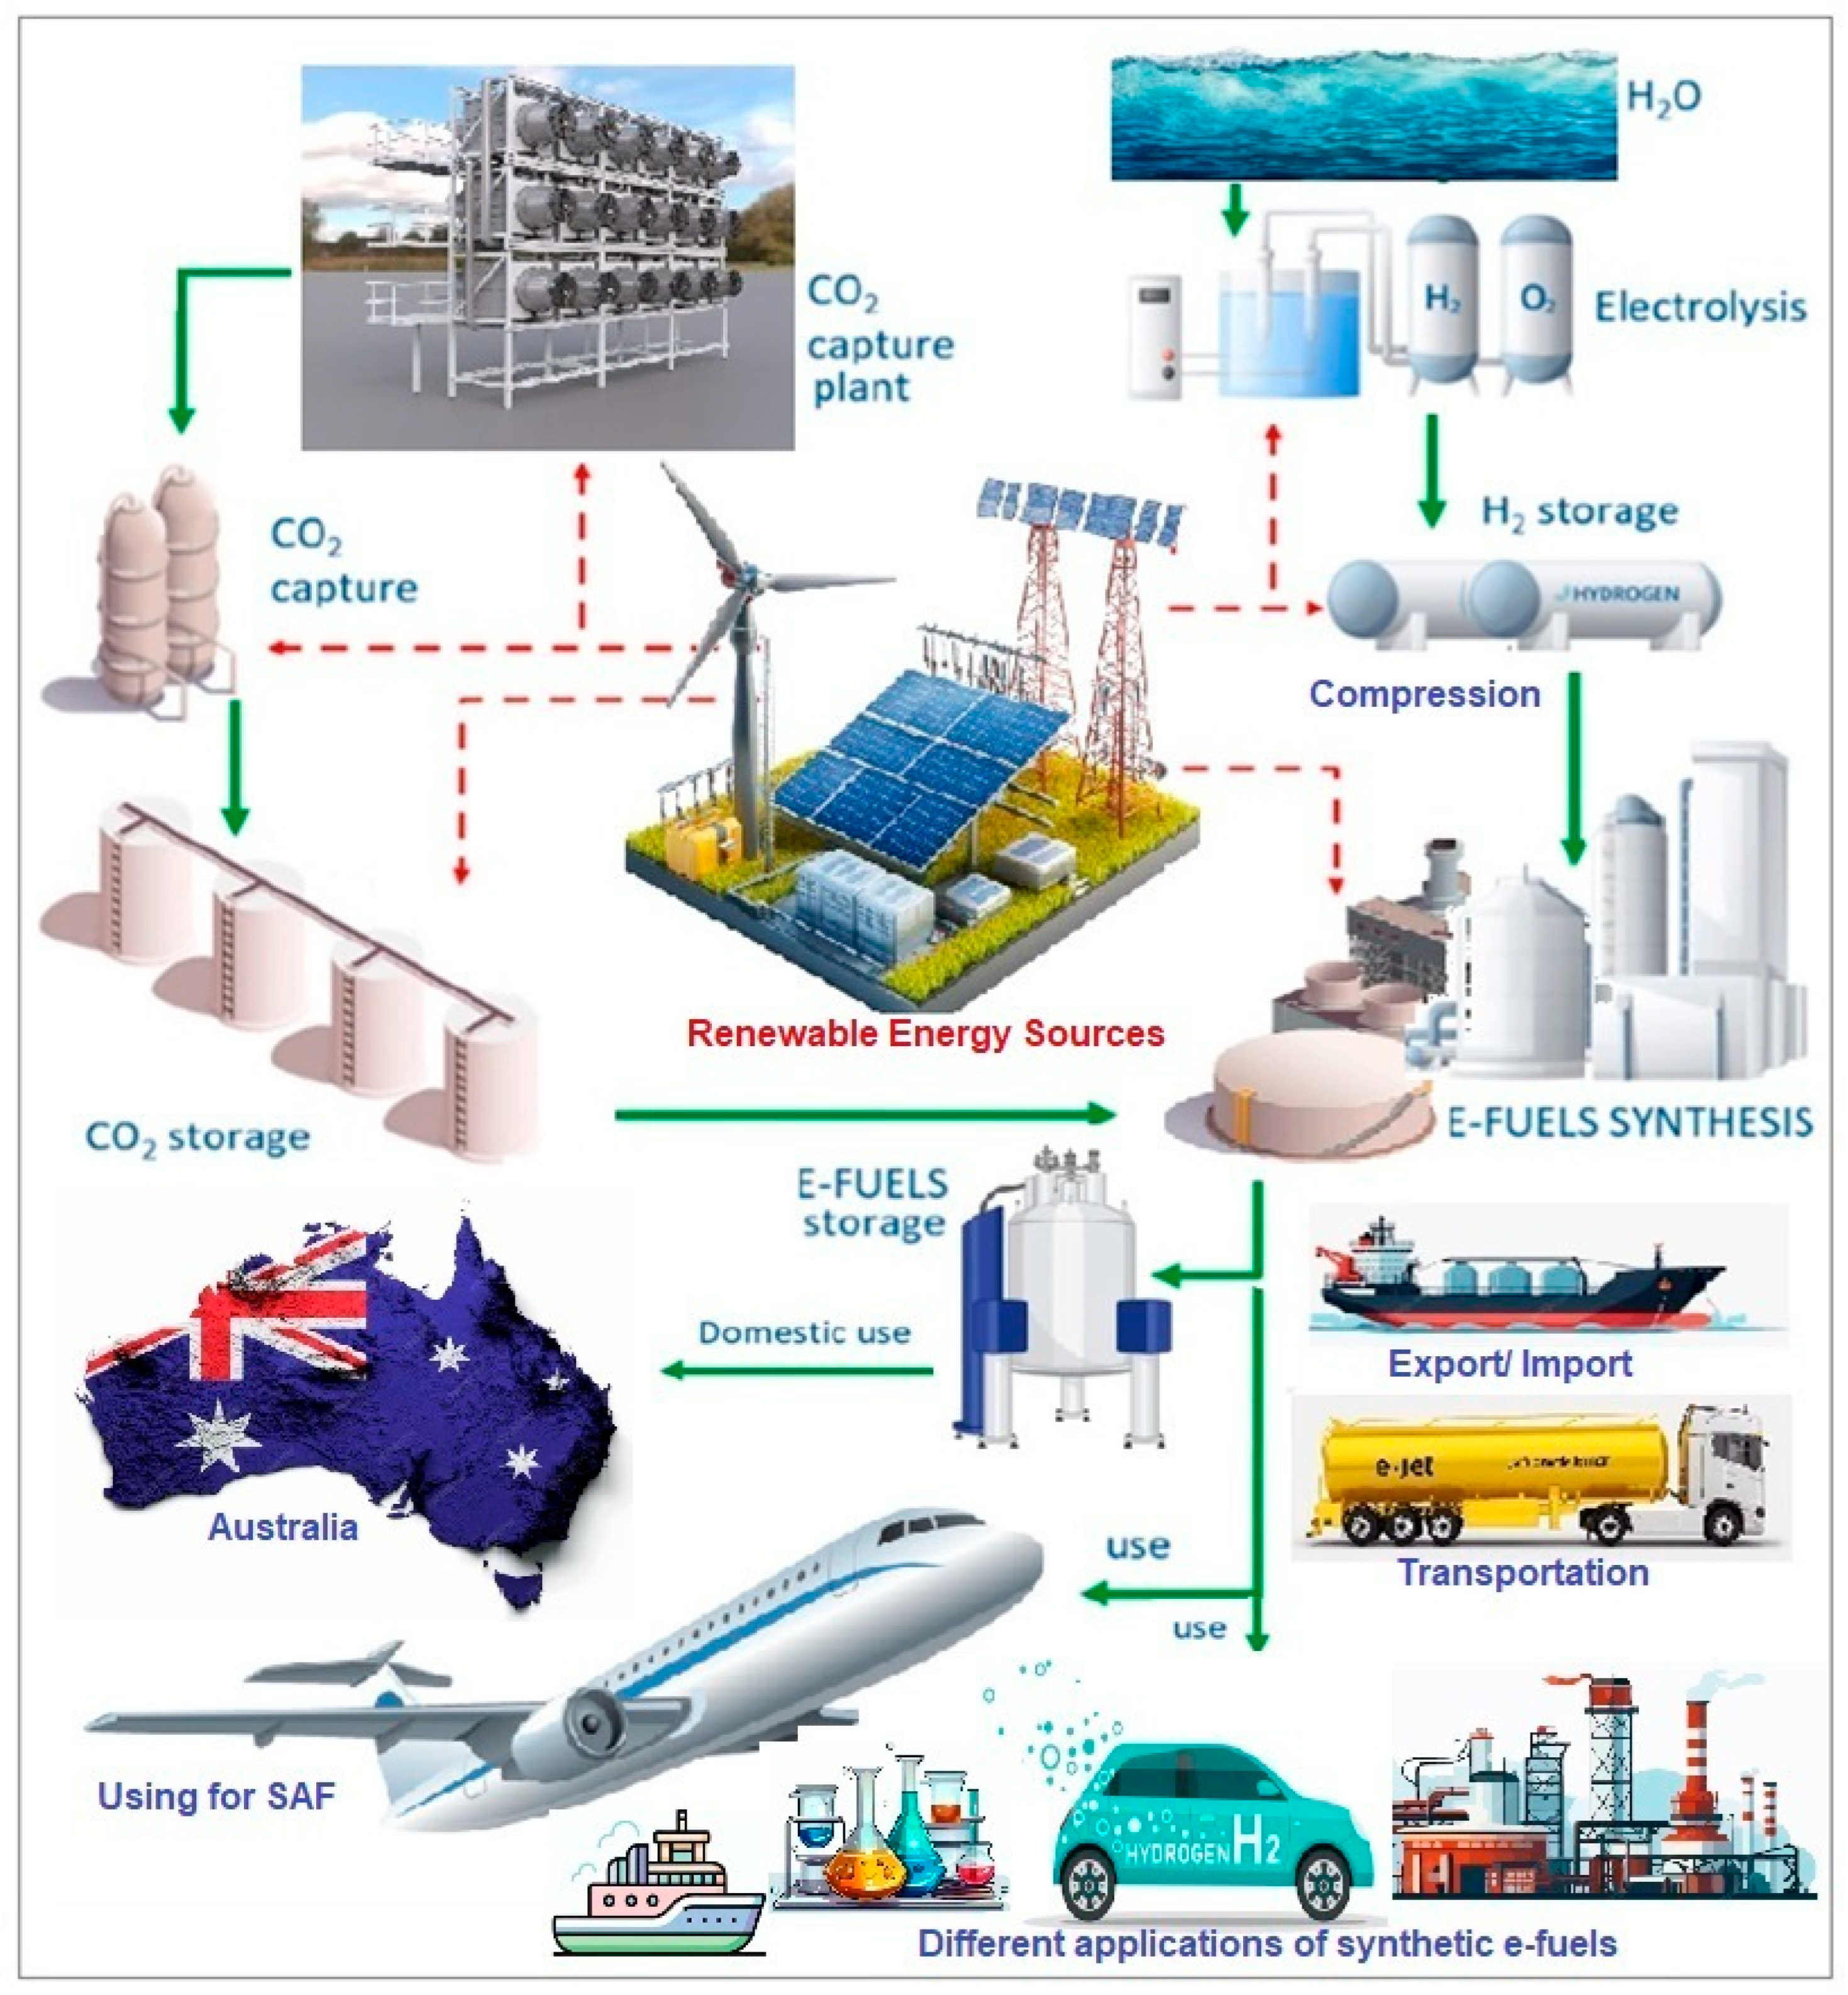
Figure 1. Production process to user end with different applications of synthetic e-fuel.
Energies 18 05510 g001
Figure 2. The 17 United Nations sustainable development goals (UNSDGs), with emphasis on SDG7- Affordable and Clean Energy [70]. Each goal is represented by a unique icon and color in a grid layout. SDG7 is highlighted to underscore its pivotal role in enabling progress across all SDGs.
Energies 18 05510 g002
Figure 3. Distribution of mitigation actions to net-zero in 2050 [29,76]. SAF accounts for 65% of the total, followed by carbon capture (19%), new technologies (13%), and operations (3%).
Energies 18 05510 g003
Figure 5. Projected jet fuel production vs. demand (2025–2050) [94]. The graph illustrates potential jet fuel output from five sources Power-to-Liquid, Residues, Carbohydrates, Waste, and Oilseeds compared to projected demand. Production is expected to exceed demand by 2050, highlighting the scalability of SAF pathways.
Energies 18 05510 g005
Figure 6. Projected levelized cost of production for various fuel sources (2023–2050) [94]. The graph compares cost trends for PtL, ethanol, municipal solid waste, biomass, and vegetable oil, showing a general decline over time relative to the constant current CIF (cost, insurance, and freight) price.
Energies 18 05510 g006
Figure 7. Overview of renewable green fuels (RGFs) and PtL pathways. The diagram outlines the conversion of renewable electricity into green hydrogen and its transformation into various liquid fuels, highlighting production processes, transport modes, and industrial applications.
Energies 18 05510 g007
Figure 8. Pathways for SAF and RD Production through biochemical and thermochemical routes.
Energies 18 05510 g008
Figure 9. Technical and economic challenges in SAF production. The diagram outlines key barriers to scaling sustainable aviation fuels, including feedstock variability, conversion inefficiencies, high costs, policy gaps, and market immaturity.
Energies 18 05510 g009
Figure 10. Boundary system of TEA and LCA of PtL SAF production. It illustrates the conversion of solar and wind energy into hydrogen and captured CO2, which are processed via electrolysis and Fischer–Tropsch synthesis into Sustainable Aviation Fuel, followed by distribution and end-use in aviation.
Energies 18 05510 g010
Figure 11. Critical literature review process. The flowchart outlines three key stages Planning, Conducting, and Reporting detailing steps from defining research questions to selecting literature and presenting findings.
Energies 18 05510 g011
Figure 12. Global distribution of a total of 50 related studies. (A) The number of studies by country, with higher values concentrated in China (7%), the United States (6%) and Australia (5%). (B) Studies by regions such as Europe (46%), Asia (15%), North America (14%) and Australia (7%). (C) The overall global pattern the green colors present concentrated studies.
Energies 18 05510 g012
Figure 13. Cost contribution ranges in SAF pathways. The chart compares CAPEX, OPEX, and feedstock cost variability across HEFA, FT, AtJ, and E-Jet production routes. Data is based on Detsios, N., et al. [153].
Energies 18 05510 g013
Table 1. Properties of e-fuels produced from various pathways vs. fossil fuels from conventional productions *.
PropertiesE-FuelsFossil Fuels
FTDFTGMtGFTKMtJ #DMEOMEMCHGasolineDieselKeroseneLPG
Density (kg/m3)765–845720–755720–755730–770730–770gas961–1100792715–780815–855780–810540 (at bar)
Boiling point (°C)85–360210 (FBP) **210 (FBP) **205–300205–300−24.8105–2806522–215170–380151–301−41 to −0.5
LHV (MJ/l)33.1–34.330–3330–33--18.3–19.319.5–19.715.4–15.631.2–32.235.3–3635.324.8
Octane number-Upto 85Upto 85----110–11290–95--105–115
Cetane number70–80----Upto 5563–1105-45–33--
MiscibilityDieselGasolineGasolineJet fuelJet fuelLPGDieselGasoline, Diesel
* Form [77,78,79]. # Methanol to Jet (MtJ) & Final Boiling Point (FBP) **.
Table 2. ASTM-approved SAF pathways *.
PathwayDescriptionFeedstockBlend Limit and (Year)Energy EfficiencyConversion EfficiencyAdvantagesChallengesFRL
TRL
Accreditation
FT Synthetic Paraffinic Kerosene (FT-SPK)Via FT, converting CO and H2 into LCHs.Biomass, coal, natural gas50% (2009)50%40–50%feedstock versatility, potential for large scale productionhigh capital costs, feedstock preprocessing complexity6–7
6–8
ASTM D7566
Annex A1
Fischer-Tropsch Synthetic Kerosene with Aromatics (FT-SPKA)Like FT-SPK but includes synthetic aromatics to improve compatibility.Biomass, coal, natural gas50% (2015)Like FT-SPKLike FT-SPKcompatible with legacy aircraft systems;
contains essential aromatics
still emerging; limited
commercial application
6–7
6–8
ASTM D7566
Annex A4
Hydroprocessed Esters and Fatty Acids (HEFA-SPK)Hydroprocessing technology to convert fats and oils into LCHs.Bio-oil, animal fat, cooking oil, tallow50% (2011)65–70%75–85%high commercial maturity, compatibility
with existing infrastructure, feedstock
flexibility
limited feedstock availability,
land-use concern
9
9
ASTM D7566
Annex A2
Alcohol-to-Jet (ATJ-SPK)Converts alcohols to LCHs through dehydration, oligomerization, hydrogenation.Alcohols like ethanol or isobutanol50% Ethanol (2018); 30% Isobutanol (2016)40–50%40–50%abundant alcohol feedstocks, uses existing infrastructurelow conversion efficiency, high scaling costs7–8
7–8
ASTM D7566
Annex A5
Synthetic Iso-Paraffinic (SIP) Fuel from Hydroprocessed Fermented SugarProduced through biological fermentation of sugars into LCHsFermented sugars (sugarcane, corn, biomass)10% (2014)25–35%20–30%high purity product; low sulfurhigh cost; low yield; limited scale-up5–8
7–9
ASTM D7566
Annex A3
Catalytic Hydrothermolysis Jet (CHJ)Converts lipids directly into SAF through catalytic hydrothermolysisLipid-rich biomass (oilseeds, algae)50% (2020)60%60–70%produces aromatics; drop-in fuel propertiesearly stage technology; limited demonstration6–7
4–6
ASTM D7566
Annex A6
Hydrocarbons, Hydroprocessed Esters, and Fatty Acids SPK (HC HEFA-SPK)Like HEFA but includes additional processing to convert fatty acids to LCHsLipid-rich oils (algae)10% (2020)Like HEFALike HEFALike HEFALike HEFA6
5
ASTM D7566
Annex A7
Co-processed BiomassCo-HEFA in a conventional petroleum refineryVegetable oil, animal fat, used cooking oil5% (2018)Like HEFALike HEFALike HEFALike HEFA6–7
7–8
ASTM D1655
Annex A1
ATJ-SKAATJ derivative with the mixed alcoholsC2–C5 alcohols (Biomass)50% (2023)Like AtJLike AtJLike AtJLike AtJ-
-
ASTM D7566
Annex A8
Co-processed FTFT hydrocarbons in a conventional petroleum refineryco-processed with petroleum5% (2020)Like FTLike FTLike FTLike FT6–7
7–8
ASTM D1655
Annex A1
Co-processed HEFAHEFA hydrocarbons co-processed with petroleumFats, oils, greases (FOG)10% (2018)Like HEFALike HEFALike HEFALike HEFA-
-
ASTM D1655
Annex A1
PtLelectrolysis, CO2 capture, synthesisCO2, water, renewable
electricity
50% (2011)40–55%40–50%ultralow carbon intensity, CO2 recycling,
renewable integration
high costs, energy-intensive,
dependence on renewable sources
6–7
6–8
ASTM D7566
Annex A1
* Information from [13,36].
Table 4. Techno-Economic Analysis (TEA) of e-Fuel Production Pathways *.
AspectComponentDescriptionEstimated Cost RangeImpact on Final CostCurrent BarriersPotential for Cost ReductionProjected Trend (2025–2035)
Renewable ElectricitySource TypePrimary energy input
(Solar, Wind, Hydro); cost varies by location
$30–$80 per MWhHighHigh initial investment, geographic limitationsDecreasing due to technology advances, economies of scaleProjected 30–50% reduction in renewable electricity costs by 2035
CO2 Capture and StorageCapture MethodEssential raw material
(DAC, Point-source); cost depends on technology, CO2 purity
$80–$120 per ton CO2ModerateHigh cost of DAC, energy-intensiveR&D into efficient DAC, adoption of modular capture unitsCost expected to decrease as DAC scales up
Electrolysis for H2Electrolysis TechnologyConverts water to hydrogen; capital- and energy-intensive
(PEM, Alkaline, SOEC)
$3.5–$7 per kg H2HighElectrolyzer cost, electricity intensityImprovements in electrolyzer efficiency, lifetime expansionCost of H2 projected to halve by 2035
Fuel SynthesisCatalyst and Reactor TechCombines H2 and CO2 to form e-fuel; catalyst type and design affect cost/efficiency$2–$5 per kg fuelModerateHigh-cost catalysts, limited reactor scalabilityResearch in catalyst recycling, scalable reactorsHigh-performance catalysts could lower costs by 25%
Total e-Fuel Production CostAggregated CostCombined expenses from each stage to produce 1 kg of e-fuel$5.5–$15 per kg fuelCompetes with fossil fuel prices; high dependency on energy costsSystem optimization, cost-effective scale-upProjected cost parity with fossil fuels by 2035 with sufficient scale-up
Comparison with AlternativesCost competitiveness vs. traditional fuels (fossil fuels, hydrogen, biofuels)$1–$3 per kg fossil fuelsModerateCurrently less competitive without subsidiesPolicy incentives, renewable energy subsidiese-Fuels likely to gain competitiveness in aviation/marine sectors
Sensitivity AnalysisAssesses variable impacts (electricity price, CO2 efficiency, catalyst cost)Varies by factorHighDependence on volatile electricity marketsInvestment in low-cost electricity sources, efficient CO2 captureImproved resilience with stable renewable prices and market evolution
* Information from [68,69,70,71,72,73,74,75,76].
Table 5. Boundary Condition Chart: TEA and LCA for PtL-FT SAF in Australia.
CategoryTEALCA
Goal and ScopeEvaluate the economic feasibility of PtL FT SAF plant in AustraliaAssess cradle-to-grave environmental impact of PtL-FT SAF produced in Australia
System BoundaryGate-to-gate or cradle-to-gate (depending on scope)Cradle-to-grave (electricity generation → CO2 capture → fuel)
Geographical ContextAustralia—focused on renewable-rich regions (e.g., South Australia, Western Australia)Australia—aligned with local grid mix, renewable energy availability, and national emission factors
Time HorizonPlant lifetime, 20–30 years100-year Global Warming Potential
Functional Unit1 L or 1 MJ of SAF1 MJ or 1 passenger-km (depending on study design)
Key Inputs
  • Renewable electricity
  • Water
  • CO2 (from DAC or point sources)
  • Renewable electricity
  • CO2 capture source
  • Catalysts and materials
Key Outputs
  • BAF (drop-in FT fuel)
  • Oxygen (co-product)
  • Economic indicators
  • BAF (with combustion emissions)
  • Co-products (e.g., oxygen, waste heat)
  • Emissions (CO2eq, NOX, etc.)
Energy Source100% renewable (e.g., solar, wind, hybrid wind-PV)100% renewable (e.g., solar, wind-hybrid-PV with storage)
CO2 Source
  • Direct Air Capture (DAC)
  • Biogenic CO2
Not directly considered (except for embodied energy inputs)
Hydrogen ProductionWater electrolysis (PEM or alkaline using renewable electricity)Water electrolysis (renewable electricity only for baseline scenario)
FT Synthesis ConditionsLow-temperature FT (200–240 °C) with iron/cobalt catalyst; product upgradingLow-temperature FT (200–240 °C) with iron/cobalt catalyst; product upgrading included
Capital Cost AssumptionsNot applicableEnergy-based or system expansion for co-products (e.g., oxygen)
End-of-LifeNot includedFuel combustion included (CO2 counted as biogenic if captured via DAC/biogenic sources)
Environmental Impact Categories
  • Levelized Cost of Fuel
  • Net Present Value (NPV)
  • Payback Period
  • CO2 capture energy use
  • Electricity carbon intensity
  • Allocation method
Allocation MethodNot applicableEnergy-based or system expansion for co-products (e.g., oxygen)
Uncertainty/Sensitivity
  • Electricity price
  • Electrolyzer efficiency/lifetime
Not applicable
Table 6. Literature search strings during January 2023–June 2025 *.
DateSubjectSearch StringsFilter
January 2023–June 2025 (Web of Science, Scopus, Google Scholar, PubMed)TEA“TEA” OR “techno-economic analysis” OR “techno-economic assessment” OR “techno-economic viability” OR “techno-economic assessment” OR “economic viability” OR “economical assessment” OR “economic analysis” OR “technical” OR “technologies”.Article title, Abstract, Keywords, Topic
LCA“LCA” OR “life cycle analysis” OR “life cycle assessment” OR “life cycle viability” OR “environmental viability” OR “environmental assessment” OR “environmental analysis” OR “environmental impact” OR “environmental fact” OR “Sustainability”.
SAF“SAF” OR “Synthetic fuel” OR “Sustainable aviation fuel” OR “E-Fuel” OR “Electro-Fuel” OR “Syn Fuel”.
PtL“PtL” OR “Power to liquid” OR “PtL based Fuel”.
FT“FT” OR “Fischer-Tropsch” OR “FT-SPK”.
“English”Limit to
* Search from Web of Science, Scopus, Google Scholar, and PubMed for information in article title, abstract, keywords, and topic.
Table 7. Summary of the findings of the previous research on the technoeconomic and life cycle analysis of E-fuel production.
Country, yr. and Refs.MethodParameterHighlightResultOthersLimitation
KSA, 2025 [13]SAF: FT, AtJ, PtL, HEFA, CHJ, DSHCTEA: Efficiency, Cost LCA: Carbon emissionGHG emission by 26–93% compared to fossil jet fuel.MJSP ranging from 0.39 to 11 USD/L.FT SAF for long-term sustainability.lack of production
facilities
Malaysia, 2025 [117]E-fuel: Electrolysis, CCSTEA: Efficiency, Cost LCA: Carbon emissionAchieved 20% efficiency and 30–40% cost reductions.70–90% carbon reduction vs. fossil fuel.TEA requires costs below $3/kg.Need for scalable e-fuel technologies.
Argentina, 2025 [118]E-fuel: Electrolysis, CCU, FT, DACTEA: Capex, Opex and the profitability analysis.Used 0.8 kgH2 and 3.1 kgCO2 /kg kerosene.Achieved a kerosene yield of ~75 %.NPV, IRR, Payback Period highlighted.Sensitive to H2 costs and kerosene prices.
Turkey, 2025 [119]E-fuel: Electrolysis, CCU, CCSTEA: Technical feasibilitysynthetic hydrocarbons and SNG are more compatible.Green H2 presents the high decarbonization.TEA is qualitative.Lack of large-scale demonstration
USA, 2025 [120]E-SAFs: CO2-based e-fuels.TEA: Capex, Opex
LCA: GWP
The potential of e-fuels to achieve net-zero emissions.Capex, Opex for SAFs are higher than CJFs.U.S. federal investments in SAF.Uncertainty policy interventions
India, 2025 [121]SAF: Renewable sourcesLCA: GWP, technologiesVital role in strengthening the circular bioeconomy.SAF can decarbonizing the aviation sector.sustainability assessment of SAF.2nd and 3rd-gen biomass feedstocks
China, 2024 [36]SAF: TechnologiesTEA: economic viability.
LCA: emissions, resource usage
Evaluates sustainable aviation fuel technologies and their readiness levels.Significantly reduce emissions compared to conventional jet fuelsRecommendations for sustainable SAF industry developmentCrucial for sustainable development
Turkey, 2024 [122]SAF: technological advancements in fuel productionEvaluation: energy densities and footprintsPresents critical data on the aviation industry’s energy consumption, which reached 12.1 MJ/RTK in 2022.With projections indicating a potential increase by 2.8 to 3.9 times by 2040Aviation emissions could reach 2000 megatons by mid-century.Economic incentives for SAF adoption require further exploration.
Poland, CZ, 2024 [39]PtL: AtJ, FTTEA: economic viability.
LCA: carbon emissions.
SAFs can reduce carbon emissions by up to 80%.SAF is currently more expensive than CJF.Substantial energy required for AtJ fuel.Energy density limitations of fuels.
Greece, DK,
2024 [43]
Alternatives fuels: production pathwayLCA: various alternative fuelsVarious fuels assessed for environmental impact.H2 is environmentally benign than other fuels.quantifying carbon emissions, toxicity.Require further exploration of TEA.
Australia, 2024 [123]SAF: Three-step AtJet pathway, FT.TEA: Economic analysis
LCA: Carbon intensity
84.6% renewable power needed for comparable emissions reduction.levelized cost of supply is 14%–25% lower than AtJ of the FT process.Three-step AtJ pathway yields 1.6 times more SAF. Higher capital cost for syngas fermentation.
Australia, 2024 [35]E-Fuel: FT, RWGS, Electrolysis, DACTEA: Capex, Opex
LCA: GWP
Economic viability relies on optimizing production.E-fuels can reduce carbon emissions.Suggests areas for future research Identifies gaps in e-fuel production.
Switzerland2024 [124]SJF: CO2 hydrogenation.LCA: emission, resource usage, cost analysisCO2 hydrogenation to methanol reduces GHG emissions by almost 50%.Production cost is 7.86 EUR kgJF-1, 7 times higher than petroleum.Electricity sources affect cost and emissions.Challenges remain in terms of cost and energy demand.
India, 2024 [125]SAF: PtL, FT.LCA: environmental and costing feasibility.SAF reduce environmental facts with renewable energy.SAF are more costly than fossil kerosene.Production process is energy intensive.Need for more cost-effective SAF.
Australia, 2024 [126]SAF: ML, Quantum mechanicalTEA: cost analysis.
LCA: emissions.
Optimization of potential strained hydrocarbonExploration of strain energy in cycloalkanes.screening of high-performance SAF.Limited widespread H2 usage in aviation.
France, NL 2024 [127]PtL: FT process (Matlab simulation)TEA: energy efficiencyGlobal efficiency linked to H2 production efficiency.Energetic efficiency reaches 48.06%.Aspen Hysys for efficiency estimation.No LCA
UK, 2024 [128]FT-SPK: FT, CCSLCA: well-to-wake and carbon footprintFT-SPK with CCS generates negative carbon flux.Certified blend reduces JF emissions by 37%.FT-SPK limited to 50% blend with CJF.UK cover 0.7% of JF demand.
Spain, 2024 [63]SAF: All pathway based SAFsLCA: CO2 emissions & commitment to climate change mitigation.Aviation sector aims to reduce its impact on climate change.Commercial aviation emitted 915 million tonnes of CO2 in 2019.SAFs are being developed to reduce the carbon emission.Does not provide a TEA and LCA
China, 2024 [129]SAF: Electrolysis, captured CO2Economic viability, and environmental benefits.Analytical review of CO2 to jet fuel conversion methods.High energy demands for carbon recycling.H2 generation from renewable energy.Limited exploration of TEA
USA, Brazil, 2024 [130]SAF: All technologies.TEA: technologies, Cost
LCA: emission, policy
HEFA technology has highest readiness for commercial deployment.SAF production operates at only 3.5% of potential capacity.High production costs, 120% more than fossil fuels.Only 38% of policies offer monetary incentives.
USA, 2024 [131]PtL: FT e-kerosene, electrolysis, DACTEA: production costs, renewable energy expenses.E-kerosene production cost expected to decrease significantly by 2050.SAF production increased from 1.9 M to 15.8 M gallons in 6 yrs.Cost reduction strategies for e-kerosene production.High cost of kerosene produced with DAC.
Canada, 2024 [132]SAF: PtL, FT, DACTEA: costs, resource and emissionsNegative emissions possible with cleaner electricity.Resource and costs vary by provinceProcess highly resource intensive.Requiring significant energy.
UK, 2023 [133]SAF: 1sFT: noble Mn-Fe-K catalyst
2sFT: RWGS, FT
Enviro-economic: LCOP, GWP, environmental impacts1sFT process has 70% and 30% lower externalities cost and GWP compared to 2sFT.MSP of the fuel blend from the 1sFT is 20% lower than the 2sFT.This emphasizes the benefits of adopting the 1sFT method.Lack of TEA
UK, Bolivia, 2023 [115]SAF: PtL, FT, CCU, DAC, Electrolysis.TEA: CAPEX, OPEX
LCA: GWP, Well-to-Wake system.
Carbon conversion of 88%, H2 conversion of 39.16%, PtL efficiency of 25.6%.MJSP: 5.16 £/kg
GWP: 21.43 gCO2eq/MJSAF.
WtWa water footprint is 0.480 l/MJSAF.GWP below UK mandate of 50% emission reduction.
Norway, Sweden, 2023 [134]SAF: PBtL, FT, Electrolysis by Aspen Plus® (V10)TEA: process, cost, mass & energy balances
LCA: sensitivity analysis
EU goal: 32% of total aviation fuel demand by SAF in 2040 can be met.25 Mt a−1 fuel output achievable with direct renewable energy.Only Norway and Sweden suitable as PBtL production.Economic feasibility and environmental impact.
Italy, 2023 [135]E-Fuel: Electrolysis by Aspen+TEA: economic analysis, cost estimation.PtL plant for producing 500 kg/h renewable methanolLCoM calculated to be 960€/t (175€/MWh).LCoM affected by electricity.Not economically competitive.
UAE, Italy, 2023 [136] Syn E-Fuel: DAC, Electrolysis, CCU, Hydrogenation. TEA: TPC, LCCR, LCOM, CAPEX, OPEXCities with uneven solar energy distribution might need high H2 storage tank.LCOM: 4.9–8.2 € kgCH4−1 with DAC, 3.1–3.9 € kgCH4−1.LCOM > current methane price; need economic incentivesElectrolyzer is most expensive
KSA, 2023 [137]Syn E-Fuel: CCU, CCS, Electrolysis.TEA: CAPEX, OPEX, LCOe and MFSPe-gasoline: MFSP of 3.24 USD/L; e-diesel: 2.89 USD/L for with solar.LCOe from 379 to 564 USD/MWhE-fuels can become a carbon-neutral option with CO2 taxation.Need economic implications for decarbonizing road.
USA, 2023 [138]E-Fuel: electrolysis, RWGS, FT, CCS, Hydrocracking.TEA: Capex, Opex, energy efficiency.
LCA: GHG, GREET.
MFSP: $0.95/L, $0.74/L, & $0.70/L of SAF mix for 100, 400, 1000 MWe energy plant.GHG: 7 & −25 gCO2e/ MJ. 70% process energy efficiency.99% carbon conversion by recycle CO2 & combustion.WTW GHG emissions reduction of at least 92%.
Italy, 2023 [139]SAF: E-Fuel, Syn-Kerosene, FT, DAC, Electrolysis.TEA: Assumptions, sensitivity analysis, cost, process evaluations.Indirect & direct processes produce 66.18 bbl/d & 38.46 bbl/d respectively.Product cost varies: 460–1435 €/bbl & 752–2364 €/bbl.Dependency on power energy and hydrogen prices.Lack of LCA
Germany, 2023 [140]SAF: LH2, LCH4, CCU, Electrolysis.LCA: Holistic techno-economic assessmentLH2 costs: 157 €/MWh; LCH4: 217–228 €/MWh.SAF costs: 279–302 €/MWh.Limited CO2 reduction potential.Focus on single fuel production costs.
Disclaimer/Publisher’s Note: The statements, opinions and data contained in all publications are solely those of the individual author(s) and contributor(s) and not of MDPI and/or the editor(s). MDPI and/or the editor(s) disclaim responsibility for any injury to people or property resulting from any ideas, methods, instructions or products referred to in the content.