Article

Day-Ahead Coordinated Reactive Power Optimization Dispatching Based on Semidefinite Programming

1
Guangzhou Power Supply Bureau, Guangdong Power Grid Co., Ltd., Guangzhou 510699, China
2
School of Electrical Engineering, Xi’an Jiaotong University, Xi’an 710049, China
3
China Southern Power Grid Electric Power Research Institute Co., Ltd., Guangzhou 510663, China
*
Author to whom correspondence should be addressed.
Energies 2025, 18(20), 5469; https://doi.org/10.3390/en18205469
Submission received: 19 August 2025 / Revised: 7 September 2025 / Accepted: 11 September 2025 / Published: 17 October 2025

Abstract

With access to new energy sources, the problem of reactive power optimization and dispatching has become increasingly important for research. However, the reactive power optimization problem is a mixed integer nonlinear optimization problem. In order to solve the integer variables and nonlinear conditions existing therein, a method for coordinated reactive power optimization and dispatching based on semidefinite programming is proposed. Firstly, a reactive power optimization model considering discrete variables and continuous variables is established with the minimization of total operating cost as the objective function; secondly, the discrete variables are transformed into equality constraints by quadratic equations, and then a solvable semi-definite programming problem is obtained; thirdly, the rank-one constraint is restored by the Iterative Optimization based Gaussian Randomization Method (IOGRM), and the optimal solution equivalent to the original problem is obtained. Finally, the correctness and effectiveness of the proposed model and solution method are verified by analyzing and comparing with the second-order cone programming (SOCP) through the modified IEEE standard example.

1. Introduction

In recent years, as the proportion of distributed generators (DGs) in distribution networks gradually increases [1,2], active distribution networks (ADNs) with distributed generators have gradually become an important part of the power system. However, due to the volatility and intermittency of new energy [3,4], the voltage fluctuation and network loss of the distribution network will be affected to a certain extent [5], so it is of great significance to optimize the reactive power of the distribution network.
At present, the controllable devices in the distribution network system can be divided into discrete controllable devices and continuously controllable devices [6,7,8]. Discrete control devices, such as group switching capacitor banks (CBs) and on-load tap changers (OLTC), can only be adjusted in a few fixed positions [9], while continuous control devices, such as static VAR generators (SVGs), can adjust reactive power within a certain range.
The above two regulating devices make the reactive power optimization problem a complex mixed integer nonlinear (MINLP) NP-hard optimization problem [10,11,12]. In the past few decades, some intelligent optimization algorithms have been used for reactive power optimization, such as genetic algorithm (GA) [13,14], particle swarm optimization (PSO) [15], differential evolution algorithm (DE) [16,17,18], etc. Reference [18] used the DE algorithm to improve the voltage offset and network loss of the power system. However, reference [19] found that the performance of intelligent algorithms such as PSO and DE depends on the selection of their parameters, and may also encounter problems of premature convergence and iterative stagnation. Reference [20] proposed a compact learning method that first learns in the subspace of principal components and then transforms the vectors back to the original output space. This approach reduces the number of trainable parameters and improves scalability and effectiveness. Reference [21] adopted the shuffled frog leaping algorithm and introduced an adaptive strategy to dynamically adjust algorithm parameters, thereby enhancing global search capability and convergence speed. Nevertheless, these algorithms exhibit issues such as slow convergence and difficulty in parameter selection when dealing with complex power system problems. Reference [22] proposed a two-stage solution method: the first stage uses a deep neural network (DNN) to prioritize the identification of key decision variables for optimal power flow, and the second stage utilizes the DNN to perform block-wise mapping of these key decision variables. This method effectively reduces sample complexity and improves computational speed. However, the DNNs trained for different case studies cannot be shared, and it is challenging to integrate the DNNs with the physical characteristics of the power system. Additionally, AI-based optimization algorithms suffer from significant interpretability issues, as their internal decision-making logic lacks transparency, making it difficult to provide reasonable physical explanations for the optimization results. Due to the inability to effectively incorporate the physical characteristics of power systems, this limitation severely hinders the widespread application of AI-based optimization algorithms in critical power system scenarios.
In recent years, modern convex relaxation theory has been used in optimal power flow (OPF). In 2006, Jabr first used second-order cone programming (SOCP) to solve the optimal power flow of radial power grids [23]. Subsequently, Lavaei and Low transformed the optimal power flow into a semi-definite program (SDP) and proposed the concept of exact relaxation [24].
Reference [25] converted the MINLP problem of reactive power optimization into a mixed integer second-order cone optimization problem (MISOCP) and proposed a tangent plane-based method to enhance the relaxation conditions of MISOCP. However, reference [26] proved that SOCP relaxation is accurate for radial distribution networks only under certain conditions. Furthermore, reference [27] found that for pure load radial distribution networks, whether SOCP relaxation is accurate depends on the choice of the objective function. When the objective function is a strictly increasing function of branch current, relaxation is accurate. Reference [28] pointed out that compared with SDP relaxation, SOCP relaxation has the same accuracy in radial networks because the phase angle cycle condition is ignored, but, in mesh networks, where the phase angle cycle condition cannot be ignored, it will affect the accuracy. Therefore, practical applications must consider the phase angle relaxation error introduced by the SOCP relaxation. In certain scenarios, the SOCP relaxation cannot restore the exact phase angles, and it generally requires the fulfillment of specific sufficient conditions [29].
Most of the current distribution networks adopt closed-loop design and open-loop operation [30], which simplifies the network structure and ensures the radial shape of the network. The mesh distribution network has become a hot topic of research due to its higher power supply reliability [31,32,33], but few people have studied the reactive power optimization problem of the mesh distribution network. This paper considers discrete control devices such as group-switched capacitor banks and on-load tap changers, as well as continuous control devices like static var generators. With the objective of minimizing system network loss costs and reactive equipment operation costs, a reactive power optimization model is established to solve the day-ahead reactive power optimization problem for meshed power networks.
For this MINLP problem, by adding quadratic equation constraints, the discrete variables, such as the tap setting of OLTC and the number of CBs switched in, are accurately converted, and the number of 01 variables is reduced through binary expression. Overall, for the MINLP problem of reactive power optimization in meshed power networks, intelligent algorithms lack strong interpretability and suffer from slow convergence rates, while the SOCP method demonstrates relatively poor solution accuracy, so this paper uses SDP to convert this reactive power optimization problem and perform day-ahead optimization.
The structure of this paper is as follows. Firstly, a mathematical model of common reactive equipment in the distribution network is established. Based on the equipment model, a reactive power optimization scheduling model with distributed power sources is established, which is a mixed integer nonlinear model mathematically. Secondly, the reactive power optimization scheduling model is transformed into an SDP problem. Thirdly, the tap setting of OLTC, the number of CBs switched in, and the system node voltage are obtained through two-stage optimization of Gaussian randomization and iteration. Fourthly, the mesh network example is compared with the solution obtained by the SOCP method to analyze the impact of adding reactive compensation equipment on the system cost. Finally, the advantages and disadvantages of the model in this paper and the direction of future research are presented.

2. Optimization Model

In this section, a reactive power optimization equipment model in the distribution network is established. The control variables in the model include the tap ratio of the OLTC, the number of switching groups of the CBs, the active power and reactive power of the distributed generation, and the reactive power of the SVG. On this basis, a reactive optimization model is established.

2.1. Reactive Equipment Model

2.1.1. Model of the OLTC

The transformer structure is shown in Figure 1. Node i is connected to the higher-level grid; node j is connected to the lower-level network.
  • Transformer voltage
V i , t = V 0 + Δ V × s i , t i O
s i , t = k = 0 n k 2 k s i k , t
s i k , t { 0 , 1 }
where O is the set of nodes containing OLTC; V i , t is the voltage of node i at time t; V 0 is the voltage base value of OLTC; Δ V is the voltage difference between the two taps of the transformer; s i , t is the tap setting of OLTC at time t; s i k , t is the 01 variable; n k is the number of s i k , t . s i , t is expressed by multiple groups of binary variables s i k , t , so s i , t can take all integer variables between 0 ~ 2 n k + 1 .
  • Transformer power equation
P O L T C i min P O L T C i , t P O L T C i max Q O L T C i min Q O L T C i , t Q O L T C i max
where P O L T C i , t and Q O L T C i , t represent the active power and reactive power flowing into the lower-level network through the transformer of the substation, respectively; P O L T C i min and P O L T C i max , respectively, represent the minimum and maximum values of the active power allowed to flow into the distribution network by the transformer; Q O L T C i min and Q O L T C i max represent the minimum and maximum values of the reactive power allowed to flow into the lower-level network by the transformer.

2.1.2. Model of the CBs

The capacitor model used in this paper is a switchable capacitor, which can be flexibly adjusted according to load fluctuations.
Q C B i , t = N C B i , t × Q 0 i C
N C B i , t = k = 0 n k 2 k c i k , t
c i k , t { 0 , 1 }
where C is the set of nodes containing CBs; Q C B i , t is the reactive power generated by CBs at node i at time t; N C B i , t is the number of CBs switched in for reactive power compensation at node i at time t, and its value selection principle is the same as s i , t in the OLTC model; Q 0 is the reactive power that can be generated by each group of capacitors.

2.1.3. Model of the DGs

In this paper, DGs access points are set in the lower-level network, and the set of DG nodes is recorded as G . In this paper, DGs adopt the operation mode of controlling their active and reactive power.
P D G i min P D G i , t P D G i max Q D G i min Q D G i , t Q D G i max i G
where P D G i , t is the active power generated by DG at node i at time t; Q D G i , t is the reactive power generated by DG at node i at time t; P D G i max , P D G i min , Q D G i max , Q D G i min are the upper and lower limits of active power and reactive power that DG at node i can generate, respectively.

2.1.4. Model of the SVG

For reactive power compensation equipment that can be continuously adjusted, the reactive power generated should be between the maximum compensation capacity and the minimum compensation capacity in each time period.
Q S V G i min Q S V G i , t Q S V G i max i S
where S is the set of nodes including SVG; Q S V G i , t is the reactive power generated by SVG at node i at time t; Q S V G i max and Q S V G i min are the upper and lower limits of the reactive power that SVG at node i can generate, respectively

2.2. Reactive Power Optimization Model

2.2.1. Objective Function

The goal of reactive power optimization is usually to minimize the active power losses in the lines of the system by adjusting the control variables of various devices in the network. In the process of minimizing active power loss, the optimization will naturally tend to maintain node voltages at a relatively high and reasonable level. Therefore, the system operating point is optimized from the “high-loss, low-voltage” region to the “low-loss, reasonable-voltage” region, which directly avoids operating at the edge of the voltage stability limit. A system operating at a low-loss state has a healthier voltage level and thus possesses a larger voltage stability margin. This paper also takes into account the switching costs of OLTC and CBs during the switching process, so the objective function formulated in this paper is shown in Equation (10):
min C = C l + C O + C B
where C l is the active power losses cost of the system; C O is the switching cost of OLTC; C B is the switching cost of CBs.
  • Active power losses cost
C l = α 1 t = 1 T l , m N I l m , t 2 R l m
where α 1 is the unit network loss cost; T is the total number of optimized time periods; N is the set of all nodes in the system; I l m is the current flowing in the line from node l to node m; R l m is the line resistance from node l to node m.
  • Switching cost of OLTC
C O = α 2 t = 1 T i = 1 n o s i , t s i , t 1 i O
where α 2 is the unit switching cost of OLTC; s i , t is the OLTC tap setting of node i at time t.
  • Switching cost of CBs
C B = α 3 t = 1 T i = 1 n c N C B i , t N C B i , t 1 i C
where α 3 is the unit switching cost of CBs; n C is the total groups of CBs in the system; N C B i , t is the number of CB switching groups at node i at time t.

2.2.2. Constraints for Reactive Power Optimization

In addition to the constraints (1) to (9) of OLTC, CBs, DGs, and SVG, the constraints of the reactive power optimization model also include AC power flow constraints, node voltage constraints, line safety constraints, and OLTC and CBs switching constraints, as shown in Equations (14)–(19):
P O L T C i , t + P D G i , t P D i , t = e i , t j = 1 n ( G i j e j , t B i j f j , t ) + f i , t j = 1 n ( G i j f j , t + B i j e j , t ) Q O L T C i , t + Q S V G i , t + Q C B i , t + Q D G i , t Q D i , t = f i , t j = 1 n ( G i j e j , t B i j f j , t ) e i , t j = 1 n ( G i j f j , t + B i j e j , t )
V i min V i , t V i max i N
S l m min P l m , t 2 + Q l m , t 2 S l m max l , m N
s i min s i , t s i max i O
N s min t T s i , t s i , t 1 N s max i O
N C B i min N C B i , t N C B i max i C
where e i , t and f j , t represent the real part and imaginary part of the voltage at node i at time t, respectively; G i j and B i j represent the real part and imaginary part of the admittance between node i and node j, respectively; S l m min and S l m max are the minimum and maximum capacity of the line that can transmit apparent power; N s min and N s max are the lower and upper limits of the OLTC tap setting; N C B i min and N C B i max are the lower and upper limits of the number of CBs switching groups.
In order to solve integer programming and SDP programming at the same time, the 01 variables and are transformed as shown in (20) and (21). In this way, discrete variables are transformed into continuous variables and solved in the form of quadratic equations.
s i k , t 2 s i k , t = 0
c i k , t 2 c i k , t = 0
Expand OLTC, CBs, SVG, and load to the whole system. If the node does not contain the corresponding OLTC, CBs, SVG, or load, set the upper and lower limits of (4), (8), and (9) to 0, and set N C B i , t in (5) to 0.

3. Optimization Model Conversion

Since the AC power flow constraints in the reactive power optimization problem are non-convex constraints, the model established in Section 2 cannot be solved directly. In order to obtain the global optimal solution, this paper transforms the above problem into an SDP for solution.

3.1. Define Vectors

Assuming that the OLTCs have 2 k 1 + 1 taps, the vector s t = [ s 0 , t , , s k 1 , t , , s k 1 * ( n o 1 ) , t , , s k 1 * n o , t , v ] T can be defined for all OLTCs in the system. Assuming that each group of CBs can choose the number of switches from 0 to 2 k 2 + 1 , the vector c t = [ c 0 , t , , c k 2 , t , , c k 2 * ( n c 1 ) , t , , c k 2 * n c , t , v ] T can be defined by putting the 01 variables of all CBs together. Finally, the vector x t = [ e 1 , t , , e n , t , f 1 , t , , f n , t ] T is defined, which represents the vector of the relevant voltage. In order to convert to SDP, some matrices are defined as follows:
S t = s t s t T
C t = c t c t T
X t = x t x t T
At the same time, constraints (25) need to be added.
v 2 = 1
Consequently, Equations (2) and (6) become as follows:
s i , t = v k = 0 k 1 2 k s i k , t
N C B i , t = v k = 0 k 2 2 k c i k , t
where v is an auxiliary variable and should always be 1. However, when solving the SDP problem, since v does not appear directly in the solution variables S t and C t , but v 2 , we now explain the equivalence of adding the auxiliary variable v.
When v = 1 , the constraint becomes s i k , t 2 s i k , t = 0 , at which time the possible value of s i k , t is 0 or 1, and Equation (26) is transformed into (2). When v = 1 , the constraint becomes s i k , t 2 + s i k , t = 0 , at which time the possible value of s i k , t is 0 or −1, and s i , t = k = 0 n k 2 k s i k , t , obtained by (26), can also ensure the non-negativity of s i , t . This means that after adding the variable v, Equation (26) is equivalent to (2), and the same is true for (27).
After adding v, constraints (20) and (21) are transformed into (28).
s i k , t 2 v s i k , t = 0 c i k , t 2 v c i k , t = 0

3.2. Define the Auxiliary Matrix

In order to convert to SDP form, it is also necessary to define an auxiliary matrix. For the network loss cost, the relevant auxiliary matrices are defined as (29) and (30). In (29), except for the l-th element being 1 and the m-th element being −1, the rest of the elements are 0.
a l m = [ 0 , , 1 , , 1 , , 0 ] n × 1 T l , m N
A l m = a l m a l m T 0 n × n 0 n × n a l m a l m T
For the tap setting variables of OLTC, the auxiliary matrix is defined as shown in (31) and (32). For b i , with k 1 elements as one group, the elements of the i-th group are 2 1 , , 2 k 1 1 .
b i = [ 0 , , 2 1 , , 2 k 1 1 , , 0 ] k 1 n o × 1 T i O
B i = 0 k 1 n o × k 1 n o b i b i T 0
For the switching number constraint of CBs, the auxiliary matrices are defined as shown in (33) and (34). For d i , with k 2 elements as one group, the elements of the i-th group are 2 1 , , 2 k 2 1 .
d i = [ 0 , , 2 1 , , 2 k 2 1 , , 0 ] k 2 n c × 1 T i C
D i = 0 k 2 n c × k 2 n c d i d i T 0
Define a set of basis vectors e 1 , e 2 , , e k 1 n o in the space R k 1 n o , then for the tap setting variables of OLTC, define the correlation matrix as shown in (35) and (36):
h i = [ 0 , , 1 / 2 , , 0 ] k 1 n o × 1 T i O
E i = e i e i T h i h i T 0
Define a set of basis vectors e 1 , e 2 , , e k 2 n c in the space R k 2 n c ; then, for the switching variables of CBs, define the correlation matrix as shown in (37) and (38):
f i = [ 0 , , 1 / 2 , , 0 ] k 2 n c × 1 T i C
F i = e i e i T f i f i T 0
By defining a set of basis vectors e 1 , e 2 , , e n in the space R n , the OLTC voltage constraint correlation matrix can be obtained as shown in (39)–(41):
H i = e i e i T 0 n × n 0 n × n e i e i T
j = [ 2 0 k 0 , , 2 k 1 k 0 ] T
J i = j j T V 0 j V 0 j V 0 2
where J i is a k 1 n o + 1 dimensional matrix, and j j T is located on the i-th diagonal element.
In addition to the above auxiliary matrices, this paper also uses Y i and Y ¯ i defined in [24]. The specific mathematical definitions are shown in Appendix A.

3.3. Convert to SDP

3.3.1. Objective Function

Combining the vectors and matrices defined above, the objective function can be transformed into Equation (42):
min C = C l + C O + C B
where,
C l = α 1 t = 1 T l , m N R l m R l m 2 + X l m 2 × Tr ( A l m X t )
C O = α 2 t = 1 T i O Tr ( B i S i , t B i S i , t 1 )
C B = α 3 t = 1 T i C Tr ( D i C t D i C t 1 )

3.3.2. Constraints for Reactive Power Optimization

Define a mapping g to establish the relationship between the set N and the set C = { 1 , , n c } . The i-th node number in containing CBs is mapped to i in C . The node number in N not containing CBs is not mapped to C . Furthermore, define the matrix D ¯ i , and J ¯ i for the OLTC can be defined in the same way:
D ¯ i = D g ( i ) i C 0 i C i N
J ¯ i = J g ( i ) i O 0 i O i N
The AC power flow constraints are transformed into Equation (48), where Q C B i , t can be determined by Equation (49). The voltage constraint at node i is transformed into Equation (50). The OLTC voltage constraint at node i is transformed into Equation (51). The CBs switching constraint is transformed into Equations (52) and (53). The OLTC switching constraint is transformed into Equations (54) and (55), and the line safety constraint is written in Schulz complement form as shown in Equation (56).
P D G i min + P O L T C i min P D i , t Tr { Y i X t } P D G i max + P O L T C i max P D i , t Q D G i min + Q O L T C i min + Q S V G i min Q D i , t Q C B i , t + Tr { Y ¯ i X t } Q D G i max + Q O L T C i max + Q S V G i max Q D i , t
Q C B i , t Tr ( D ¯ i C t ) × Q 0 = 0 i C
( V i min ) 2 X i i , t + X i + N , i + N , t ( V i max ) 2 i N
Tr ( J ¯ i S i , t ) Tr ( H i X t ) = 0
Tr ( F i C t ) = 0 i = 1 , , k 2 n c
N C B i min Tr ( D i C t ) N C B i max i C
Tr ( E i S t ) = 0 i = 1 , , k 1 n o
N s min T r ( B S i , t ) N s max
( S l m max ) 2 Tr { Y i X t } Tr { Y ¯ i X t } Tr { Y i X t } 1 0 Tr { Y ¯ i X t } 0 1 _ 0 i N
After defining the SDP variables, the transformed optimization problem is equivalent to the original problem only when the SDP matrices are rank-one semi-positive definite matrices. At this time, it is necessary to add rank-one constraints and semi-definite constraints, as shown in Equation (57):
X t _ 0 , rank ( X t ) = 1 S t _ 0 , rank ( S t ) = 1 C t _ 0 , rank ( C t ) = 1
Through the above transformation, the reactive power optimization problem with mixed integer variables is transformed into an SDP problem. However, the rank-one constraint is still non-convex, so the global optimal solution cannot be directly obtained at this time.
In [34], it adopts the method of relaxing the rank-one constraint to solve the above SDP problem, but only when the solution directly satisfies the rank of one, the relaxed problem is equivalent to the original problem; however, this cannot be satisfied in most cases. Therefore, this paper subsequently uses Gaussian randomization and an iterative method to jointly process and restore the rank-one constraint. This paper names the algorithm the Iterative Optimization based Gaussian Randomization Method (IOGRM).

4. Solving the Semidefinite Programming Problems

There are many ways to deal with rank-one constraints. In addition to directly relaxing the rank-one constraint, reference [35] uses the EVD decomposition method. However, these methods often have the problem of low precision. Therefore, this paper uses Gaussian randomization and an iterative method to jointly deal with the rank-one constraint problem. Gaussian randomization can be used to obtain the values of discrete variables, and then the continuous variable matrix that satisfies the rank-one constraint can be obtained through the iterative method.
The SDP problem obtained by ignoring the rank-one constraint above is a standard convex optimization problem, which can obtain a set of solutions, denoted as S t , C t , and X t .
After obtaining the relaxed solution, generate L groups of random vectors that satisfy the normal distribution for S t and C t , respectively, denoted as ξ l , s and ξ l , c , which should satisfy (58) and (59):
ξ l , s ~ N ( 0 , S t * )
ξ l , c ~ N ( 0 , C t * )
First, we obtain a random vector ϕ that obeys a Gaussian distribution N ( 0 , I ) , whose dimensions are consistent with S t * and C t * . Then, we perform Cholesky decomposition on S t * and C t * , obtaining the L t , s and L t , c , which satisfy (60) and (61):
S t = L t , s L t , s H
C t = L t , c L t , c H
Each ξ l , s and ξ l , c can be obtained by formula (62) and (63):
ξ l , s = L t , s ϕ
ξ l , c = L t , c ϕ
At this time, ξ l , s and ξ l , c do not necessarily satisfy the 01 constraint and need to be further modified. For the elements corresponding to the constant v, all the elements greater than or equal to 0.5 are set to 1, and all the elements less than 0.5 are set to 0.
Finally, we can use the formula to obtain the L groups after randomization S t and C t , denoted as S l , t , C l , t .
S l , t = ξ l , s ξ l , s H
C l , t = ξ l , c ξ l , c H
After the above randomization, the discrete matrices S l , t and C l , t satisfy the rank-one constraint, but the continuous matrix variable X t still does not satisfy the rank-one constraint. At this time, the constant matrices S l , t and C l , t are brought into the original problem, and the solution of the original problem that satisfies the rank-one constraint can be solved by the iteration method.
By adding the constraint rank ( X t ) = 1 into the objective function through the penalty term [36], the model can be transformed into a convex optimization model while ensuring the rank-one constraint, and then the global optimal solution can be obtained.
When the rank of X t is one, the trace of X t is equal to its maximum eigenvalue. The rank-one constraint can be transformed into the following (66):
Tr ( X t ) λ max , t ( X t ) = 0
where λ max ( X t ) is the largest eigenvalue of the matrix W .
The difference between Tr ( X t ) and λ max , t ( X t ) is added as a penalty term to the objective function, and the difference between the two is reduced through an iteration method. The cost per hour in the original objective function is recorded as F ( X t ) , and the new objective function F μ can be obtained.
min F μ = t = 1 T F ( X t ) + μ t ( Tr ( X t ) λ max ( X t ) )
where μ t is the penalty factor, which is a large positive number. This paper uses (68) to select the penalty factor for each hour.
μ t = F ( X t ) Tr ( X t ) λ max ( X t )
Since λ max is a non-smooth function, its lower bound can be determined by the Rayleigh Quotient theorem
λ max ( X t ) = max ω H X t ω ( ω max ( κ ) ) H X t ω max ( κ )
Then, the objective function is transformed into Formula (70):
min F ( κ ) ( X t ) = t = 1 T F ( X t ) + μ t ( Tr ( X t ) ( ω max ( κ 1 ) ) H X t ω max ( κ 1 ) )
where κ represents the number of iterations. It can be seen that the iteration method changes λ max ( X t ) in the objective function to λ max ( X t ( κ ) ) . In [36], it proves that, through iteration, X t ( κ ) can eventually converge to the optimal solution of the entire objective function, and the entire iteration is a monotonically decreasing process without oscillation. The final solution that satisfies the rank-one constraint is denoted as X l , t . Therefore, choosing a suitable initial value is one of the important means to reduce the number of iterations and reduce time complexity.
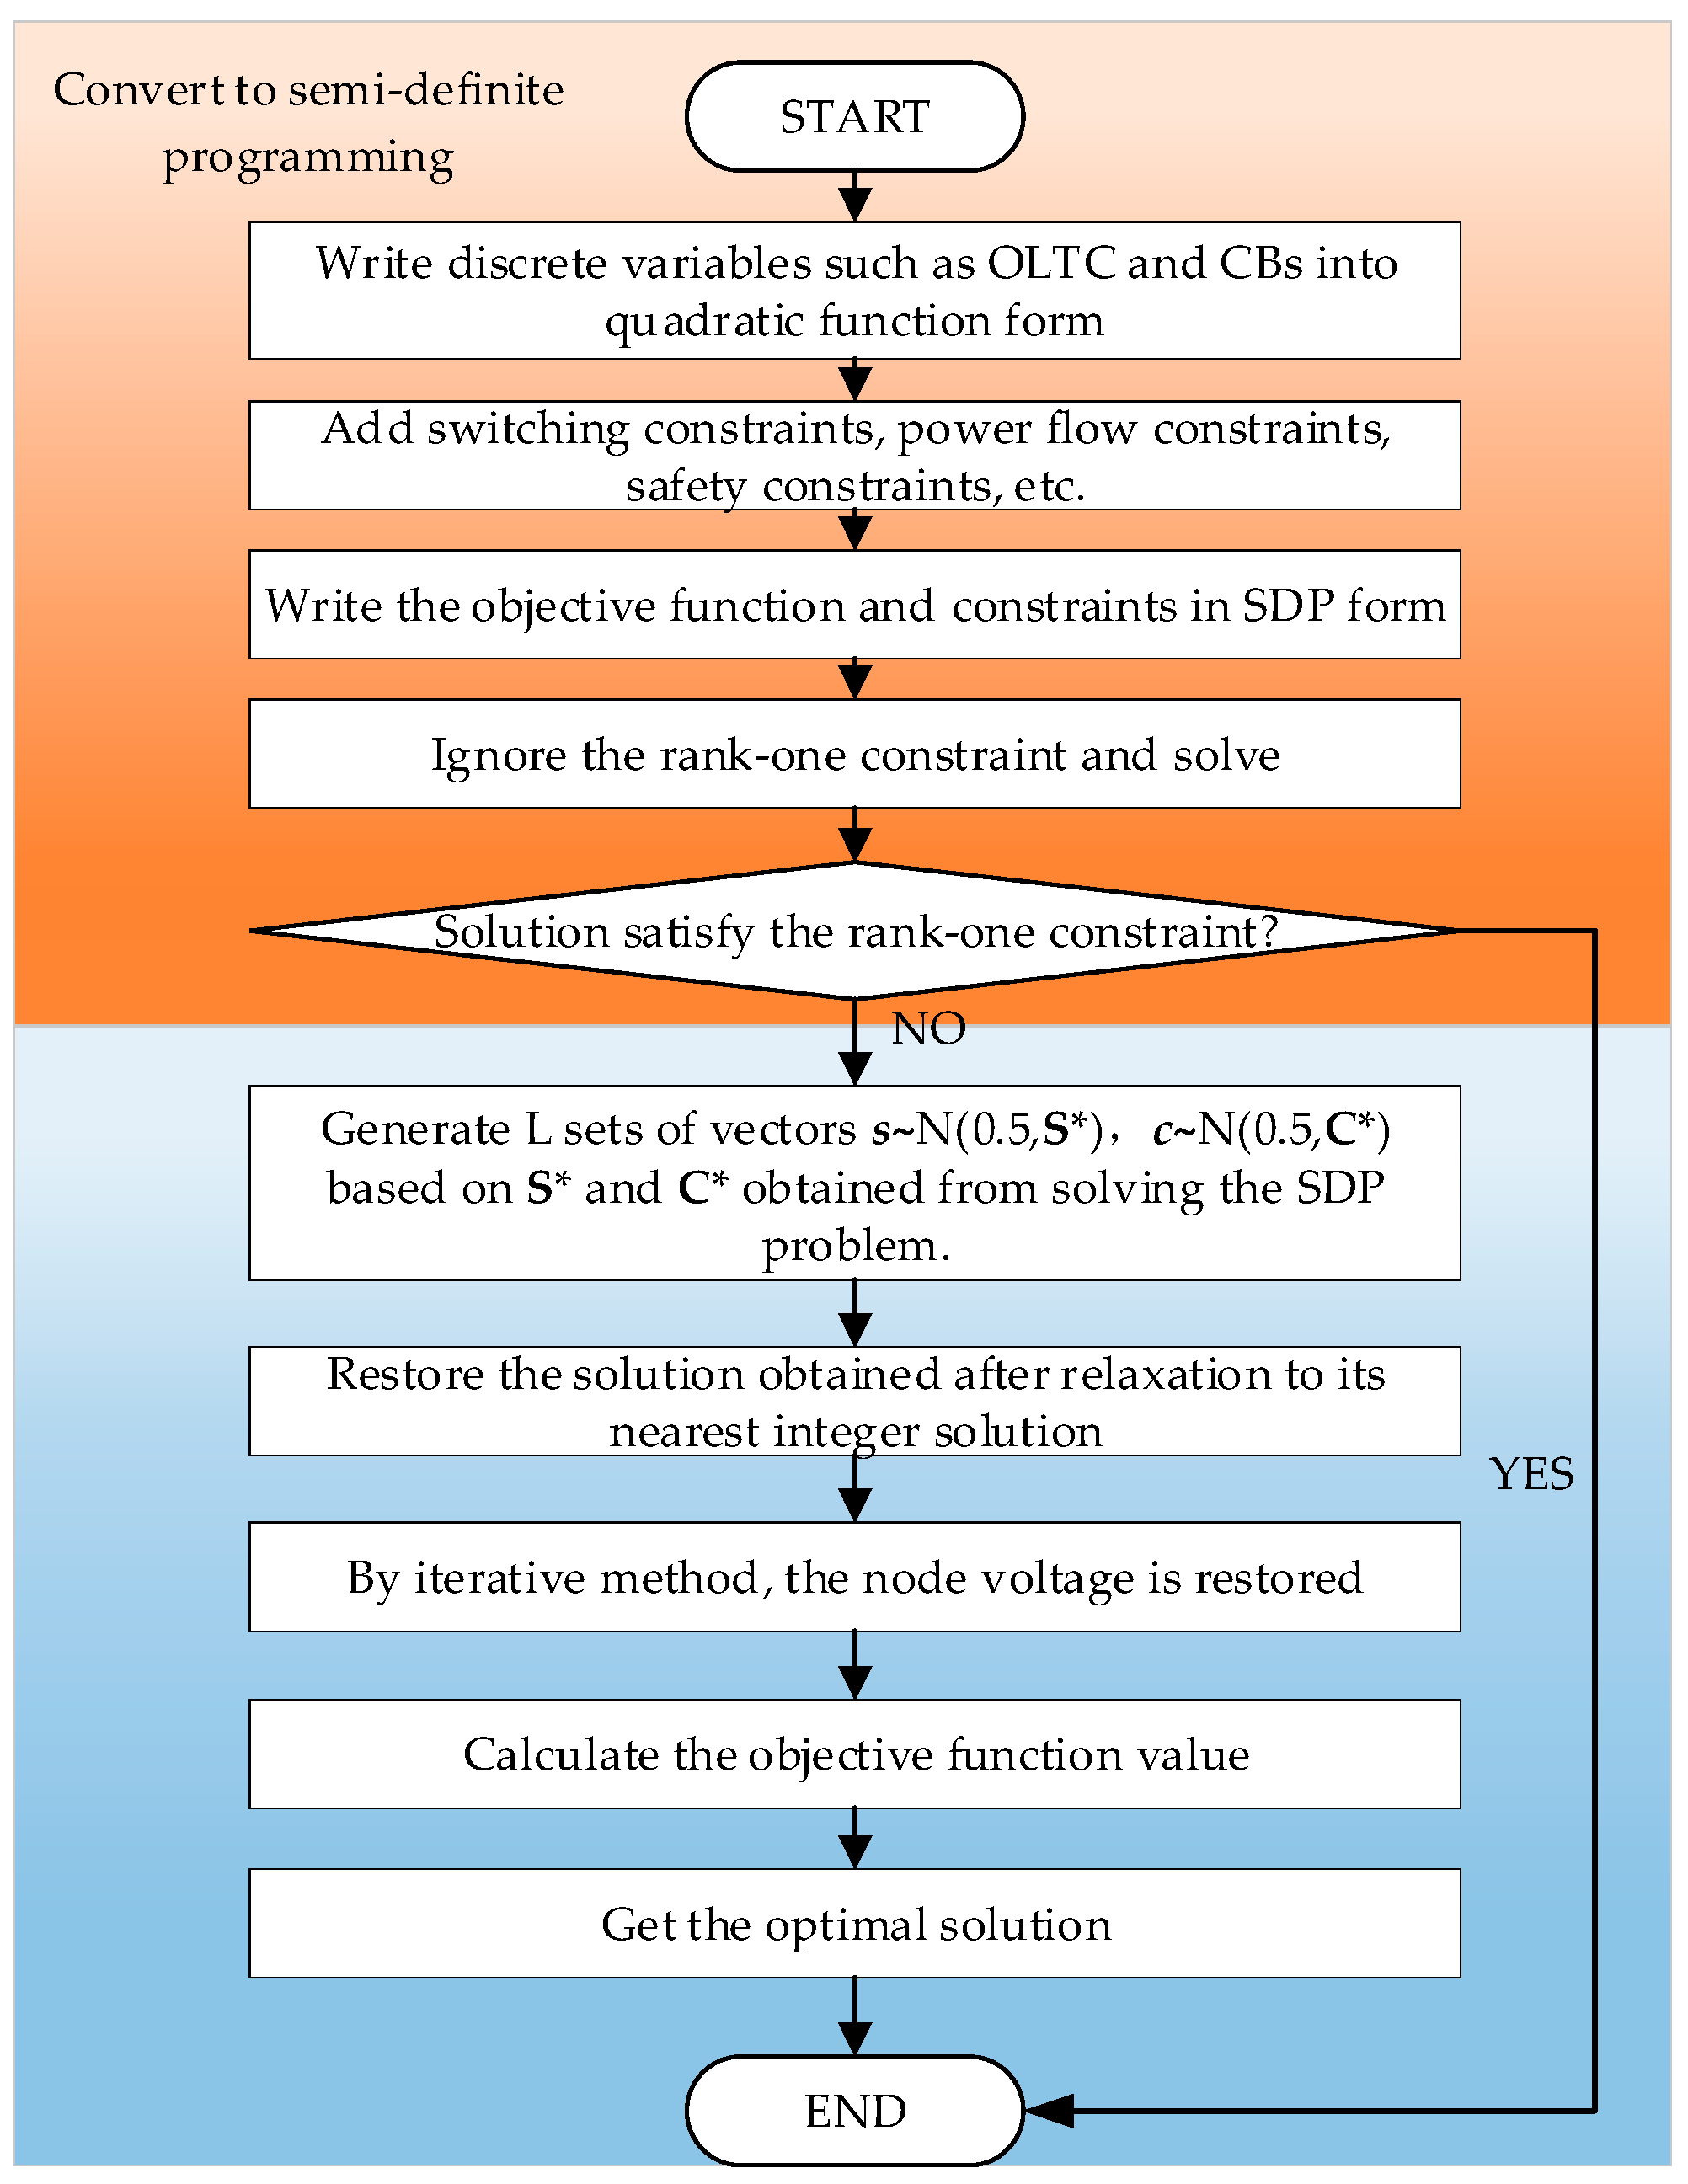
Through the above Gaussian randomization and iteration method, we can obtain L groups of S l , t , C l , t , X l , t . Finally, by comparing the L groups’ feasible solutions, we can obtain the optimal solution that minimizes the objective function. The IOGRM process is shown in Figure 2. Through this process, the implementation of solving power system management and planning problems can be realized.
To obtain a better initial value for iteration, this paper, following reference [24], modifies the system’s admittance matrix as follows: a small resistance (10−5) is added to each zero-resistance branch. This strengthens the connections between different parts of the power system. This is necessary because some nodes are connected only by reactance, resulting in very weak connections in the graph corresponding to the real part of the admittance matrix. Purely reactive branches manifest as “disconnected” edges (i.e., edges with zero weight) in the graph associated with the conductance matrix. Adding the small resistance assigns a tiny weight to these edges, changing the graph structure from “disconnected” to “connected,” thereby improving the rank of the matrix. On the other hand, zero elements can cause the matrix to have redundant (linearly dependent) rows/columns. After introducing this perturbation with tiny non-zero values, the rank of the matrix is restored to full rank, satisfying the non-singularity condition. Consequently, the matrix formed by the real part of the admittance matrix will no longer be singular. After adding the small resistances, all parts of the system will also be resistively connected, and the graph formed by the real part of the admittance matrix becomes “strongly connected”. Simultaneously, the added resistances are very small relative to the system impedance; therefore, they will not affect the optimal solution of the optimization problem.
This minor modification is highly advantageous. It optimizes the structure of the feasible region in the semidefinite programming (SDP) solution process, enabling the solution X obtained by relaxing the rank-one constraint to directly satisfy the rank-one constraint in some test cases. For cases where the rank-one constraint is not directly satisfied, the resulting X can be used as the initial iterative value. Since the entire iterative process is monotonically decreasing (in terms of the objective function value) and this initial value is closer to the optimal solution, it can significantly reduce the number of iterations required.

5. Case Study and Discussion

This chapter mainly compares the basic examples in IEEE with the SOCP method used in [37]. The test examples include the Case 9 Network and other networks, both of which are mesh networks. Reference [38] points out that, for high-dimensional problems, appropriately increasing L can achieve better performance, but the benefits become limited after exceeding a certain threshold. Therefore, L = 10 n is adopted in this paper.
All models in this paper are constructed using MATLABR2023a toolboxes YALMIP2023-06-22 and MATPOWER8.0 [39]. Therefore, the cost coefficients, system base values, and device limits are all taken from the corresponding cases in MATPOWER. Whether there are line shunts also comes from MATPOWER. Meanwhile, this paper does not consider the tap-ratio phase shifts of transformers. The solver used to solve the SOCP problem is Gurobi12.0.0, and the solver used to solve the SDP problem is MOSEK10.1.27. The computer running this program is a HP computer, with a central processing unit (CPU) model of Intel Core i7-8700 and a clock speed of 3.20 gigahertz (GHz).

5.1. Case 9 Network

This paper modifies the Case 9 Network by increasing the resistance value in the original Case 9 and adding reactive power optimization equipment. The locations of the equipment in the system are shown in Table 1.
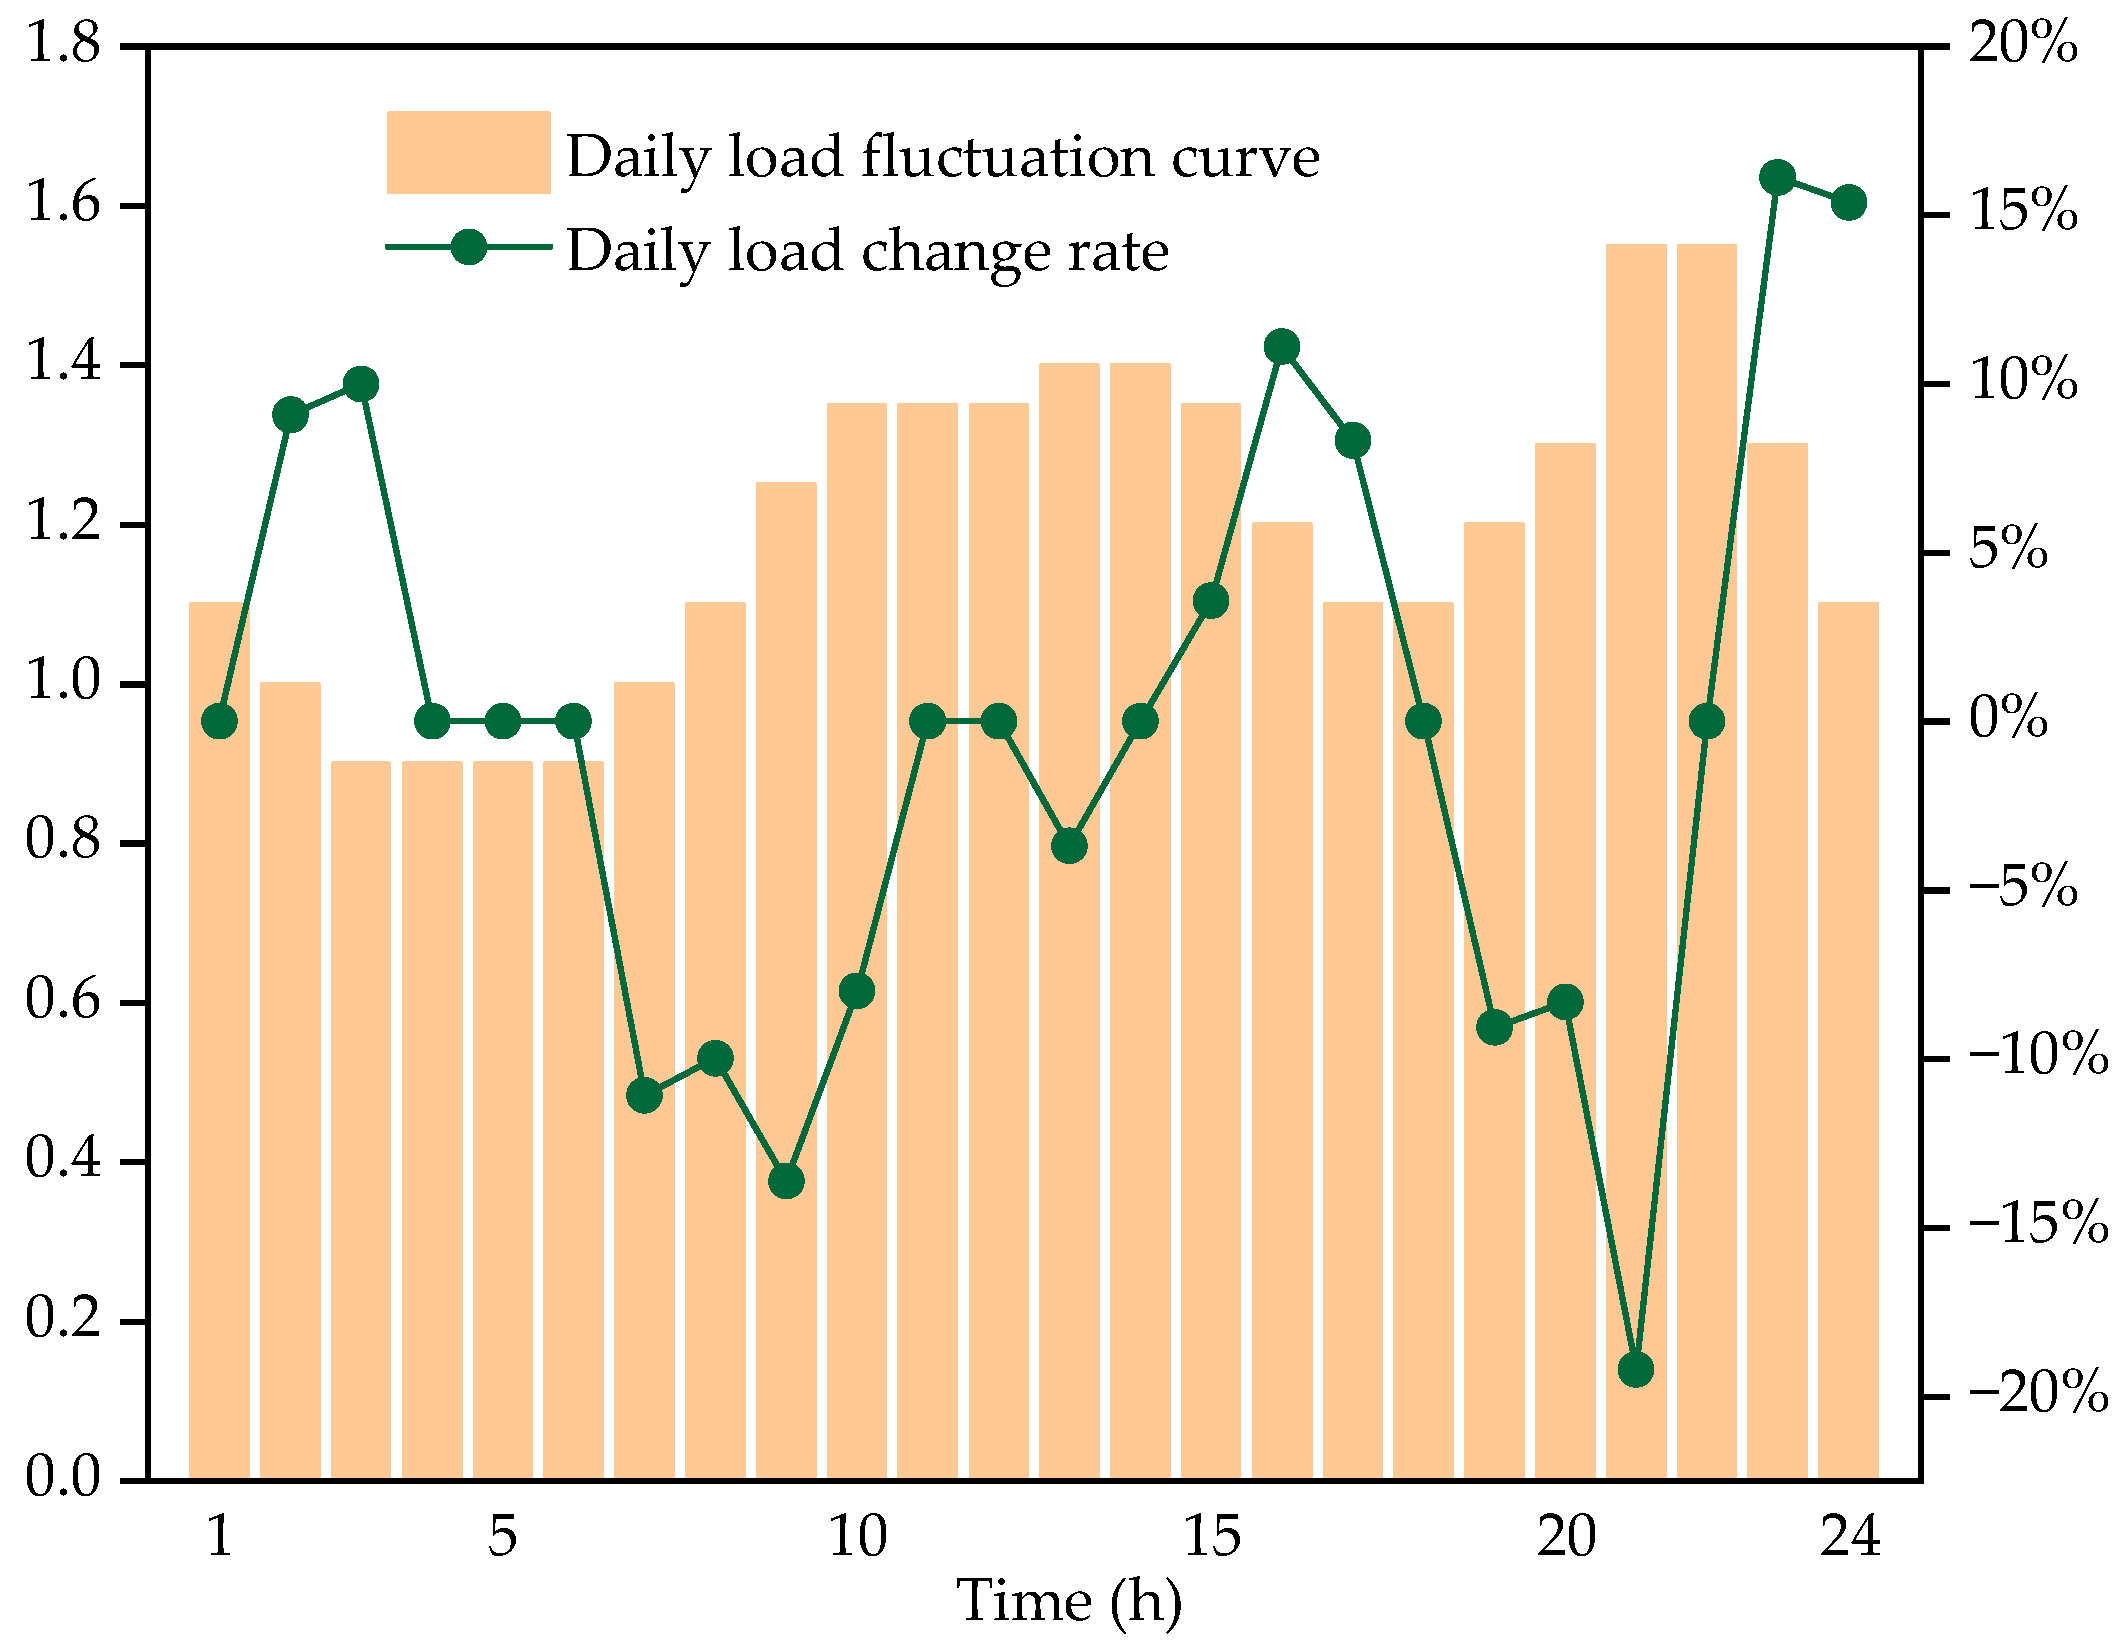
Assume that the number of CBs that can be switched in each group is between 0 and 7, and the voltage range of OLTC is from 1 to 1.15, with a tap setting of 0.05. In the IEEE standard calculation example, the load is a fixed value. In order to perform dynamic optimization, this paper assumes that the load fluctuates according to the typical daily load curve. The typical daily load curve generally presents a bimodal characteristic, reaching the peak of electricity consumption at noon and at night. The daily load curve is shown in Figure 3.
In order to verify the accuracy of the algorithm proposed in this paper (hereinafter referred to as Method 1), this paper compares it with the SOCP method proposed in reference [37] (hereinafter referred to as Method 2) and the optimal power flow without reactive equipment (hereinafter referred to as Method 3). Method 2 establishes a branch power flow model and uses the Sylvester criterion to transform the semi-positive definite constraint (71) into a second-order cone constraint, while relaxing the rank-one constraint (72).
W m S e S e H L e _ 0
rank W m S e S e H L e = 1
After obtaining the optimal solution, the amplitude of each node voltage is the square root of the main diagonal element W m , and the current of each branch is the square root of the main diagonal element L e .
Since Method 2 ignores the rank-one constraint, in order to measure the accuracy of the results obtained by Method 1 and Method 2, the relaxation deviation function (73) is defined to measure the degree of deviation between the matrix and the rank-one matrix.
G a p = Tr ( W * ) λ max ( W * ) Tr ( W * )
where W * is the voltage matrix obtained by Method 1 and Method 2. When Tr ( W * ) λ max ( W * ) = 0 , G a p = 0 means rank ( W * ) = 1 .
The maximum GAP obtained by using the SOCP of Method 2 is 0.847, while the maximum GAP obtained by using this paper is only 5.91 × 10 5 . This shows that the solution obtained by Method 2 does not meet the rank-one requirement of the original problem, and the relaxation deviation is large. While the relaxation deviation of the algorithm in this paper is small. Within a certain error tolerance range, it can be concluded that the solution obtained by Method 1 is relaxation accurate.
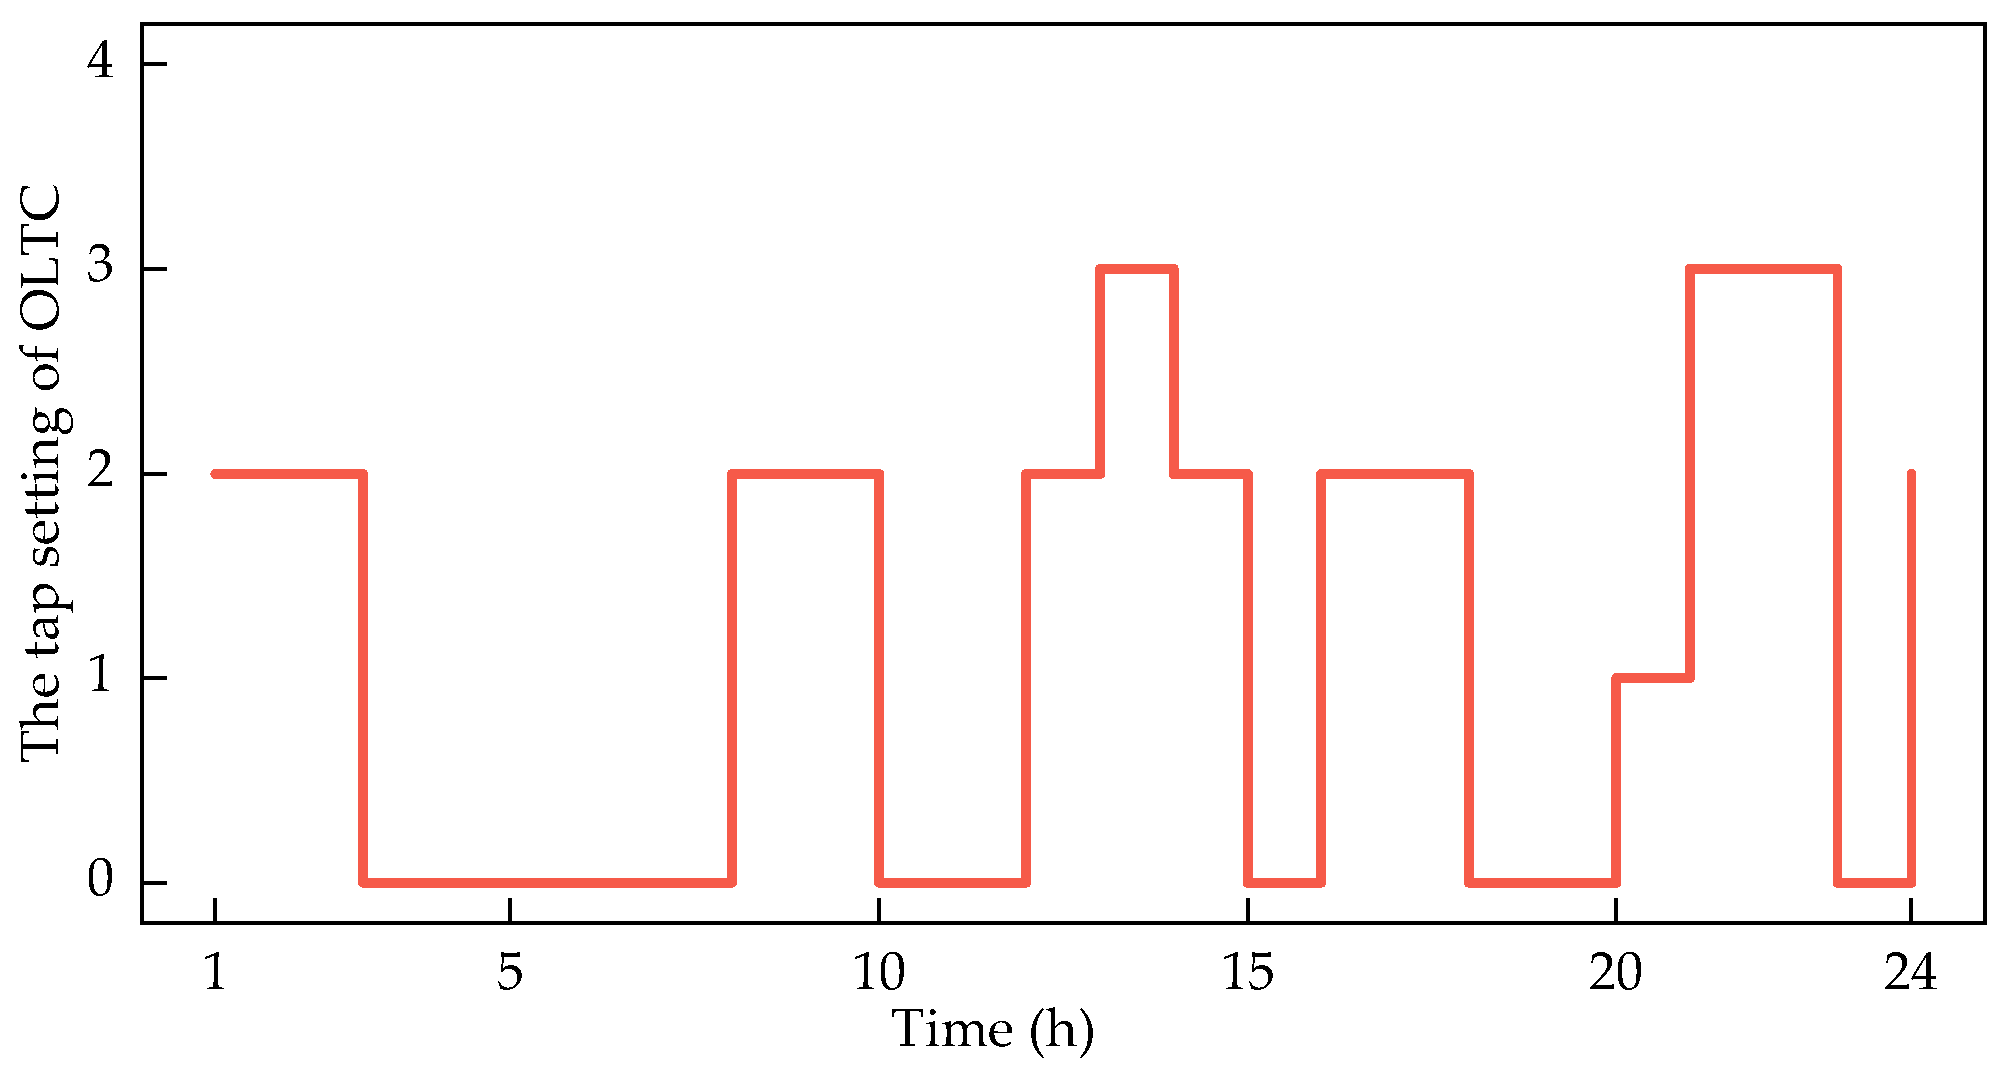
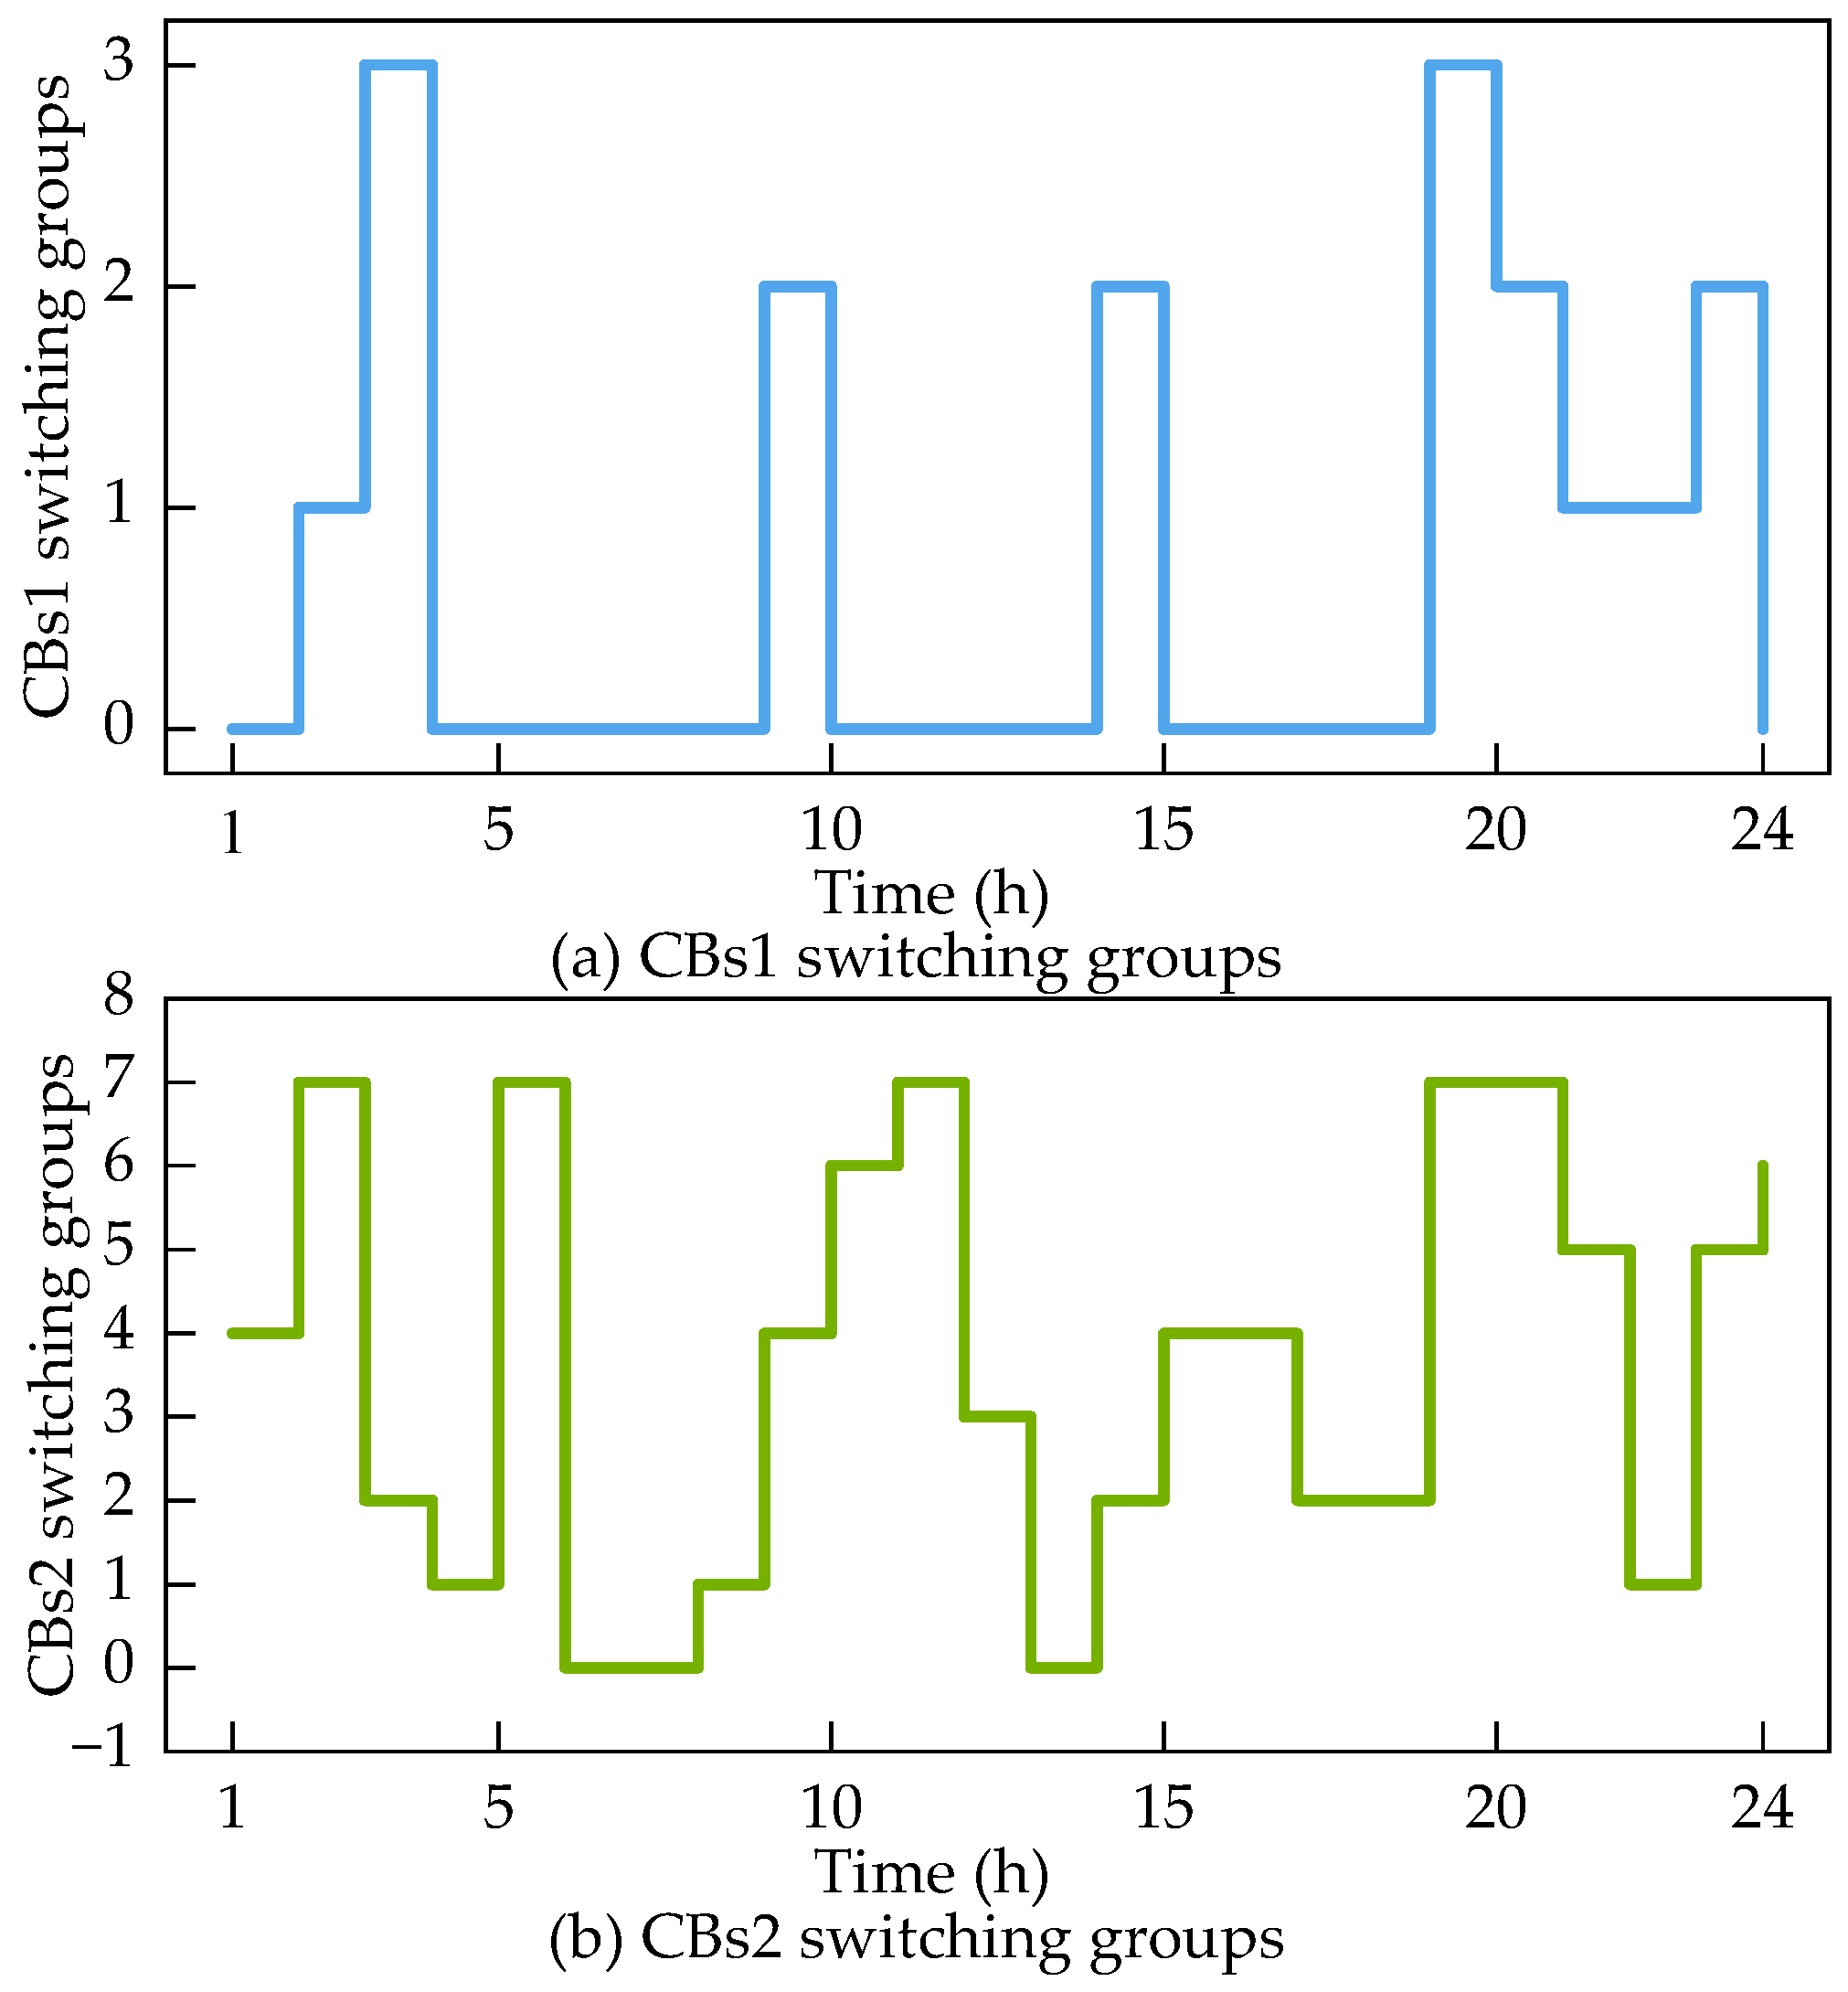
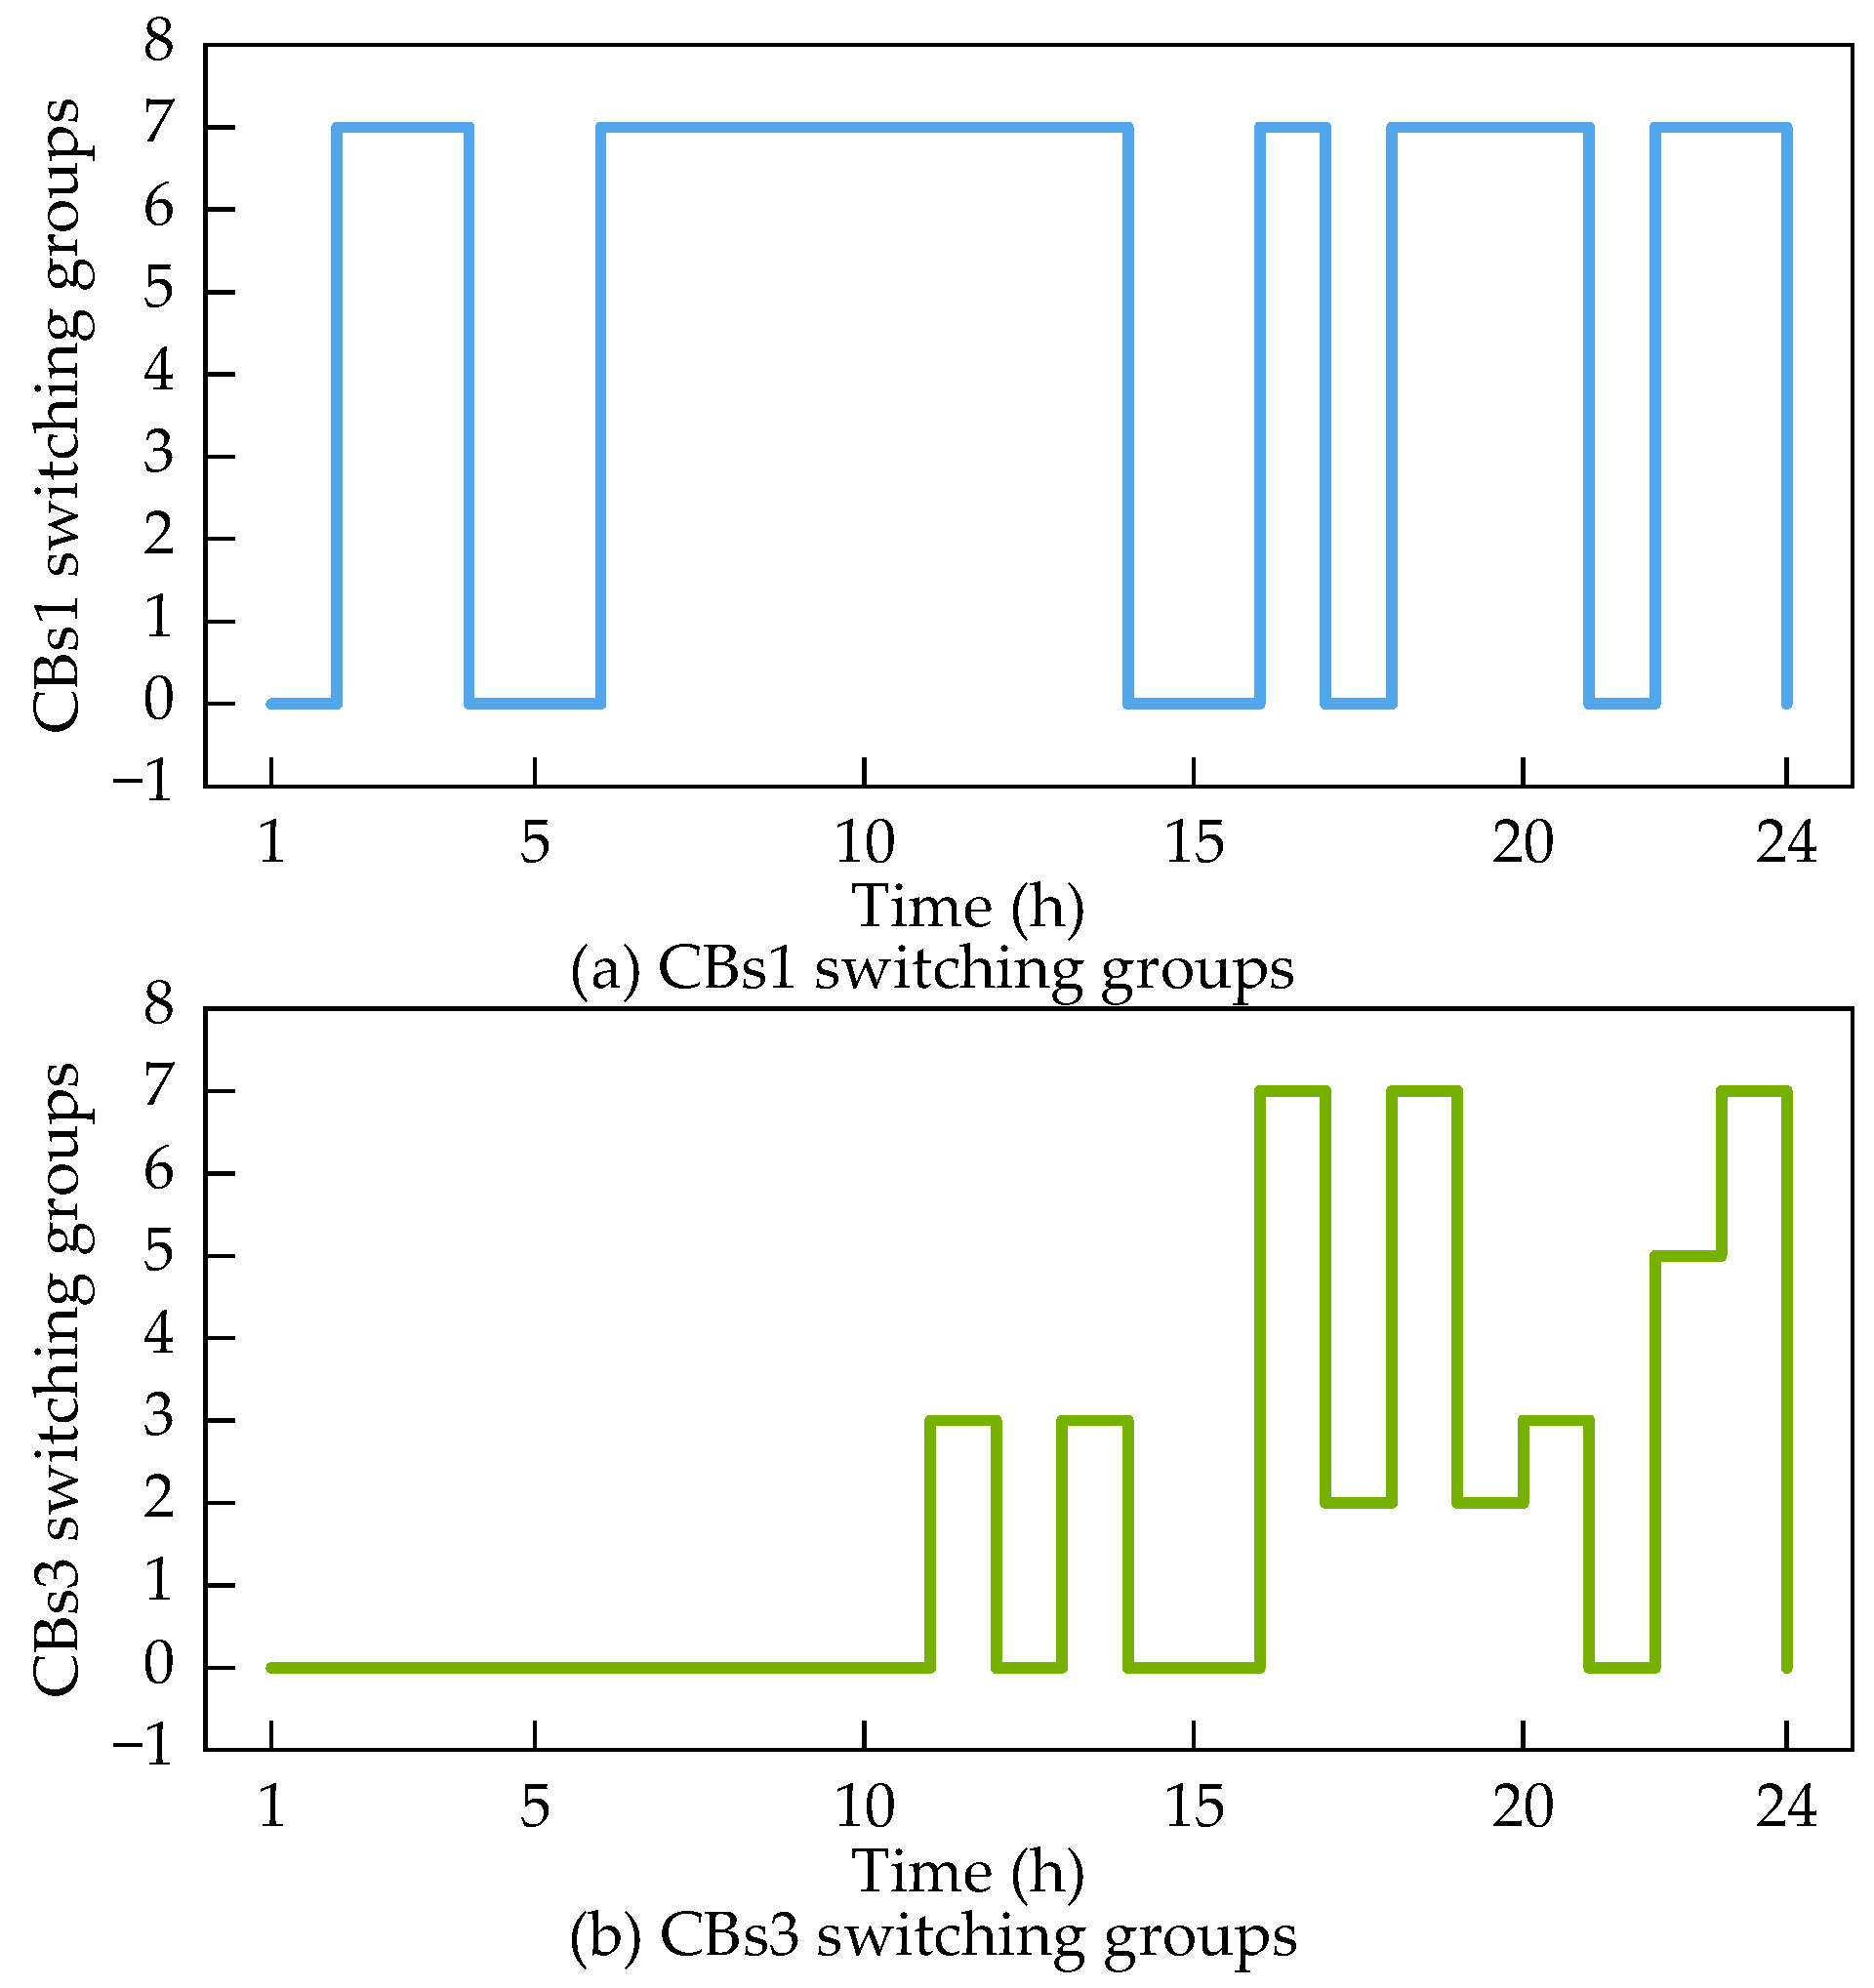
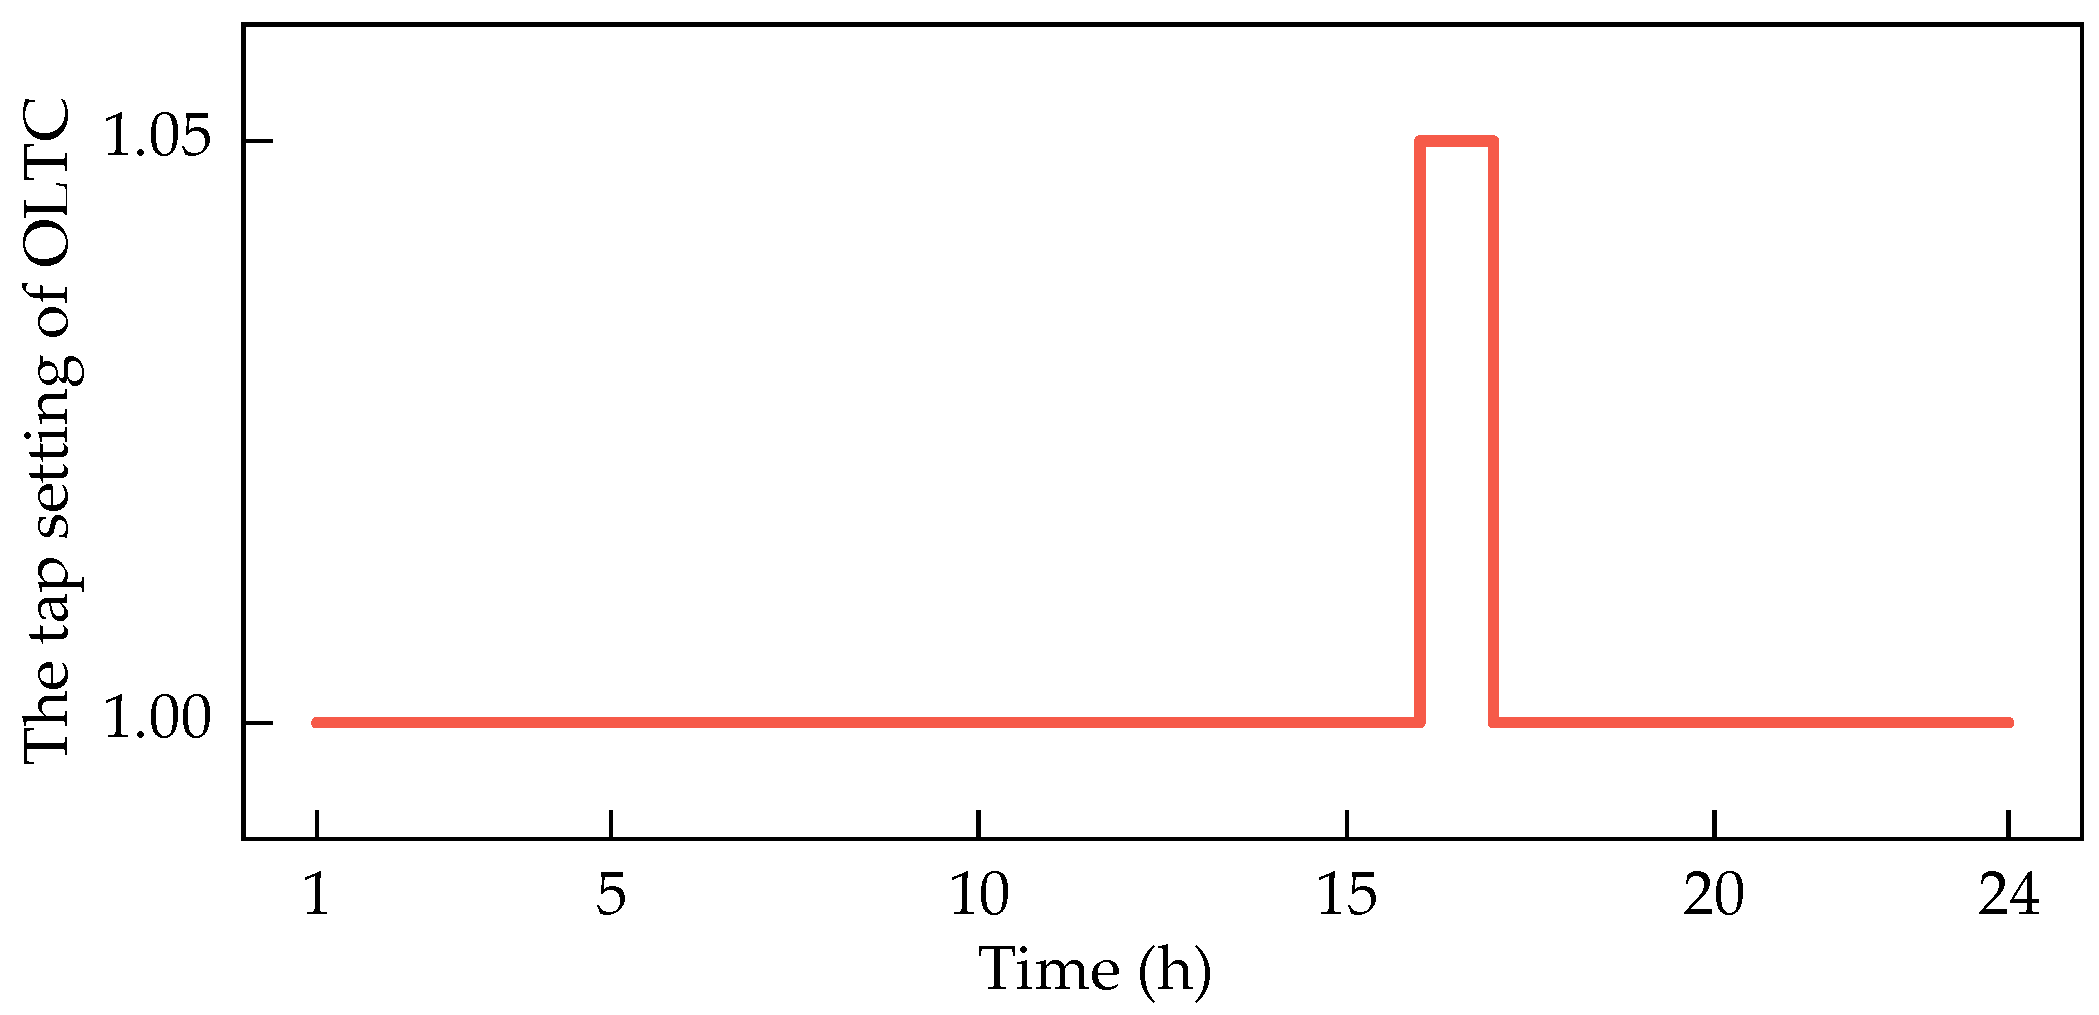
The action of OLTC in Method 1 is shown in Figure 4, the action of CB at node 7 is shown in Figure 5a, and the action of CB at node 9 is shown in Figure 5b. Neither OLTC nor CBs in Method 2 acted.
The cost obtained by Method 1 is USD 196,700; the cost obtained by Method 2 is USD 59,200; and the cost obtained by Method 3 is USD 220,600. Compared with Method 1, although the latter has a lower cost, it can be seen from the relaxation deviation that the solution obtained by Method 2 has a large deviation from the rank-one matrix. The voltage and current restored by Method 2 do not actually meet the AC power flow constraints, while the relaxation deviation obtained by Method 1 is almost zero.
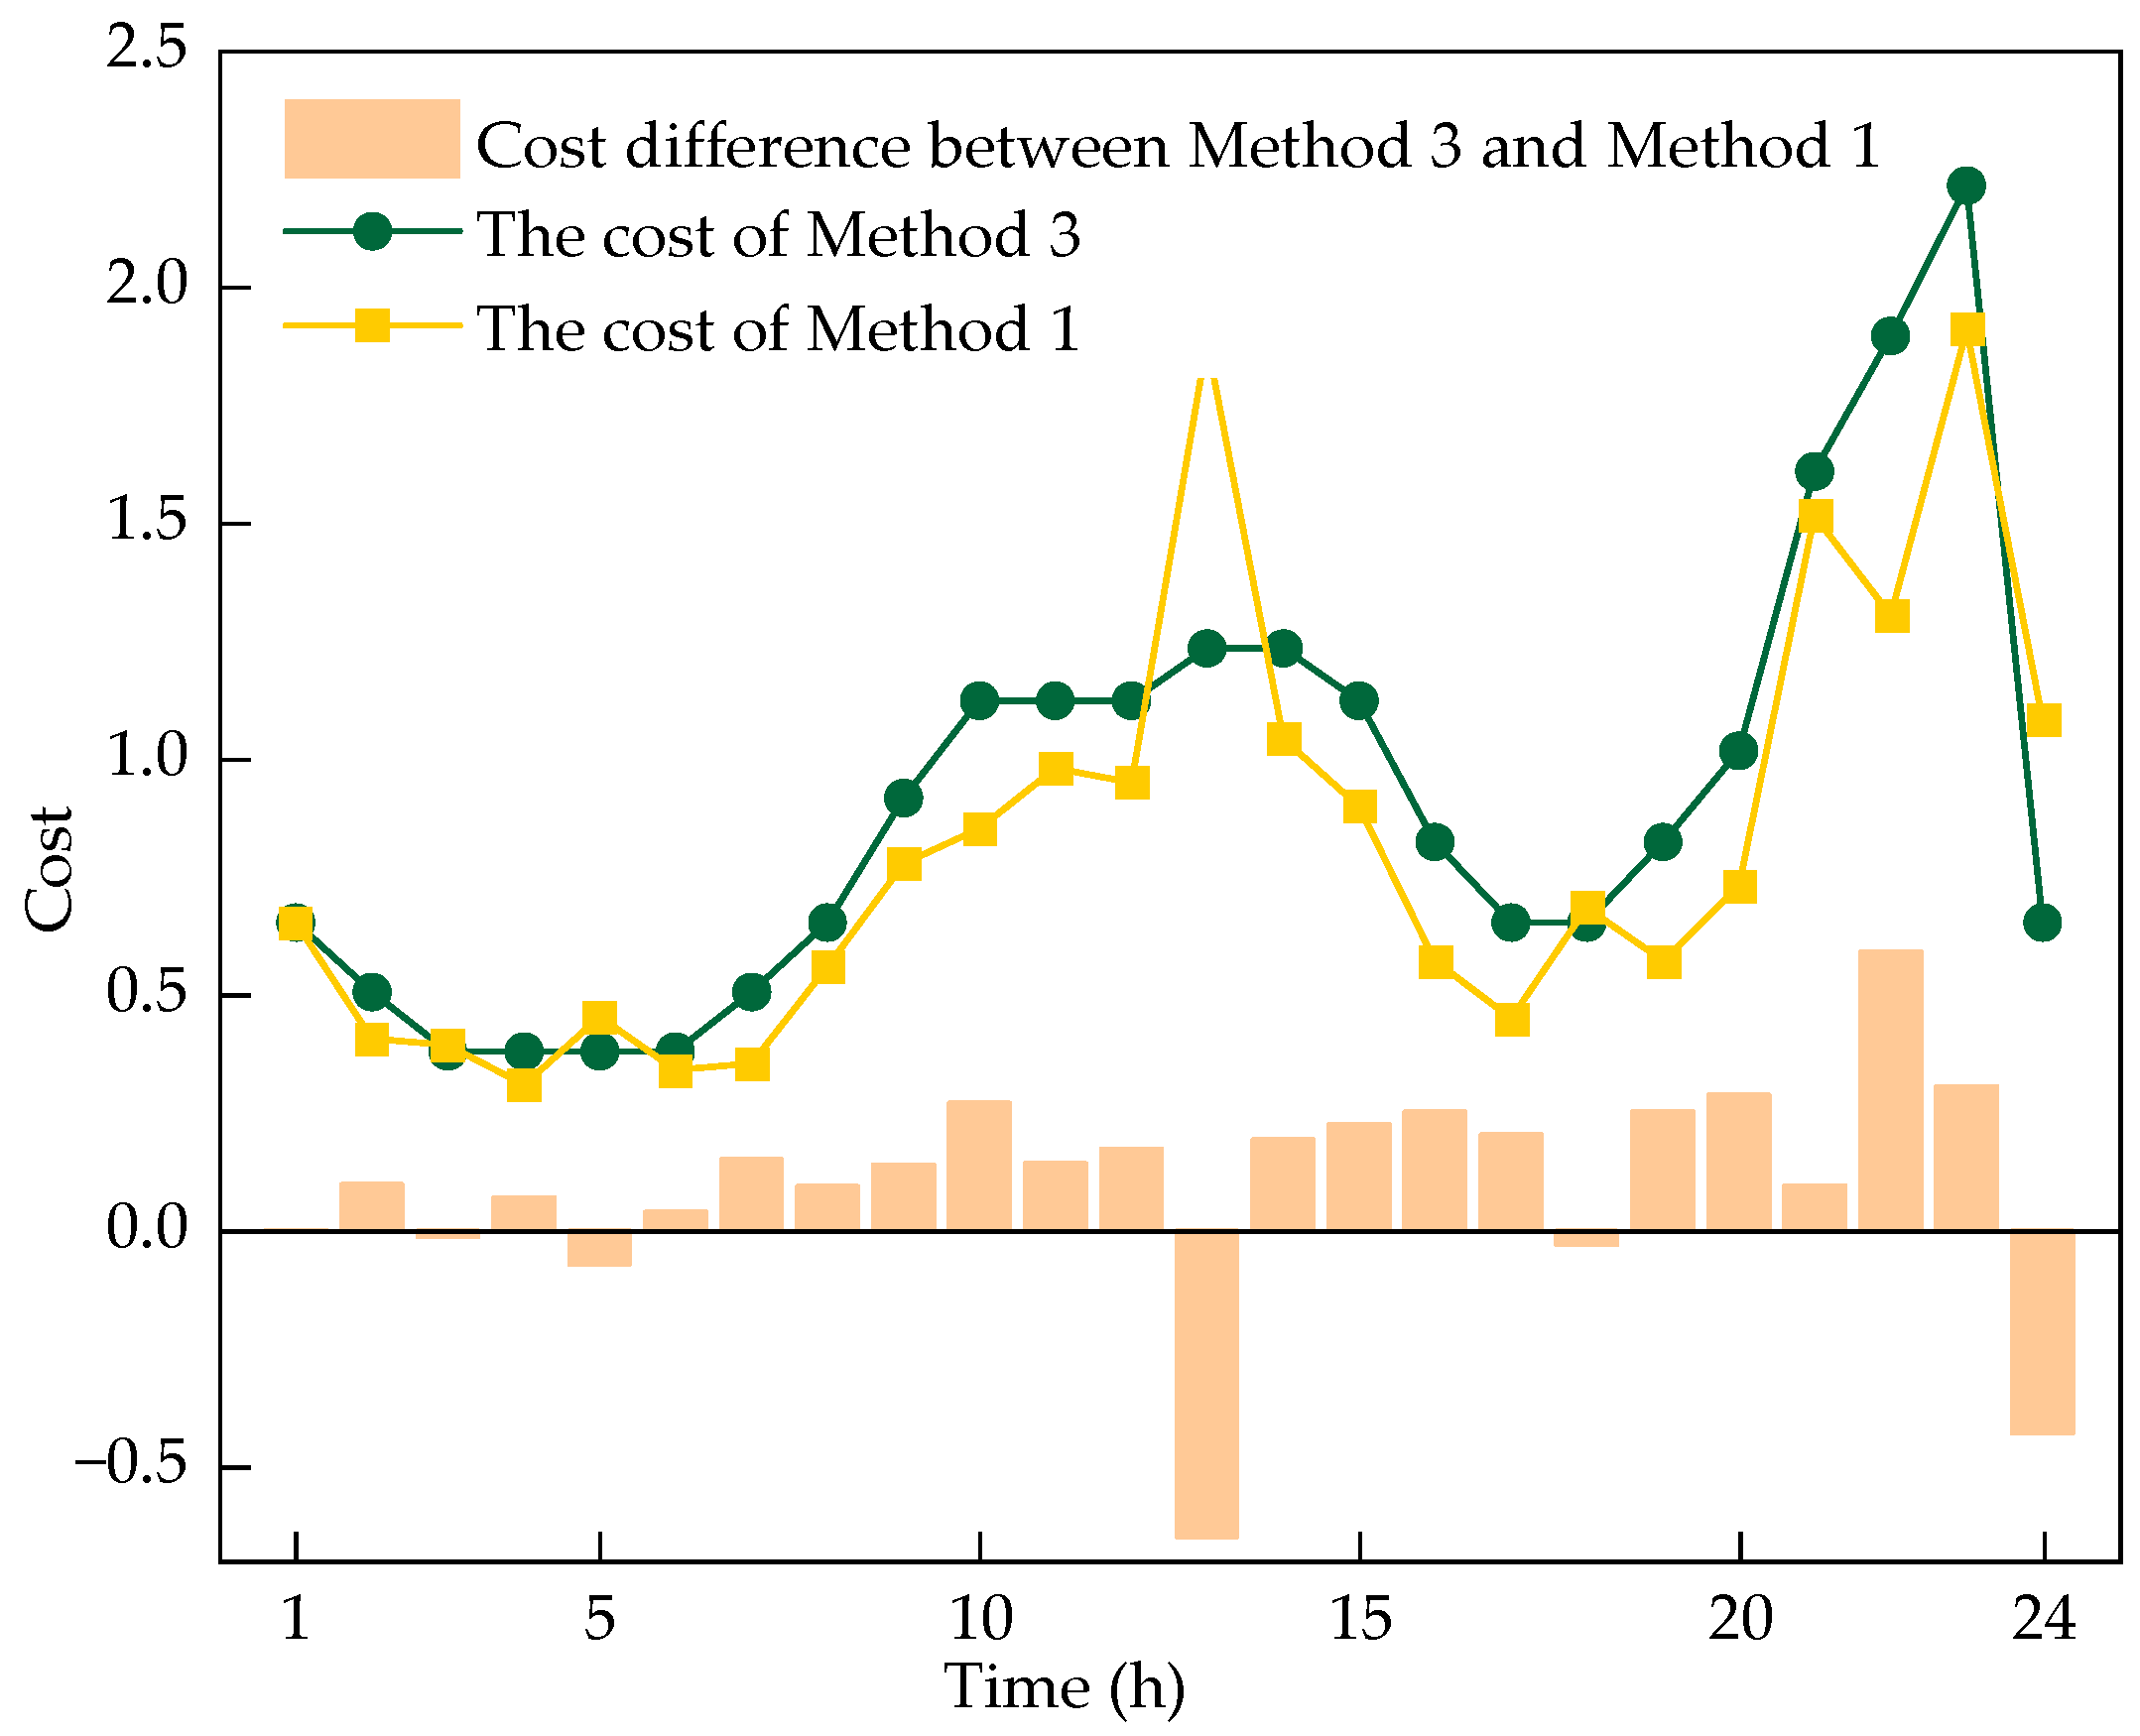
Compared with Method 3 without reactive equipment, it can be seen that the cost change trend of Method 1 and Method 3 is the same overall. During the peak load periods at 13:00 and 21:00, the line loss cost is high; at 2:00 during off-peak hours, the line loss is low. The line loss cost plus the switching cost of Method 1 is less than the loss cost of Method 3, indicating that adding reactive equipment for optimized scheduling can reduce the system loss and overall cost. The hourly system cost comparison obtained by Method 1 and Method 3 is shown in Figure 6.
Furthermore, when rounded to two decimal places, the cost obtained by Method 1 with the addition of a small resistance is USD 196,700.34; without the addition of the small resistance, the cost is USD 196,700.27. Taking the scenario without the small resistance as the benchmark, the relative error is 3.56 × 10⁻⁷. It can be seen that the introduction of a small perturbation does not affect the optimal solution.

5.2. Other Network

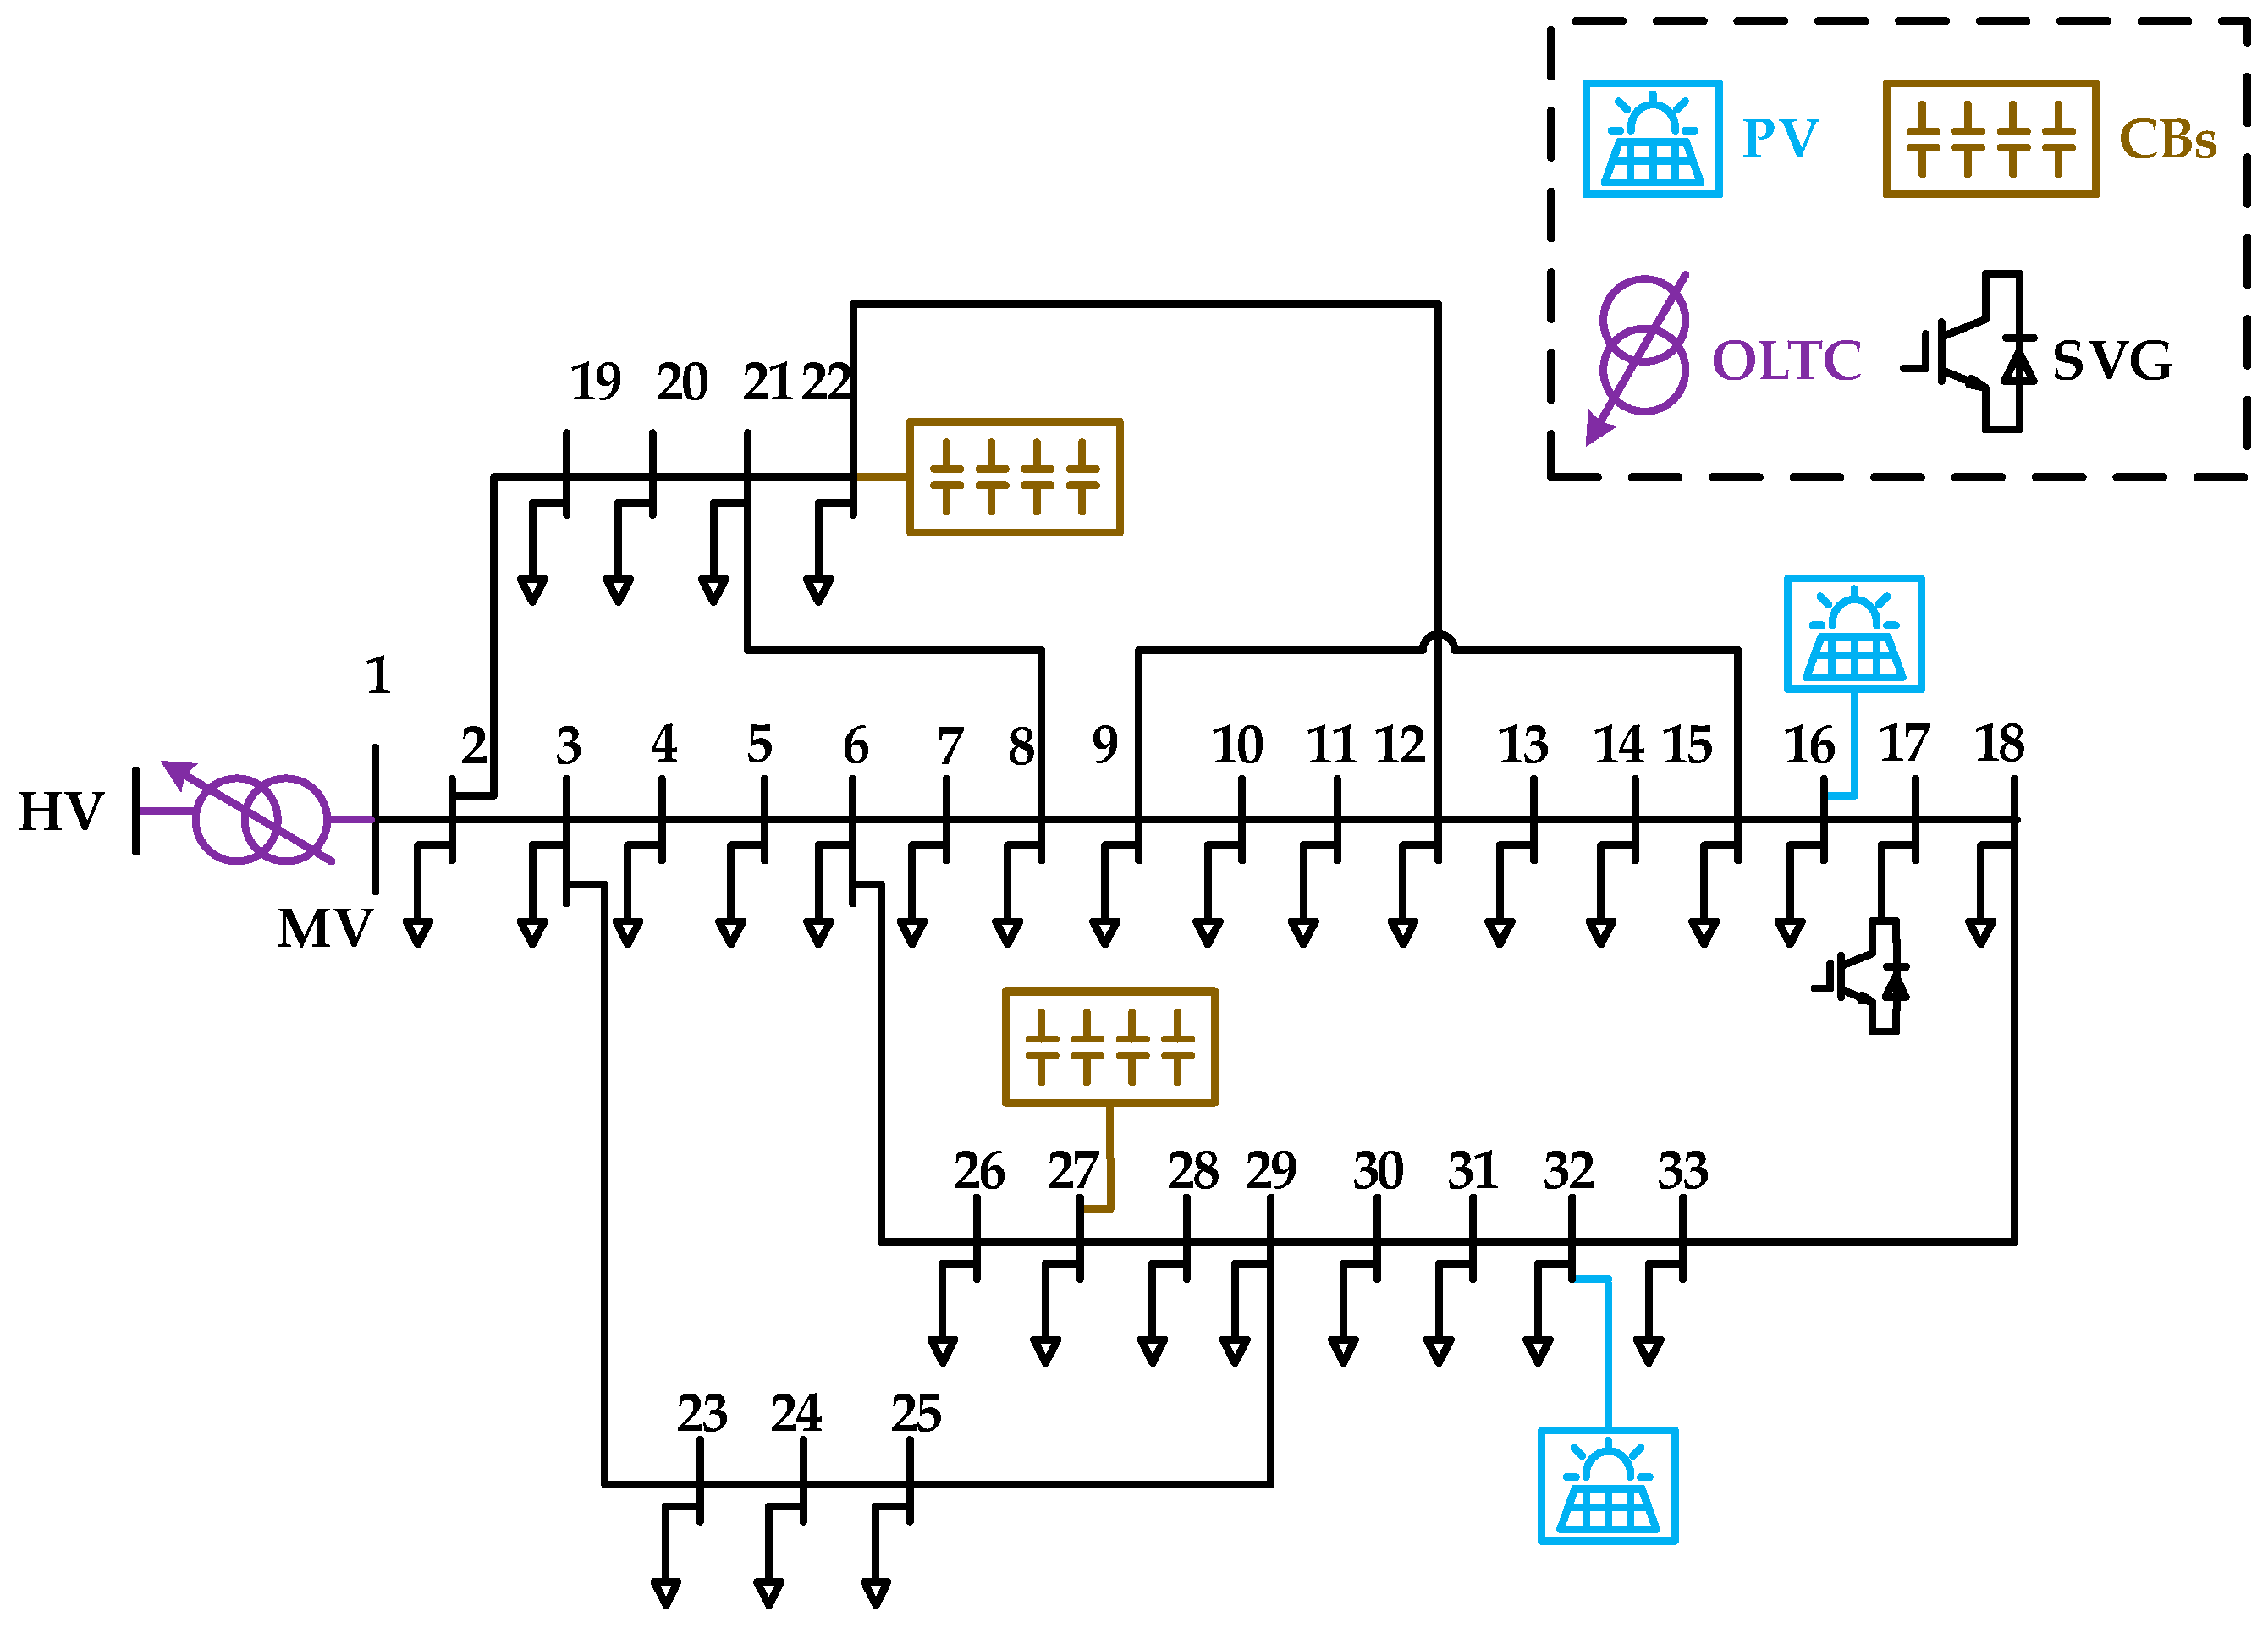
In addition to Case 9, this paper also uses Case 33 and Case 39 for testing. The Case 33 network used in this paper is shown in Figure 7, in which reactive power optimization equipment is added.
The locations of the equipment in Case 33 are shown in Table 2. The locations of the equipment in Case 39 are shown in Table 3.
Assume that the number of groups that can be switched in each group of CBs is between 0 and 7, and the voltage range of OLTC is from 1 to 1.15, with a tap setting of 0.05. The load still fluctuates using the typical daily load curve in Figure 3.
Since Gurobi uses the branch and bound method to solve MISOCP, and the time complexity of the branch and bound method increases exponentially with the increase in discrete variables, the solution time increases exponentially. At the same time, Example 1 proves that the solution relaxation gap obtained by Method 2 is large, so this example only explains the results of Method 1.
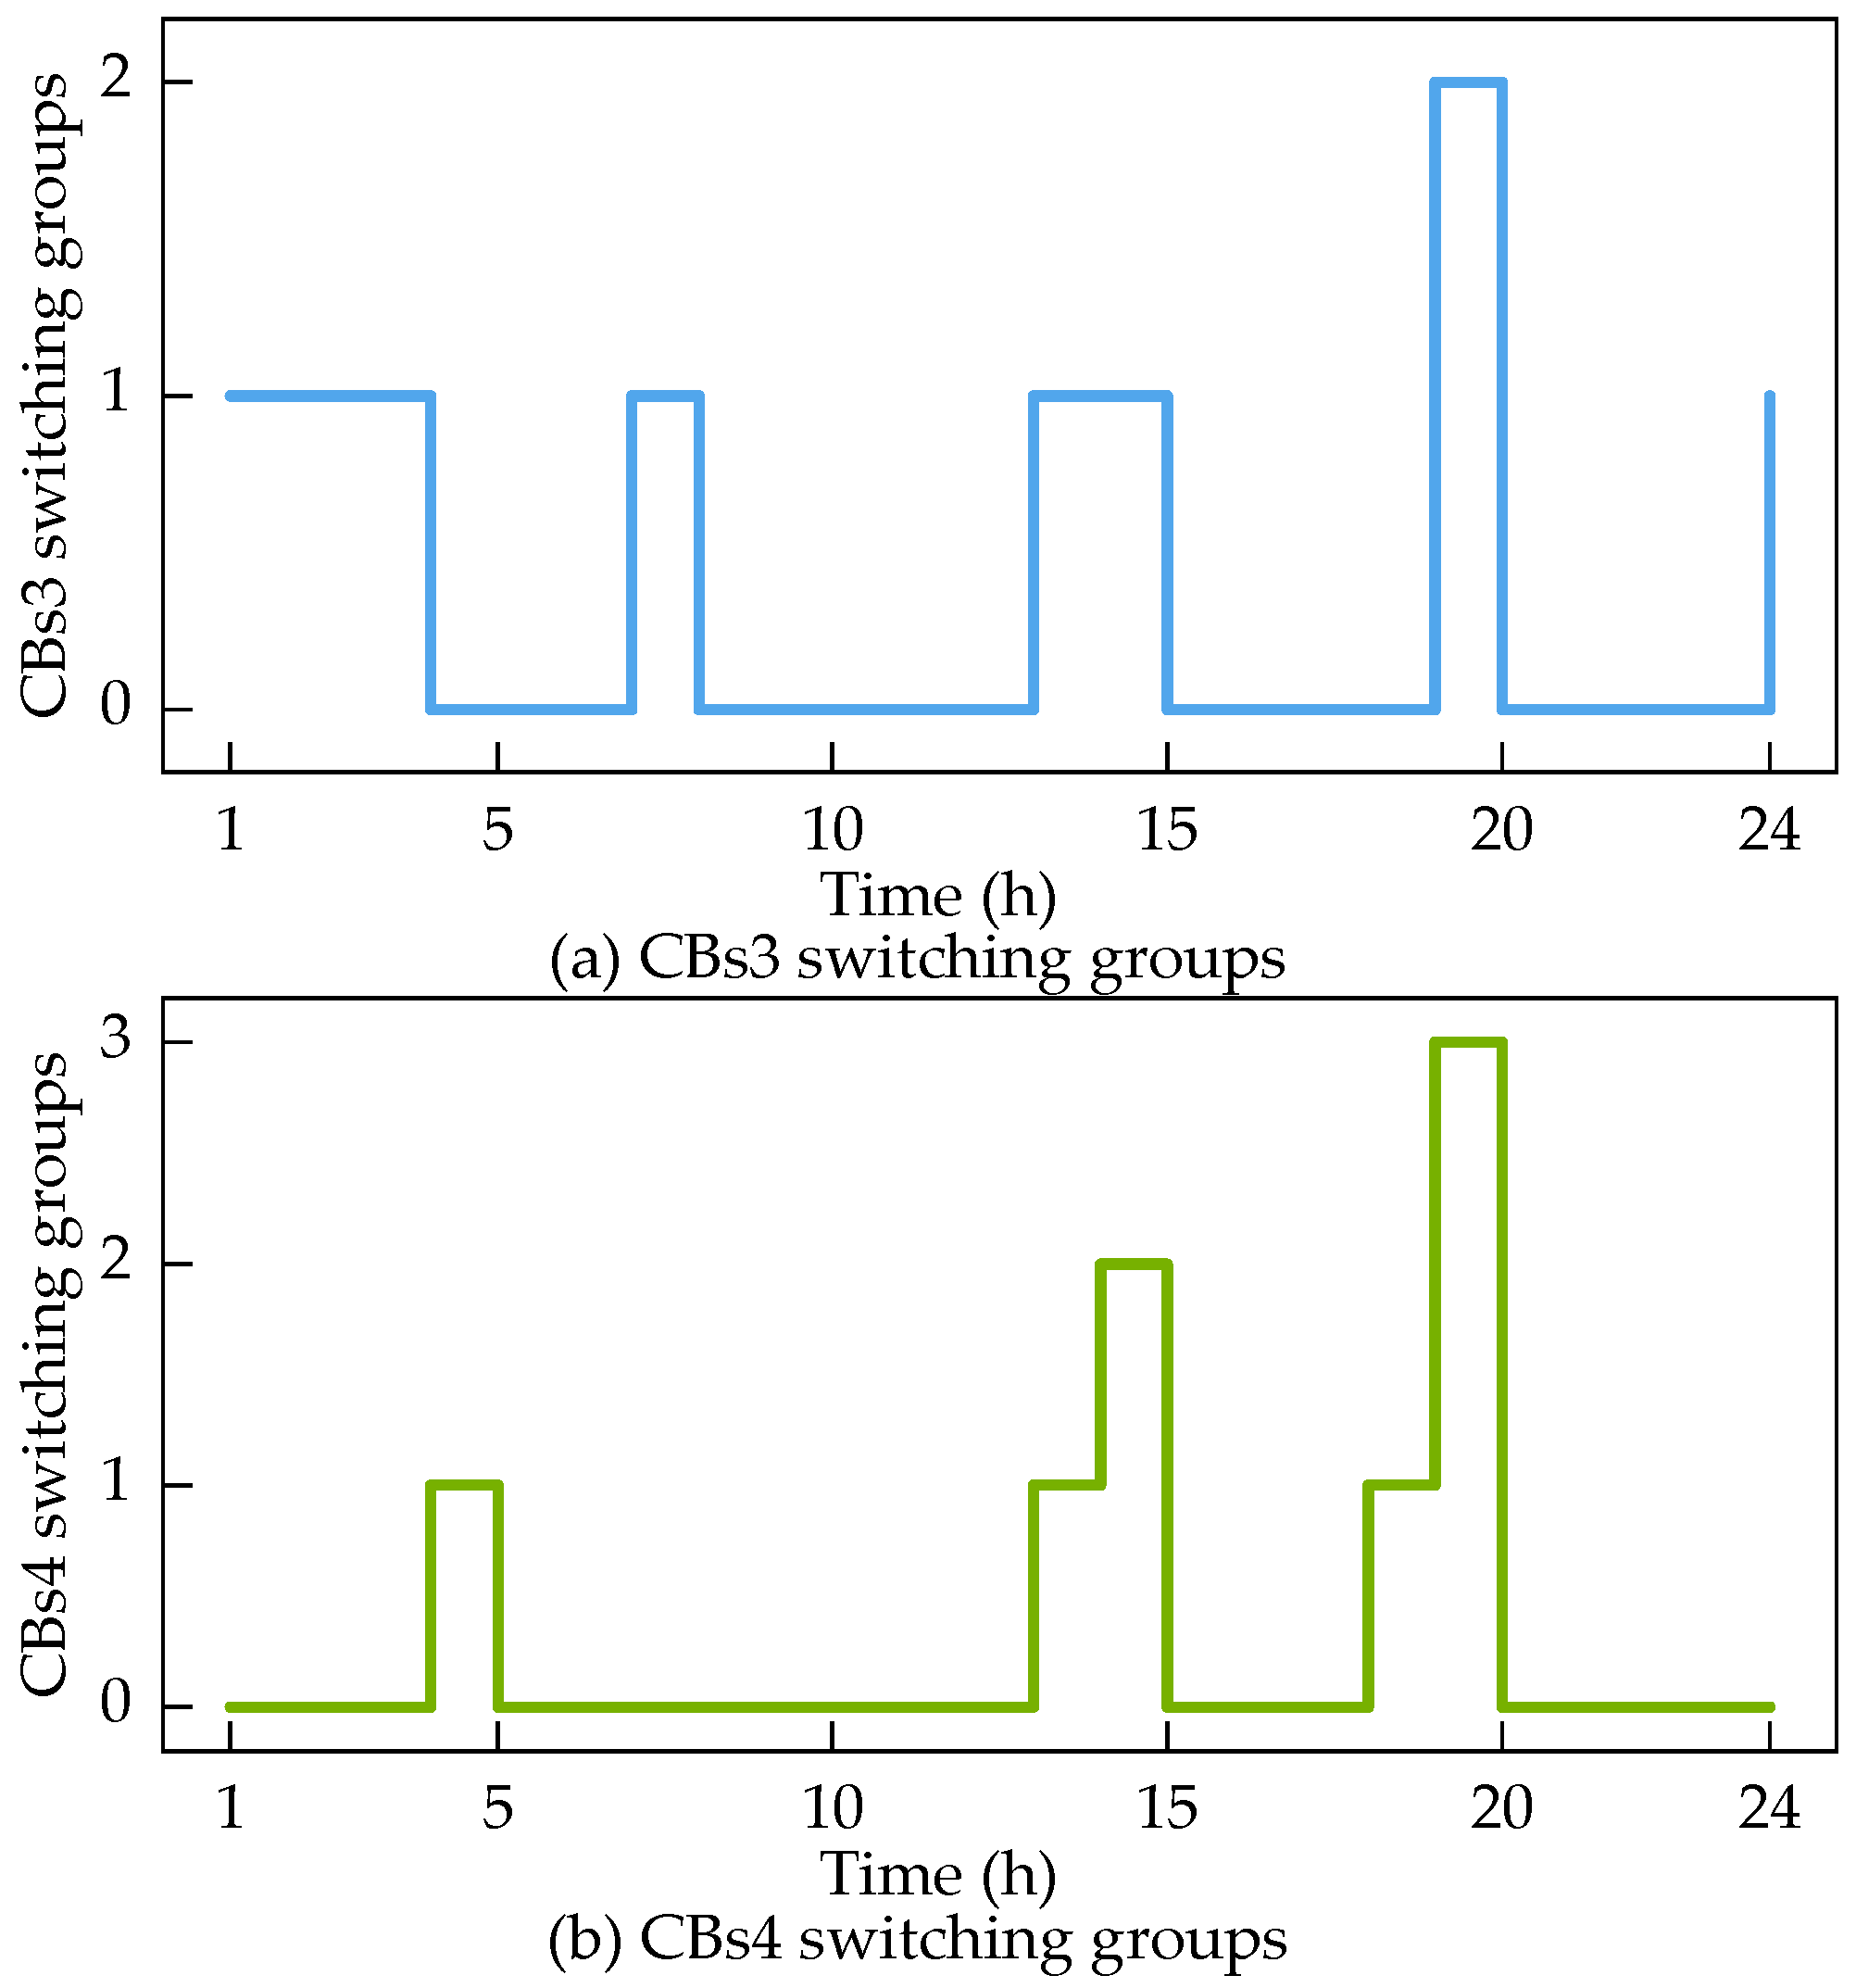
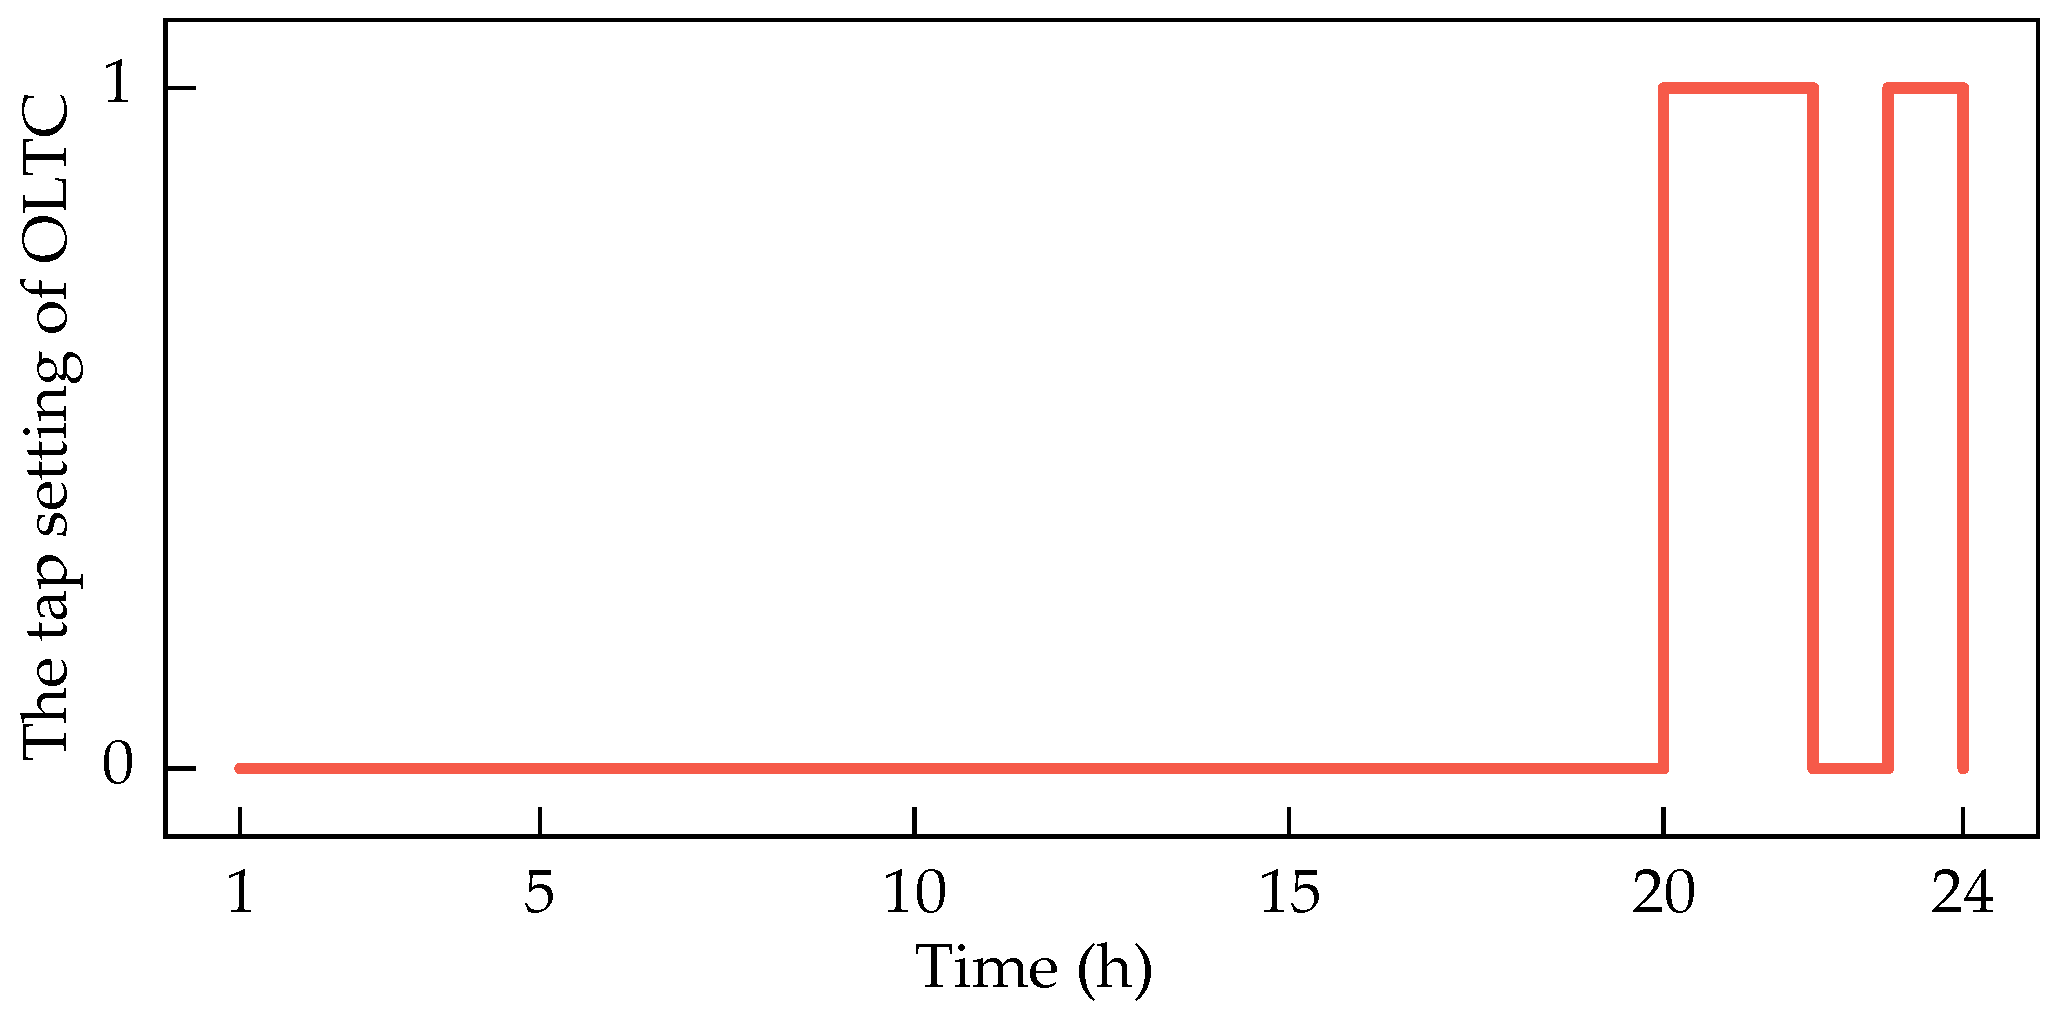
For Case 33, the action of CBs at node 15 is shown in Figure 8a, and the action of CBs at node 19 is shown in Figure 8b. The CBs of the remaining nodes are all inactive. The action of OLTC calculated by Method 1 is shown in Figure 9.
For Case 39, the action of CBs at node 7 is shown in Figure 10a, and the action of CBs at node 15 is shown in Figure 10b. The CBs of the remaining nodes are all inactive. The action of OLTC calculated by Method 1 is shown in Figure 11.
For Case 33, the cost obtained by Method 1 is USD 84,000, and the cost obtained by Method 3 is USD 222,000. For Case 39, the cost obtained by Method 1 is USD 20,668, and the cost obtained by Method 3 is USD 27,738. These fully demonstrate the effectiveness of Method 1.

6. Conclusions

This paper establishes the reactive power optimization problem of the mesh distribution network, which is a mixed integer nonlinear problem. This paper transforms this problem into a semidefinite programming problem. Since the current commercial solvers cannot directly solve the SDP problem with integer variables, this paper transforms the discrete variables in the OLTC and CBs models into equality constraints of quadratic equations, and uses a binary method to reduce the number of discrete variables. Finally, the rank-one constraint is restored by the Iterative Optimization-based Gaussian Randomization method to obtain the solution to the original problem. Taking Case 9 as an example, on the one hand, the maximum GAP obtained by the SOCP method is 0.847, while the maximum error of the methodology proposed in this paper is only 5.91 × 10⁻⁵. This indicates that compared with the SOCP method, the algorithm relaxation of the proposed methodology is more accurate, and it can satisfy both the unit safety constraints and AC power flow constraints. On the other hand, when no reactive power equipment is incorporated, the system cost is USD 220,600; when reactive power equipment is incorporated, the system cost is USD 196,700. This shows that compared with the scenario without reactive power equipment, the system cost derived from the proposed methodology is lower, and reactive power optimal dispatching can reduce the system cost. In the future, research can focus on the selection of initial iteration values. This is because a properly selected initial iteration point can reduce the number of iterations of the methodology proposed in this paper.

Author Contributions

Conceptualization, B.X.; Methodology, M.L.; Validation, Y.L.; Formal analysis, Y.Z., P.C., B.Z., T.L., Y.L. and Z.D.; Writing—review & editing, M.L. All authors have read and agreed to the published version of the manuscript.

Funding

This research was funded by the China Southern Power Grid C (Grant Number: 030100KC23110092). The APC was funded by the same project.

Data Availability Statement

The original contributions presented in this study are included in the article. Further inquiries can be directed to the corresponding author.

Conflicts of Interest

Authors Binbin Xu, Peijie Cong and Bo Zhu were employed by the company Guangzhou Power Supply Bureau, Guangdong Power Grid Co., Ltd. Authors Yilin Zhong and Tao Liu were employed by the company China Southern Power Grid Electric Power Research Institute Co., Ltd. The remaining authors declare that the research was conducted in the absence of any commercial or financial relationships that could be construed as a potential conflict of interest.

Abbreviations

The following abbreviations are used in this manuscript:
V i , t The voltage of OLTC at node i at time t
s i , t The tap setting of OLTC at time t
P O L T C i , t OLTC output active power at time t
Q O L T C i , t OLTC output reactive power at time t
Q C B i , t Reactive power generated by CBs at node i at time t
N C B i , t Number of CBs put into operation at node i at time t
P D G i , t Active power generated by DG at node i at time t
Q D G i , t Reactive power generated by DG at node i at time t
Q S V G i , t Reactive power generated by SVG at node i at time t
C l Line loss cost of the system
C O OLTC switching cost
C B Switching cost of CBs
e i , t Real part of the voltage at node i at time t
f j , t Imaginary part of the voltage at node i at time t
G i j Real part of the admittance between node i and node j
B i j Imaginary part of the admittance between node i and node j
I l m Line current from node l to node m
X t Voltage matrix
S t OLTC matrix variables
C t CBs matrix variables
V 0 OLTC voltage base value
Δ V OLTC voltage regulation for each tap
P O L T C i max OLTC output active power maximum
P O L T C i min OLTC output active power minimum
Q O L T C i max OLTC output reactive power maximum
Q O L T C i min OLTC output reactive power minimum
Q 0 Reactive power that can be generated by each group of capacitors
P D G i max DG can generate active power upper limit
P D G i min DG can generate active power lower limit
Q D G i max DG can generate reactive power upper limit
Q D G i min DG can generate reactive power lower limit
Q S V G i max SVG can generate reactive power upper limit
Q S V G i min SVG can generate reactive power lower limit
T Time period
α 1 Unit network loss cost
α 2 Unit switching cost of OLTC
α 3 Unit switching cost of CBs
V i max Maximum value of voltage at node i
V i min Minimum value of voltage at node i
S l m max Maximum transmission capacity of lm branch
R l m Line resistance from node l to node m
Y i Self-admittance at node i
Re( )Real part calculation
Im( )Imaginary part calculation
Tr( )Matrix trace calculation
rank( )Calculate the rank of a matrix
λ max , t ( ) Calculate the maximum eigenvalue of a matrix

Appendix A

Define a set of basis vectors e 1 , e 2 , , e n in space R n . For each node i in a given power system, define the following matrix:
Y i = e i e i T Y
Y i = 1 2 Re Y i + Y i T Im Y i T Y i Im Y i Y i T Re Y i + Y i T
Y ¯ i = 1 2 Im Y i + Y i T Re Y i Y i T Re Y i T Y i Im Y i + Y i T

References

  1. Luo, S.; Hu, W.; Liu, W.; Xu, X.; Huang, Q.; Chen, Z.; Lund, H. Transition pathways towards a deep decarbonization energy system—A case study in Sichuan, China. Appl. Energy 2021, 302, 117507. [Google Scholar] [CrossRef]
  2. Zhao, Y.; Zhang, G.; Hu, W.; Huang, Q.; Chen, Z.; Blaabjerg, F. Meta-Learning Based Voltage Control for Renewable Energy Integrated Active Distribution Network Against Topology Change. IEEE Tran. Power Syst. 2023, 38, 5937–5940. [Google Scholar] [CrossRef]
  3. Zhang, G.; Hu, W.; Zhao, J.; Cao, D.; Chen, Z.; Blaabjerg, F. A novel deep reinforcement learning enabled multi-band PSS for multi-mode oscillation control. IEEE Trans. Power Syst. 2021, 36, 3794–3797. [Google Scholar] [CrossRef]
  4. Xu, X.; Zhang, H.; Li, C.; Liu, Y.; Li, W.; Terzija, V. Optimization of the event-driven emergency load-shedding considering transient security and stability constraints. IEEE Trans. Power Syst. 2017, 32, 2581–2592. [Google Scholar] [CrossRef]
  5. Cao, D.; Hu, W.; Zhao, J.; Huang, Q.; Chen, Z.; Blaabjerg, F. Amulti-agent deep reinforcement learning based voltage regulation using coordinated PV inverters. IEEE Trans. Power Syst. 2020, 35, 4120–4123. [Google Scholar] [CrossRef]
  6. Win, T.S.; Hisada, Y.; Tanaka, T.; Hiraki, E.; Okamoto, M.; Lee, S.R. Novel Simple Reactive Power Control Strategy with DC Capacitor Voltage Control for Active Load Balancer in Three-Phase Four-Wire Distribution Systems. IEEE Trans. Ind. Appl. 2015, 51, 4091–4099. [Google Scholar] [CrossRef]
  7. Akagi, H.; Kanazawa, Y.; Nabae, A. Instantaneous reactive power compensators comprising switching devices without energy storage components. IEEE Trans. Ind. Appl. 1984, IA-20, 625–630. [Google Scholar] [CrossRef]
  8. Peng, F.Z.; Ott, G.; Adams, D. Adams. Harmonic and reactive power compensation based on the generalized instantaneous reactive power theory for the three-phase four-wire systems. IEEE Trans. Power Electron. 1998, 13, 1174–1181. [Google Scholar] [CrossRef]
  9. Santoso, S. On Determining the Relative Location of Switched Capacitor Banks. IEEE Trans. Power Del. 2007, 22, 1108–1116. [Google Scholar] [CrossRef]
  10. Lehmann, K.; Grastien, A.; Van Hentenryck, P. AC-feasibility on tree networks is NP-hard. IEEE Trans. Power Syst. 2016, 31, 798–801. [Google Scholar] [CrossRef]
  11. Rabiee, A.; Parniani, M. Voltage security constrained multi-period optimal reactive power flow using benders and optimality condition de compositions. IEEE Trans. Power Syst. 2013, 28, 696–708. [Google Scholar] [CrossRef]
  12. Sharif, S.; Taylor, J. MINLP formulation of optimal reactive power flow. In Proceedings of the 1997 American Control Conference, Albuquerque, NM, USA, 4–6 June 1997; Volume 3, pp. 1974–1978. [Google Scholar]
  13. Iba, K. Reactive power optimization by genetic algorithm. IEEE Trans. Power Syst. 1994, 9, 685–692. [Google Scholar] [CrossRef]
  14. da Silva, A.A.; Abrão, P.J. Application of evolutionary computation in electric power systems. In Proceedings of the International Congress on Evolutionary Computation, Honolulu, HI, USA, 2–17 May 2002; pp. 1057–1062. [Google Scholar]
  15. Kennedy, J.; Eberhart, R.C. Particle swarm optimization. In Proceedings of the International Conference on Neural Networks, Perth, WA, Australia, 27 November–1 December 1995; pp. 1942–1948. [Google Scholar]
  16. Zhao, B.; Guo, C.X.; Cao, Y.J. A multiagent-based particle swarm optimization approach for optimal reactive power dispatch. IEEE Trans. Power Syst. 2005, 20, 1070–1078. [Google Scholar] [CrossRef]
  17. Yoshida, H.; Kawata, K.; Fukuyama, Y.; Takayama, S.; Nakanishi, Y. A particle swarm optimization for reactive power and voltage control considering voltage security assessment. IEEE Trans. Power Syst. 2000, 15, 1232–1239. [Google Scholar] [CrossRef]
  18. Bakare, G.A.; Krost, G.; Venayagamoorthy, G.K.; Aliyu, U.O. Differential Evolution Approach for Reactive Power Optimization of Nigerian Grid System. In Proceedings of the 2007 IEEE Power Engineering Society General Meeting, Tampa, FL, USA, 24–28 June 2007; pp. 1–6. [Google Scholar]
  19. Zhang, W.; Liu, Y.; Clerc, M. An adaptive PSO algorithm for reactive power optimization. In Proceedings of the 2003 Sixth International Conference on Advances in Power System Control, Operation and Management ASDCOM 2003 (Conf. Publ. No. 497), Hong Kong, China, 11–14 November 2003; pp. 302–307. [Google Scholar]
  20. Park, S.; Chen, W.; Mak, T.W.; Van Hentenryck, P. Compact Optimization Learning for AC Optimal Power Flow. IEEE Tran. Power Syst. 2023, 39, 4350–4359. [Google Scholar] [CrossRef]
  21. Han, L.; Liu, B. Optimal Power Flow Calculation Method Based on Adaptive Artificial Frog Jumping Foraging Algorithm. Chang. Inf. Commun. 2024, 37, 34–36. [Google Scholar]
  22. Wu, X.; Guo, S.; Dai, W. Feature Dimension Reduction and Partitioning Based Deep Learning Method for Probabilistic Optimal Power Flow of Transmission Network. Electr. Power Autom. Equip. 2023, 43, 174–180. [Google Scholar]
  23. Jabr, R.A. Radial distribution load flow using conic programming. IEEE Trans. Power Syst. 2006, 21, 1458–1459. [Google Scholar] [CrossRef]
  24. Lavaei, J.; Low, S.H. Zero Duality Gap in Optimal Power Flow Problem. IEEE Trans. Power Syst. 2012, 27, 92–107. [Google Scholar] [CrossRef]
  25. Lv, C.X.; Liang, R.; Zhang, G.; Zhang, X.T.; Jin, W. Energy accommodation-oriented interaction of active distribution network and central energy station considering soft open points. Energy 2023, 268, 126574. [Google Scholar] [CrossRef]
  26. Low, S.H. Convex relaxation of optimal power flow part II: Exactness. IEEE Trans. Control Netw. Syst. 2014, 1, 177–189. [Google Scholar] [CrossRef]
  27. Jha, R.R.; Dubey, A. Exact distribution optimal power flow (D-OPF) model using convex iteration technique. In Proceedings of the 2019 IEEE Power & Energy Society General Meeting, Atlanta, GA, USA, 4–8 August 2019; pp. 1–5. [Google Scholar]
  28. Low, S.H. Convex Relaxation of Optimal Power Flow—Part I: Formulations and Equivalence. IEEE Trans. Control Netw. Syst. 2014, 1, 15–27. [Google Scholar] [CrossRef]
  29. Chen, K.; Wu, W.; Zhang, B.; Djokic, S.; Harrison, G.P. A Method to Evaluate Total Supply Capability of Distribution Systems Considering Network Reconfiguration and Daily Load Curves. IEEE Trans. Power Syst. 2016, 31, 2096–2104. [Google Scholar] [CrossRef]
  30. Novara, C.; Formentin, S. Data-Driven Inversion-Based Control of Nonlinear Systems with Guaranteed Closed-Loop Stability. IEEE Trans. Auto. Cont. 2018, 63, 1147–1154. [Google Scholar] [CrossRef]
  31. Zhou, P.; Wang, X.; Rao, R. Asymptotic Capacity of Infrastructure Wireless Mesh Networks. IEEE Trans. Mob. Comput. 2008, 7, 1011–1024. [Google Scholar] [CrossRef]
  32. Bruno, R.; Conti, M.; Gregori, E. Mesh Networks: Commodity Multihop ad hoc Networks. IEEE Comm. Mag. 2005, 43, 123–131. [Google Scholar] [CrossRef]
  33. Akyildiz, I.F.; Wang, X.; Wang, W. Wireless Mesh Networks: A Survey. Comput. Netw. J. 2005, 47, 445–487. [Google Scholar] [CrossRef]
  34. Josz, C.; Maeght, J.; Panciatici, P.; Gilbert, J.C. Application of the Moment-SOS Approach to Global Optimization of the OPF Problem. IEEE Trans. Power Syst. 2015, 30, 463–470. [Google Scholar] [CrossRef]
  35. Yu, X.; Shen, J.-C.; Zhang, J.; Letaief, K.B. Alternating Minimization Algorithms for Hybrid Precoding in Millimeter Wave MIMO Systems. IEEE J. Sel. Top. Signal Process 2016, 10, 485–500. [Google Scholar] [CrossRef]
  36. Shi, Y.; Tuan, H.D.; Tuy, H.; Su, S. Global optimization for optimal power flow over transmission networks. J. Glob. Optim. 2017, 69, 745–760. [Google Scholar] [CrossRef]
  37. Xu, T.; Ding, T.; Li, L.; Wang, K.; Chi, F.; Gao, H. Second-order cone relaxation model adapting to reactive power optimization for three-phase unbalanced active distribution network. Autom. Electr. Power Syst. 2021, 45, 81–88. [Google Scholar]
  38. Luo, Z.Q.; Ma, W.K.; So, A.M.C.; Ye, Y.; Zhang, S. Semidefinite Relaxation of Quadratic Optimization Problems. IEEE Signal Process. Mag. 2010, 27, 20–34. [Google Scholar] [CrossRef]
  39. Zimmerman, R.D.; Murillo-Sanchez, C.E.; Thomas, R.J. MAT POWER: Steady-state operations, planning, and analysis tools for power systems research and education. IEEE Trans. Power Syst. 2011, 26, 12–19. [Google Scholar] [CrossRef]
Figure 1. The diagram of the transformer structure.
Energies 18 05469 g001
Figure 2. IOGRM flow chart.
Energies 18 05469 g002
Figure 3. Typical daily load curve.
Energies 18 05469 g003
Figure 4. OLTC tap setting change diagram in Case 9.
Energies 18 05469 g004
Figure 5. Changes in the number of CBs switching groups in Case 9.
Energies 18 05469 g005
Figure 6. Case 9 cost comparison of different methods.
Energies 18 05469 g006
Figure 7. Case 33 network connection diagram.
Energies 18 05469 g007
Figure 8. Changes in the number of CBs switching groups in Case 33.
Energies 18 05469 g008
Figure 9. OLTC tap setting change diagram in Case 33.
Energies 18 05469 g009
Figure 10. Changes in the number of CBs switching groups in Case 39.
Energies 18 05469 g010
Figure 11. OLTC tap setting change diagram in Case 39.
Energies 18 05469 g011
Table 1. Case 9 device location node.
EquipmentLocation
SVG3, 4
DGs2, 3
CBs7, 9
OLTC1
Table 2. Case 33 device location node.
EquipmentLocation
SVG3, 14, 22
DGs2, 3, 5, 8, 13, 17, 20, 24, 29, 31
CBs7, 9, 15, 19, 27
OLTC1
Table 3. Case 39 device location node.
EquipmentLocation
SVG3, 14, 22
DGs30, 31, 32, 33, 34, 35, 36, 37, 38, 39
CBs7, 9, 15
OLTC1
Disclaimer/Publisher’s Note: The statements, opinions and data contained in all publications are solely those of the individual author(s) and contributor(s) and not of MDPI and/or the editor(s). MDPI and/or the editor(s) disclaim responsibility for any injury to people or property resulting from any ideas, methods, instructions or products referred to in the content.