Abstract
Hydrogen-based technologies, prominently fuel cells, are emerging as strategic solutions for decarbonization. They offer an efficient and clean alternative to fossil fuels for electricity generation, making a tangible contribution to the European Green Deal climate objectives. The primary issue is the production and transportation of hydrogen. An on-site hydrogen production system that includes CO2 capture could be a viable solution. The proposed power system integrates an internal combustion engine (ICE) with a steam methane reformer (SMR) equipped with a CO2 capture and energy storage system to produce “blue hydrogen”. The hydrogen fuels a high-temperature polymer electrolyte membrane (HT-PEM) fuel cell. A battery pack, incorporated into the system, manages rapid fluctuations in electrical load, ensuring stability and continuity of supply and enabling the fuel cell to operate at a fixed point under nominal conditions. This hybrid system utilizes natural gas as its primary source, reducing climate-altering emissions and representing an efficient and sustainable solution. The simulation was conducted in two distinct environments: Thermoflex code for the integration of the engine, reformer, and CO2 capture system; and Matlab/Simulink for fuel cell and battery pack sizing and dynamic system behavior analysis in response to user-demanded load variations, with particular attention to energy flow management within the simulated electrical grid. The main results show an overall efficiency of the power system of 39.9% with a 33.5% reduction in CO2 emissions compared to traditional systems based solely on internal combustion engines.
1. Introduction
In recent decades, the increasing pressure to reduce greenhouse gas (GHG) emissions and transition towards a sustainable energy system has driven research towards the development of innovative technologies for energy production and utilization. In this regard, in 2019, the European Council approved a strategy known as the “Green Deal,” whose primary objective is to achieve a reduction in GHG emissions of at least 55% by 2030 compared to 1990 levels, aiming for climate neutrality by 2050 [1]. In this scenario, hydrogen-based technologies, primarily Fuel Cells, are emerging as strategic solutions for decarbonization. They offer an efficient and clean alternative to fossil fuels, significantly contributing to the climate objectives outlined by the European Green Deal. It should be noted that, unlike fossil fuels, which occur naturally, hydrogen is not available in significant quantities in nature and must always be produced as an energy carrier. Although currently about 96% of global hydrogen production still relies on fossil fuels, the long-term trend is to progressively increase the share of green hydrogen obtained from renewable electricity, as this pathway is carbon-neutral and consistent with global decarbonization strategies. In order to mitigate the negative impacts of fossil fuel use, a large-scale shift towards renewable energy sources is essential. Nevertheless, renewable resources are inherently intermittent and geographically distributed, which creates mismatches between the timing and location of energy generation and end-user demand. Addressing these challenges requires the deployment of suitable energy conversion and storage technologies to ensure stability and flexibility of power grids [2]. In this context, hydrogen represents a promising energy vector, since electrolysis not only provides a route for carbon-free hydrogen production but also contributes to mitigating the intermittency of renewable sources by coupling energy conversion and storage functions. At the same time, hydrogen derived from natural gas via steam reforming technology accounts for the largest share (48%) due to the widespread availability of this hydrocarbon coupled with the presence of established transport and distribution infrastructures. Furthermore, the high thermal energy demand of the reformer makes this technology suitable for integration with internal combustion engines, facilitating the retrofit of existing thermal plants.
However, it is essential that hydrogen production occurs through low-environmental-impact processes to ensure that the benefits derived from its utilization are not offset by significant emissions during the generation phase of the energy carrier itself. The production of green hydrogen could be increased from water electrolysis powered by renewable electricity. While this process is the most environmentally advantageous, its large-scale adoption is currently limited by two main factors: the high cost of the technology and the limited availability of renewable energy. Conversely, hydrogen produced from fossil sources without adequate emission control systems, termed gray hydrogen, contributes significantly to CO2 emissions. Steam Methane Reforming (SMR) is currently the most widespread technology globally, accounting for approximately 48% of global production [3,4,5]. The use of Carbon Capture and Storage (CCS) technologies mitigates the environmental impact, leading to the production of ‘blue’ hydrogen, characterized by a significantly reduced emission profile compatible with global sustainability goals.
Several studies propose the use of proton-exchange membrane fuel cells (PEMFCs) in cogenerating power plants, with some also investigating on-site hydrogen production to power them. In the field of micro-cogeneration, applicable in various sectors, such as residential and industrial ones, PEMFCs are considered an emerging alternative to combustion-based cogeneration systems. This is due to their high-power density, high efficiency, and fast response to load variations.
Wang et al. [6] conducted a study on an innovative integrated system for power generation with on-site hydrogen production and heat recovery. The authors utilize a low-temperature PEMFC (LT-PEMFC), which operates at a steam-to-carbon ratio (S/C) of 3.0 and a steam reforming temperature of 700 °C. With a hydrogen utilization coefficient of 0.8 in the PEMFC, it is possible to generate an electrical power output of about 520 W. This setup achieves an energy efficiency of 47.4%. A significant challenge, however, is that low-temperature PEMFCs require highly pure hydrogen.
Jannelli et al. [7] conducted a comparative study on three configurations of PEMFC-based systems, each with a nominal electrical power output of 2.5 kW. The configurations analyzed include the following: an LT-PEMFC, operating at 67 °C; a high-temperature PEM (HT-PEMFC) operating at 160 °C; and a second HT-PEMFC that utilizes aromatic polyether-based copolymers with functionalized pyridine groups operating at 180 °C. The results of the study indicate that the high-temperature configurations offer superior performance compared to the low-temperature cell, achieving an electrical efficiency approaching 40% and a cogeneration fuel utilization index of approximately 79%.
Numerous studies have been conducted on plant architectures with fuel cells to evaluate the effect of key operating parameters on the overall system performance. Specifically, Nalbant et al. [8] developed a mathematical model of an integrated cogeneration system based on an HT-PEMFC. The system includes not only the cell stack but also the fuel reforming unit and the auxiliary components necessary for its operation. The main results show that as the steam-to-carbon ratio (S/C) increases, the electrical efficiency rises significantly, from 13.21% to 26.4%. Concurrently, a reduction is observed in both cogeneration efficiency (from 83.03% to 70.32%) and exergetic efficiency (from 43.2% to 30.3%). An increase in the cell’s operating temperature from 120 °C to 200 °C, however, leads to a 37.21% rise in electrical efficiency and an improvement in exergetic efficiency, which increases from 25.86% to 33.45%.
A similar parametric analysis was also conducted by Arsalis et al. [9], who evaluated the effect of key operating parameters on a 1 kWe residential micro-cogenerative plant (micro-CHP) based on HT-PEMFC technology. The analysis showed that the highest overall cogeneration efficiency, at 83.08%, was achieved when the fuel cell operated at a temperature of 180 °C, with a steam-to-carbon ratio of 4.5, a combustor temperature of 827 °C, and a hydrogen stoichiometric ratio of 1.3. This combination of operating parameters maximized the system’s yield, confirming the potential of HT-PEMFC technology for high-efficiency micro-CHP applications.
The analysis showed that the highest overall cogeneration efficiency was achieved when the fuel cell operated at a temperature of 180 °C, with a steam-to-carbon ratio of 4.5 and a combustor temperature of 827 °C. This combination of operating parameters maximized the system yield, confirming the potential of HT-PEMFC technology for high-efficiency micro-CHP applications.
Focusing on cogeneration systems for residential applications (Pe = 1 kW), a recent study [10] investigated a hybrid configuration. The system consists of a micro-cogeneration unit based on HT-PEMFC, coupled with an electric heat pump (EHP), which is powered by reformed natural gas. The HT-PEMFC stack is preceded by a natural gas steam reformer (SMR) subsystem and followed by a water-gas shift (WGS) reactor to reduce the CO content to a level compatible with the cell anode. Waste heat is recovered through a catalytic combustor and subsequent heat exchangers, which contribute to preheating the fuel and generating steam. The entire plant is interconnected with the electrical grid, allowing for bidirectional energy exchange. A similar plant was studied by Capuano et al. [11], who proposed a hybrid system for residential heating that couples an HT-PEMFC with an air source heat pump (ASHP) and an innovative thermal recovery strategy. The system is fueled by methane, which is converted into hydrogen through steam methane reforming to feed the fuel cell. In the residential sector, Najafi et al. [12] proposed a 30 kWe plant based on an HT-PEMFC and structured around an integrated process of methane reforming, electrochemical conversion, and thermal recovery.
To extend the analysis towards higher-power cogeneration solutions, hybrid configurations have been developed to maximize overall efficiency through the effective management of thermal effluents. In these systems, high-temperature fuel cells, such as HT-PEMs, are integrated with other technologies like reciprocating engines or organic Rankine cycles (ORCs). A study by Fan et al. [13] proposes the analysis and simulation of a 58.11 kWe cogeneration system. This system is fueled by hydrogen, which is produced on-site via steam methane reforming, with electrical generation provided by HT-PEMFC. The system is completed by an ORC, which is powered by the waste heat from the fuel cell. The on-site hydrogen production system starts with natural gas from the distribution grid. This process takes place in a reformer operating at 700 °C, followed by two water-gas shift (WGS) reactors: a high-temperature one (HT-WGS) at 350 °C and a low-temperature one (LT-WGS) at 200 °C. The methane is preheated to 400 °C and mixed with superheated steam at 500 °C. In the reformer, this mixture undergoes a strongly endothermic reaction, which is thermally supported by heat from a combustor. The combustor is fed almost exclusively by syngas from downstream of a membrane separator, which contains combustible gases like carbon monoxide and unreacted methane.
Leng et al. [14] developed a cogeneration plant of approximately 780 kWe based on the integration of an internal combustion engine and an HT-PEMFC. The electrical energy, approximately 39 kW, is generated by expanding the syngas in a turbine. The remaining portion is provided by the engine (271 kW) and the fuel cell (470 kW).
Examples of studies of hybrid plants with PEMFCs and SMRs also exist in the maritime sector [15]. The electrification of onboard systems and the adoption of hydrogen-based solutions, such as integrating internal combustion engines with fuel cells, are key strategies for achieving emissions reduction targets. However, the use of hydrogen systems on a naval scale is hindered by issues related to the storage and transport of the energy carrier, which lead to significant logistical complexity and costs. In this scenario, producing hydrogen directly on board through hydrocarbon reforming is proposed as an effective technical solution. The study by Lim et al. [16] highlights the possibility of using boil-off gas (BOG) generated in liquefied natural gas (LNG) tanks as a source for on-board hydrogen production. This hydrogen is then used in an HT-PEMFC stack to generate an additional amount of electrical power to operate the ship’s auxiliaries.
Based on findings from the scientific literature, the HT-PEMFC was selected over LT-PEMFC and SOFC technologies due to its favorable operating temperature (160–180 °C) and its tolerance to CO impurities up to about 1% [9], which makes it compatible with the SMR outlet gas composition after WGS and PSA treatment. LT-PEMFCs, although widely studied, require highly pure hydrogen (<10 ppm CO) [17] and suffer from water management issues at low operating temperatures, making their integration with reformers more complex and costly. SOFCs, on the other hand, operate at much higher temperatures (800–1000 °C) [18], which are not compatible with the exhaust gas temperatures of the ICE and suffer from slow start-up dynamics, limiting their applicability in compact hybrid systems. Therefore, the HT-PEMFC was considered the most rational option for the present architecture.
According to the current state of the art and the remaining unexplored options, this paper proposes an innovative hybrid CHP power system to serve an industrial consumer. This system is based on the integration of an internal combustion engine (ICE), a Methane Steam Reformer (SMR) for on-site hydrogen production with a CO2 capture system, an HT-PEMFC, and a battery pack. The battery is sized to make the consumer independent from the utility grid. The adopted methodology ensures that the various components of the plant are interconnected through thermal flows and energy balance. This approach aims to reduce consumption and heat losses while mitigating environmental impact by integrating a CO2 capture system. The seamless integration of these components is a result of appropriate design choices and operating conditions that allow for a minimal number of auxiliary systems. On-site hydrogen production also offers significant benefits by reducing transportation costs and associated risks, while also leading to a lower environmental impact by eliminating emissions from transport vehicles. Instead of a storage system, continuous hydrogen usage is planned, as the power to be supplied is fixed.
The proposed example is analyzed using two modeling environments: a lumped-parameter code (Thermoflex) for the thermal part of the plant (ICE, SMR, and CO2 capture), and a Matlab/Simulink model for the electrochemical section (HT-PEMFC) and the battery sizing/optimization. The integration of these two tools allows a comprehensive assessment of the system, combining steady-state thermodynamic performance with dynamic electrical behavior.
2. System Description
The plant investigated is a hybrid system, co-producing electricity, heat, and hydrogen. Figure 1 provides a schematic representation of the system architecture.
At its core, the plant integrates an ICE with a nominal gross electrical power output of 1025 kW. The engine is a Siemens gas engine fueled by natural gas, featuring an electrical efficiency of 0.395 [19], as described in Table 1. Under nominal conditions, the engine burns a fuel flow rate of natural gas of 0.056 kg/s, which is injected into the intake manifold at a pressure of 3 bar. This engine is coupled with an SMR.

Figure 1.
Proposed plant diagram.
Specifically, exhaust gases from the engine, at a temperature of 495 °C, supply thermal energy to a Heat Recovery Steam Generator (HRSG). The steam generated by the HRSG is utilized in reactions of an SMR, which produces synthesis gas (syngas). The process inside the reformer is highly endothermic, and the heat required is provided by a combustor. The SMR sub-system capabilities are augmented through a waste heat recovery strategy. The Steam Reformer model used simulates the behavior of an FTR (Fired-Tubular-Reforming) reactor, set as described in Figure 2. The main chemical reactions implemented in the model are listed below [4]:
The mixture of superheated steam and natural gas is preheated to a temperature of 850 °C, utilizing the combustion products exiting the integrated combustor as the hot fluid. In the latter, a mixture of pure hydrogen and purified syngas exiting the PSA (Pressure Swing Adsorption) unit is used as fuel in the SMR itself. The choice to ensure the reformer’s energy self-sufficiency is a consolidated practice in this type of plant, as it avoids the use of auxiliary fuels like natural gas, whose utilization would lead to an increase in external energy consumption and a consequent reduction in the overall efficiency of the plant.
Finally, hydrogen is directly extracted from the syngas for the FC, thereby circumventing the need for hydrogen storage. This configuration facilitates the generation of supplementary electricity and recoverable heat; the latter being harvested from the fuel cell cooling system. A portion of the produced hydrogen is also directed to the reformer burner, ensuring the thermal self-sustainability of the reforming process. Although detailed thermal management strategies are beyond the scope of this study, it is worth noting that the integration of ICE exhaust, SMR, and HT-PEMFC cooling requires precise temperature control. In particular, as highlighted in recent reviews, liquid-cooled thermal management approaches are essential to maintain fuel cell stability and efficiency under variable operating conditions [20].
Downstream of the reformer, a CO2 capture system has been implemented. This integrated design results in a plant with a reduced environmental footprint, enhancing its competitiveness against conventional thermal power plants.
The entire plant can deliver a net electrical power of 1462.7 kWe, with an overall electrical efficiency of 39.9%, considering all auxiliary losses. Additionally, the plant provides a total thermal power of 1318 kWt, including the heat recovery from the FC. The sizes of the ICE and the fuel cell are selected based on both the electrical load curve required by the user and to ensure integration with the natural gas reforming system and the CO2 capture system. This approach avoids the need for auxiliary steam generators, which would increase fuel consumption and consequently worsen overall efficiency. Furthermore, the system incorporates an appropriately sized battery pack for storing surplus electrical energy from the fuel cell, enabling the system to meet fluctuating load demands.
The industrial facility requires a dual supply of electricity and thermal energy. The thermal unit must be delivered at diverse temperature levels to fulfill requirements for heating and process steam. The electrical load duration curve of the facility is depicted in Figure 3. The graph illustrates the average electrical power delivered by the plant when operating at nominal full-load conditions (dashed red lines).
Table 2 and Table 3 show the technical data and operating conditions of the fuel cell chosen for this investigation. This is a 500 kW HT-PEMFC with a stack consisting of 145 parallel-connected modules, each able to provide 3.465 kW under nominal conditions. The typical operating temperature for this cell type is 165 °C, and reactants are supplied to the two electrodes at an operating pressure of 1.5 bar. The HT-PEMFC is assumed to operate at a fixed point, with the battery pack managing load fluctuations, reducing the complexity of control of the fuel cell, and maximizing the electrical efficiency. In fact, a dynamic load variation in the HT-PEMFC requires advanced control mechanisms as reported in [21].

Table 1.
Engine specifications.
Table 1.
Engine specifications.
| Type | Fuel | Speed [rpm] | Power [kW] | Texh [°C] | Exh Mass Flow Rate [kg/s] | Efficiency |
|---|---|---|---|---|---|---|
| SIE SGE 56-SM | NG | 1500 | 1025 | 495 | 1.47 | 0.395 |

Figure 2.
SMR settings.

Figure 3.
Annual electric load.
Table 2.
HT-PEMFC technical data.
Table 2.
HT-PEMFC technical data.
| FC Model | Fuel | Efficiency (LHV) | Power [kW] | Number of Modules | Module Power [kW] |
|---|---|---|---|---|---|
| H3-5000 SERENERGY | Hydrogen | 52% | 500 | 145 | 3.465 |
Table 3.
HT-PEMFC operating conditions.
Table 3.
HT-PEMFC operating conditions.
| Temperature [°C] | Pressure [bar] | H2 Mass Flow Rate [kg/s] | Open Circuit Voltage/Single Module [V] | Rated Current and Voltage [A, V] |
|---|---|---|---|---|
| 165 | 1.5 | 0.008 | 102 | [45, 77] |
The characteristic curves of a single fuel cell module are presented in Figure 4. They illustrate the relationship between the fuel cell’s output voltage and current, as well as between its output electrical power and the supplied current.
At the operating point highlighted in the graphs, corresponding to a current of 45 A, the single module of the stack operates at an intermediate condition along the voltage-current curve, with a voltage of 77 V. At this current, the cell has moved past the initial zone characterized by a rapid voltage drop due to activation losses, and ohmic losses begin to become predominant. The voltage remains sufficiently high to ensure good electrical efficiency while limiting electrochemical stress, making this point particularly suitable for stable and long-lasting operation.
From the second graph (power versus current), it is observed that at 45 A, the stack delivers a power of 3.465 kW. This value is equivalent to the nominal power output that the fuel cell can achieve. Although the maximum power is reached at approximately 68 A (4.76 kW), the 45 A point represents an optimal compromise between performance and reliability. Operating under this condition allows for high electrical power output while avoiding the zone of maximum stress, where internal losses increase and material degradation is more rapid.
At this operating point, the HT-PEMFC ensures a good thermal balance, significant electrical efficiency, and conditions favorable for long-term stability. Therefore, the 45 A point can be considered ideal for continuous operation, ensuring a balance among efficiency, durability, and operational safety.

Figure 4.
Single cell operating point.
The battery, used for the independent assessment of the fuel cell, is designed using as a reference the cell specifications shown in Table 4 [22].
Table 4.
Battery cell specifications.
Table 4.
Battery cell specifications.
| Rated Voltage [V] | Maximum Voltage [V] | Internal Resistance [mΩ] | Rated Capacity [Ah] | Cell Mass [kg] |
|---|---|---|---|---|
| 3.6 | 4.2 | 17 | 3 | 0.046 |
3. Simulation of ICE/SMR/CO2 Capture System
The thermal section of the plant (ICE, Reformer, and CO2 capture) is modeled in the Thermoflex 32 code [23], a lumped-parameter thermodynamic modeling software based on a mass and heat balance approach. Figure 5 provides a detailed illustration of the plant and all its components. The system is based on a natural gas-fired ICE (Table 1). Exhaust gases exiting the engine at 495 °C (Point 6) are used to generate superheated steam, which is then sent to both the methane reformer (Point 5) and the CO2 capture system (Point 8). Heat recovery is performed by the HRSG. Within the HRSG, water flows counter-current to the gases at a pressure slightly above 20 bar. This ensures the production of superheated steam at the operating conditions required by the SMR process. Downstream of the evaporator, a steam flow of 0.1558 kg/s (Point 2) is extracted and directed to both the CO2 capture system (Point 8) and the process steam production unit (Point 1). The remaining saturated steam flow rate (0.0568 kg/s) is directed to the superheater, exiting at 468 °C (Point 5). Natural gas, intended for the reforming reaction, is compressed to 21 bar. This pressure is marginally higher than the reformer operational pressure (approximately 20 bar); such overpressure is required to offset the pressure losses encountered in both the connecting pipelines and the various downstream components.
After exiting the compressor, the natural gas is preheated in a Heat Exchanger (HX1) to 630 °C (Point 14). It then undergoes desulfurization to prevent irreversible poisoning of the reformer’s nickel-based catalyst and to inhibit the concurrent formation of undesirable solid carbonaceous particles (Point 13). Following this pretreatment, the natural gas is blended with superheated steam from the HRSG. This mixture, with a Steam-to-Carbon Ratio (S/C) of 2.5, is further heated in HX2 via heat exchange with the combustor’s exhaust gases (Point 15), reaching an inlet temperature of 850 °C at the reformer. Within the reformer, methane reacts endothermically with steam, generating syngas. An integrated burner supplies the necessary heat for these reactions.
This burner is fueled by a blend of waste syngas (Point 19) and excess pure hydrogen (Point 32), reaching a temperature of 950 °C (Point 41). This fuel mixture has a total lower heating value of 5380 kJ/kg. Reformer outlet stream of crude syngas, consisting of 0.08 kg/s of syngas at 650 °C (Point 18), has a volumetric composition, expressed as a percentage of the total volume, shown in Table 5.
Subsequently, it is cooled in HX1 (Point 16) and HX4 exchangers (Point 35), where heat is transferred to water for the heat unit (Point 37), ultimately reducing the syngas temperature. Then, the syngas undergoes the chemical conversion of carbon monoxide to hydrogen in the WGS reactor. The WGS operates in two temperature stages: the first (HT-WGS at 312 °C), which allows a CO conversion of 96% (Point 24), and the second (LT-WGS, at 200 °C), where a further CO conversion is achieved with 99% efficiency. A heat exchanger positioned between these stages facilitates heat transfer from the syngas exiting the first stage to a stream of saturated water (Point 36). At the exit of the WGS reactor, the syngas has the volumetric composition, expressed as a percentage of the total volume, shown in Table 6. After exiting the second WGS stage, the syngas is further cooled to 50 °C in two exchangers (HX6 and HX7). Subsequently, the syngas is dehumidified in a condensate separator and then purified in a Pressure Swing Adsorption (PSA) unit (Point 20). The PSA leverages the varying adsorption capacities of gases on porous materials at different pressures to achieve hydrogen purity exceeding 99.9%. The PSA unit yields two distinct outlet streams: the first stream is dehydrogenated syngas (Point 19), with a heating value of 5141 kJ/kg, which is subsequently combusted in the SMR integrated combustor (Point 17); the second stream is pure hydrogen (with a high degree of purity of 99.9%), with a flow rate of 0.0081 kg/s directed both to the HT-PEMFC stack after being throttled to 1.5 bar and preheated to 165 °C (the fuel cell operating conditions, Point 25) and the SMR integrated combustor (Point 32).
The SMR generates a flue gas stream of 0.153 kg/s at 950 °C (Point 41), which is consistent with values reported in the literature. This stream will be used at several points in the system to recover heat before it reaches the CO2 capture subsystem.
Table 5.
Volumetric composition of crude syngas (after reforming).
Table 5.
Volumetric composition of crude syngas (after reforming).
| H2 | H2O | CO | CO2 | CH4 | C2H6 | C3H8 |
|---|---|---|---|---|---|---|
| 52.34% | 26.39% | 9.45% | 6.47% | 4.63% | 0.18% | 0.09% |
Table 6.
Volumetric composition of syngas (after WGS).
Table 6.
Volumetric composition of syngas (after WGS).
| H2 | H2O | CO | CO2 | CH4 | C2H6 | C3H8 |
|---|---|---|---|---|---|---|
| 65% | 13.01% | 0.22% | 16.87% | 4.63% | 0.18% | 0.09% |

Figure 5.
Thermal system diagram.
The Thermoflex model simulates a CO2 CCS plant (shown in Figure 6) that uses chemical absorption with amine-based solvents (like MEA). The CO2 targeted for capture originates from the combustion of syngas and hydrogen in the reformer. The implementation of the CO2 capture system enables a reduction in CO2 emissions of approximately 28%, decreasing from 505.53 kgCO2/MWh (without capture) to 363.69 kgCO2/MWh. In CO2 capture processes from flue gases, the latter are first cooled to approximately 30 °C and passed through an absorption tower (absorber). The CO2-rich solvent, coming from the bottom of the absorber, is sent to a regeneration column (stripper) where heating with steam decomposes the compound and releases the CO2, thus regenerating the solvent. Finally, the regenerated solvent is cooled and pumped back to the absorption tower. The gas stream exiting the stripper, consisting of CO2, water vapor, and traces of amine, is initially cooled by a condenser, which reduces the gas flow temperature, facilitating subsequent phase separation. The cooled gas is then sent to a phase separator (knockout drum), where CO2 is physically separated from the condensate. Once purified, the CO2 is then compressed to 151 bar. This process brings it to a supercritical condition, which is ideal for its transportation.
The simulations show the plant captures 4.975 tonnes of CO2 daily with a purity of 99.9%, and a daily amine solvent loss of only 0.002 tonnes. This significantly reduces CO2 emissions by 95% (CO2 capture rate), from 5.235 tonnes/day (without capture) to just 0.2618 tonnes/day. The system consumes 22.36 kW of electricity, with 85% (18.92 kW) attributed to the CO2 compressor, and the remaining powering the pumps. The thermal energy demand is 200.8 kW, or 3489 kJ/kg of CO2 captured, primarily for solvent regeneration in the stripper. This is supplied by 0.088 kg/s of superheated steam at 165 °C and 2.3 bar, which exits the stripper saturated at 100 °C.

Figure 6.
Input parameters of the CO2 capture system.
Table 7.
Thermodynamic properties of system state points.
4. Simulation in Matlab/Simulink Environment
Integrating a fuel cell into a DC or AC microgrid often necessitates regulating the electrical power supplied to the load. This leads to the development of control algorithms and regulation systems that frequently prove to be inefficient for the overall plant. The primary limitation of a fuel cell is its slow dynamic response, which hinders its ability to adapt to rapid changes in electrical load. Therefore, in almost all fuel cell applications, it is essential to utilize a hybrid system comprising the fuel cell and a fast-responding energy storage system, such as electrochemical battery packs or high-speed flywheels. In the present work, a battery pack was considered, as it currently represents the storage system offering the best compromise in terms of stored energy, power delivery, and ease of integration and control. The schematic of the plant, simulated in the Simulink environment, is shown in Figure 7.
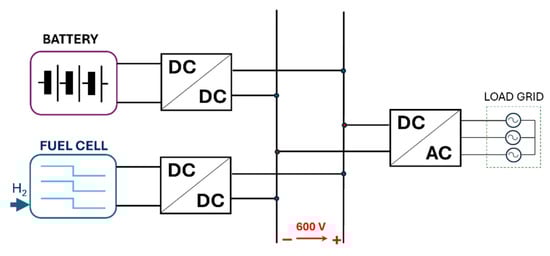
Figure 7.
Schematic of the considered plant.
The battery energy storage system (BESS) is interfaced with the bus of a DC microgrid in parallel with the fuel cell; from the DC bus, it is possible to feed directly the DC load or, with a DC-AC converter, the AC part of the microgrid (where is also connected the electric generator of the ICE). To enable the inverter to generate a 400 V three-phase AC voltage, the DC bus must maintain a stable voltage of 600 V. Therefore, both the fuel cell and the BESS are interfaced with the DC bus not directly, but via dedicated DC-DC converters (Boost Converter), where a double loop PI controller is implemented for the output voltage and current regulation.
The framework of the Simulink simulation is reported in Figure 8. The thermal data were previously obtained by Thermoflex and reported in a Simulink block. The simulation is carried out in continuous mode, with a maximum step of 1 ms.
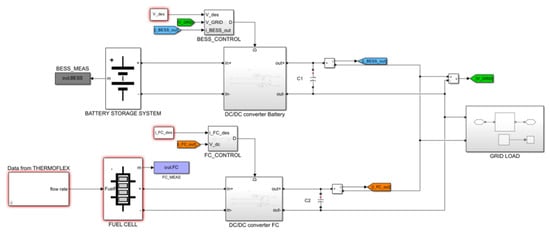
Figure 8.
Scheme of the Simulink simulation.
4.1. Fuel Cell Model
The HT-PEMFC data under study are introduced into the hydrogen-air fuel cell stack model [24]. The model takes into account variations in operating parameters such as pressure, temperature, composition, and flow rates of fuel and oxidizer (air). These variations directly influence the parameters of the electrochemical model, such as the exchange current, Equation (3), and open-circuit voltage, Equation (4).
where k is the Boltzmann constant; pH2 and pO2 are the partial pressures of hydrogen and oxygen, respectively; h is the Planck constant; ΔG is the Gibbs free energy change.
where Kc is the cell voltage under nominal operating conditions; En is the ideal Nerst voltage, which, if the cell has an operating temperature greater than 373K, is calculated with Equation (5).
As said in Section 2, the HT-PEMFC works at a fixed point (see Table 2 and Table 3), leaving the load variation dynamics to the battery pack. At the operating point highlighted in the graphs in Figure 3, corresponding to a current of 45 A, the individual stack module operates in an intermediate state along the voltage-current curve, with a voltage of 77 V. At this current, the cell has passed the initial zone characterized by a rapid voltage drop due to activation losses, while ohmic losses begin to become predominant. At 45 A the stack delivers a power of 3.465 kW, equal to the nominal power output of the fuel cell.
4.2. Battery Sizing and Optimization
As previously mentioned, a battery pack is essential with a fuel cell for quickly handling load variations. This additional storage also offers flexibility to manage surplus energy from the fuel cell, especially when it operates at a fixed point. Therefore, it is necessary to solve an optimization problem to size the battery pack. In the examined case, the minimization of the mass of the battery pack is the target (Equation (6)).
where ns and np are the number of cells in series and the number of branches in parallel of the battery pack, while mb is the mass of the single cell.
While the primary goal is to minimize mass, there are always constraints that must be satisfied, such as:
- The maximum charge current Ic_max must be below the maximum charge current supported by the battery;
- The maximum discharge current Id_max must be below the maximum discharge current supported by the battery;
- The state of charge, SOC, must be between 20% and 100% in order to avoid a rapid degradation of the cells. The COS is defined as in Equation (7):
The battery pack optimization considers constraints on its minimum/maximum SOC and its maximum charge/discharge currents. For stationary uses like this, these currents are typically lower than manufacturer specifications to prevent rapid cell degradation and reduce heat.
The optimization problem relies on a battery power profile, derived from a statistical analysis of the industrial user’s electrical load. A single-day load profile from a specific source [25] is used, assumed to represent the system’s worst-case scenario. By subtracting the fixed power supplied by the fuel cell, this profile indicates when there is surplus power (which can be sold or stored) or a deficit (requiring battery supply). Optimization problems of this type are typically Mixed Integer Programming (MIP) problems, featuring both real and integer variables. This means they cannot be solved with standard gradient-based techniques, requiring heuristic methods like genetic algorithms or differential evolution instead. Therefore, a differential evolution algorithm is developed. It starts with an initial population defined by the stochastic definitions of the problem variables listed below.
- Number of cells in series, ns
- Number of cells in parallel, np
- Initial state of charge, SOC(t0)
These variables relate to two different case studies, called Case #1 and Case #2.
- Case#1: The battery charging power during the energy surplus, Pric is kept constant
- Case#2: The power supplied to the grid during the energy surplus, Pnet is kept constant
The number of cells in series and parallel identifies the integer variables required for the construction of the battery pack. Pric is the charging power made available to the batteries during energy surplus, while Pnet is the desired power to be supplied to the grid when surplus energy is available from the fuel cell.
For each initial configuration, the dynamic behavior of the battery pack is simulated using a simplified model in which the voltage at the battery pack terminals is given by the following:
where Rb is the internal resistance of the battery pack and Ibatt is the current supplied. The current from a single cell is calculated by considering the battery pack’s power demand. The initial assumption is that the internal resistance is zero, ensuring the effective terminal voltage is equivalent to the no-load voltage.
The open-circuit voltage of the battery pack is a linear function of the initial state of charge, and the required electrical power curve is discretized, assuming it remains constant over a 1 s interval. The algorithm executes for 200,000 iterations, upon the completion of which the optimal configuration is identified via the convergence of the objective function. This convergence signifies that the algorithm reaches a stable solution. Table 8 shows the optimal results obtained for the two cases.
The convergence of Case#1 and Case#2 is reported in Figure 9.
Table 8.
Results of the two cases.
Table 8.
Results of the two cases.
| CASE#1 | CASE#2 | |
|---|---|---|
| Number of cells in series | 88 | 64 |
| Number of cells in parallel | 3780 | 5177 |
| Initial SOC | 0.57 | 0.36 |
| Battery charging power [kW] | 164.2 | 813.7 |
| Energy pack with 100% SOC [kWh] | 3593 | 3578 |
| Battery pack mass [kg] | 23,285 | 23,193 |

Figure 9.
Convergence of the objective function (battery pack mass) during the optimization process.
In Case#1, a lower charging power requirement leads the optimization to favor more series cells and fewer parallel ones. This happens because discharge currents are higher than charge currents. While this does not significantly affect stored energy or total cell mass (considering only the stored energy, it is possible to estimate a cost increase in less than 1% of the Case#1 with respect to the Case#2), having fewer parallel branches could reduce overall battery pack cost by needing fewer current sensors. Instead, the presence of more parallel branches gives the possibility of sectioning the battery pack into multiple subunits, installing the various storage units in the critical nodes of the network, and improving the electrical management of the microgrid. This aspect permits not only to improve the quality of the energy supply but also to reduce the losses in the grid with a great advantage for the owner of the plant.
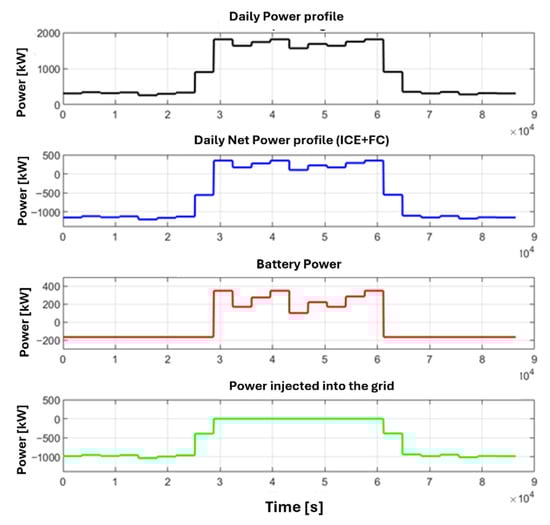
Figure 10.
Profiles of power in Case#1: load power trend (black line), net power profile produced by fuel cells (blue line), battery pack power (red line), power supplied to the grid (green line).
Specifically, the black curve shows the required load profile. When the power generated by the HT-PEMFC and ICE is subtracted, the blue curve is obtained. This profile clearly indicates that, between 8:30 AM (30,600 s) and 4:30 PM (59,400 s), the fuel cell’s power needs to be supplemented by the battery pack (red curve). For the remainder of the day, the power can be utilized for both recharging the battery pack and for exchange with the grid (green curve). Based on the trends observed in Case#1 (Figure 9), it is evident that the power supplied to the grid is variable. This variability arises because only a small, constant portion of the fuel cell’s energy surplus is retained for recharging the battery pack. In contrast, the power exchange with the grid remains constant in Case#2, while the power used to recharge the battery pack is variable. Based on the results of the power profile, the total exchanged energy with the grid reaches the values of 13.5 MWh and 12.2 MWh, respectively, for Case#1 and Case#2.
The results on optimal power exchange strategies suggest that Case#1 is more suitable for scenarios where it is economically advantageous to sell energy to the grid and when the grid operator does not impose constraints on the exchanged power value. Conversely, Case#2 is characterized by a constant power exchange with the grid, making it beneficial under conditions where the grid operator mandates a constant power exchange. This constancy facilitates grid regulation and power management among various consumers, especially considering that most of the energy surplus is supplied during the night hours, when the load required by the grid is the lowest.
Using the results of the optimizations and the previous mathematical models, the Simulink simulations are carried out. The goal of the simulations is to verify the feasibility of the optimization results, using a high-fidelity simulative environment and introducing a standard PI controller for the DC-DC converter adopted for the battery storage system and the fuel cell. The results of the simulations are depicted in Figure 12 and Figure 13, where the SOC, current, and voltage trends for the fuel cell and battery pack across both optimization cases are illustrated. An interesting result is the trends of the battery SOC: as it is possible to note, the imposed constraints are respected in both cases, while in Case#1 the maximum value of SOC is slightly smaller than the Case#2, and this could be a benefit in terms of degradation of the electrochemical cells. Regarding the dynamic behavior of the battery storage system, it is possible to analyze the trend of the output voltage, noting that the load variations are well balanced by the battery storage system with a limited voltage variation during the power peaks. The impact and the reduction in degradation of both battery cells and fuel cells are worthy of further consideration and future investigations; in particular, long-term degradation of the HT-PEMFC under thermal cycling remains a concern, as it is demonstrated by a recent study that involves the reversible voltage loss recovery mechanisms [26,27].

Figure 11.
Profiles of power in Case#2: load power trend (black line), net power profile produced by fuel cell (blue line), battery pack power (red line), power supplied to the grid (green line).

Figure 12.
Power profiles obtained via simulation of Case#1: battery state of charge trend, battery pack current, and load current supplied in output by the DC-DC converter, and output voltage from the battery pack.

Figure 13.
Power profiles obtained via simulation of Case#2: battery state of charge trend, battery pack current, and load current supplied in output by the DC-DC converter, output voltage from the battery pack.
5. Overall System Performance
In order to evaluate the plant’s overall performance, key performance indicators were employed.
- Efficiency of the fuel cell and methane reformer system, which considers the ratio between the electrical power generated by the fuel cell ( and the flow rate of natural gas to be reformed multiplied by its calorific value:
- Efficiency of the natural gas to hydrogen conversion system, considering the total flow rate of hydrogen produced ( and that of natural gas entering the SMR (:
- Fuel utilization index, used to estimate the performance of a cogeneration plant:
- Internal combustion engine efficiency:
- Fuel cell efficiency:
- Overall electrical efficiency, defined as the ratio between the total electrical power generated by the ICE/FC system ( and the natural gas flow rate multiplied by its lower calorific value, or:
Table 9 shows the parameters useful for calculating the aforementioned indices, obtained partly from the simulation carried out with Thermoflex and from the data of the fuel cell. In this regard, to evaluate the useful thermal power recoverable from the cooling circuit of the fuel cell, the following empirical formula was used [28]:
Here, 1.25 V represents the ideal voltage for a pure hydrogen fuel cell, assuming the water byproduct from the electrochemical reactions is expelled as vapor. The term Vcell denotes the voltage delivered by an individual cell within the stack, which is 0.64 V in this specific analysis. is an empirical parameter, set at 0.7, which reflects that not all the fuel cell-generated thermal power can be utilized. A portion is inevitably dissipated to the environment via radiation and convection from the stack’s hot surfaces or through auxiliary components.
Finally, Table 10 shows the values obtained for the previously defined indices.
Table 9.
Simulation results.
Table 9.
Simulation results.
| [kW] | [kW] | [kW] | [kW] | [kg/s] | [kg/s] | [kJ/kg] | [kJ/kg] | [kg/s] | [kWt] | [kWt] |
|---|---|---|---|---|---|---|---|---|---|---|
| 1025.4 | 500 | 62.65 | 1462.7 | 0.0556 | 0.0232 | 46,514 | 120,000 | 0.0081 | 333.5 | 984.1 |
Table 10.
Index values.
Table 10.
Index values.
| 0.399 | 0.463 | 0.905 | 0.76 |
The efficiency of the fuel cell and methane reformer system is found to be greater than 0.46. This value is considered high when compared to the efficiency of commercially available small-to-medium-sized thermal engines (under 1 MW). For instance, the current leading technology in this power range, ICEs, typically achieves efficiencies between 0.35 and 0.40. Consequently, replacing the SMR/FC block with a reciprocating engine of the same net electrical power (500 kW) would result in an overall plant efficiency that is demonstrably lower than that achieved by the system presented in this study. Furthermore, the system’s conversion efficiency exceeds 90%. This value is achieved through the optimization of the reformer’s operating conditions (S/C ratio, temperature, and pressure) and the effective integration of thermal waste streams. The majority of these streams were used to meet the energy demand of the reformer itself. This approach minimized the amount of fuel (syngas and hydrogen in this case) sent to the combustor, thereby maximizing conversion efficiency.
Figure 14 shows a diagram detailing the electrical power absorbed by each auxiliary component of the plant, including its percentage relative to the total. Considering that the total power absorbed by the auxiliaries, including transformation losses in the electrical generator, is 62.21 kW, it is observed that the CCS system is the most energy-intensive auxiliary component. It requires an electrical power of 22.36 kW, which accounts for 35.94% of the total power consumed by all auxiliaries. This energy demand highlights the intrinsic trade-off between capture efficiency and overall system performance. While the CCS system significantly reduces CO2 emissions, its 22.36 kW demand reduces the net efficiency of the plant. This penalty is an inherent characteristic of any capture technology, as additional energy is required for gas separation and compression. Therefore, the optimal balance depends on the relative weight assigned to environmental benefits versus efficiency losses, which may vary according to operational or regulatory requirements.
Finally, a performance evaluation of the plant in terms of primary energy saving and avoided CO2 emissions is conducted. This evaluation assumes that the plant operates at full load for 6000 h per year (250 days). The system’s performance is compared to that of a reciprocating internal combustion engine (ICE2) of the same power (Table 11), which would replace the HT-PEMFC, leaving the rest of the plant unchanged. The simulation shows that the overall electrical efficiency of the conventional power system with only thermal engines (37%) is lower than that of the proposed hybrid system (39.9%). Table 12 reports the instantaneous and annual fuel consumption data used to evaluate the primary energy savings of the two systems.

Figure 14.
Auxiliary systems consumption.
Table 11.
Engine (ICE2) data.
Table 11.
Engine (ICE2) data.
| Type | Fuel | Speed [rpm] | Power [kW] | Efficiency |
|---|---|---|---|---|
| CAT3512E | NG | 1000 | 500 | 0.354 |
Table 12.
Fuel consumption.
Table 12.
Fuel consumption.
| Power System | Instantaneous Rate of Consumption [kg/h] | Annual Rate of Consumption [Tonnes/Year] |
|---|---|---|
| Hybrid with FC | 283.68 | 1702.8 |
| Plant with ICE2 | 305.28 | 1831.68 |
The annual primary energy saving is then calculated (Equation (16)).
where the primary energy is evaluated by multiplying the annual fuel consumption of the system by the fuel calorific value. In both cases, natural gas is considered the fuel, with a calorific value of 46,514 kJ/kg. The results of this evaluation are reported in Table 13.
The analysis revealed that the proposed system achieves an emissions reduction of 2163 tonnes per year, corresponding to a 33.52% decrease compared to the reference system with a second internal combustion engine (ICE2) instead of a fuel cell (FC).
Table 13.
Results of the Energy Analysis.
Table 13.
Results of the Energy Analysis.
[kWh/Year] | [kWh/Year] | [kWh/Year] | % |
|---|---|---|---|
| 23.7∙106 | 22∙106 | 1.7∙106 | 7.2 |
Regarding annual CO2 production, the values obtained from the simulations are reported in Table 14.
Table 14.
CO2 emissions.
6. Conclusions
A simulated innovative hybrid power system has been proposed for industrial use. The system integrates a natural gas reformer with a CO2 capture system, an internal combustion engine, a high-temperature proton exchange membrane fuel cell (HT-PEMFC), and a battery pack. This configuration allows for autonomous operation, independent of the electrical grid. Key findings from the simulation include:
- High Efficiency: A 90.5% conversion efficiency of natural gas to hydrogen was achieved. The overall electrical efficiency of the plant reached 39.9%, representing a 2% increase compared to a reference system using only internal combustion engines.
- CO2 Reduction: A CO2 capture system reduced reformer emissions by 95%, limiting residual emissions to less than 0.3 tonnes per day. Overall, CO2 emissions were reduced by 33.52% compared to an equivalent system producing the same power but relying exclusively on engines. Due to the capture system’s high-power consumption (35.9% of auxiliary load), it was not applied to the engine exhaust to avoid a significant drop in overall efficiency.
- Operational Control: A PI control logic was used to manage the system’s dynamics. The fuel cell operates at a constant, high-efficiency load, while the battery pack handles fluctuations in user demand, ensuring independence from the grid.
The proposed system is a viable solution for industrial decarbonization, offering efficiency comparable to traditional thermal plants along with operational flexibility and multi-level heat recovery. Although natural gas was assumed as the main feedstock, partial substitution with biogas or renewable hydrogen could further reduce the carbon footprint and will be explored in future developments. Future research directions will also focus on integrating renewable sources for combined blue and green hydrogen production, exploring less energy-intensive CO2 capture technologies (e.g., solid sorbents or membranes), and implementing advanced AI-based control logics validated via Hardware-in-the-Loop (HIL) simulation. Some considerations about the economic impacts of the proposed solution are reported in the paper. Considering the different components of the overall system proposed in the paper, a comprehensive LCA and economic evaluation will be conducted in future papers, with the aim of assessing the system’s overall viability and environmental impact.
Author Contributions
Conceptualization, M.C.C. and L.P.D.N.; methodology, M.C.C., M.P. and L.P.D.N.; software, M.P. and L.P.D.N.; validation, R.R. and M.P.; investigation, M.P.; data curation, M.P. and R.R.; original draft preparation, M.C.C. and L.P.D.N.; review, M.P., L.P.D.N. and R.R.; supervision, M.C.C. and L.P.D.N. All authors have read and agreed to the published version of the manuscript.
Funding
This research received no external funding.
Data Availability Statement
The original contributions presented in this study are included in the article. Further inquiries can be directed to the corresponding author.
Acknowledgments
Calculations are licensed by Thermoflow Inc. and Matlab-Simulink.
Conflicts of Interest
The authors declare no conflicts of interest.
Abbreviations
The following abbreviations are used in this manuscript:
| BESS | Battery Energy Storage System |
| BOG | Boil Off Gas |
| CCS | Carbon Capture and Storage |
| DHW | Domestic Hot Water |
| EHP | Electric Heat Pump |
| FC | Fuel Cell |
| FTR | Fired Tubular Reforming |
| GHG | Greenhouse Gases |
| HIL | Hardware in the Loop |
| HT | High Temperature |
| HRSG | Heat Recovery Steam Generator |
| ICE | Internal Combustion Engine |
| LCA | Life Cycle Assessment |
| LNG | Liquefied Natural Gas |
| LT | Low Temperature |
| MEA | Monoethanolamine |
| MIP | Mixed Integer Programming |
| NG | Natural gas |
| ORC | Organic Rankine Cycle |
| PEM | Proton Exchange Membrane |
| PI | Proportional–Integral |
| SMR | Steam Methane Reformer |
| SOC | State of Charge |
| WGS | Water Gas Shift |
References
- European Commission. The European Green Deal. COM(2019) 640 Final. Brussels. Available online: https://EUR-Lex-52019DC0640-EN-EUR-Lex (accessed on 20 July 2025).
- Mei, J.; Meng, X.; Tang, X.; Li, H.; Hasanien, H.; Alharbi, M.; Dong, Z.; Shen, J.; Sun, C.; Fan, F.; et al. An Accurate Parameter Estimation Method of the Voltage Model for Proton Exchange Membrane Fuel Cells. Energies 2024, 17, 2917. [Google Scholar] [CrossRef]
- International Energy Agency. 2023 Global Hydrogen Review; IEA: Paris, France, 2023; Available online: https://www.iea.org/reports/global-hydrogen-review-2023 (accessed on 20 July 2025).
- Szablowski, L.; Wojcik, M.; Dybinski, O. Review of Steam Methane Reforming as a Method of Hydrogen Production. Energy 2025, 316, 134540. [Google Scholar] [CrossRef]
- Shahid, M.I.; Farhan, M.; Rao, A.; Hussain, M.S.; Salam, H.A.; Chen, T.; Zhang, Z.; Li, X.; Ma, F. Hydrogen Production by Waste Heat Recovery of Hydrogen-Enriched Compressed Natural Gas via Steam Methane Reforming Process. Int. J. Hydrogen Energy 2025, 117, 374–392. [Google Scholar] [CrossRef]
- Wang, Z.; Mao, J.; He, Z.; Liang, F. Energy-Exergy Analysis of an Integrated Small-Scale LT-PEMFC Based on Steam Me-thane Reforming Process. Energy Convers. Manag. 2021, 246, 114685. [Google Scholar] [CrossRef]
- Jannelli, E.; Minutillo, M.; Perna, A. Analyzing Microcogeneration Systems Based on LT-PEMFC and HT-PEMFC by Energy Balances. Appl. Energy 2013, 108, 82–91. [Google Scholar] [CrossRef]
- Nalbant, Y.; Colpan, C.O.; Devrim, Y. Energy and Exergy Performance Assessments of a High Temperature-Proton Ex-change Membrane Fuel Cell Based Integrated Cogeneration System. Int. J. Hydrogen Energy 2020, 45, 3584–3594. [Google Scholar] [CrossRef]
- Arsalis, A.; Nielsen, M.P.; Kær, S.K. Modeling and Parametric Study of a 1kWe HT-PEMFC-Based Residential Micro-CHP System. Int. J. Hydrogen Energy 2011, 36, 5010–5020. [Google Scholar] [CrossRef]
- Arsalis, A.; Kær, S.K.; Nielsen, M.P. Modeling and Optimization of a Heat-Pump-Assisted High Temperature Proton Exchange Membrane Fuel Cell Micro-Combined-Heat-and-Power System for Residential Applications. Appl. Energy 2015, 147, 569–581. [Google Scholar] [CrossRef]
- Capuano, M.; Sorrentino, M.; Agelin-Chaab, M. Design and Analysis of a Hybrid Space Heating System Based on HT-PEM Fuel Cell and an Air Source Heat Pump with a Novel Heat Recovery Strategy. Appl. Therm. Eng. 2023, 231, 120947. [Google Scholar] [CrossRef]
- Najafi, B.; Haghighat Mamaghani, A.; Rinaldi, F.; Casalegno, A. Fuel Partialization and Power/Heat Shifting Strategies Applied to a 30 KW El High Temperature PEM Fuel Cell Based Residential Micro Cogeneration Plant. Int. J. Hydrogen Energy 2015, 40, 14224–14234. [Google Scholar] [CrossRef]
- Fan, R.; Li, Z.-Q.; Zhang, H.-M.; Tao, W.-Q. Analysis of a Combined Heating and Power System Based on High-Temperature Proton Exchange Membrane Fuel Cell and Steam Methane Reforming: From Energy, Exergy and Economic Point of Views. Appl. Therm. Eng. 2024, 247, 123075. [Google Scholar] [CrossRef]
- Leng, S.; Xu, S.; Li, C.; Ha, C.; Liu, Z.; Qin, J.; Wang, Z.; Wang, J.; Chen, Z.; Liao, M. Performance Analysis of an Internal Combustion Engine with Thermochemical Recovery and High Temperature Proton Exchange Membrane Fuel Cell Combined Power Generation System. Fuel 2025, 384, 133913. [Google Scholar] [CrossRef]
- Palomba, M.; Cameretti, M.C.; Pio Di Noia, L. Numerical Analysis of a PEM Fuel Cell Fed by a Steam Reformer Integrated into an Internal Combustion Engine. In Proceedings of the 2025 International Conference on Clean Electrical Power (ICCEP), Sardinia, Italy, 24 June 2025; pp. 836–841. [Google Scholar] [CrossRef]
- Lim, T.-W.; Hwang, D.-H.; Choi, Y.-S. Design and Optimization of a Steam Methane Reformer for Ship-Based Hydrogen Production on LNG-Fueled Ship. Appl. Therm. Eng. 2024, 243, 122588. [Google Scholar] [CrossRef]
- Authayanun, S.; Arpornwichanop, A.; Patcharavorachot, Y.; Wiyaratn, W.; Assabumrungrat, S. Hydrogen Production from Glycerol Steam Reforming for Low- and High-Temperature PEMFCs. Int. J. Hydrogen Energy 2011, 36, 267–275. [Google Scholar] [CrossRef]
- Zhao, Y.; Xia, C.; Jia, L.; Wang, Z.; Li, H.; Yu, J.; Li, Y. Recent Progress on Solid Oxide Fuel Cell: Lowering Temperature and Utilizing Non-Hydrogen Fuels. Int. J. Hydrogen Energy 2013, 38, 16498–16517. [Google Scholar] [CrossRef]
- Siemens SGE-56SM Gas Generator Manual. Available online: https://ps.buckeyepowersales.com/wp-content/uploads/2021/09/SGE-S_natural-gas.pdf (accessed on 20 July 2025).
- Song, K.; Hou, T.; Jiang, J.; Grigoriev, S.A.; Fan, F.; Qin, J.; Wang, Z.; Sun, C. Thermal Management of Liquid-Cooled Proton Exchange Membrane Fuel Cell: A Review. J. Power Sources 2025, 648, 237227. [Google Scholar] [CrossRef]
- Li, H.; Sun, C.; Li, J.; Mei, J.; Jiang, J.; Fan, F.; Yang, W.; Zhuo, R.; Song, K. Self-Tuning Oxygen Excess Ratio Control for Proton Exchange Membrane Fuel Cells Under Dynamic Conditions. Processes 2024, 12, 2807. [Google Scholar] [CrossRef]
- Molicel INR-18650-P30B Datasheet. Available online: https://www.molicel.com/inr-18650-p30b/ (accessed on 20 June 2025).
- Thermoflow Inc. Available online: http://www.thermoflow.com (accessed on 1 February 2023).
- Souleman, N.M.; Tremblay, O.; Dessaint, L.-A. A Generic Fuel Cell Model for the Simulation of Fuel Cell Power Systems. In Proceedings of the 2009 IEEE Power & Energy Society General Meeting, Calgary, AB, Canada, 26–30 July 2009; pp. 1–8. [Google Scholar]
- Hasanbeigi, A.; Price, L. Industrial Energy Audit Guidebook: Guidelines for Conducting an Energy Audit in Industrial Facilities; Berkeley National Laboratory: Berkeley, CA, USA, 2010. [Google Scholar]
- Meng, X.; Liu, M.; Mei, J.; Li, X.; Grigoriev, S.; Hasanien, H.M.; Tang, X.; Li, R.; Sun, C. Polarization Loss Decomposition-Based Online Health State Estimation for Proton Exchange Membrane Fuel Cells. Int. J. Hydrogen Energy 2025, 157, 150162. [Google Scholar] [CrossRef]
- Meng, X.; Sun, C.; Mei, J.; Tang, X.; Hasanien, H.M.; Jiang, J.; Fan, F.; Song, K. Fuel Cell Life Prediction Considering the Recovery Phenomenon of Reversible Voltage Loss. J. Power Sources 2025, 625, 235634. [Google Scholar] [CrossRef]
- Dicks, A.L.; Rand, D.A.J. Fuel Cell Systems Explained; John Wiley & Sons: Hoboken, NJ, USA, 2018; ISBN 9781118613528. [Google Scholar]
Disclaimer/Publisher’s Note: The statements, opinions and data contained in all publications are solely those of the individual author(s) and contributor(s) and not of MDPI and/or the editor(s). MDPI and/or the editor(s) disclaim responsibility for any injury to people or property resulting from any ideas, methods, instructions or products referred to in the content. |
© 2025 by the authors. Licensee MDPI, Basel, Switzerland. This article is an open access article distributed under the terms and conditions of the Creative Commons Attribution (CC BY) license (https://creativecommons.org/licenses/by/4.0/).