Article

Experimental Study on Wave Energy Conversion Performance of a Wave-Driven Profiler

1
College of Artificial Intelligence, Nankai University, Tianjin 300350, China
2
School of Environment Science and Safety Engineering, Tianjin University of Technology, Tianjin 300382, China
*
Author to whom correspondence should be addressed.
These authors contributed equally to this work.
Energies 2025, 18(20), 5425; https://doi.org/10.3390/en18205425
Submission received: 17 July 2025 / Revised: 2 September 2025 / Accepted: 10 September 2025 / Published: 15 October 2025

Abstract

Few experimental studies have analyzed the wave energy conversion performance and underlying mechanisms of wave-driven profilers in controlled environments. Therefore, building on linear wave theory, Newton–Euler equations, and the working mechanisms of wave-driven profilers, this study has designed a crank mechanism-driven experimental tank facility. A comprehensive dynamic model of a wave-driven profiler has been established, and the impacts of wave height, wave period, and net buoyancy on the wave energy conversion performance of the wave-driven profiler and their underlying mechanisms have been analyzed. The results show that increased wave height enhances the buoy’s heave velocity, improving the dynamic performance of the wave-driven profiler by 441%. However, increased hydrodynamic resistance and mechanical collisions decreased the wave energy conversion efficiency by 57%. Longer wave periods reduce the wave excitation frequency, decreasing the buoy’s heave velocity; this results in a 35% reduction in the dynamic performance of the wave-driven profiler and a 53% decrease in wave energy conversion efficiency. During the descent phase, increased net buoyancy offsets more propulsive force, causing a 26% decrease in the wave-driven profiler’s dynamic performance yet increasing its energy conversion efficiency by 136%. This study provides a theoretical basis for optimizing the performance of similar wave-driven profilers.

1. Introduction

For human exploration of the ocean, oceanographic profiling observations have become the primary direction of oceanographic research because they enable vertical measurements, providing critical data for understanding the ocean [1,2]. However, traditional methods for profiling observations are constrained by insufficient power supply and the lack of continuous data collection, which limits their ability to meet long-term, large-scale monitoring requirements [3]. Argo buoys complete only one vertical profile every 10 days, with a maximum of approximately 100 profiles [4,5]. Buoyancy-driven underwater gliders have significantly enhanced endurance capabilities and the number of vertical profiles; however, under extreme conditions, relying solely on their onboard power supply limits them to completing only 615 vertical profiles [6,7]. Traditional observation equipment relies on a self-contained power supply as the power source, which limits its observational capabilities.
Many scholars are considering using environmental energy to overcome the energy constraints of profiling observation equipment. Environmental energy is widely distributed and encompasses diverse types, which has opened up new design approaches for profiling observation equipment [8,9,10]. Hou et al. developed an underwater glider that harnesses ocean thermal energy to enable mechanical motion [11]. In addition, Zang et al. created a tidal energy-powered profiler using a mechanically driven design for ocean monitoring [12]. The “Seahorse” profiler and the Wirewalker demonstrate that wave-driven profilers (WDPs) can achieve repeated vertical profiling without relying on large battery packs [13,14]. Although wave energy-driven profilers have been applied to wave energy generation, coastal internal waves, marine structures, and other related research areas, research on the wave energy conversion performance of WDPs remains relatively limited [15,16,17,18,19].
Previous studies have highlighted that improving the wave energy conversion performance of WDPs requires the simultaneous optimization of wave energy conversion efficiency and dynamic performance, which are jointly influenced by the buoy and the profiling platform. A buoy’s wave energy absorption efficiency largely depends on its geometric design. Studies have shown that buoys with a larger diameter, a smaller draft, or a hemispherical cap configuration can enhance wave absorption efficiency [20,21,22]. From the perspective of the profiling platform, its descent velocity determines the dynamic performance of a WDP. Profiling platforms with a faster descent velocity mean more efficient profile observation and the better dynamic performance of the WDP. Numerical simulation and physical experimentation are the two primary methods used to evaluate the performance of WDPs. For instance, Zang et al. and Smith et al. developed WDP prediction models via numerical simulations and found that velocity is a key factor affecting the motion stability and dynamic performance of WDPs [12,23]. Numerical simulations provide theoretical support and predictive capability for WDP-related research, yet they have certain limitations. Numerical simulation struggles to capture the impact of actual sea conditions on WDPs’ motion response, hampering studies of such responses under real conditions.
To overcome the limitations of idealized numerical simulations, some researchers have combined the theoretical analysis of WDPs with experimental validation. Rainville and Pinkel elaborated on the structures and operating principles of WDPs, validated their feasibility through experimental tests, and noted that dynamic performance improves significantly under stronger wind and wave conditions [14]. Pinkel et al. further improved the design and demonstrated, through field tests, the adaptability and stability of WDPs under different sea conditions [24]. Compared with numerical simulations, physical experiments can more realistically reflect the actual performance of WDPs in complex marine environments. However, most existing physical experiments on WDPs are conducted in open ocean environments. Due to the high randomness of waves, it is difficult to quantitatively analyze the influence of a single parameter’s change on the wave energy conversion performance of WDPs. Furthermore, current studies on the complete dynamic processes of WDPs are insufficient.
Based on the above status quo, this study is built on the comprehensive dynamic model of WDPs and further introduces and investigates two key methodological advances. First, we have developed a comprehensive dynamic model, unlike studies that rely on numerical simulations under idealized assumptions or qualitative physical experiments under uncontrolled sea conditions. This dynamic model describes the complete motion process of WDPs, providing a coherent framework for understanding their energy conversion mechanism. Second, we conducted controlled tank experiments using a crank slider facility capable of generating monochromatic waves, which can systematically isolate the influence of wave height, wave period, and net buoyancy on dynamic performance and wave energy conversion efficiency. By combining a dynamic model with experimental measurements, this study analyzes the effects of wave parameters and net buoyancy on the wave energy conversion performance of the WDP but also elucidates the mechanisms underlying these effects. These mechanisms provide a more solid theoretical foundation for the design and performance optimization of WDPs.

2. Materials and Methods

2.1. Research on Wave-Driven Mechanisms

2.1.1. Composition and Working Mechanisms of WDPs

The WDP comprises a buoy, an upper reversing block, a profiling platform, a wire rope, a bottom reversing block, and a tension hammer, as shown in Figure 1a. The wire rope passing through the profiling platform connects the buoy and the tension hammer and transmits the wave energy captured by the buoy’s heave motion to the tension hammer. The tension hammer exerts constant tension on the wire rope to ensure it remains taut and is responsible for further transmitting energy to the profiling platform. The profiling platform converts the wave energy captured by the buoy into mechanical energy for its own descent. The buoyancy blocks on the profiling platform enable the platform to maintain positive buoyancy, thereby providing power for rising. The profiling platform performs a longitudinal reciprocating motion along the wire rope through alternating descent and rise processes. The two ends of the wire rope are fixed with an upper reversing block and a bottom reversing block, which can control the conversion of the motion state of the profiling platform. The profiling platform consists of a wire rope, orthogonal guide wheels, fairings, buoyancy blocks, a wave energy capture device, lateral skeletal structures, structural anchor blocks, and guide pulley retainers, as shown in Figure 1b.
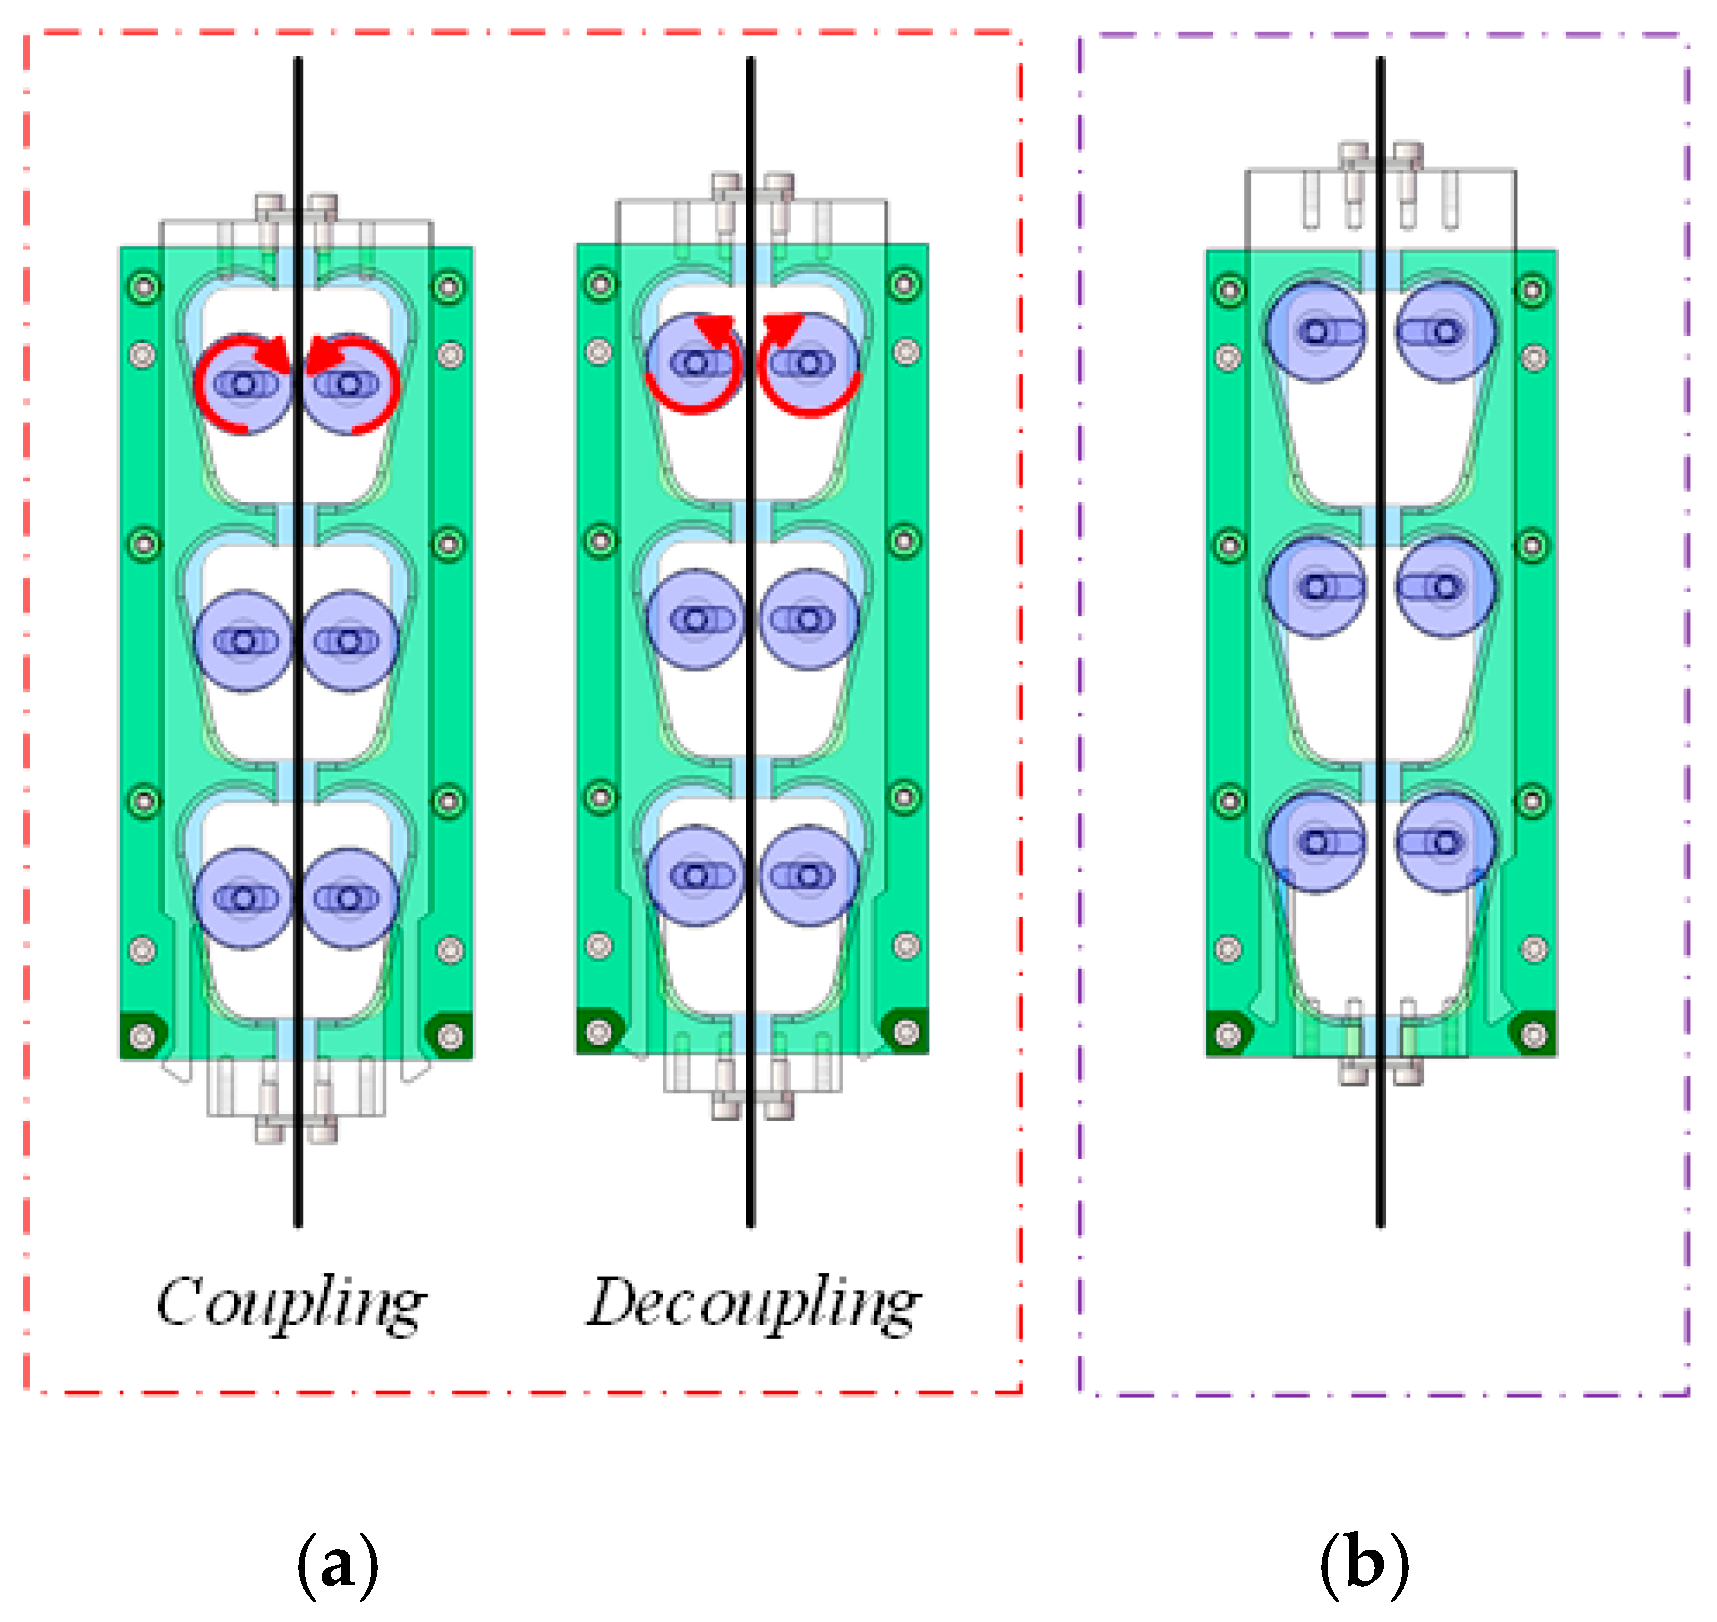
The wave energy capture device consists of cams, guide grooves, a sliding plate, a switching baffle, a unidirectional baffle, stopper blocks, and a base plate. The wave energy capture device operates in both open and closed states, as depicted in Figure 2.
  • Open state of the wave energy capture device
The adjustable latch of the sliding plate is below the stopper block, and the cam is supported by the guiding groove and the sliding plate, keeping the cam close to the wire rope. Based on the open state, the wave energy capture device has two sub-states:
(1)
Coupling state
When the velocity of the wire rope is lower than that of the profiling platform, the bilateral cams translate downward along the guide grooves. A rapid surge in pressure between the cams and the wire rope induces a proportional increase in their frictional interaction. The frictional forces are transmitted through other internal components of the device to the profiling platform, causing it to descend synchronously with the wire rope and enter the coupling phase.
(2)
Decoupling state
When the velocity of the wire rope is greater than that of the profiling platform, relative sliding occurs between the wire rope and the profiling platform. Frictional interaction between the wire rope and cams drives the upward translation of the cams along the guide grooves. Concomitant reductions in pressure and frictional forces result in the complete decoupling of the cam–cable interface. The profiling platform is then in the decoupled phase.
2.
Closed state of the wave energy capture device
The sliding plate’s latch is positioned above the stopper block. After the cam rises along the guide groove to the top of the groove, it is constrained by the sliding plate, so the cam no longer receives the supporting force provided by the guide groove. With the loss of the constraining force, the cam can no longer exert pressure and frictional interaction on the wire rope and thus can no longer couple with the wire rope. Consequently, the profiling platform transitions into the rise phase.
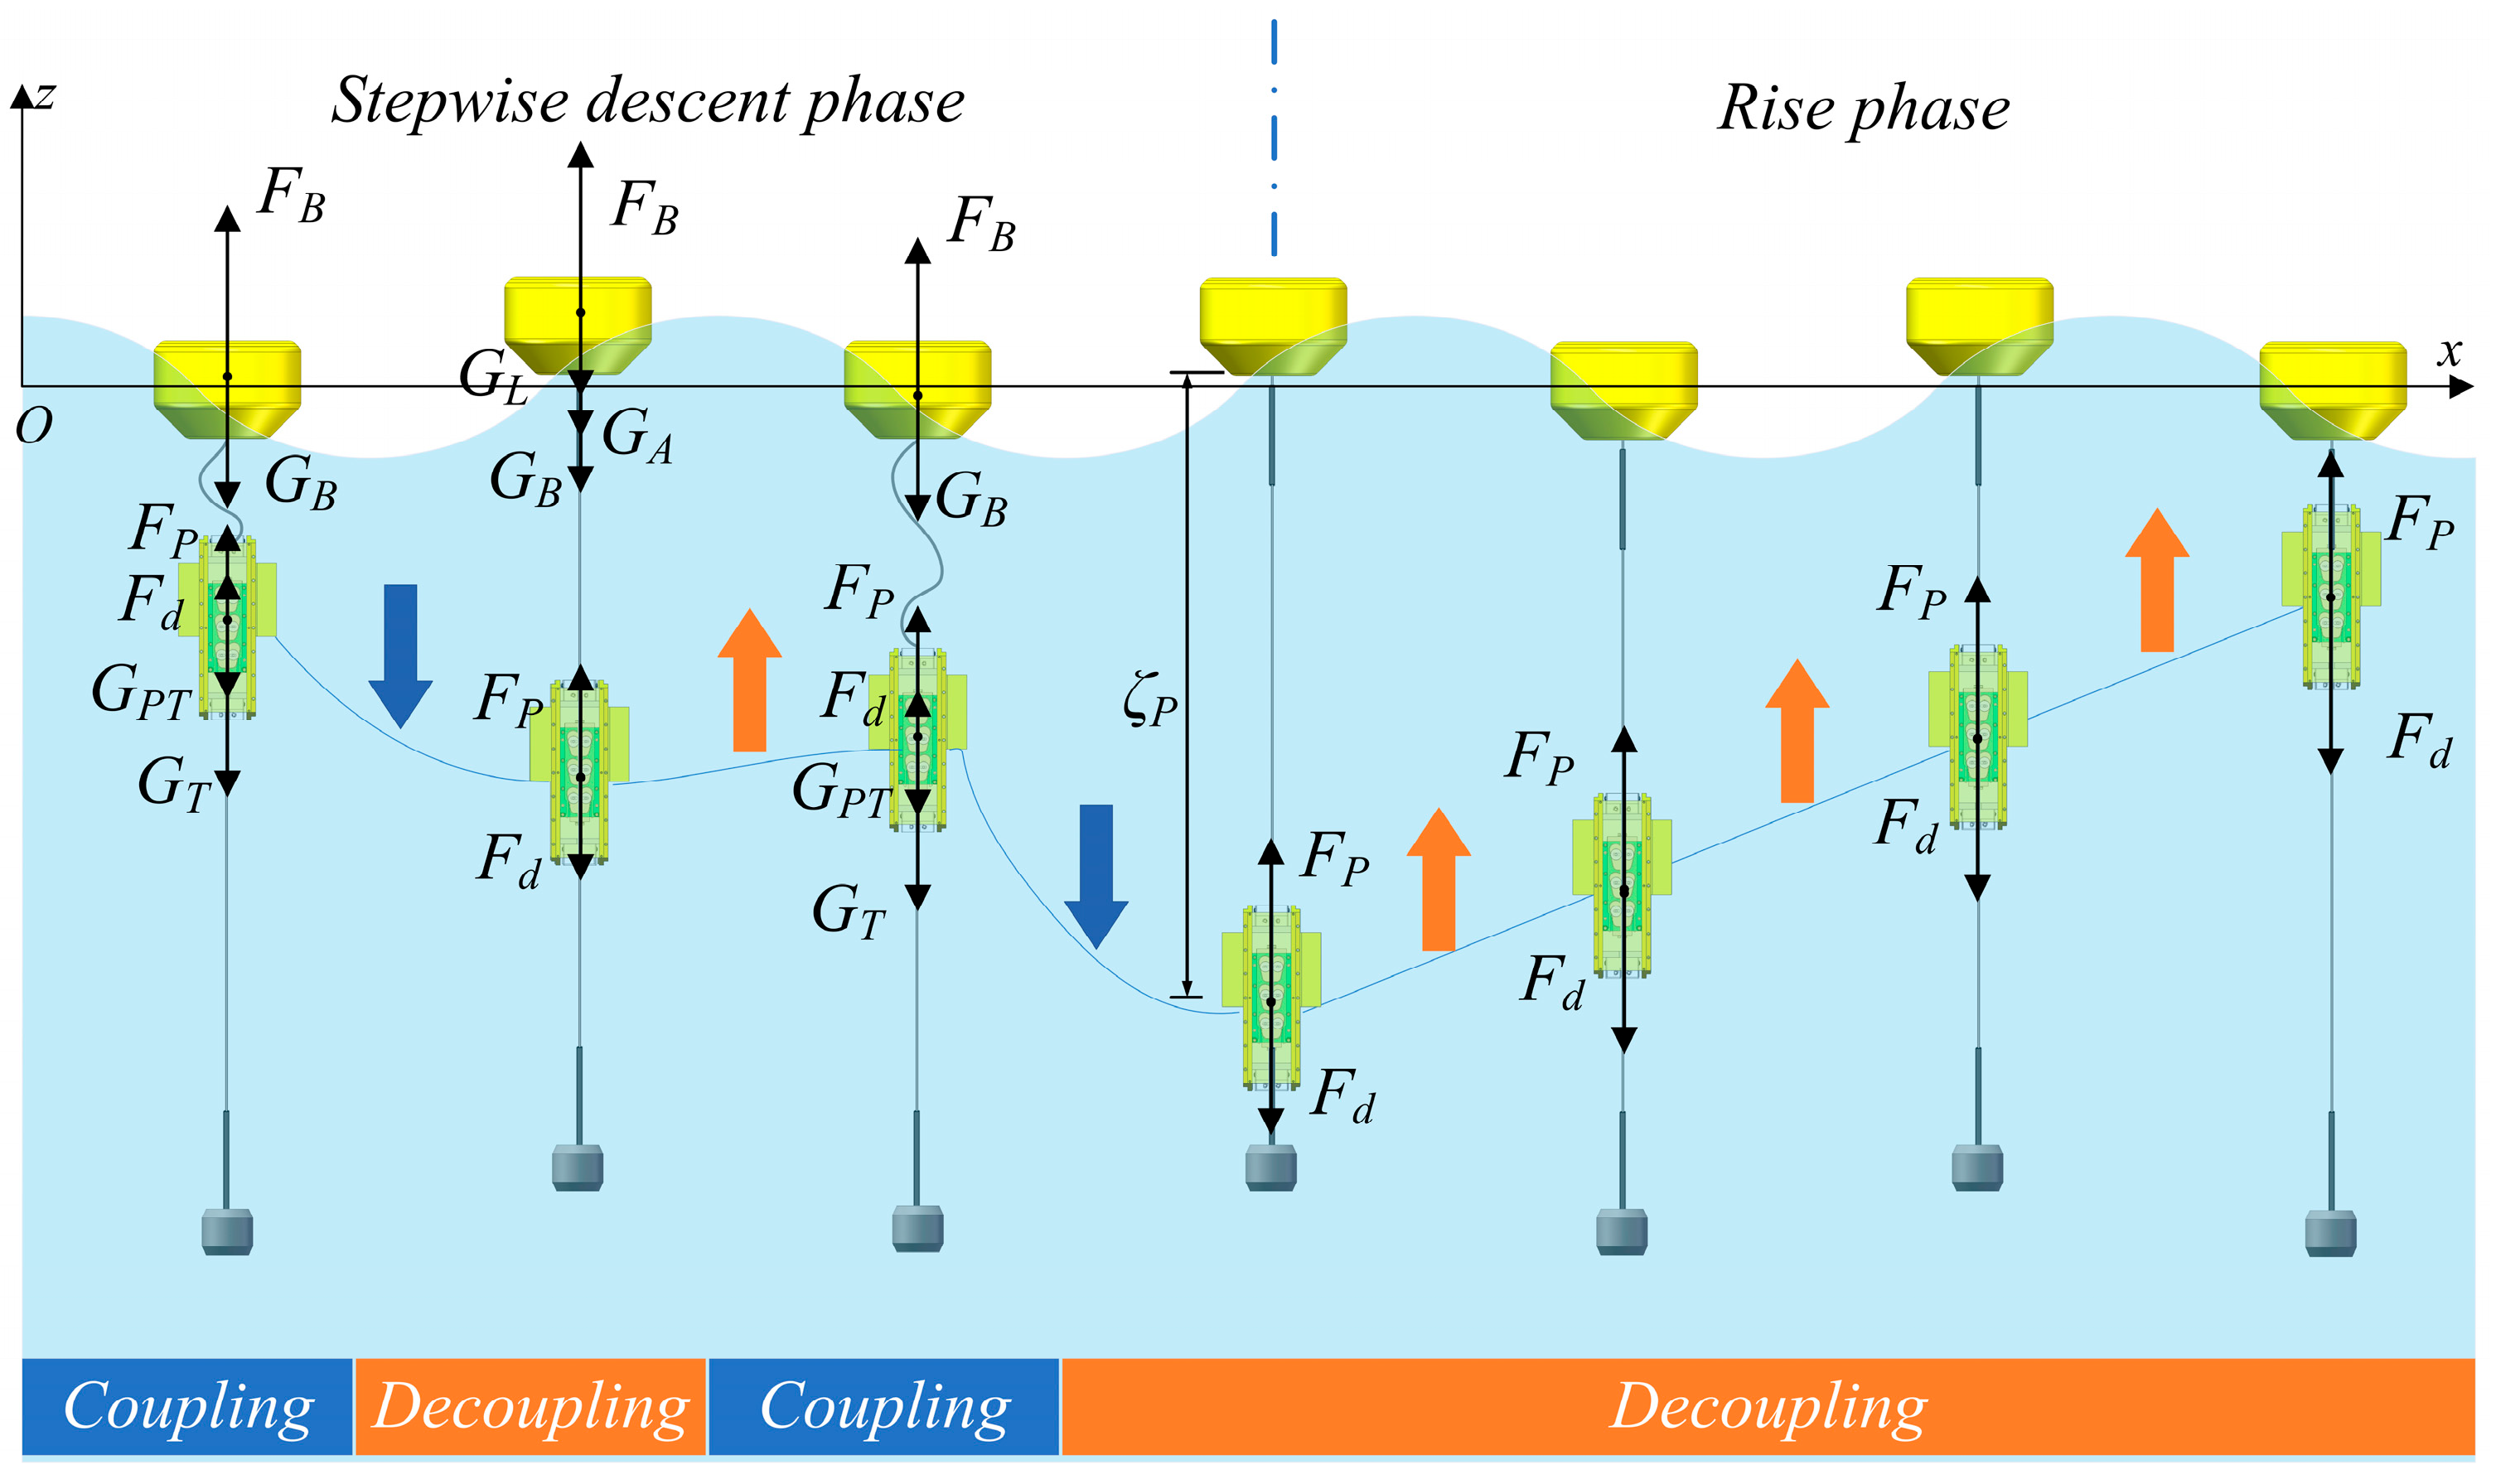
The wave energy capture, transmission, and conversion processes of the WDP can be divided into four phases: the stepwise descent phase, the underwater switching phase, the rise phase, and the surface switching phase, as shown in Figure 3. The positive z-axis direction is defined as vertically upward.
  • Stepwise descent phase
The buoy heaves with the waves, and at this point, the wave energy capture device inside the profiling platform is in an open state. When the buoy’s velocity is less than that of the profiling platform, the profiling platform enters the coupled phase. The wire rope between the buoy and the profiling platform is relaxed, and the profiling platform, the tension hammer, and the wire rope between them move together. When the velocity of the buoy is greater than that of the profiling platform, the profiling platform is decoupled. The profiling platform acquires an upward acceleration under the action of net buoyancy and hydrodynamic resistance. Each time the profiling platform repeats a coupling–decoupling phase, it completes a stepwise descent. Under the continuous excitation of waves, the buoy drives the profiling platform to complete the stepwise descent phase.
2.
Underwater switching phase
When the profiling platform reaches the bottom reversing block during its stepwise descent, a collision between the sliding plate and the bottom reversing block causes the wave energy capture device to close. The profiling platform disengages from the wire rope and enters the rise phase.
3.
Rise phase
When the wave energy capture device is closed, the profiling platform accelerates upward with a decreasing acceleration under net buoyancy and hydrodynamic resistance. Once the net buoyancy and hydrodynamic resistance on the profiling platform are balanced, it reaches its maximum rising velocity, which rises to the upper reversing block at this maximum velocity.
4.
Surface switching phase
When the profiling platform rises to the upper reversing block, the sliding plate of the wave energy capture device collides with the block. This collision triggers the wave energy capture device to switch from the closed state back to the open state, and the profiling platform subsequently repeats the stepwise descent phase. At this point, the profiling platform completes a full profiling motion from the start of the stepwise descent phase to the end of the surface switching phase.

2.1.2. Dynamics Analysis of the WDP

Comprehensive dynamic modeling of the WDP is complex because of its structural complexity and multi-degree-of-freedom motion. To facilitate the investigation of the dynamic model and wave energy conversion performance of the WDP, the following assumptions are made:
  • Based on linear wave theory, the buoy’s motion under wave excitation is assumed to be small amplitude [25], and the influence of water particle oscillation on the WDP is neglected.
  • The vertical dynamics of the WDP are analyzed exclusively, with horizontal hydrodynamic forces being neglected.
  • Neglecting the structural dimensions of each component, they are treated as equivalent to a mass point.
  • Ignoring the effect of the wire rope’s elongation. The WDP utilizes a 5 mm diameter armored wire rope with an elastic modulus of 200 GPa [26]. The effect of masses, including the tension hammer and profiling platform, on the wire rope’s elongation is negligible [27].
  • The impact duration between the sliding plate and reversing blocks in the wave energy capture device is neglected.
  • Neglect the cam’s actuation duration and stroke length in the wave energy capture device. Studies by Isaacs et al. and Pinkel et al. demonstrate that the engagement duration in the wave energy capture device is negligible compared with wave excitation or buoyancy cycles, with field experiments confirming the rapid locking of wire ropes via optimized cam mechanisms [24,28].
According to Bayoumi et al.’s study, the buoy exhibits excellent wave-following characteristics in linear waves [29,30,31]. This study assumes that the buoy exhibits perfect wave-following characteristics to facilitate the dynamic analysis of the WDP. Based on linear wave theory, the buoy’s vertical displacement, velocity, and acceleration in waves can be expressed as follows [23,24,32,33,34]:
ς B = H 2 cos ( k x σ t )
υ B = H σ 2 sinh k h cosh ( z + h ) cos ( k x σ t )
a B = H σ 2 2 sinh k h cosh ( z + h ) cos ( k x σ t ) .
where ς B , υ B , and a B are the buoy’s wave-induced displacement, vertical velocity, and vertical acceleration, H is the wave height, k is the wave number, x is the wave’s horizontal position, σ is the wave angular frequency, t is the time of wave motion, z is the free surface position, and h is the water depth. Based on linear wave theory and the WDP’s working mechanisms, the WDP’s dynamic characteristics are analyzed with reference to Figure 3.
  • The stepwise descent phase of the profiling platform
As the buoy moves from the wave crest to the wave trough, the wave energy capture device inside the profiling platform is in an open state. The cam and wire rope are mechanically coupled when the buoy’s descent velocity exceeds the profiling platform’s. The wire rope between the profiling platform and the buoy is in a slack state, and the profiling platform collides with the lower wire rope and the tension hammer. The momentum equation of collision is as follows:
m P υ P + m T + m P T υ T = m T + m P + m P T υ
where m P is the profiling platform’s mass, m T is the tension hammer’s mass, m P T is the wire rope’s mass between the profiling platform and the tension hammer, υ T is the tension hammer’s vertical velocity, and υ is the combined velocity after the collision. After the profiling platform, tension hammer, and the wire rope between them collide, they move downward as an integrated whole and gain a downward acceleration. The force equation of the profiling platform, wire rope, and tension hammer (PWT) is as follows:
F P + F d G T G P T = m T + m P + m P T a
where F P is the profiling platform’s net buoyancy, G T is the tension hammer’s gravity, G P T is the wire rope’s gravity between the profiling platform and the tension hammer, and a is the combined acceleration of the PWT. F d is the vertical hydrodynamic resistance to the profiling platform, which can be expressed as follows [2]:
F d = C d ρ S P υ P 2 2
where C d is the coefficient of resistance in the vertical direction of the profiling platform, S P is the vertical projected frontal area of the profiling platform, and ρ is the density of water. The direction of hydrodynamic resistance opposes the profiling platform’s velocity direction.
The buoy undergoes heave motion with the waves. The wire rope is tense when the buoy’s descent velocity is less than the profiling platform’s. The cam and wire rope are decoupled, and the profiling platform undergoes deceleration motion under its net buoyancy. The wire rope and the profiling platform undergo relative sliding, and the force equation for the profiling platform is as follows:
F P + F d = m P a P
where a P is the acceleration of the profiling platform in the vertical direction. The force equations of the buoy, wire rope, and tension hammer (BWT) are as follows:
F B G T G B G W = m T + m B + m W a B W T
where F B is the buoy’s buoyancy, G B is the buoy’s gravity, G W is the wire rope’s gravity, m W is the wire rope’s mass, and a B W T is the combined acceleration of the BWT.
When the buoy moves towards the wave crest, the wire rope is tense. The buoy drives the tension hammer into motion, while the profiling platform remains decoupled. When the motion direction of the profiling platform changes, the force conditions of the profiling platform are as follows:
F P F d = m P a P
The BWT system force balance is governed by Equation (8).
The cam and wire rope are mechanically coupled when the buoy’s rising velocity is less than the profiling platform’s. The profiling platform collides with the tension hammer and the wire rope, and the momentum conservation equation is the same as Equation (4). The wire rope between the buoy and the profiling platform is slack after the collision. The PWT moves together, and its force conditions are as follows:
F P F d G T G P T = m T + m P + m P T a
Until the buoy’s velocity exceeds that of the profiling platform, the profiling platform enters the decoupling phase again. The profiling platform performs stepwise descent motion following the coupling–decoupling process. When the wave energy capture device in the profiling platform collides with the bottom reversing block, it switches to a closed state, and the profiling platform enters the rise phase.
2.
The rise phase of the profiling platform
The rise phase of the profiling platform consists of two processes:
(1)
Accelerating rise phase with decreasing acceleration
When the wave energy capture device is closed, the profiling platform begins to rise because of the net buoyancy. The force equation is as follows:
F P 1 2 C d ρ S P υ u 2 = m P a P
where υ u is the vertical rising velocity of the profiling platform.
(2)
Constant-velocity rise phase
When the wire rope is sufficiently long, the profiling platform accelerates to an equilibrium state where the net buoyancy equals the hydrodynamic resistance, and the maximum rising velocity is attained. The force equation is as follows:
F P 1 2 C d ρ S P υ u 2 = 0
The maximum rising velocity of the profiling platform is
υ max = 2 F P C d ρ S P
where υ max is the maximum rising velocity of the profiling platform.
Upon collision between the wave energy capture device in the profiling platform and the upper reversing block, the device transitions from a closed state to an open state. The profiling platform then initiates its stepwise descent phase.

2.1.3. Analysis of Wave-Driven Performance

During the profiling platform’s stepwise descent from near-surface waters to the bottom reversing block, its low-velocity regime renders hydrodynamic resistance negligible. The useful work captured by the wave-driven profiling platform is defined as the sum of the net buoyancy potential energy and the kinetic energy of the platform when it reaches the lowest point of the wire rope. The useful work for a single profiling process is calculated as follows:
E P = F P L cos α + 1 2 m p v d 2
where E P is the useful work for a single profiling process, L is the wire rope’s length, α is the vertical angle of the wire rope, and v d is the profiling platform’s descent velocity.
The useful power of the profiling platform to complete a profiling process is calculated as follows:
P P = E P T d
where P P is the useful power of the profiling platform and T d is the descent time of the profiling platform.
In real seas, the descent time of the profiling platform exhibits stochastic variation due to the influences of the sea state. Therefore, the effect of different sea states on the useful power of the profiling platform is minimized by calculating the mean of multiple descent times. The mean useful power of the profiling platform is calculated as follows:
P P ¯ = 1 n E P 1 n T d
where P P ¯ is the mean useful power of the profiling platform and n is the number of groups of useful work and corresponding descent time.
During the stepwise descent phase, the net buoyancy of the profiling platform and the length of the wire rope remain unchanged. The tension hammer at the bottom of the wire rope has a larger mass, resulting in a smaller α. Therefore, Equation (16) can be simplified, and the mean useful power of the profiling platform is expressed as follows:
P P ¯ = F p υ d ¯ + 1 2 m p v d ¯ a p
where υ d ¯ is the mean descent velocity of the profiling platform.
For regular waves, the mean wave power obtained by the buoy is expressed as [32,35,36,37]
P B ¯ = ρ g 2 H 2 T D 32 π
where P B ¯ is the mean wave power obtained by the buoy and D is the dimension of the buoy.
The wave energy conversion efficiency of the WDP can be expressed as [34,38]
η P = P P ¯ P B ¯
where η P is the wave energy conversion efficiency of the WDP.

2.2. Description of Methodology

2.2.1. Construction of Experimental Facility

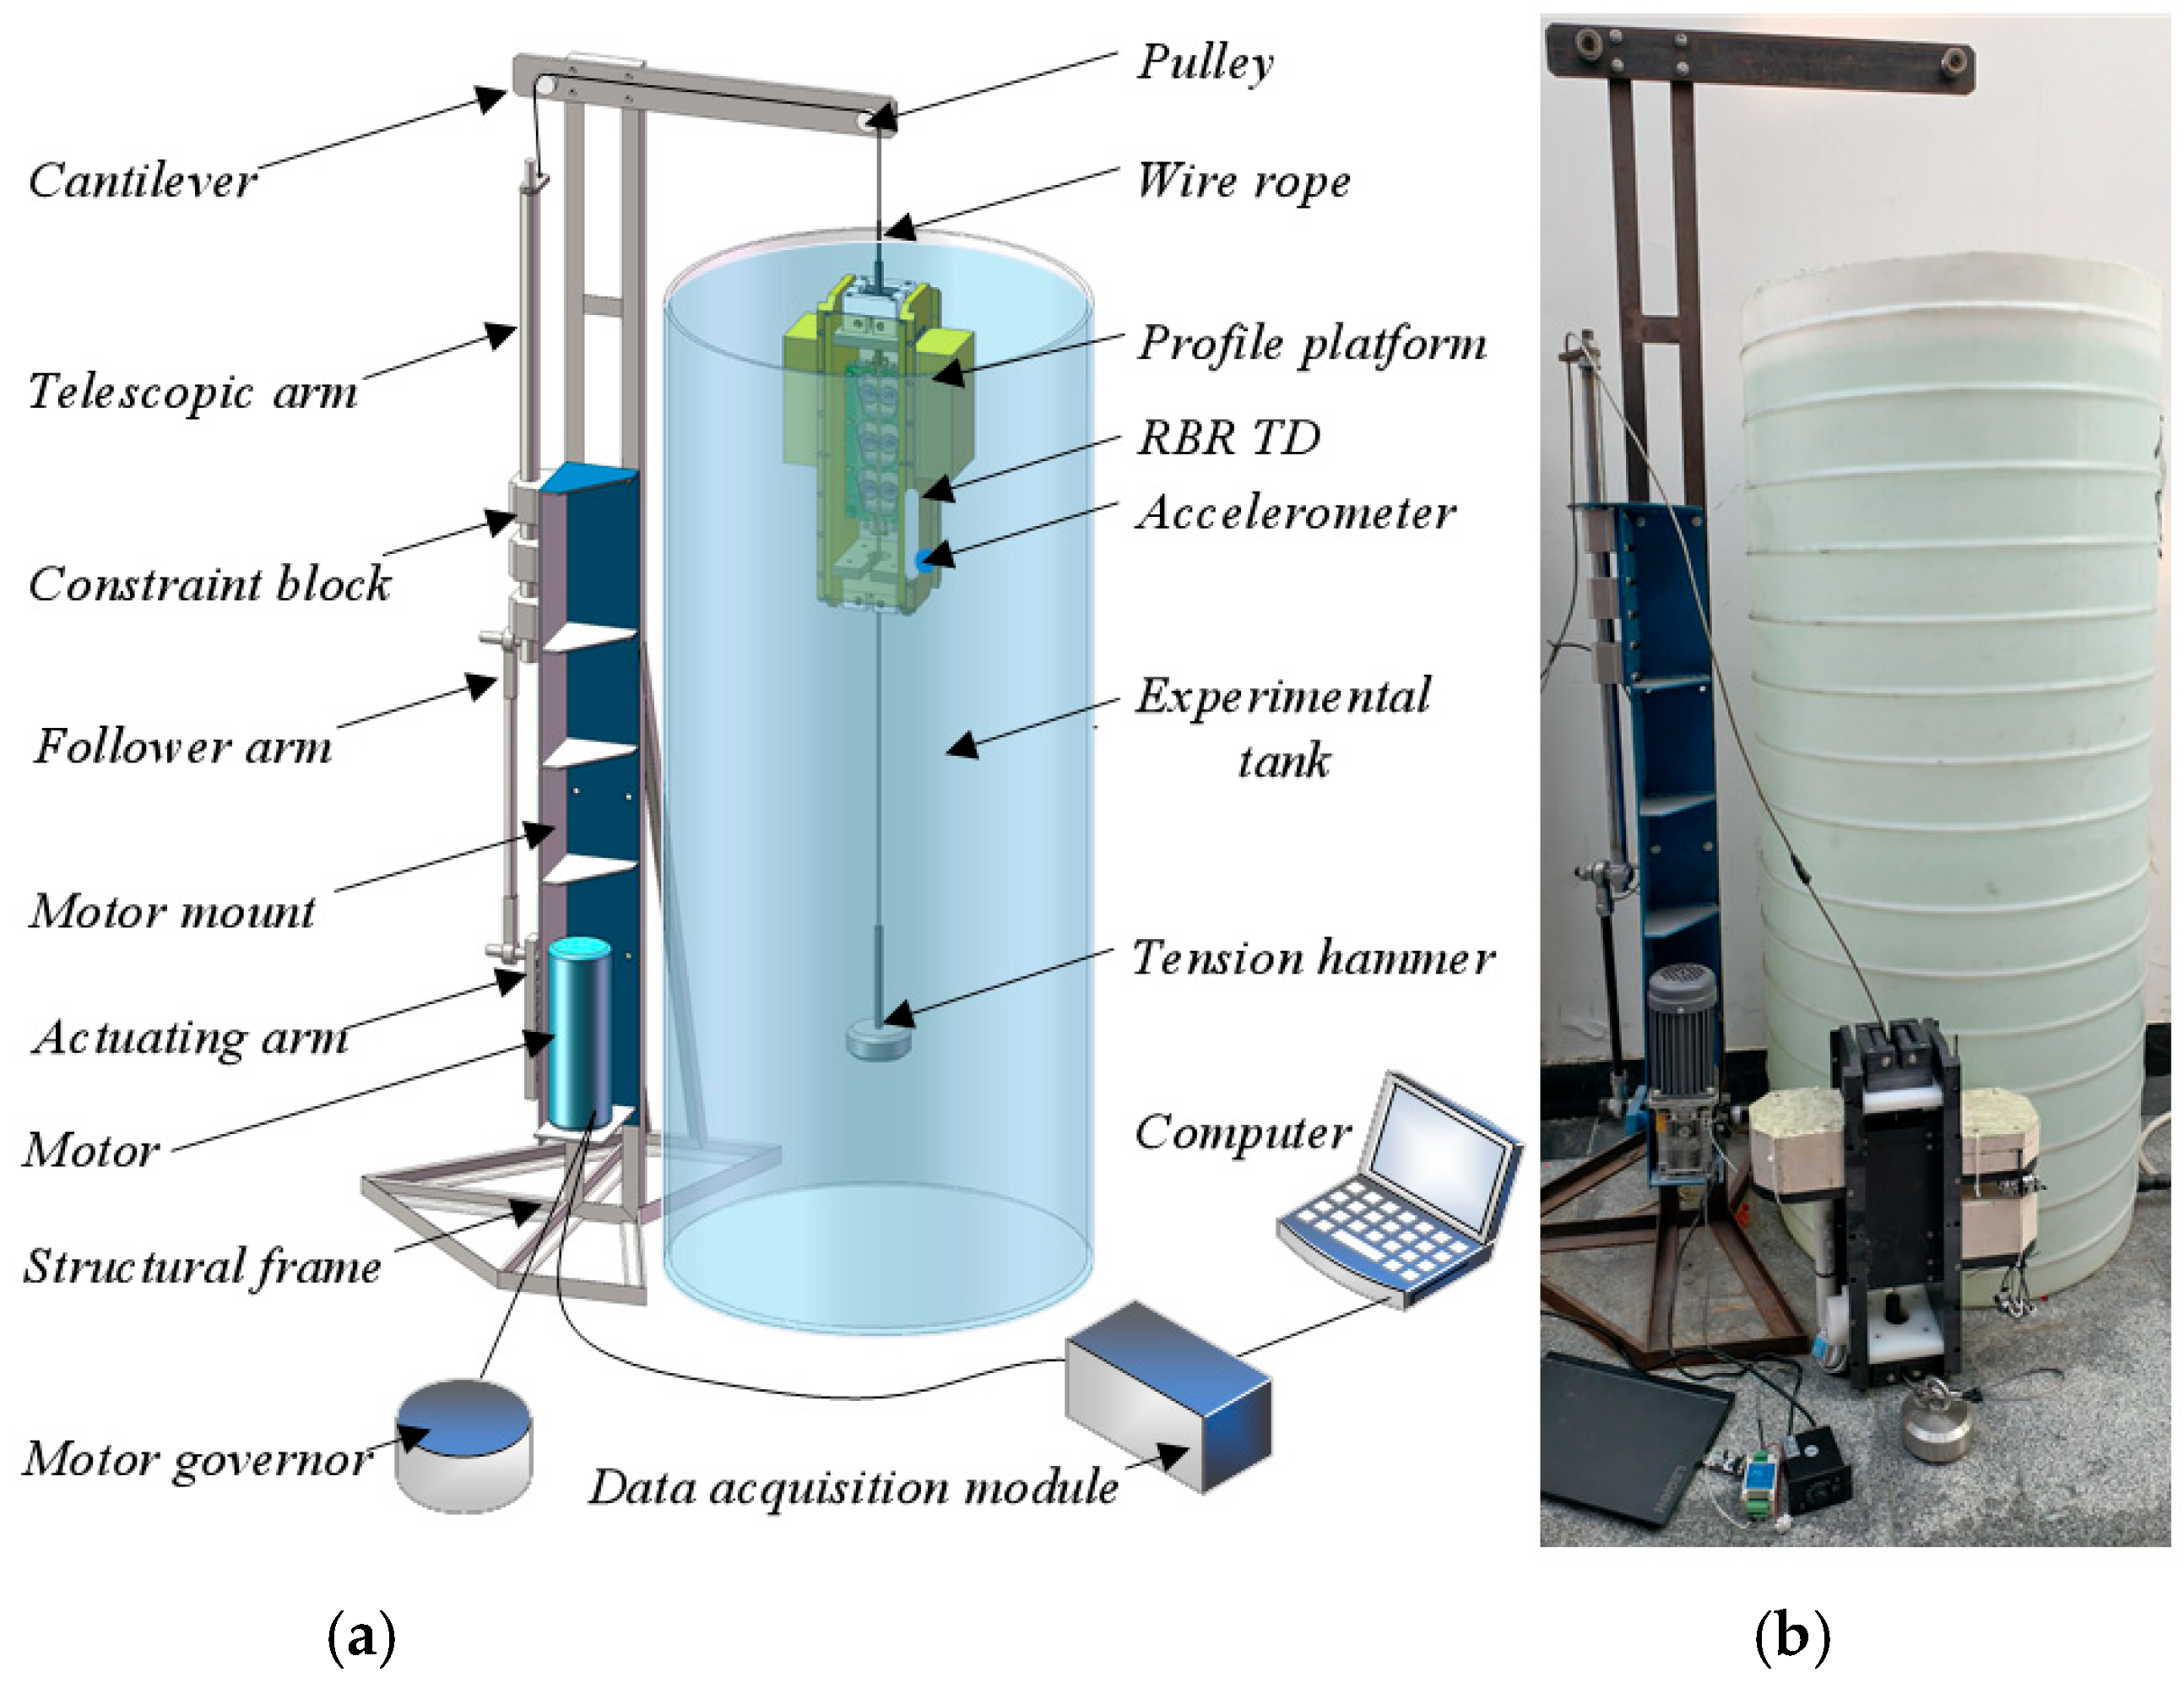
To quantitatively analyze the influence and mechanism of wave parameters and the net buoyancy of the profiling platform on the wave energy conversion performance of the WDP, we have constructed an experimental tank facility. This facility can independently control wave height and wave period, facilitating in-depth research on the WDP’s performance and mechanism in a controlled environment. The experimental tank facility of the WDP consists of a structural frame, motor, actuating arm, follower arm, telescopic arm, constraint blocks, pulley, cantilever, wire rope, experimental tank, profiling platform, tension hammer, accelerometer, temperature–depth sensor, and angular displacement sensor, as illustrated in Figure 4. The crank mechanism, formed by the actuating arm and follower arm, begins to rotate under motor actuation. The telescopic arm connected to the follower arm converts rotational motion into vertical reciprocating motion through the constraint blocks, simulating the heave motion of the buoy in waves. The wire rope passes through pulleys on the cantilever, connecting the end of the telescopic arm to the tension hammer. An accelerometer is horizontally mounted on the lateral skeletal structure of the profiling platform, while a temperature–depth sensor is vertically fixed to the same structure. The angular displacement sensor is installed inside the motor. The profiling platform and tension hammer are then immersed in the experimental tank. When the motor is started, the experimental tank facility begins to simulate the heave motion of the buoy under conditions of different wave parameters, thereby driving the profiling platform to perform longitudinal reciprocating motion.
The experiment facility uses a 71K400RV-CRF single-phase speed-regulating motor produced by Taizhou Aoqili Electromechanical Co., Ltd. in Taizhou, China. Multiple positioning holes on the crank allow for the adjustment of the crank radius, thereby simulating different wave height parameters. The rotation speed of the crank is converted into 4–20 mA current signals via a GTCV13636 magnetic induction angular displacement sensor produced by Taizhou Quantum Electronics Technology Co., Ltd. in Taizhou, China. The PH-mA20-485 data acquisition module produced by Shanghai Penghe Electronics Technology Co., Ltd. in Shanghai, China converts the current signal into angular displacement, which is then converted into the wave period. The crank’s rotational speed is modified by adjusting the speed regulator’s duty cycle to achieve precise control over wave period simulation. The profiling platform is fully submerged in the tank. Counterweights are added or removed on both sides of the profiling platform to establish neutral buoyancy in the water. Subsequently, removing the counterweight changes the net buoyancy of the profiling platform. The WT901SDCL accelerometer produced by WitMotion Shenzhen Co, Ltd. in Shenzhen, China monitors the triaxial acceleration of the profiling platform, while the RBR-TDR-1060 temperature–depth sensor produced by RBR Ltd. in Ottawa, Canada measures its vertical displacement. The key technical specifications of the sensors are detailed in Table 1. Experimental data records include the profiling platform’s start and end timestamps for each profiling motion cycle and variations in wave period, wave height, displacement, and acceleration. Under each operational condition, the profiling platform completes eight motion cycles. The results are averaged to mitigate experimental errors.
Factors such as the experimental conditions, device operation, and reading errors can introduce uncertainties in physical experiments. Therefore, uncertainty analysis is commonly used to evaluate the accuracy of experimental results. The uncertainties in this experiment stem from the measurement accuracy of the angular displacement sensor, accelerometer, temperature–depth sensor, and data acquisition module, whose specific values are provided in Table 2. The formula for calculating total uncertainty is as follows [39]:
U = U 1 2 + U 2 2 + U 3 2 + U 4 2
where U is the total uncertainty. An uncertainty analysis was performed, which yielded a combined uncertainty of 1.13% for the experimental system. This value indicates high measurement accuracy and good reliability, thus providing reliable support for the conclusions drawn in this study regarding wave energy conversion efficiency and dynamic performance.

2.2.2. Experimental Parameters

According to the wind–wave characteristics of typical sea conditions, the range of experimental parameters is determined by the wave parameters under sea state 1–2 [40]. The experimental tank facility’s stability constrains the wave period parameter selection. Experimental measurements show that the duty cycle of the motor speed regulator, ranging from 50% to 80%, corresponds to a wave period ranging from 2.9 s to 1.95 s. When T < 1.95 s, the experimental tank facility of the WDP exhibits resonant instability; when T > 2.9 s, the velocity of the profiling platform is too slow to perform a stepwise descent. The maximum dimension of the actuating arm in the experimental tank facility constrains the selection of wave height parameters. From the nearest to farthest positions, the positioning holes on the actuating arm correspond to simulated wave height parameters ranging from 0.2 m to 0.6 m. Moreover, when the net buoyancy of the profiling platform exceeds 5 N, the rising velocity of the profiling platform is too fast, and the experimental tank facility cannot capture the motion characteristics of the profiling platform. The selection of the drag coefficient of the profiling platform is based on the study by Zhao et al. [2]. Physical parameters such as the mass of the profiling platform, its external dimensions, and the mass of the tension hammer in the WDP are determined based on the physical prototype. The parameters of the experimental tank facility are detailed in Table 3.

3. Results

3.1. The Influence of Wave Parameters

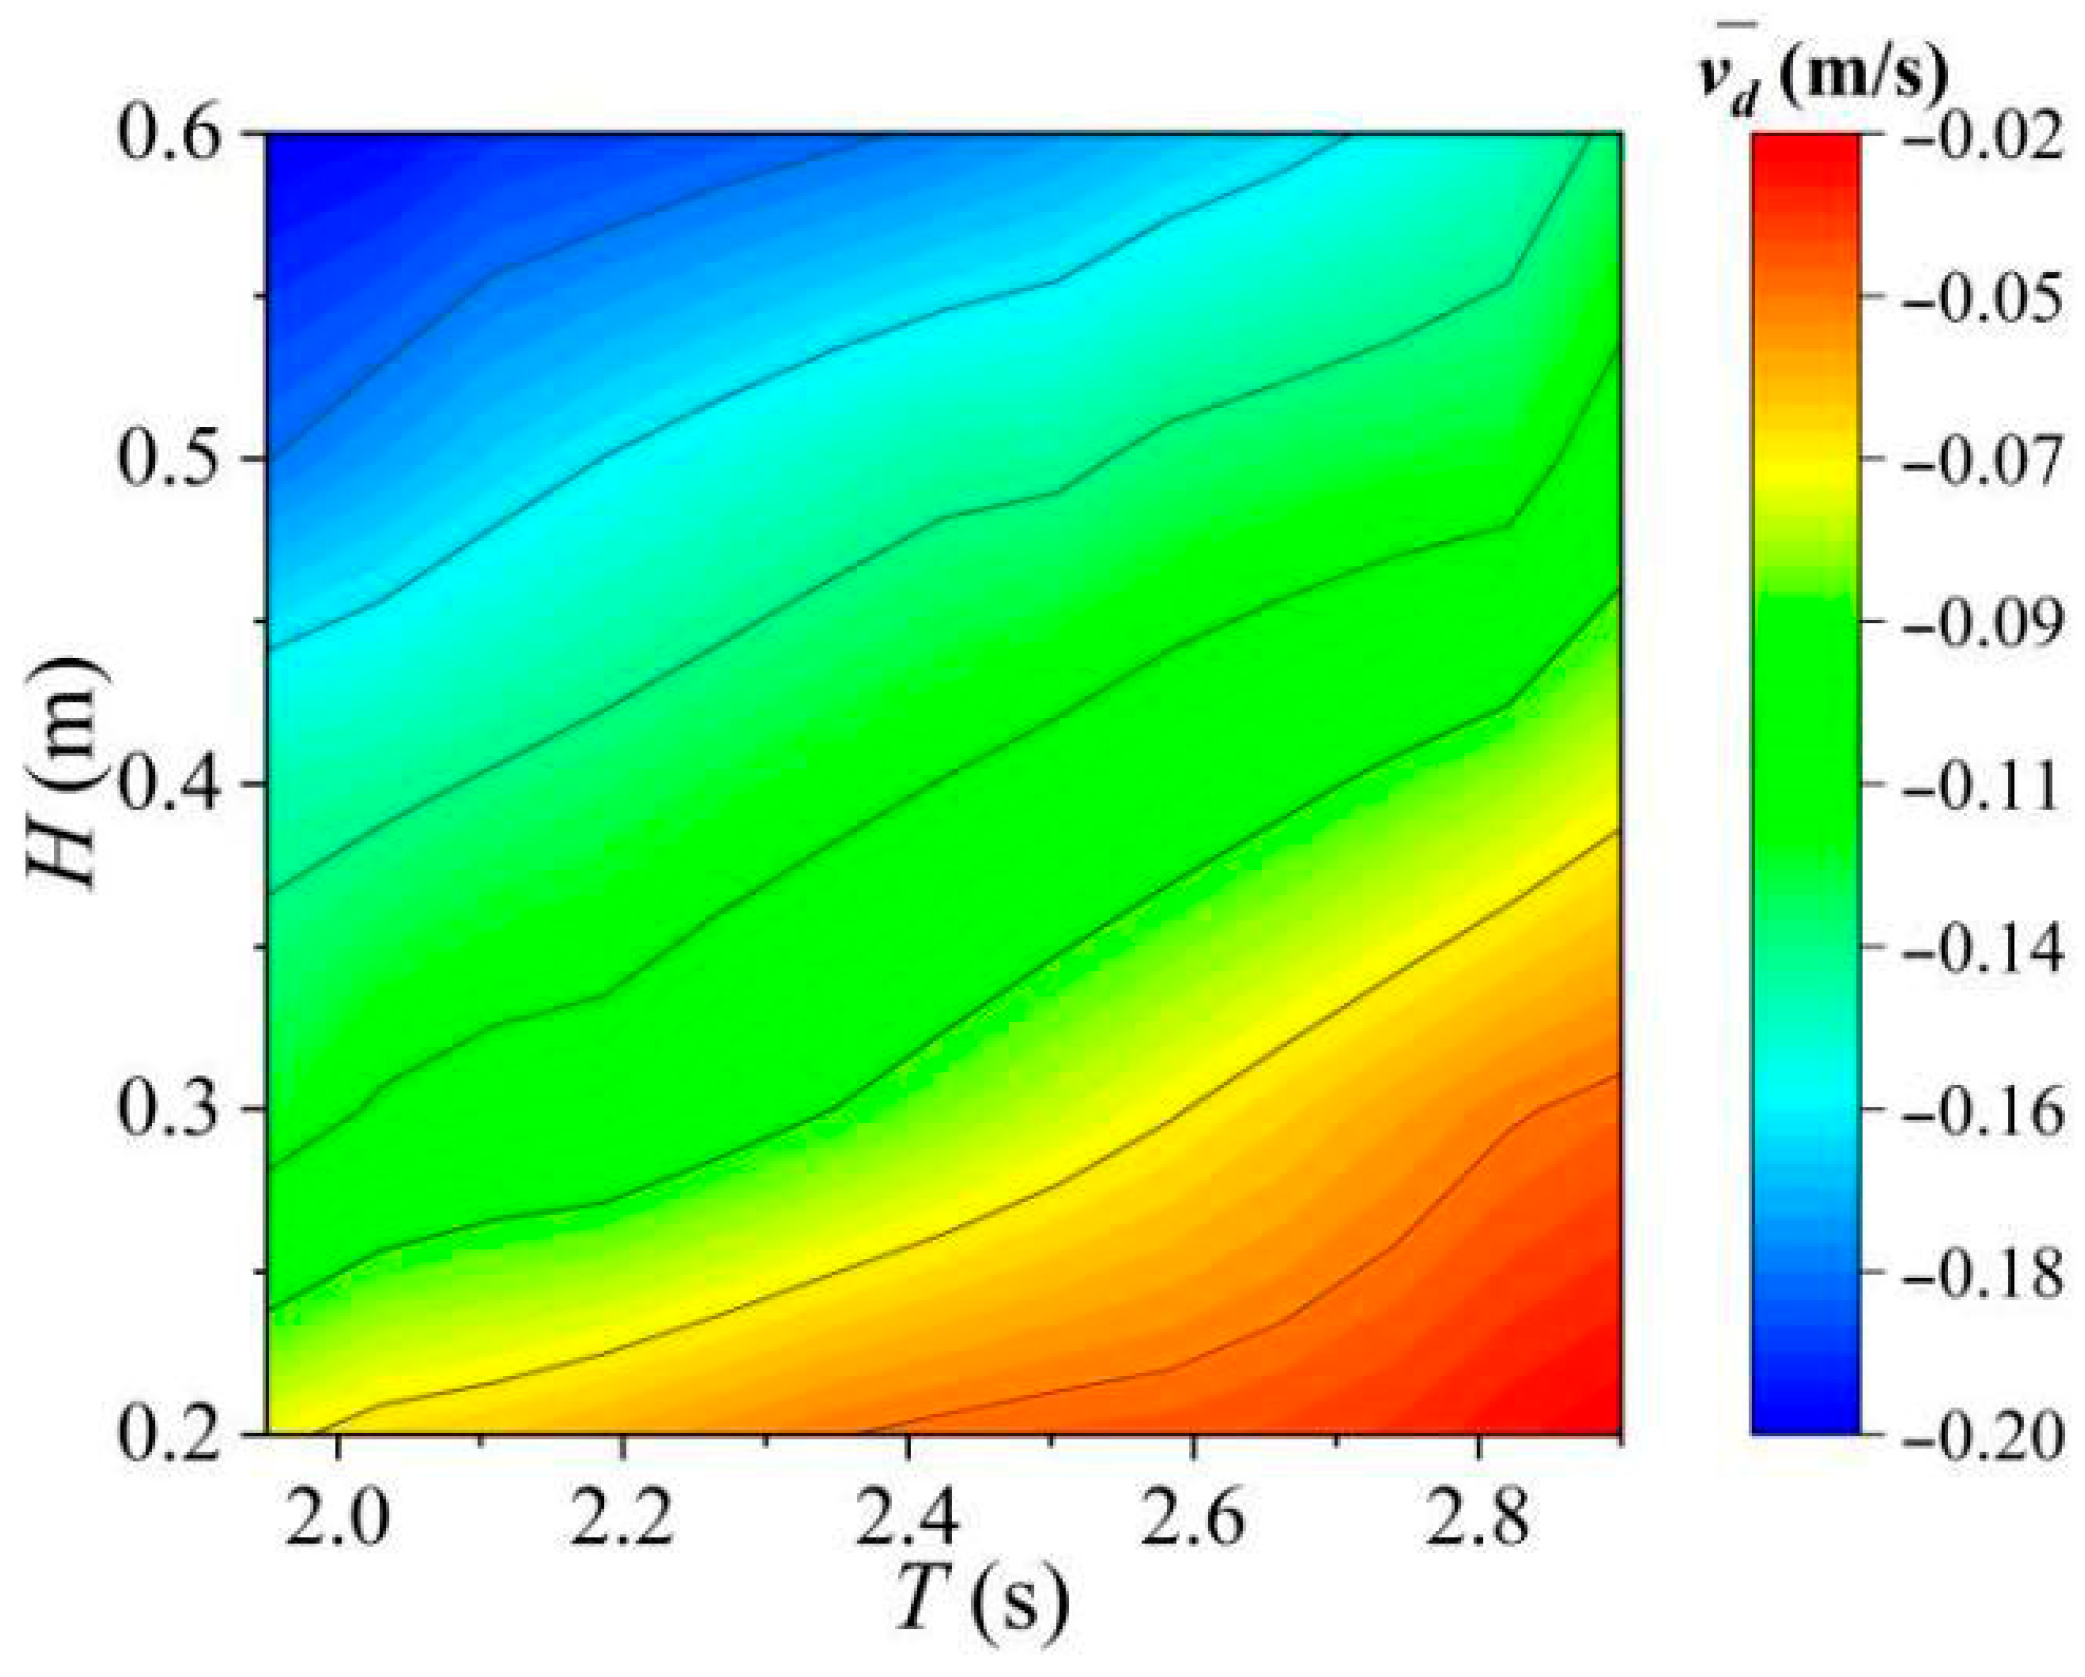
This section investigates the influence of wave parameters on the wave energy conversion performance of the WDP. Figure 5 displays the contour map of the profiling platform’s mean descent velocity within the parameter space defined by wave height and wave period. Figure 5 shows that as the wave height increases, the mean descent velocity of the profiling platform also increases. When T = 2.9 s, the profiling platform’s mean descent velocities at H = 0.2 m, H = 0.4 m, and H = 0.6 m are −0.024 m/s, −0.07 m/s, and −0.13 m/s, respectively. Compared with when H = 0.2 m, the velocity increases by 191.7% at H = 0.4 m and 441.7% at H = 0.6 m. The further observation of Figure 5 also reveals that under the same wave height, the mean descent velocity of the profiling platform decreases as the wave period increases. When H = 0.6 m, the mean descent velocities of the profiling platform at T = 1.95 s, T = 2.5 s, and T = 2.9 s are −0.2 m/s, −0.17 m/s, and −0.13 m/s, respectively. Compared with T = 1.95 s, the mean descent velocities at T = 2.5 s and T = 2.9 s decreased by 15% and 35%, respectively. As the wave height increases, the dynamic performance of the WDP is significantly enhanced; whereas as the wave period increases, the dynamic performance of the WDP is significantly reduced. Therefore, the WDP achieves superior dynamic performance under shorter wave periods and higher wave heights.
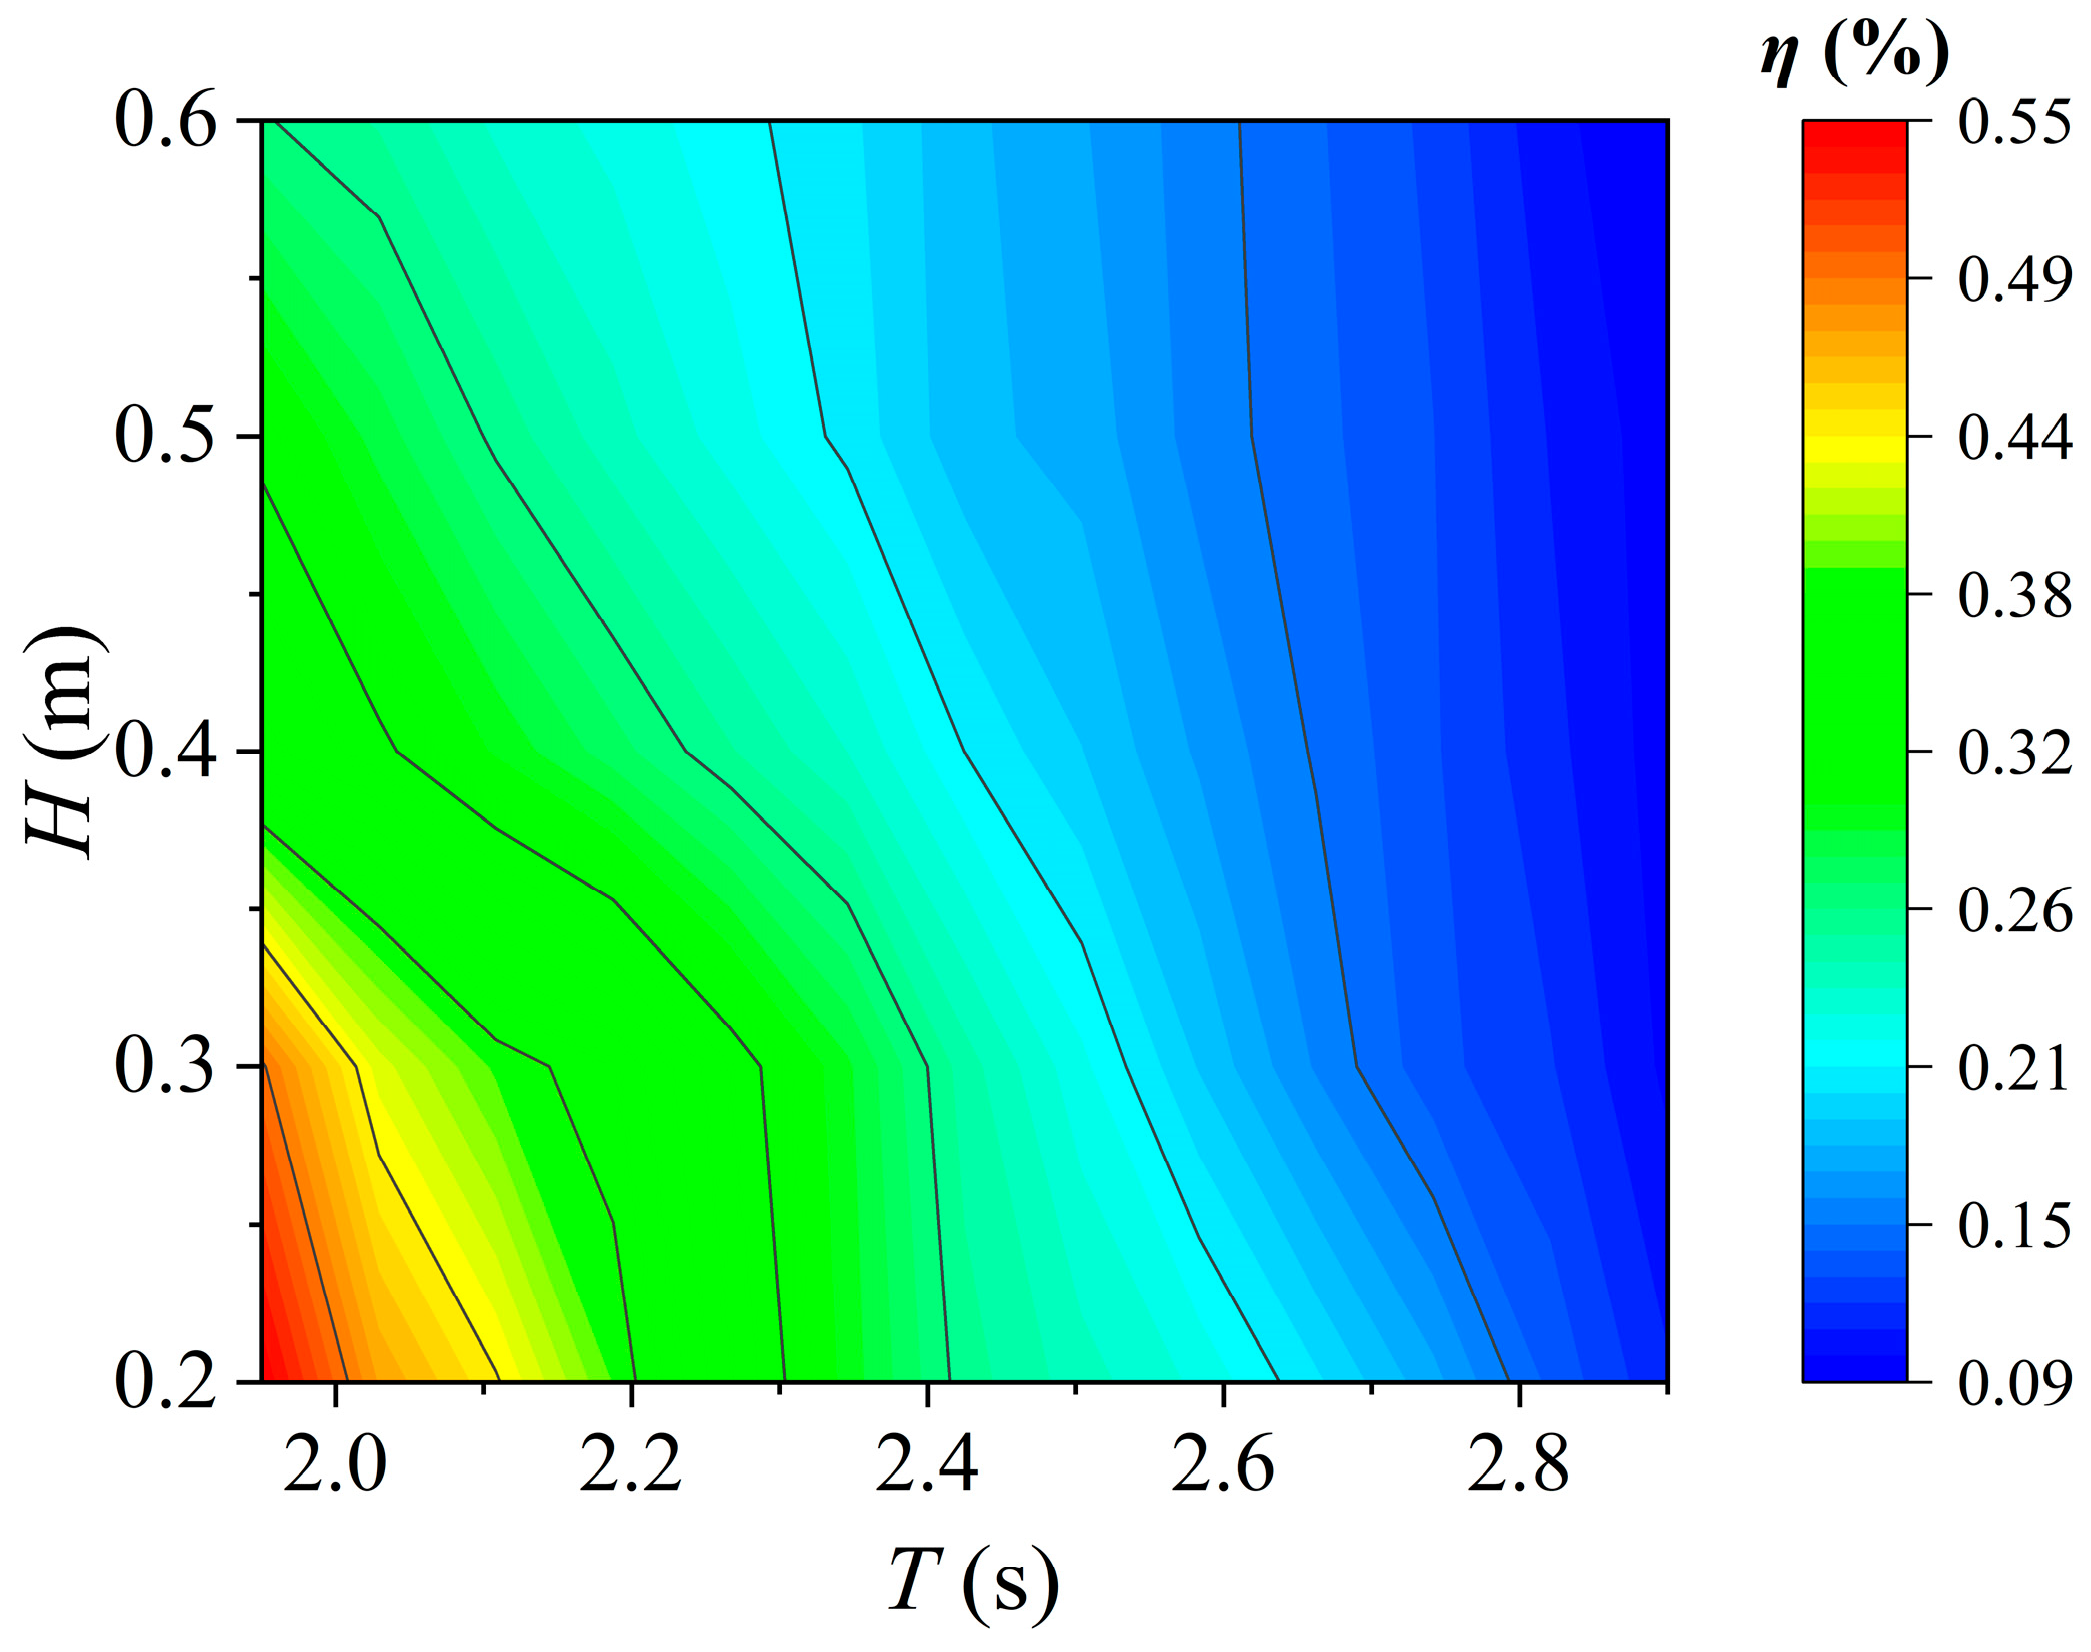
Figure 6 presents the contour map of wave energy conversion efficiency for the WDP within the wave height and wave period parametric space. As shown in Figure 6, the wave energy conversion efficiency of the WDP decreases as the wave period increases. When H = 0.2 m, as the wave period increases from T = 1.95 s to T = 2.9 s, the wave energy conversion efficiency decreases from 0.55% to 0.26%. Compared with T = 1.95 s, the efficiency of the WDP at T = 2.9 s decreased by 53%. The further observation of Figure 6 reveals that the wave energy conversion efficiency of the WDP also decreases as the wave height increases. At T = 2.5 s, as the wave height increases from H = 0.2 m to H = 0.6 m, the efficiency decreases from 0.22% to 0.15%. Compared with H = 0.2 m, the efficiency at H = 0.6 m decreased by 32%. The WDP exhibits a higher wave energy conversion efficiency under shorter wave periods and lower wave heights. Furthermore, we also found that the wave energy conversion efficiency of the WDP is relatively low. This is because we define useful work as the sum of the potential energy from net buoyancy and the kinetic energy of the profiling platform, thereby more directly characterizing the wave energy conversion performance. The calculation of the useful work of the profiling platform also neglected the work done by hydrodynamic drag, thereby leading to the observed low efficiency. Similar conclusions were reported by Zhang et al. in their study on profilers’ wave energy conversion performance [41,42,43].
The mean descent velocity of the profiling platform decreases as the wave period increases, thereby reducing the useful power of the profiling platform. Since the wave energy captured by the buoy increases with the increase in wave period, the wave energy conversion efficiency of the profiler decreases. When wave height increases, both the useful power of the profiling platform and the mean power of the wave energy captured by the buoy increase. However, the wave energy conversion efficiency of the WDP decreases with increasing wave height. We speculate that the increased energy loss ratio in WDP is attributed to the enhanced wave energy loss with increasing wave height. As the wave height increases, the profiling platform moves more violently and needs to consume more energy to overcome the work done by hydrodynamic resistance. Furthermore, more violent collisions may occur inside the WDP, resulting in part of the captured energy failing to be converted into the mechanical energy of the profiling platform.

3.2. The Influence of Net Buoyancy of Profiling Platform

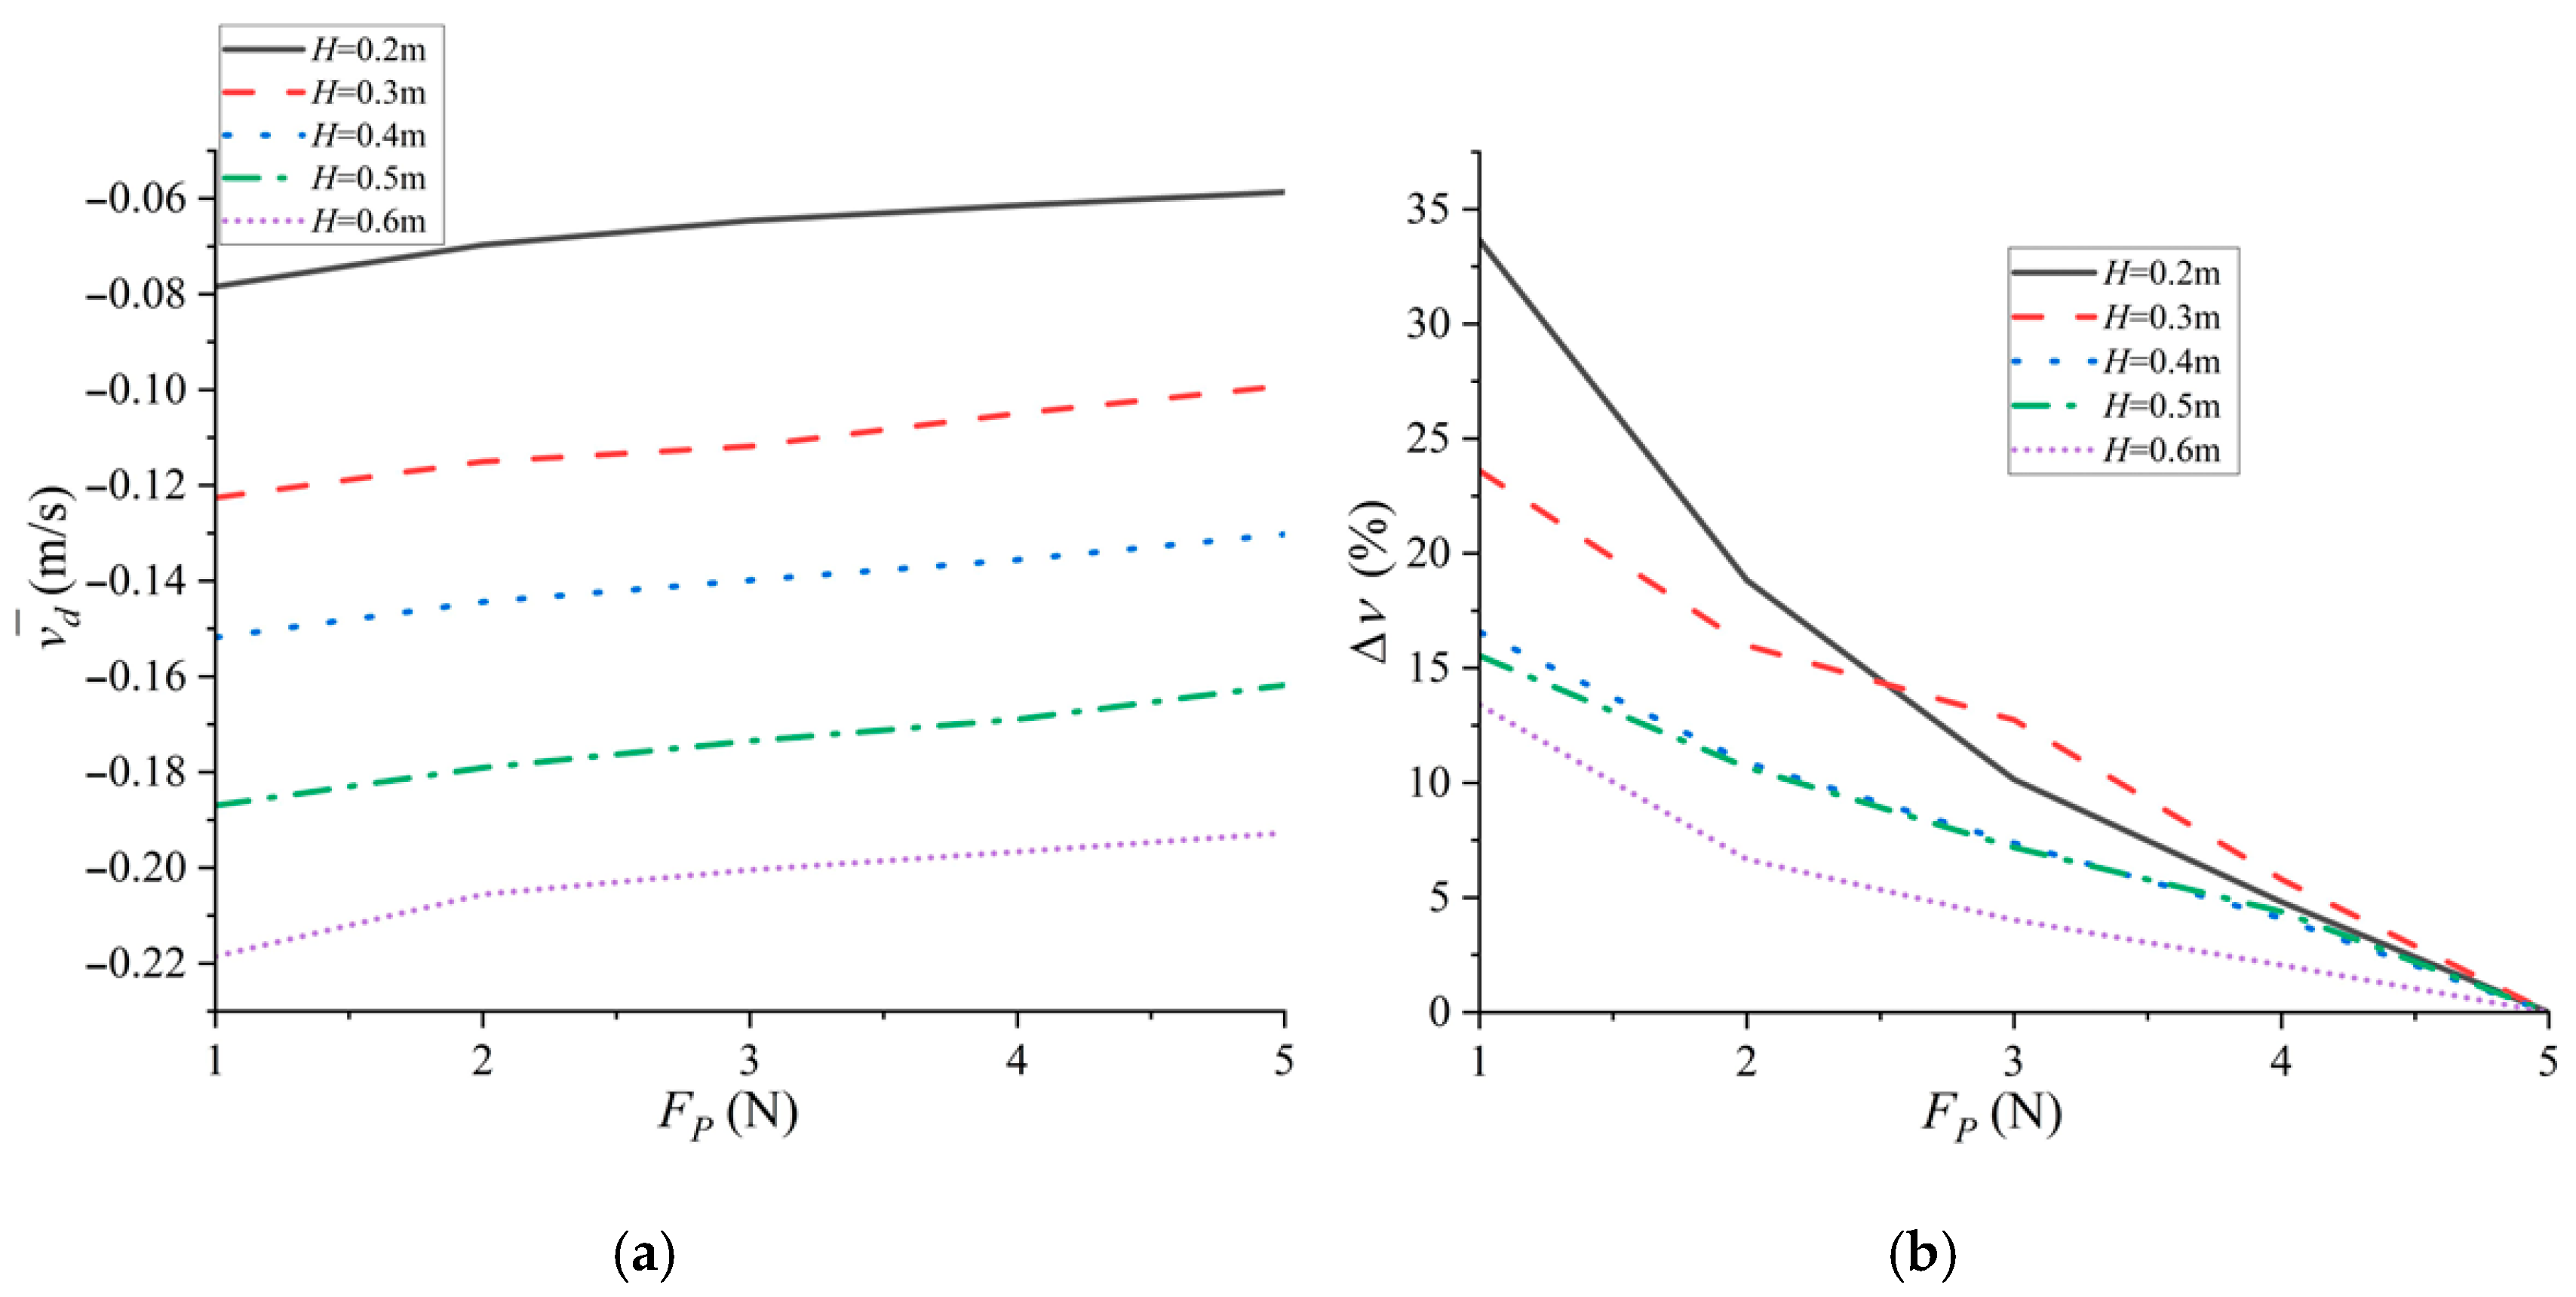
This section elaborates on the influence of the net buoyancy of the profiling platform on the wave energy conversion performance of the WDP. Figure 7 shows the evolution curves of the profiling platform’s mean descent velocity and variation rate as a function of net buoyancy under different wave heights. The mean descent velocity of the profiling platform under FP = 5 N is selected as the reference value for the mean descent velocity. The variation rate in the mean descent velocity of the profiling platform is defined as the percentage of the difference between the descent velocities under varying conditions and the reference value. The formula for the mean descent velocity variation rate of the profiling platform is as follows:
Δ v = ( v d ¯ v b a s e ¯ ) / v b a s e ¯
where Δ v is the variation rate of the mean descent velocity of the profiling platform and v b a s e ¯ is the mean descent velocity of the profiling platform for FP = 5 N. Figure 7a demonstrates that the mean descent velocity of the profiling platform decreases with increasing net buoyancy. At H = 0.2 m, when the profiling platform’s net buoyancy increases from FP = 1 N to FP = 5 N, the mean descent velocity of the profiling platform reduces from −0.078 m/s to −0.058 m/s. Compared with FP = 1 N, the mean descent velocity of the profiling platform at FP = 5 N exhibits a reduction of 25.6%. Figure 7b shows that the velocity variation rate decreases with the increasing net buoyancy of the profiling platform. Under H = 0.2 m, when the profiling platform’s net buoyancy increases from FP = 1 N to FP = 3 N, the variation rate of the mean descent velocity of the profiling platform decreases from 34% to 10%. Furthermore, Figure 7b reveals that under a lower wave height, the variation rate of the profiling platform’s mean descent velocity changes more significantly with reductions in net buoyancy. When the profiling platform’s net buoyancy decreases from FP = 3 N to FP = 1 N at H = 0.2 m, the variation rate of the mean descent velocity of the profiling platform increases by 24%. In contrast, a decrease from FP = 5 N to FP = 3 N results in only a 10% increase. An increased net buoyancy of the profiling platform degrades the WDP’s dynamic performance and reduces the variation rate in the profiling platform’s mean descent velocity. Specifically, smaller net buoyancy values enhance superior dynamic performance. Under a lower wave height, reductions in net buoyancy induce more pronounced variations in the rate of variation in the profiling platform’s mean descent velocity.
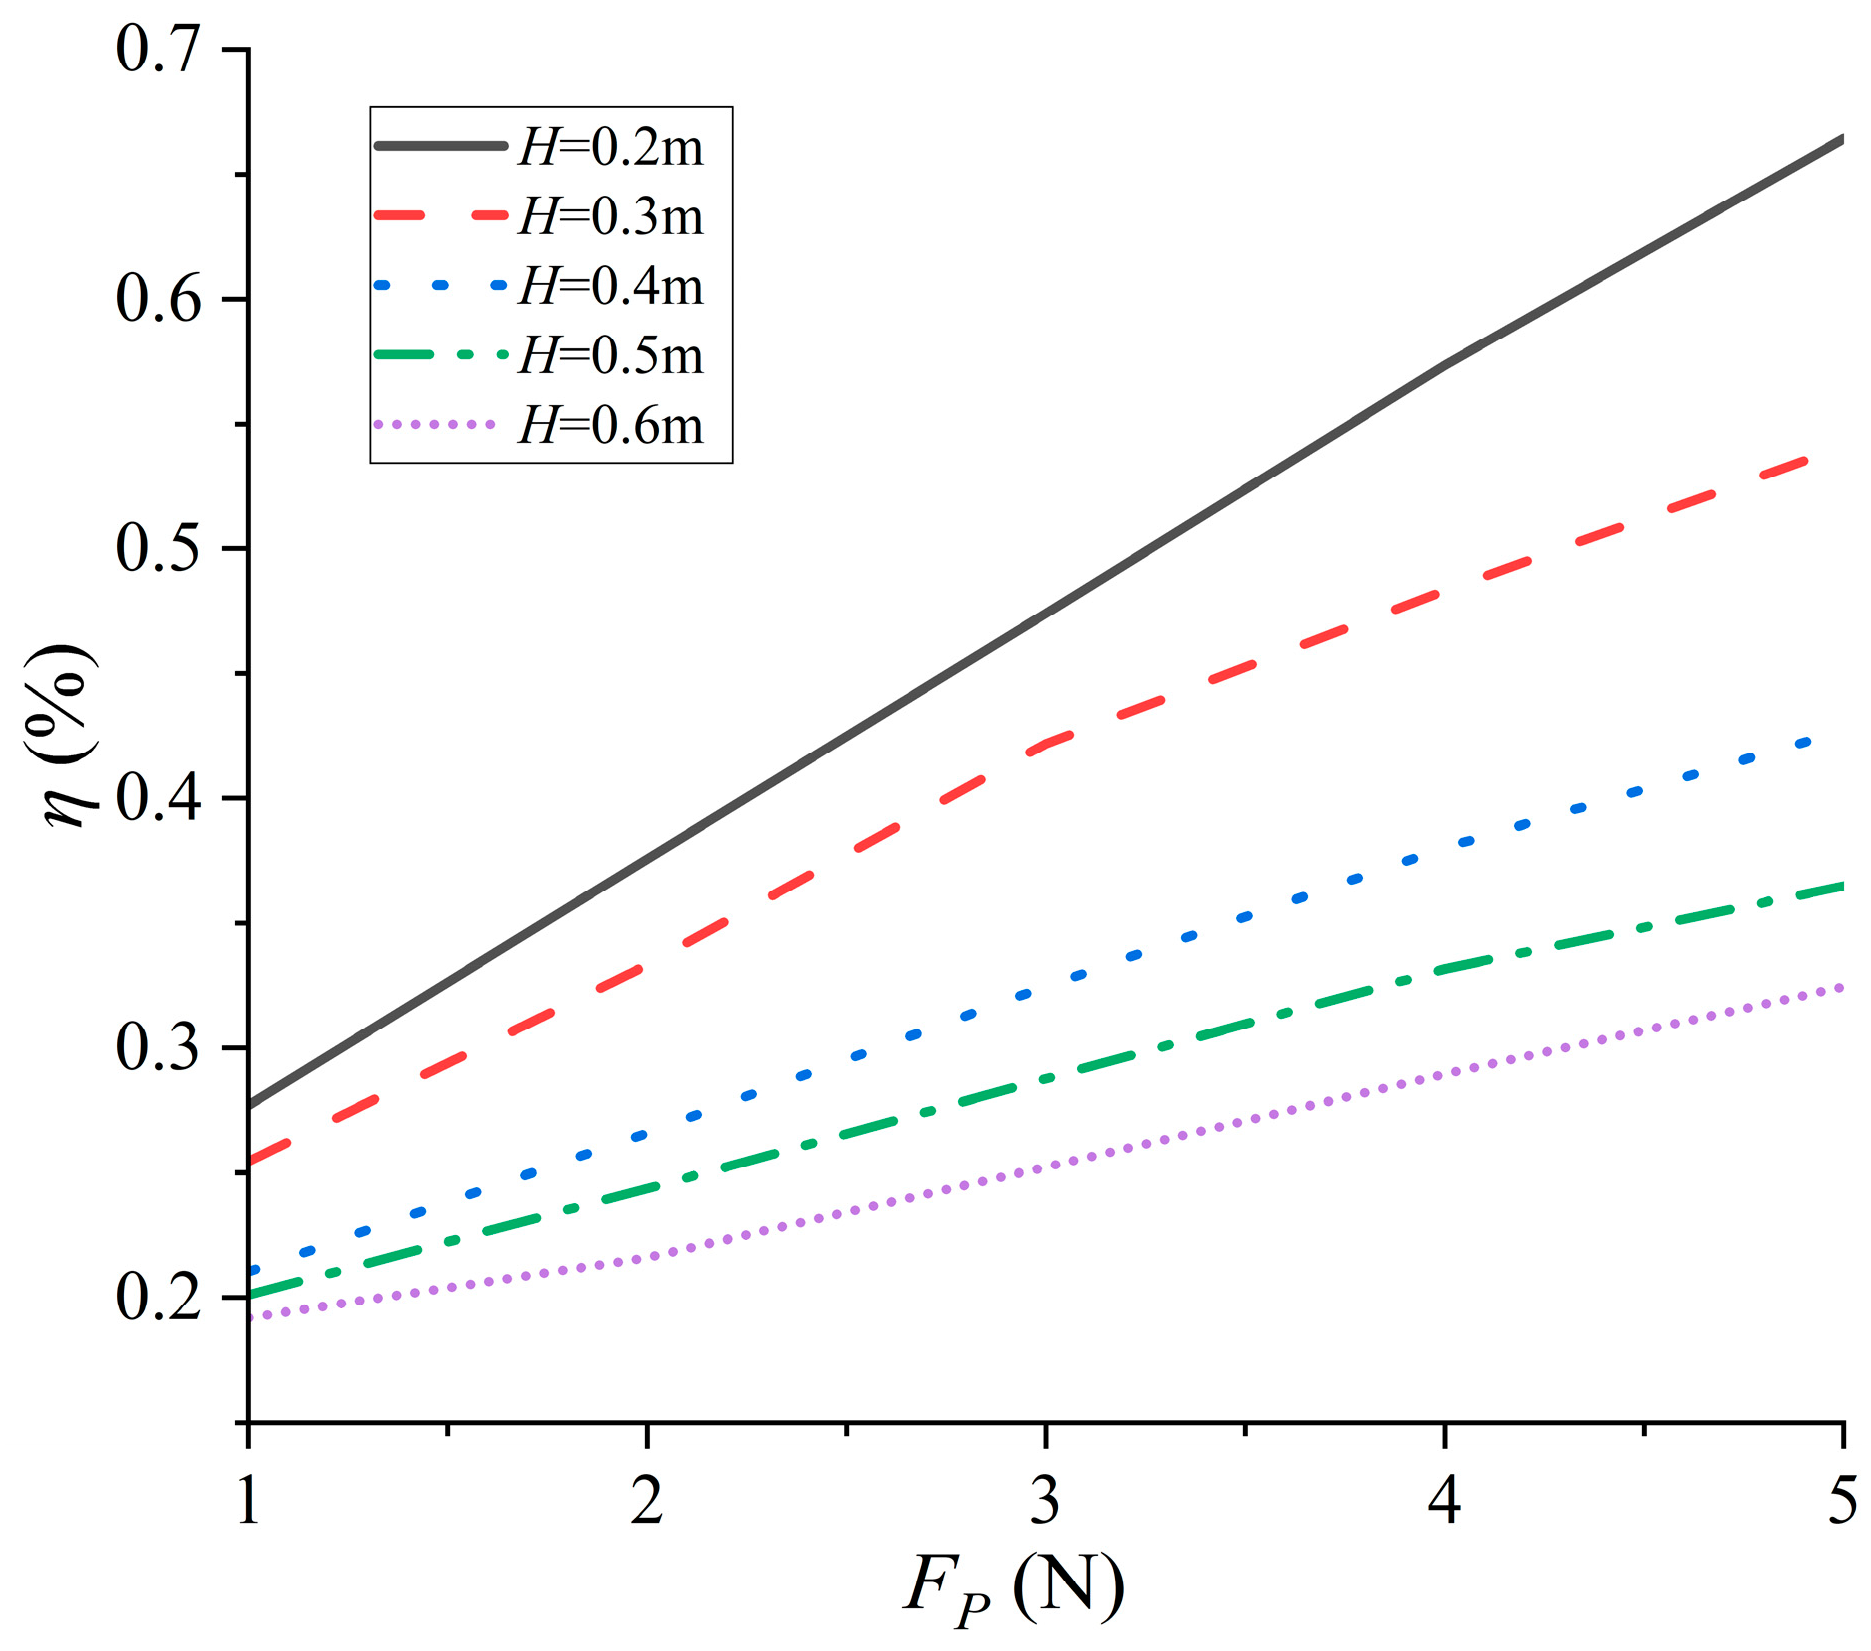
Figure 8 presents the evolutionary curves of the WDP’s wave energy conversion efficiency within the net buoyancy parameter space under varying wave heights. Observing Figure 8 reveals that the wave energy conversion efficiency of the WDP increases with a greater net buoyancy of the profiling platform. Under H = 0.2 m, an increase in net buoyancy from FP = 1 N to FP = 5 N elevates the wave energy conversion efficiency from 0.28% to 0.66%. Compared with FP = 1 N, the wave energy conversion efficiency of the profiling platform at FP = 5 N exhibits an enhancement of 136%. Thus, a greater net buoyancy enables higher wave energy conversion efficiency for the WDP, provided that the profiling platform maintains a normal profiling motion.
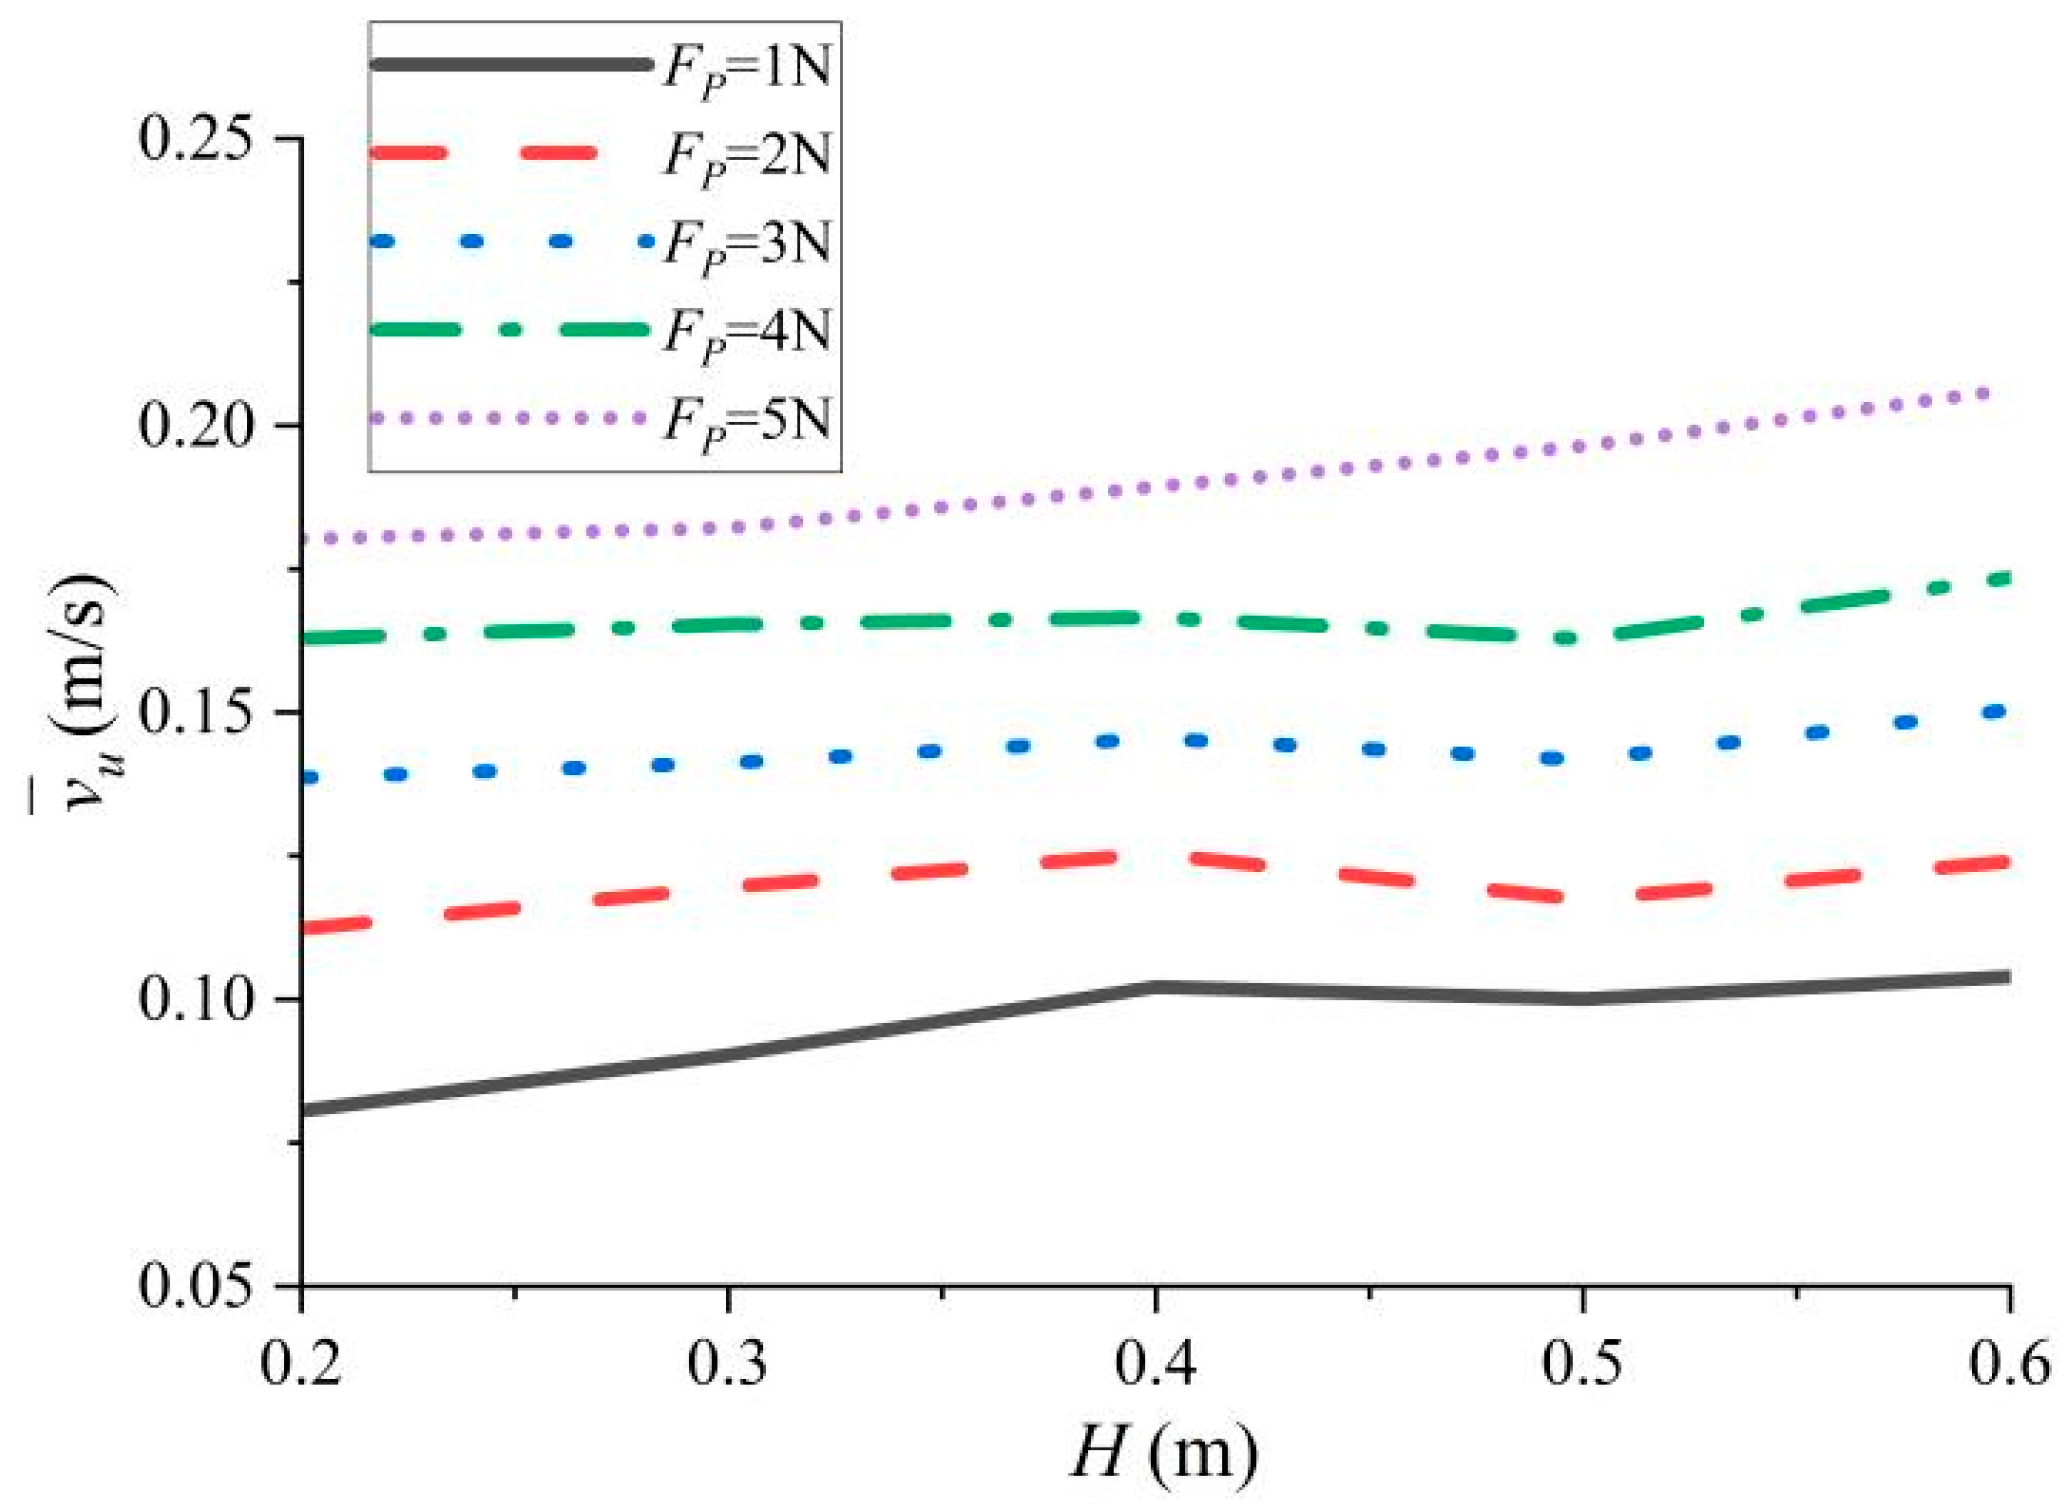
This section investigates the influence of the net buoyancy of the profiling platform on the mean rising velocity of the profiling platform. Figure 9 illustrates the evolutionary curves of the profiling platform’s mean rising velocity within the wave height parameter space under varying net buoyancy. Observing Figure 9 reveals that the profiling platform’s mean rising velocity increases with greater net buoyancy. At H = 0.2 m, when the net buoyancy increases from FP = 1 N to FP = 5 N, the mean rising velocity rises from 0.08 m/s to 0.18 m/s. Compared with FP = 1 N, the mean rising velocity of the profiling platform at FP = 5 N exhibits an enhancement of 125%. The profiling platform in the WDP achieves better rising performance under larger net buoyancy. The further observation of Figure 9 indicates that as wave height changes, the mean rising velocity of the profiling platform exhibits significant fluctuations. This is due to the inherent randomness in the wave-driven motion of the profiling platform and the observed instability of the experimental tank facility under a higher wave height, which leads to abnormal fluctuations in the mean rising velocity. It was also observed that the profiling platform had not reached equilibrium during the rise phase due to the limited length of the wire rope. This results in a significant discrepancy between the maximum rising velocity of the profiling platform and the theoretical value.

4. Discussion

Building on the experimental findings from the previous chapter, this chapter elucidates the influence of wave parameters and net buoyancy on the motion behavior of the profiling platform by analyzing its dynamic characteristics, including displacement, velocity, and acceleration. Furthermore, this chapter reveals the mechanism of action of wave parameters and net buoyancy on the WDP.

4.1. Discussion on Wave Parameters

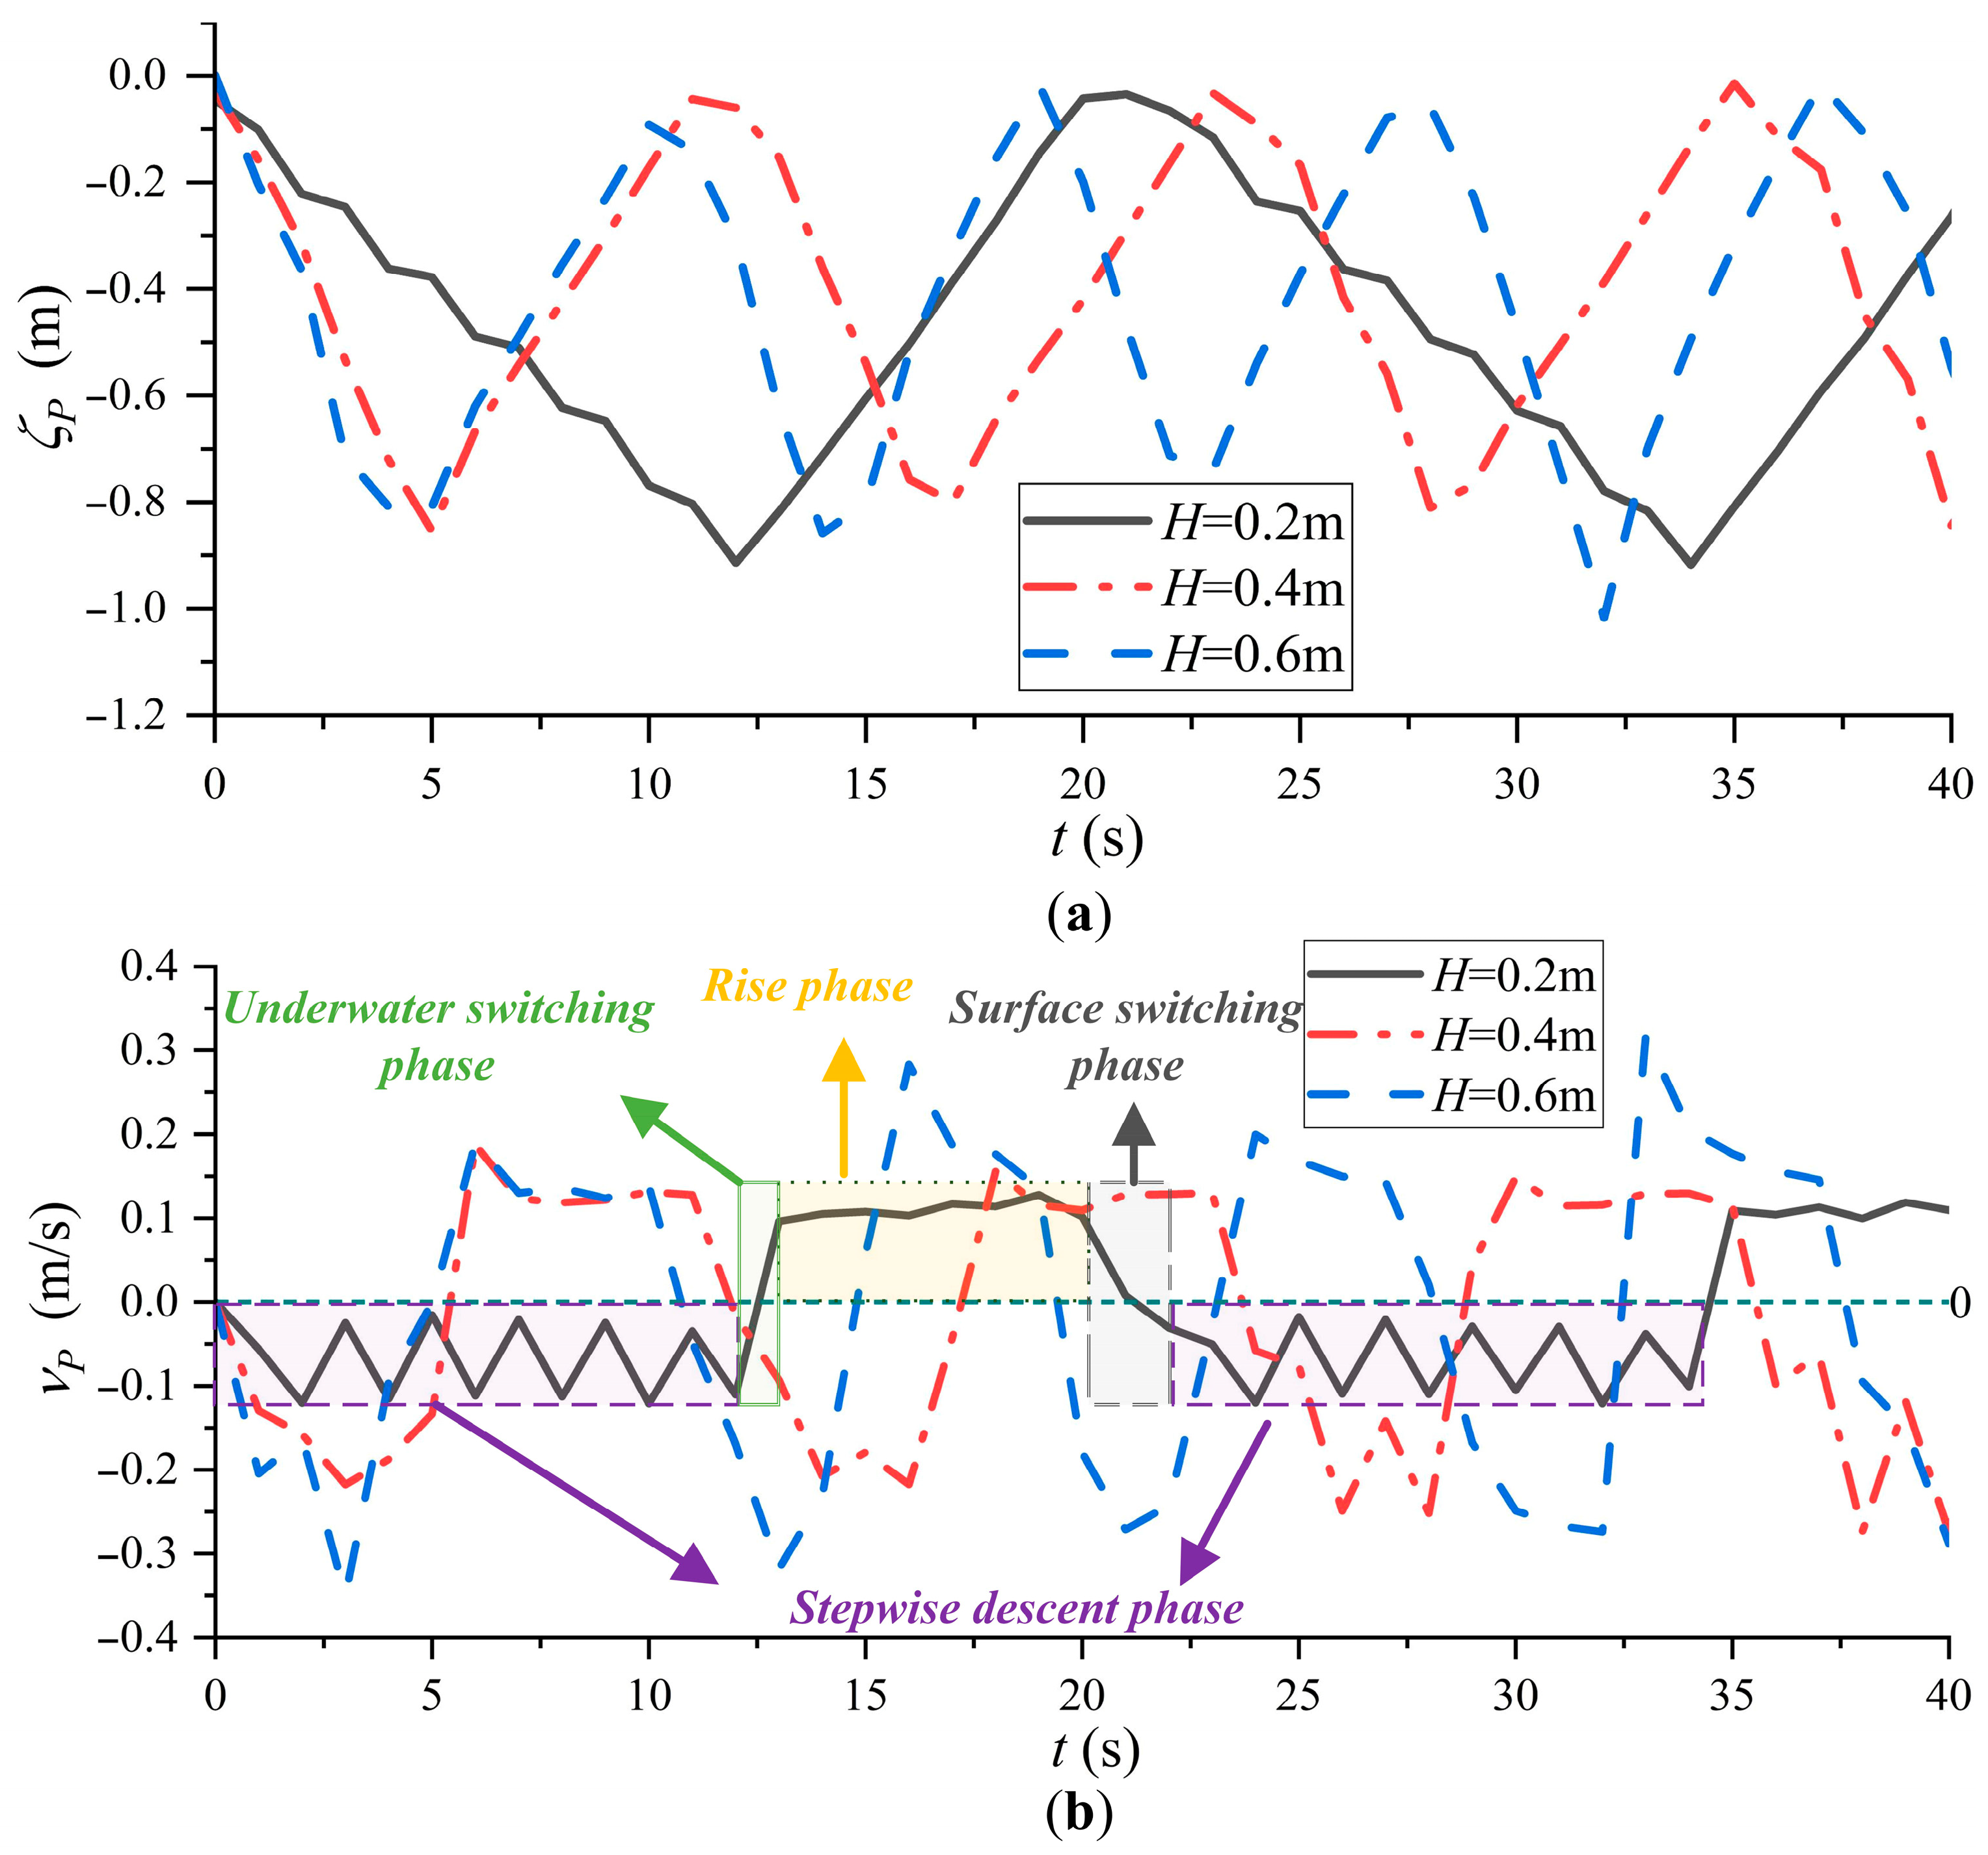
Figure 5 demonstrates that the dynamic performance of the WDP improves significantly with increasing wave height, with superior dynamic performance observed under higher wave heights. This section presents displacement variation curves of the profiling platform under different wave heights, as shown in Figure 10a. Figure 10a reveals that the profiling platform exhibits continuous longitudinal reciprocating motion across all wave heights. Under continuous wave excitation, the profiling platform undergoes a stepwise descent followed by a continuous rise. This motion process aligns with the wave-driven working mechanisms of the WDP illustrated in Figure 3. At H = 0.2 m, the displacement curve of the profiling platform during the descent phase exhibits a distinct stepwise descent feature. However, the displacement curves of the profiling platform at H = 0.4 m and H = 0.6 m do not show such a distinct stepwise descent. This is because the sampling rate of the temperature–depth sensor is only 1 Hz, which is insufficient for capturing the fine-scale displacement changes of the platform. Figure 10a further shows that the displacement curve during the rise phase exhibits a linear trend, attributed to the shallow water depth of the experimental tank facility, where the profiling platform remains in an accelerated rising state. Additionally, the peaks and troughs of the profiling platform’s displacement curve in Figure 10a are misaligned, resulting from the discrepancy between the wave period and the profiling platform’s motion period and the strong randomness of the wave-driven process. The further observation of Figure 10a reveals that increasing wave height decreases the platform’s descent time. At H = 0.2 m, H = 0.4 m, and H = 0.6 m, the mean descent times are approximately 12 s, 5 s, and 4 s, respectively, corresponding to mean descent velocities of 0.08 m/s, 0.17 m/s, and 0.2 m/s. Compared with H = 0.2 m, the mean descent velocities at H = 0.4 m and H = 0.6 m increase by 112% and 150%. This is consistent with the trend of variation in the mean descent velocity of the profiling platform, as shown in Section 3.1. Additionally, the rise time of the profiling platform remains consistent across different wave heights, averaging approximately 7 s.
Figure 10b shows the evolution curves of the profiling platform’s velocity under different wave heights. The velocity variation curves of the profiling platform under different wave heights exhibit distinct regular variations. At H = 0.2 m, the velocity curve of the profiling platform during the descent phase exhibits distinct oscillations, which is consistent with the stepwise descent feature of the profiling platform’s displacement curve shown in Figure 10a. The observation of Figure 10b also reveals that the velocity curve of the profiling platform during the rise phase remains relatively stable, which corresponds to the linear variation in its displacement curve during the rise phase. The further observation of Figure 10b shows that the maximum descent velocity of the profiling platform increases with wave height. At H = 0.2 m, H = 0.4 m, and H = 0.6 m, the maximum velocities during the descent phase are −0.12 m/s, −0.21 m/s, and −0.34 m/s, respectively. This is because the buoy captures more wave energy as wave height increases and transfers more kinetic energy to the profiling platform. Increased kinetic energy elevates the maximum descent velocity of the profiling platform, thereby shortening the descent time, which is consistent with the variation in descent time shown in Figure 10a. Furthermore, the rising velocity of the profiling platform remains stable at 0.15 m/s, which is consistent with the variation in rise time in Figure 10a.
From an engineering perspective, significant velocity fluctuations under higher wave heights will affect the measurement accuracy of installed sensors. This may cause sensors to fail to collect data accurately, reducing the reliability of high-frequency observations. When velocity fluctuations are large, the internal components of the profiling platform are subjected to greater impact forces, which will accelerate the mechanical wear of cams, guide grooves, and wire rope, thereby shortening their service life. Conversely, under smaller wave heights, velocity fluctuations are also minor. This helps sensors collect data, but the frequency of profiling observations may be low. When deploying the WDP, it is necessary to balance profiling frequency, data quality, and structural durability.
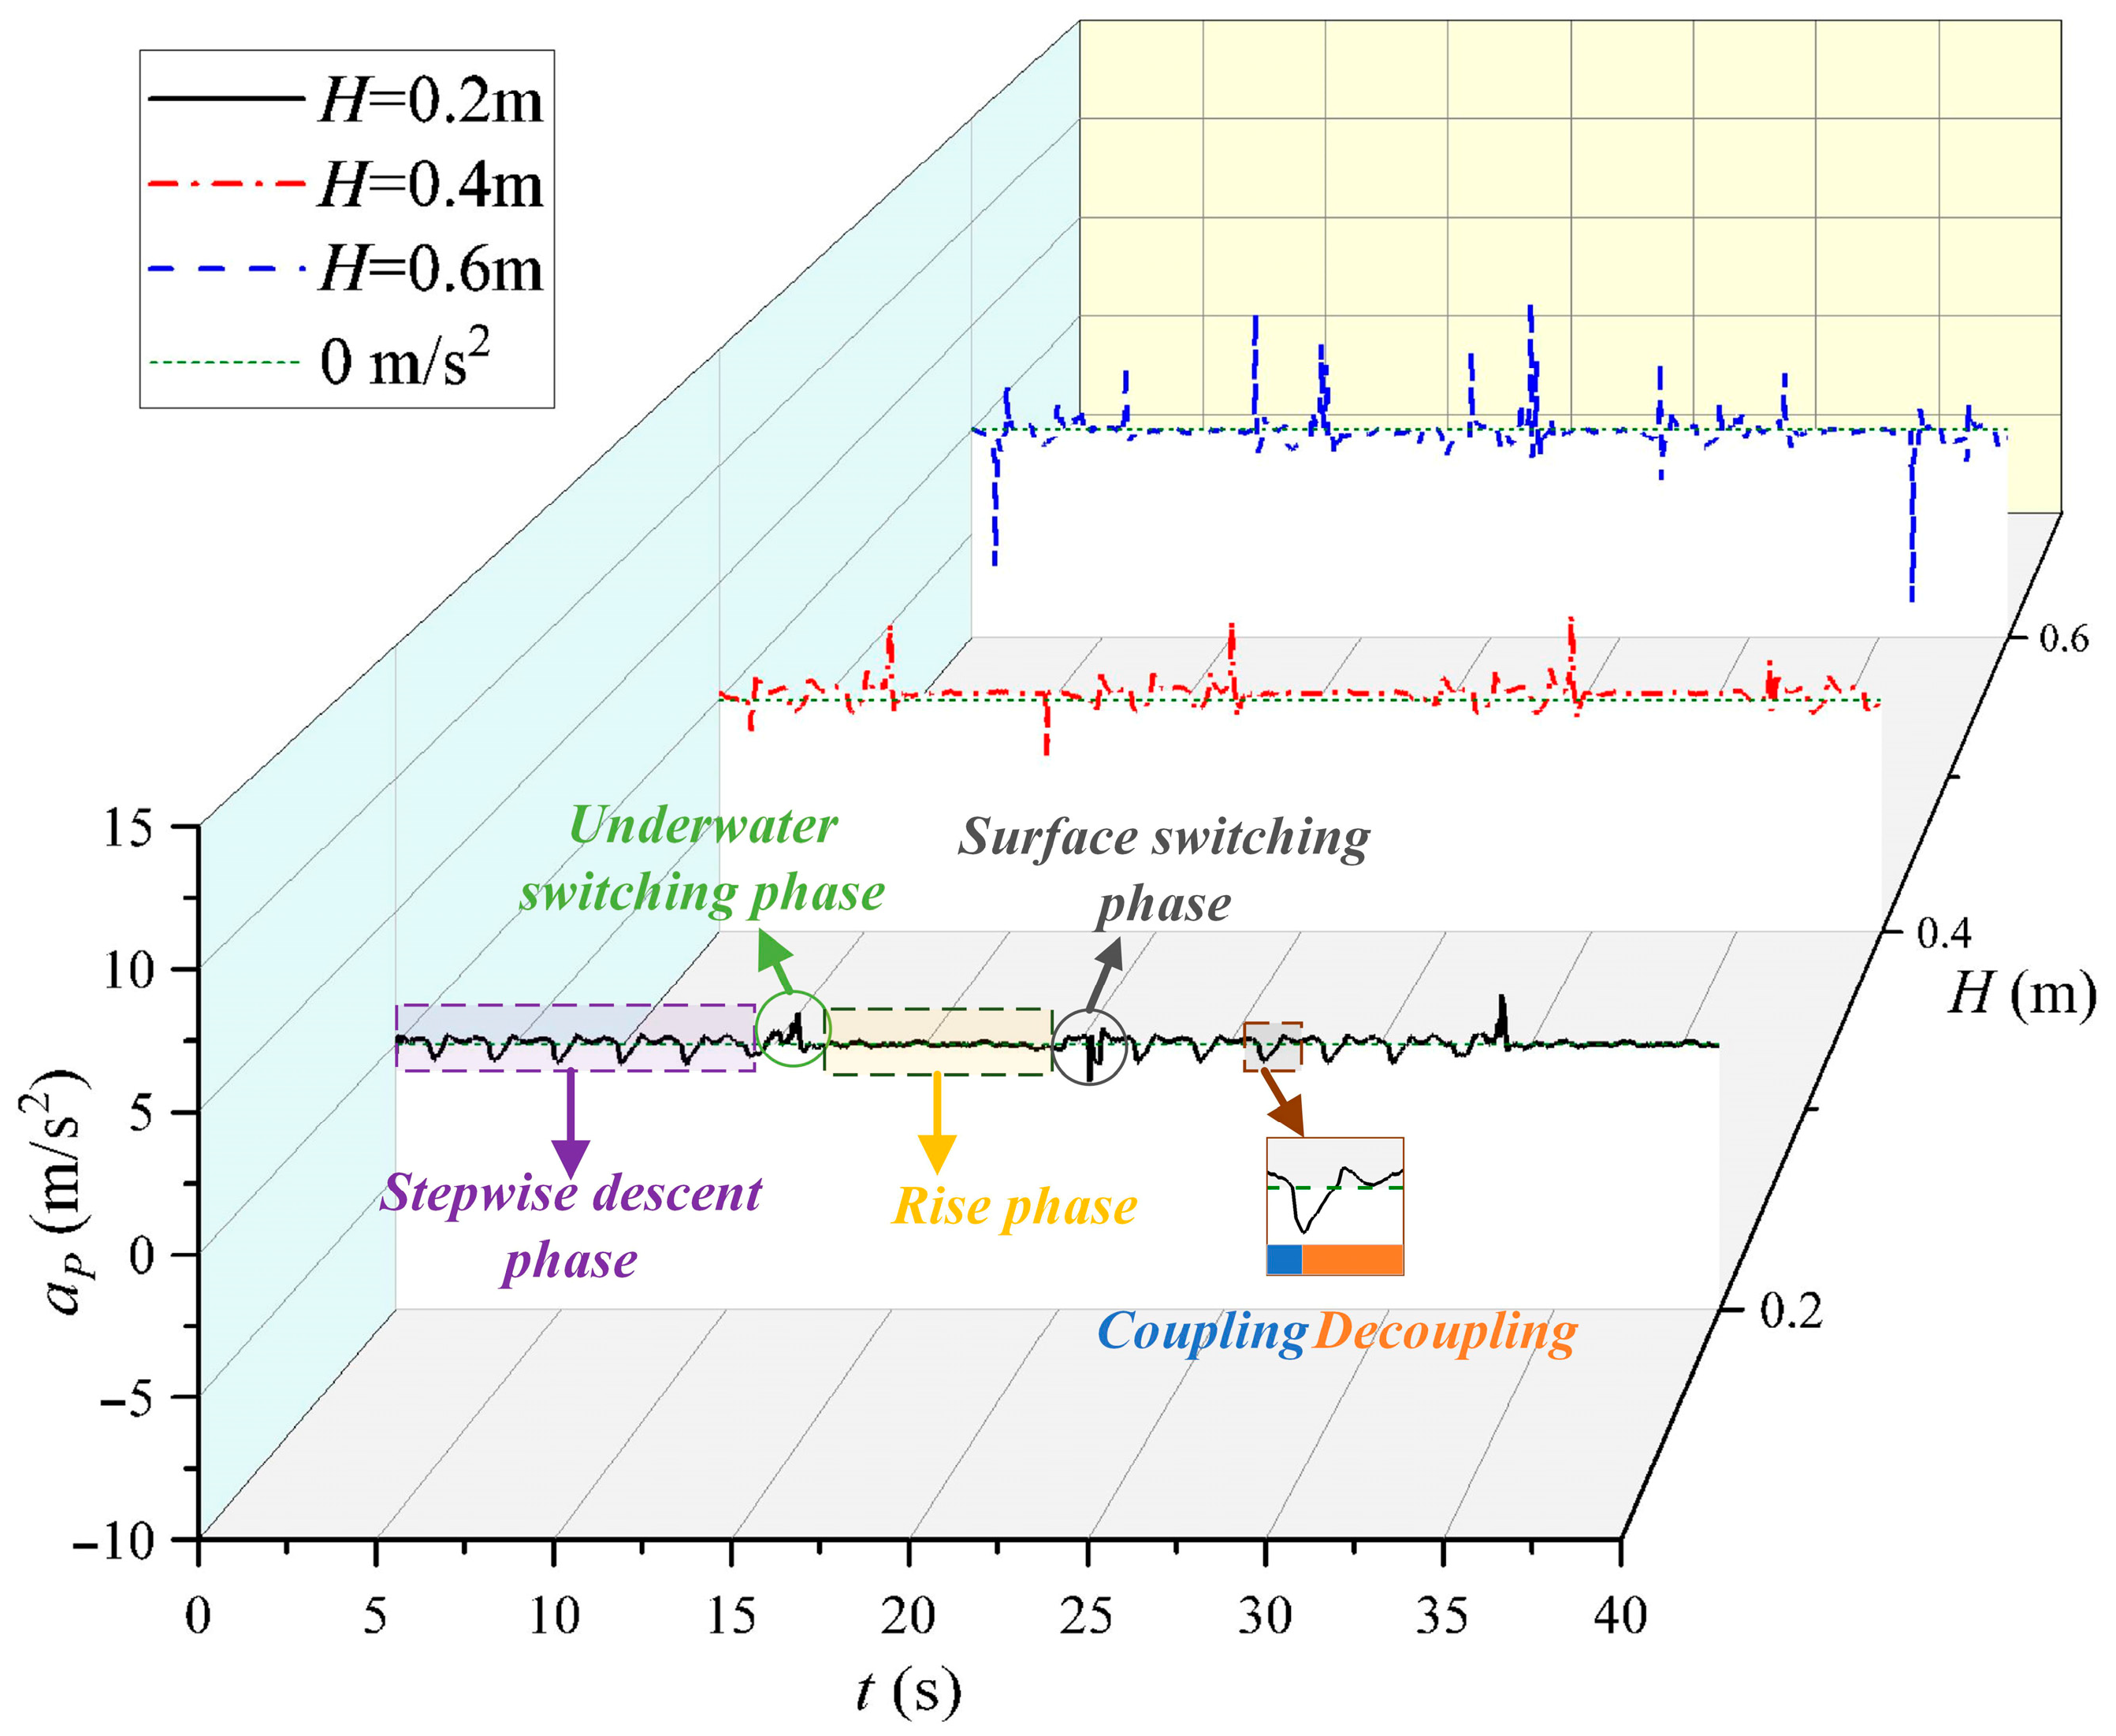
Figure 11 shows the acceleration evolution curves of the profiling platform under different wave heights. The observation of Figure 11 reveals significant regular variations in the acceleration of the profiling platform across different wave heights. The acceleration curve of the profiling platform during the descent phase exhibits distinct stepwise descent characteristics: the acceleration of the profiling platform increases during the coupling phase and decreases during the decoupling phase. This behavior occurs because the resultant force acting on the profiling platform during the coupling phase is dominated by the gravity from the tension hammer. The resultant force transitions to the profiling platform’s net buoyancy and upward hydrodynamic resistance during decoupling. This is consistent with the variation trend of the profiling platform’s descent velocity in Figure 10b. The further observation of Figure 11 shows that the acceleration curve during the rise phase of the profiling platform remains generally stable but exhibits minor fluctuations. These fluctuations result from disturbances caused by water particles in the tank during the rise phase. The acceleration variations during the rise phase correspond to the velocity trends observed in Figure 10b. Additionally, abrupt changes in acceleration occur during the profiling platform’s underwater and surface switching phases. The peak acceleration during the underwater switching phase increases with wave height because higher wave heights enhance the descent velocity of the profiling platform. According to the momentum theorem, the increased descent velocity enhances the instantaneous impact force exerted on the profiling platform, increasing its acceleration. This corresponds to the variation trend of the maximum descent velocity of the profiling platform in Figure 10b.
The wave parameters affect the wave energy conversion performance of the WDP by influencing wave energy input power, energy capture efficiency, and transmission loss. A higher wave height increases the wave input power, enhancing the energy the buoy captures and its movement velocity. Although higher wave heights improve the dynamic performance of the WDP, they also exacerbate frictional losses in the wire rope and collision losses between the tension hammer and the profiling platform, thereby reducing the wave energy conversion efficiency. Waves with a longer period act on the buoy, reducing the buoy’s heave frequency and weakening the transfer frequency of the energy transfer chain. Additionally, a longer period prolongs the motion time of the profiling platform and increases the cumulative loss from hydrodynamic resistance. Although the energy density of waves with a longer period is slightly higher, low-frequency energy transfer and long-term cumulative resistance ultimately lead to a decline in dynamic performance and efficiency. This is consistent with the conclusions drawn from the experiment in Section 3.1.

4.2. Discussion on Net Buoyancy of the Profiling Platform

In addition to the external wave parameters, the net buoyancy of the profiling platform internally influences the motion response of the WDP. Therefore, this section investigates how changes in net buoyancy affect the dynamic characteristics of the WDP and their mechanism of action on the WDP.
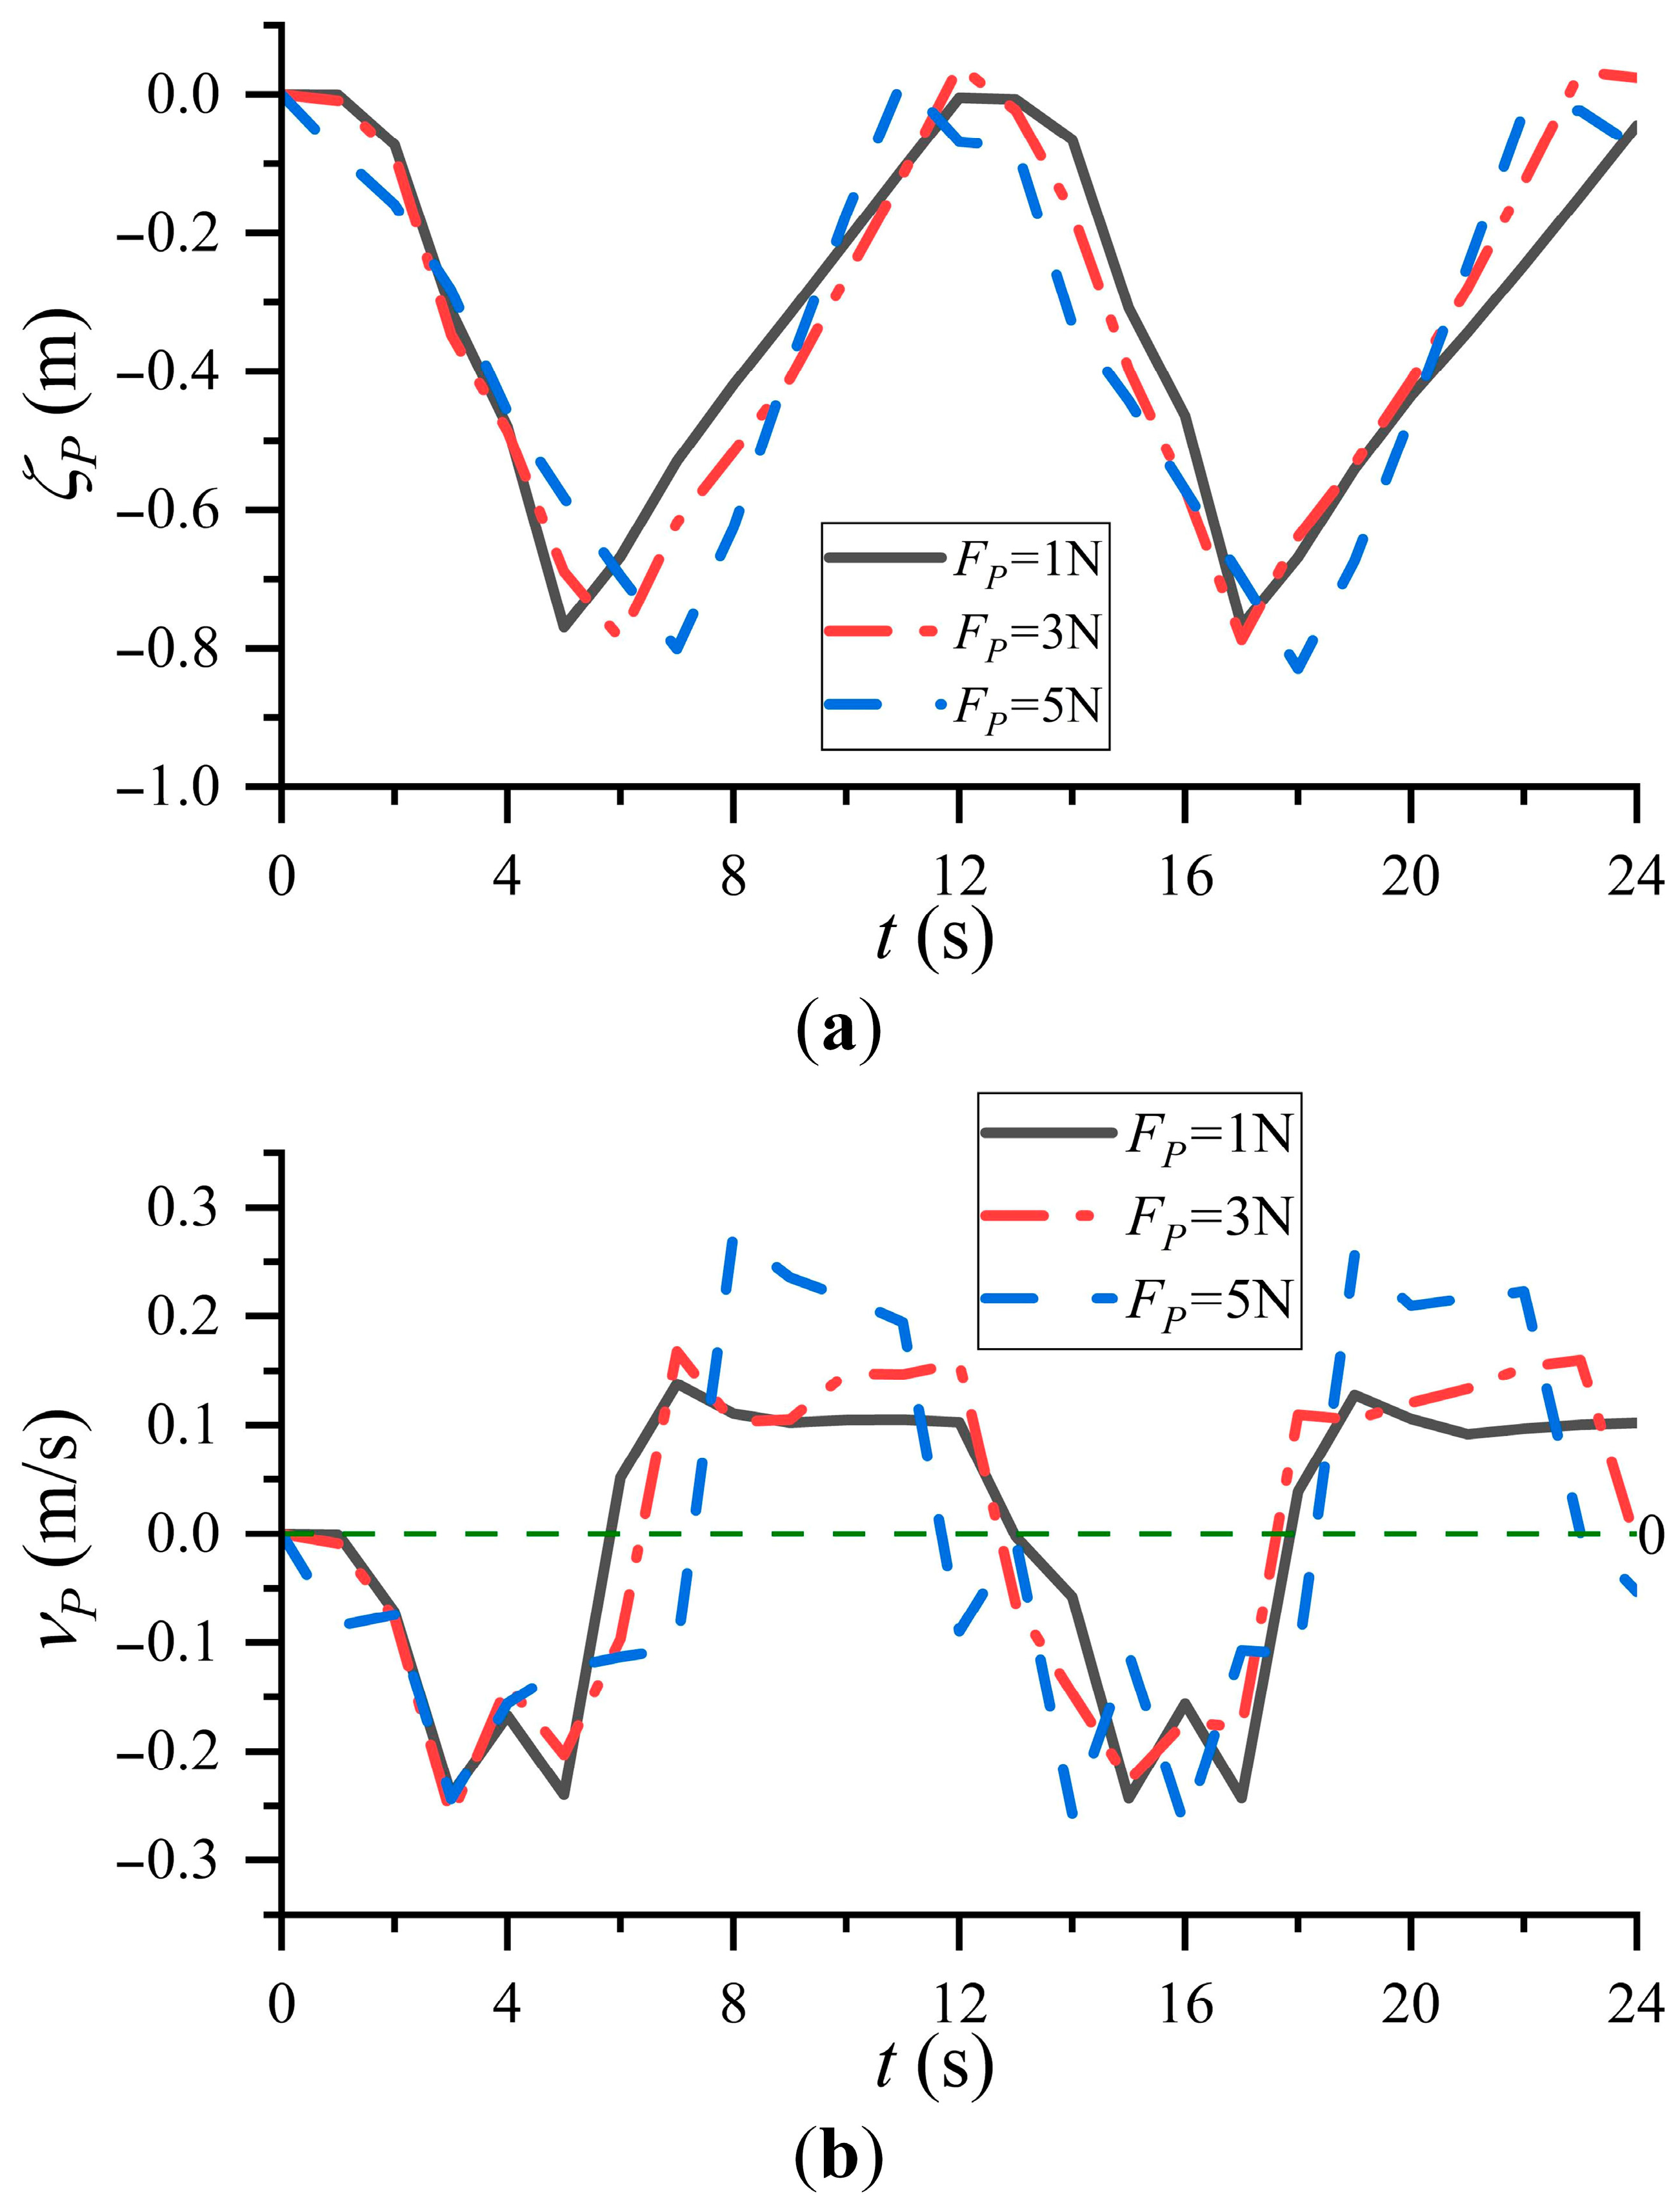
In Figure 7 and Figure 9 of Section 3.2, we observed that the descent velocity of the profiling platform decreases with increasing net buoyancy. In contrast, the rising velocity increases with greater net buoyancy. This section presents the profiling platform’s displacement and velocity variation curves under different net buoyancies, as shown in Figure 12. Figure 12a shows that the profiling platform’s descent time increases with net buoyancy. At FP = 1 N, FP = 3 N, and FP = 5 N, the mean descent times of the profiling platform are approximately 5 s, 6 s, and 7 s, corresponding to mean descent velocities of −0.144 m/s, −0.131 m/s, and −0.128 m/s, respectively. Compared with FP = 1 N, the mean descent velocities at FP = 3 N and FP = 5 N decrease by 9% and 11%, respectively—a trend consistent with the velocity variations observed in Figure 7. Figure 12a further reveals that the rise time of the profiling platform decreases with increasing net buoyancy. Under FP = 1 N, FP = 3 N, and FP = 5 N, the mean rise times of the profiling platform are approximately 7 s, 6 s, and 4 s, respectively, corresponding to mean rising velocities of 0.11 m/s, 0.16 m/s, and 0.20 m/s. Compared with FP = 1 N, the mean rising velocities of the profiling platform at FP = 3 N and FP = 5 N increase by 45% and 82%, respectively. This trend is consistent with the conclusion regarding the profiling platform’s mean rising velocity in Figure 9. Additionally, Figure 12b illustrates that the profiling platform’s rising velocity increases with net buoyancy. At FP = 1 N, FP = 3 N, and FP = 5 N, the profiling platform’s maximum rising velocities during the rise phase are 0.13 m/s, 0.17 m/s, and 0.25 m/s, respectively. Compared with FP = 1 N, the profiling platform’s maximum rising velocities at FP = 3 N and FP = 5 N increase by 31% and 92%, respectively. This is because the increased net buoyancy of the profiling platform leads to greater acceleration during rise, thereby increasing its rising velocity, consistent with the change in the displacement curve during the rise phase shown in Figure 12a.
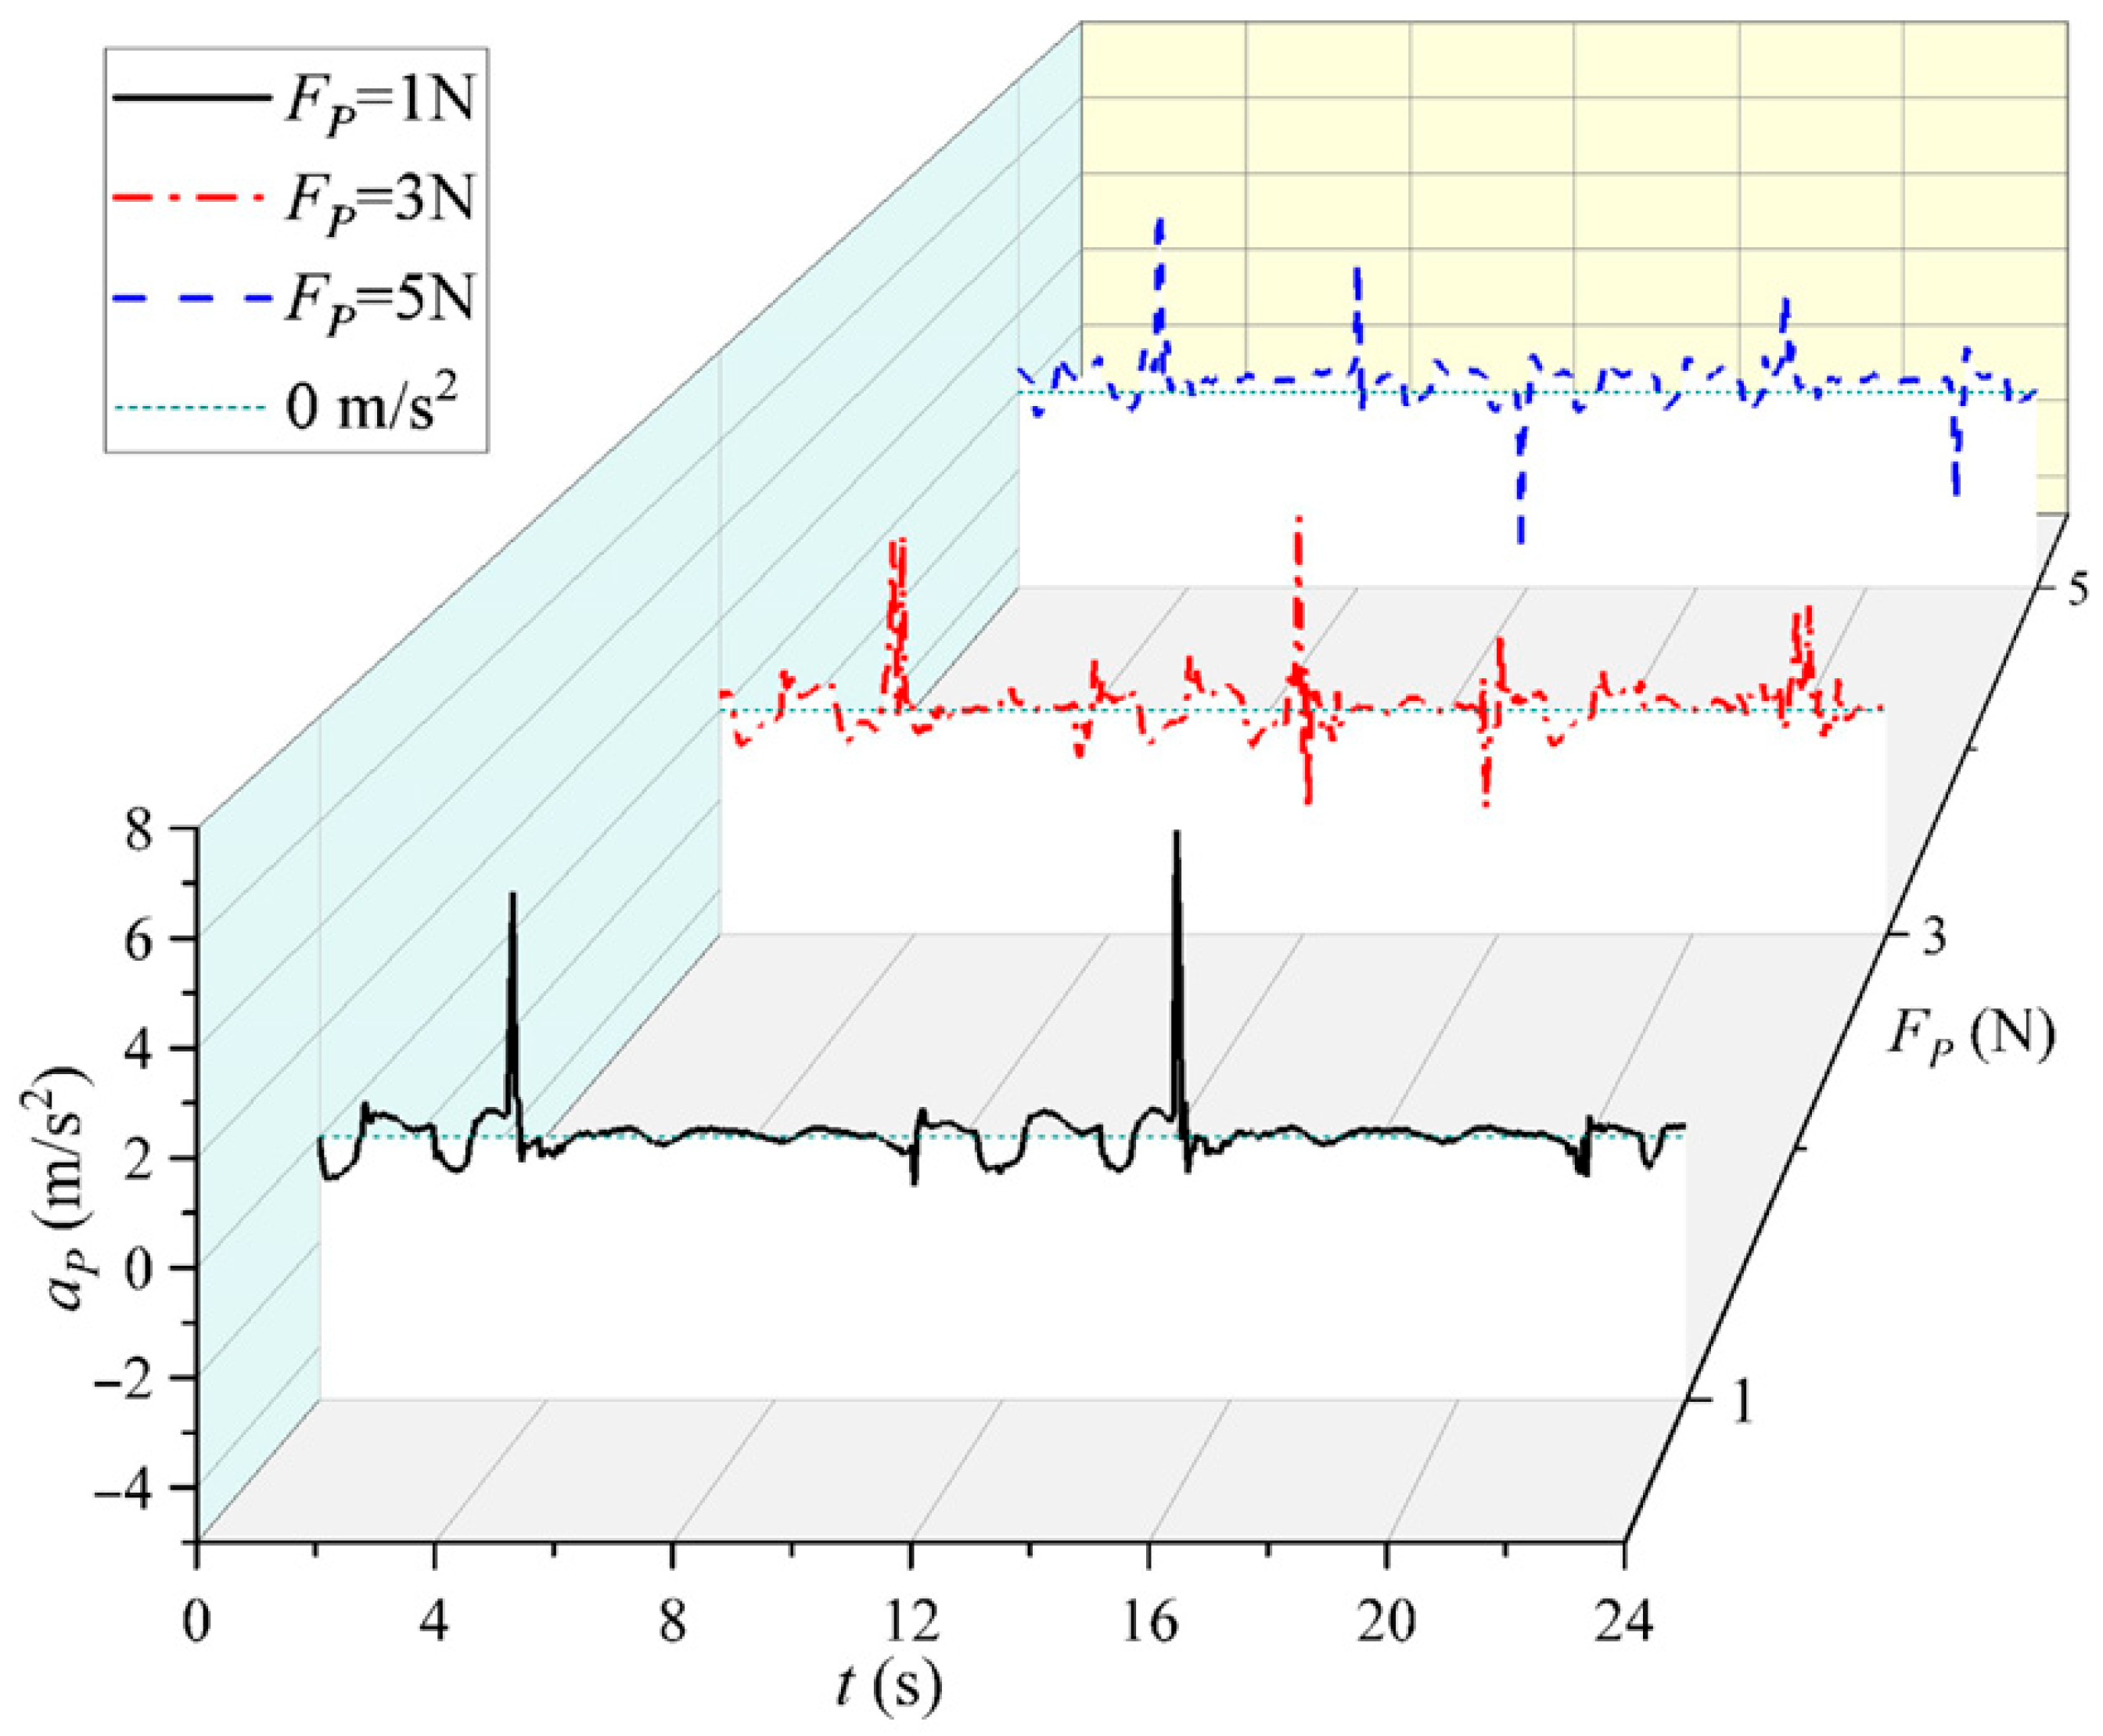
Figure 13 displays the acceleration evolution curves of the profiling platform under different net buoyancy conditions. The observation in Figure 13 reveals that the acceleration of the profiling platform during the coupling phase decreases with increasing net buoyancy. This is because during the coupling phase, the resultant force acting on the PWT decreases as the net buoyancy of the profiling platform increases, which reduces the acceleration of the profiling platform and thereby lowers its mean descent velocity. This is consistent with the conclusion drawn in Section 3.2 regarding the changes in the mean descent velocity of the profiling platform, which leads to the variation in the displacement curve during the descent phase, as shown in Figure 12a.
The net buoyancy of the profiling platform is an intrinsic factor affecting performance and is independent of the external conditions of waves, the buoy, and the tension hammer. Increased net buoyancy during the coupling phase counteracts more of the tension hammer’s driving force, reduces the profiling platform’s descent velocity, and decreases collision loss and loss from hydrodynamic resistance. A larger portion of the energy acquired by the profiling platform is converted into the potential energy of its accumulated net buoyancy. Therefore, although greater net buoyancy reduces the WDP’s dynamic performance, it conversely improves the wave energy conversion efficiency. This is consistent with the conclusions drawn from the experiment in Section 3.2.

4.3. Discussion on Limitations of Experimental Equipment

Although the experimental tank facility based on a crank slider mechanism provides a controllable experimental environment, it simplifies the complexity and randomness of real ocean waves. As a result, the profiling platform in the experimental facility cannot fully reflect the energy transfer associated with nonlinear waves that are more representative of actual sea conditions. In addition, the finite dimensions of the tank may cause wave reflection, which could slightly alter the hydrodynamic resistance acting on the profiling platform. These factors may lead to slight differences between the observed and expected performance in the actual ocean. Overall, these limitations mean that while the results of the quantitative analysis serve as reference values rather than exact values, the mechanism of action of the parameters and the observed trends are reliable. Experiments in a controlled environment are primarily used to clarify the influence of wave parameters and net buoyancy on the performance of a WDP, providing a validated theoretical framework. Future studies will involve tank experiments with irregular waves and field experiments to further evaluate the generalizability of the conclusions of this study under practical conditions.

5. Conclusions

This study elaborates on the influence of wave parameters and the net buoyancy of the profiling platform on the wave energy conversion performance of a WDP and its underlying mechanisms. We conducted a mechanistic analysis of a WDP and performed comprehensive dynamic modeling. A study was conducted on a WDP’s wave energy conversion performance using a controllable experimental facility. By combining the dynamic model of the WDP with experimental results, we elucidated the mechanisms of wave parameters and the net buoyancy of the profiling platform on the wave energy conversion performance of the WDP. The conclusions of this study are as follows:
  • Higher wave heights increase the wave energy captured by the WDP buoy, which is transmitted along the chain consisting of waves, buoys, tension hammers, and profiling platforms. The increase in captured energy enhances the WDP’s dynamic performance. However, better dynamic performance also exacerbates energy dissipation, including hydrodynamic resistance, the friction of the profiling platform, and collisions, and these factors reduce the wave energy conversion efficiency.
  • Longer wave periods reduce the excitation frequency of waves, thereby slowing down the rhythm of energy transmission along the chain. Therefore, both the buoy’s velocity and the energy transmission frequency are reduced, resulting in decreased energy gained by the profiling platform. Although longer wave periods increase the wave energy captured by the buoy, they ultimately reduce the WDP’s wave energy conversion efficiency due to reduced transmission efficiency, cumulative resistance loss, and reduced energy gained by the profiling platform.
  • The net buoyancy of the profiling platform has different impacts on the dynamic response of the WDP in different phases. In the coupling phase, increased net buoyancy offsets the downward driving force of the tension hammer more, thereby reducing the descent velocity of the profiling platform. In the decoupling phase, greater net buoyancy accelerates the attenuation of the profiling platform’s descent velocity. In the rise phase, the net buoyancy of the profiling platform is converted into an upward driving force, increasing the rising velocity of the profiling platform. Since useful work is positively correlated with net buoyancy, greater net buoyancy increases storable energy output, thereby improving the wave energy conversion efficiency.
The conclusions drawn from this study provide theoretical guidance for improving the wave energy conversion performance of the WDP. Due to the limitations of the experimental facility, the parameter ranges of wave height and wave period were relatively limited, which may affect the comprehensiveness and universality of the research results to a certain extent. Future work will delve into the performance of the WDP under irregular waves, providing more comprehensive insights for optimizing the WDP’s design and performance.

Author Contributions

Conceptualization, H.L., Y.L. and Z.Q.; methodology, H.L., Y.L. and Z.Q.; validation, H.L., Y.L. and L.C.; formal analysis, H.L.; investigation, H.L.; resources, Z.X.; data curation, H.L., Y.L., Z.Q., X.C., Z.S., L.C. and Z.X.; writing—original draft preparation, H.L.; writing—review and editing, Z.Q.; supervision, Z.Q. All authors have read and agreed to the published version of the manuscript.

Funding

This research was funded by the Natural Science Foundation of Tianjin Municipality, grant number 22JCYBJC01190, the Tianjin Municipal Science and Technology Program, grant number 23YFZCSN00020, and the National Natural Science Foundation of China, grant number: 42006168.

Data Availability Statement

The data presented in this study are available on request from the corresponding author. The data are not publicly available due to confidentiality restrictions.

Acknowledgments

The authors would like to express their gratitude to everyone who supported this work.

Conflicts of Interest

The authors declare no conflicts of interest.

Abbreviations

The following abbreviations are used in this manuscript:
WDPWave-driven profiler
ς B The buoy’s wave-induced displacement (m)
υ B The buoy’s wave-induced vertical velocity (m/s)
a B The buoy’s wave-induced vertical acceleration (m/s2)
H The wave height (m)
k The wave number
λ The wavelength (m)
x The horizontal position of the wave (m)
σ The angular frequency of the wave (Hz)
T The wave period (s)
t The time during the wave motion (s)
z The free surface position (m)
h The water depth (m)
m P The mass of the profiling platform (kg)
m T The mass of the tension hammer (kg)
m P T The wire rope’s mass between the profiling platform and tension hammer (kg)
υ T The vertical velocity of the tension hammer (m/s)
υ The combined velocity after the collision (m/s)
PWTThe profiling platform, wire rope, and tension hammer
F P The net buoyancy of the profiling platform (N)
G T The gravity of the tension hammer (N)
K The mass per unit length of the wire rope (kg/m)
L P T The wire rope’s length between the platform and the tension hammer (m)
a The combined acceleration of the PWT (m/s2)
F d The hydrodynamic resistance to the profiling platform (N)
C d The vertical coefficient of resistance of the profiling platform
S P The projected frontal area of the profiling platform (m2)
ρ The density of water (kg/m3)
a P The acceleration of the profiling platform (m/s2)
BWTThe buoy, wire rope, and tension hammer
F B The buoyancy of the buoy (N)
G B The gravity of the buoy (N)
G W The gravity of the wire rope (N)
m W The quality of the wire rope (kg)
a B W T The combined acceleration of the BWT (m/s2)
υ u The vertical rising velocity of the profiling platform (m/s)
υ max The maximum rising velocity of the profiling platform (m/s)
E P The useful work for a single profiling process (J)
L The length of the wire rope (m)
α The vertical angle of the wire rope (°)
v d The descent velocity of the profiling platform (m/s)
P P The useful power of the profiling platform (W)
T d The descent time of the profiling platform (s)
P P ¯ The mean useful power of the profiling platform (W)
υ d ¯ The mean descent velocity of the profiling platform (m/s)
P B ¯ The mean wave power obtained by the buoy (W)
g The gravitational acceleration (N/kg)
D The dimension of the buoy (m)
η P The wave energy conversion efficiency of the WDP
U The total uncertainty percentage
Δ v The variation rate of the mean descent velocity of the profiling platform
v b a s e ¯ The mean descent velocity of the profiling platform for FP = 5N (m/s)
L P The profiling platform’s length
W P The profiling platform’s width
H P The profiling platform’s height

References

  1. Jiang, S.; Guo, Z.; Zhao, H.; Cui, Z.; Wang, W. OPO-CVI: Design and implementation of an ocean profiling observation system for wave-powered vertical profiler following an ISO standard. Front. Mar. Sci. 2024, 11, 1324523. [Google Scholar] [CrossRef]
  2. Zhao, H.; Guo, Z.; Jing, W. Numerical investigation of a Wave-Powered Vertical Profiler. Ocean Eng. 2023, 285, 115419. [Google Scholar] [CrossRef]
  3. Fowler, G.A.; Hamilton, J.M.; Beanlands, B.D.; Belliveau, D.J.; Furlong, A.R. A wave powered profiler for long term monitoring. In Proceedings of the Oceans ’97. MTS/IEEE Conference Proceedings, Halifax, NS, Canada, 6–9 October 1997; Volume 1, pp. 225–228. [Google Scholar]
  4. Wong, A.P.S.; Wijffels, S.E.; Riser, S.C.; Pouliquen, S.; Hosoda, S.; Roemmich, D.; Gilson, J.; Johnson, G.C.; Martini, K.; Murphy, D.J.; et al. Argo Data 1999–2019: Two Million Temperature-Salinity Profiles and Subsurface Velocity Observations From a Global Array of Profiling Floats. Front. Mar. Sci. 2020, 7, 700. [Google Scholar] [CrossRef]
  5. Johnson, G.C.; King, B.A. Zapiola Gyre, Velocities and Mixing, New Argo Insights. J. Geophys. Res. Oceans 2023, 128, e2023JC019893. [Google Scholar] [CrossRef]
  6. Hine, R.; Willcox, S.; Hine, G.; Richardson, T. The Wave Glider: A Wave-Powered autonomous marine vehicle. In Proceedings of the Oceans 2009, Biloxi, MS, USA, 26–29 October 2009. [Google Scholar]
  7. Song, Y.; Wang, Y.; Yang, S.; Wang, S.; Yang, M. Sensitivity analysis and parameter optimization of energy consumption for underwater gliders. Energy 2020, 191, 116506. [Google Scholar] [CrossRef]
  8. Ma, Z.; Wang, Y.; Wang, S.; Yang, Y. Ocean thermal energy harvesting with phase change material for underwater glider. Appl. Energy 2016, 178, 557–566. [Google Scholar] [CrossRef]
  9. Sangiuliano, S.J. Analysing the potentials and effects of multi-use between tidal energy development and environmental protection and monitoring: A case study of the inner sound of the Pentland Firth. Mar. Policy 2018, 96, 120–132. [Google Scholar] [CrossRef]
  10. Nazir, M.S.; Ali, N.; Bilal, M.; Iqbal, H.M.N. Potential environmental impacts of wind energy development: A global perspective. Curr. Opin. Environ. Sci. Health 2020, 13, 85–90. [Google Scholar] [CrossRef]
  11. Hou, H.; Arredondo Galeana, A.; Song, Y.; Xu, G.; Xu, Y.; Shi, W. Design of a novel energy harvesting mechanism for underwater gliders using thermal buoyancy engines. Ocean Eng. 2023, 278, 114310. [Google Scholar] [CrossRef]
  12. Zang, X.; Zhang, Z.; Fan, W. A Novel Profiler Driven by Tidal Energy for Long Term Oceanographic Measurements in Offshore Areas. J. Mar. Sci. Eng. 2021, 9, 534. [Google Scholar] [CrossRef]
  13. Hamilton, J.; Fowler, G.; Beanlands, B. Long-term monitoring with a moored wave-powered profiler. Sea Technol. 1999, 40, 68–69. [Google Scholar]
  14. Rainville, L.; Pinkel, R. Wirewalker: An Autonomous Wave-Powered Vertical Profiler. J. Atmos. Ocean Technol. 2001, 18, 1048–1051. [Google Scholar] [CrossRef]
  15. Wang, C.; Pawlowicz, R. Propagation speeds of strongly nonlinear near-surface internal waves in the Strait of Georgia. J. Geophys. Res. 2011, 116, C10021. [Google Scholar] [CrossRef]
  16. Wijesekera, H.W.; Shroyer, E.; Tandon, A.; Ravichandran, M.; Sengupta, D.; Jinadasa, S.U.P.; Fernando, H.J.S.; Agrawal, N.; Arulananthan, K.; Bhat, G.S.; et al. ASIRI: An Ocean–Atmosphere Initiative for Bay of Bengal. Bull. Am. Meteorol. Soc. 2016, 97, 1859–1884. [Google Scholar] [CrossRef]
  17. Lucas, A.; Nash, J.; Pinkel, R.; MacKinnon, J.; Tandon, A.; Mahadevan, A.; Omand, M.; Freilich, M.; Sengupta, D.; Ravichandran, M.; et al. Adrift Upon a Salinity-Stratified Sea: A View of Upper-Ocean Processes in the Bay of Bengal During the Southwest Monsoon. Oceanography 2016, 29, 134–145. [Google Scholar] [CrossRef]
  18. Omand, M.; Cetinić, I.; Lucas, A. Using Bio-Optics to Reveal Phytoplankton Physiology from a Wirewalker Autonomous Platform. Oceanography 2017, 30, 128–131. [Google Scholar] [CrossRef]
  19. Morales-Aragón, I.P.; Gilabert, J.; Torres-Sánchez, R.; Soto-Valles, F. Design and development of a new stand-alone profiler for marine monitoring purposes. Appl. Ocean Res. 2024, 152, 104199. [Google Scholar] [CrossRef]
  20. Jayathunga, B.J.C.L.; Karunasena, H.C.P. Development and Performance Analysis of a Small-Scale On-shore Wave Energy Converter. Eng. J. Inst. Eng. Sri Lanka 2022, 55, 47–60. [Google Scholar] [CrossRef]
  21. Khojasteh, D.; Kamali, R. Evaluation of wave energy absorption by heaving point absorbers at various hot spots in Iran seas. Energy 2016, 109, 629–640. [Google Scholar] [CrossRef]
  22. Berenjkoob, M.N.; Ghiasi, M.; Soares, C.G. Influence of the shape of a buoy on the efficiency of its dual-motion wave energy conversion. Energy 2021, 214, 118998. [Google Scholar] [CrossRef]
  23. Aja, A.; Bui, M.; Hughen, T.; Nguyen, S.; Sun, O.; Goldin, M.; Pinkel, R.; Smith, J.A. Wirewalker Dynamics. J. Atmos. Ocean Technol. 2011, 29, 103–115. [Google Scholar] [CrossRef]
  24. Hughen, T.; Bui, M.N.; Aja, A.A.; Sun, O.M.; Smith, J.A.; Goldin, M.A.; Pinkel, R. The Wirewalker: A Vertically Profiling Instrument Carrier Powered by Ocean Waves. J. Atmos. Ocean Technol. 2011, 28, 426–435. [Google Scholar] [CrossRef]
  25. El-Shahat, S.A.; Fu, L.; Li, G. Linear and non-linear wave theories coupled with a modified BEM model for quantifying dynamic loads of a tidal stream turbine. Ocean Eng. 2022, 243, 110334. [Google Scholar] [CrossRef]
  26. Hu, Z.; Wang, E.; Jia, F.; Dong, M. Experimental study on effect of additional torsional load on bending fatigue behavior and failure mechanism of steel wire rope. Int. J. Fatigue 2023, 167, 107399. [Google Scholar] [CrossRef]
  27. Amaechi, C.V.; Wang, F.; Ye, J. Numerical studies on CALM buoy motion responses and the effect of buoy geometry cum skirt dimensions with its hydrodynamic waves-current interactions. Ocean Eng. 2022, 244, 110378. [Google Scholar] [CrossRef]
  28. Isaacs, J.D.; Castel, D.; Wick, G.L. Utilization of the energy in ocean waves. Ocean Eng. 1976, 3, 175–187. [Google Scholar] [CrossRef]
  29. Bayoumi, S.; Amin, I.; Oterkus, E.; Incecik, A. Experimentally validated simplified prediction model of unloaded spar-buoy wave energy converter motions’ responses in waves. Proc. Inst. Mech. Eng. Part A J. Power Energy 2022, 236, 1608–1620. [Google Scholar] [CrossRef]
  30. Eriksson, M.; Isberg, J.; Leijon, M. Theory and Experiment on an Elastically Moored Cylindrical Buoy. IEEE J. Ocean Eng. 2006, 31, 959–963. [Google Scholar] [CrossRef]
  31. Stelzer, M.A.; Joshi, R.P. Evaluation of wave energy generation from buoy heave response based on linear generator concepts. J. Renew. Sustain. Energy 2012, 4, 063137. [Google Scholar] [CrossRef]
  32. Longuet-Higgins, M.S.; Stewart, R.W. Radiation stresses in water waves; a physical discussion, with applications. Deep Sea Res. Oceanogr. Abstr. 1964, 11, 529–562. [Google Scholar] [CrossRef]
  33. Huang, L.; Yang, Y.; Khojasteh, D.; Ou, B.; Luo, Z. Floating solar power loss due to motions induced by ocean waves: An experimental study. Ocean Eng. 2024, 312, 118988. [Google Scholar] [CrossRef]
  34. Montasir, O.A.; Yenduri, A.; Kurian, V.J. Effect of mooring line configurations on the dynamic responses of truss spar platforms. Ocean Eng. 2015, 96, 161–172. [Google Scholar] [CrossRef]
  35. Barone, P.; Truscelli, F.; Castiglione, T.; Bova, S. Latching control of a point-absorber wave energy converter with a hydraulic power take-off system: A calabrian case study. Ocean Eng. 2024, 310, 118775. [Google Scholar] [CrossRef]
  36. Zhang, Y.; Wu, W.; Zhang, H.; Cui, L. A controllable-valve buoy for high-efficiency wave energy conversion under a wide range of wave conditions. Ocean Eng. 2023, 279, 114468. [Google Scholar] [CrossRef]
  37. Wang, L.; Yang, R.; Li, H.; Lin, J.; Wen, C. Investigating the influence of geometry on the performance of a wave-powered marine observation buoy: The wave-to-wire approach. Energy 2024, 309, 133022. [Google Scholar] [CrossRef]
  38. Casas-Prat, M.; Holthuijsen, L.H. Short-term statistics of waves observed in deep water. J. Geophys. Res. Oceans 2010, 115. [Google Scholar] [CrossRef]
  39. Praveen Kumar, S.; Kumar, A.; Petrov, A.S.; Velkin, V.I.; Shcheklein, S.E.; Qasim, M.A. Development of a laboratory test bench for the linear electric generator for micro power plant of a float-wave type: An experimental investigation. AIP Conf. Proc. 2023, 2800, 020253. [Google Scholar] [CrossRef]
  40. Ghani, M.H.; Hole, L.R.; Fer, I.; Kourafalou, V.H.; Wienders, N.; Kang, H.; Drushka, K.; Peddie, D. The SailBuoy remotely-controlled unmanned vessel: Measurements of near surface temperature, salinity and oxygen concentration in the Northern Gulf of Mexico. Methods Oceanogr. 2014, 10, 104–121. [Google Scholar] [CrossRef]
  41. Bao, J.; Yu, D. Hydrodynamic performance optimization of a cost-effective WEC-type floating breakwater with half-airfoil bottom. Renew. Energy 2024, 226, 120333. [Google Scholar] [CrossRef]
  42. Chen, W.; Lin, X.; Wu, Z.; Xu, Q.; Gao, F. Performance analysis of the SJTU-WEC based on the wave-to-wire model and the wave tank experiment. Ocean Eng. 2022, 264, 112537. [Google Scholar] [CrossRef]
  43. Zhang, B.; Song, B.; Li, B.; Su, L.; Ding, W. Numerical study of the effect of submergence depth on hydrokinetic energy conversion of an elastically mounted square cylinder in FIV. Ocean Eng. 2020, 200, 107030. [Google Scholar] [CrossRef]
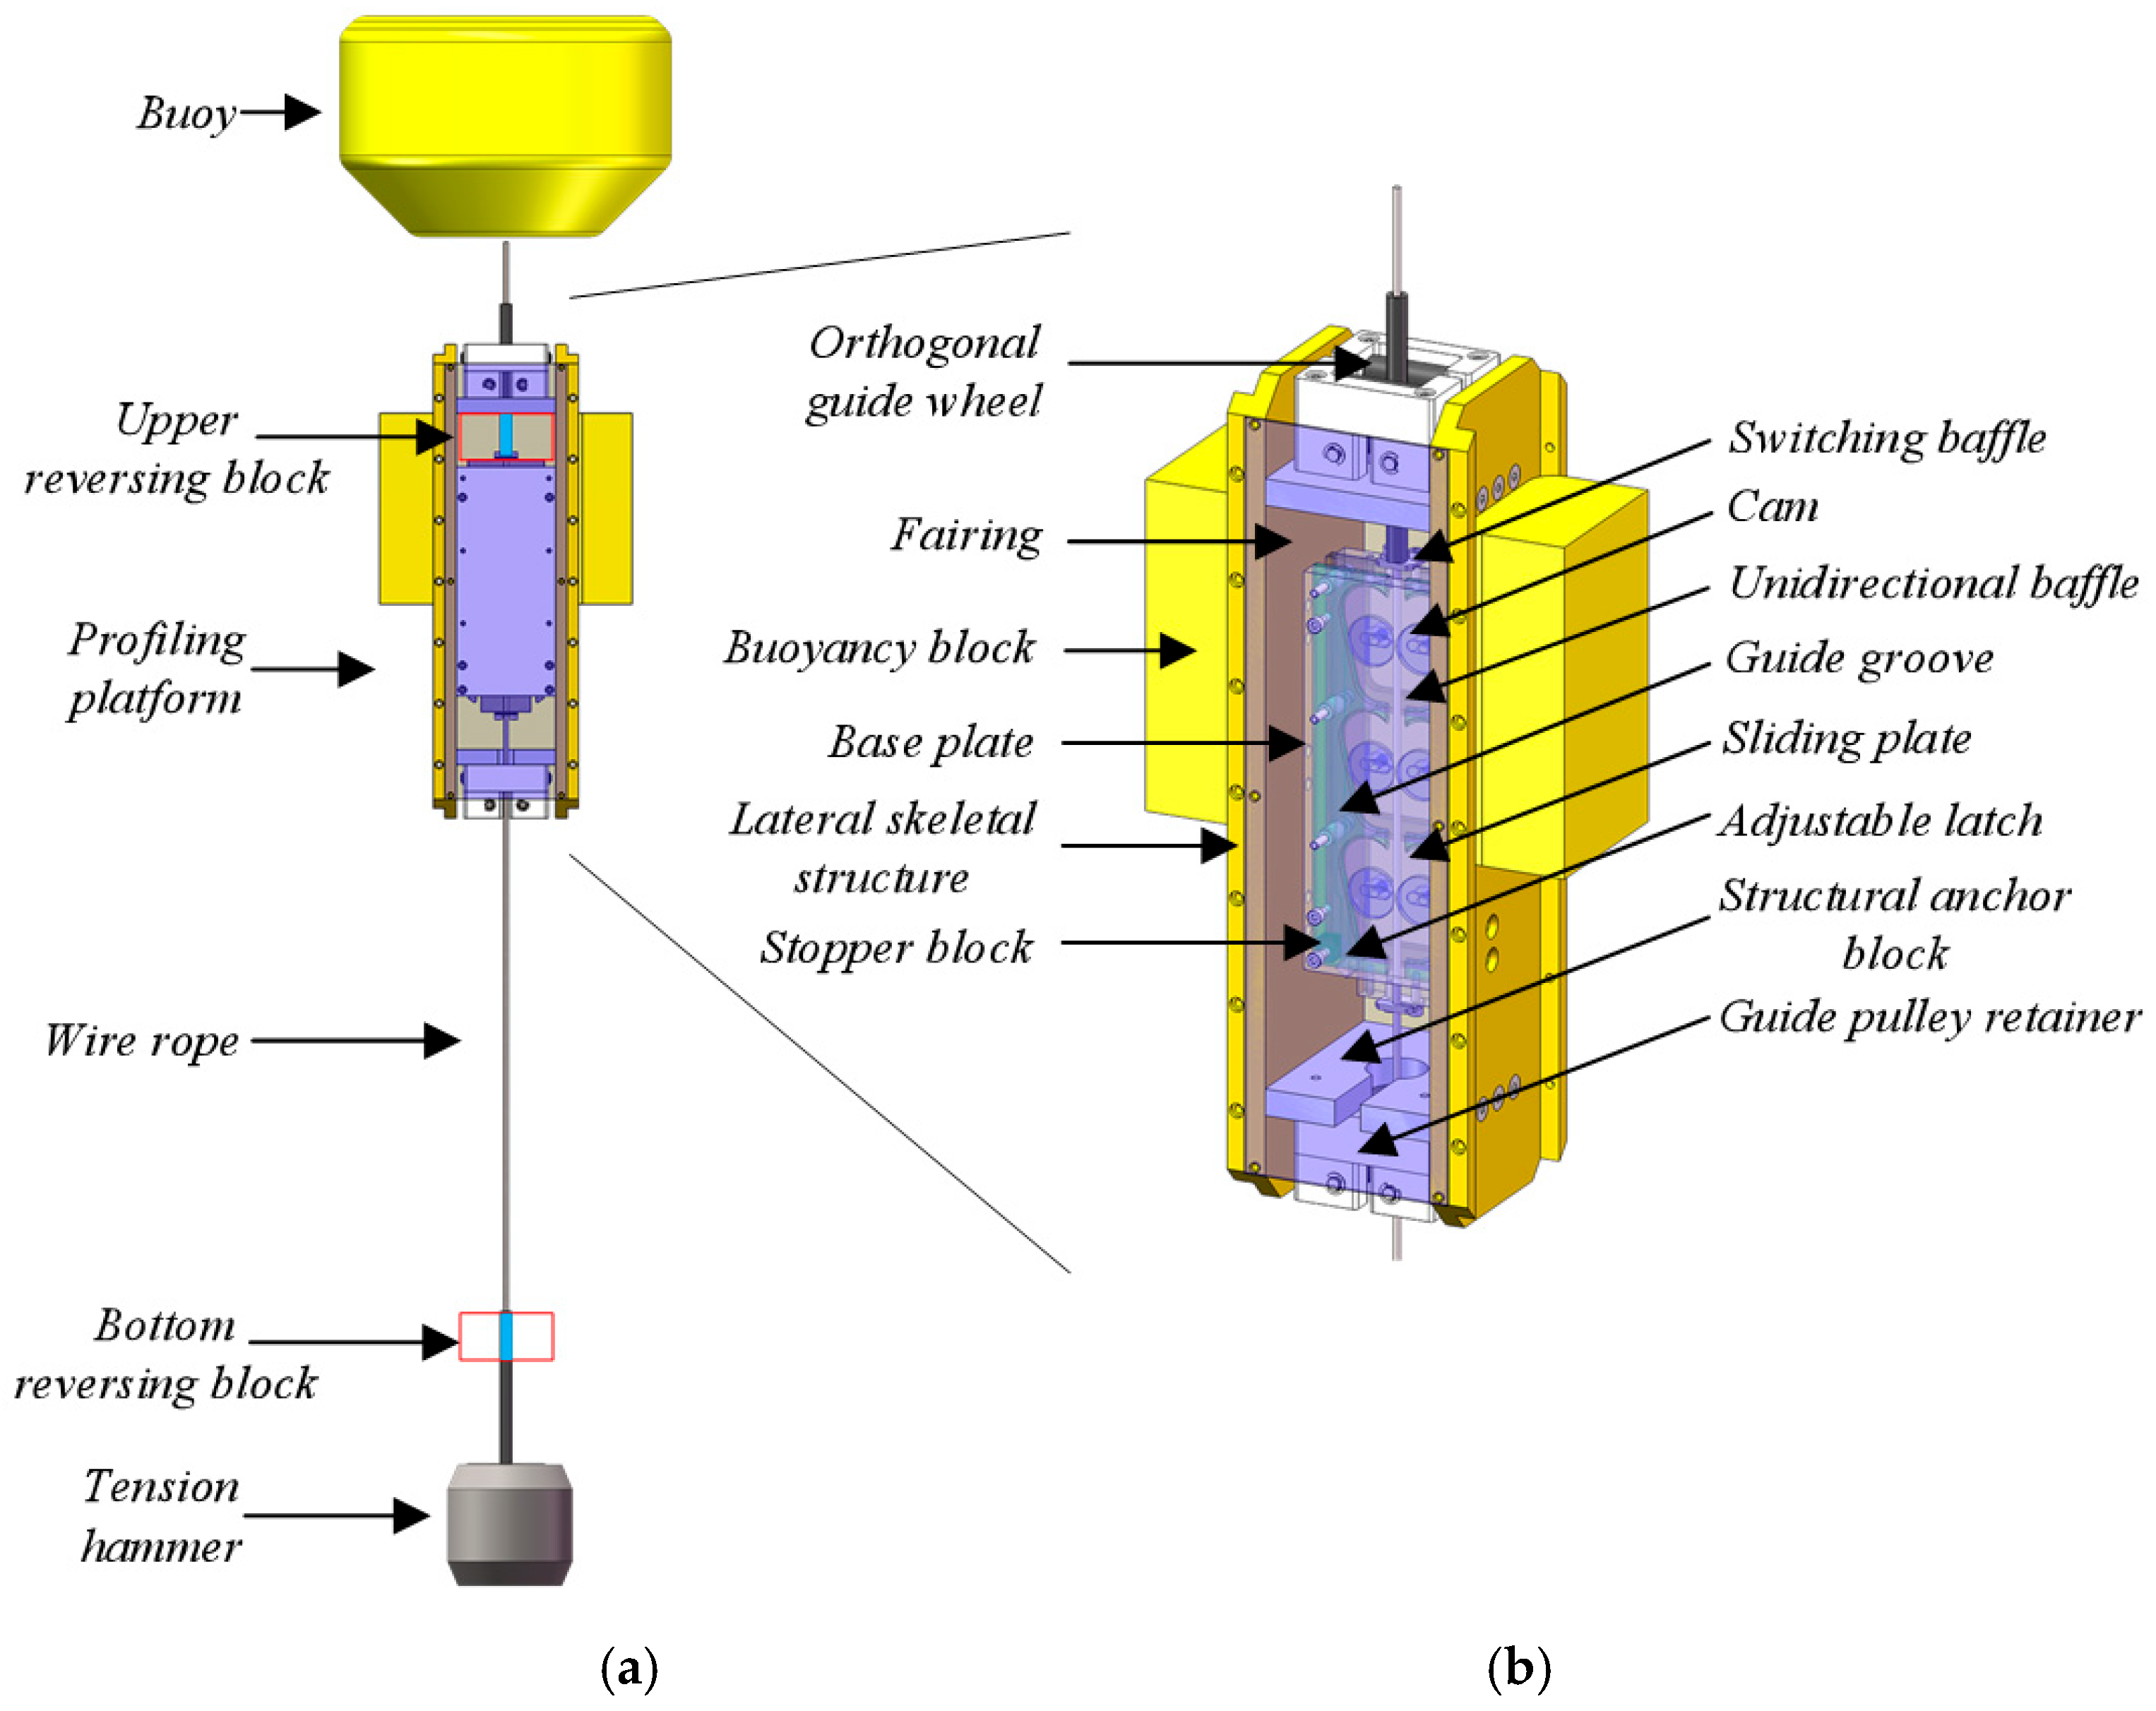
Figure 1. The WDP developed by Tianjin University of Technology. (a) Structure of the WDP; (b) structure of the profiling platform.
Energies 18 05425 g001
Figure 2. The working mechanisms of the wave energy capture device. (a) Open state; (b) closed state.
Energies 18 05425 g002
Figure 3. The working mechanisms of the WDP.
Energies 18 05425 g003
Figure 4. The experimental tank facility of the WDP. (a) Model of the experimental system; (b) physical model of the experimental system.
Energies 18 05425 g004
Figure 5. Contour map of the platform’s mean descent velocity within the parameter space defined by wave height and wave period, FP = 3 N.
Energies 18 05425 g005
Figure 6. Contour map of wave energy conversion efficiency for the WDP within the wave height and wave period parametric space, FP = 3 N.
Energies 18 05425 g006
Figure 7. Variation in profiling platform’s mean descent velocity as functions of net buoyancy under varying wave heights, T = 2 s. (a) Curves of mean descent velocity; (b) variation rate curves of mean descent velocity.
Energies 18 05425 g007
Figure 8. Evolution curves of the wave energy conversion efficiency for the WDP under varying wave heights within the net buoyancy parameter space, T = 2 s.
Energies 18 05425 g008
Figure 9. Evolution curves of the profiling platform’s mean rising velocity under varying net buoyancy conditions within the wave height parameter space, T = 1.95 s.
Energies 18 05425 g009
Figure 10. Time evolution of the profiling platform’s (a) displacement and (b) velocity under various wave heights, T = 1.95 s, FP = 2 N.
Energies 18 05425 g010
Figure 11. Time-dependent acceleration evolution curves of the profiling platform under various wave heights, T = 1.95 s, FP = 2 N.
Energies 18 05425 g011
Figure 12. Time evolution of the profiling platform’s (a) displacement and (b) velocity under varying net buoyancy conditions, T = 1.95 s, H = 0.4 m.
Energies 18 05425 g012
Figure 13. Time-dependent acceleration evolution curves of the profiling platform under varying net buoyancy conditions, T = 1.95 s, H = 0.4 m.
Energies 18 05425 g013
Table 1. Main parameters of sensors.
SensorsAngular Displacement SensorAccelerometerTemperature–Depth SensorData Acquisition Module
Product modelGTCV13636WT901SDCLRBRTDR-1060PH-mA20-485
Full scale range0–360°±2/4/8/16 g500 m\
Accuracy\0.0005 (g/LSB)±0.05%Better than 1‰
Baud rate9600 bps115,200 bps\\
Sampling frequency20 Hz20 Hz1 Hz\
Table 2. Uncertainties for various instruments.
SensorsSymbolUncertainty (%)
Angular displacement sensor U 1 1
Accelerometer U 2 0.5
Temperature–depth sensor U 3 0.1
Data acquisition module U 4 0.1
Table 3. Parameters of the experimental tank facility of the WDP.
Parameters Symbol ValueUnit
Profiling platform’s massmP14kg
Profiling platform’s lengthLP0.62m
Profiling platform’s widthWP0.5m
Profiling platform’s heightHP0.16m
Tension hammer’s massmT5kg
Wire rope’s lengthL1.8m
Wire rope’s mass per unit lengthK0.05Kg/m
Water densityρ1000Kg/m3
Vertical resistance coefficientCd0.53
Buoy’s diameterD0.636m
Wave heightH0.2–0.6m
Wave periodT1.95–2.9s
Profiling platform’s net buoyancyFP1–5N
Gravitational accelerationg9.81N/kg
Tank’s heightHT2m
Tank’s diameterDT0.9m
Disclaimer/Publisher’s Note: The statements, opinions and data contained in all publications are solely those of the individual author(s) and contributor(s) and not of MDPI and/or the editor(s). MDPI and/or the editor(s) disclaim responsibility for any injury to people or property resulting from any ideas, methods, instructions or products referred to in the content.