Article

Graph-Enhanced Prompt Tuning for Evidence-Grounded HFACS Classification in Power-System Safety

1
School of Electric Power Engineering, South China University of Technology, Guangzhou 510641, China
2
Shenzhen Urban Public Safety and Technology Institute, Shenzhen 518024, China
3
Shenzhen Research Institute, China University of Mining and Technology, Shenzhen 518057, China
4
School of Computer Science and Technology, China University of Mining and Technology, Xuzhou 221116, China
5
School of Artificial Intelligence, China University of Mining and Technology, Xuzhou 221116, China
6
School of Mechanics and Civil Engineering, China University of Mining and Technology, Xuzhou 221116, China
*
Authors to whom correspondence should be addressed.
Energies 2025, 18(20), 5389; https://doi.org/10.3390/en18205389 (registering DOI)
Submission received: 22 August 2025 / Revised: 2 October 2025 / Accepted: 9 October 2025 / Published: 13 October 2025
(This article belongs to the Special Issue AI, Big Data, and IoT for Smart Grids and Electric Vehicles)

Abstract

Power-system safety is fundamental to protecting lives and ensuring reliable grid operation. Yet, hierarchical text classification (HTC) methods struggle with domain-dense accident narratives that require cross-sentence reasoning, often yielding limited fine-grained recognition, inconsistent label paths, and weak evidence traceability. We propose EG-HPT (Evidence-Grounded Hierarchy-Aware Prompt Tuning), which augments hierarchical prompt tuning with Global Pointer-based nested-entity recognition and a sentence–entity heterogeneous graph to aggregate cross-sentence cues; label-aware attention selects Top-k evidence nodes and a weighted InfoNCE objective aligns label and evidence representations, while a hierarchical separation loss and an ancestor-completeness constraint regularize the taxonomy. On a HFACS-based power-accident corpus, EG-HPT consistently outperforms strong baselines in Micro-F1, Macro-F1, and path-constrained Micro-F1 (C-Micro-F1), with ablations confirming the contributions of entity evidence and graph aggregation. These results indicate a deployable, interpretable solution for automated risk factor analysis, enabling auditable evidence chains and supporting multi-granularity accident intelligence in safety-critical operations.

1. Introduction

Safety in the power industry is directly related to personal safety and socioeconomic stability. However, statistics indicate that over the past decade, a large number of power safety incidents have continued to cause casualties and economic losses each year [1]. The systematic analysis of accident risks not only helps reveal the mechanisms of risk evolution but also provides a basis for preventing similar events [2]. Currently, accident-causation analysis is primarily based on domain experts manually reading investigation reports and categorizing them, an approach that is inefficient, costly, and susceptible to subjective bias. With the ever-growing volume of accident text, this paradigm cannot adequately meet the needs of data-driven research on risk evolution.
To enable automatic identification and hierarchical categorization of accident risk factors, we introduce Hierarchical Text Classification (HTC). HTC is a multi-label NLP task whose objective is to assign texts to a hierarchical label taxonomy [3]. Compared with flat classification, HTC can exploit hierarchical inter-label dependencies to improve discrimination for fine-grained categories [4]; moreover, its predictions typically correspond to one or more paths in the taxonomy [5,6,7]. HTC has achieved progress in news categorization [8,9,10], scientific literature classification [11], legal document retrieval [12], and patent analysis [13], but it still faces challenges in modeling label structures that are large-scale, long-tailed/imbalanced, and deeply hierarchical [14].
In recent years, researchers have proposed various deep learning approaches to enhance the performance of hierarchical text classification (HTC) [5,6,7,15,16,17,18,19]. For example,
Zhou et al. [6] proposed HiAGM, which combined text encoding with hierarchical structure encoding to jointly model textual semantics and class topology. Deng et al. [7] maximized mutual information between the texts and the ground-truth labels and imposed priors on the label representations to counteract noise and imbalance. Chen et al. [15] employed hyperbolic representations of labels to better capture the structural relations between parents and children, and Wang et al. [16] proposed hierarchy-aware prompt tuning (HPT), using trainable soft prompts to narrow the semantic gap between pretrained language models (PLMs) and HTC downstream. These methods improved HTC performance from the perspectives of structural priors, geometric constraints, and prompt learning. Chen et al. [17] aligned text and label representations in a shared space with hierarchy-aware matching; Wang et al. [18] injected label hierarchies directly into contrastive construction to learn hierarchy-aware encoders; and Ji et al. [19] introduced HierVerb, a prompt-based framework that fused hierarchical knowledge into verbalizers through hierarchical contrastive learning for low-resource regimes.
Overall, these studies explored diverse directions for advancing HTC: explicit modeling of structural priors [6,7,17,18], geometric embedding in hyperbolic space [15], prompt-based learning [16,19], and comprehensive surveys and benchmarking [5]. Collectively, they substantially improved HTC under complex label taxonomies, long-tailed distributions, and low-resource conditions, and they also provided important motivation and references for the present work. In addition, Plaud et al. [20] emphasized the importance of hierarchical-specific evaluation metrics and inference strategies, highlighting that appropriate metrics were critical for fair comparison of HTC models. However, despite the remarkable progress of these methods, directly applying HTC to the vertical domain of power accident analysis still poses three substantive challenges.
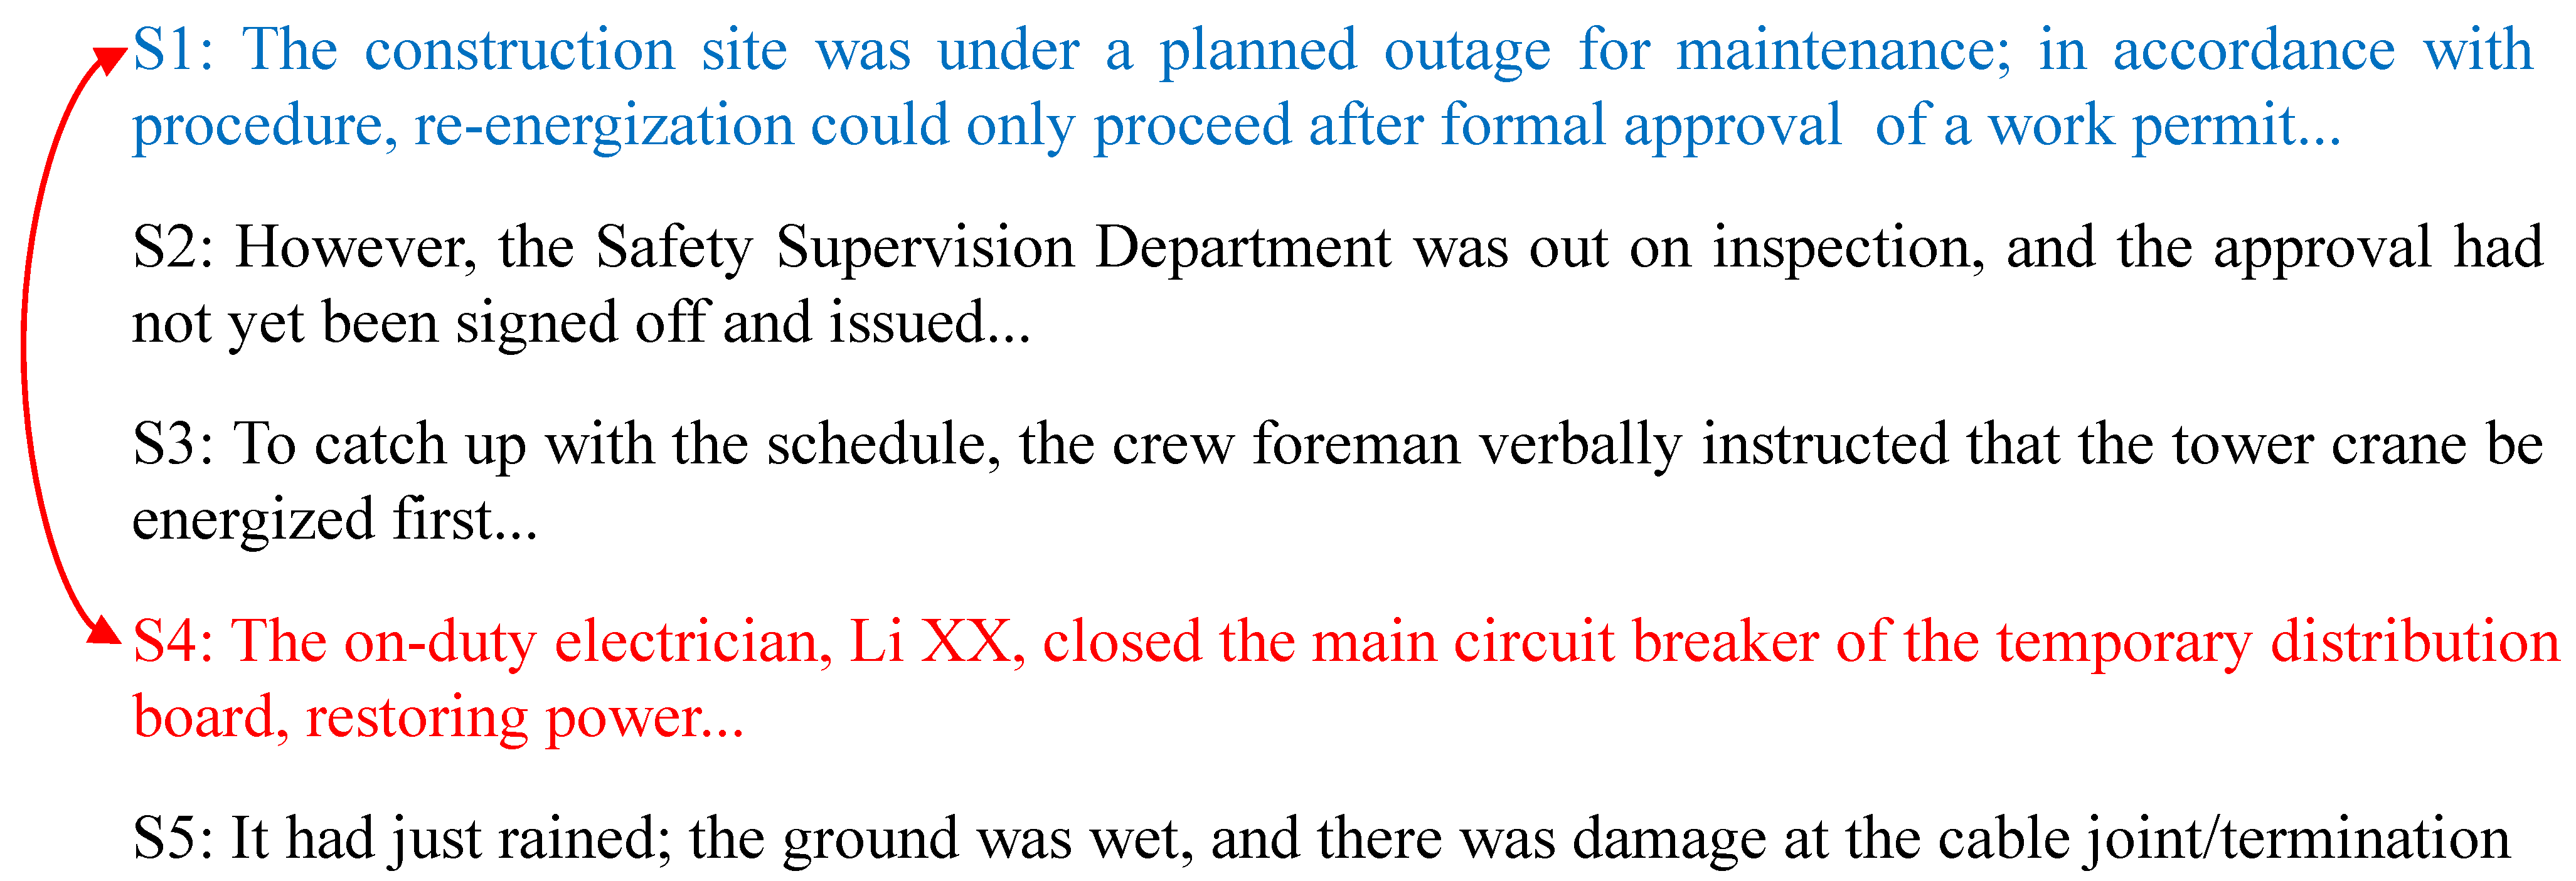
First, most HTC studies are validated at the sentence level or in short texts, while accident investigation reports often span multiple sentences and even paragraphs, with risk-related cues dispersed throughout. Meanwhile, HTC methods built on PLMs (e.g., BERT [21]) tend to suffer from attention decay over long-range dependencies and undermodel cross-sentence and cross-entity interactions, making it difficult to capture cross-sentence relations and causing key evidence entities, phrases, and short clauses scattered across sentences to be overlooked. As shown in Figure 1, identifying the label ’personnel violation’ usually requires the aggregation of clues from multiple surrounding sentences.
Second, most hierarchical text classification (HTC) methods are validated on open-domain datasets, with comparatively little work in vertical domain-specific settings. In open domain corpora [8,10], knowledge about label hierarchies, ontological concepts, entities, and hypernym–hyponym relations is largely acquired during PLM pre-training, so downstream fine-tuning can perform well even with limited supervision. In contrast, in vertical domains, models often lack the required expertise, making it difficult to correctly recognize terms such as ’220 kV fused circuit breaker’ and ’disc-type suspension porcelain insulator’, as well as their accident risks under specific operating conditions. Recently, Liu et al. [22] sought to mitigate this by integrating a domain knowledge graph into HTC, enabling the use of prior knowledge for both text representation and label learning. However, constructing a high-quality knowledge graph for accident analysis is itself complex and costly, and it remains particularly challenging in natural-language settings.
Third, most HTC approaches prioritize improving accuracy while paying insufficient attention to interpretability. Models typically return a label but fail to indicate which parts of the text substantiate the prediction. In high-stakes domain-specific settings, such as safety risk analysis, interpretability is as critical as precision. In power system accident risk classification, experts prefer models that demonstrate their work. If a model can highlight evidence units aligned with the predicted label (e.g., salient sentences, entities, or events) and produce an auditable evidence chain, its practical utility and regulatory readiness are greatly enhanced. However, systematic research on evidence localization and label–evidence alignment remains limited.
To address these challenges, we propose EG-HPT, a hierarchical classification method for determining the risk of power system accidents that integrates evidence extraction with semantic alignment. Built on a hierarchical prompt-tuning (HPT) framework, our key idea is to integrate label-aware evidence localization and semantic alignment modules, enabling the model to explicitly locate and exploit relevant text spans while predicting labels at each hierarchical level, thereby improving both classification performance and interpretability. Specifically, we employ the Global Pointer [23] to recognize complex, nested entities in accident narratives and construct a sentence–entity heterogeneous graph to aggregate cross-sentence information and enhance sentence and entity representations. We then compute attention scores between virtual label vectors and graph nodes, select the Top-k most relevant nodes as the evidence set for classification, and apply a weighted InfoNCE objective to achieve hierarchical semantic alignment between labels and evidence. A hierarchical separation loss and an ancestor-completeness constraint are further introduced, enabling the joint output of hierarchical labels and their corresponding key evidence nodes. Extensive experiments on a power-accident risk dataset show that EG-HPT outperforms strong baselines on Micro-F1, Macro-F1, and path-constrained C-Micro-F1. Ablation studies confirm the effectiveness of each module, and case analyses demonstrate robust adaptability to evidence localization and model interpretability. The principal contributions of this work are threefold.
(1)
We introduce EG-HPT, an evidence-driven, hierarchically interpretable framework for the classification of power-accident risk. Built on hierarchical prompt tuning (HPT), EG-HPT injects nested entity signals via the Global Pointer and aggregates cross-sentence context through a sentence–entity heterogeneous graph; an ancestors completeness constraint enforces hierarchical validity, enabling unified learning of labels, evidence, and text.
(2)
We design label-sensitive evidence localization and hierarchical alignment separation. The output slots of hierarchical prompts query the graph to surface auditable Top-k sentences/entities; a weighted InfoNCE objective aligns labels with evidence, while a triplet-margin separation preserves parent–child representation distances, mitigating semantic entanglement and hierarchical collapse.
(3)
We conduct a systematic evaluation under an extended Human Factors Analysis and Classification System (HFACS) taxonomy. In a cross-annotated corpus of double experts on power incidents, EG-HPT alleviates cross-sentence cue loss and long-tail effects, outperforming strong baselines on Macro-F1, Micro-F1, and path-consistent Micro-F1 (C-Micro-F1); ablations and case studies corroborate the contributions of evidence at the entity level and graph modeling.
The remainder of this paper is structured as follows. Section 2 reviews related work; Section 3 presents the EG-HPT framework and technical details; Section 4 describes the experimental setup, including dataset, label taxonomy, evaluation metrics, and baselines; Section 5 reports the results and analysis; Section 6 discusses applications, limitations, and potential improvements; Section 7 concludes and outlines future work.

2. Literature Review

2.1. Analysis of Accident Report Texts

In recent years, NLP has been widely applied to accident risk analysis in the safety domain. Early studies relied primarily on traditional machine learning pipelines. Unstructured accident narratives were converted into shallow statistical features, such as bag-of-words (BoW) and TF-IDF, and fed to classifiers including Naïve Bayes (NB), support vector machines (SVM), logistic regression (LR), and k-nearest neighbors (kNN) for cause identification and category assignment [24,25,26,27,28,29]. For example, Goh and Ubeynarayana [24] systematically evaluated multiple algorithms on 1000 OSHA construction accident reports; Zhang et al. [25] compared SVM, LR, and kNN in construction accident texts; and Kim and Chi [26] achieved automatic organization and classification of accident reports in the construction industry. In the power sector, Lu et al. [27] leveraged tokenization, term frequency, and TF-IDF to extract high-frequency terms from the description and cause the paragraphs to identify hazards; Xu et al. [28] built a domain lexicon to extract risk factors; and Li et al. [29] combined text mining with Bayesian networks for causation analysis in coal mine accidents. Although these approaches are simple and interpretable, they are limited by shallow representations and struggle to capture cross-sentence dependencies and implicit semantics. Methodologically, these pipelines emphasize feature engineering with linear or kernel decision rules, which offers fast training and transparent outputs; empirically, they improve coarse-grained categorization on short narratives but degrade on long reports where key evidence is scattered across sentences, and they rarely ground predicted labels in verifiable text spans.
With the rapid progress of deep learning, approaches based on RNNs, CNNs, GNNs, and pre-trained language models (PLMs) have been introduced into accident analysis [30,31,32]. Representative examples include Fang et al. [33] applying BERT to near-miss classification in construction; Meng et al. [34] combining BERT, Bi-LSTM, and CRF to construct a knowledge graph of power equipment failures from the literature; Liu et al. [35] proposing an intelligent parsing pipeline for power accident reports; Liu and Yang [36] integrating HMMs and random forests for association visualization and quantitative assessment of railway accident risk; and Khairuddin et al. [37] using Bi-LSTM to predict injury severity in accident reports. Numerous studies further validate the effectiveness of CNNs and GNNs for accident text tasks [30,38,39,40,41]: for example, Liu et al. [38] used CNNs for short text classification of secondary equipment faults in power systems; Li and Wu [30] applied CNNs to categorize construction accidents; Pan et al. [41] employed graph convolutional networks (GCNs) to automatically extract accident type, injury type, and injured body part from construction reports; and Cao et al. [42], Zeng et al. [43] incorporated structurally aware and multimodal textual features to extract key information. There is also a line of work that couples accident-causation theory with text analysis to enhance risk prediction. Jia et al. [44] embedded a classical causation model into the classification process to automatically extract causation patterns from gas explosion reports in coal mining. Qin and Ai [45] proposed a causality-driven hierarchical multi-label classifier that treats predefined hazard checklists as hierarchical labels, enabling the model to learn hazard–accident correspondences and improving the accuracy of risk identification. Cheng and Shi [46] applied a dual graph attention network to tourism resource texts, showing that integrating domain knowledge and heterogeneous label relations can significantly enhance classification accuracy in vertical domains. Overall, deep models substantially enhance the modeling of contextual semantics and local structure; however, they still fail to fully exploit hierarchical label dependencies and provide evidence-based explanations. In terms of contributions, PLM-based encoders increase robustness to lexical variation and typically raise Micro- and Macro-F1 over traditional baselines; in terms of challenges, most systems remain flat or weakly hierarchy-aware and seldom return sentence/entity-level evidence that auditors can verify, which limits deployment in safety-critical workflows.
More recently, research has shifted toward prompt engineering with large language models (LLMs). Ray et al. [47] used LLMs to classify OSHA narratives and fault details for automatic identification of equipment failures in construction; Ahmadi et al. [48] used GPT-4.0, Gemini Pro, and LLaMA 3.1 with zero-shot and customized prompts to extract root causes, injury causes, body part, severity, and time from construction accident reports; and Jing and Rahman [49] combined GPT-4 with prompt engineering for power grid fault diagnosis. Despite their versatility and rapid adaptability, LLMs face challenges in safety-critical scenarios, including domain knowledge gaps, hallucinations, and auditability of decisions; Majumder et al. [50] argued that domain-specific fine-tuning data, professional toolchains, and retrieval-augmented generation (RAG)-style knowledge augmentation are essential to improve reliability and controllability. In practice, we observe that zero/low-shot setups can expedite prototyping, but robust deployment often requires domain grounding and explicit evidence outputs, which current LLM pipelines do not guarantee.
In summary, accident text analysis has evolved along three main trajectories: from shallow features to deep representations, from flat labels to structure-aware modeling, and from purely supervised learning to prompt-driven and knowledge-augmented paradigms [51]. Nevertheless, most studies still rely on flat labels and under-utilize the inherent hierarchical structure of accident data; interpretability is also underaddressed, making it difficult to explicitly link labels to evidence. In critical infrastructure domains such as power systems, trustworthy and auditable decision processes are vital, and explainable AI (XAI) has become a key determinant of real-world deployment [52]. Beyond classification, prior work in the safety domain also investigates information extraction and event/causality modeling (entities, relations, and causal chains that explain accident mechanisms), temporal progression and hazard evolution, retrieval and question answering for incident investigation, and knowledge-graph construction; additional strands explore multimodal fusion, retrieval-augmented reasoning, and human-in-the-loop auditing. Our study focuses on evidence-grounded hierarchical classification, while these complementary directions clarify the broader landscape and delineate the scope of this work.

2.2. Hierarchical Text Classification Methods

Hierarchical text classification must balance label prediction with hierarchical dependency constraints. Its technical trajectory has generally evolved progressively from hierarchical variants of traditional learners to end-to-end neural modeling, then to explicit/implicit structural encodings and low-resource paradigms. As a field-level map, Zangari et al. [5] synthesized traditional and neural HTC lines and highlighted the need for metrics and benchmarks that reflect hierarchical structure (e.g., path consistency and level-aware scoring), which framed many of the methods discussed below.
Early studies focused on hierarchy-adaptive modifications of traditional machine learning algorithms. Granitzer et al.’s hierarchical boost (BoosTexter/Centroid Booster) trained binary classifiers independently at each node and suppressed error propagation across levels via local negative sample selection [53,54]; Esuli et al. [55,56] recursed AdaBoost.MH into TreeBoost.MH, dynamically updating sample weights according to parent–child relations to enhance the robustness of hierarchical decisions. ClusHMC by Vens et al. jointly predicted multiple labels with a single decision tree and introduced a hierarchical distance to improve the split criterion, markedly boosting multi-task sharing efficiency [57]. To address label scarcity, Santos et al. [58] proposed HMC-SSRAkEL (self-training + ensemble), while Nakano et al. H-QBC [59] used query-by-committee to select highly informative samples, promoting the deployment of semi-supervised/active learning in HMTC scenarios. Methods at this stage are simple and efficient but have limited capacity for cross-level semantic propagation and contextual representation. They are computationally light and interpretable, and they reduce top-level mistakes; however, node-local decisions tend to propagate errors downward, and performance drops on deeper levels and long documents that require cross-sentence context.
With the rise of deep learning, end-to-end neural modeling has become a mainstream approach. On the recurrent front, Huang et al.’s HARNN/HmcNet generated document representations top-down via hierarchical attention units and ensured decoding consistency with path-constrained pruning (PCP) [60,61]; Wang et al.’s HCSM combined an ordered RNN (AORNN) with a bidirectional capsule network (HBiCaps), using dynamic routing to pass semantics across the hierarchy [62]. On the convolutional side, Shimura et al.’s HFT-CNN hierarchically fine-tuned the characteristics of the parent class to strengthen discrimination between child classes [63]; Peng et al. [64] converted text into a Word graph and used graph convolution to capture non-contiguous patterns, including a joint hierarchical regularizer that inspired subsequent graph-based research. From a generative perspective, Mao et al. [14] treated HMTC as a Markov decision process, and HiLAP searched label paths via reinforcement learning; Fan et al. [65] adopted a sequence generation paradigm to output structured labels and introduced hierarchical constraints via multilevel decoupling. These approaches enhance end-to-end representation and inference, but they remain relatively weak in explicitly aligning label semantics with textual evidence. Across benchmarks, these models typically improved accuracy and F1 over traditional learners—especially at mid-depth levels—yet they seldom provided auditable evidence per predicted label, and path consistency often relied on post hoc rules rather than learned grounding. HTCInfoMax [7] advanced this line by maximizing mutual information between texts and gold labels while imposing priors on label embeddings, effectively filtering irrelevant content and mitigating label imbalance beyond HiAGM.
In recent years, graph neural networks have become a key technique for explicit structural modeling. In semantic alignment, Chen et al.’s HiMatch [17] computed text–label similarity in a shared embedding space, with a hierarchical matching loss that enforced coarse-to-fine alignment and improved hierarchy awareness; Zhang et al.’s LA-HCN [66] employed label-aware graph attention to dynamically aggregate same-level labels and generate feature masks. In geometric embeddings, Chen et al.’s HyperIM [15] leveraged the tree-like property of hyperbolic space to encode parent–child relations in the Poincaré ball; Deng et al.’s HLGM [67] modeled branch dependencies with a hypergraph and strengthened inter-class separation via a hierarchical triplet loss. For knowledge augmentation, Liu et al.’s K-HTC [22] integrated knowledge-graph entities and used graph attention to jointly optimize text and label representations; Cheng et al. [68] integrated domain knowledge and hierarchical relations via a heterogeneous graph. Kumar and Toshinwal [69] further introduced a Hierarchy-Aware Label Correlation (HLC) model with Graphormer encoders and a CEAL loss, which effectively captured fine-grained label dependencies.
This line of work reinforces structural priors and topological plasticity, but it often relies on high-quality ontologies/knowledge graphs, as well as stable structural assumptions. These methods inject topology into learning and reduce coarse-to-fine errors when structural priors are accurate; however, they depend on ontology/knowledge-graph quality, and robustness degrades when priors are noisy or incomplete. Moreover, many still optimize structure without explicitly grounding predictions in sentence/entity evidence. HiMatch [17] exemplified hierarchy-aware text–label alignment in a joint embedding space, reporting consistent gains in hierarchy-sensitive metrics.
Breakthroughs in low-resource learning paradigms are pushing HMTC toward practical deployment. In contrastive learning, Wang et al. proposed HGCLR [18] and HPT [16]. HGCLR injected label topology into the text encoder through hierarchy-aware construction of positives and negatives, and, together with label path control and phrase-level enhancement, produced high-quality samples [18]. HPT appended learnable virtual label tokens to the end of the input sequence, reformulated hierarchical multilabeling as layer-wise multilabel MLM, and jointly trained text and label representations within a shared BERT encoding space using ZMLCE loss [16]. Yu et al.’s HJCL [70] combined contrastive learning at the instance level and the label level, using batching strategies to stabilize optimization over complex structures. In the few-shot setting, Shen et al.’s TaxoClass [71] initialized the core classifier from class names and achieved efficient generalization through hierarchical self-training; Ji et al.’s HierVerbalizer [19] verbalized label descriptions as prompts to adapt pre-trained models; Zhang et al.’s Dataless [72] achieved zero-shot classification via semantic-space similarity. Zhang et al. [73] proposed Bpc-lw, which introduced a bidirectional path constraint with label weighting to enforce inter-layer consistency and employed contrastive learning to enhance discriminability in few-shot HTC. Compared with fully supervised end-to-end methods, these approaches offer advantages in parameter efficiency, generalization, and adaptability to weak supervision, but they still provide limited support for evidence interpretability and cross-sentence dependencies. Empirically, HGCLR [18] trained hierarchy-aware encoders by constructing contrastive positives and negatives directly guided by taxonomy, while HPT [16] narrowed the PLM-task mismatch via prompt-based verbalizers; HierVerbalizer (HierVerb) [19] injected hierarchical knowledge into verbalizers through hierarchical contrastive learning and outperformed graph-based baselines in few-shot HTC. Still, most methods fall short of selecting verifiable Top-k evidences per label or modeling cross-sentence chains explicitly.
Task-specific extensions continue to broaden application boundaries. Under extreme multi-label and dynamic environments, researchers explore computational and evaluation scalability. Liu et al. [74] validated the scalability of CNNs on large label sets and proposed dynamic pooling; Gargiulo et al. [75] mitigated long-tailed effects via label set expansion. Ren et al. [76] combined time-aware topics to cope with concept drift in social streams; Zhao et al. [77] designed an interactive feature fusion to accommodate the hierarchical classification of the scholarly literature. In terms of toolkits and metrics, Liu et al. [78] provided multiple text encoders and hierarchical loss interfaces; Amigó and Delgado [79] introduced an Information-Contrast Measure (ICM) to characterize evaluation consistency under hierarchical imbalance, supporting reproducibility and fair comparison. These efforts address scale and evaluation, but persistent challenges remain in long-tail robustness, deep-level recall, and delivering path-consistent predictions with evidence that auditors can verify.
In summary, the development of HMTC reflects a continuous evolution from hand-crafted features → end-to-end representations, from explicit constraints → implicit structural encodings, and from full supervision → low-resource/parameter-efficient regimes [14,16,17,18,64]. However, existing methods still have shortcomings in the following aspects. First, label–evidence alignment is insufficiently explicit: most models improve structural consistency via label embeddings or path constraints, but they do not systematically address the auditable question of “which sentences/entities support a predicted label.” Second, cross-sentence/cross-entity dependency modeling is inadequate: in long documents, causal cues are often scattered across sentences, and pure sequence encoding or label alignment struggles to capture cross-sentence interactions and inter-entity relations. In addition, hierarchical separability and long-tail robustness remain fragile, with semantic collapse and insufficient recall of deep labels and rare categories. To address these issues, this paper introduces label-aware evidence localization, hierarchical semantic alignment (weighted InfoNCE), and hierarchical separation (triplet) constraints under the HPT framework, and it models cross-sentence dependencies via Global Pointer [23]-based nested entity recognition and a sentence–entity heterogeneous graph, with the aim of simultaneously improving structural consistency, few-shot robustness, and interpretability, thus remediating gaps in engineering auditability and long-document understanding. Our approach therefore seeks to join structural priors with explicit evidence grounding and to deliver path-consistent predictions that can be inspected and audited in safety-critical applications.
3. Materials and Methods

3.1. Model Architecture

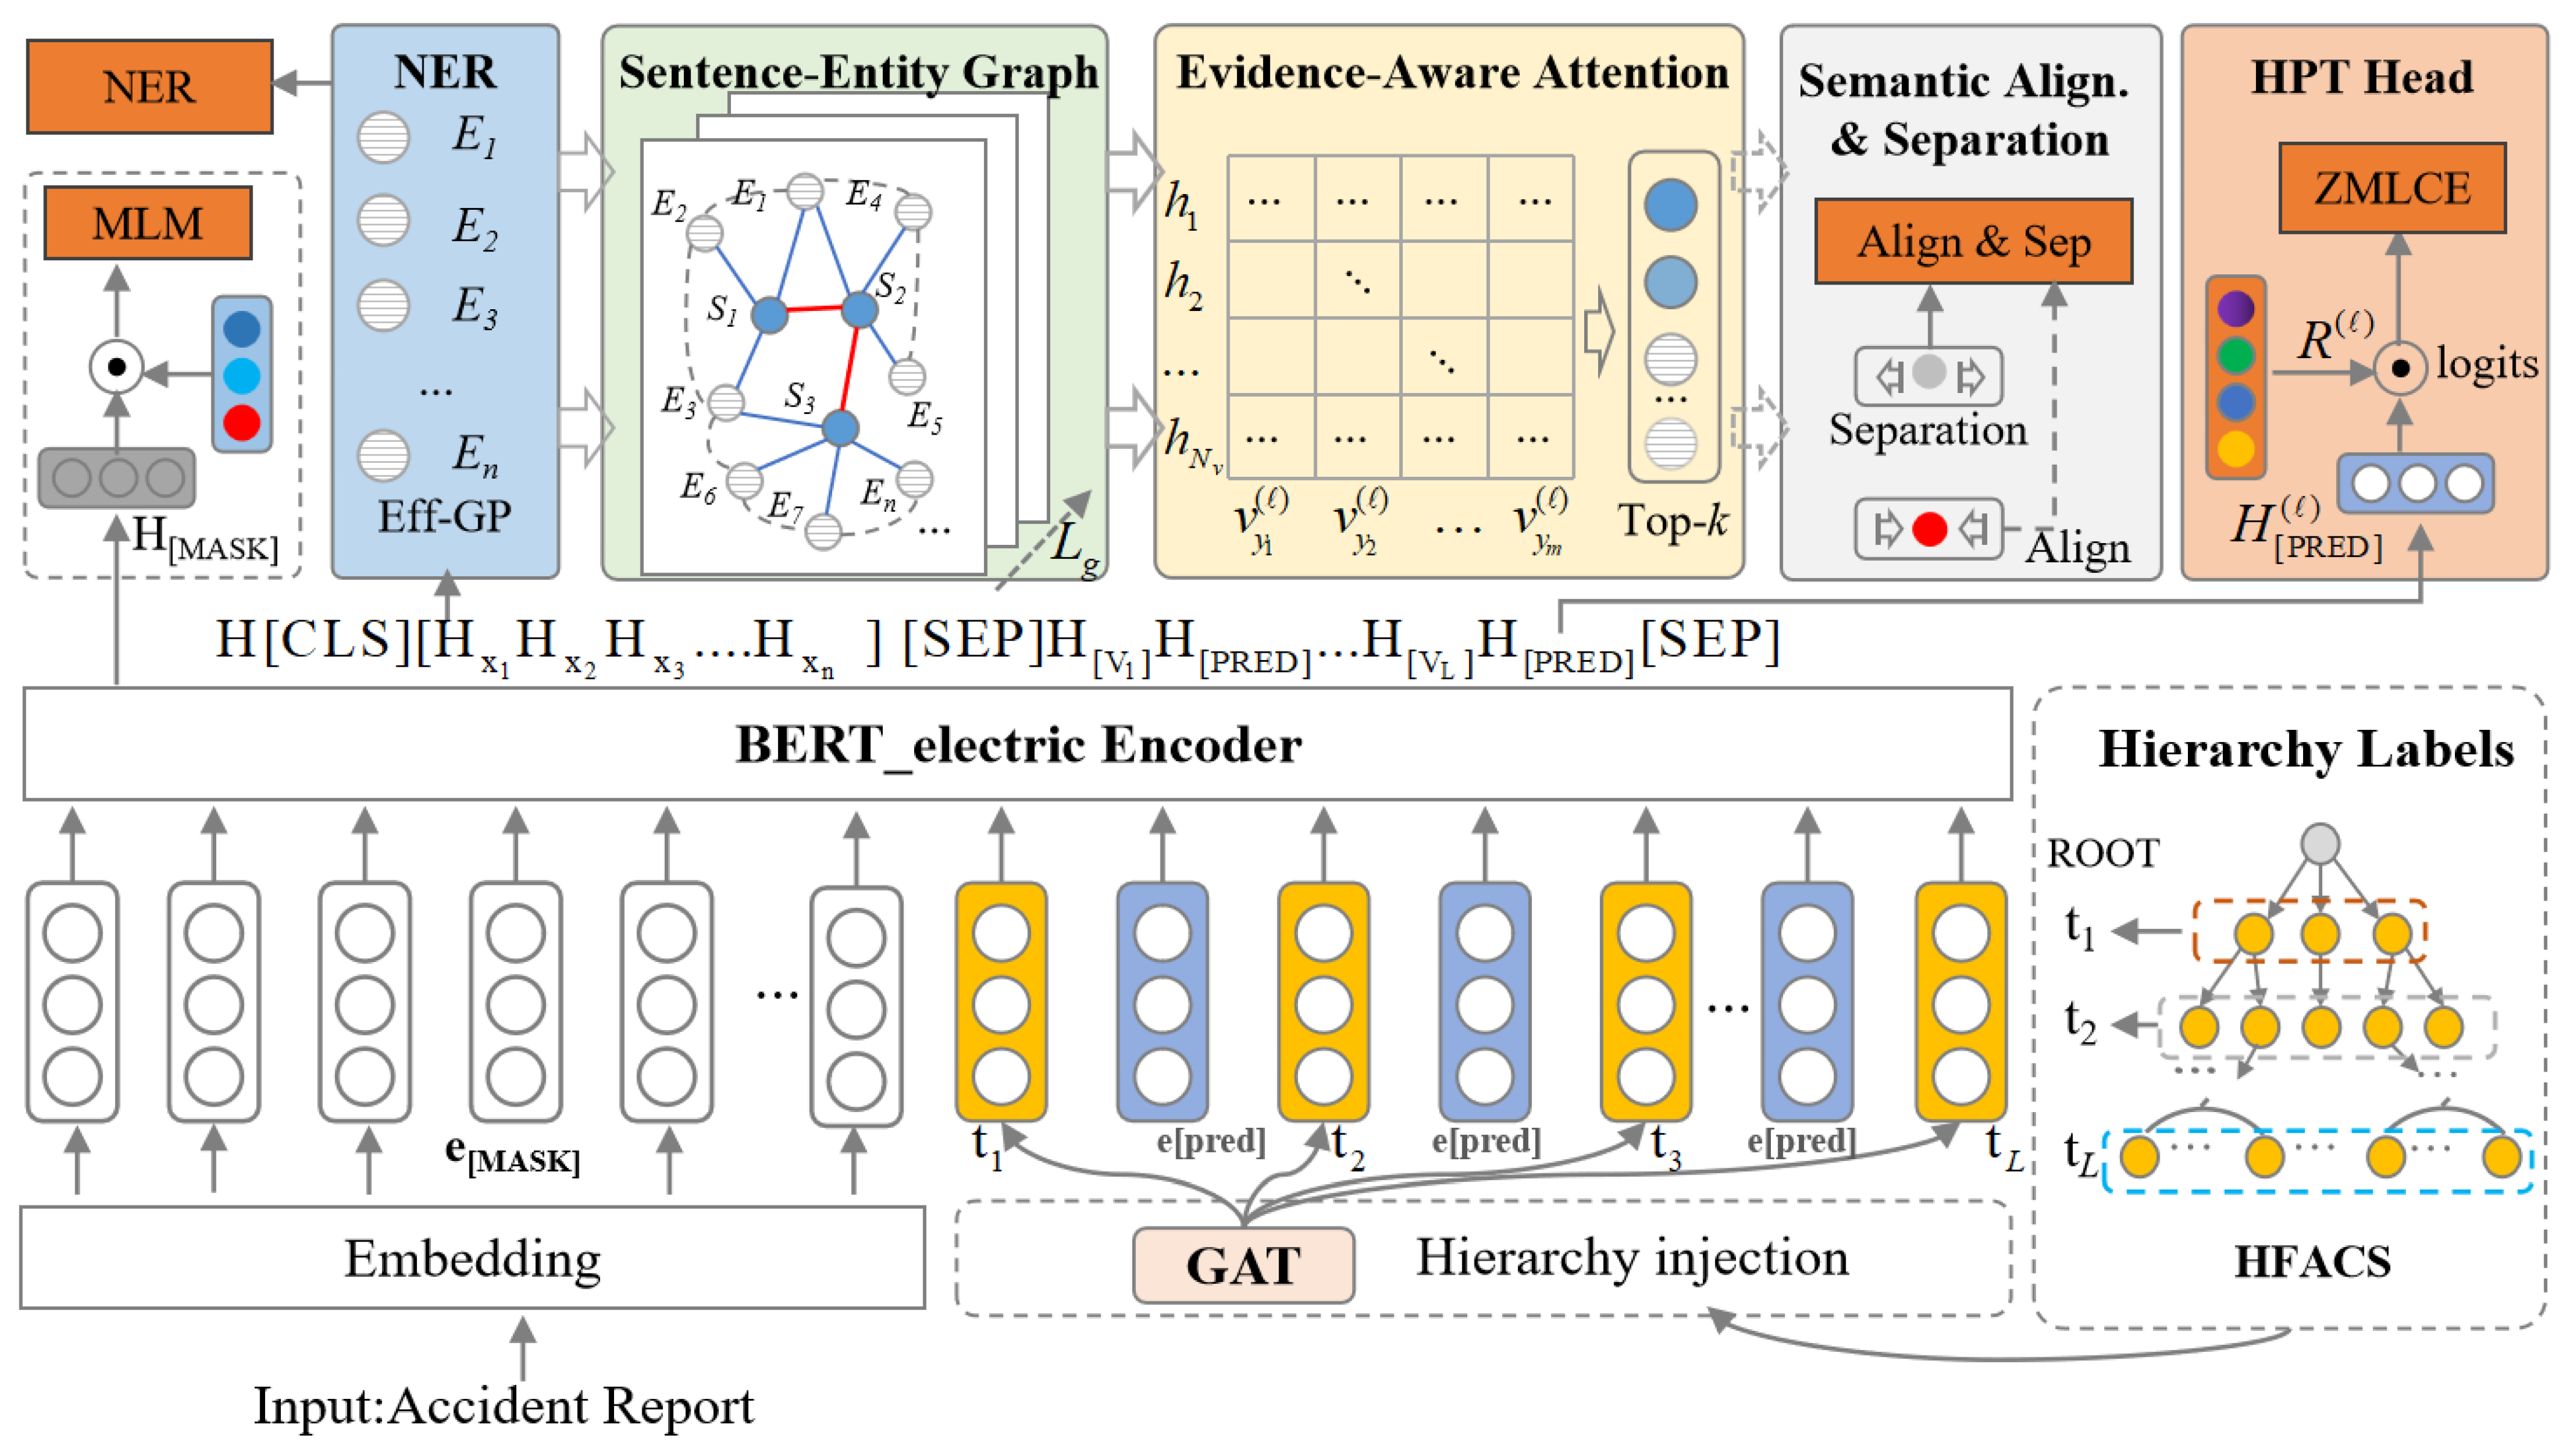
The general architecture of EG-HPT is shown in Figure 2. Taking accident reports as input, the model outputs the corresponding set of hierarchical label paths and, for each predicted label, provides the Top-k most relevant evidence sentences as explanations. Based on HPT, EG-HPT introduces entity-centric information modeling and cross-sentence evidence mining modules to better exploit domain knowledge and enhance the interpretability of classification. Specifically, the model comprises two main pipelines: one serves as the backbone for text encoding and classification with hierarchical prompting, and the other is an evidence-oriented module for key information extraction and semantic alignment.
The model first embeds the input text and augments it with hierarchical prompts, which are then fed into a BERT encoder. Through the design of soft prompt tokens and the special marker [PRED] (see Section 3.2), the BERT encoder yields the hidden states required to predict labels at each hierarchical level. Then, given a predefined label hierarchy (e.g., the HFACS taxonomy), a Graph Attention Network (GAT) injects structural knowledge into the prompt representations, producing text representations and label prediction vectors infused with hierarchical information. Finally, following HPT [16], a multi-label MLM head maps the hidden states at each level to prediction scores over the corresponding labels, and optimization is performed using the Zero-bounded Multi-Label Cross-Entropy (ZMLCE) loss.
In the evidence extraction and alignment pipeline, the model first applies a named entity recognition module to extract domain entities from the text (Section 3.3). Then, it constructs a heterogeneous sentence–entity graph based on the extracted entities, connecting sentence nodes and entity nodes in the report to capture cross-sentence evidence chains (Section 3.4). Graph neural propagation yields sentence representations enriched with entity information, which serve as representations of candidate evidence fragments. Next, for each potential label, the model computes its relevance scores with all textual units (sentences) and identifies the Top-k sentences that provide the strongest support as evidence for that label (Section 3.5). During training, in addition to the basic loss in label prediction, we introduce semantic alignment and separation losses over evidence (Section 3.6) to encourage the semantic representation of correct labels to be closer to their corresponding evidence while distinguishing the semantics of the evidence of different labels. Moreover, the model enforces hierarchical consistency in the outputs: For any predicted fine-grained label, all its ancestor labels are automatically completed to produce a full path. With this design, EG-HPT effectively integrates the hierarchical prompting strengths of the original HPT with explicit entity-evidence modeling, thus improving performance in complex hierarchical classification while providing strong interpretability.

3.2. Text Encoding and Hierarchical Prompting

The text-encoding module with hierarchical prompting converts the input text into a sequence of representation vectors enriched with label-hierarchy information. As shown in Figure 2, we adopt the prompt-template approach of HPT [16], concatenating accident reports with hierarchical prompts and feeding the result into a pre-trained language model for encoding. Specifically, given an input token sequence x = [ x 1 , x 2 , , x N ] (with N tokens) and a hierarchy with L levels, we first construct the corresponding prompt-template sequence:
T = [ [ C L S ] x 1 , x 2 , , x N [ S E P ] V 1 [ P R E D ] V 2 [ P R E D ] V L [ P R E D ] ] .
Here, [ C L S ] and [ S E P ] are BERT’s special separators; V i denotes the learnable virtual prompt token (soft prompts) for level i; and [ P R E D ] is a special prediction placeholder that indicates the position to predict labels at that level. After BERT encoding, we obtain a d-dimensional hidden state h for each position. In particular, for the i-th [ P R E D ] position, we denote its output vector by h p ( i ) R d , which will be used to predict all candidate labels at level i.
To explicitly inject the label hierarchy into the prompt representations, we employ a hierarchical-injection mechanism [16] (see the lower right of Figure 2). We model the label system (e.g., the HFACS taxonomy) as a graph and, for each level, we introduce a “virtual level node” t i connected to all label nodes at that level. We initialize each label node with its semantic vector r y (a learnable label representation, which can be initialized by averaging the word embeddings of the label name) and initialize each virtual level node with the corresponding template vector t i . We then run several layers of a Graph Attention Network (GAT) on this graph so that each virtual level node aggregates information from all label nodes at its level, thereby producing new template vectors t i infused with hierarchical semantics. Finally, we replace t i with t i as V i in the BERT input sequence. This fusion strategy injects prior knowledge of the label system during encoding, helping the model capture cross-level label dependencies and mitigate label imbalance across levels.
After obtaining hierarchy-aware hidden representations, we perform multi-label prediction via prompt tuning. The [PRED] vector at each level only predicts the labels at that level: for each concrete label y in the hierarchy, we pre-define or learn a representation of the label d dimension r y and compute a matching score between h p ( i ) , the candidate vectors of labels r y (e.g., an inner product s y = h p ( i ) · r y ). Thus, at the i-th [PRED] position, the model produces the set of scores { s y } on all labels at that level, which is then transformed into a probability distribution via appropriate activation. During training, we optimize per-level label predictions with the Zero-bounded Multi-Label Cross-Entropy (ZMLCE) objective proposed in HPT (see Section 3.6).
With this encoding-and-prediction mechanism based on hierarchical prompts, EG-HPT casts complex hierarchical multi-label classification as a sequence of fill-in-the-blank predictions, fully integrating label semantics and hierarchical information without altering the pretrained model architecture.

3.3. Domain Named Entity Recognition

Power-accident reports encompass multiple categories of domain entities closely tied to risk assessment, which provide key signals for hierarchical risk classification. Based on industry references such as the Electric Power Safety Work Regulations, our semantic annotation covers a range of entity types relevant to safety, as shown in Table 1.
Unlike open-domain text, power-accident reports frequently exhibit overlapping and nested entities: a longer entity may contain shorter ones, and the same span can correspond to multiple types. For example, in “using [insulating operating rod] to open [drop-out fuse],” the phrase “insulating operating rod” is composed of “insulating” and “operating rod,” and, depending on context, can be annotated as “safety gear” or “electrical equipment.” Conventional sequence labeling typically assumes nonoverlapping entities and thus struggles with such nesting. We therefore adopt Global Pointer (GP) [23] for nested entity recognition and use its efficient variant (Eff-GP) for span scoring, producing more robust extraction under overlap and nesting. During end-to-end training, the NER branch is supervised with a masked binary cross-entropy over type-specific span score matrices, producing the NER loss L NER . This loss is included in the joint objective with a weight λ n to stabilize the boundaries and types of entities.
After NER, we obtain an entity set { e k } , where each entity e k is associated with its start and end positions ( i k , j k ) in the text and a predefined type c k . We compute a representation vector for each entity and incorporate its type information. As noted above, the BERT encoder produces a d-dimensional hidden state h i for each token x i . For the k-th entity mention spanning positions i k to j k , we first average the token vectors within the span to obtain its contextual representation:
h ¯ k = 1 j k i k + 1 i = i k j k h i , h ¯ k R d .
Let the type of e k be c k ; we assign a trainable type vector t c k R d to each entity type c and add it to the contextual vector, yielding the final entity representation
e k = h ¯ k + t c k .
If the same entity is mentioned multiple times in the report, we average the vectors at the level of reference h ¯ to obtain a vector for the unified entity e k .
In this way, we derive vector representations for all salient entities in the text. These entity embeddings encode domain knowledge (type semantics and local context) and lay the groundwork for constructing the subsequent sentence–entity graph. Compared with the original HPT, which relies solely on unlabeled textual features, explicitly introducing the NER module highlights key entities in accident reports and helps the model capture content correlated with category labels more accurately.

3.4. Sentence–Entity Heterogeneous Graph

Accident reports typically contain multiple sentences, and each sentence may describe only part of the facts or contributing factors. To integrate clues that span across sentences, we construct a sentence–entity heterogeneous graph to structurally model textual evidence. As shown by the green module in Figure 2, we treat both the entities extracted in the previous step and the sentences in the report as graph nodes: let S i denote the i-th sentence node and E k denote the k-th entity node. If an entity E k appears in a sentence S i , we add an undirected edge between S i and E k to indicate that the sentence mentions that entity. In this way, sentences that mention the same entity become indirectly connected, forming cross-sentence evidence chains in the graph (the red lines in Figure 2 illustrate how a shared entity links sentences S 1 and S 3 ).
Next, we assign initial representations to graph nodes and perform information propagation with a graph neural network. For each node in the sentence S i , we compute its vector s i from the hidden states of the BERT: if the sentence S i spans the positions of the tokens α i to β i in the text, we average the hidden vectors of these tokens to obtain the following:
s i = 1 β i α i + 1 t = α i β i h t , s i R d .
The initial representation of each entity node is directly given by the entity vector e k obtained in Section 3.3. With these initial sentence and entity representations, we encode the heterogeneous graph using a Graph Attention Network (GAT). In each message passing around, a node receives information from its neighbors and updates its representation:
h v = σ u N ( v ) α v u W h u ,
where N ( v ) denotes the neighborhood of node v, α v u is the attention weight computed from the current representations of node v and its neighbor u, W is a learnable transformation matrix, and σ is a nonlinear activation.
We stack several layers (e.g., L g layers) so that information gradually propagates between sentence and entity nodes. After graph encoding, each sentence node aggregates evidential cues from other sentences that share entities with it, producing a cross-sentence evidence vector s i . We consider updated sentence vectors { s i } as representations of candidate “evidence fragments” for the subsequent attention-based selection. Compared to the original HPT, which relies solely on hidden Transformer layers to capture long-range dependencies, our explicit sentence–entity graph strengthens inter-sentence interactions and structurally integrates dispersed evidence, thus improving the model’s ability to capture cross-sentence information.

3.5. Evidence-Aware Attention over Text Units

After heterogeneous-graph information propagation, the sentence and entity nodes in an accident report have been fused into alignable text units (see the orange module in Figure 2). Let the index set of these text unit nodes be { 1 , 2 , , N v } . We denote the representation vector of node i by h i R d ( d = 768 ) , which encodes both the local lexical information of the node and cross-sentence evidential cues. To guide the supervision signal of hierarchical labels in these text units, we establish, for each candidate label, an evidence selection mechanism based on attention: we calculate a relevance score between the embedding vector of the label and each representation of the text unit, then we normalize the scores to obtain an attention distribution. Specifically, for a label y on level l, let its embedding be v y ( l ) R d (for example, obtained by combining the output of [PRED] position H [ PRED ] ( l ) from the previous section with the semantics of that label). The relevance score between the label y and the text unit i is then defined as follows:
s i , y ( l ) = v y ( l ) · h i ,
where v y ( l ) is the d-dimensional vector representation of label y at level l, h i is the d-dimensional representation vector of text unit i, “·” denotes the inner product operation, and s i , y ( l ) is a scalar indicating the relevance score of label y for text unit i.
Next, we apply a Softmax function with the temperature parameter τ to convert all text unit scores { s j , y ( l ) } into an attention weight distribution:
α i , y ( l ) = exp ( s i , y ( l ) / τ ) j = 1 N v exp ( s j , y ( l ) / τ ) , i = 1 , 2 , , N v ,
where α i , y ( l ) denotes the attention weight with which label y at level l attends to text unit i, and τ > 0 is a hyperparameter that controls the sharpness of the distribution: a smaller τ value makes the attention more concentrated, thereby selecting a more concise set of key evidence; a larger τ value yields a smoother attention distribution, thereby covering more content and improving robustness to noise.
We then select from all text units the k units with the largest attention weights as the Top-k evidence, forming the key evidence set for label y at level l, denoted by H y , l + . The elements of H y , l + are the text unit evidences (sentences or sentence fragments containing entities), and their number k is a prespecified hyperparameter, typically chosen in the validation set to balance recall against noise; a k value that is too small may miss important evidence, whereas a k value that is too large may introduce redundancy. For the nodes in H y , l + , we renormalize their attention values to obtain the final attention coefficient for each evidence:
w i , y ( l ) = α i , y ( l ) j H y , l + α j , y ( l ) , i H y , l + .
Here, w i , y ( l ) denotes the normalized attention weight of text unit i with respect to label y. These weights will be used in the subsequent semantic alignment loss.
During inference, for each label predicted by the model, we apply the above attention mechanism over all text units in the document to select and output the Top-k evidences: for every predicted label, the model returns several supporting text fragments together with their attention scores, serving as interpretable justifications for the decision (corresponding to the output module in Figure 2, i.e., “label path including ancestors + Top-k evidence for each label”).
By establishing the pathway “label vector → node attention → key evidence,” the semantic constraints of hierarchical labels are explicitly grounded to concrete sentence or entity nodes, mitigating the dilution of salient cues in long documents. This evidence-aware attention mechanism effectively mitigates the dilution of critical information in long documents while maintaining classification performance, and it substantially enhances the interpretability and auditability of the model’s decisions.

3.6. Hierarchical Semantic Alignment and Separation Losses

Alignment pulls each label embedding toward the Top-k supporting text units (sentences/entities from Section 3.5) and pushes it away from non-evidence; separation keeps easily confused labels (especially parent–child or same-level neighbors) apart with a margin so that decision boundaries remain sharp. Guided by these intuitions, we realize alignment with a weighted InfoNCE objective and separation with a triplet-margin constraint in the shared embedding space.
To mitigate semantic decoupling between virtual label embeddings and textual representations, we introduce a hierarchical semantic alignment loss L align that pulls each label embedding toward its Top-k key evidence in the representation space while pushing it away from irrelevant nodes. Meanwhile, we must avoid semantic collapse in which embeddings of hierarchical labels—especially parent–child pairs—become overly similar. To this end, during training, we also introduce a hierarchical semantic alignment loss and a hierarchical separation loss (the orange module labeled “Align & Sep” in Figure 2, enabled only during training) to strengthen the alignment between the representations of the label and the evidence while preserving the hierarchical discriminability of the label embeddings.
First, the semantic alignment loss L align is designed to pull the correct label and its evidence fragments closer together in the representation space while pushing the label representation away from irrelevant text units. Specifically, for a ground truth label y at level l, let H y , l + be its Top-k evidence set with corresponding evidence vectors { h i : i H y , l + } ; meanwhile, a set of negative examples H y , l is sampled from the non-evidence nodes (consisting of vectors of unrelated text units). We adopt a weighted contrastive objective to realize semantic alignment, which is formally equivalent to a variant of the InfoNCE loss:
L align ( l , y ) = i H y , l + w i , y ( l ) log exp ( sim ( v y ( l ) , h i ) / τ ) exp ( sim ( v y ( l ) , h i ) / τ ) + j H y , l exp ( sim ( v y ( l ) , h j ) / τ ) ,
where v y ( l ) is the d-dimensional embedding vector of label y at level l; h i and h j are the d-dimensional representation vectors of a positive evidence sample and a negative sample, respectively; sim ( · , · ) denotes a similarity function between vectors (e.g., cosine similarity); and τ is the temperature parameter (the same τ as in Equation (5). The term w i , y ( l ) is the normalized weight of the evidence text unit i with respect to the label y (see Equation (6)), used to emphasize the relative importance of different positive samples.
The above formula maximizes the similarity between the label y and each text unit in its evidence set (numerator) while minimizing the similarity to unrelated text units (denominator), thus tightly aligning the label representation with its corresponding evidence in the semantic space and pushing it away from distractors. Summing over all ground-truth labels at level l yields the alignment loss for that level L align ( l ) = y L align ( l , y ) ; further summing across levels gives the overall hierarchical alignment loss:
L ALIGN = l = 1 L L align ( l ) ,
where L is the total number of levels in the label taxonomy.
Next, the hierarchical separation loss L SEP aims to enhance the separability of the label embeddings along the hierarchy, preventing the label semantics from becoming overly similar either across different levels or within the same level. In particular, we focus on the representational separation between parent and child labels to avoid the vector representation of a child label becoming too close to that of its parent, which would cause hierarchical semantic confusion. For any parent label p and its child label c, we construct the triplet ( v c , h c + , v p ) , where the anchor is the embedding vector of the child label v c R d , the positive sample h c + R d is the evidence representation vector for the child label (approximated by averaging all evidence vectors in the child label’s Top-k evidence set H c + : h c + = 1 | H c + | i H c + h i ), and the negative sample is the embedding vector of the parent label v p R d . We first define a distance function based on cosine similarity D ( u , v ) = 1 sim ( u , v ) (range [0,2]). The separation loss for the triplet ( c , p ) is then defined as follows:
L sep ( c , p ) = max { 0 , D ( v c , h c + ) D ( v c , v p ) + γ } ,
where γ > 0 is a preset margin threshold hyperparameter.
When the embedding of the child label v c is closer to its parent embedding v p than to its own evidence representation h c + by more than γ , the loss incurs a positive penalty, which encourages the model to expand the semantic distance between the child and parent labels. Averaging over all parent–child pairs ( c , p ) P yields the overall hierarchical separation loss:
L SEP = 1 | P | ( c , p ) P L sep ( c , p ) .
The joint alignment and separation optimization enforces that the triad of label–evidence–text representations simultaneously satisfy proximity to supporting evidence and inter-level spacing within a shared space, thereby improving discriminability for few-shot and deep-level labels while preserving hierarchical consistency and enhancing interpretability and auditability.
Finally, the total loss of the model is the weighted sum of the above terms:
L = L HPT + λ n L NER + λ a L ALIGN + λ s L SEP , λ n , λ a , λ s > 0 ,
where L HPT denotes the base classification loss of HPT (including zero-bounded multilabel cross entropy, ZMLCE, and the MLM language model loss); L NER is the loss for the recognition of named entities (computed by the Global Pointer model); L ALIGN and L SEP are the semantic alignment and separation losses described above; and λ n , λ a and λ s are the corresponding weighting hyperparameters.
By jointly optimizing the four objectives—classification, entity recognition, evidence alignment, and hierarchical separation (minimized simultaneously as a weighted sum during training)—the model balances predictive performance, hierarchical consistency, and interpretability within a unified framework. This joint training strategy encourages the label, evidence, and text representations to satisfy two constraints in a shared semantic space: “each label is sufficiently close to its supporting evidence,” while “labels at different hierarchical levels maintain appropriate distances from one another.” This constraint aims to enhance the discriminability of labels at both low-resource and deep levels, preserve the rationality of hierarchical classification, and equip the model with stronger interpretability and auditability.
After training, the model first obtains per-level prediction sets from the HPT head and then enforces an ancestor-completeness constraint to ensure valid output paths:
Y ^ 1 : L = A Y ^ ( l ) l = 1 L ,
This constraint is an inference-time post hoc rule rather than a training loss, consistent with Figure 2 (“Output: Ancestor-complete Paths + Top-k Evidences per label”). Finally, for each predicted label, the system returns its Top-k evidences together with their weights to support the decision.

4. Experimental Setup

4.1. Dataset

To assess the effectiveness of the proposed method, we curated a domain-specific dataset for hierarchical risk classification in power-system accidents. The corpus is drawn from internal investigation records of the State Grid Corporation of China and publicly available compilations of accident cases, covering typical scenarios over the past decade. All documents were rigorously deidentified for data security and privacy; only human factor-relevant narratives (e.g., accident progression and cause analysis) were retained. In de-identification, personally identifiable names, units, and locations were masked with placeholders, and IDs/time-stamps unrelated to the incident timeline were removed to prevent leakage while preserving causality cues.
We preprocessed the data by unifying technical terminology, correcting common misspellings, and converting fragmented texts into paragraphs and sentences. We also performed tokenization and terminology normalization with a power-domain lexicon to ensure that professional mentions—such as equipment names and operating procedures (e.g., “drop-out fuse,” “SF6 circuit breaker”)—were accurately captured by subsequent encoders and the NER module. Concretely, we: (i) normalized domain terms and units, e.g., “SF6” → “SF6”, “220 kV/220 KV ” → “220 kV”; (ii) mapped frequent synonyms to canonical forms, e.g., “drop-out fuse/DOF” → “drop-out fuse”, “disconnect/isolating” → “disconnect switch”; (iii) standardized operation phrases, e.g., “switch on/off power” → “energize/de-energize”; (iv) harmonized punctuation and numbering for bullet-like steps common in reports. Sentence segmentation followed rule-based heuristics tailored to technical Chinese/English, preserving enumerations and time anchors (e.g., “14:35, feeder A tripped; 14:38, reclose succeeded”) so that cross-sentence evidence chains remained intact. We also ensured that there was no cross-split leakage by assigning entire reports (and any near-duplicate versions) to a single split.
Based on the HFACS framework and tailored to power-system safety codes and standards, the taxonomy adopts three hierarchical levels: 4 level-1 categories, 16 level-2 categories, and 119 fine-grained level-3 labels, spanning direct unsafe acts to supervisory and organizational influences. Table 2 lists the level 1/2 categories and the representative level 3 labels. To give a concrete sense of label semantics, a typical path might read: “Routine Violations (A2) → Inadequate Work Preparation (C1) → Lax On-site Supervision (S2),” reflecting a sequence from unsafe operation to insufficient pre-job preparation to supervisory lapses; our evaluation respects ancestor completeness for such paths.
Two senior experts—each with over ten years of experience in power-system safety management and accident investigation—performed independent annotations. For each case, they selected label paths that reflect the causal chain according to the taxonomy. A single accident typically involves multiple levels of contributing factors, including direct causes (level A or C) and higher-level managerial or organizational factors (level S and O), producing one or more “label paths.”
To ensure annotation quality, we adopted a double-blind cross-validation procedure. Two domain experts first completed annotations independently and then compared their results item by item. In the event of disagreement, they discussed the case with reference to the Electric Power Safety Code and established practices to reach consensus, and a third senior expert was invited to arbitrate cases that remained difficult to decide. To quantify the agreement of the initial independent annotations, we computed Cohen’s kappa; the resulting value indicated high reproducibility and reliability. After discussion and adjudication, we produced a reconciled and consistent annotation set to serve as the authoritative reference for model training and evaluation. Figure 3 shows an example of the original report and its annotated counterpart.

4.2. Baselines

To verify the effectiveness and generality of the proposed method, we select representative baselines spanning three mainstream families: (i) flat PLM fine-tuning (BERT), which provides a reference without hierarchical priors or evidence signals; (ii) structure-aware hierarchical modeling (HiAGM [6], HTCInfoMax [7], HiMatch [17], HGCLR [18]), representing graph encoding, mutual information regularization, text-label joint embedding and hierarchy-guided contrastive learning, respectively; and (iii) prompt-based approaches (HPT [16], HierVerb [19]), which allow for a head-to-head comparison with methods from the same prompt-based family regarding adaptation to hierarchical semantics. These choices encompass the primary branches of current HTC research and provide a clear point of comparison with our evidence-aligned, hierarchy-aware prompt tuning.
To ensure cross-model comparability and fairness, we standardize on the domain-continued pre-trained encoder BERT_electric for both the text and label sides; unify prediction in the 139-dimensional leaf label space; and enforce ancestor-completeness checks against the HFACS topology when evaluating path consistency (computing C-Micro-F1). The tokenization, maximum sequence length, and truncation policies are identical across methods. Decision thresholds are calibrated on the validation set (either a global threshold or layer-shared thresholds, whichever maximizes validation Macro-F1), preventing bias from disparate default thresholds. All models are trained with the same optimizer, learning rate schedule, early stopping criterion, and batch size. Hyperparameters (learning rate, regularization/contrastive temperature, number of graph layers/hidden size, etc.) are tuned over the same search ranges on the validation set. We run three random seeds and report the mean. For methods that consume label descriptions, we standardize the description length and provenance (Chinese label name plus a short, expert-curated glossary phrase) to avoid unfair advantages from verbose descriptions. The key hyperparameters of all baselines (for example, learning rate, regularization/temperature, number of layers of the graph, and hidden size) are tuned in the validation set within the same search ranges as ours. When the recommended defaults of the official implementations are optimal on our data, we retain them and we share the same threshold calibration, early stopping, and training schedule between methods.

4.3. Evaluation Metrics

We evaluated our results using precision, recall, and F1 scores, reporting both macro-averaged (Macro) and micro-averaged (Micro) metrics. Macro metrics weight each class equally and thus reflect performance on long-tail and minority labels; micro metrics aggregate over all decisions and capture overall accuracy. To assess hierarchical consistency under HFACS, we also report path-constrained Micro-F1 (C-Micro-F1), which counts a prediction as correct only when the label and all of its ancestors are predicted correctly. For diagnostic analysis, we also include per-level Micro-F1 (computed separately for each HFACS level) and Head/Mid/Tail Macro-F1 (classes grouped by training frequency). Decision thresholds are calibrated on the validation set and then fixed for the test set to ensure fair and reproducible comparisons.

4.4. Parameter Settings

To ensure cross-model comparability and fairness, all methods are trained under a unified protocol. We use the BERT_electric encoder, trained as a continuation on domain corpora (hidden size 768). To reserve four layers of soft prompts and prediction slots (eight ‘virtual tokens’ in total) plus the two special tokens[CLS],[SEP], the effective input length is fixed at 502 tokens. Overlong documents are handled with a sliding window of 502 tokens and a stride of 64, with segment-level scores aggregated at the sample level before applying the ancestor-completeness check and thresholding. We adopt a 2-layer heterogeneous hierarchical convolution with 4 attention heads per layer, GELU activation, LayerNorm, and residual connections within each layer, and Dropout set to 0.1.
The optimizer is AdamW [80]; the learning rate is 3 × 10 5 for the encoder parameters, and 1 × 10 4 for newly introduced parameters (e.g., prompt vectors and projection layers) with a weight decay 0.01. The schedule uses a 10% warm-up followed by linear decay. The batch size is 16; the maximum number of epochs is 30; mixed precision and gradient clipping (threshold 1.0) are enabled. The random seeds are fixed at {13,17,23}, and we report the mean over three independent runs. Early stopping is triggered if Macro-F1 validation does not improve for five consecutive epochs. The decision threshold τ is identified in the validation set by a grid search on [0.05,0.95] with a step of 0.01 (maximizing Macro-F1) and then fixed during testing. All metrics are computed in the unified 139-class leaf space, with path consistency reported as C-Micro-F1.
The joint loss is
L = L HPT + λ n L NER + λ a L ALIGN + λ s L SEP ,
where L HPT includes ZMLCE and MLM losses [16]. On the validation set, we choose λ n = 1.0 , λ a = 1.0 , λ s = 0.25 ; the InfoNCE temperature is τ = 0.07 ; the triplet margin is γ = 0.2 ; the number of evidence nodes is Top- k = 5 ; and at most, 10 entities per sample are retained for inference. We selected λ a and λ s via a small validation grid search, and the results were robust—perturbing λ n , λ a , λ s by ± 20 % changes Micro-/Macro-/C-Micro-F1 by 0.5 percentage points. These hyperparameters (except for method-specific terms) are applied uniformly to baselines to ensure a fair and reproducible comparison.
In terms of computational footprint, the parameter budget is dominated by the unchanged BERT_electric encoder; EG-HPT adds only soft-prompt vectors, a lightweight GP-NER head, and a 2-layer sentence–entity GNN, yielding a small parameter increase (≈3–5% over HPT). In wall-clock terms, the evidence branch and graph pass add a modest runtime overhead—training time per epoch is about 1.2 1.3 × that of HPT and single-report inference is 1.1 × —while enabling auditable Top-k evidences and consistent gains in Macro-F1/C-Micro-F1.

5. Experimental Results and Analysis

5.1. Overall Comparison

Table 3 summarizes Micro/Macro precision, recall, and F1 (%) in a shared encoder and evaluation setup. In general, the three methodological families exhibit stable performance stratification in our dataset. Flat fine-tuning of pre-trained language models offers a strong semantic-encoding baseline but lacks hierarchical and evidence modeling. BERT yields a Micro-F1 of 50.84% and a Macro-F1 of 45.55%, markedly lower than methods that leverage hierarchical and label priors. Structure-aware hierarchical models (HiAGM [6], HTCInfoMax [7], HiMatch [17], HGCLR [18]) converge to a higher-range Micro-F1 of 60.47–65.51% and Macro-F1 of 54.30–60.58%. Gains in macro metrics indicate that explicitly exploiting hierarchical topology and structural regularization helps cover low-frequency labels and mitigate class imbalance.
In contrast, prompt-learning methods further improve overall accuracy. With the same encoder and threshold calibration strategy, HPT achieves a Micro-/Macro-F1 of 70.47%/64.06%, and HierVerb reaches 69.07%/63.20%. Our EG-HPT achieves the best results to date, with Micro-F1 = 72.02% and Macro-F1 = 66.42%, while improving both precision and recall: Micro-Precision 74.69%, Micro-Recall 69.54%, Macro-Precision 69.82%, and Macro-Recall 63.34%. Relative to the strongest prompt baseline (HPT), EG-HPT improves Micro-F1 by +1.55 percentage points (pp) and Macro-F1 by +2.36 pp; specifically, Micro-Precision/Recall increases by +2.34 pp/+0.85 pp and Macro-Precision/Recall by +4.60 pp/+0.40 pp. Compared with the best structure-aware baseline (HTCInfoMax; Macro-F1 = 60.58%, Micro-F1 = 65.51%), EG-HPT gains +5.84 pp in Macro-F1 and +6.51 pp in Micro-F1.
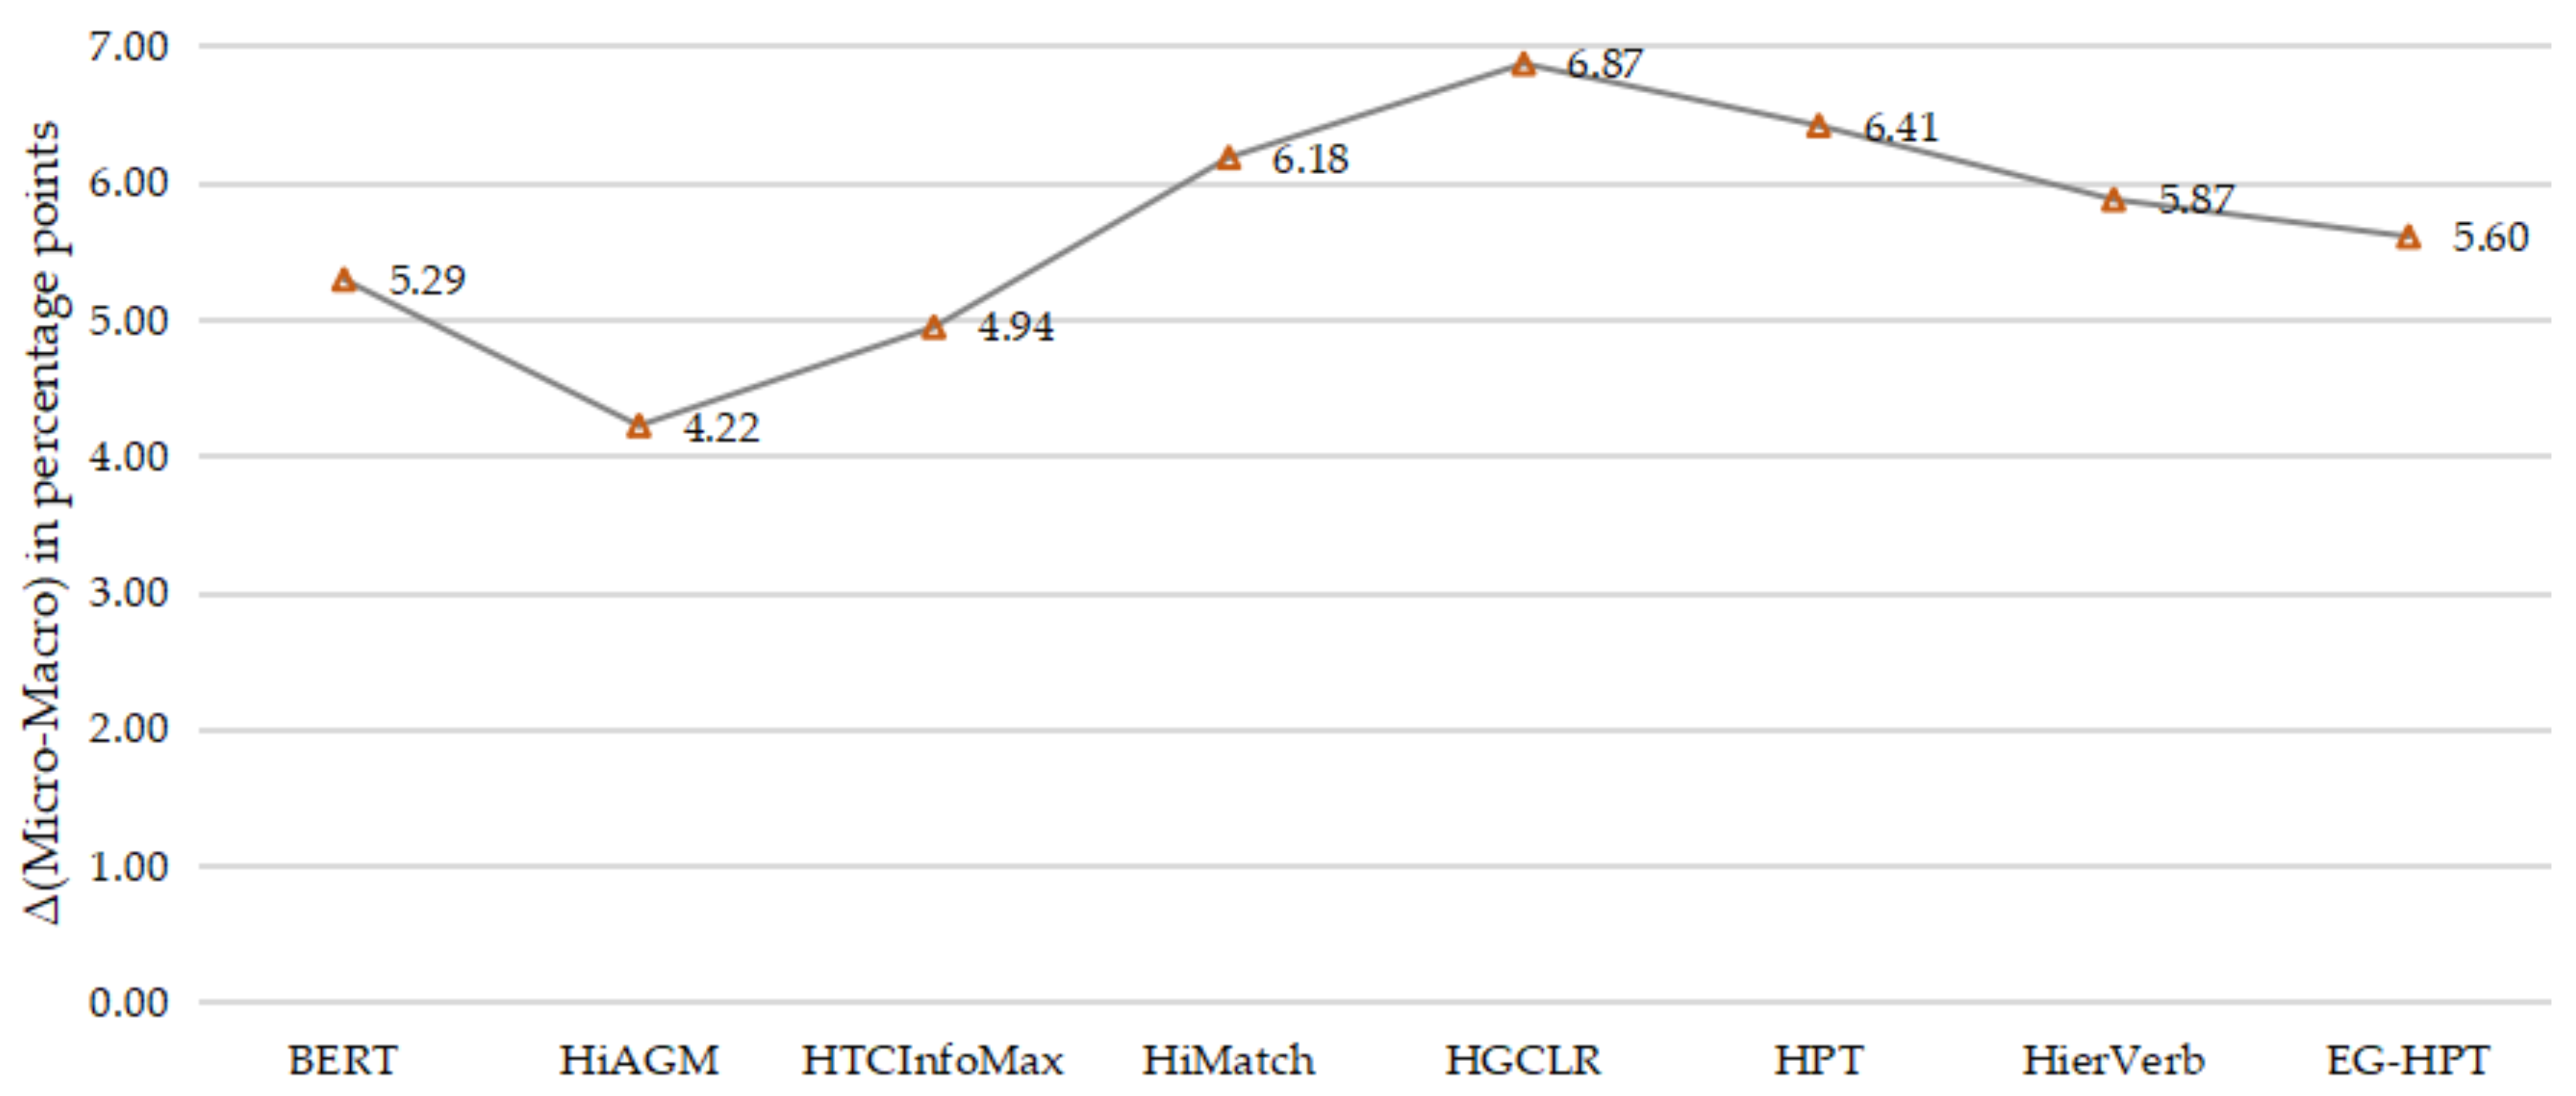
Across all models, there remains a pronounced gap between Micro-F1 and Macro-F1, reflecting the pull of high-frequency classes in sample-weighted metrics and the difficulty of recognizing rare classes (Figure 4). As Figure 4 shows, HiAGM (4.22 pp) and HTCInfoMax (4.94 pp) exhibit the smallest Micro–Macro gaps, suggesting a better class-level balance. This aligns with their design: HiAGM utilizes a hierarchy-aware structural encoder to inject hierarchical signals into text representations, while HTCInfoMax incorporates mutual information and prior regularization to mitigate representation collapse and enhance discrimination for low-frequency labels. These mechanisms preferentially lift Macro-F1 (equal class weighting), thus narrowing the Micro–Macro gap; however, their Micro-F1 remains around 65%, indicating lower sample-weighted accuracy than the prompt learning family, although with stronger robustness under long-tailed distributions.
In contrast, the prompt learning paradigm (HPT / HierVerb / EG-HPT) embeds the semantics of labels via soft prompts and achieves a higher Micro-F1 overall, but the gap Δ (Micro–Macro) tends to be larger (e.g., HPT = 6.41 pp; EG-HPT = 5.60 pp). A plausible reason is that LM priors are more sensitive to high-frequency patterns, elevating overall hit rates (Micro-F1), whereas boosting extremely low-resource labels requires additional mechanisms. Through alignment of evidence and hierarchical separation, our EG-HPT increases Macro-F1 over HPT by +2.36 pp while maintaining a higher Micro-F1 (+1.55 pp), indicating that introducing evidence at the entity level and cross-sentence aggregation alleviates the weakness of the prompt paradigm in rare labels. However, due to long-tail distributions and semantic proximity between labels, Δ remains above the smallest levels achieved by structure-aware approaches (Figure 4).

5.2. Layer-Wise Metric Analysis

To comprehensively evaluate the model’s classification capability at different hierarchical granularities, we examine layer-wise metrics. Specifically, we report Macro-F1 and Micro-F1 on three slices: L1 (top level), L2 (middle level), and L3 (fine-grained leaf level). Macro-F1 first scores each label independently and then averages them with equal weights, which suppresses the dominance of high-frequency classes and sensitively reflects the model’s balance and robustness on rare and fine-grained labels. In addition, to avoid potential bias when using Macro-F1 alone, we also report Micro-F1 on the same slices as a complementary perspective to reflect overall performance weighted by samples, as shown in Table 4.
From Table 4 we observe that all models experience performance degradation at deeper levels, showing a monotonic decline from L1 to L3 (for example, EG-HPT’s Macro-F1: 88.88 → 74.21 → 66.42; Micro-F1: 90.59 → 75.58 → 72.02), reflecting the increasing difficulty brought jointly by deeper hierarchies, finer categories, and sample sparsity. By comparing the three methodological families, the prompt-learning paradigm emerges as the overall leader across all three levels. EG-HPT achieves Macro-F1 of 88.88/74.21/66.42 and Micro-F1 of 90.59/75.58/72.02 at L1/L2/L3, respectively, all of which are the best to date; structure-aware methods fall in the middle and are markedly better than flat BERT fine-tuning, indicating that introducing hierarchical topology and structural regularization is effective for fine-grained and low-frequency labels.
In terms of the drop from coarse to fine levels (L1–L3), the prompt-learning family exhibits smaller declines. For example, EG-HPT’s Macro-F1 and Micro-F1 decrease by 22.46 pp and 18.57 pp, HPT by 23.86 pp and 19.22 pp; in contrast, structure-aware methods such as HiMatch decrease by 30.81 pp and 26.02 pp, while BERT reaches 30.63 pp and 27.59 pp. Regarding family averages, prompt learning shows mean declines of about 23.58 pp (Macro–F1) and 19.30 pp (Micro–F1), versus 26.64 pp and 22.45 pp for structure-aware methods, indicating that soft-prompt-based semantic injection, together with our entity-level evidence alignment and cross-sentence aggregation, helps curb performance loss on deep, fine-grained levels.

5.3. Long-Tail Metrics Analysis

At the leaf level of HFACS, the taxonomy spans four branches: Unsafe Acts (A: including A1 Unintentional Errors and A2 Routine Violations), Preconditions for Unsafe Acts (C: covering clusters C1–C7), Unsafe Supervision (S), and Organizational Influences (O). The labels are fine-grained and numerous, with markedly skewed frequencies, yielding a typical long-tail distribution. To examine the impact of the long-tail effect on different models, we divide the 139 leaf labels by training set frequency into three buckets: Head (top 30%), Mid (middle 40%), and Tail (bottom 30%). We then compare the average proportions per label F1 and the sample proportions across buckets; the results are shown in Table 5.
Overall, under the long-tailed distribution of our dataset, Micro-F1 exceeds Macro-F1 for all models (see Section 5.1 and Figure 4). Table 5 further shows that the Micro–Macro gap is directly related to the separability of the Tail labels. For instance, the per-label F1 scores of HiAGM and HTCInfoMax in the Tail bucket—45.29% and 45.53%, respectively—are clearly higher than those of HiMatch (39.86%) and BERT (38.41%), thereby reducing the Macro-F1 loss and narrowing the Micro–Macro gap.
Within the prompt learning family, EG-HPT improves over HPT by +3.60 pp (45.10%→48.70%), +2.96 pp (64.05%→67.01%), and +2.04 pp (81.20%→83.24%) on the Tail/Mid/Head buckets, respectively. Because Macro-F1 averages labels with equal weights, these gains—especially on Tail and Mid—are fully reflected in the Macro metric, bringing EG-HPT’s Macro-F1 to 66.42%, i.e., +2.36 pp over HPT.
To visualize how the long-tail distribution affects fine-grained classification, we plot a scatter of the training set frequency of each leaf label (log-scaled on the x-axis) versus its per-label F1 on the test set, and we fit least-squares lines for HPT and EG-HPT to compare global trends across low- to high-frequency regions; see Figure 5.

5.4. Ablation Study

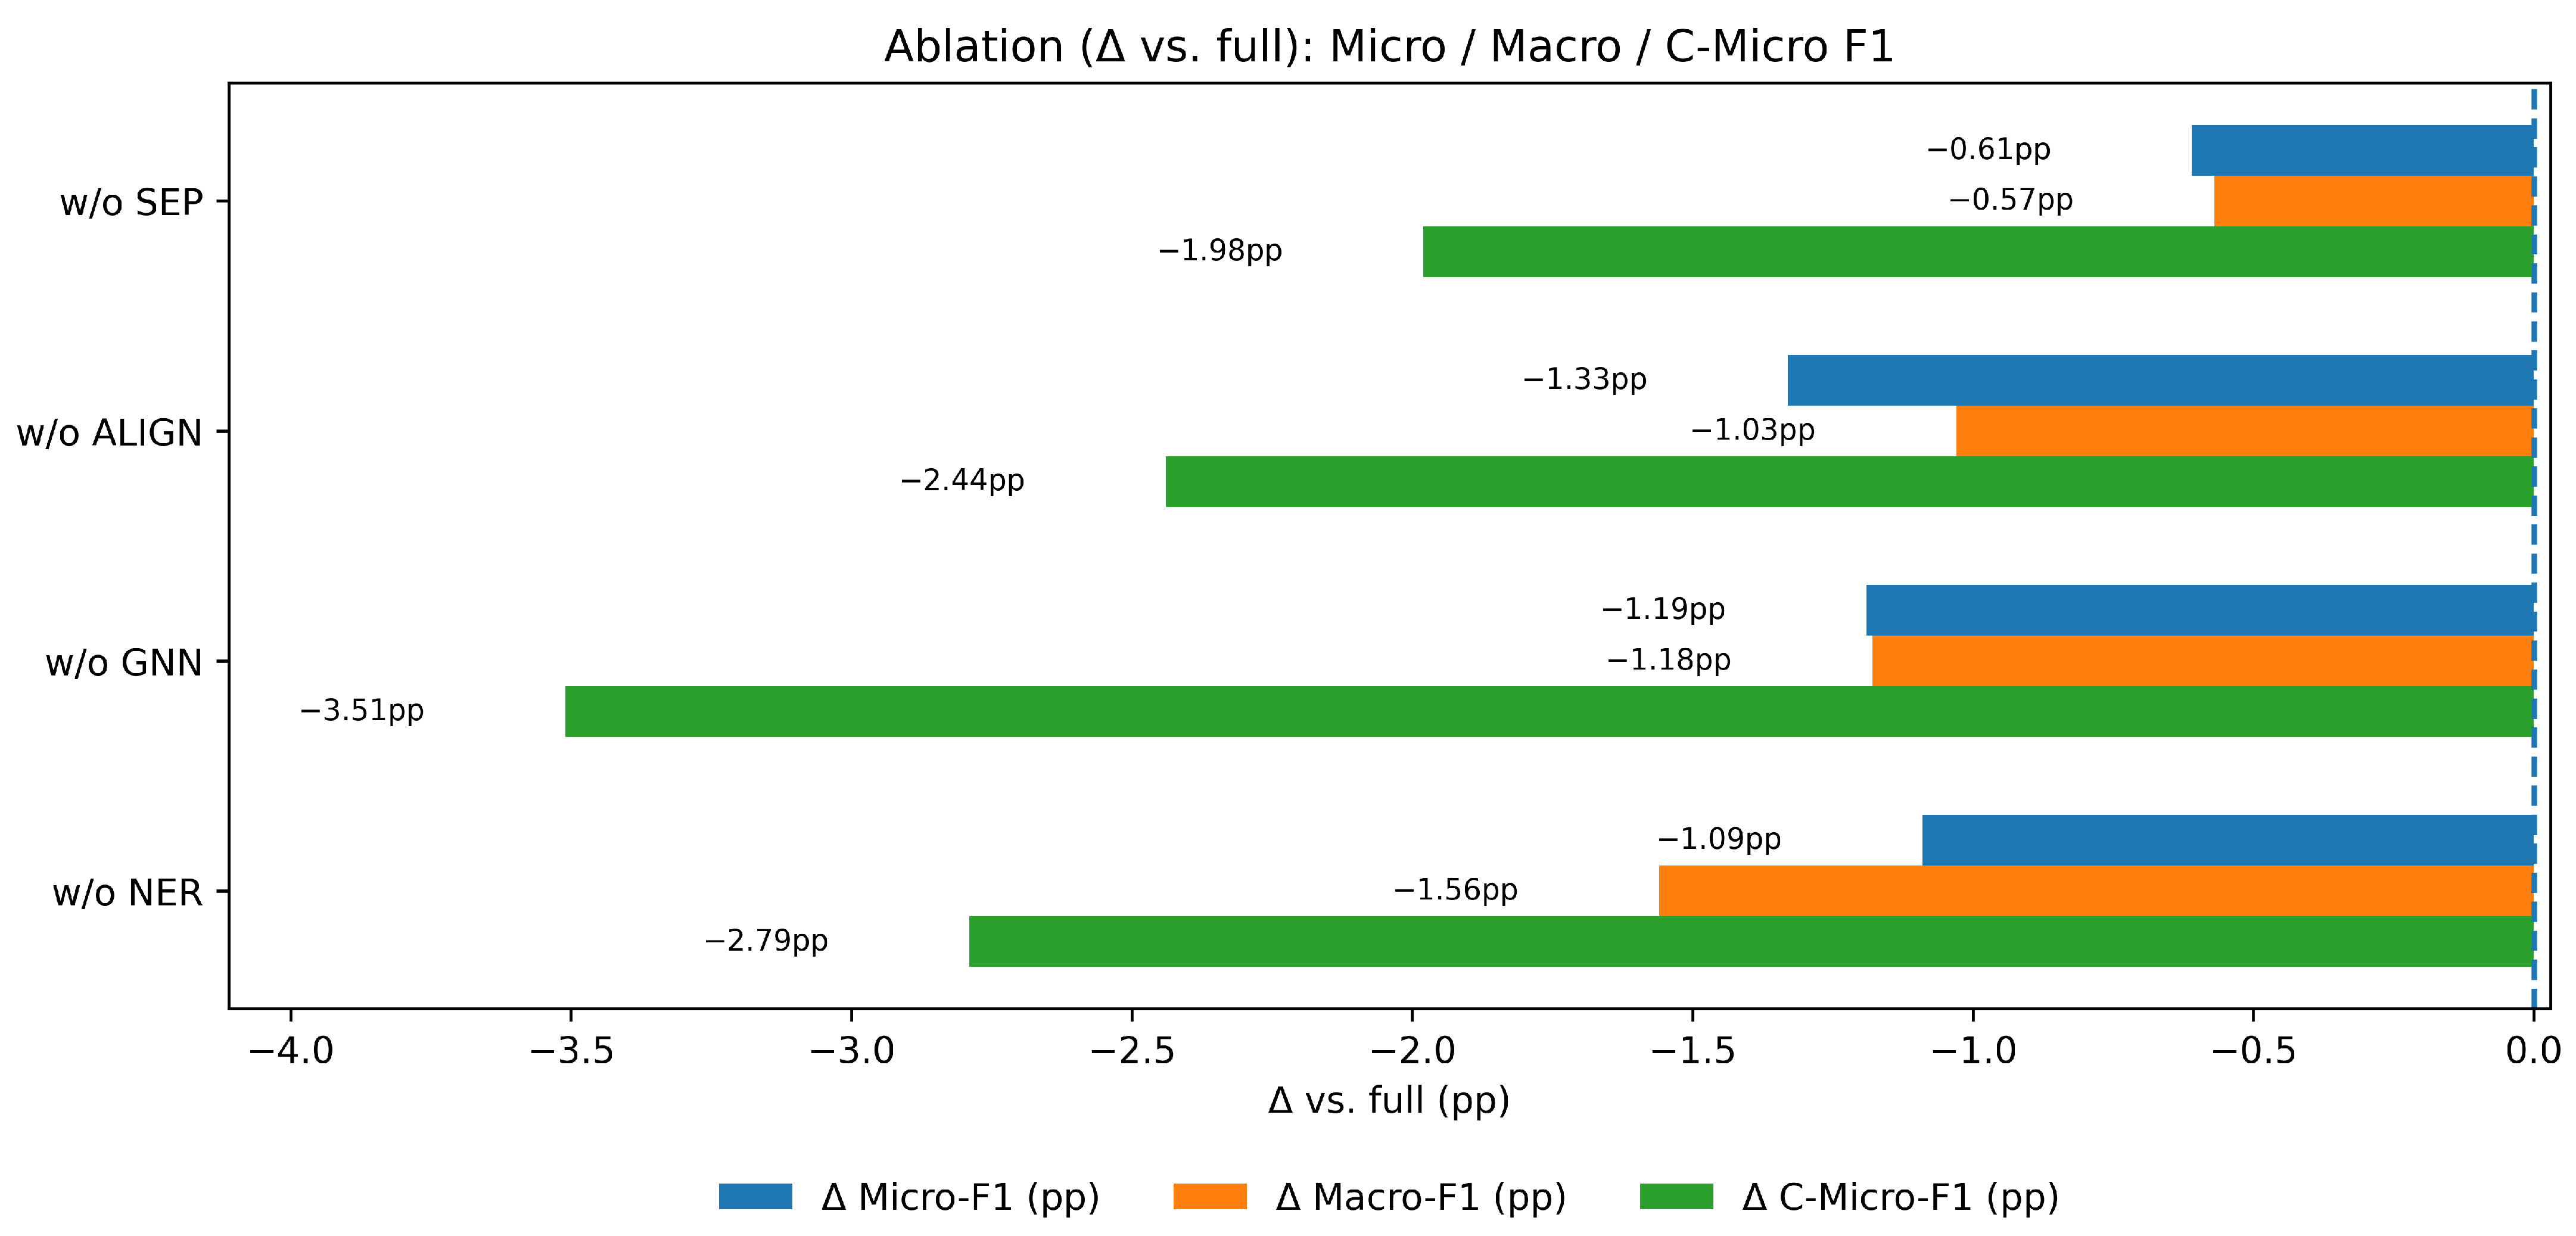
To verify the contribution of each key module, we conduct ablation experiments and compare the performance changes after selectively removing each component. Specifically, the four ablation variants correspond directly to the following subsections of this paper: (i)w/o NER removes the Global Pointer-based domain named-entity recognition described in Section 3.3; (ii) w/o GNN removes the sentence–entity heterogeneous graph with heterogeneous hierarchical convolution introduced in Section 3.4; (iii) w/o ALIGN disables the hierarchical semantic alignment loss from Section 3.6; and (iv) w/o SEP disables the hierarchical semantic separation loss from Section 3.6. Table 6 reports the quantitative results of these ablations, and Figure 6 intuitively shows the corresponding performance degradation.
As shown in Figure 6, removing NER leads to clear declines in Micro-, Macro-, and C-Micro-F1, with the path-consistency metric C-Micro-F1 dropping the most ( 2.79 pp). This shows that entity-level evidence serves as a stable anchor for consistent ancestor-descendant predictions. Without explicit exposure of key semantic units, such as equipment, components, environment, personnel, and actions, the model is more likely to produce broken label paths in which a child node is predicted but its ancestor is missing. For example, on the label ” defective protective device”, entity-level signals such as ” safety ropes” and ”fall arresters” provide the necessary evidence for correct classification.
Hierarchical semantic alignment (w/o ALIGN) and hierarchical separation (w/o SEP) are also crucial for stable deep-level predictions. Removing ALIGN reduces Micro-F1 by 1.34 pp, Macro-F1 by 1.06 pp, and C-Micro-F1 by 1.06 pp. Removing SEP leads to slightly smaller decreases: 0.61 pp, 0.58 pp, and 1.98 pp, respectively. These two losses work together to preserve hierarchical consistency. The weighted InfoNCE alignment pulls label and evidence representations closer, ensuring that ancestor and descendant labels rely on the same evidence cluster. Triplet-margin separation prevents parent–child embeddings from collapsing, reducing path inconsistencies caused by blurred hierarchical boundaries.
Figure 7 visualizes the contribution of each module in the evaluation metrics. In summary, GNN and NER enhance the visibility of evidence and information aggregation across sentences, while ALIGN and SEP enforce hierarchical consistency and refine decision boundaries. Together, the four components form a complementary system that supports the robustness of the full model.
Overall, the four modules complement each other to ensure both accuracy and interpretability. The GNN has the strongest impact, providing essential cross-sentence aggregation that links dispersed evidence and yields the largest gains in C-Micro-F1. NER follows, supplying explicit entity evidence that improves recall and stabilizes hierarchical paths. ALIGN contributes by anchoring label and evidence representations, further reinforcing ancestor–descendant consistency, while SEP enhances path consistency and hierarchical separability by preventing parent–child embedding collapse. Together, these components transform hierarchical priors into an auditable evidence chain, achieving higher recall and more reliable ancestor completeness for deep, fine-grained labels under long-tailed conditions.

5.5. Interpretability Analysis

To rigorously verify the interpretability of EG-HPT, we analyze a real case—WN Power Supply Bureau “9·17” Fatal Electrocution Accident. We focus on the Cause of Accident section (three paragraphs, seven sentences; Table A1 in Appendix A) and use it as the model input. The model outputs domain entities such as equipment components, operating actions, and environmental conditions through GP-NER (Section 3.3). Detailed definitions of entity types are provided in Table 1, while representative examples of extracted entities, along with their codes and types, are provided in Table A2 in Appendix A.
Table A3 (Appendix A) presents the predicted labels together with model confidence and representative evidence snippets. The model produces 14 fine-grained HFACS labels with confidence scores ranging from 81.36% (C510 Unsafe position) to 92.06% (C205 Lack of or defective protective devices). For each label, the top three supporting text fragments are shown with alignment weights (e.g., 0.20 for the most salient phrase). These numbers quantify the model’s belief and the strength of text–label connections, providing an explicit machine-auditable basis for expert review.
For example: - A201 Working without a permit is predicted with 91.82% confidence, supported by S1 statements such as “no application procedures for change/alteration completed” (alignment weight 0.19) and “unauthorized assignment of employees” (0.17). - C205 Lack of or defective protective devices attains 92.06% confidence, with strong evidence from S5 describing that the “ground-fault automatic tripping function was not put into service” (0.18) and the “switch could not be automatically tripped” (0.15). - O303 Incomplete enforcement of the two-ticket system is supported by “No application procedures for change and alteration completed” in S1 (0.20).
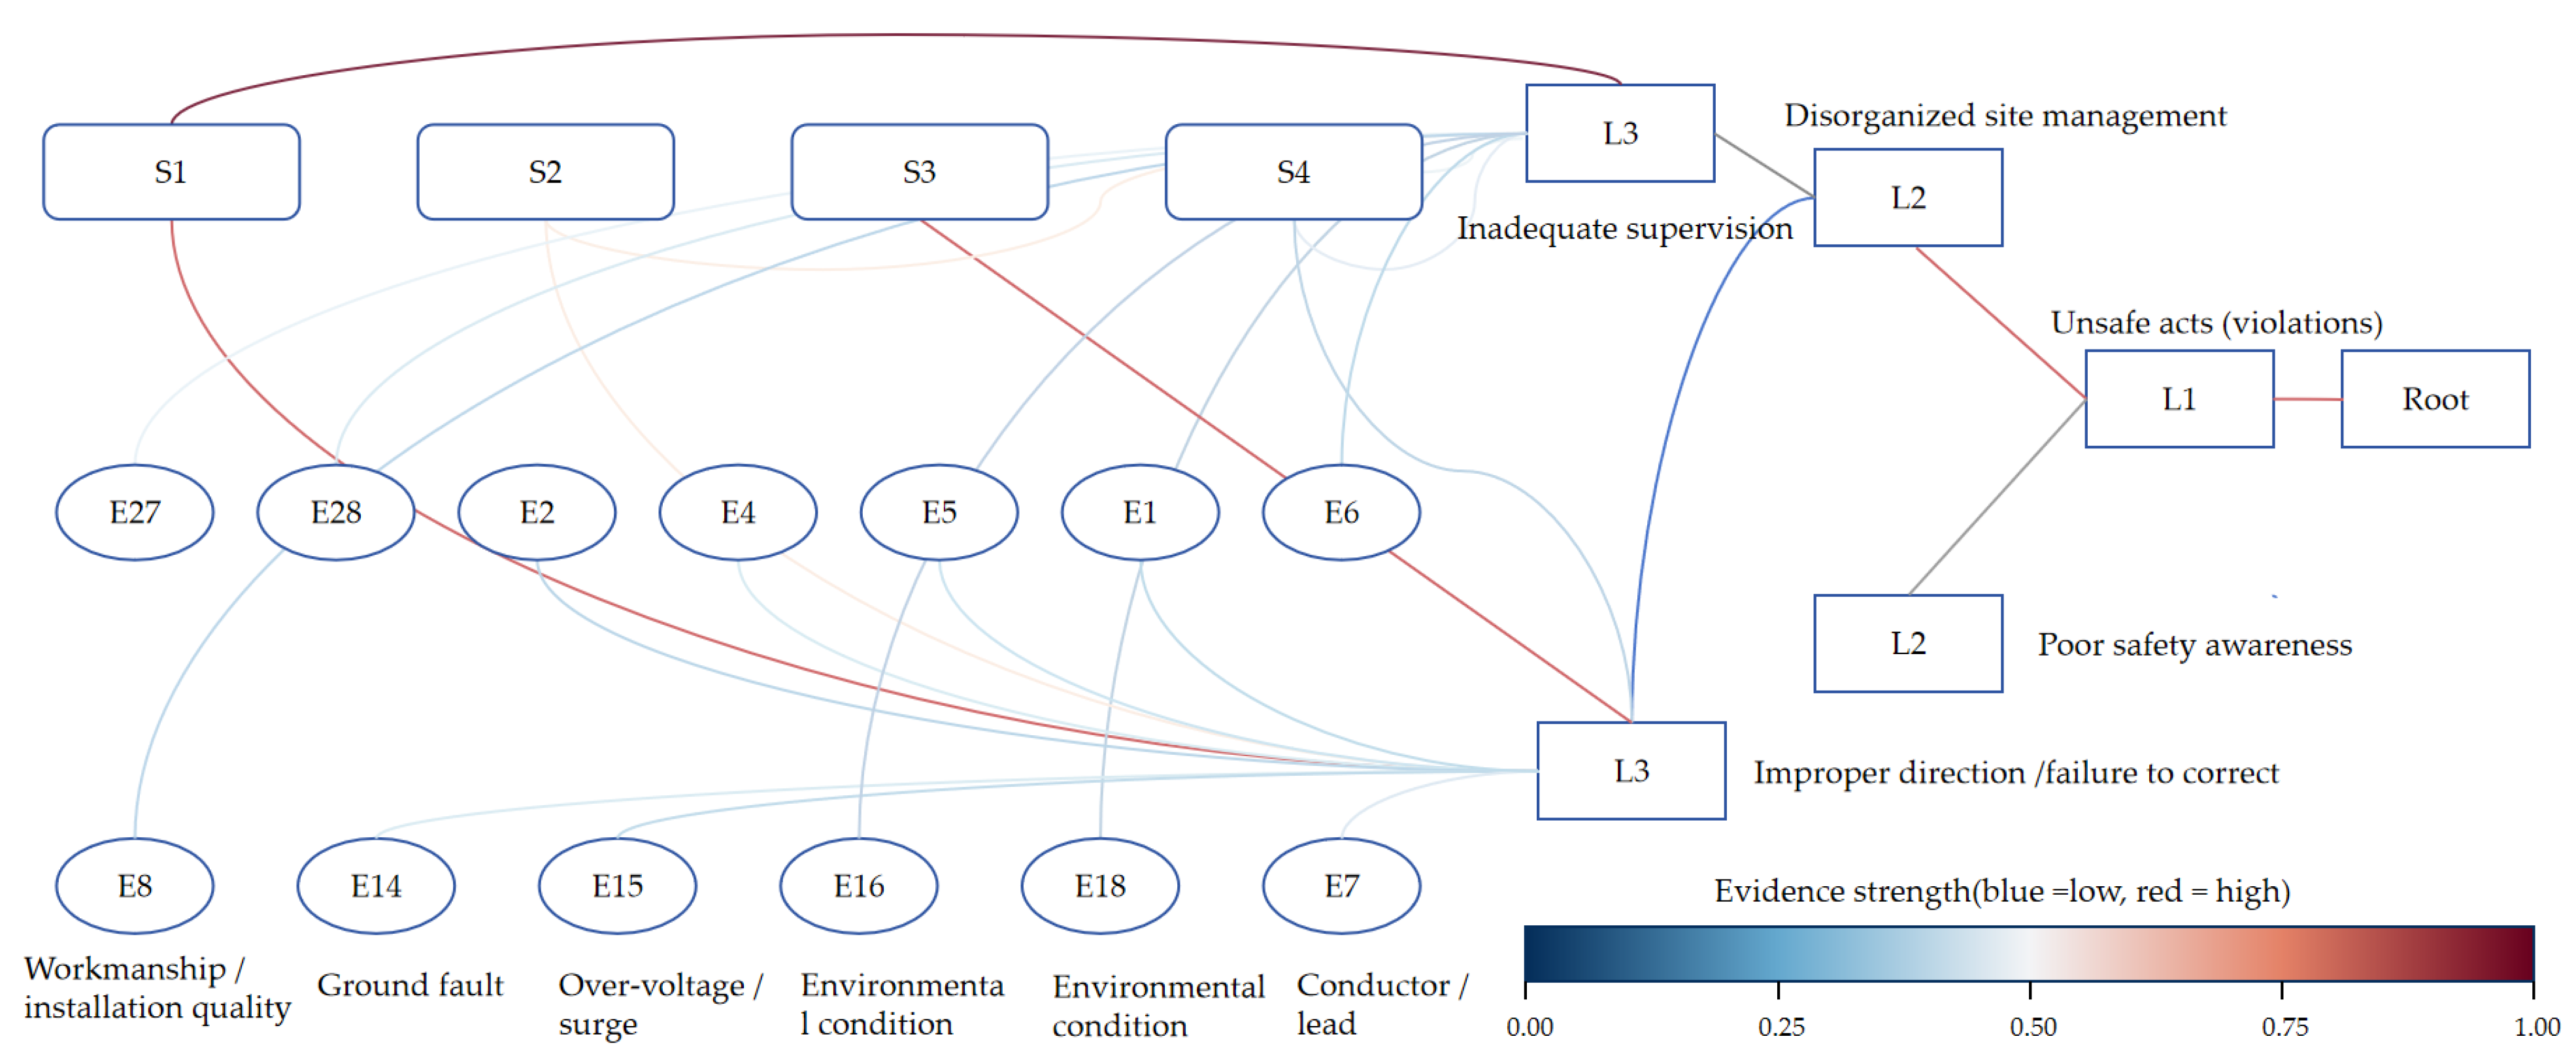
Figure 8 visualizes how the sentence and entity nodes connect to the predicted labels. Edges are colored and weighted to reflect alignment strength, allowing experts to trace how each label is grounded in specific text and entity mentions. The gray structural bands from leaf to ancestor illustrate that predicted leaf nodes and their ancestor labels form topologically consistent paths, ensuring that the evidence chain respects the HFACS hierarchy.
Overall, this case study shows that EG-HPT does more than output hierarchical risk labels: it attaches confidence scores and fine-grained alignment weights to concrete text spans and domain entities, achieving both qualitative transparency and quantitative evidence–label consistency. These properties enable experts to rapidly audit and validate the causal reasoning that underlies the model’s decisions.

6. Discussion

This study focuses on hierarchical risk identification in electric power accident reports, a setting characterized by long documents, cross-sentence dependencies, dense technical terminology, and simultaneous requirements for hierarchical consistency and interpretability. We proposed the EG-HPT framework and observed stable gains in practice. Although the absolute scores are moderate—reflecting the difficulty of long documents, deep hierarchies, and long-tail label imbalance—EG-HPT consistently surpasses strong HTC baselines (HPT [16], HiMatch [17], HGCLR [18]) on Micro-/Macro-F1 and path-constrained C-Micro-F1 while uniquely providing auditable per-label Top-k evidences, thereby demonstrating clear advancement over prior literature under realistic, safety-critical conditions. The discussion below addresses the sources of improvement, relationships and differences with mainstream approaches, robustness, and applicability, as well as limitations and prospects.
From a mechanistic perspective, performance gains can be traced to three complementary components. First, the introduction of GP-based NER explicitly exposes key semantic units—equipment/components, operational actions, personnel, and environmental factors—during encoding, rather than relying on implicit attention to ’guess’ evidence. Compared with token- or phrase-level soft attention, entity-anchored evidence is more stable under sparse or cross-sentence dispersion, which directly improves recall on low-frequency fine-grained labels and lifts Macro-F1. Second, the sentence–entity heterogeneous graph mitigates the decay of cross-sentence dependencies in long texts. Entities serve as shared nodes across sentences, and multihop aggregation fuses fragments such as ‘device name–operation–environmental constraint’ into coherent semantic clusters. This encourages ancestors and descendants to reach consistent decisions on the same evidence set and is reflected in higher path-constrained Micro-F1 (C-Micro-F1). Third, layered semantic alignment and hierarchical separation loss act in tandem on the output side: the former pulls ‘label vectors–evidence nodes’ together through weighted contrastive learning, narrowing the semantic gap between text and labels; the latter enforces triplet margins to prevent parent–child embedding collapse, sharpening deep-level decision boundaries and reducing inconsistencies where a child is predicted but its ancestors are missed. Ablation confirms that removing NER, the graph module, or the alignment/separation terms causes notable degradation; the drop is largest without the graph, underscoring that cross-sentence evidence aggregation is essential. Removing the alignment/separation terms primarily harms fine-grained recall and path consistency.
Positioning EG-HPT against three mainstream lines further clarifies its value. Flat PLM fine-tuning (BERT) offers strong semantic encoding but lacks structural and evidential constraints; it underperforms overall on this dataset and is more sensitive to the long tail. Structure-aware hierarchical modeling (for example, HiAGM [6], HTCInfoMax [7], Hi-Match [17], HGCLR [18]) injects topology, mutual information regularization, or graph-style matching, thus improving Macro-F1 and narrowing the Micro–Macro gap, but it still falls short on explicit cross-sentence aggregation and alignment of ’label evidence’. Prompt-based methods (HPT [16], HierVerb [19]) sit closer to the PLM pretraining space and thus lead in overall accuracy, but their boosts in fine granularity and path consistency are constrained by the lack of explicit evidence modeling. EG-HPT couples prompt tuning with ’entity evidence + graph aggregation + alignment / separation’, retaining the strength of the prompt paradigm while addressing its evidential and cross-sentence shortcomings, resulting in concurrent improvements in Micro-F1, Macro-F1, and C-Micro-F1. In particular, structure-aware models such as HiAGM [6] and HTCInfoMax [7] exhibit smaller Micro–Macro gaps in our data, consistent with their explicit topology modeling that benefits low-frequency labels. Prompt methods primarily lead to Micro-F1 (sample-weighted accuracy), indicating a better fit for frequent/leading classes. The results with EG-HPT show that, once prompt tuning is combined with evidence alignment and hierarchical constraints, macro-level performance and path consistency rise together rather than trading off. In addition, Cai et al. [81] recently proposed NERHTC, a hierarchical NER-guided prompt-tuning framework whose technical focus is related to ours but differs in essential mechanisms. For single-path HTC, NERHTC formulates prediction as sequence labeling and uses a CRF to enforce adjacency and path consistency across hierarchy levels; for multi-path HTC, it casts prediction as span detection with a Global Pointer to capture local hierarchical dependencies and further adopts a GAT over the label graph to learn global structural representations. Compared with EG-HPT, NERHTC emphasizes structural encoding of the output space through CRF/GP and the label side GAT, while EG-HPT operates in the input space by introducing GP-NER and a heterogeneous sentence–entity graph to aggregate cross-sentence evidence, together with weighted alignment and hierarchical separation losses to ensure path consistency while providing auditable label–evidence alignment.
Robustness and applicability analyses provide converging evidence. Layer-wise metrics and long-tail slicing both yield substantially higher scores at L1 than at L3, an expected outcome resulting from the coarser granularity, larger sample sizes, and weaker semantic confusability at higher levels. EG-HPT delivers larger per-label F1 gains in the Tail and Mid buckets than in the Head bucket, indicating that entity anchoring and cross-sentence aggregation are particularly effective for rare labels. Threshold-sensitivity experiments show that C-Micro-F1 varies the least when the global threshold lies between 0.35 and 0.55; within this range, the EG-HPT curve consistently dominates the baselines, suggesting robust threshold improvements in the consistency of the path. Case-level visualizations further confirm that each predicted label can be traced back to specific sentences or entities, meeting the “auditable result” requirement in power-safety review; at the same time, these alignments express association rather than causality and should be used in conjunction with expert judgment.
These reports are long, contain dense technical terminology, and involve an HFACS taxonomy with 119 highly imbalanced, fine-grained categories, which naturally impose a ceiling on achievable scores. Additionally, several limitations further complicate the task. The amount of domain-specific NER annotation is limited, and while GP captures nested entities well, novel device names or colloquial expressions may still be missed or misidentified, which can degrade downstream alignment. To ensure a fair comparison between methods, the inputs were truncated to a uniform effective length, which can result in the loss of distant evidence in very long reports—a limitation that could be alleviated by long-sequence encoders or retrieval-augmented mechanisms. Furthermore, the weights for alignment and hierarchical separation are tuned in a validation set and currently lack adaptive scheduling; the evidence weights quantify the strength of support but should not be interpreted as direct causal contributions. Finally, certain fine-grained HFACS definitions vary between utilities or regions, and transferring the model to other industries or languages would require light domain adaptation and prompt reconstruction. Despite these challenges, EG-HPT sets a new benchmark by combining competitive accuracy with evidence-level interpretability, an essential advancement for deployment in safety-critical domains.
While EG-HPT demonstrates promising performance in hierarchical accident analysis, several limitations remain. First, although the framework is designed to be generalizable, its effectiveness across other domains and languages has not yet been fully validated. Future work should investigate domain adaptation and transfer learning strategies. Second, real-world deployment in safety-critical industries presents practical challenges, including noisy or incomplete reports, integration with existing risk management systems, and the need for interpretable outputs to support expert decision-making. Finally, the computational costs of entity recognition, graph construction, and prompt tuning can hinder large-scale or real-time applications, suggesting that model efficiency and optimization should be key directions for future research.

7. Conclusions

This paper addresses the challenge of hierarchical cause identification in power-incident investigation reports by proposing EG-HPT (Evidence-Grounded, Hierarchy-Aware Prompt Tuning), a framework that unifies performance and interpretability while preserving hierarchical consistency. Built on hierarchy-aware prompt tuning, the method introduces GP-based domain NER to make key semantic units—equipment, personnel, environment, and operations—explicit; employs a sentence–entity heterogeneous graph to mitigate cross-sentence dependency decay in long texts; and constrains label representations on the output side via weighted contrastive hierarchical alignment and a hierarchical separation loss, thereby improving fine-grained discrimination and path consistency simultaneously.
On a real-world HFACS-based corpus with four levels and fine-grained labels, EG-HPT delivers consistent gains over both flat PLM fine-tuning and structure-aware hierarchical modeling and further improves upon prompt-based peers. Overall results show that EG-HPT surpasses strong baselines in Micro-F1, Macro-F1, and path-constrained C-Micro-F1; layer-wise and long-tail analyses indicate that its advantages are more pronounced at L2/L3 and for low-frequency labels, confirming the contribution of entity anchoring and cross-sentence aggregation to Tail-class recall. Ablation studies quantify the role of each component: removing NER, the heterogeneous graph, or alignment/separation constraints degrades both performance and hierarchical consistency, with cross-sentence graph reasoning contributing the largest share of the overall gain. Case visualizations further demonstrate that the model provides source-identifiable sentence- or entity-level evidence for each predicted label, meeting engineering audit requirements for traceability and verifiability.
In general, EG-HPT achieves strong performance and interpretability while preserving hierarchical consistency, providing a reusable technical baseline for automated evidence-based analysis of power domain safety. Beyond this domain, the framework also holds transfer potential to other high-risk sectors such as railways, aviation, and healthcare, where accident reports are similarly organized hierarchically and contain long technical narratives with causal factors distributed across multiple levels of organizational responsibility. By combining domain-specific entity recognition, sentence-level evidence aggregation, and path-consistent prediction, the evidence-grounded hierarchical classification paradigm can therefore support broader accident causation analysis and risk management. Future work will extend EG-HPT to such domains, enabling comparative evaluation and domain adaptation studies that further demonstrate its generalizability.

Author Contributions

Conceptualization, W.Z. and W.T.; methodology, W.Z. and W.T.; software, W.Z. and B.Z.; validation, D.Y., N.X. and H.Z.; formal analysis, N.X. and H.Z.; investigation, W.Z. and N.X.; resources, W.T. and D.Y.; data curation, W.Z. and B.Z.; writing—original draft preparation, W.Z. and W.T.; writing—review and editing, W.Z., W.T. and B.Z.; visualization, W.Z., B.Z. and N.X.; supervision, W.T. and D.Y.; project administration, W.T. and D.Y.; funding acquisition, W.T., D.Y. and H.Z. All authors have read and agreed to the published version of the manuscript.

Funding

This research was funded by Shenzhen Science and Technology Program, grant number KCXFZ20230731093902005.

Data Availability Statement

The dataset used in this study can be made available by the corresponding author upon reasonable request.

Acknowledgments

We would like to thank the anonymous reviewers for their valuable feedback and helpful suggestions, which have greatly improved the quality of this manuscript. Special thanks to the City Safety Risk Monitoring and Early Warning Emergency Management Key Laboratory at the Shenzhen City Public Safety Technology Research Institute for their technical support and for providing the necessary resources to conduct this research.

Conflicts of Interest

Authors Wenhua Zeng and Hui Zhang were employed by the company Shenzhen Urban Public Safety and Technology Institute. The remaining authors declare that the research was conducted in the absence of any commercial or financial relationships that could be construed as a potential conflict of interest.

Abbreviations

The following abbreviations are used in this manuscript:
HFACSHuman Factors Analysis and Classification System
NERNamed Entity Recognition
EG-HPTEvidence-Grounded Hierarchy-Aware Prompt Tuning
HPTHierarchy-Aware Prompt Tuning
HTCHierarchical Text Classification
HMTCHierarchical Multi-Label Text Classification
PLMPre-trained Language Model
BERTBidirectional Encoder Representations from Transformers
GPGlobal Pointer
GNNGraph Neural Network
HHCHeterogeneous Hierarchical Convolution
HiAGMHierarchy-Aware Global Model
HTCInfoMaxHierarchical Text Classification with InfoMax
HiMatchHierarchical Matching
HGCLRHierarchy-Guided Contrastive Learning for HTC
HierVerbHierarchical Verbalizer
MLMMasked Language Modeling
ZMLCEZero-Margin Multi-Label Cross-Entropy
C-Micro-F1Path-Constrained Micro-F1
ppPercentage Points

Appendix A

This appendix contains the full text of the case titled ”WN Power Supply Bureau ‘9·17’ Fatal Accident”. On 17 September 2014, during emergency repair and power restoration in Typhoon ‘Seagulls’, the WN Power Supply Bureau experienced a general accident in which an employee of the power supply office was electrocuted, resulting in one fatality; the type of accident was electrocution. The interpretability analysis in Section 5.5 of this paper selects only the relevant paragraphs from the ‘Cause Analysis’ part of this case as input to the model and as examples of evidence alignment; the other sections (such as overview of the accident, course of events, and handling recommendations) are not included in the experiments and discussion of this section. Table A1 provides WN Power Supply Bureau ‘9·17’ Fatal Accident (partial). Table A2 provides the entity codes and types extracted in GP_NER.
Table A1. Accident report (partial).
ParagraphSentenceContents
1S1Without completing the application procedures for distribution-equipment change and alteration, the WN Power Supply Office arranged employees to install a “three-no” sectionalizing switch on pole #12 of the 10 kV RYW line.
1S2At the post insulator on pole #12 of the 10 kV RYW line, the B-phase lead was wrapped with bare aluminum wire, and the tying was non-standard.
1S3When H closed that sectionalizing switch, an A-phase ground occurred at the high-voltage metering box of the dedicated-transformer user at pole No. 02 on the XGLL branch near pole #154, causing the B- and C-phase voltages to ground to rise.
2S4During the typhoon on the 16th, the area experienced heavy rainfall, and the surfaces of the insulators had high moisture.
2S5Intermittent arcing occurred at the tying point of the B-phase lead on the post insulator at pole #12; the ground-fault automatic tripping function was not put into service, and the switch could not trip automatically during a line fault.
3S6Current conducted through the damp pole into the earth, producing an electric-field distribution around the pole.
3S7After the operator was startled and fell accidentally, multiple parts of the body—legs, back, etc.—made contact with the ground, resulting in step-voltage electric shock and ultimately causing casualties.
Table A2. Entity codes and types extracted by GP_NER.
EntityEntity TypeEntity TextSent.Para.
E0ORG_UTILITYWN Power Supply BureauS11
E27PROC_PERMITno application procedures for change/alteration completedS11
E28ACT_UNAUTHunauthorized assignment of employeesS11
E2ELEC_VLEVEL10kVS11
E3ASSET_LINERYW lineS11
E29ASSET_POLEpole #12S11
E5QUAL_UNCERT“three-no”S11
E4EQU_SWITCHsectionalizing switchS11
E2ELEC_VLEVEL10kVS21
E3ASSET_LINERYW lineS21
E1LOC_PHASEDpole #12 B-phaseS21
E7COMP_CONDUCTORleadS21
E6COMP_INSULATORpost insulatorS21
E7COMP_CONDUCTORbare aluminum wireS21
E8PROC_QUALITYnon-standard tyingS21
E9PERSON_NAMEHuS31
E4EQU_SWITCHsectionalizing switchS31
E10ASSET_POLEpole #154S31
E11ASSET_BRANCHXGLL branchS31
E12ASSET_POLEpole No. 02S31
E13EQU_METER_BOXhigh-voltage metering box of a dedicated-transformerS31
E14FAULT_GROUNDA-phase groundS31
E15FAULT_OVERVOLTB- and C-phase voltage-to-ground riseS31
E16ENV_CONDtyphoonS42
E17ENV_CONDheavy rainfallS42
E6COMP_INSULATORinsulator surfaceS42
E18ENV_CONDhigh moistureS42
E1LOC_PHASEDpole #12 B-phaseS52
E7COMP_CONDUCTORleadS52
E6COMP_INSULATORpost insulatorS52
E8PROC_QUALITYtying pointS52
E19FAULT_ARCintermittent arcingS52
E20PROT_STATUSground-fault protection function not put into serviceS52
E21PROT_TRIP_FAILunable to trip automaticallyS52
E22ASSET_POLE_CONDdamp poleS63
E22ASSET_POLE_CONDaround the poleS63
E23ENV_EFIELDelectric-field distributionS63
E24PERSON_ROLEoperatorS73
E25HAZ_STEPVstep-voltage electric shockS73
E26OUTCOME_INJURYcasualtiesS73
Table A3. Predicted label paths and evidence snippets.
Predicted LabelConfidence (%)Main Evidence Snippets (Top-3, Alignment Weight)
A201 Working without a permit91.82“No application procedures for change and alteration completed” (S1, 0.19); “Unauthorized assignment of employees to install a ‘three-no’ sectionalizing switch” (S1, 0.17); “Operating near live equipment” (S3/S5, 0.10)
A214 Violation of operating procedures89.64“When the sectionalizing switch was closed … A-phase grounding” (S3, 0.16); “Ground-fault automatic tripping function not put into service” (S5, 0.13); “Unable to trip automatically” (S5, 0.11)
A101 Unauthorized operation84.27“Closing the sectionalizing switch” (S3, 0.14); “Unauthorized assignment of personnel to work” (S1, 0.12); “Commissioning of a ‘three-no’ sectionalizing switch” (S1, 0.10)
C205 Lack of or defective protective devices92.06“Ground-fault automatic tripping function not put into service” (S5, 0.18); “Switch unable to trip automatically in the event of a fault” (S5, 0.15); “Inadequate on-site equipment inspection (corroborating evidence)” (S2, 0.12)
C206 Inadequate on-site equipment inspection88.73“Bare aluminum wire wrapping; non-standard tying” (S2, 0.19); “Process at the post insulator not up to standard” (S2, 0.12)
C601 Abnormal weather87.58“Typhoon period … heavy rainfall” (S4, 0.16); “High moisture on insulator surfaces” (S4, 0.14); “Electric-field distribution around a damp pole” (S6, 0.11)
C606 Noise/unsuitable temperature and humidity83.41“High humidity/dampness” (S4/S6, 0.15); “Harsh environmental conditions” (S4–S6, 0.09)
C510 Unsafe position81.36“Startled accidental fall … multiple points of the body contacting the ground” (S7, 0.14); “Step-voltage electric shock” (S7, 0.12)
S206 Illegal work orders86.92“(Without completing procedures) unauthorized assignment of personnel to work” (S1, 0.17); “Closing the sectionalizing switch” (S3, 0.13)
S201 Inadequate supervision of operating personnel84.10“Failure to promptly correct non-standard tying” (S2, 0.12); “On-site safety measures inadequate (corroborated by protection not put into service)” (S5, 0.11)
S401 Failure to effectively stop violations82.27“A ‘three-no’ device entered and was put into operation” (S1, 0.15); “Violations were not stopped” (S1/S3, 0.10)
O303 Incomplete enforcement of the two-ticket system88.95“No application procedures for change and alteration completed” (S1, 0.20); “Work/energization without approval” (S1, 0.16)
O302 Lax approval of work plans86.48“Lax work-plan approval (corroborated by no permit and ‘three-no’ device)” (S1, 0.17); “Gaps in dispatch management (failure to implement protection configuration)” (S5, 0.12)
O301 Lax equipment operation and maintenance management85.06“Ground-fault automatic tripping not put into service” (S5, 0.16); “Unable to trip automatically in the event of a fault” (S5, 0.13)

References

  1. National Energy Administration. 2025. Available online: https://www.nea.gov.cn/ (accessed on 18 August 2025).
  2. Xu, N.; Ma, L.; Liu, Q.; Wang, L.; Deng, Y. An improved text mining approach to extract safety risk factors from construction accident reports. Saf. Sci. 2021, 138, 105216. [Google Scholar] [CrossRef]
  3. Silla, C.N.; Freitas, A.A. A Survey of Hierarchical Classification across Different Application Domains. Data Min. Knowl. Discov. 2011, 22, 31–72. [Google Scholar] [CrossRef]
  4. Zhang, Y.; Shen, Z.; Dong, Y.; Wang, K.; Han, J. MATCH: Metadata-Aware Text Classification in a Large Hierarchy. In Proceedings of the Web Conference, Ljubljana, Slovenia, 19–23 April 2021; pp. 3246–3257. [Google Scholar] [CrossRef]
  5. Zangari, A.; Marcuzzo, M.; Rizzo, M.; Giudice, L.; Albarelli, A.; Gasparetto, A. Hierarchical Text Classification and Its Foundations: A Review of Current Research. Electronics 2024, 13, 1199. [Google Scholar] [CrossRef]
  6. Zhou, J.; Ma, C.; Long, D.; Xu, G.; Ding, N.; Zhang, H.; Xie, P.; Liu, G. Hierarchy-Aware Global Model for Hierarchical Text Classification. In Proceedings of the 58th Annual Meeting of the Association for Computational Linguistics, Online, 5–10 July 2020; pp. 1106–1117. [Google Scholar] [CrossRef]
  7. Deng, Z.; Peng, H.; He, D.; Li, J.; Yu, P.S. HTCInfoMax: A global model for hierarchical text classification via information maximization. arXiv 2021, arXiv:2104.05220. [Google Scholar] [CrossRef]
  8. Lewis, D.D.; Yang, Y.; Rose, T.G.; Li, F. RCV1: A New Benchmark Collection for Text Categorization Research. J. Mach. Learn. Res. 2004, 5, 361–397. [Google Scholar]
  9. Gui, Y.; Gao, Z.; Li, R.; Yang, X. Hierarchical Text Classification for News Articles Based on Named Entities. In Proceedings of the Advanced Data Mining and Applications, Nanjing, China, 15–18 December 2012; Lecture Notes in Computer Science. Volume 7713, pp. 318–329. [Google Scholar] [CrossRef]
  10. Sandhaus, E. The New York Times Annotated Corpus, V1. Abacus Data Network: 2008. Available online: https://hdl.handle.net/11272.1/AB2/GZC6PL (accessed on 18 August 2025).
  11. Kowsari, K.; Brown, D.E.; Heidarysafa, M.; Jafari Meimandi, K.; Gerber, M.S.; Barnes, L.E. HDLTex: Hierarchical Deep Learning for Text Classification. In Proceedings of the 2017 16th IEEE International Conference on Machine Learning and Applications, Cancun, Mexico, 18–21 December 2017; pp. 364–371. [Google Scholar] [CrossRef]
  12. Caled, D.; Won, M.; Martins, B.; Silva, M.J. A Hierarchical Label Network for Multi-Label EuroVoc Classification of Legislative Contents. In Proceedings of the International Conference on Theory and Practice of Digital Libraries, Oslo, Norway, 9–12 September 2019; pp. 238–252. [Google Scholar] [CrossRef]
  13. Zhu, H.; He, C.; Fang, Y.; Ge, B.; Xing, M.; Xiao, W. Patent Automatic Classification Based on Symmetric Hierarchical Convolution Neural Network. Symmetry 2020, 12, 186. [Google Scholar] [CrossRef]
  14. Mao, Y.; Tian, J.; Han, J.; Ren, X. Hierarchical Text Classification with Reinforced Label Assignment. arXiv 2019, arXiv:1908.10419. [Google Scholar] [CrossRef]
  15. Chen, B.; Huang, X.; Xiao, L.; Cai, Z.; Jing, L. Hyperbolic Interaction Model for Hierarchical Multi-Label Classification. In Proceedings of the AAAI Conference on Artificial Intelligence, New York, NY, USA, 7–12 February 2020; Volume 34, pp. 7496–7503. [Google Scholar] [CrossRef]
  16. Wang, Z.; Wang, P.; Liu, T.; Lin, B.; Cao, Y.; Sui, Z.; Wang, H. HPT: Hierarchy-Aware Prompt Tuning for Hierarchical Text Classification. arXiv 2022, arXiv:2204.13413. [Google Scholar] [CrossRef]
  17. Chen, H.; Ma, Q.; Lin, Z.; Yan, J. Hierarchy-Aware Label Semantics Matching Network for Hierarchical Text Classification. In Proceedings of the 59th Annual Meeting of the Association for Computational Linguistics, Online, 1–6 August 2021; pp. 4370–4379. [Google Scholar]
  18. Wang, Z.; Wang, P.; Huang, L.; Sun, X.; Wang, H. Incorporating Hierarchy into Text Encoder: A Contrastive Learning Approach for Hierarchical Text Classification. arXiv 2022, arXiv:2203.03825. [Google Scholar] [CrossRef]
  19. Ji, K.; Lian, Y.; Gao, J.; Wang, B. Hierarchical Verbalizer for Few-Shot Hierarchical Text Classification. arXiv 2023, arXiv:2305.16885. [Google Scholar] [CrossRef]
  20. Plaud, R.; Labeau, M.; Saillenfest, A.; Bonald, T. Revisiting Hierarchical Text Classification: Inference and Metrics, Proceedings of the 28th Conference on Computational Natural Language Learning, Miami, FL, USA, 15–16 November 2024; Barak, L., Alikhani, M., Eds.; Association for Computational Linguistics: Stroudsburg, PA, USA, 2024; pp. 231–242. [Google Scholar] [CrossRef]
  21. Devlin, J.; Chang, M.W.; Lee, K.; Toutanova, K. BERT: Pre-training of Deep Bidirectional Transformers for Language Understanding. In Proceedings of the 2019 Conference of the North American Chapter of the Association for Computational Linguistics, Minneapolis, MN, USA, 2–7 June 2019; pp. 4171–4186. [Google Scholar]
  22. Liu, Y.; Zhang, K.; Huang, Z.; Wang, K.; Zhang, Y.; Liu, Q.; Chen, E. Enhancing Hierarchical Text Classification through Knowledge Graph Integration. In Findings of the Association for Computational Linguistics; ACL: Stroudsburg, PA, USA, 2023; pp. 5797–5810. [Google Scholar] [CrossRef]
  23. Su, J.; Murtadha, A.; Pan, S.; Hou, J.; Sun, J.; Huang, W.; Wen, B.; Liu, Y. Global Pointer: Novel Efficient Span-Based Approach for Named Entity Recognition. arXiv 2022, arXiv:2208.03054. [Google Scholar] [CrossRef]
  24. Goh, Y.M.; Ubeynarayana, C.U. Construction Accident Narrative Classification: An Evaluation of Text Mining Techniques. Accid. Anal. Prev. 2017, 108, 122–130. [Google Scholar] [CrossRef]
  25. Zhang, F.; Fleyeh, H.; Wang, X.; Lu, M. Construction Site Accident Analysis Using Text Mining and Natural Language Processing Techniques. Autom. Constr. 2019, 99, 238–248. [Google Scholar] [CrossRef]
  26. Kim, T.; Chi, S. Accident Case Retrieval and Analyses: Using Natural Language Processing in the Construction Industry. J. Constr. Eng. Manag. 2019, 145, 04019004. [Google Scholar] [CrossRef]
  27. Lu, D.; Xu, C.; Mi, C.; Wang, Y.; Xu, X.; Zhao, C. Establishment of a Key Hidden Danger Factor System for Electric Power Personal Casualty Accidents Based on Text Mining. Information 2021, 12, 243. [Google Scholar] [CrossRef]
  28. Xu, N.; Ma, L.; Wang, L.; Deng, Y.; Ni, G. Extracting Domain Knowledge Elements of Construction Safety Management: Rule-Based Approach Using Chinese Natural Language Processing. J. Manag. Eng. 2021, 37, 04021001. [Google Scholar] [CrossRef]
  29. Li, S.; You, M.; Li, D.; Liu, J. Identifying Coal Mine Safety Production Risk Factors by Employing Text Mining and Bayesian Network Techniques. Process Saf. Environ. Prot. 2022, 162, 1067–1081. [Google Scholar] [CrossRef]
  30. Li, J.; Wu, C. Deep Learning and Text Mining: Classifying and Extracting Key Information from Construction Accident Narratives. Appl. Sci. 2023, 13, 10599. [Google Scholar] [CrossRef]
  31. Zhang, J.; Zi, L.; Hou, Y.; Deng, D.; Jiang, W. A C-BiLSTM Approach to Classify Construction Accident Reports. Appl. Sci. 2020, 10, 5754. [Google Scholar] [CrossRef]
  32. Qiao, J.; Wang, C.; Guan, S.; Shuran, L. Construction-Accident Narrative Classification Using Shallow and Deep Learning. J. Constr. Eng. Manag. 2022, 148, 04022088. [Google Scholar] [CrossRef]
  33. Fang, W.; Luo, H.; Xu, S.; Love, P.E.D.; Lu, Z.; Ye, C. Automated Text Classification of Near-Misses from Safety Reports: An Improved Deep Learning Approach. Adv. Eng. Inform. 2020, 44, 101060. [Google Scholar] [CrossRef]
  34. Meng, F.; Yang, S.; Wang, J.; Xia, L.; Liu, H. Creating Knowledge Graph of Electric Power Equipment Faults Based on BERT–BiLSTM–CRF Model. J. Electr. Eng. Technol. 2022, 17, 2507–2516. [Google Scholar] [CrossRef]
  35. Liu, F.; Wen, Z.; Wu, Y. Intelligent Analysis on Text of Power Industry Accident Based on BERT-BILSTM-CRF Model. J. Saf. Sci. Technol. 2023, 19, 209–215. [Google Scholar]
  36. Liu, C.; Yang, S. Using Text Mining to Establish Knowledge Graph from Accident/Incident Reports in Risk Assessment. Expert Syst. Appl. 2022, 207, 117991. [Google Scholar] [CrossRef]
  37. Khairuddin, M.Z.F.; Sankaranarayanan, S.; Hasikin, K.; Abd Razak, N.A.; Omar, R. Contextualizing Injury Severity from Occupational Accident Reports Using an Optimized Deep Learning Prediction Model. PeerJ Comput. Sci. 2024, 10, e1985. [Google Scholar] [CrossRef] [PubMed]
  38. Liu, J.; Ma, H.; Xie, X.; Cheng, J. Short Text Classification for Faults Information of Secondary Equipment Based on Convolutional Neural Networks. Energies 2022, 15, 2400. [Google Scholar] [CrossRef]
  39. Luo, X.; Li, X.; Song, X.; Liu, Q. Convolutional Neural Network Algorithm–Based Novel Automatic Text Classification Framework for Construction Accident Reports. J. Constr. Eng. Manag. 2023, 149, 04023128. [Google Scholar] [CrossRef]
  40. Chen, Z.; Huang, K.; Wu, L.; Zhong, Z.; Jiao, Z. Relational Graph Convolutional Network for Text-Mining-Based Accident Causal Classification. Appl. Sci. 2022, 12, 2482. [Google Scholar] [CrossRef]
  41. Pan, X.; Zhong, B.; Wang, Y.; Shen, L. Identification of Accident-Injury Type and Bodypart Factors from Construction Accident Reports: A Graph-Based Deep Learning Framework. Adv. Eng. Inform. 2022, 54, 101752. [Google Scholar] [CrossRef]
  42. Cao, K.; Chen, S.; Zhang, X.; Chen, Y.; Li, Z.; Wang, D. Identification of Causative Factors for Fatal Accidents in the Electric Power Industry Using Text Categorization and Catastrophe Association Analysis Techniques. Alex. Eng. J. 2024, 102, 290–308. [Google Scholar] [CrossRef]
  43. Zeng, W.; Tang, W.; Yuan, D.; Zhang, H.; Duan, P.; Hu, S. Structure-Aware and Format-Enhanced Transformer for Accident Report Modeling. Appl. Sci. 2025, 15, 7928. [Google Scholar] [CrossRef]
  44. Jia, Q.; Fu, G.; Xie, X.; Xue, Y.; Hu, S. Enhancing Accident Cause Analysis through Text Classification and Accident Causation Theory: A Case Study of Coal Mine Gas Explosion Accidents. Process Saf. Environ. Prot. 2024, 185, 989–1002. [Google Scholar] [CrossRef]
  45. Qin, Y.; Ai, X. Infer Potential Accidents from Hazard Reports: A Causal Hierarchical Multi-Label Classification Approach. Adv. Eng. Informatics 2025, 65, 103237. [Google Scholar] [CrossRef]
  46. Cheng, Q.; Shi, W. Hierarchical multi-label text classification of tourism resources using a label-aware dual graph attention network. Inf. Process. Manag. 2025, 62, 103952. [Google Scholar] [CrossRef]
  47. Ray, U.; Arteaga, C.; Ahn, Y.; Park, J. Enhanced Identification of Equipment Failures from Descriptive Accident Reports Using Language Generative Model. Eng. Constr. Archit. Manag. 2024. [Google Scholar] [CrossRef]
  48. Ahmadi, E.; Muley, S.; Wang, C. Automatic Construction Accident Report Analysis Using Large Language Models (LLMs). J. Intell. Constr. 2025, 3, 1–10. [Google Scholar] [CrossRef]
  49. Jing, L.; Rahman, A. Fault Diagnosis in Power Grids with Large Language Model. arXiv 2024, arXiv:2407.08836. [Google Scholar] [CrossRef]
  50. Majumder, S.; Dong, L.; Doudi, F.; Cai, Y.; Tian, C.; Kalathil, D.; Ding, K.; Thatte, A.A.; Li, N.; Xie, L. Exploring the Capabilities and Limitations of Large Language Models in the Electric Energy Sector. Joule 2024, 8, 1544–1549. [Google Scholar] [CrossRef]
  51. Khairuddin, M.Z.F.; Hasikin, K.; Abd Razak, N.A.; Lai, K.W.; Osman, M.Z.; Aslan, M.F.; Sabanci, K.; Azizan, M.; Satapathy, S.C.; Wu, X. Predicting Occupational Injury Causal Factors Using Text-Based Analytics: A Systematic Review. Front. Public Health 2022, 10, 984099. [Google Scholar] [CrossRef]
  52. Fu, Y.; Zhang, D.; Xiao, Y.; Wang, Z.; Zhou, H. An Interpretable Time Series Data Prediction Framework for Severe Accidents in Nuclear Power Plants. Entropy 2023, 25, 1160. [Google Scholar] [CrossRef]
  53. Granitzer, M. Hierarchical Text Classification Using Methods from Machine Learning. Ph.D. Thesis, Graz University of Technology, Styria, Austria, 2003. [Google Scholar]
  54. Granitzer, M.; Auer, P. Experiments with Hierarchical Text Classification. In Proceedings of the 9th IASTED International Conference on Artificial Intelligence, Innsbruck, Austria, 14–16 February 2005. [Google Scholar]
  55. Esuli, A.; Fagni, T.; Sebastiani, F. TreeBoost.MH: A Boosting Algorithm for Multi-Label Hierarchical Text Categorization, Proceedings of the String Processing and Information Retrieval; Lecture Notes in Computer Science; Springer: Berlin/Heidelberg, Germany, 2006; Volume 4209, pp. 13–24. [Google Scholar] [CrossRef]
  56. Esuli, A.; Fagni, T.; Sebastiani, F. Boosting Multi-Label Hierarchical Text Categorization. Inf. Retr. 2008, 11, 287–313. [Google Scholar] [CrossRef]
  57. Vens, C.; Struyf, J.; Schietgat, L.; Džeroski, S.; Blockeel, H. Decision Trees for Hierarchical Multi-Label Classification. Mach. Learn. 2008, 73, 185–214. [Google Scholar] [CrossRef]
  58. Santos, A.; Canuto, A. Applying semi-supervised learning in hierarchical multi-label classification. Expert Syst. Appl. 2014, 41, 6075–6085. [Google Scholar] [CrossRef]
  59. Nakano, F.K.; Cerri, R.; Vens, C. Active Learning for Hierarchical Multi-Label Classification. Data Min. Knowl. Discov. 2020, 34, 1496–1530. [Google Scholar] [CrossRef]
  60. Huang, W.; Chen, E.; Liu, Q.; Chen, Y.; Huang, Z.; Liu, Y.; Zhao, Z.; Zhang, D.; Wang, S. Hierarchical Multi-Label Text Classification: An Attention-Based Recurrent Network Approach. In Proceedings of the 28th ACM International Conference on Information and Knowledge Management, Beijing, China, 3–7 November 2019; pp. 1051–1060. [Google Scholar]
  61. Huang, W.; Chen, E.; Liu, Q.; Xiong, H.; Huang, Z.; Tong, S. HmcNet: A General Approach for Hierarchical Multi-Label Classification. IEEE Trans. Knowl. Data Eng. 2022, 35, 8713–8728. [Google Scholar] [CrossRef]
  62. Wang, B.; Hu, X.; Li, P.; Yu, P.S. Cognitive Structure Learning Model for Hierarchical Multi-Label Text Classification. Knowl.-Based Syst. 2021, 218, 106876. [Google Scholar] [CrossRef]
  63. Shimura, K.; Li, J.; Fukumoto, F. HFT-CNN: Learning Hierarchical Category Structure for Multi-Label Short Text Categorization. In Proceedings of the 2018 Conference on Empirical Methods in Natural Language Processing, Brussels, Belgium, 31 October–4 November 2018; pp. 811–816. [Google Scholar]
  64. Peng, H.; Li, J.; He, Y.; Liu, Y.; Bao, M.; Wang, L.; Song, Y.; Yang, Q. Large-Scale Hierarchical Text Classification with Recursively Regularized Deep Graph-CNN. In Proceedings of the 2018 World Wide Web Conference, Lyon, France, 23–27 April 2018; pp. 1063–1072. [Google Scholar]
  65. Fan, Q.; Qiu, C. Hierarchical Multi-Label Text Classification Method Based on Multi-Level Decoupling. In Proceedings of the 2023 International Conference on Neural Networks, Information and Communication Engineering, Guangzhou, China, 24–26 February 2023; pp. 453–457. [Google Scholar]
  66. Zhang, X.; Xu, J.; Soh, C.; Chen, L. LA-HCN: Label-Based Attention for Hierarchical Multi-Label Text Classification Neural Network. Expert Syst. Appl. 2022, 187, 115922. [Google Scholar] [CrossRef]
  67. Deng, W.; Zhang, J.; Zhang, P.; Yao, Y.; Gao, H.; Zhang, Y. Hyper-Label-Graph: Modeling Branch-Level Dependencies of Labels for Hierarchical Multi-Label Text Classification. In Proceedings of the Asian Conference on Machine Learning, Hanoi, Vietnam, 5–7 December 2024; pp. 279–294. [Google Scholar]
  68. Cheng, Q.; Cheng, J.; Chen, J.; Liu, S. Hierarchical Multi-Label Classification Model for Science and Technology News Based on Heterogeneous Graph Semantic Enhancement. PeerJ Comput. Sci. 2024, 10, e2469. [Google Scholar] [CrossRef]
  69. Kumar, A.; Toshinwal, D. HLC: Hierarchically-aware label correlation for hierarchical text classification. Appl. Intell. 2024, 54, 1602–1618. [Google Scholar] [CrossRef]
  70. Yu, S.; He, J.; Gutiérrez-Basulto, V.; Pan, J.Z. Instances and Labels: Hierarchy-Aware Joint Supervised Contrastive Learning for Hierarchical Multi-Label Text Classification. arXiv 2023, arXiv:2310.05128. [Google Scholar]
  71. Shen, J.; Qiu, W.; Meng, Y.; Shang, J.; Ren, X.; Han, J. TaxoClass: Hierarchical Multi-Label Text Classification Using Only Class Names. In Proceedings of the 2021 Conference of the North American Chapter of the Association for Computational Linguistics, Mexico City, Mexico, 6–11 June 2021. [Google Scholar]
  72. Zhang, J.; Li, Y.; Shen, F.; He, Y.; Tan, H.; He, Y. Hierarchical Text Classification with Multi-Label Contrastive Learning and KNN. Neurocomputing 2024, 577, 127323. [Google Scholar] [CrossRef]
  73. Zhang, M.; Song, R.; Li, X.; Tavares, A.; Xu, H. Few-shot Hierarchical Text Classification with Bidirectional Path Constraint by label weighting. Pattern Recognit. Lett. 2025, 190, 81–88. [Google Scholar] [CrossRef]
  74. Liu, J.; Chang, W.-C.; Wu, Y.; Yang, Y. Deep Learning for Extreme Multi-Label Text Classification. In Proceedings of the 40th International ACM SIGIR Conference on Research and Development in Information Retrieval, Tokyo, Japan, 7–11 August 2017; pp. 115–124. [Google Scholar]
  75. Gargiulo, F.; Silvestri, S.; Ciampi, M.; De Pietro, G. Deep Neural Network for Hierarchical Extreme Multi-Label Text Classification. Appl. Soft Comput. 2019, 79, 125–138. [Google Scholar] [CrossRef]
  76. Ren, Z.; Peetz, M.H.; Liang, S.; van Dolen, W.; de Rijke, M. Hierarchical Multi-Label Classification of Social Text Streams. In Proceedings of the 37th International ACM SIGIR Conference on Research and Development in Information Retrieval, Gold Coast, Australia, 6–11 June 2014; pp. 213–222. [Google Scholar]
  77. Zhao, X.; Li, Z.; Zhang, X.; Wang, J.; Chen, T.; Ju, Z.; Wang, C.; Zhang, C.; Zhan, Y. An Interactive Fusion Model for Hierarchical Multi-Label Text Classification. In Proceedings of the CCF International Conference on Natural Language Processing and Chinese Computing, Guilin, China, 24–25 September 2022; pp. 168–178. [Google Scholar]
  78. Liu, L.; Mu, F.; Li, P.; Mu, X.; Tang, J.; Ai, X.; Fu, R.; Wang, L.; Zhou, X. NeuralClassifier: An Open-Source Neural Hierarchical Multi-Label Text Classification Toolkit. In Proceedings of the 57th Annual Meeting of the Association for Computational Linguistics: System Demonstrations, Florence, Italy, 28 July–2 August 2019; pp. 87–92. [Google Scholar] [CrossRef]
  79. Amigó, E.; Delgado, A. Evaluating Extreme Hierarchical Multi-Label Classification. In Proceedings of the 60th Annual Meeting of the Association for Computational Linguistics, Dublin, Ireland, 22–27 May 2022; pp. 5809–5819. [Google Scholar] [CrossRef]
  80. Loshchilov, I.; Hutter, F. Decoupled Weight Decay Regularization. In Proceedings of the International Conference on Learning Representations, New Orleans, LA, USA, 6–9 May 2019. [Google Scholar]
  81. Cai, F.; Liu, D.; Zhang, Z.; Liu, G.; Yang, X.; Fang, X. NER-Guided Comprehensive Hierarchy-Aware Prompt Tuning for Hierarchical Text Classification. In Proceedings of the 2024 Joint International Conference on Computational Linguistics, Language Resources and Evaluation, Torino, Italia, 20–25 May 2024; pp. 12117–12126. [Google Scholar]
Figure 1. Cross-sentence reasoning in an accident narrative. While statement S4 (“The on-duty electrician closed the main breaker…”, in red), appears normal in isolation, its interpretation changes when its context is considered. As indicated by the red arrow, integrating the rule from S1 (“re-energization during a planned outage requires approval…”, in blue) allows S4 to be correctly identified as a personnel violation (unauthorized operation). This illustrates how contextual reasoning across sentences is crucial for accurate analysis.
Energies 18 05389 g001
Figure 2. Model architecture: The colored dots on the left and right represent the embeddings of the masked tokens and the hierarchical labels, respectively.
Energies 18 05389 g002
Figure 3. Data annotation example. The text spans highlighted in different colors in (a) are annotated as entity types of the corresponding colors in (b).
Energies 18 05389 g003
Figure 4. Micro-F1 and Macro-F1 gap (percentage points). The figure plots the gap Δ (Micro–Macro) for each model; HiAGM-TP (4.22 pp) and HTCInfoMax (4.94 pp) show the smallest gaps, indicating more balanced per-class performance. The curve rises from BERT through HGCLR and then declines toward EG-HPT.
Energies 18 05389 g004
Figure 5. Frequency bands of label samples and their F1 scores. Figure 5 clearly reveals the dual effect of data scarcity on estimation variance and label separability. Both fitted lines slope upward, yet the EG-HPT line lies consistently above HPT, with more pronounced gains in the low-to-mid frequency range—evidence that evidence alignment and graph enhancement mitigate performance collapse on under-represented labels. This aligns with the bucketed results in the previous subsection (larger improvements on Tail/Mid). Taken together, the scatter cloud and trend lines indicate that the primary drag on Macro-F1 arises from low-frequency labels, and that EG-HPT secures steadier returns in this region, thereby lifting Macro-F1.
Energies 18 05389 g005
Figure 6. Comparison of each ablation variant with the full model, showing changes ( Δ ) in Micro-F1, Macro-F1, and C-Micro-F1 (unit: percentage points, pp; two decimals). Two main observations emerge. First, removing ALIGN or SEP causes the largest overall performance drop, with Macro-F1 being especially affected. Second, both GNN and NER contribute to maintaining path consistency, as removing either mainly reduces C-Micro-F1. Among them, the heterogeneous graph (GNN) has the greatest impact. When it is removed (w/o GNN), Micro-F1 and Macro-F1 drop by 1.14 pp and 1.19 pp, respectively, while C-Micro-F1 falls even more sharply by 3.51 pp. These results underscore the critical role of cross-sentence multi-hop aggregation in linking dispersed evidence fragments into coherent evidence sets. These results indicate that cross-sentence multi-hop aggregation is essential for clustering dispersed evidence fragments into coherent evidence sets.
Energies 18 05389 g006
Figure 7. Heatmap summarizing module contributions across metrics (unit: pp, two decimals; darker colors indicate stronger effects). It reveals two key patterns: (1) Macro-F1 is most sensitive to NER and GNN, confirming that explicit entity signals and cross-sentence multi-hop aggregation are vital for recalling rare and fine-grained labels. (2) C-Micro-F1 is more sensitive to ALIGN and SEP, showing that semantic alignment anchors ancestor and descendant decisions to the same evidence cluster, while the separation constraint prevents parent–child embedding collapse and reduces path breaks.
Energies 18 05389 g007
Figure 8. Case of multi-granularity evidence for labels–entities–sentences (partial paths).
Energies 18 05389 g008
Table 1. Entity types (partial).
Entity TypeCodeExamples
Accident typeACC_TYPEfalls from height, electric shock accidents, confined space, near-misses, etc.
Personnel rolePER_ROLEhigh-altitude worker, safety watcher, operator, etc.
Operation typeOPS_TYPEline maintenance, equipment servicing, fault clearance, high-voltage test, etc.
Electrical equipmentELEC_EQPhigh-voltage fuse, isolating switch, drop-out fuse, grounding wire, etc.
Action/operationACTIONvoltage verification, installing grounding wire, hanging tags, interlocking
Environmental factorENV_CONDwind force ≥ Beaufort 5, nighttime, rain/fog, poor lighting, etc.
Safety equipmentSFT_EQPsafety rope, fall arrester, energy absorber, tool bag, anti-slip sleeve, etc.
Facility/structureFACILITYguardrail, safety net, scaffold, hoisting mechanism etc.
Permit/documentPERMIToperation ticket, work permit, dispatch order, safety briefing record, etc.
Table 2. Power HFACS risk label taxonomy and tagging scheme (partial).
Level-1Level-2Level-3 (Examples)
Unsafe Acts (A)Unintentional Improper Acts (A1)Misjudgment of equipment status (A101); Unauthorized operation (A102); …; Insufficient risk identification (A110)
Routine Violations (A2)Operation without tickets (A201); Operating out of sequence (A202); …; Rule-violating command (A215)
Inadequate Work Preparation (C1)No pre-job safety briefing (C101);Two tickets not at the work site (C102); …; To carry out on-site survey (C105)
Preconditions for Unsafe Acts (C)Insufficient Safety Facilities and Protection (C2)Lack of anti-misoperation interlocking device (C201); Insufficient protection for facilities/equipment (C202); …; Protective devices have defects (C205)
Dispatching and Management Errors (C3)Unqualified “three types of personnel” (C301); Unclear division of dispatch authority (C302); …; Non-standard dispatch instructions (C306)
Defective Installation Conditions (C4)Insufficient safety clearance for equipment (C401); Defects in facilities, equipment, or tools (C402); …; Insufficient infrastructure strength (C406)
Personnel in Unsafe State or Environment (C5)Weak safety awareness of personnel (C501); Poor emergency response capability (C502); …; Personnel in an unsafe position (C511)
External Environment Not Suitable (C6)Adverse weather conditions (C601); In a special-operations area (C602); …; Insufficient time for the task (C605)
Information Mistakes or Errors (C7)Defects in the information system (C701); Hazards/defects not registered (C702); …; Signs missed or wrongly hung (C704)
Unsafe Supervision (S)Deficiencies in Supervision and Responsibility (S1)Safety production responsibilities not implemented (S101); Unclear division of inspection/maintenance responsibilities (S102); …; Unclear division of duties (S104)
Lax On-site Supervision (S2)Two tickets not reviewed/approved (S201); No on-site guardian (S202); …; No fence set at the job site (S206)
Lack of Risk Assessment and Emergency Mgmt (S3)Inadequate risk assessment (S301); No emergency plan prepared (S302); …; No safety training/drills conducted (S306)
Failure to Correct Problems in Time (S4)Inadequate hazard identification and rectification (S401); Defects not eliminated in time (C402); Failure to stop or correct violations (S403)
Organizational Influences (O)Resource Management (O1)Safety production funding not implemented (O101); Safety management organization not sound (O102); …; Hiring personnel without work qualifications (O105)
Organizational Climate (O2)Ignoring safety regulations (O201); Poor recognition of hazards and risks (O202); …; Safety education not in place (O205)
Organizational Process (O3)Lax equipment O&M management (O301); Lax approval of work plans (O302); …; Conducting business activities in violation of rules (O309)
Total: 16 categories, 119 labels
Table 3. Overall experimental results.
MethodsMicro (%)Macro (%)
PrecisionRecallF1PrecisionRecallF1
BERT [21]53.2348.6550.8449.0242.5445.55
HiAGM [6]66.2563.2664.7262.0459.0460.50
HTCInfoMax [7]66.8564.2365.5161.5459.6460.58
HiMatch [17]65.2156.3860.4758.0251.0254.30
HGCLR [18]65.8562.6364.2061.8453.4457.33
HPT [16]72.3568.6970.4765.2262.9464.06
HierVerb [19]70.5867.6369.0765.4361.1263.20
EG-HPT (ours)74.6969.5472.0269.8263.3466.42
Table 4. Layer-wise F1 metrics of models.
MethodMacro-F1 (%)Micro-F1 (%)
L1L2L3L1L2L3
BERT [21]76.1856.1245.5578.4357.9450.84
HiAGM [6]84.5867.8560.5086.0369.1164.72
HTCInfoMax [7]84.6668.4760.5886.0169.0665.51
HiMatch [17]85.1166.0254.3086.4969.7260.47
HGCLR [18]84.9369.2757.3386.1869.8464.20
HPT [16]87.9272.1164.0689.6973.3970.47
HierVerb [19]87.6171.6963.2089.1772.8269.07
EG-HPT (ours)88.8874.2166.4290.5975.5872.02
Table 5. Average F1 Score per Bucket.
MethodsHead M-F1(%)Mid M-F1 (%)Tail M-F1 (%)
BERT [21]74.8355.9238.41
HiAGM [6]81.0763.1445.29
HTCInfoMax [7]81.3263.7145.53
HiMatch [17]79.6659.4839.86
HGCLR [18]80.1261.3743.05
HPT [16]81.2064.0545.10
HierVerb [19]80.7163.4244.27
EG-HPT (ours)83.2467.0148.70
Table 6. Ablation results.
Model VariantMicro (%)Macro (%)C-Micro (%)
PrecisionRecallF1 ΔF1PrecisionRecallF1ΔF1F1ΔF1
EG-HPT (full)74.6969.5472.0269.8263.3466.4268.24
w/o NER73.4168.6170.93−1.0968.1161.9164.86−1.5665.45−2.79
w/o GNN73.3168.5270.83−1.1968.7162.1165.24−1.1864.73−3.51
w/o ALIGN73.0268.5170.69−1.3368.5362.5265.39−1.0365.80−2.44
w/o SEP74.1168.9171.41−0.6169.2162.8165.85−0.5766.26−1.98
Disclaimer/Publisher’s Note: The statements, opinions and data contained in all publications are solely those of the individual author(s) and contributor(s) and not of MDPI and/or the editor(s). MDPI and/or the editor(s) disclaim responsibility for any injury to people or property resulting from any ideas, methods, instructions or products referred to in the content.