Article

Development of a Hybrid Expert Diagnostic System for Power Transformers Based on the Integration of Computational and Measurement Complexes

by
Ivan Beloev
1,
Mikhail Evgenievich Alpatov
2,
Marsel Sharifyanovich Garifullin
3,
Ilgiz Fanzilevich Galiev
3,
Shamil Faridovich Rakhmankulov
3,
Iliya Iliev
4 and
Ylia Sergeevna Valeeva
5,*
1
Department of Transport, “Angel Kanchev” University of Ruse, 7017 Ruse, Bulgaria
2
JSC “PK HC ELEKTROZAVOD”, 107023 Moscow, Russia
3
Department of Electric Power Systems and Networks, FGBOU VO “KGEU”, 420066 Kazan, Russia
4
Department of Heat, Hydraulics and Environmental Engineering, “Angel Kanchev” University of Ruse, 7017 Ruse, Bulgaria
5
Department Project Activities, Russian University of Cooperation, 420034 Kazan, Russia
*
Author to whom correspondence should be addressed.
Energies 2025, 18(20), 5360; https://doi.org/10.3390/en18205360
Submission received: 11 May 2025 / Revised: 6 August 2025 / Accepted: 29 September 2025 / Published: 11 October 2025
(This article belongs to the Section F: Electrical Engineering)

Abstract

The paper presents a hybrid intelligent expert diagnostic system (HIESD) of power transformer (PT) subsystems realized on the basis of integration of measuring and computing hardware and software complexes into a single functional architecture. HIESD performs online diagnostics of four main subsystems of PT: 1—insulating (liquid and solid insulation); 2—electromagnetic (windings, magnetic conductor); 3—voltage regulation; and 4—high-voltage inputs. Computational complexes and modules of the system are connected with the real object of power grids, 110/10 kV substation, which interact with each other and contain a relational database of retrospective offline data of the PT “life cycle” (including test and measurement results), supplemented by online monitoring data of the main subsystems, corrected by high-precision test measurements; analytical complex, in which the work of calculation modules of the operational state of PT subsystems is supplemented by predictive analytics and machine learning modules; and a knowledge base, sections of which are regularly updated and supplemented. The system architecture is tested at industrial facilities in terms of online transformer diagnostics based on dissolved gas analysis (DGA) data. Additionally, a theoretical model of diagnostics based on the electromagnetic characteristics of the transformer, which takes into account distorted and nonlinear modes of its operation, is presented. The scientific significance of the work consists of the presentation of the following new provisions: Methodology and algorithm for diagnostics of electromagnetic parameters of ST, taking into account nonlinearity and non-sinusoidality of winding currents and voltages; formation of optimal client–service architecture of training models of hybrid system based on the processes of data storage and management; and modification of the moth–flame algorithm to optimize the smoothing coefficient in the process of training a probabilistic neural network

1. Introduction

1.1. Relevance of the Problem

Power oil-filled transformer is the most expensive asset in the electric power system. Up to 60% of the cost of all substation equipment is accounted for by PTs [1], so maintaining their trouble-free operation is an important economic task and a key factor in ensuring reliable supply of electric energy (EE) to consumers.
The average age of the power grid PTs fleet is about 30 years and continues to increase, so the problem of ensuring their reliable operation from year to year is becoming more and more urgent. Taking into account the impossibility of full-fledged replacement of equipment that has served its normal service life, the most correct strategy to ensure reliable operation of power grids is to increase the efficiency of diagnostics of their condition.
The high rate of digitalization of the power industry has created new opportunities for improving the reliability of electrical equipment and, in particular, PTs. The opportunities are based on continuous monitoring and diagnostics of the state of PT subsystems [2], which makes it possible to
-
Supplement the possibilities of integral assessment of the PT state as a whole and to forecast the change in the state of its subsystems with determination of their residual resource;
-
Ensure the formation of more adequate diagnostic models for forecasting and predictive analysis of the technical condition of PT on the basis of both deterministic approach and machine learning methods;
-
Develop a system of optimal decision-making when selecting effective operational impacts on the object (creation of a “digital twin” of the PT).
To successfully solve the above tasks, it is necessary to provide multicomponent diagnostics of PT in the online monitoring mode [3]. Numerous works on this topic imply the development of and improvement in mathematical models for operational and predictive assessment of equipment condition (diagnostic models) and decision support systems to ensure reliable operation, which determines their relevance.

1.2. Experience of the Team of Authors

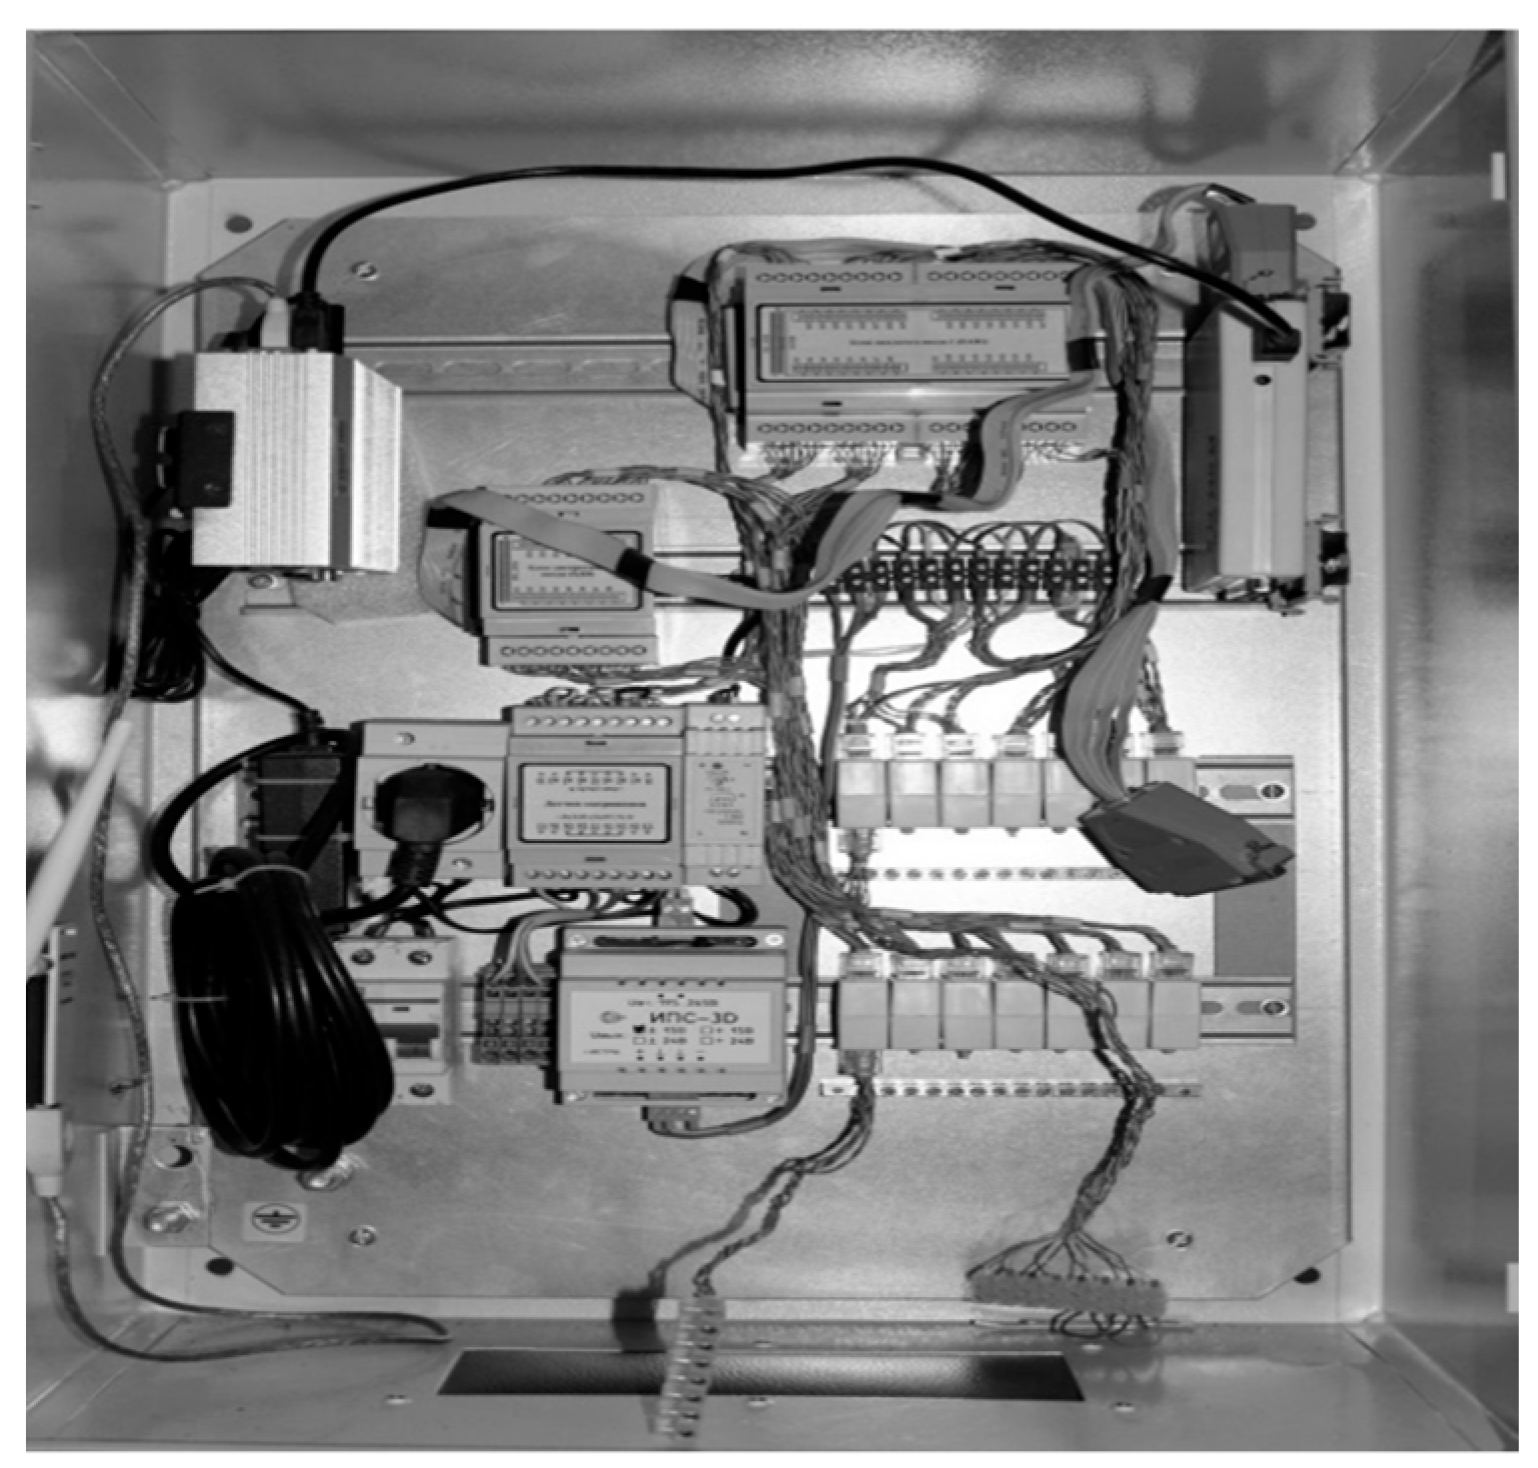
Over the past 10 years, the authors of this article have developed and implemented online subsystems for commercial and technical accounting of electrical energy [4], diagnostics of the condition of transformer on-load tap changers (OLTC) [5], Figure 1, and circuit breakers [6], Figure 2; and a device for testing electromagnetic parameters (EMPs) [7] (low-power transformers, laboratory transformers—physical models of transformers), Figure 3.
In addition to the above, analytical software modules have been developed: models for optimizing voltages in power centers (PCs) [8]; models for deviation of current waveforms of OLTC device drives and circuit breakers; determination of load losses under asymmetrical load [9]; methods for determining the degree of degradation of transformer oils [10]; and an adaptive model for diagnosing liquid insulation based on a probabilistic neural network [11]. Based on the results of their work, the authors have formed and structured a server relational database based on the PostgreSQL database management system (DBMS) containing information on the “life cycle” of several dozen 110/10 kV transformers of the same type.
The experience gained from the work performed allows us to conclude that transformer diagnostic systems should be “personalized”, i.e., based on the passport data of a specific transformer, which increases their effectiveness. In the modern “classical” diagnostic system (program) [12], an important role is assigned to the analysis of gases dissolved in oil, which theoretically allows for the detection of many developing defects. However, almost half a century of using this method has not allowed for the formation of an unambiguous library of defect images. One of the reasons for this is the failure to take into account the physical and chemical characteristics of the oil.
Electromagnetic parameters have historically played an important role in transformer diagnostics [13,14]. At the present stage, highly sensitive frequency analysis (FRA) methods are in particular demand, as they allow for the effective monitoring of the condition of the active part of the transformer, including the windings and magnetic circuit [15], as well as methods for diagnosing such critical structural elements as high-voltage bushings and on-load tap changers.
Thus, the set of diagnostic information represents an array of heterogeneous data, the combination of which within a single diagnostic object is a complex task. It is solved by methods of recognition theory and requires special in-depth consideration. At the same time, no less complex sub-tasks arise within the main task, caused by the need to compare variable diagnostic parameters that depend on a variety of influencing factors. For example, the values of EMP in test and operating modes can differ significantly (due to their nonlinearity, frequency dependence, etc.). Methods and algorithms need to be developed to reconcile the diagnostic parameters being compared. Obviously, this aspect largely determines the effectiveness of practical PT diagnostics.
Recently, many researchers have linked the improvement in operational control and diagnostics of PTs to the use of artificial intelligence (AI) [1]. In this case, not only the selection of optimal machine learning algorithms becomes important but also the volume and accuracy of the measurement results of various diagnostic features, parameters, and quality indicators. At the same time, it is obvious that the use of traditional measurement methods alone is no longer sufficient. The modern approach to diagnostics provides for continuous (quasi-continuous) monitoring of the condition of its components and subsystems. It should be noted that there is often a certain degree of “voluntarism” in the construction of monitoring systems—in each specific case, a unique set of sensors, detectors, and systems from different manufacturers is used to collect diagnostic parameters. In this regard, obtaining (measuring and processing) the necessary amount of diagnostic data is a non-trivial and creative task.
Therefore, the main objective of this study is to justify, develop, and implement (test) a prototype of an intelligent computing complex and information and measurement system based on a minimum number of controlled diagnostic parameters of the transformer, which, in turn, minimizes the cost of the system as a whole.
An analysis of the causes of emergency shutdowns of the PT shows that its most frequently damaged components are high-voltage bushings and on-load tap changers—OLTC devices. According to the operating data of Hydro-Québec, which services more than 2000 transformers, damage to these devices accounts for up to 50% of the total number of failures [16]. The importance of monitoring traditional diagnostic objects, insulation and electromagnetic systems, is obvious: the former determines the resource; the latter determines the functional performance of the transformer.
Based on this, the following transformer subsystems were selected for online diagnostics:
1—Insulation (liquid and solid insulation);
2—Electromagnetic (windings and magnetic circuit);
3—Voltage regulation;
4—High-voltage bushings.

1.3. Overview of Diagnostic Methods for Selected Subsystems of the PT

The insulation subsystem of a PT is divided into liquid and solid insulation. In the vast majority of cases, the former is based on mineral transformer oil, in which the active part is immersed [17]. Solid insulation is based on insulating paper and cardboard obtained from cellulose raw materials. Solid insulation of a transformer is a non-recoverable element in case of damage. Liquid oil can be replaced or regenerated even without disconnecting the transformer [18].
Defects in the transformer lead to the occurrence of local thermal and discharge processes, resulting in the decomposition of the insulation system with the release of various degradation products of the hydrocarbon base of the paper–oil insulation into the oil. This served as the basis for the development of methods for identifying defects in oil-filled transformers by analyzing characteristic gases dissolved in oil—DGA. For more than half a century, such analysis has been one of the most effective diagnostic tools [19]. A detailed overview of existing methods for processing and interpreting DGA results is given in [20]. The most well-known of these are the Dornburg method, the Duval triangle, and the Rogers ratio method [21], among others.
Despite such methodological diversity, interpreting gas content in transformer oil is a complex task, the solution to which depends on many often contradictory factors (shielding of defects). Even a combination of different methods [22,23] does not allow for the reliable diagnosis of many developing defects.
In the mid-2000s, studies appeared that proposed the use of genetic algorithms for analysis [24,25]. This was an initial attempt to formalize the process of diagnosing gas content in oil. With the advent of machine learning methods, mathematical methods replaced the heuristic approach to interpreting DGA data. Nowadays, this approach seems to be the most productive for analyzing results [26,27,28,29,30]. However, the stochastic nature of the information and the complexity of reproducing the results obtained by other researchers make it difficult to create a universal tool for such analysis [20]. The prospect for the development of this area lies in the combined efforts of specialists, in particular, in the exchange of data from numerous studies. Positive examples of openness to such cooperation include the DGA data repository, which is freely accessible [31], and the work [32], which used data collected from 16 different sources.
Today, it is generally accepted that when interpreting DGA results, it is necessary to take into account the structural-group and physicochemical composition of transformer oil, which have a significant impact on gas formation [33,34]. It has been established that changes in the moisture content of oil affect the diffusion of gases dissolved in it [35]. It follows that in the process of machine learning, DGA data and data on various physical and chemical parameters and oil quality indicators must be simultaneously fed as input data. Here, it is necessary to take full advantage of modern sensors and detectors [36] for online monitoring of transformer oil characteristics. It seems very promising to supplement the input information with spectral research data obtained, in particular, by methods of optical spectroscopy in the UV, visible, and IR ranges.
Other factors that influence the interpretation of DGA results are the design characteristics of a particular transformer and its operating modes.
Thus, the development of effective algorithms for interpreting DGA results, taking into account additional parameters (temperature inside the transformer, its load factor, insulation moisture content, etc.), remains an important and relevant task, the solution of which will allow us to move to a qualitatively new level of diagnostic examination of oil-filled transformers [37].
The electromagnetic parameters (EMP) of a transformer primarily refer to no-load parameters: no-load losses (P0) and no-load current (i0), and short-circuit parameters: short-circuit losses (Pк) and short-circuit resistance (Zк). These values, as state characteristics, “accompany” the PT throughout its entire “life cycle” and are the most important indicators of the presence or absence of defects in it. They are the “products” of test (offline) diagnostics and imply removing the transformer from its operating state and creating conditions for special modes: complete disconnection or “dead” connection of one of the windings. Monitoring EMPs under operating (online) diagnostics conditions is a non-trivial task.
However, attempts to determine Zк based on operating currents and voltages have been made repeatedly. The theoretical foundations of this online method include works [38,39] and some others. The logical reasoning underlying these proposals seems quite consistent and even flawless but attempts to implement them in practice have resulted in a significant (30–40%) methodological error.
An analysis of the causes of this negative situation, carried out by the authors of the proposed methods, led them to independent but practically identical conclusions that the main cause of errors is due to instrumental errors of current and voltage measuring transformers (to a greater extent the former). In other words, the main difficulty of online diagnostics of Zк (any electromagnetic parameter) lies in the errors in measuring the operating currents and voltages of PTs. Attempts have been made to overcome this difficulty by complicating the measuring circuit, but these have not yielded positive results.
Starting in 1986, a number of works [40,41,42] and others proposed a theoretical scheme for operational diagnosis of EMP, which was based on modeling the PT with an electrical multipole and using the achievements of electrical circuit theory. The proposal was also published in the form of an invention and patent application [7,43].
At the same time, in order to confirm the feasibility and improve this method, a number of studies were conducted on physical models. In [44], the following results were obtained:
(1)
The nonlinearity of the scattering field parameters was established (this conclusion is of great importance for transformer theory in general and also explains the main causes of errors in methods [38,39]);
(2)
The concept of EMP as possible combinations of coefficients at operating parameters (currents and voltages of windings) of power transformers has been clarified and expanded [41];
(3)
Methods and algorithms for diagnosing EMP of power transformers in conditions of insufficient information have been developed;
(4)
Methods and algorithms have been developed to solve the diagnostic tasks set in conditions of PT nonlinearity and non-sinusoidal operating parameters [45];
(5)
The feasibility of the approach has been confirmed in relation to a four-pole circuit (the case of a single-phase two-winding transformer);
(6)
A method has been developed for matching the parameters of test and operating modes to solve diagnostic problems [40,41,42,46].
The methodology for operational diagnostics of transformer EMPs is described in detail in monograph [47].
It should be noted that most researchers who have proposed alternative options for EMP control do not take into account the nonlinearity of PTs [48,49,50], as well as the poor conditionality of their mathematical models, which leads to large methodological errors.
There are also well-known methods described in [51,52,53,54], which, however, relate to test diagnostics.
Let us consider issues related to the diagnostics of transformer voltage regulation devices, on-load tap changers (OLTCs), which, according to [16], account for up to 50% of all transformer failures. The on-load tap changer is the only node containing moving parts (i.e., the most mechanically complex) and, at the same time, the most expensive part of the transformer [55]. The high susceptibility to damage and functional responsibility of on-load tap changers significantly complicate the methods and equipment used for their diagnostics.
The generally accepted approach to diagnosing OLTC devices is to measure the motor load current and vibration signal while the device is in operation [56,57,58,59]. Vibroacoustic measurements are a fairly simple but diagnostically valuable way to detect changes in the mechanical condition of the OLTC at different stages of its operation. The use of vibroacoustic signals in the form of standard vibration parameters (displacement, velocity, acceleration) is, as practice shows, insufficiently informative. For a more in-depth extraction of diagnostic information, it is necessary to use more sophisticated tools—various algorithms for converting measured vibration signals. In particular, the algorithms proposed at the beginning of this century [60], based on wavelet analysis [61,62], have shown high efficiency. However, as noted in [63], despite certain achievements, there are still problems with interpreting these data. To improve the reliability of diagnostics, the authors propose supplementing vibration studies with measurements of electromagnetic signals from microarcs that occur when OLTC contacts switch. For this purpose, high-frequency current transducers are used, which are installed on the PT grounding cables. The development of the methodology for such diagnostic analysis is presented in [64].
It has also been shown that temperature has a significant effect on the OLTC vibroacoustic signal [16]. To compensate for this effect, the authors propose using a method of averaging and time alignment. An original approach based on detecting changes in the envelopes of the vibroacoustic signal is proposed in [65].
The modern approach to building diagnostic models based on the results of vibroacoustic analysis is based on machine learning technologies. Practical implementation options for this approach are presented in numerous works, for example, in [66,67].
To improve the accuracy of diagnostic models, it will probably be necessary to take into account a greater number of parameters characterizing the state of various transformer components and systems. Modern sensor technologies for online monitoring of the transformer state [68] should play an important role in this.
Another important element of substations are high-voltage bushings. As operational practice has shown [16], defects in high-voltage bushings account for a significant proportion of all substation damage. Currently, bushings with RIP insulation are most commonly used for substations with a voltage of 110–500 kV. Operational practice has shown that up to 60% of developing defects in bushings can be detected at an early stage by monitoring key diagnostic indicators. The following methods and parameters are used to monitor the technical condition of bushings: visual inspection, measurement of the dielectric loss tangent tgδ, measurement of capacitance C, and recording of partial discharges (PD) [69,70], since major damage is almost always accompanied by internal or surface discharges [70]. The PD recording method is used in acceptance tests [71]. Thus, online recording and analysis of PD in bushing insulation is one of the promising methods for continuous monitoring of their technical condition.
The main methods for measuring PD are:
  • Electrical method. Principle: measurement of electrical signals from partial discharges, followed by interpretation of these signals in terms of apparent charge units [72]. Advantages of the method: high sensitivity, accuracy, and reliability of apparent charge characteristics assessment. The disadvantages are the need to tune out interference, the complexity of the calibration procedure, and the conversion to apparent charge units under operating conditions [73].
  • Registration of electromagnetic radiation from corona discharges. The advantage of the method is its noise immunity, but the complexity of interpreting the results severely limits the possible implementation of the method [74]. The method has found its main application in the control of overhead and cable lines.
  • Optical method based on the registration of CR radiation in the IR and UV ranges. The method has been widely used to monitor contact connections and external insulation of equipment nodes [75,76,77].
  • Acoustic method based on the recording of mechanical vibrations arising from the pressure of the expanding discharge channel. The advantages of acoustic monitoring include the ability to diagnose equipment without disrupting its normal operating mode. The disadvantages of the acoustic method of PD detection include the difficulty of locating the PD source in complex equipment structures, low sensitivity to PD compared to the electrical method, the inability to calibrate measurements in units of apparent PD charge according to the IEC 60270 standard, and, as a result, difficulties in comparing results obtained with different equipment, etc. [78,79].
Based on the above, the most effective method for recording partial discharges in RIP insulation of high-voltage bushings and their subsequent analysis appears to be the electrical method.

2. Concept of the Hardware–Software Complex

Earlier, the structure and functionality of the integrated expert diagnostic system (IEDS) for power transformers (PTs) were presented. The system consisted of three main components: the Executive Complex (EC), the Analytical Complex (AC), and the Knowledge Base (KB) [80].
At present, the hardware and software capabilities of the system have been significantly expanded, primarily due to the development of EC instrumentation (online measurement subsystems), as well as the enhancement of the entire information–analytical complex encompassing the AC and KB.
The conceptual framework of the system is as follows. The Executive Complex includes online monitoring subsystems, which collectively form the Information Layer (IL) of the Knowledge Base, designed to support multi-component diagnostics of PTs:
  • Liquid and solid insulation (dissolved gas analysis and moisture content), external and internal temperature monitoring—Module 1;
  • Electromagnetic diagnostics (operating currents and voltages of windings)—Module 2;
  • Voltage regulation devices (phase currents and voltages, drive motor current, vibration levels during tap changes, ambient and cabinet temperatures, number of operations)—Module 3;
  • High-voltage bushings (internal partial discharges, surface discharges, bushing leakage currents)—Module 4.
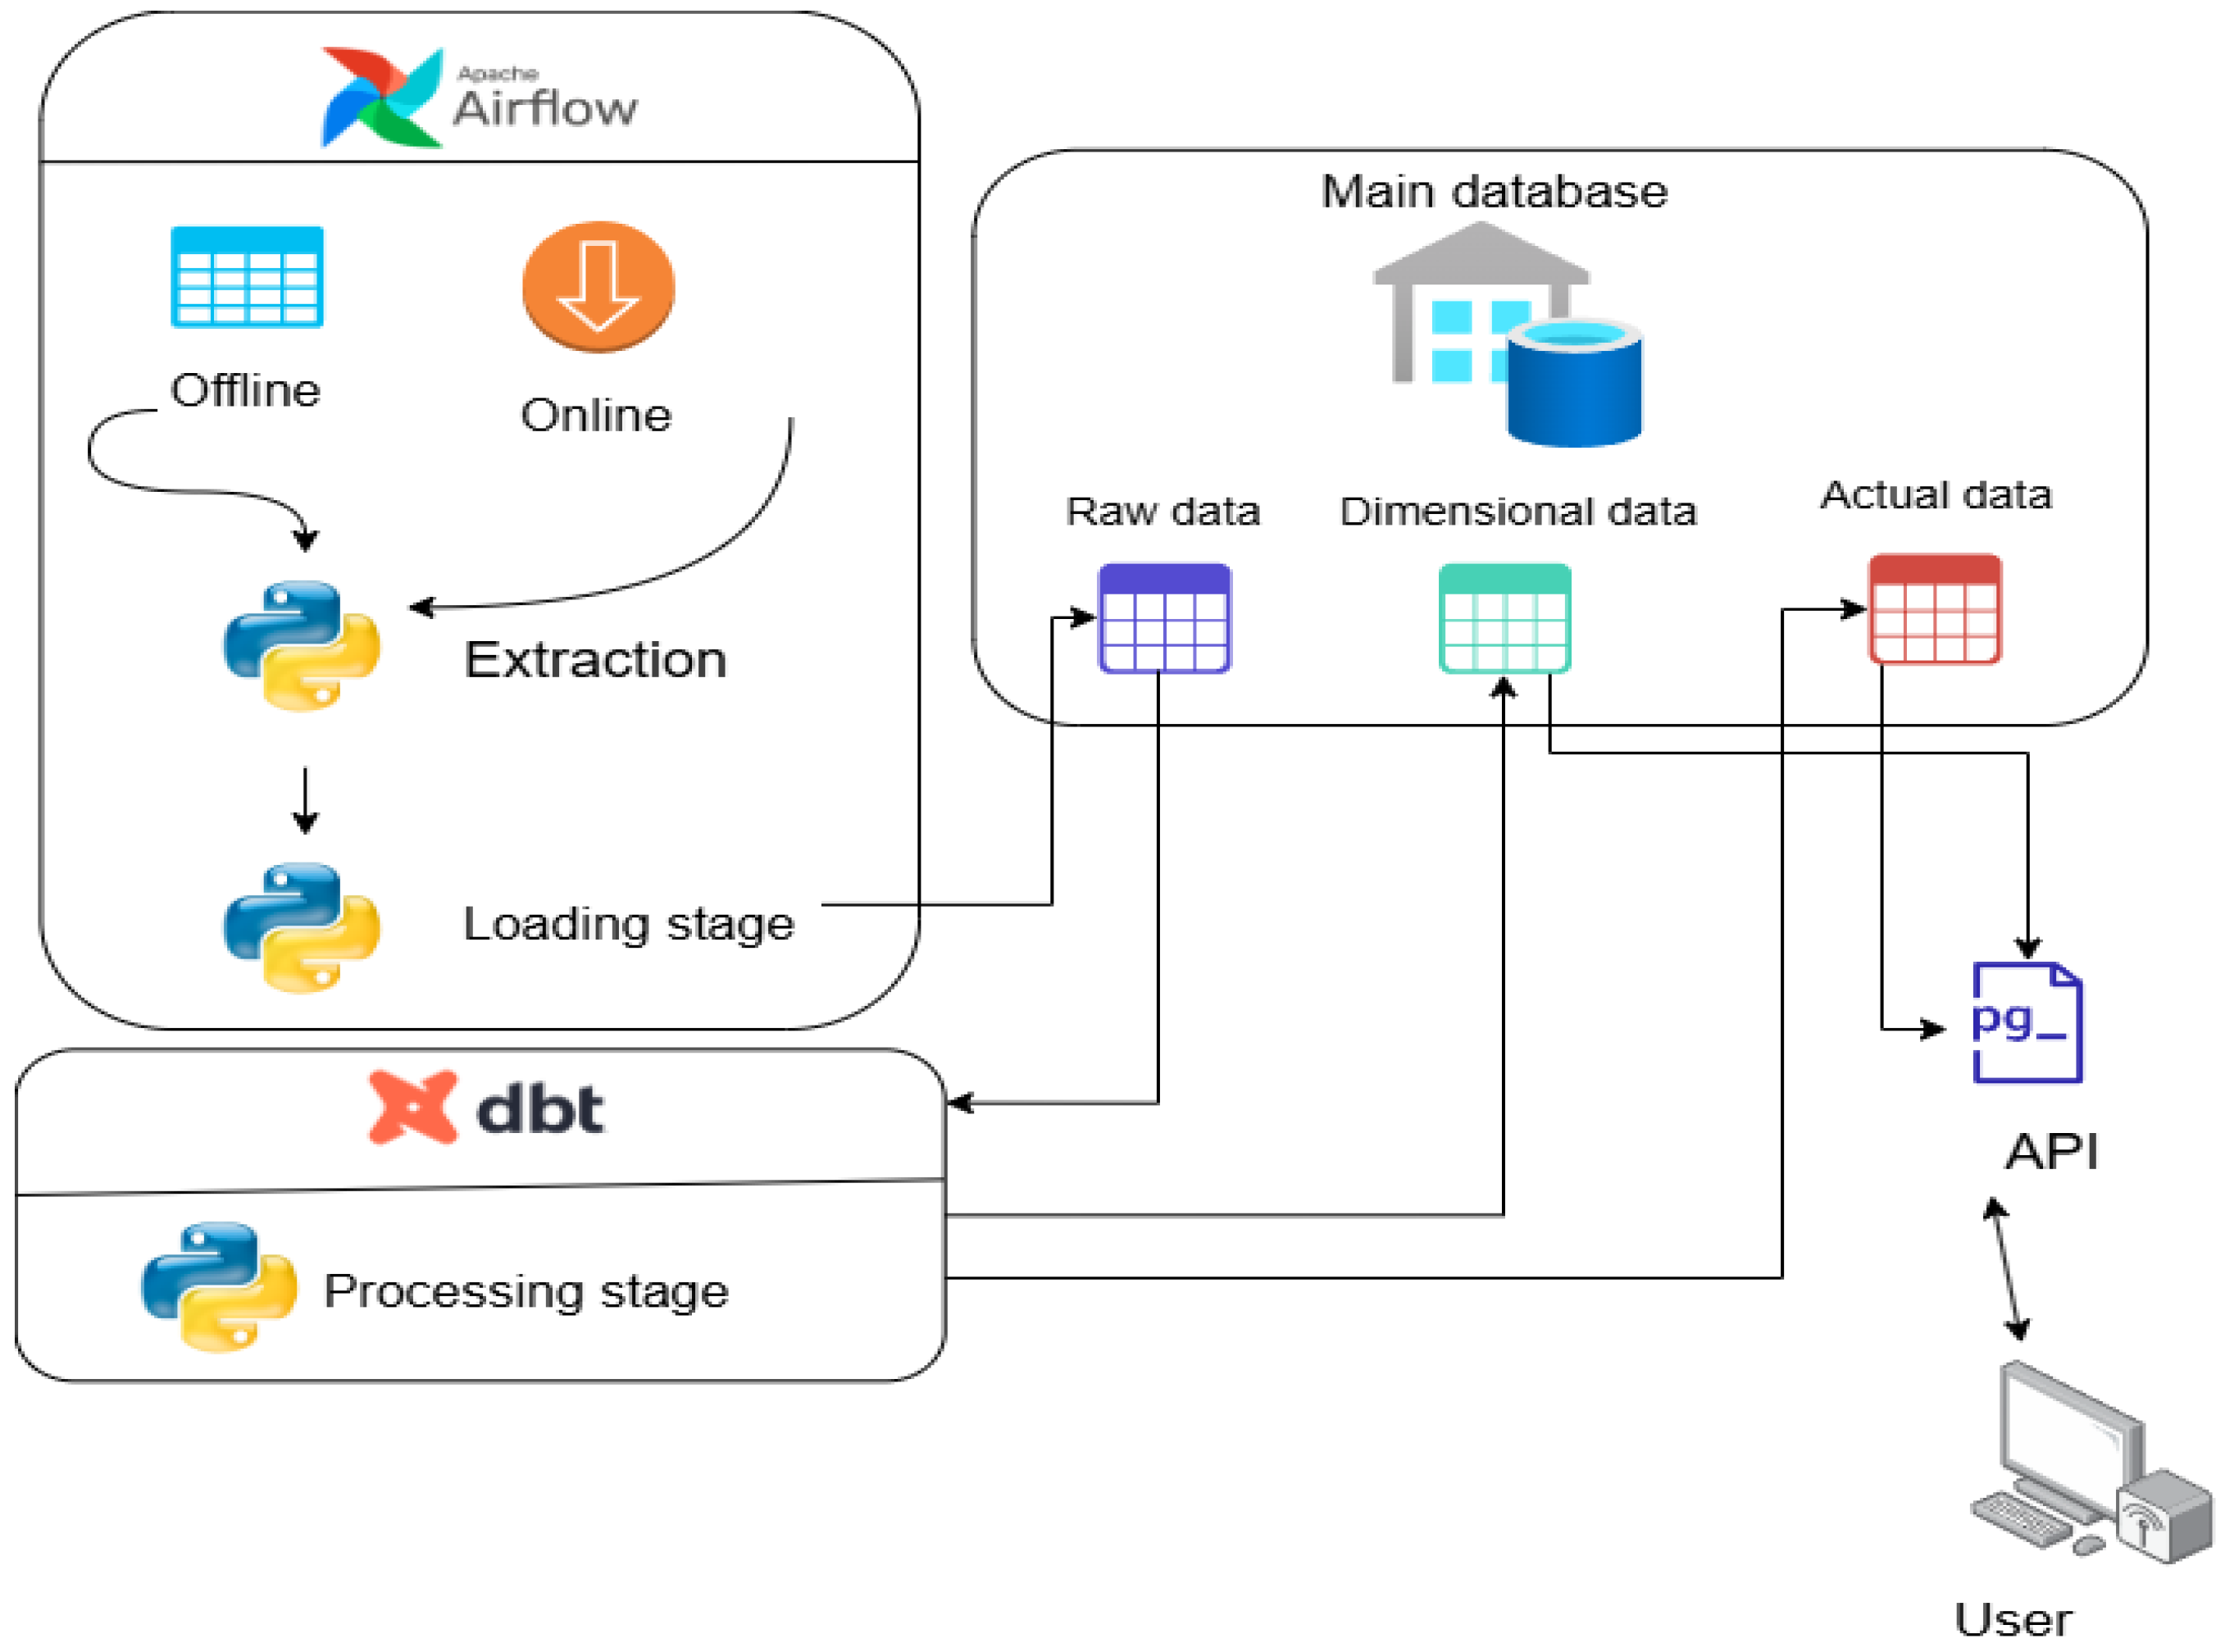
Thus, the monitoring subsystems of the EC supply information that is transmitted, processed, and stored within the IL of the KB in the form of discrete datasets, tables, or deviation models. Figure 4 shows the overall structure of the ETL processes (Extract, Transform, Load), which ensure data integration and preparation within the hybrid intelligent expert diagnostic system (HIESD).
Knowledge Base
As illustrated in Figure 4, the Information Layer (IL) of the Knowledge Base also includes offline data concerning power transformers in the form of electronic documents, including:
  • Parameters of seasonal loads and operating modes;
  • Parameters and models of PT subsystems and adjacent equipment, derived from both offline and online data sources;
  • Indicators of reliability and power quality at the power center (PC);
  • Diagnostic reports, testing protocols, and maintenance diagnostics (identified defects, control parameters).
The IL of the Knowledge Base is connected to the Analytical Complex (AC) via the Computation Comparison Module (CCM).
The Conceptual Layer (CL) of the Knowledge Base comprises the following modules:
  • Normative characteristics of subsystems;
  • “Reference models” of subsystem parameters and characteristics recorded at the start of operation;
  • Normative and reference information (NRI) concerning substation equipment in operation;
  • Tables of permissible parameter thresholds and decision-making matrices;
  • Condition-based maintenance and repair schedules.
Analytical Complex
The primary function of the Analytical Complex is to perform diagnostics of PT subsystems and optimize their operating conditions through a graphical user interface (workstation, WS), utilizing the following modules:
  • Predictive analytics, aimed at recognizing the current state of a subsystem at any given time by comparing it with a reference model and forecasting the evolution of its technical condition;
  • Residual life estimation, based on the analysis of key characteristics and parameters of PT components (e.g., voltage and load levels, PT electromagnetic field properties including no-load and short-circuit losses, gas concentrations, etc.).
Client–Server Architecture
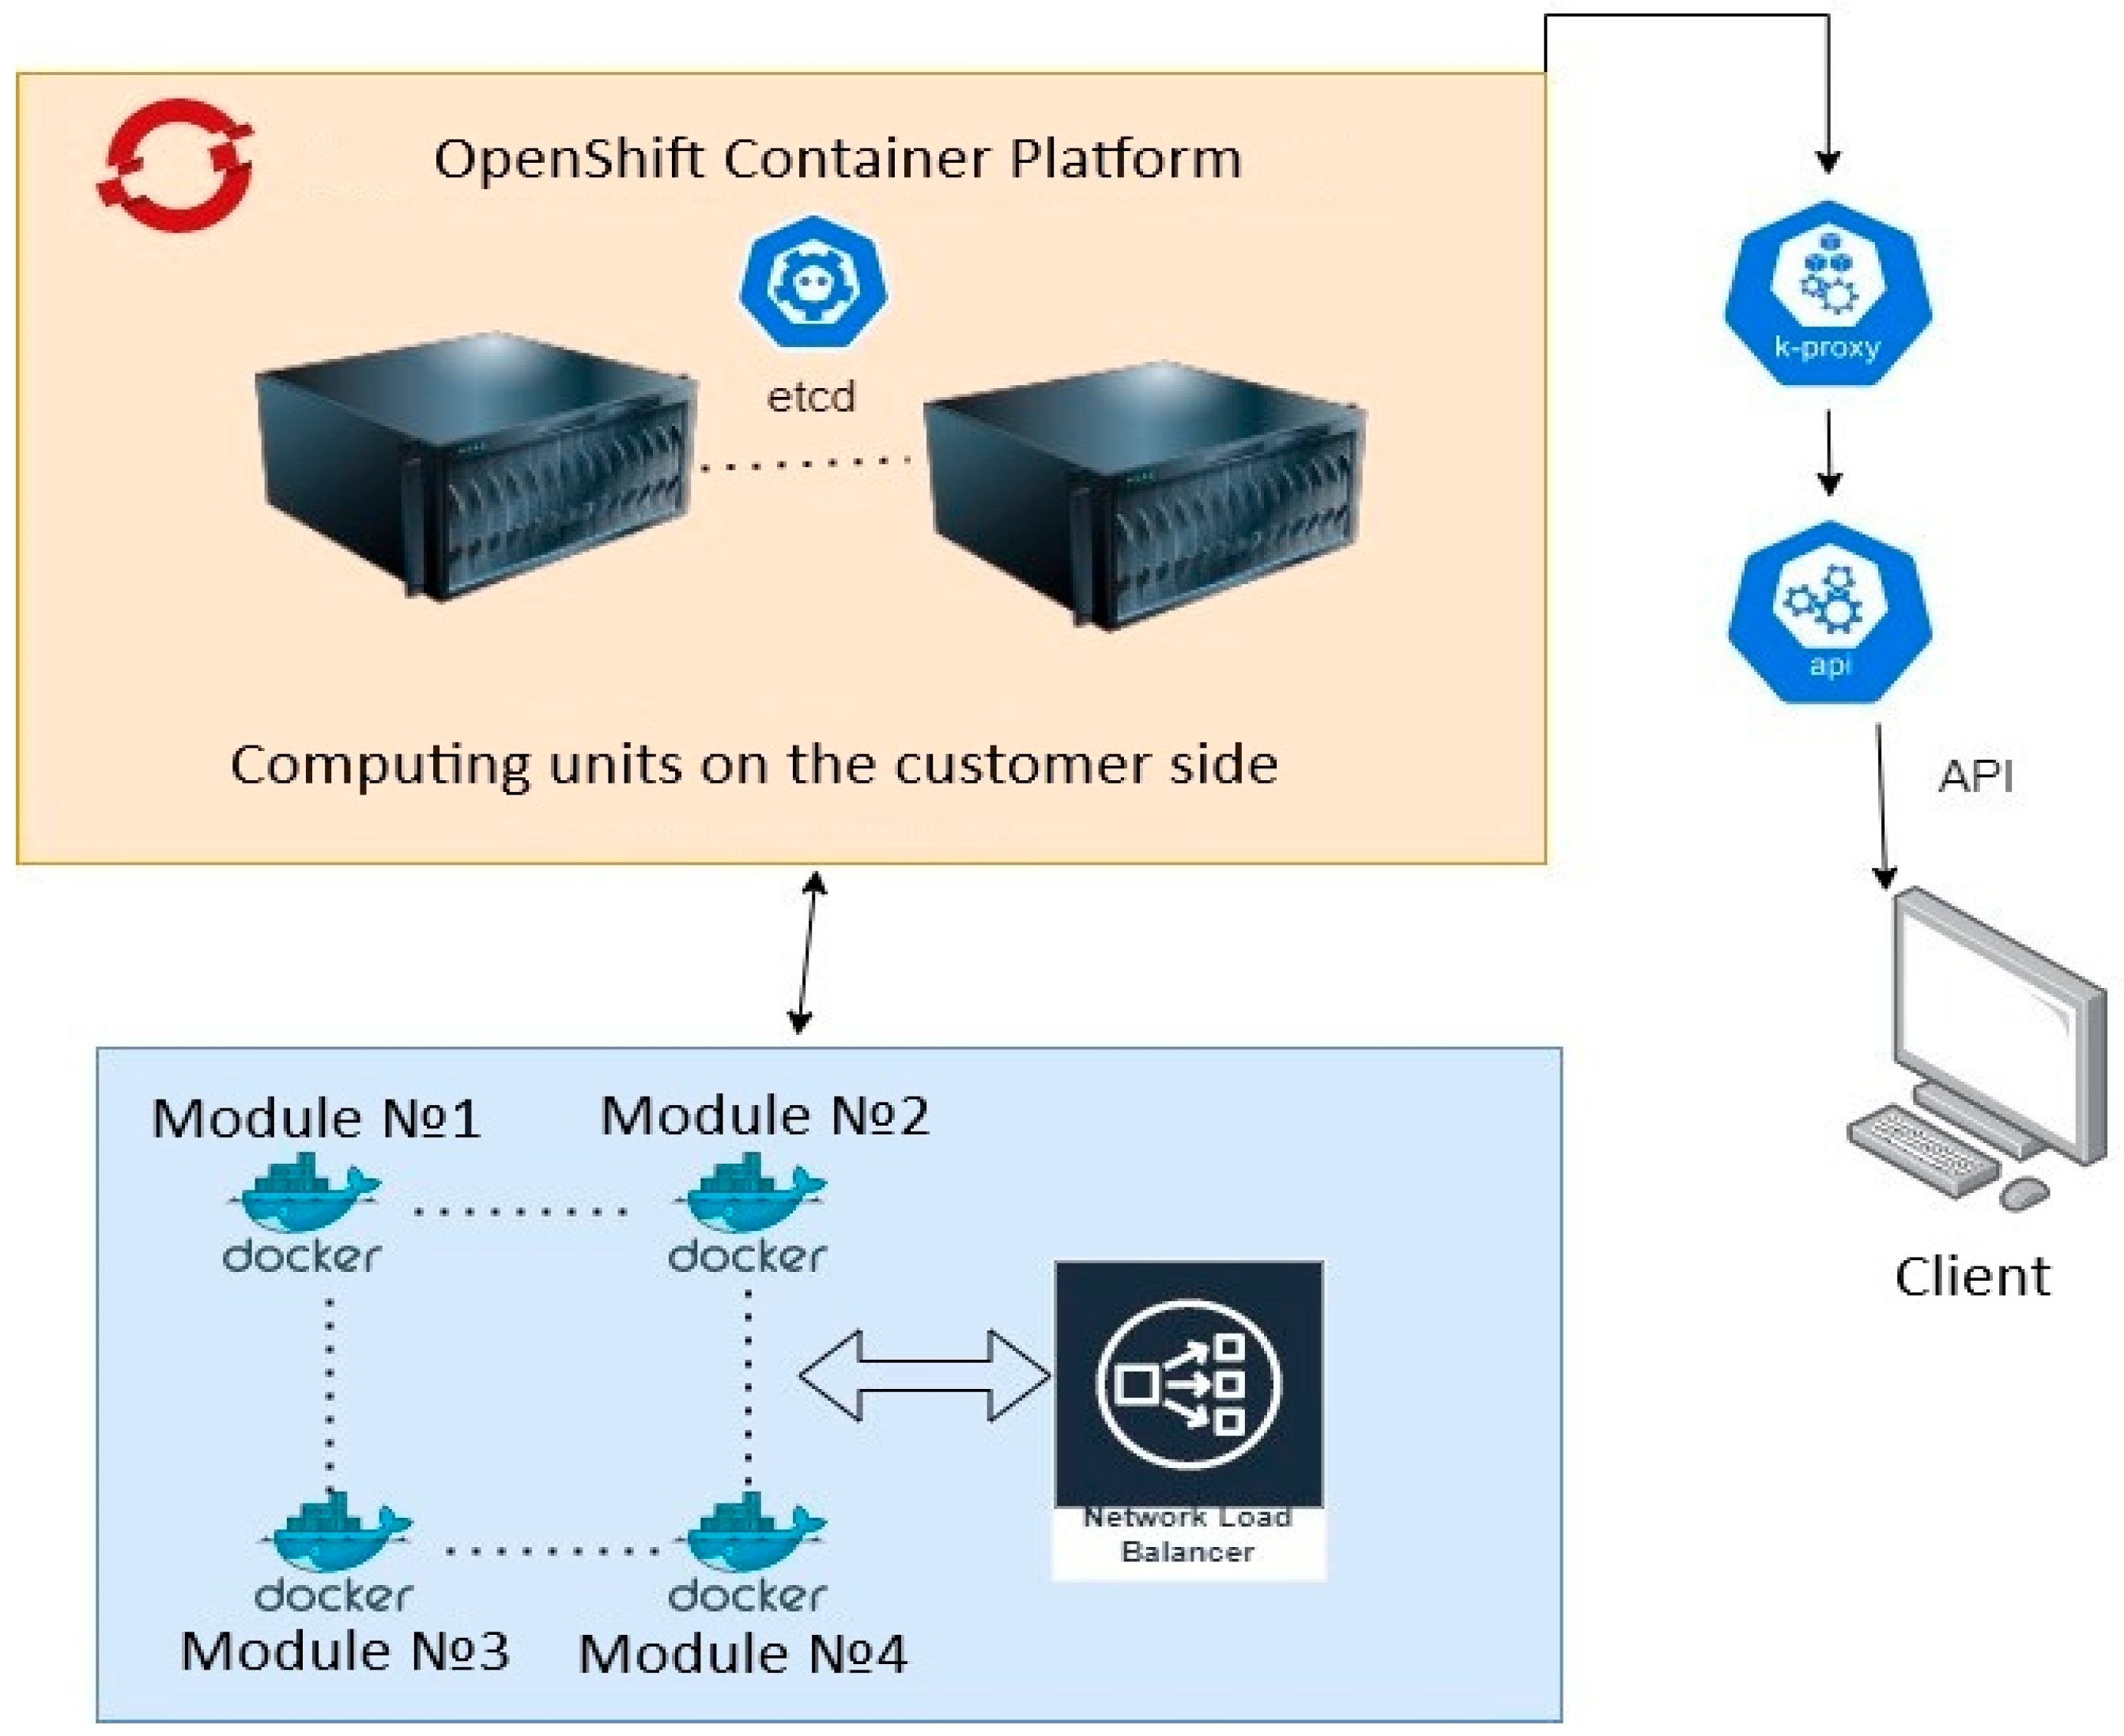
Figure 5 illustrates the client–server architecture, component management structure, and client interaction mechanisms. The advantages of this architecture include:
  • Management and scalability: The architecture employs modern orchestration and containerization methods, enabling efficient management and scalability of the system.
  • Availability and reliability: Load balancing and container-based deployment ensure high availability and fault tolerance, as local installations tend to be less reliable and more prone to failures.
  • Client interaction: Communication with clients is facilitated via an API, streamlining integration and enabling seamless network-based interaction.
In [11], a structured platform was introduced, deployed within a unified PostgreSQL-based DBMS resource. This platform stores, complements, and contextualizes the parameters and hyperparameters of neural networks, forming an efficient cluster in which each object is allocated a dedicated container. This ensures data isolation and efficient storage of all associated parameters.
The digital platform is integrated with the database system and employs a variety of algorithms and methods for data storage, retrieval, transformation, and loading, as well as for interaction with artificial intelligence (AI) models.
Many algorithms that undergo successful laboratory testing often prove unsuitable for real-world deployment. This is largely because developers frequently overlook critical integration details. Industrial environments demand a far more rigorous integration approach due to their operation with large volumes of data and strict requirements for reliability, security, and performance. While certain algorithms may function adequately in test environments, their application in production often reveals serious issues—such as incompatibility with existing information systems, incorrect data handling, or inefficiency at scale.
The approach proposed in this study is distinguished by its proactive consideration of integration with actual IT infrastructures. Specifically, it ensures correct interaction between algorithms and database systems, data storage and processing layers, and model metadata and artifact management. As a result, the developed strategy avoids common errors and enables smooth integration into existing IT systems. This provides a clear advantage, as the proposed neural network (NN) model is designed to function effectively not only in test environments but also under real-world conditions—demonstrating both reliability and performance. This is especially critical for sectors such as electric power engineering.
To this end, a dedicated platform for integrating AI models with databases was developed. This platform simplifies and automates the processes of training, retraining, and deploying neural networks in complex systems. Its primary goal is to optimize work with large volumes of system-generated data and to make AI deployment more flexible, scalable, and efficient. This is essential for fault prediction, improved equipment maintenance, workflow optimization, and overall system efficiency—particularly in environments where decision-making speed and data accuracy are of paramount importance.
The core elements of the platform include:
  • Artifacts—These are data elements generated and stored during the training and operation of AI models. Artifacts include neural network weight coefficients, training parameters, training results, and configuration files. They are essential for model reproducibility and proper deployment, allowing retraining or fine-tuning processes to be accelerated without restarting from scratch.
  • Metadata—Special data that describes the characteristics of models and their components. Metadata may include training parameters, artifact locations, and other important attributes. This information facilitates the tracking of model performance and supports full lifecycle management.
  • Datalayer—A key component that governs the interaction between AI models, data, and system logic. Its responsibilities include:
    Database queries—A module responsible for retrieving data needed for AI model operation, such as training datasets or input data for inference;
    Artifact storage and retrieval—This component ensures the storage of artifacts (e.g., model weights) and their retrieval when needed, expediting model deployment and reuse;
    Metadata management—This ensures effective control over model lifecycle and performance tracking.
  • Artifact storage—An infrastructure designed for the centralized storage of large volumes of data associated with AI models. It provides secure and efficient management of critical model data, which can be stored locally or via MongoDB-based solutions (e.g., GridFS), depending on system requirements. This storage is essential for preserving all artifacts used by the models and streamlining scalable data management.
  • Metadata storage—This component serves as a repository for critical information associated with AI models, such as training parameters, data locations, and the components and artifacts used during training. The metadata storage plays a key role in optimizing model selection, performance monitoring, and retraining processes. It also supports compliance with security and auditing requirements.
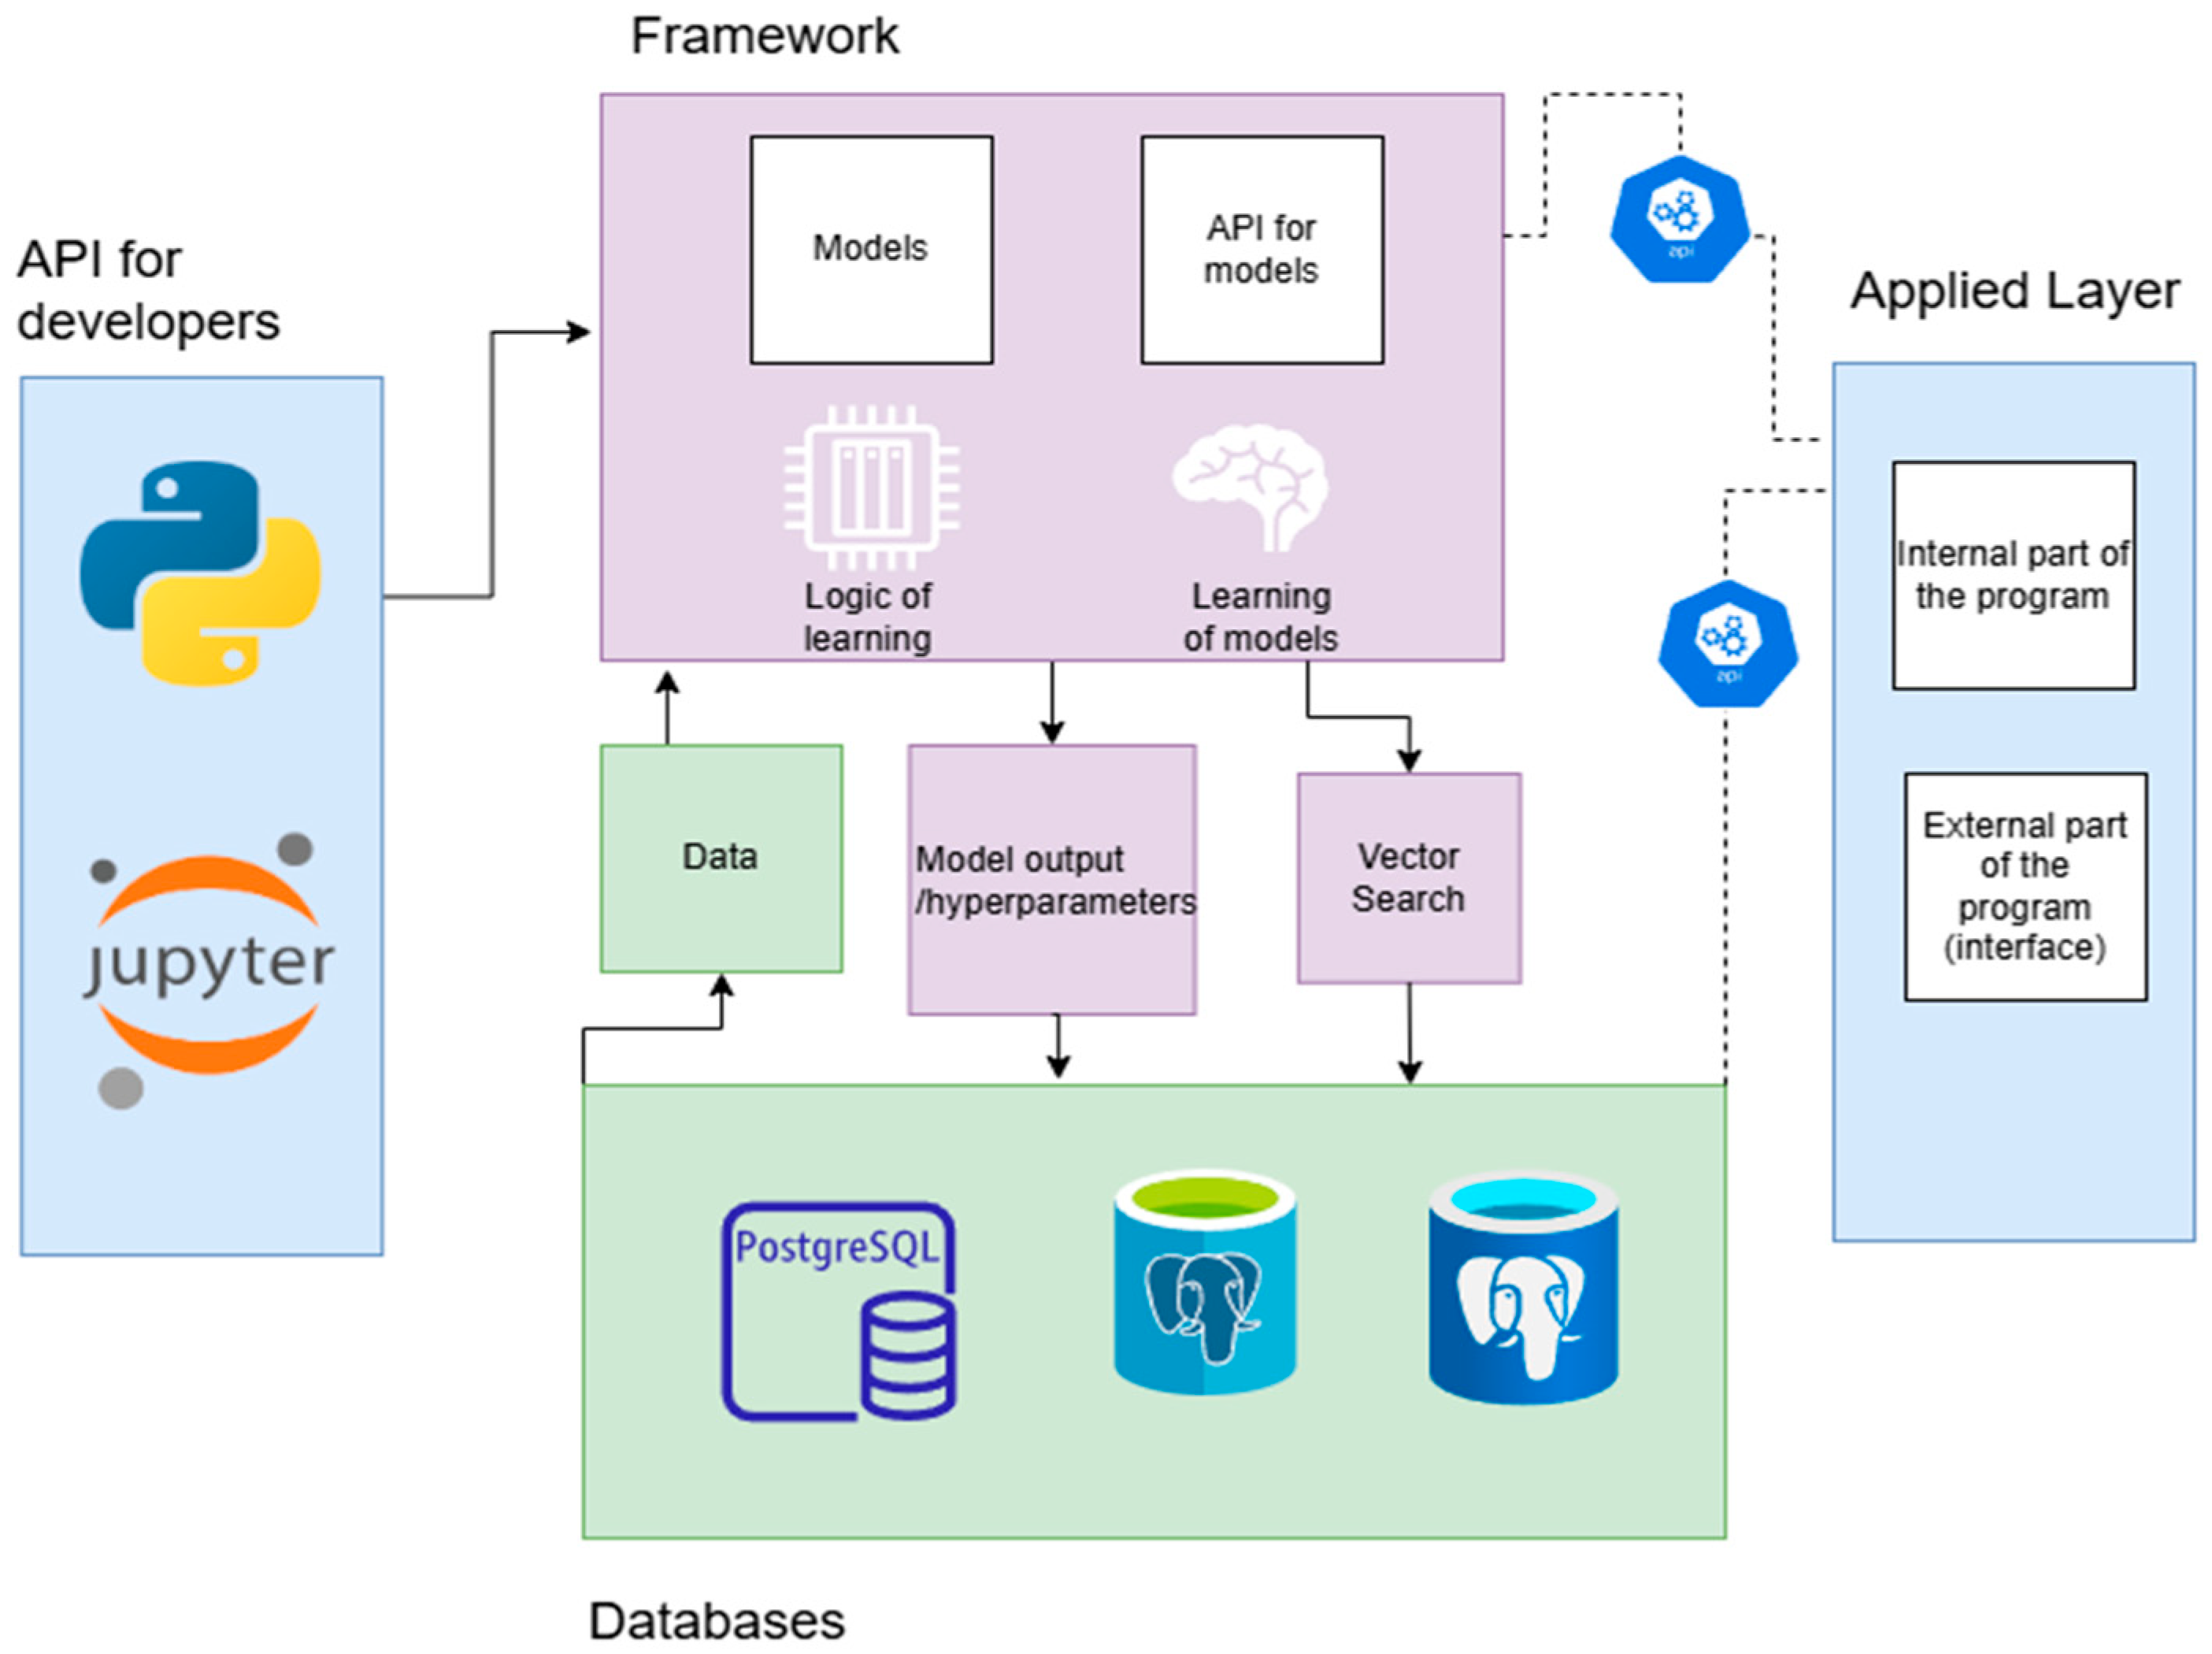
  • API layer—An interface facilitating interaction between AI models and the database. The API supports tools such as pymongo for MongoDB and ibis for SQL-based data. This interface enables efficient database querying, vector search operations, and the execution of more complex queries. By providing a unified access layer, the API integrates AI model functionality with database systems, thereby accelerating training, testing, and optimization workflows.
The developed platform brings together all the necessary components to enable seamless integration of AI models and database systems within a unified framework. This approach significantly accelerates the development and deployment of neural networks for solving tasks such as fault prediction, equipment maintenance optimization, and workflow enhancement in power systems—domains where high demands on data processing speed and accuracy are critical.
A structural diagram (framework) of the operational platform for storing and organizing multiple neural network models is presented in Figure 6.
The step-by-step development process of the system, along with its key features, is presented in a tabular format (Table 1).
Let us now describe the logic of operation of the Analytical Complex (AC) modules using Module 1 and Module 2 as examples.
Module 1 is responsible for solving one of the most complex tasks: the classification of fault types in a power transformer based on data from the insulation subsystem. This involves the analysis of a large volume of input data, including retrospective dissolved gas analysis (DGA) records and data from online gas analyzers.
As previously noted, contemporary diagnostic studies primarily rely on machine learning techniques. Among the most effective tools in this domain are neural networks (NNs).
We begin by focusing on an important property of diagnostic algorithms: computational efficiency. In many publications, authors propose highly accurate yet computationally inefficient algorithms, particularly problematic under high-load conditions. For instance, algorithms based on Radial Basis Functions (RBF) [82] demonstrate excellent performance in solving differential equations [83]; however, they exhibit a notable weakness due to the computational overhead associated with dense linear systems. As stated in the literature, “…for global RBF methods, one of the main disadvantages is the computational cost linked to dense linear systems…”.
This issue is also evident in numerous studies involving neural networks. Typically, a model is trained on a given dataset; however, the trained model is seldom validated under real-world information conditions, where extremely high volumes of online data may be encountered. Developers frequently overlook data stream scalability—a critical factor given that the data volumes in operational environments may far exceed those used for model training or benchmarking.
A classical example that illustrates this problem is the traveling salesman problem [84,85,86]. With a small number of cities (e.g., 10), a brute-force algorithm can enumerate all permutations to find the optimal route. However, when the number of cities increases to 50 or 100, exhaustive search becomes computationally infeasible. This challenge led to the emergence of discrete mathematics and operations research, disciplines that introduced the trade-off between solution accuracy and computational feasibility. In practice, a slight reduction in accuracy is often acceptable in exchange for significant gains in processing time and resource efficiency.
The advancement of technologies such as neural networks has sparked growing interest among specialists and research teams in applying these methods to complex industrial tasks. However, these technologies are often adopted without appropriate adaptation to the characteristics of existing diagnostic data. In many cases, models are deployed “out of the box” without accounting for domain-specific constraints. Consequently, the results obtained through such practices are not always reproducible, verifiable, or suitable for practical implementation.
In general, it can be concluded that many existing approaches to diagnostic data processing lack universality. As a result, each research group often “reinvents” original methods that do not always reach the stage of practical implementation.
The authors of the present study share their experience in solving the problem of interpreting dissolved gas analysis (DGA) data obtained from online chromatographs installed on a fleet of power transformers. During early experimentation, feedforward neural networks (perceptrons) were employed. Several configurations with varying numbers of neurons and layer arrangements were tested in order to identify the optimal network structure. Key factors in selecting the neural network architecture included the volume of the training dataset and the model’s generalization capability on unseen data. Training was typically carried out using the backpropagation algorithm with a validation set.
Although the developed models were initially ready for deployment, integration into real-time data streams revealed that the processing time for a single iteration was approximately 30–40 s. Given the large number of monitored assets and limited computational resources, it became clear that traditional approaches could not deliver the required performance and were therefore unsuitable for practical use.
As a result, both the training algorithm and neural network architecture had to be optimized. Additionally, improvements were made to the formats for storing hyperparameters and data values, and computational load balancing strategies were introduced—utilizing data lakes and message brokers, which are essential components of any high-load system.
Following a series of tests, Probabilistic Neural Networks (PNNs) [87] were selected as the preferred solution. Compared to multilayer perceptrons (MLPs), PNNs offer several notable advantages:
  • Significantly faster operation than MLPs;
  • Potentially higher classification accuracy;
  • High robustness to noisy data;
  • Precise probabilistic estimation of target values;
  • Approximate implementation of Bayes-optimal classification.
The primary disadvantages of PNNs include:
  • Slower classification of new inputs compared to perceptrons;
  • Increased memory requirements to store the trained model.
In the context of the task at hand, the first drawback is not critical, since classification is performed over a closed set of states (specifically, four “standard” DGA-based defect categories), with no requirement to adapt to novel classes.
The second limitation relates more to IT architecture than to the machine learning algorithms themselves. It can be effectively mitigated through proper database organization and system scaling—both vertical and horizontal.
Based on the considerations outlined above, the authors undertook the development of a hybrid intelligent expert system for oil-filled power transformers featuring an optimized architecture. It is anticipated that the adoption of this conceptual framework will enable the timely detection of transformer defects, prevent critical failures, and extend the actual service life of the equipment.
Next, let us consider several practical aspects of using Probabilistic Neural Networks (PNNs).
PNNs are a type of neural network designed for classification tasks, where class membership probability densities are estimated through kernel approximation techniques. These networks are particularly effective in handling uncertainty and noise in data—a crucial feature when analyzing defects, as the input data may often be incomplete or corrupted.
Another important advantage of PNNs is their flexibility and scalability. They can be constructed in a modular fashion and expanded easily to incorporate new defect types or additional data sources without requiring a complete system redesign. Moreover, PNNs can interact with expert systems to improve decision-making accuracy and even forecast defect progression, which is especially relevant given that all models will ultimately be integrated into a unified expert system.
In our implementation, the PNN consists of three layers: an input layer, a radial (hidden) layer, and an output layer. At the radial layer, a separate unit (kernel) is created for each training sample, represented by a Gaussian function centered on that sample. Each class is associated with a dedicated output neuron, which connects exclusively to the radial units corresponding to samples of that class. The output neuron computes the sum of the responses from all its class-specific radial units.
A significant enhancement was introduced by adding an additional layer incorporating a loss matrix. This layer multiplies the vector of class probabilities produced by the previous layer by coefficients that reflect the relative importance of different types of classification errors. This adjustment enabled recalibration of class probabilities (corresponding to the four DGA defect states) to minimize the risk of critical misclassifications—particularly vital in scenarios where overlooking a transformer fault could lead to severe consequences.
The integration of this loss matrix layer substantially improved the reliability of our diagnostic system. Now, the network not only classifies samples correctly but also considers the potential impact of errors, reducing the likelihood of failures and optimizing costs by avoiding unnecessary inspections of healthy equipment. Furthermore, this loss matrix approach can be generalized and applied to other classification problems, enhancing the adaptability and flexibility of our method.
PNNs are governed by a single key training parameter—the smoothing factor σ (the standard deviation of the Gaussian kernel)—which must be selected by the user. The following formula is used to calculate its value:
g ( x ) = i = 1 n exp x x i 2 σ 2
where g(x)—output function of the probabilistic neural network;
σ—smoothing parameter (standard deviation of the Gaussian kernel);
xi—the i-th training example;
x—input vector (new observation);
x x i —Euclidean distance between the input vector x and the training example.
Extremely small values of the smoothing parameter σ lead to the creation of “sharp” approximating functions, which reduce the network’s ability to generalize. Such sharp approximations cause overfitting, wherein the model reproduces the training data too precisely, losing its capacity to generalize to new data. Conversely, excessively large σ values may result in the loss of important data details.
Determining an appropriate value for σ by trial and error is challenging because it requires minimizing error on a validation dataset. PNNs are highly sensitive to the choice of this smoothing parameter, which motivated the development of a dedicated optimization algorithm described in [88]—the Moth Flame Optimization (MFO) algorithm.
We improved the original MFO algorithm by replacing traditional spiral trajectories with linear ones and by introducing a chaotic operator to enhance global search capabilities [11,89]. These modifications enabled the algorithm to more effectively avoid getting trapped in local minima, thus improving its ability to find global optima. Consequently, this approach ensures more accurate tuning of the smoothing parameter, minimizes model errors, and enhances the model’s generalization capacity.
The enhanced MFO algorithm has become more flexible and robust for solving complex optimization problems where conventional methods may fail. The overall workflow of the algorithm is illustrated in Figure 7.
Thanks to this methodology, it becomes possible to identify the optimal relationship between algorithm parameters while accounting for their permissible levels of seasonality and the presence of various noise outliers.
As a result, an original configuration of the Probabilistic Neural Network (PNN) was constructed. The primary distinction of the developed diagnostic process—or model creation approach—from the other methods described above lies in the high efficiency of the implemented algorithms relative to the computational resources they require and the accuracy they achieve. In other words, the diagnostic accuracy obtained per unit of computational power is acceptable or even notably high, as demonstrated in our case.
Earlier, in Table 1, comparative characteristics of the hardware implementation processes for these algorithms were presented.
The stages of the neural network development process, along with their key features, are summarized in Table 2.
Specific aspects of the author’s solution within the software framework are presented in Table 3.
Module 2. Algorithm for Diagnosing the Electromagnetic Parameters of the Transformer
1.
Nominal transformer parameters are entered:
1.1.
Nominal voltages and currents: U1nom, I1nom, U2nom, I2nom.
1.2.
No-load parameters (current and losses): i0, P0.
1.3.
Short-circuit parameters (impedance and losses): Zk, Pk.
2.
Measurement and accumulation of instantaneous values of operating currents and voltages of the windings are performed:
(u1)1, (u1)2 … (u1)m;
(i1)1, (i1)2 … (i1)m;
(u2)1, (u2)2 … (u2)m;
(i2)1, (i2)2 … (i2)m,
where m = T Δ t ,   T = 2 π —period, Δ t = 10 6 10 5 .
3.
Vectors of instantaneous values are formed:
us = [(us)1, (us)2 … (us)m]t
is = [(is)1, (is)2 … (is)m]t,
where s = 1, 2.
4.
The root-mean-square (RMS) values and phase shifts in the operating currents and voltages are calculated:
Us = m−1/2[(us)t, (us)]1/2
Is = m−1/2[(is)t, (is)]1/2,
ϕ U 1 = 0 .
ϕ A S = arccos ( u 1 ) , ( a s ) ( u 1 ) , ( u 1 ) 0.5 ( a s ) , ( a s ) 0.5
where As = U2, I1, I2; as = u2, i1, i2; [(u1)′, (as)], [(u1)′, (u1)]0.5, and [(as)′, (as)]0.5—denote scalar products of the corresponding vectors.
5.
The electromagnetic parameters are calculated based on simplified modeling:
( Y 11 ) 0 = I 1 e i ϕ I 1 U 1 k r U 2 e i ϕ U 2       ( Y 22 ) 0 = I 2 e i ϕ I 2 U 2 ( k r ) 1 U 1 e i ϕ U 1
where k r = I 2 e i ϕ I 2 I 1 e i ϕ I 1
( Z 11 ) 0 = U 1 e i ϕ U 1 I 1 k z I 2 e i ϕ I 2       ( Z 22 ) 0 = U 2 e i ϕ U 1 I 2 ( k z ) 1 I 1 e i ϕ I 1
where k z = U 2 e i ϕ U 2 U 1 e i ϕ U 1
6.
Based on the calculated values (Y11)0, (Y22)0, (Z11)0, (Z22)0, all possible diagnostic parameters are determined (Table 4).
7.
Steps 2–5 are repeated for the next measurement cycle, and the data from different cycles are assigned an additional superscript corresponding to the cycle number: (U1)2 … (Z22)02
8.
Matrices of variables are formed:
U = ( U 1 ) 1 ( U 1 ) 2 ( U 2 ) 1 ( U 2 ) 2 I = ( I 1 ) 1 ( I 1 ) 2 ( I 2 ) 1 ( I 2 ) 2 V 1 = ( U 1 ) 1 ( U 1 ) 2 ( I 1 ) 1 ( I 1 ) 2      V 2 = ( U 2 ) 1 ( U 2 ) 2 ( I 2 ) 1 ( I 2 ) 2
9.
The matrices of Z, Y, and A parameters are calculated:
9.1.
ZI = UI−1  YI = (ZI)−1
9.2.
YU = IU−1  ZU = (YU)−1
9.3.
H1V1 = V2(V1)−1
H 1 V 1 = A V 1 B V 1 C V 1 D V 1
Z V 1 = 1 C V 1 A V 1 1 1 D V 1     Y V 1 = 1 B V 1 D V 1 1 1 A V 1
9.4.
H2V2 = V1(V2)−1
H 2 V 1 = D V 2 B V 2 C V 2 A V 2
Z V 2 = 1 C V 2 A V 2 1 1 D V 2     Y V 2 = 1 B V 2 D V 2 1 1 A V 2
10.
Diagnostic parameters are calculated (see Table 4 [47]).
11.
Graphs showing the temporal dependence of the diagnostic parameters being determined are constructed, as well as other options for presenting (processing) diagnostic information.
Accounting for Transformer Nonlinearity and Nonsinusoidal Currents and Voltages
1.
Accounting for nonsinusoidality. Nonlinearity, external influences, and the nature of the load cause distortions of the sinusoidal shape of voltages and currents, which complicates the use of the phasor method for the mathematical description of electromagnetic processes and requires adjustments to the developed transformer models. To overcome these difficulties, the method of equivalent sinusoids is usually applied; however, this method has certain peculiarities, neglecting which leads to calculation errors.
In the present work, the method of “orthogonal time coordinates” developed by Academician K. S. Demirchyan [45] is used—a method that is both physically well-grounded and mathematically convenient. In this method, the time functions (currents and voltages) are represented as vectors in a linear space, where each time instant serves as an independent coordinate of a multidimensional orthogonal Euclidean coordinate system. In this representation, the instantaneous values of currents and voltages are treated as the projections of these vectors. Accordingly, the root-mean-square values of currents and voltages are given by:
I = 1 T 0 T i 2 d t = 1 m j = 1 m i 2 = m 1 / 2 ( i t , i ) 1 / 2 ,
U = 1 T 0 T u 2 d t = 1 m j = 1 m u 2 = m 1 / 2 ( u t , u ) 1 / 2 ,
where u = u ( t 1 ) , , u ( t m ) t ;   i = i ( t 1 ) , , i ( t m ) t ; m = T / Δ t (∆t is the discretization step of the time interval T); ( i t , i ) , ( u t , u ) —denotes the scalar product of vectors; t—denotes transposition. The active power is calculated as
P = 1 T 0 T u i d t = 1 m j = 1 m u i = m 1 ( u t , i ) = m 1 ( i t , u )
Phase shift between the voltage and current vectors:
φ = ( u , i ) = arccos P U I = arccos m 1 ( u t , i ) m 1 / 2 ( u t , u ) 1 / 2 m 1 / 2 ( i , i ) 1 / 2 = arccos ( u t , i ) ( u t , u ) 1 / 2 ( i t , i ) 1 / 2
Thus, all complex expressions become applicable, which is utilized in the algorithm presented above.
2.
Accounting for nonlinearity. The transformer’s nonlinearity leads to difficulties in comparing data from different operating modes. In particular, the no-load and short-circuit parameters of a real transformer correspond to different linear models and therefore are not mutually consistent. This also results in a mismatch between the transformer impedance measured under load conditions and in a short-circuit test. Therefore, an essential task is to develop a methodology for reconciling the different modes (modes with different levels of core magnetization). A practical implementation of this approach is presented below.

3. Results and Discussion

Below, we present examples of the interaction between the executable files and the analytical models of the HIESD complex in solving specific tasks of state identification and parameter calculation for transformer subsystems.
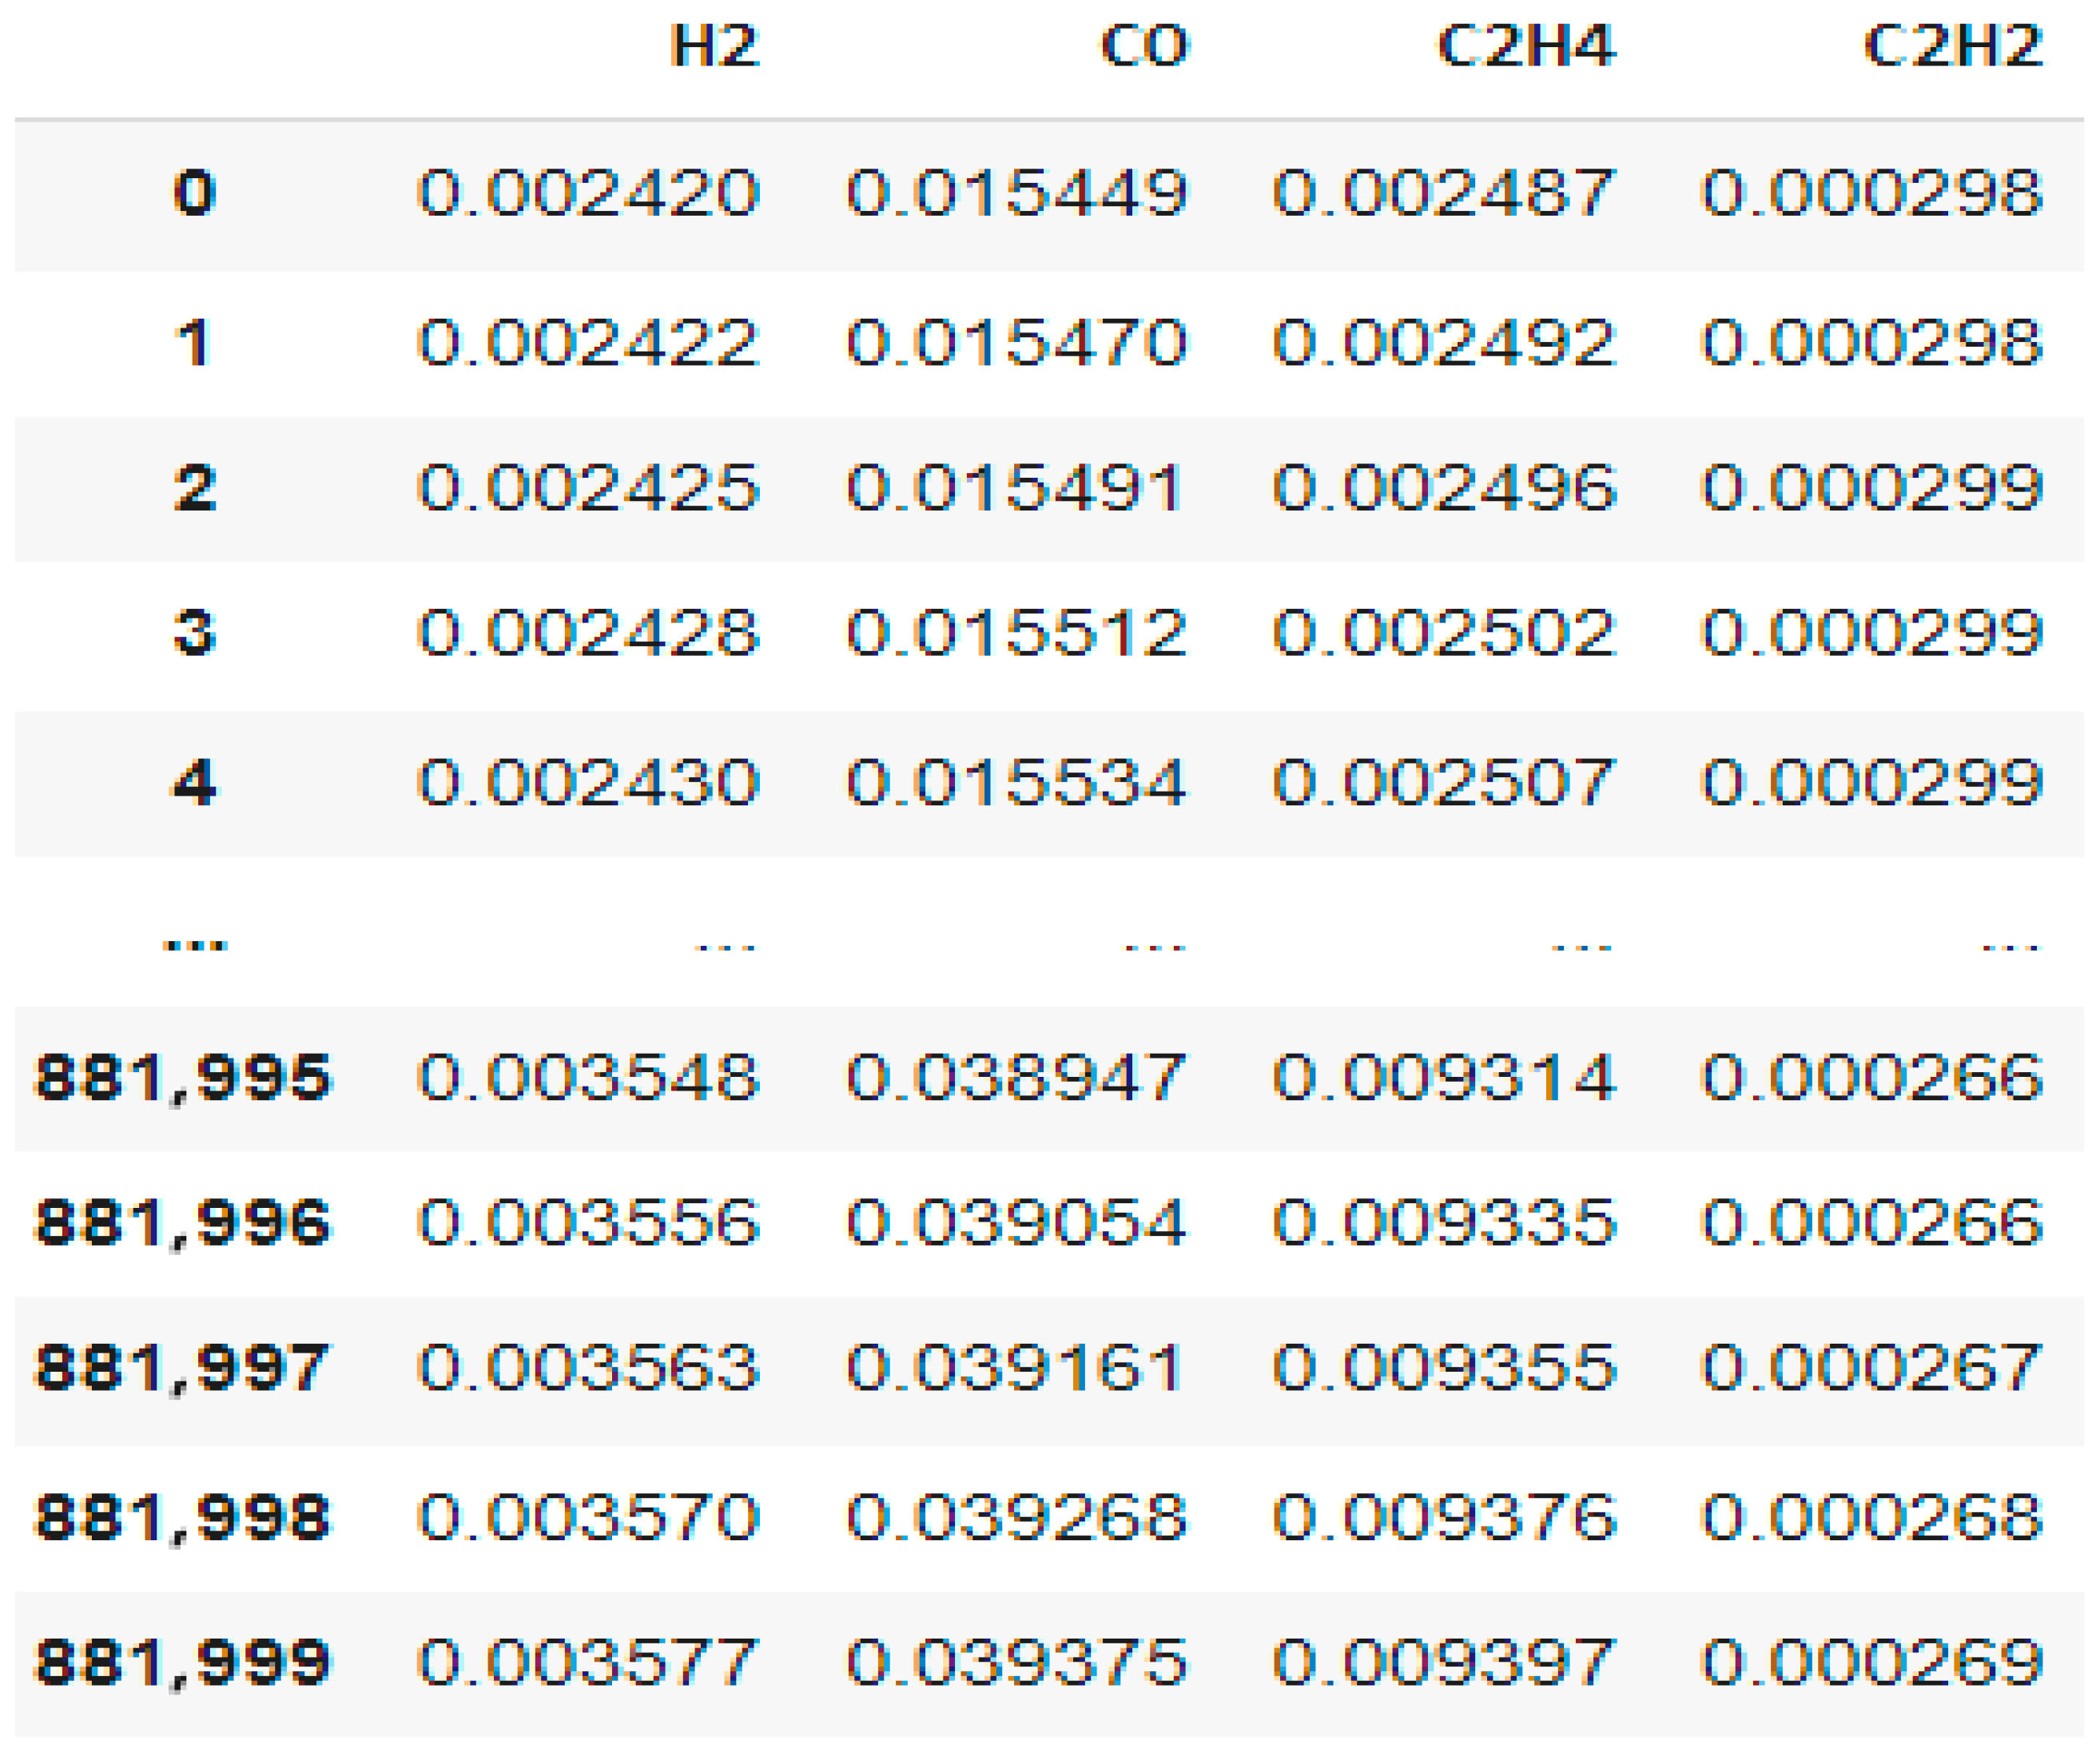
Module 1. An example of time series analysis of dissolved gases in oil is presented (Figure 8).
The first column—Index—contains transformed data reflecting the chronology of measurements from the beginning to the end of the observation period. The subsequent columns represent the concentrations of gases, which serve as input indicators for the built-in defect classification algorithm within the model.
The initial training data were labeled according to the following condition categories:
  • Normal Operation (NW): The system operates without any anomalies or signs of malfunction. This state is characterized by stable and correct functioning of the equipment.
  • Partial Discharge (PD): This condition indicates the presence of a partial electrical discharge within the system, which may serve as an early indicator of wear or impending failure. Timely detection of such conditions is crucial for preventing serious faults, as outlined in [90] (see Table 2, Item 1—“Typical Defects in Power Transformers and Reactors”).
  • Low-Temperature Overheating (LT): This state implies that the system is experiencing overheating, albeit at relatively low temperatures. It may signal the onset of insulation degradation—a thermal defect with temperatures below 300 °C, as specified in Table 2, Item 4 [90].
  • Combined Partial Discharge and Low-Temperature Overheating (LPD): This state reflects the simultaneous occurrence of partial discharge and low-temperature overheating. It is a complex condition that may indicate more severe underlying issues within the system—representing a combination of Items 4 and 1 in Table 2 [90].
A concept termed the “Condition Index” was introduced, with discrete values ranging from 1 to 5. Table 5 presents the Condition Indices of the transformer as determined from DGA results. The proposed classification is conditional and was developed to facilitate interpretation and analysis of transformer condition within the context of the task at hand. Depending on the specific system and diagnostic methodologies applied, this classification may be adapted or revised. Other approaches to defect classification exist, employing different criteria or boundaries between condition categories. This ensures flexibility and enables the system to be tailored to various operational and maintenance scenarios.
Figure 9 presents an example demonstrating how the trained model was able to predict in advance states 4 and 5, i.e., approximately between LPD and PD, which are considered deviations from the norm. It can be observed that the model enables the early forecasting of a potential failure scenario.
Let us now consider the performance metrics for both models:
(1)
The DGA data prediction model based on the current time series (LSTM network);
(2)
The defect classification model (Probabilistic Neural Network—PNN).
To evaluate the prediction accuracy of LSTM networks, various metrics are typically used. The most commonly applied ones, as used in our developed LSTM network, are shown in Figure 10.
The diagram demonstrates three key metrics for evaluating the LSTM model that predicts time series data:
MAE (Mean Absolute Error)—a value around 0.8 indicates reasonably accurate model performance, especially for time series where small errors may be acceptable depending on the nature of the data.
MSE (Mean Squared Error)—also close to 0.8, which is a positive sign as it demonstrates the model’s robustness against large errors. This means the model avoids significant mistakes, which is important for time series where large errors can greatly affect forecasts.
RMSE (Root Mean Squared Error)—slightly above 0.8, which is a good result for the task at hand.
Overall, the LSTM model shows stable performance by minimizing both average and large errors. Low MSE and RMSE values indicate that the model is not prone to serious deviations, which is crucial when working with time series data where such deviations could significantly distort long-term forecasts. MAE and MSE values below 1 confirm the model’s high prediction accuracy, which is especially useful in real-world forecasting scenarios, particularly if the data contain regular trends or seasonal components.
The advantages of the developed system include simplifying and automating AI-related processes, enhancing existing database capabilities, saving time and resources required for integration and data processing, and ensuring flexibility and scalability when working with neural network models and data.
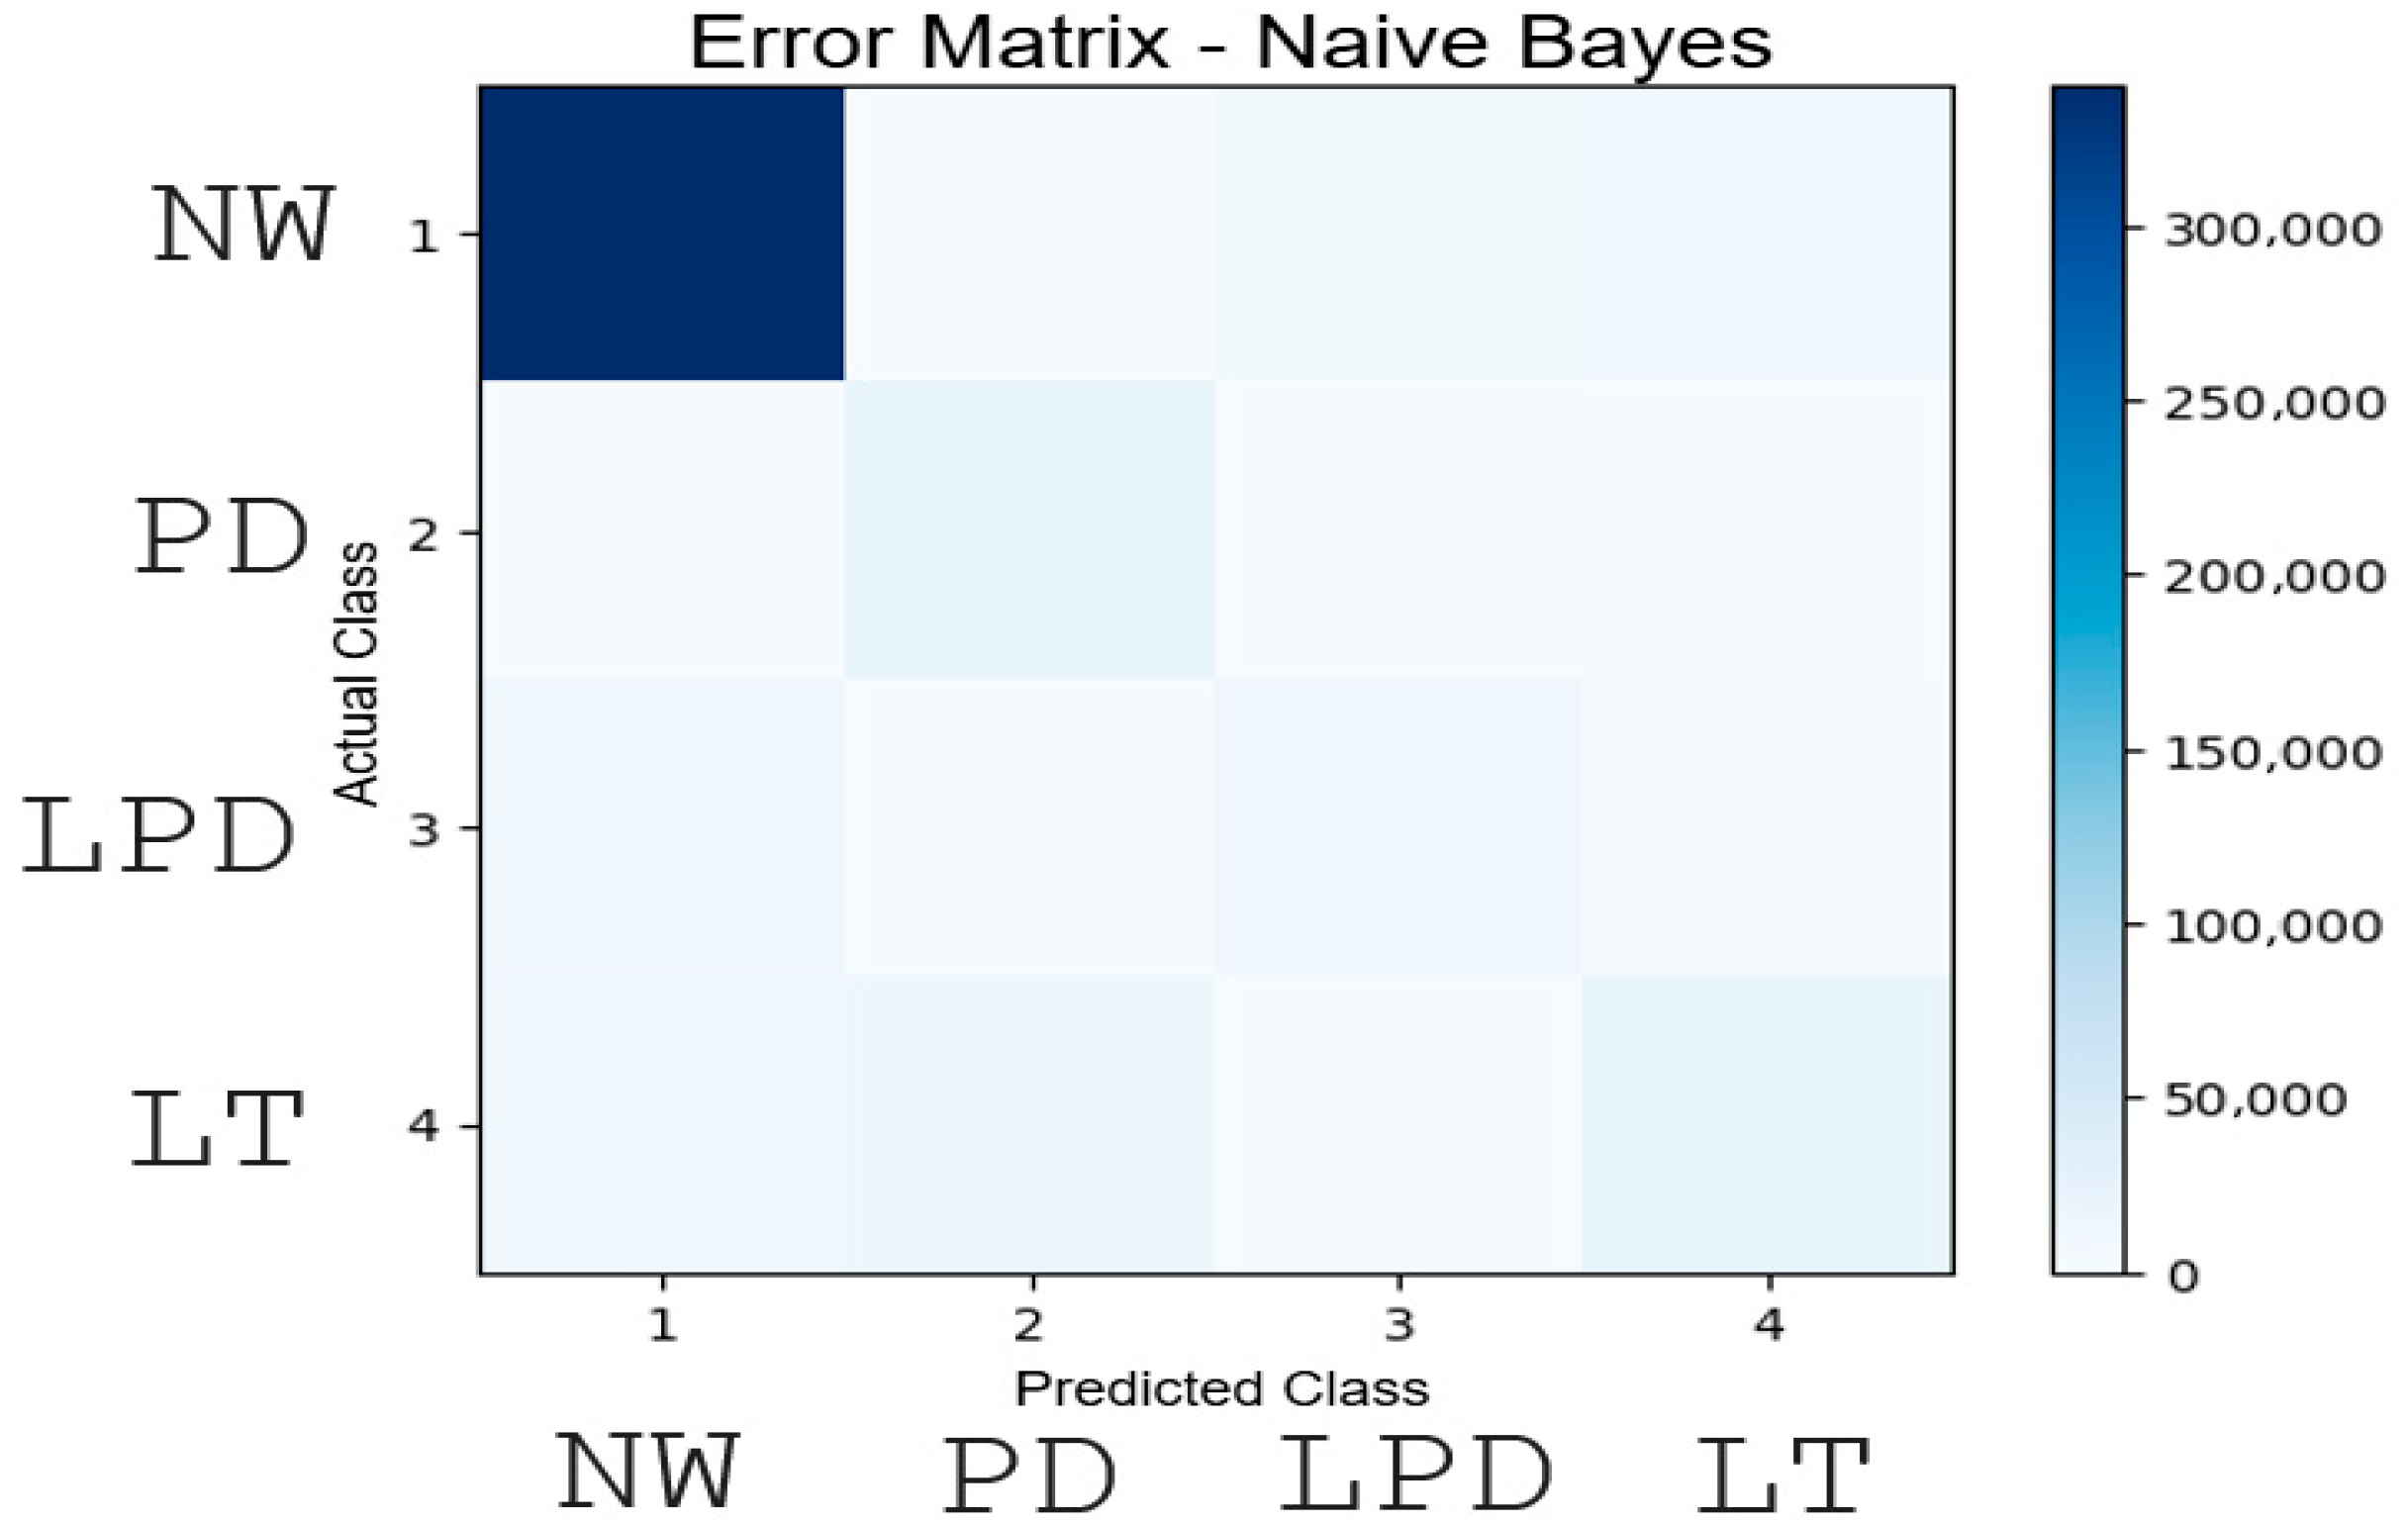
To evaluate the quality of the Probabilistic Neural Network (PNN) model in practice, a confusion matrix obtained from testing on real data is typically used. Figure 11 presents the confusion matrix for the developed Naive Bayes model, which classifies the condition states of diagnosed transformers into four classes originally labeled in the DGA data:
  • NW (Normal Operation);
  • PD (Partial Discharge);
  • LPD (Combination of Partial Discharge and Low-Temperature Overheating);
  • LT (Low-Temperature Overheating).
The confusion matrix shows that the model classifies the NW state very accurately, which is reflected by the dark cell in the (NW, NW) position. The other classes contain almost no errors, indicating the model’s confident performance in classifying all states.
Table 6 presents a summary of various quality metrics for prediction using the probabilistic neural network (PNN).
The Naive Bayes-based model demonstrates very strong results in classifying the normal operation state (NW), showing high precision (0.94), recall (0.95), and F1-score (0.95). This means the system effectively recognizes normal operating conditions, which is especially important for monitoring the stability of the electrical network.
For the partial discharge state (PD), the model exhibits exceptional ability to detect nearly all occurrences of these events, as evidenced by a high recall value (0.99). This indicates that the model rarely misses critical partial discharge conditions, which is key for preventing failures and maintaining system safety.
Despite difficulties in classifying weak discharges (LPD) and low-temperature overheating (LT), the model still shows fairly good performance for the multi-class task, with an overall accuracy of 0.88, considering the complexity and heterogeneity of the data.
The weighted average F1-score (0.87) indicates that the model works steadily and reliably across most classes, demonstrating its applicability in real diagnostic scenarios. Thus:
  • The model successfully recognizes normal operating conditions, which is critical for monitoring;
  • Nearly all cases of partial discharges are accurately detected, ensuring a high level of safety;
  • The overall accuracy of 0.88 shows that the model handles the multi-level classification task well, even with complex classes.
The model’s high accuracy (0.88) means it correctly classifies almost 88% of all observations, which is especially important when processing large datasets (441,000 observations). This indicates the model generalizes well based on the training data.
As an additional performance evaluation, the developed classification model was compared to traditional offline diagnostic methods—specifically, the Duval and Dornenburg methods. These widely used approaches represent classical diagnostic techniques for transformer condition assessment, based on empirical rules and charts derived from long-term observations. Table 7 and Table 8 present the classification quality metrics for defects.
The results of the comparative analysis showed that the developed model significantly outperforms the classical methods across all key quality metrics. In particular, it achieves an overall accuracy of 0.88, whereas the Duval and Dornenburg methods reach only 0.67 and 0.16, respectively. The developed model’s macro-average F1 score is 0.67, which is more than twice as high as Duval’s method (0.28) and nearly seven times higher than Dornenburg’s method (0.10). The weighted F1-score of the developed model is 0.87, compared to 0.68 (Duval) and 0.19 (Dornenburg).
Class-wise analysis also demonstrates the advantage of the developed model. For the dominant NW class, it achieves an F1-score of 0.95 versus 0.82 (Duval) and 0.23 (Dornenburg). For the PD class, it reaches 0.74 compared to 0.23 and 0.17, respectively. The LPD and LT classes, which are poorly recognized by classical methods (with F1 scores close to zero), show significantly higher values in the developed model, indicating its ability to detect rare and complex defects.
Thus, the proposed model provides higher accuracy, better balance between recall and precision, and sensitivity to all defect classes compared to classical methods, confirming its practical applicability for transformer condition diagnostics based on gas analysis data.
Module 2.
An essential task in diagnosing the electromagnetic parameters is the development of a methodology for reconciling operating modes with different levels of core magnetization. As shown in [47], such normalization can be performed by multiplying the corresponding parameter by a certain nonlinearity coefficient χ. The nonlinearity coefficient can be determined in various ways, for example, from the instantaneous values of currents and voltages. The sequence of steps for such normalization is as follows:
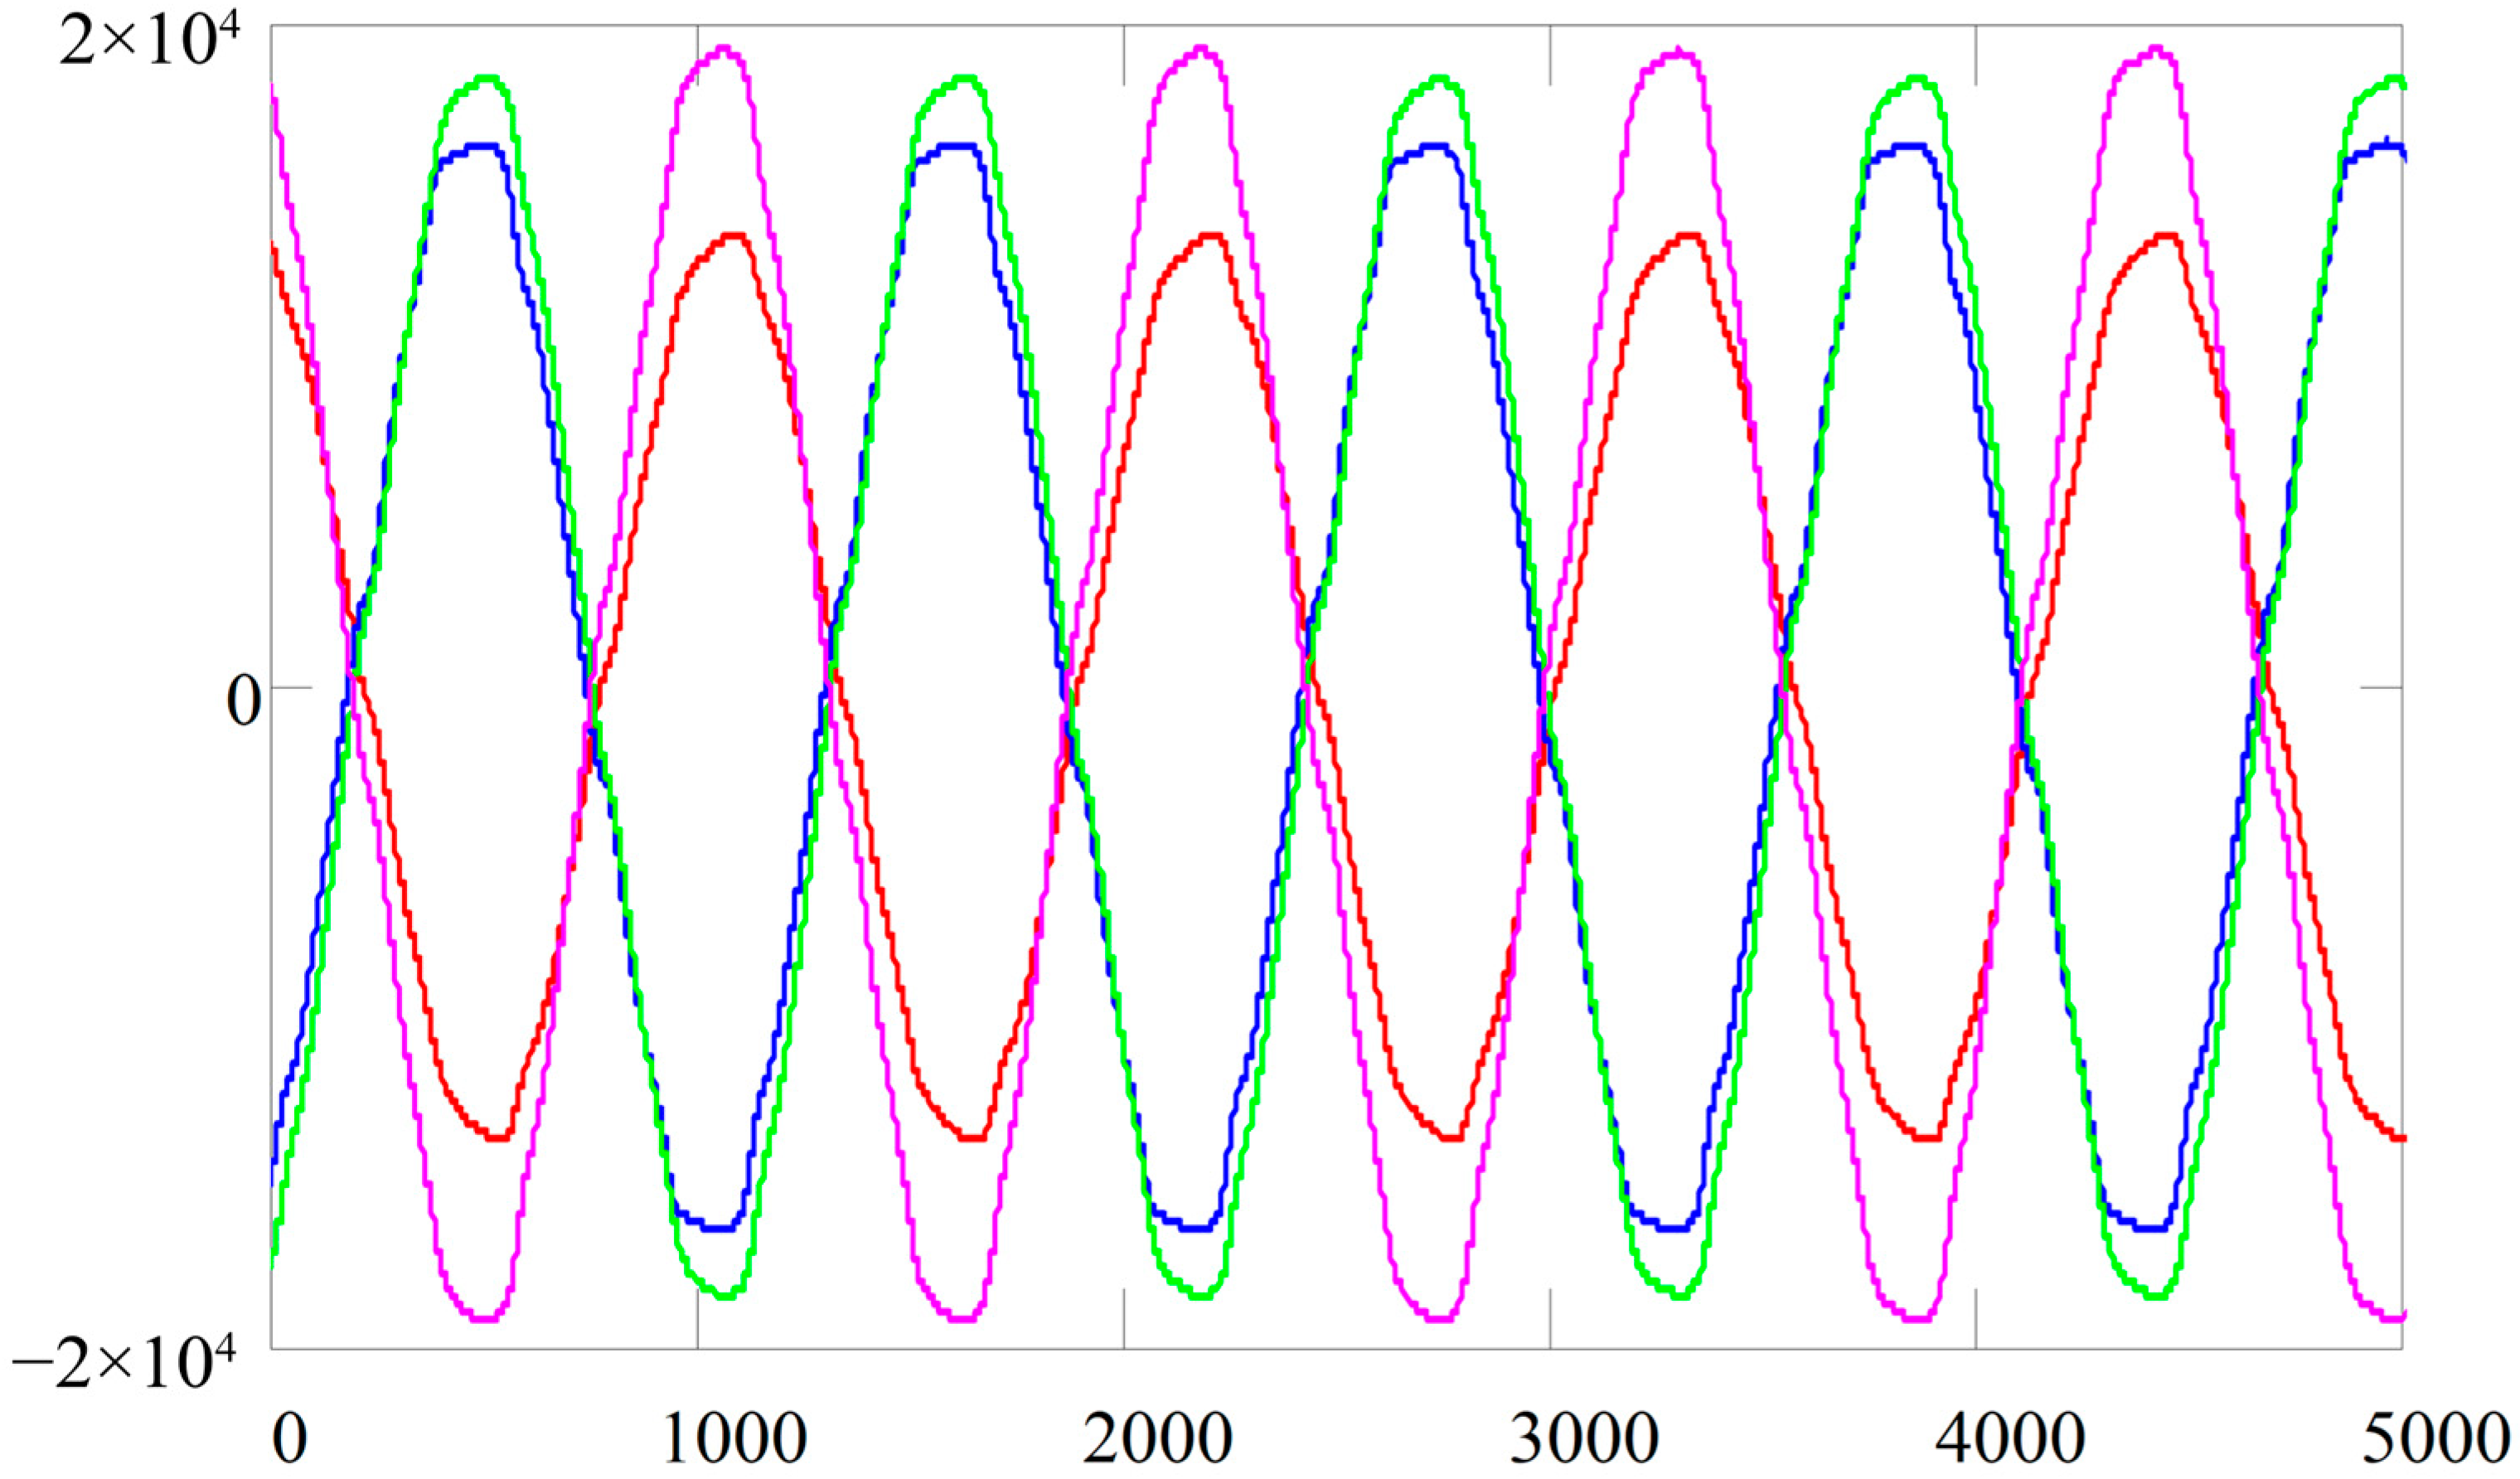
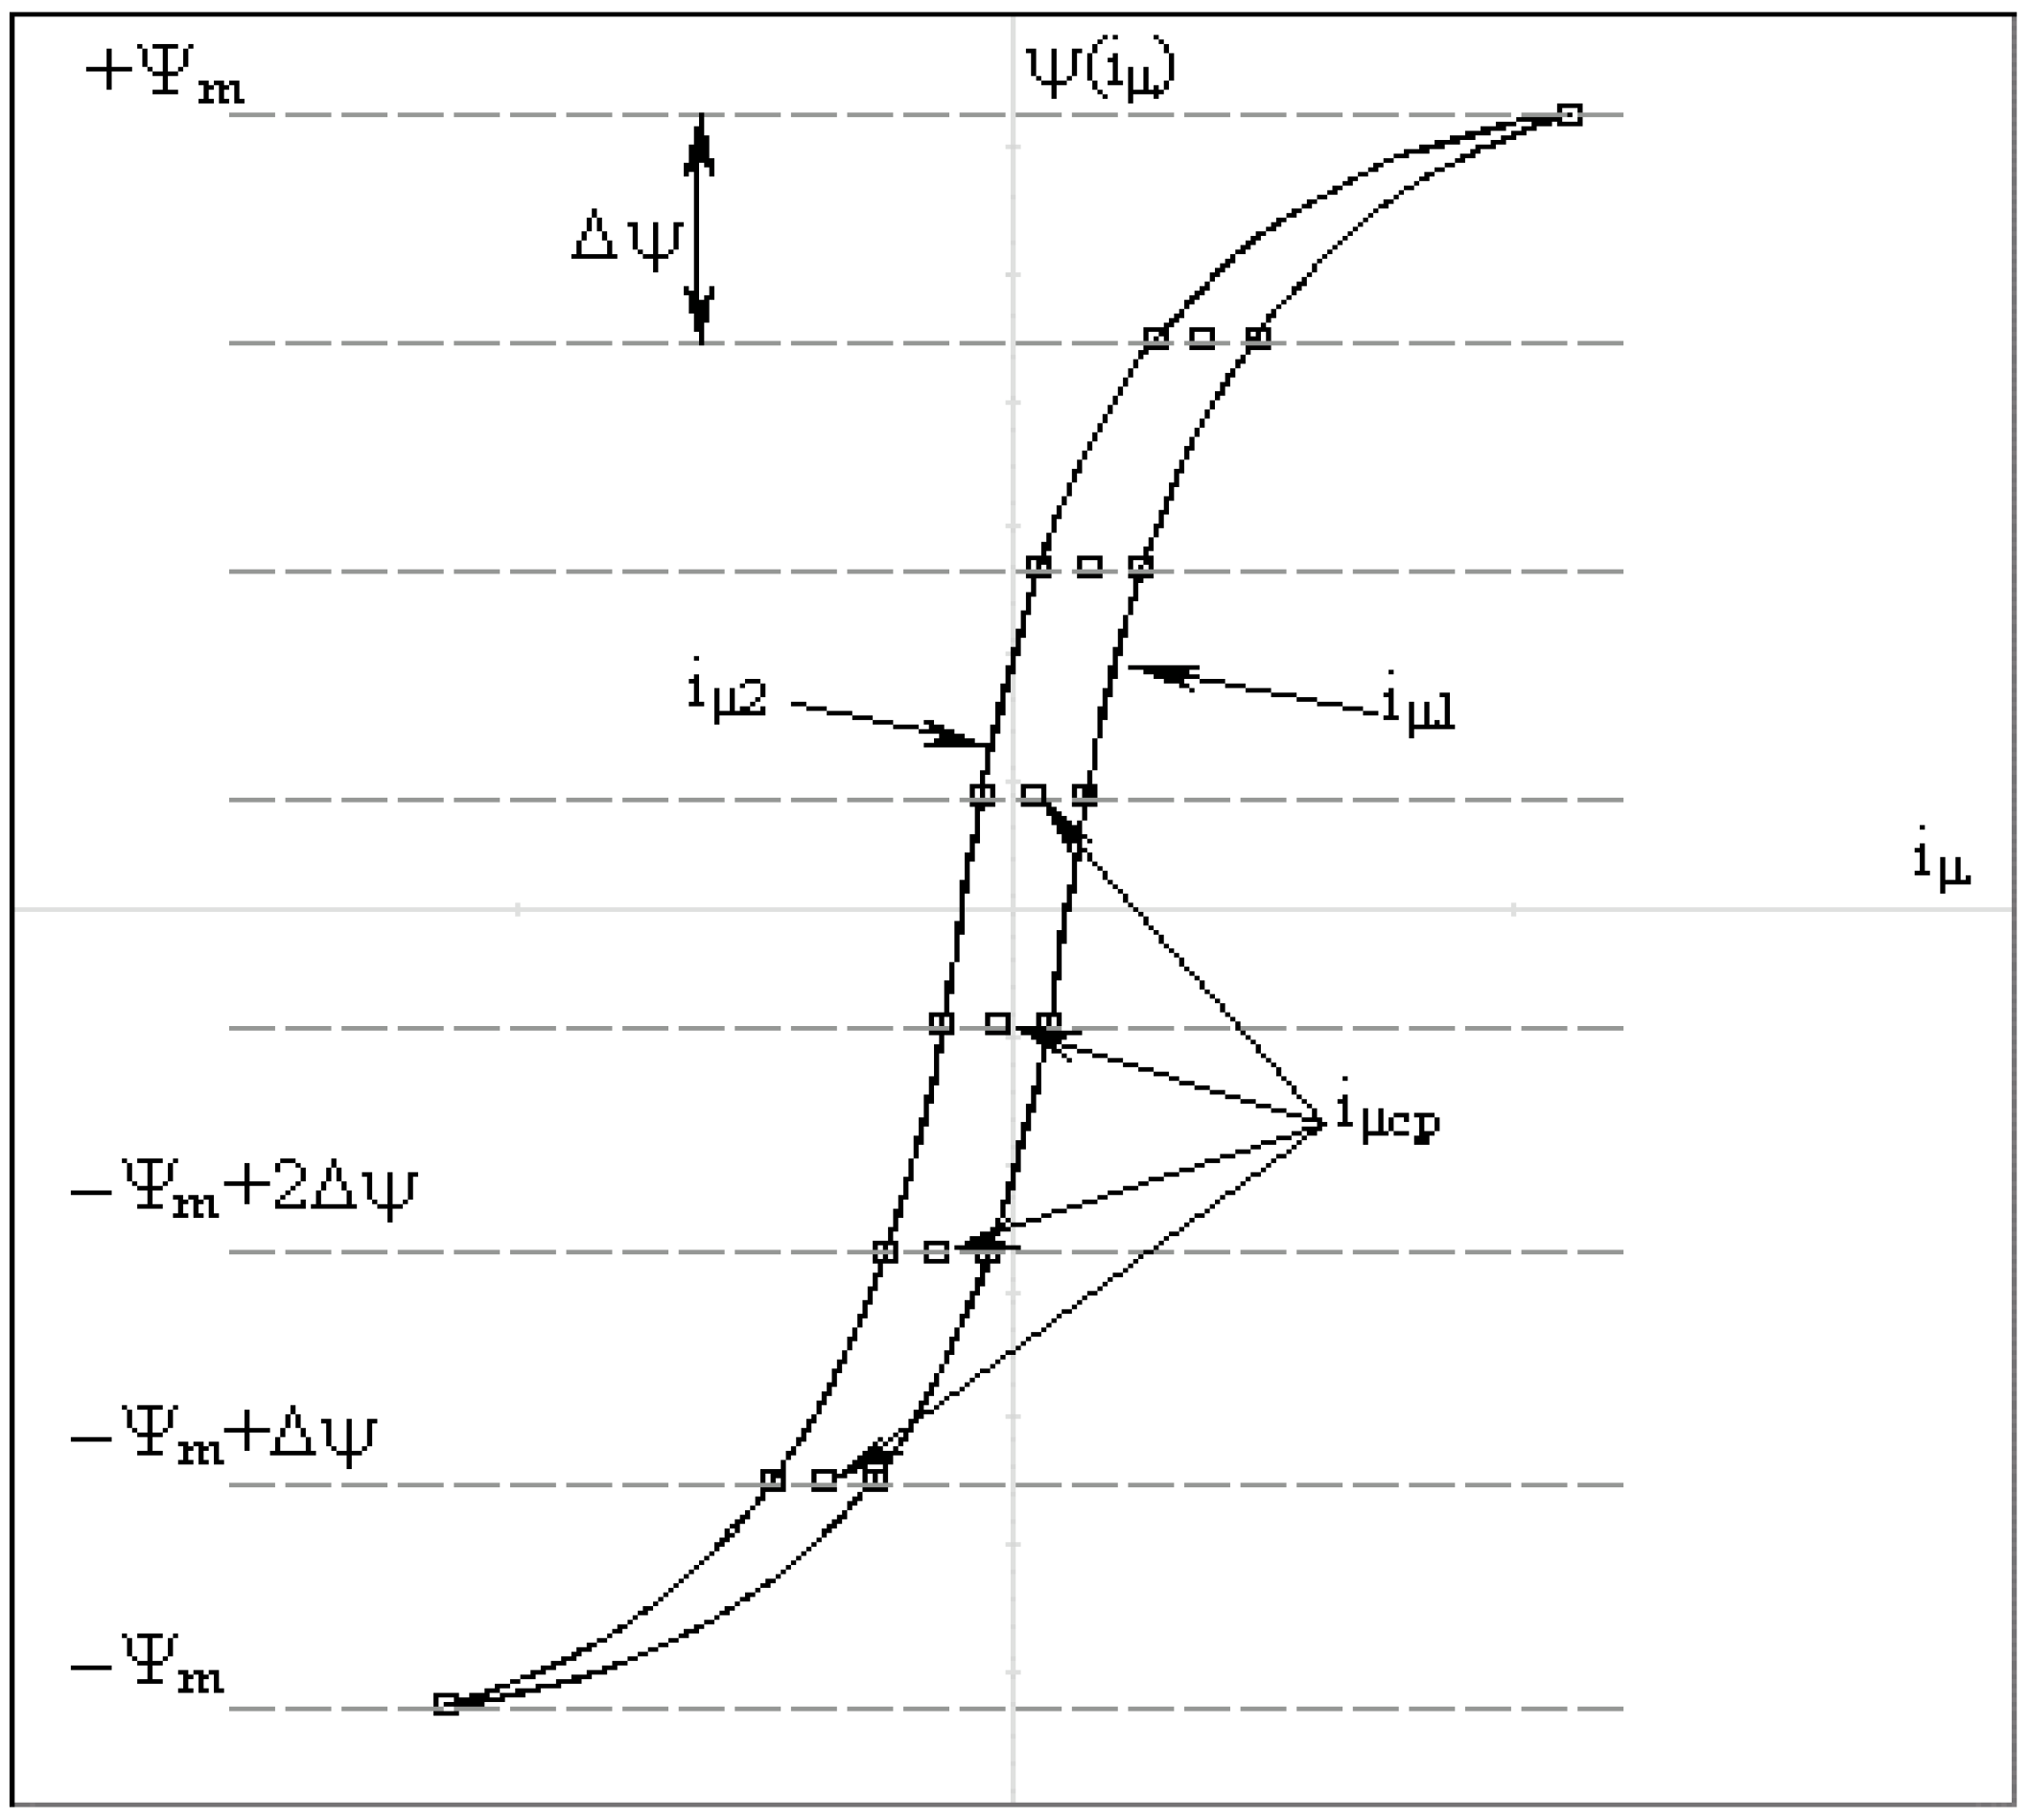
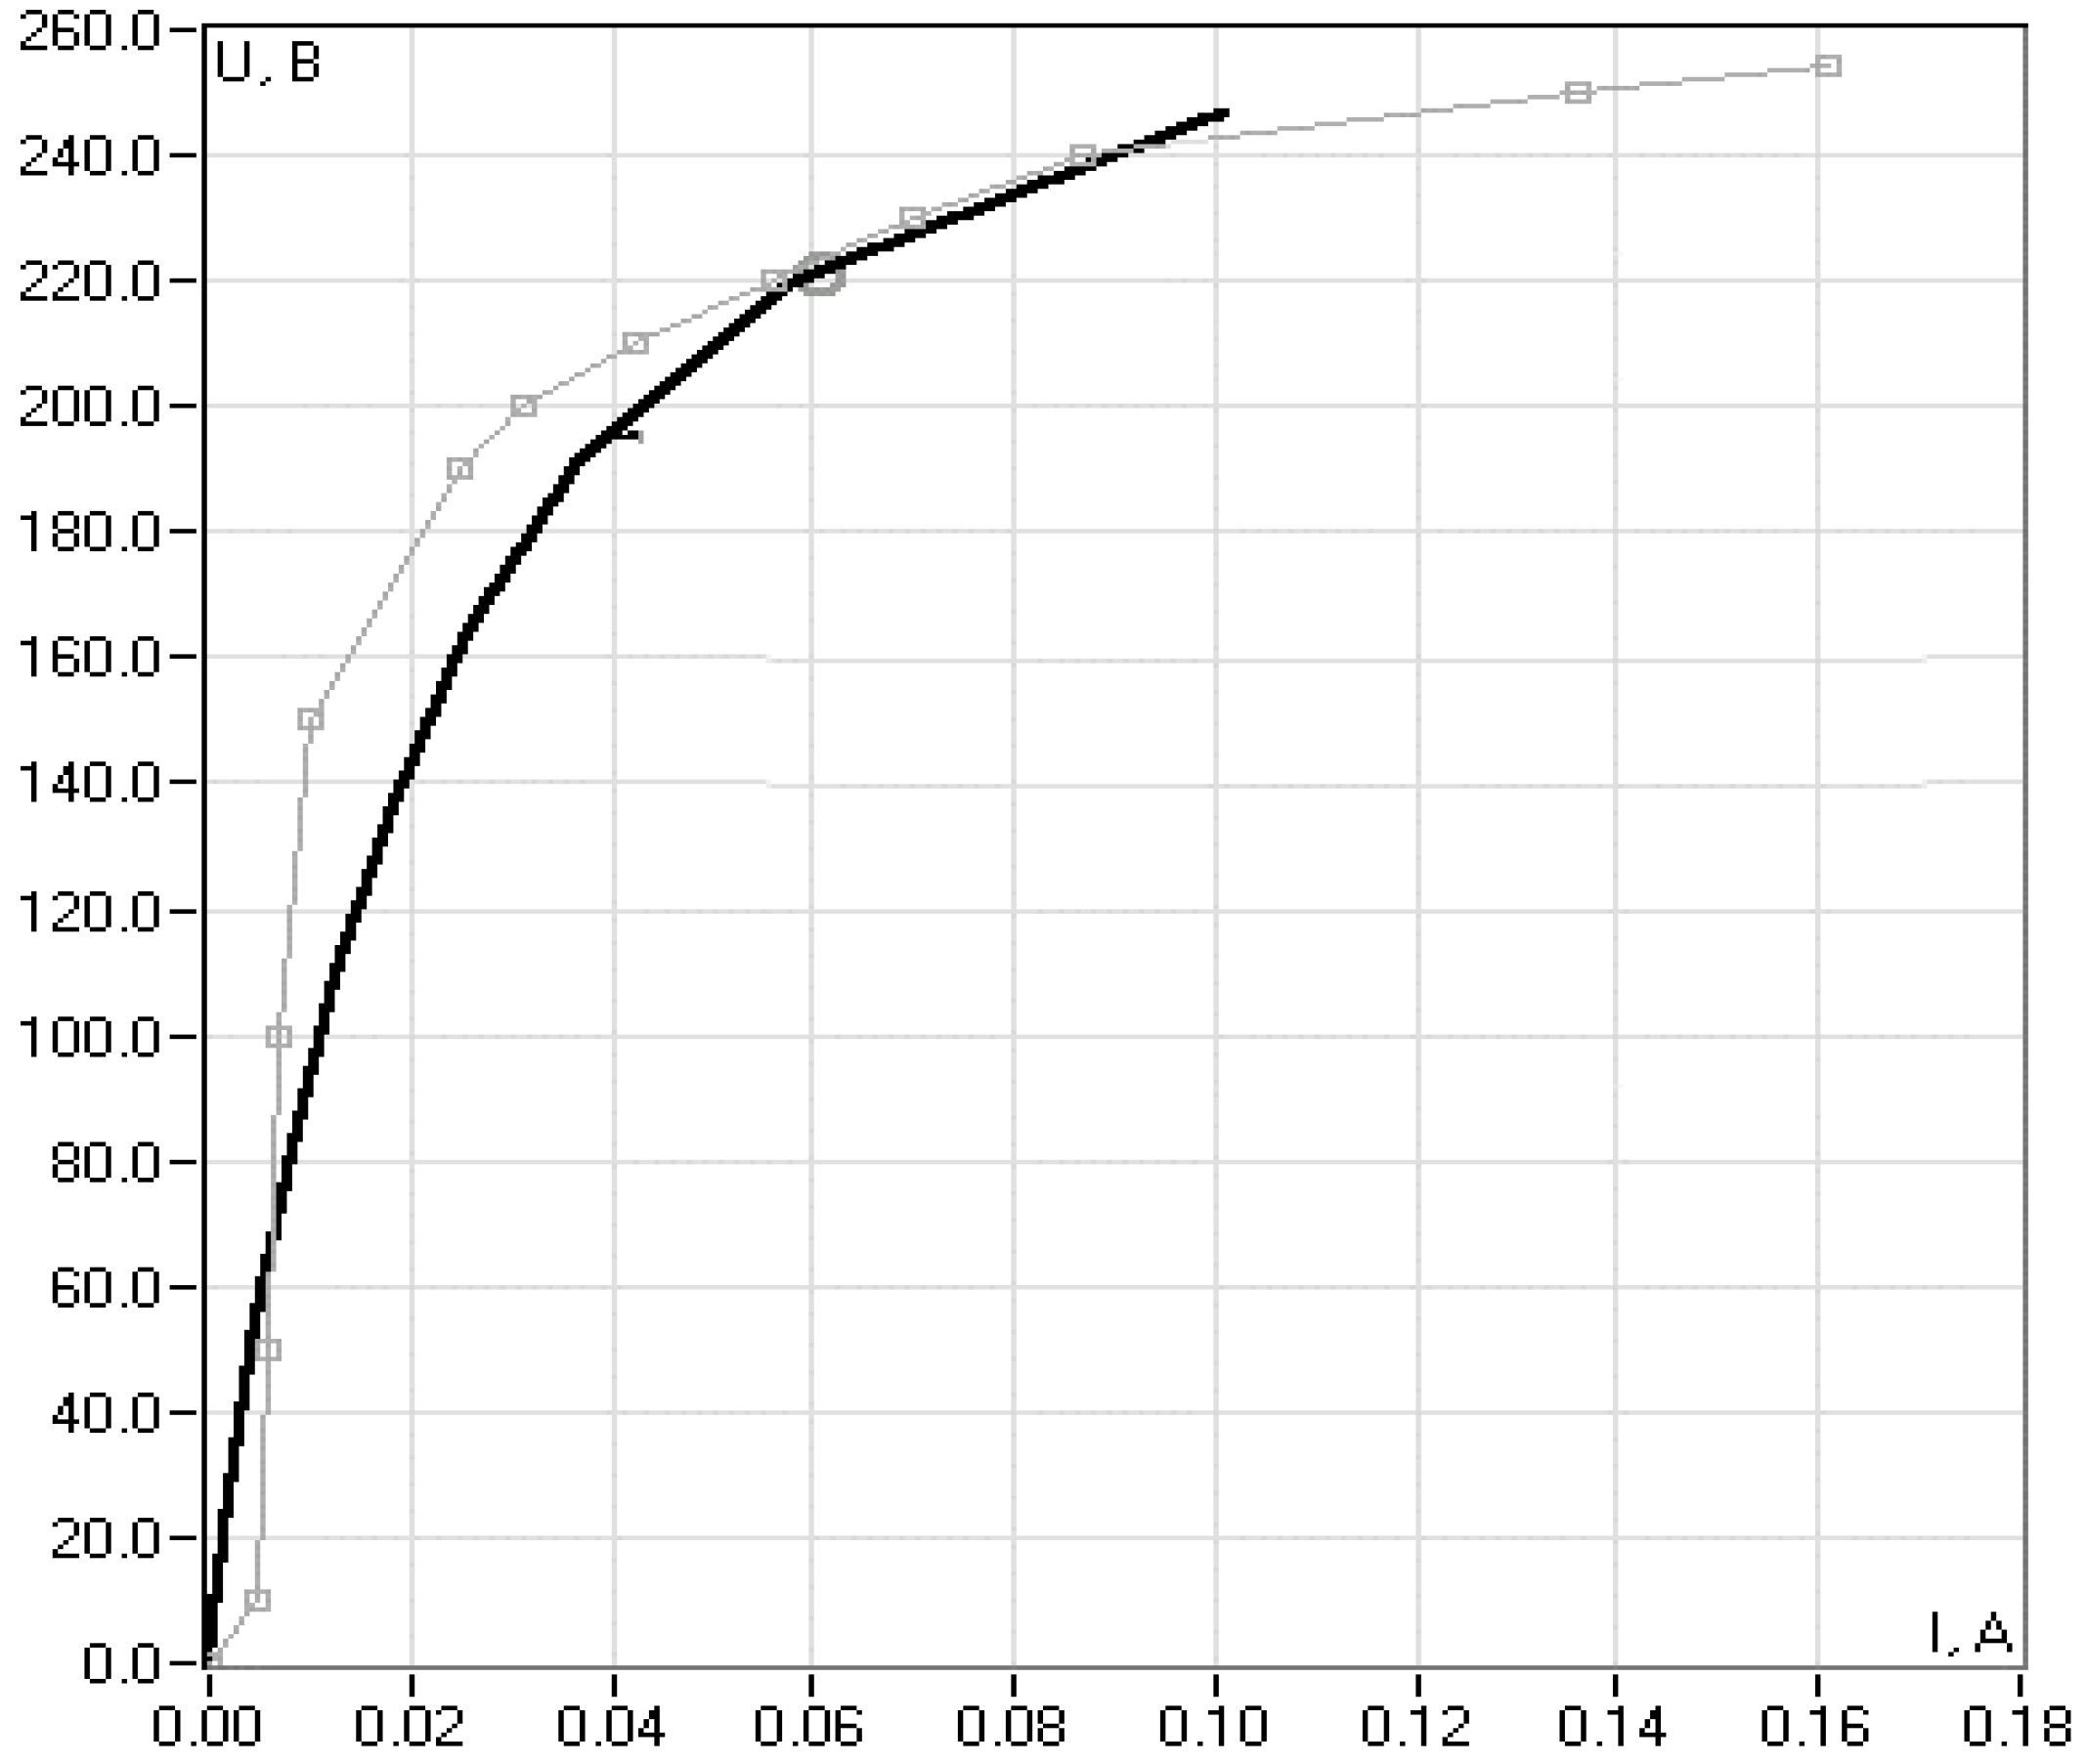
  • Based on the measurement data (Figure 12), a looped volt-ampere characteristic (VAC) is plotted for one period of current and voltage variation (Figure 13).
2.
The single-valued (non-looped) volt-ampere characteristic for instantaneous values is determined computationally (see Figure 14).
3.
The volt-ampere characteristic (VAC) for root-mean-square values is computed.
4.
From two points on the VAC for root-mean-square values, the amplitude and phase of the complex nonlinearity coefficient χ are calculated.
It should be noted that this method allows not only determining the parameter Zk and its variation, but also other electromagnetic parameters required for a comprehensive assessment of the transformer condition.
As an illustration of the specific features (and challenges) of online diagnostics of transformer electromagnetic parameters, some results of experimental studies conducted using a physical transformer model are presented (Table 9).
For further discussion, we note the following circumstances:
(1)
The experimental setup was far from perfect—the measurement of circuit parameters was carried out with significant errors (up to 10%), especially with regard to winding voltages (the “imperfection” of the voltage divider).
(2)
It was not possible to accurately reproduce various modes, which also prevented the achievement of the necessary efficiency in solving the task at hand.
The manifestation of these “imperfections” may be noticeable in the presented measurement and calculation results, but we believe that there is no need to dwell on them in detail.
The main questions that needed to be answered were as follows:
(a)
The fundamental feasibility of the method;
(b)
The influence of the accuracy of circuit parameter measurements (currents and voltages) on the solution of the EMP diagnostic task (including the influence of the sampling frequency of the measured signals);
(c)
The influence of load fluctuation levels on the conditionality of the diagnostic model;
(d)
The influence of transformer nonlinearity on the accuracy of diagnostics.
Let us analyze the work performed in terms of the stated requirements. As noted above, some of its results are given in Table 9. Let us draw conclusions based on them and accompany them with explanatory comments.
  • The method is workable, as evidenced by the comparison of the obtained matrices with the results of test diagnostics (no-load tests and, partially, short-circuit tests).
  • The difference in winding currents in different modes is important, as it affects the conditionality of the current and voltage matrices (used in the solution). Preliminary conclusion: the specified deviation must be at least 10% (as an illustration, compare the data for modes 1, 2, 3, and 5, 6 in Table 9).
  • The signal sampling frequency (SSF) has a significant impact on the accuracy of the solution. Thus, an SSF of 50 kHz compared to an SSF of 8 kHz increases the accuracy of the solution by approximately (5–7)%.
  • The calculation of short-circuit conductivity based on operational diagnostics data (e.g., based on mode 1) differs significantly from the data obtained from direct test measurements (mode 4): by a factor of 3.33 in terms of modulus. This shows that the modulus of the complex nonlinearity coefficient, which can be used to make the necessary correction, is quite large. At the same time, we emphasize that this difference is not an error of the diagnostic method, but the essence of the manifestation of transformer nonlinearity in operating mode (which is not mentioned in textbooks and monographs on transformers).
This article presents algorithmic solutions to diagnostic problems using the examples of insulation (Module 1) and electromagnetic (Module 2) subsystems, as well as some results of the forecasting models. In the next publication, the authors plan to describe the algorithms of the voltage regulation subsystems (Module 3) and high-voltage bushings (Module 4) and present the results of their application.

4. Conclusions

The following conclusions can be drawn from the presented study:
  • A concept of a hybrid expert diagnostic system based on the functionality of measurement and analytical complexes has been proposed. The system is built on a minimalist approach to the number of monitored parameters and types of measuring equipment for four subsystems of power transformers.
  • A methodology and algorithm for diagnosing the electromagnetic parameters of a transformer have been developed, taking into account the nonlinearity and nonsinusoidality of the winding currents and voltages. The method allows for determining not only the Zk parameter and its variations but also other electromagnetic parameters necessary for a comprehensive assessment of transformer condition. The feasibility of the method has been demonstrated through an experiment on a physical transformer model under conditions of measurement errors in primary voltages and currents. The signal sampling frequency has been shown to have a significant impact on the accuracy of the solution.
  • In the field of information technologies, an optimal client–service architecture for training hybrid system models based on data storage and management processes has been implemented. This includes effective management of data and hyperparameters and improved system scalability through the use of data lakes and message brokers. The adoption of these technologies enables more efficient real-time big data processing, improves the overall system performance, and reduces latency, which is particularly important for high-load computing platforms.
  • The optimal search path for smoothing coefficients of synaptic trajectories in the probabilistic neural network training algorithm has been improved. Spiral trajectories were replaced with linear ones, which enhanced the algorithm’s ability to find optimal solutions and avoid getting stuck in local minima. Additionally, the introduction of a chaotic operator significantly improved global search and increased the likelihood of finding global optima. These changes provided a balance between the required diagnostic accuracy and the efficient use of computational resources.

Author Contributions

Methodology, I.F.G. and I.I.; Software, Y.S.V.; Validation, M.E.A.; Resources, M.S.G.; Data curation, I.B.; Writing—original draft, S.F.R. All authors have read and agreed to the published version of the manuscript.

Funding

This research received—European Union-NextGenerationEU, through the National Recovery and Resilience Plan of the Republic of Bulgaria grant number BG-RRP-2.013-0001-C01.

Data Availability Statement

The original contributions presented in this study are included in the article. Further inquiries can be directed to the corresponding author.

Acknowledgments

The authors would like to thank Kazan State Power Engineering University (Russian Federation) for its assistance in conducting the research.

Conflicts of Interest

Author Mikhail Evgenievich Alpatov was employed by the company JSC “PK HC ELEKTROZAVOD”. The remaining authors declare that the research was conducted in the absence of any commercial or financial relationships that could be construed as a potential conflict of interest.

References

  1. Davidenko, I.V.; Dyakov, A.V.; Lopatin, V.V.; Vladimirova, M.N. Analysis of changes in the technical condition of the electrical equipment fleet using artificial intelligence. Electr. Transm. Distrib. 2020, 5, 122–133. [Google Scholar]
  2. C57.143-2024; IEEE Guide for Application of Monitoring Equipment to Liquid-Immersed Transformers and Components. Revision of IEEE Std C57.143-2012; IEEE: New York, NY, USA, 2025; pp. 1–177. [CrossRef]
  3. Yahya, A.A. Improving Models of Predictive Diagnostics and Assessment of the State of Transformer Equipment of Power Facilities. Ph.D. Thesis, Novosibirsk State University, Novosibirsk, Russia, 2022. [Google Scholar]
  4. Makletsov, A.M.; Galiev, I.F.; Galiev, R.I. Remote monitoring of 0.4 kV power transmission line mode parameters. In Proceedings of the Dispatching and Control in Electric Power Industry: XIV All-Russian Open Youth Scientific and Practical Conference, Kazan, Russia, 6–8 November 2019; Kazan State Power Engineering University: Kazan, Russia, 2019; pp. 250–254. [Google Scholar]
  5. Makletsov, A.M.; Galiev, I.F.; Galiev, R.I. Monitoring system for transformer voltage regulators under load. In Instrument Making and Automated Electric Drive in the Fuel and Energy Complex and Housing and Communal Services, Proceedings of the VI National Scientific and Practical Conference, Kazan, Russia, 10–11 December 2020; Kazan State Power Engineering University: Kazan, Russia, 2020; Volume 1, pp. 378–380. [Google Scholar]
  6. Makletsov, A.M.; Khamitov, I.G.; Galiev, I.F.; Galiev, R.I. Monitoring of 6–10 kV circuit breakers. In New Technologies, Materials, and Equipment in the Energy Sector; Kazan State Power Engineering University: Kazan, Russia, 2018; Volume 3, pp. 95–111. [Google Scholar]
  7. Butyrin, P.A.; Alpatov, M.E.; Alekseychik, L.V. Method for Diagnosing Power Transformers: No. 94034034/07. Patent No. 94034034 A1; Russian Federation, IPC H02H 7/04, G01R 35/02, 19 September 1994. [Google Scholar]
  8. Kuok Kyong, L.; Makletsov, A.M.; Alzakkar, A.; Maksimov, V.V.; Galiev, I.F. Development of an algorithm for balancing loads in 0.4 kV networks with distributed load along the line. News of Higher Educational Institutions. Probl. Power Eng. 2022, 24, 87–97. [Google Scholar] [CrossRef]
  9. Yakhin, S.R.; Pigalin, A.A.; Galiev, I.F.; Makletsov, A.M. Analysis of load modes and voltage regulation capacity of the distribution network during optimization of sectioning on its sections. Electric Power. Transm. Distrib. 2024, 1, 34–42. [Google Scholar]
  10. Garifullin, M.S.; Slobodina, Y.N.; Bikzinurov, A.R.; Giniatullin, R.A.; Chernyshov, V.A. Investigation of the content of unsaturated hydrocarbons in transformer oils using IR spectroscopy. Power Eng. Res. Equip. Technol. 2023, 25, 3–19. [Google Scholar] [CrossRef]
  11. Rakhmankulov, S.F.; Garifullin, M.S.; Galiev, I.F. Optimization of Power Transformer Defect Recognition Algorithm with DGA Based on Probabilistic Neural Network. In Proceedings of the 2024 International Russian Smart Industry Conference (SmartIndustryCon), Sochi, Russia, 25–29 March 2024; pp. 121–126. [Google Scholar] [CrossRef]
  12. JSC “FGC UES”. Standard Program for Comprehensive Diagnostic Examination of Power Transformers (Autotransformers) and Shunt Reactors 110–750 kV; JSC “FGC UES”: Moscow, Russia, 2005. [Google Scholar]
  13. Butyrin, P.A.; Vaskovskaya, T.A.; Alpatov, M.E. Investigation of simplified diagnostic models of transformers. Electro. Electr. Eng. Electr. Power Eng. Electr. Eng. Ind. 2007, 10–12. Available online: https://transform.ru/issledovanie-uproshhennyh-diagnosticheskih-modelej-transformatorov/ (accessed on 28 September 2025).
  14. Butyrin, P.A.; Alpatov, M.E. Digitalization and analytics in electrical engineering. Digital doubles transformers. Electricity 2021, 10, 4–10. [Google Scholar]
  15. CIGRE Working Group A2.26 report. Mechanical condition assessment of transformer windings using Frequency Response Analysis (FRA). Electra, no. 228. October 2006. Available online: https://www.e-cigre.org/publications/detail/342-mechanical-condition-assessment-of-transformer-windings-using-frequency-response-analysis-fra.html (accessed on 28 September 2025).
  16. Picher, P.; Riendeau, S.; Gauvin, M.; Leonard, F.; Dupont, L.; Goulet, J.; Rajotte, C. New technologies for monitoring transformer tap-changers and bushings and their integration into a modern IT infrastructure. In Proceedings of the CIGRE Session, Paris, France, 26–30 August 2012. [Google Scholar]
  17. Lukenda, N. Not all mineral oils are equal. Transform. Mag. 2019, 6, 112–117. [Google Scholar]
  18. CMM-10 Mobile oil Plant. Available online: https://globecore.com/products/degassing-thermal-vacuum-drying-oil/uvm-1015-mobile-oil-plant/ (accessed on 1 September 2025).
  19. Khalyasmaa, A.I.; Ovchinnikov, V.K. Methods for interpreting the results of chromatographic analysis of transformer equipment oil. Bull. Kazan State Power Eng. Univ. 2021, 13, 177–190. [Google Scholar]
  20. Nanfak, A.; Samuel, E.; Fofana, I.; Meghnefi, F.; Ngaleu, M.; Kom, C. Traditional fault diagnosis methods for mineral oil—Immersed power transformer based on dissolved gas analysis: Past, present and future. IET Nanodielectrics 2024, 7, 97–130. [Google Scholar] [CrossRef]
  21. Fofana, I.; Imani, M.; Farahani, M.; Gockenbach, E.; Borsi, H. Influence of Transformer Oil Aging By-products on the Dissolved Gas Analysis. In Proceedings of the International Symposium on High Voltage Engineering (ISH 2013), Seoul, Republic of Korea, 25–30 August 2013. [Google Scholar]
  22. Ibrahim, I.; Saleh, S.M.; Sherif Ghoneim, S.M.; Ibrahim Taha, B.M. DGALab: An Extensible Software Implementation for DGA. IET Gener. Transm. Distrib. 2018, 12, 4117–4124. [Google Scholar] [CrossRef]
  23. Ibrahim Taha, B.M.; Hoballah, A.; Ghoneim, S.S.M. Optimal ratio limits of rogers’ four-ratios and IEC 60599 code methods using particle swarm optimization fuzzy-logic approach. IEEE Trans. Dielectr. Electr. Insul. 2020, 27, 222–230. [Google Scholar] [CrossRef]
  24. Shintemirov, A.; Tang, W.; Wu, Q.H. Power Transformer Fault Classification Based on Dissolved Gas Analysis by Implementing Bootstrap and Genetic Programming. IEEE Trans. Syst. Man Cybern. Part C (Appl. Rev.) 2009, 39, 69–79. [Google Scholar] [CrossRef]
  25. Shintemirov, A.; Tang, W.H.; Wu, Q.H.; Fitch, J. Genetic programming feature extraction with bootstrap for dis-solved gas analysis of power transformers. In Proceedings of the 2009 IEEE Power & Energy Society General Meeting, Calgary, AB, Canada, 26–30 July 2009; pp. 1–6. [Google Scholar] [CrossRef]
  26. Taha, I.B.M.; Mansour, D.-E.A.; Ghoneim, S.S.M.; Elkalashy, N.I. Conditional probability-based interpretation of dissolved gas analysis for transformer incipient faults. IET Gen. Transm. Distrib. 2017, 11, 943–951. [Google Scholar] [CrossRef]
  27. Nanfak, A.; Eke, S.; Meghnefi, F.; Fofana, I.; Ngaleu, G.M.; Kom, C.H. Hybrid DGA Method for Power Transformer Faults Diagnosis Based on Evolutionary k-Means Clustering and Dissolved Gas Subsets Analysis. IEEE Trans. Dielectr. Electr. Insul. 2023, 30, 2421–2428. [Google Scholar] [CrossRef]
  28. Benmahamed, Y.; Kherif, O.; Teguar, M.; Boubakeur, A.; Ghoneim, S.S.M. Accuracy Improvement of Transformer Faults Diagnostic Based on DGA Data Using SVM-BA Classifier. Energies 2021, 14, 2970. [Google Scholar] [CrossRef]
  29. Poonnoy, N.; Suwanasri, C.; Suwanasri, T. Fuzzy Logic Approach to Dissolved Gas Analysis for Power Transformer Failure Index and Fault Identification. Energies 2021, 14, 36. [Google Scholar] [CrossRef]
  30. Lu, W.; Shi, C.; Fu, H.; Xu, Y. Fault Diagnosis Method for Power Transformers Based on Improved Golden Jackal Optimization Algorithm and Random Configuration Network. IEEE Access 2023, 11, 35336–35351. [Google Scholar] [CrossRef]
  31. Ibrahim, S.; Taha, I.B.M.; Ghoneim, S.S.M. DGA Tool GitHub Repository. 2018. Available online: https://github.com/Saleh860/DGA (accessed on 1 September 2025).
  32. Taha, I.B.M.; Ibrahim, S.; Mansour, D. -E.A. Power Transformer Fault Diagnosis Based on DGA Using a Convolu-tional Neural Network With Noise in Measurements. IEEE Access 2021, 9, 111162–111170. [Google Scholar] [CrossRef]
  33. Ghalkhani, M.; Fofana, I.; Bouaïcha, A.; Hemmatjou, H. Influence of aging by products on the gassing tendency of transformer oils. In Proceedings of the 2012 Annual Conference Electrical Insulation and Dielectric Phenomena, Montreal, QC, Canada, 14–17 October 2012; pp. 870–873. [Google Scholar] [CrossRef]
  34. Senoussaoui, M.E.A.; Fofana, I.; Brahami, M. Influence of Oil Quality on the Interpretation of Dissolved Gas Analysis Data. In Proceedings of the 2021 IEEE 5th International Conference on Condition Assessment Techniques in Electrical Systems (CATCON), Kozhikode, India, 3–5 December 2021; pp. 170–175. [Google Scholar] [CrossRef]
  35. Jiang, T.; Yang, J.; Yang, X.; Li, Y.; Bi, M.; Zhou, X. Diffusion Mechanisms of Dissolved Gases in Transformer Oil Influenced with Moisture Based on Molecular Dynamics Simulation. ACS Omega 2022, 7, 39812–39821. [Google Scholar] [CrossRef]
  36. Elele, U.; Nekahi, A.; Arshad, A.; Fofana, I. Towards Online Aging Detection in Transformer Oil: A Review. Sensors 2022, 22, 7923. [Google Scholar] [CrossRef]
  37. Tippannavar, S.S.; Mishra, V.; Yashwanth, S.D.; Gowda, R.R.; Sathvik, H.R.; Ajay, M. Smart Transformer—An Analysis of Recent Technologies for Monitoring Transformer. In Proceedings of the 2023 International Conference on Recent Trends in Electronics and Communication (ICRTEC), Mysore, India, 10–11 February 2023; pp. 1–11. [Google Scholar] [CrossRef]
  38. Shinkarenko, G.V. Measurement of short-circuit resistance of block transformers under operating voltage. Power Eng. Electrif. 1996, 19–24. [Google Scholar]
  39. Konov, Y.S.; Tsurpal, S.V. Method for Monitoring Internal Windings of Power Transformers. USSR A.s. No. 1221620; cl. G01R31/02, B.I. No. 12, 1986,
  40. Butyrin, P.A.; Alpatov, M.E. Diagnostics of power transformers under load. Proc. Russ. Acad. Sci. Power Eng. 1996, 74–81. [Google Scholar]
  41. Butyrin, P.A.; Alpatov, M.E. Continuous diagnostics of transformers. Electricity 1998, 45–55, ISSN 0013-5380. [Google Scholar]
  42. Butirin, P.A.; Alpatov, M.Y. The Continuous Diagnostics of Transformers. Electr. Technol. Russ. 1998, 23–42. [Google Scholar]
  43. Butyrin, P.A.; Alekseychik, L.V.; Alpatov, M.E. Method for Diagnosing Power Transformers: No. 93033648/28. Patent No. 2069371 C1; Russian Federation, IPC G01R 35/02, 29 June 1993. [Google Scholar]
  44. Report “Development of Algorithms for Diagnostics of Electromagnetic Parameters of Transformers” (Contract No. 2431000); MPEI: Moscow, Russia, 2001.
  45. Demirchyan, K.S. Reactive power in the case of non-sinusoidal functions. Orthopower Izv. RAS Power Eng. 1992, 15–38. [Google Scholar]
  46. Alpatov, M. On-line detection of winding deformation. In Proceedings of the Conference Record of the 2004 IEEE International Symposium on Electrical Insulation, Indianapolis, IN, USA, 19–22 September 2004; pp. 113–116. [Google Scholar] [CrossRef]
  47. Alpatov, M.E.; Butyrin, P.A. Analytical Theory of Transformers; MPEI Publishing House: Moscow, Russia, 2019; 112p. [Google Scholar]
  48. Goldstein, E.I. Method of Operational Monitoring of Short-Circuit Resistance of a Single-Phase Two-Winding Transformer in Operating Mode. RU2390034C1, 20 May 2010. [Google Scholar]
  49. Berezhnoy, A.V. Method for Monitoring Deformation of Windings of a Step-Down Three-Phase Two-Winding Three-Rod Power Transformer Under Operating Currents and Voltages. RU2478977C1, 10 April 2013. [Google Scholar]
  50. Sapunkov, M.L. Method for Detecting Turn-to-Turn Short Circuits in Windings of Three-Phase Transformers. RU2645811C1, 28 February 2018. [Google Scholar]
  51. Avtaev, P.N. Method for Detecting a Defect in a Power Transformer. RU2539821C2, 27 January 2015. [Google Scholar]
  52. Murataev, I.A. Method for Diagnosing the Magnetic System of a Transformer. RU2354982C1, 10 May 2009. [Google Scholar]
  53. Alyunov, A.N. Method for Diagnosing Power Transformers. RU2237254C1, 27 September 2004. [Google Scholar]
  54. Kozlov, V.K. Method of Forming a Diagnostic Parameter During Testing of Electromagnetic Energy Converters. RU2374656C1, 27 November 2009. [Google Scholar]
  55. Feizifar, B.; Müller, Z.; Fandi, G.; Usta, O. A Collective Condition Monitoring Algorithm for On-Load Tap-Changers. In Proceedings of the 2019 IEEE International Conference on Environment and Electrical Engineering and 2019 IEEE Industrial and Commercial Power Systems Europe (EEEIC/I&CPS Europe), Genova, Italy, 11–14 June 2019; pp. 1–6. [Google Scholar] [CrossRef]
  56. Abeywickrama, N.; Kouzmine, O.; Kornhuber, S.; Cheim, L.; Lorin, P.; Gauvin, M.; Leonard, F.; Picher, P. Application of novel algorithms for continuous bushing and OLTC monitoring for increasing network reliability. In Proceedings of the CIGRE Session, Paris, France, 24 August 2014; Paper A2-113. [Google Scholar]
  57. Kang, P.; Birtwhistle, D. Condition Assessment of Power Transformer on-Load Tap-Changers Using Wavelet Analysis and Self-Organizing Map: Field Evaluation. IEEE Power Eng. Rev. 2002, 22, 69. [Google Scholar] [CrossRef]
  58. Kang, P.; Birtwhistle, D.; Daly, J.; McCulloch, D. Non-invasive-line condition monitoring of on load tap changers. In Proceedings of the 2000 IEEE Power Engineering Society Winter Meeting. Conference Proceedings (Cat. No. 00CH37077), Singapore, 23–27 January 2000; Volume 3, pp. 2223–2228. [Google Scholar] [CrossRef]
  59. Foata, M.; Girard, B.; Landry, C.; Mow, A.; Rajotte, C. Field experience with the implementation of a new on-line vibro-acoustic diagnostic for on-load tap changers. In Proceedings of the Doble Users Conference, Boston, MA, USA, 28 February–4 March 2005. [Google Scholar]
  60. Kang, P.; Birtwhistle, D. Condition Assessment of Power Transformer on-Load Tap-Changers Using Wavelet Analysis. IEEE Power Eng. Rev. 2001, 21, 64. [Google Scholar] [CrossRef]
  61. Rivas, E.; Burgos, J.; García-Prada, J.C. Vibration Analysis Using Envelope Wavelet for Detecting Faults in the OLTC Tap Selector. IEEE Trans. Power Deliv. 2010, 25, 1629–1636. [Google Scholar] [CrossRef]
  62. Rivas, E.; Burgos, J.; Garcia-Prada, J.C. Methodology for Vibration Signal Processing of an On-load Tap Changer. Adv. Vib. Anal. Res. 2011, 17, 329–342. [Google Scholar] [CrossRef]
  63. Seo, J.; Ma, H.; Saha, T. A Joint Vibration and Arcing Measurement System for Online Condition Monitoring of On-Load Tap Changer of Power Transformer. IEEE Trans. Power Deliv. 2017, 32, 1031–1038. [Google Scholar] [CrossRef]
  64. Seo, J.; Ma, H.; Saha, T. On Savitzky-Golay Filtering for Online Condition Monitoring of Transformer On-Load Tap Changer. IEEE Trans. Power Deliv. 2018, 33, 1689–1698. [Google Scholar] [CrossRef]
  65. Dabaghi-Zarandi, F.; Behjat, V.; Gauvin, M.; Picher, P.; Ezzaidi, H.; Fofana, I. Power Transformers OLTC Condition Monitoring Based on Feature Extraction from Vibro-Acoustic Signals: Main Peaks and Euclidean Distance. Sensors 2023, 23, 7020. [Google Scholar] [CrossRef]
  66. Dabaghi-Zarandi, F.; Picher, P.; Gauvin, M.; Ezzaidi, H.; Fofana, I.; Rao, U.M.; Behjat, V.; Souza, J. Evaluating OLTC condition based on feature extraction from vibro-acoustic signals. In Proceedings of the 23rd International Symposium on High Voltage Engineering (ISH 2023), Glasgow, UK, 28 August–1 September 2023; pp. 133–137. [Google Scholar] [CrossRef]
  67. Dabaghi-Zarandi, F.; Behjat, V.; Gauvin, M.; Picher, P.; Ezzaidi, H.; Fofana, I. Using Deep Learning to Detect Anomalies in On-Load Tap Changer Based on Vibro-Acoustic Signal Features. Energies 2024, 17, 1665. [Google Scholar] [CrossRef]
  68. Beheshti Asl, M.; Fofana, I.; Meghnefi, F. Review of Various Sensor Technologies in Monitoring the Condition of Power Transformers. Energies 2024, 17, 3533. [Google Scholar] [CrossRef]
  69. Transformer Reliability Survey: CIGRE WG A2.37. Technical Brochure C1GRE; 642; CIGRE: Paris, France, 2015; 120p.
  70. STO 34.01-23.1-001-2017; Scope and Standards for Testing Electrical Equipment. PJSC Rosseti: Moscow, Russia, 2017.
  71. Korobeynikov, S.M.; Ovsyannikov, A.G. Physical Mechanisms of Partial Discharges; Publishing House of NSTU: Novosibirsk, Russia, 2021; 266p. [Google Scholar]
  72. Guidelines for the Operation of High-Voltage Bushings with RIP Insulation Manufactured by Massa LLC—Izolyator Plant at the Facilities of PJSC FGC UES Moscow, 2016 [Electronic Resource]. Available online: https://mosizolyator.ru/files/nodus_items/0002/1410/attaches/Metod.-ukaz.-po-ekspluatatsii-vvodov-s-RIP.pdf (accessed on 1 September 2025).
  73. GOST R 55191-2012 (IEC 60270:2000); High-Voltage Test Methods: Partial Discharge Measurements. Gosstandart: Moscow, Russia, 2012.
  74. On the Mass Operational Testing of the High-Frequency Flaw Detection Method for High-Voltage Insulation; Information Message No. E-7/61; Soyuzglavenergo, ORGRES: Moscow, Russia, 1961; 38p.
  75. Halyasmaa, A.I.; Dmitriev, S.A.; Cokin, S.E.; Glushkov, D.A. Diagnostics of Electrical Equipment of Power Plants and Substations: A Tutorial; Izdvo Ural University: Ekaterinburg, Russia, 2015; 64p. (In Russian) [Google Scholar]
  76. GOST 18353-79; Non-Destructive Testing: Classification of Types and Methods. Interstate Standard: Moscow, Russia, 1979.
  77. RD 153-34.0-20.363-99; Basic Provisions of the Methodology for Infrared Diagnostics of Electrical Equipment and Overhead Lines. Ministry of Energy of the Russian Federation: Moscow, Russia, 1999.
  78. Lundgaard, L.E. Partial discharge. XIII. Acoustic partial discharge detection-fundamental considerations. IEEE Electr. Insul. Mag. 1992, 8, 25–31. [Google Scholar] [CrossRef]
  79. Lundgaard, L.E. Partial discharge. XIV. Acoustic partial discharge detection-practical application. IEEE Electr. Insul. Mag. 1992, 8, 34–43. [Google Scholar] [CrossRef]
  80. Galiev, I.F.; Garifullin, M.S.; Alekseev, I.P.; Gizatullin, A.R.; Makletsov, A.M. Development of an Integrated Expert System for Distribution Network Diagnostics Based on Artificial Intelligence Technology. In Proceedings of the 2023 International Russian Smart Industry Conference (SmartIndustryCon), Sochi, Russia, 27–31 March 2023; pp. 6–14. [Google Scholar]
  81. Weruaga, L. Frequency-Selective Noise-Compensated Autoregressive Estimation. IEEE Trans. Circuits Syst. I Regul. Pap. 2011, 58, 2469–2476. [Google Scholar] [CrossRef]
  82. Hendel, M.; Bousmaha, I.; Meghnefi, F.; Fofana, I.; Brahami, M.M. An Intelligent Power Transformers Diagnostic System Based on Hierarchical Radial Basis Functions Improved by Linde Buzo Gray and Single-Layer Perceptron Algorithms. Energies 2024, 17, 3171. [Google Scholar] [CrossRef]
  83. Safdari-Vaighani, A.; Heryudono, A.; Larsson, E. A Radial Basis Function Partition of Unity Collocation Method for Convection–Diffusion Equations Arising in Financial Applications. J. Sci. Comput. 2015, 64, 341–367. [Google Scholar] [CrossRef]
  84. Traveling Salesman Problem. Available online: https://en.wikipedia.org/wiki/Travelling_salesman_problem (accessed on 1 September 2025).
  85. The Traveling Salesman Problem. Available online: http://www.math.uwaterloo.ca/tsp/index.html (accessed on 1 September 2025).
  86. Rosenkrantz, D.J.; Stearns, R.E.; Lewis, P.M. Approximate algorithms for the traveling salesperson problem. In Proceedings of the 15th Annual Symposium on Switching and Automata Theory (Swat 1974), New Orleans, LA, USA, 14–16 October 1974; pp. 33–42. [Google Scholar] [CrossRef]
  87. Baughman, D.R.; Liu, Y.A. Classification: Fault Diagnosis and Feature Categorization. In Neural Networks in Bioprocessing and Chemical Engineering; Academic Press: Cambridge, MA, USA, 1995; pp. 110–171. [Google Scholar] [CrossRef]
  88. Nadimi-Shahraki, M.H.; Zamani, H.; Fatahi, A.; Mirjalili, S. MFO-SFR: An Enhanced Moth-Flame Optimization Algorithm Using an Effective Stagnation Finding and Replacing Strategy. Mathematics 2023, 11, 862. [Google Scholar] [CrossRef]
  89. Rakhmankulov, S.F.; Garifullin, M.S.; Galiev, I.F. The “Butterfly Flame” Algorithm for Optimizing the Topography of a Neural Network for Diagnostics of Power Transformers Using Chromatographic Analysis. In Energy and Resource Saving—XXI Century, Proceedings of the XXI International Scientific and Practical Conference, Orel, Bucharest, Romania, 15–16 November 2023; Atlantic Press: New York City, NY, USA; pp. 57–61.
  90. STO 34.01-23-003-2019; Guidelines for Technical Diagnostics of Developing Defects in Oil-Filled High-Voltage Electrical Equipment Based on the Results of Analysis of Gases Dissolved in Mineral Transformer Oil. PJSC “ROSSETI”: Moscow, Russia, 2019; 63p.
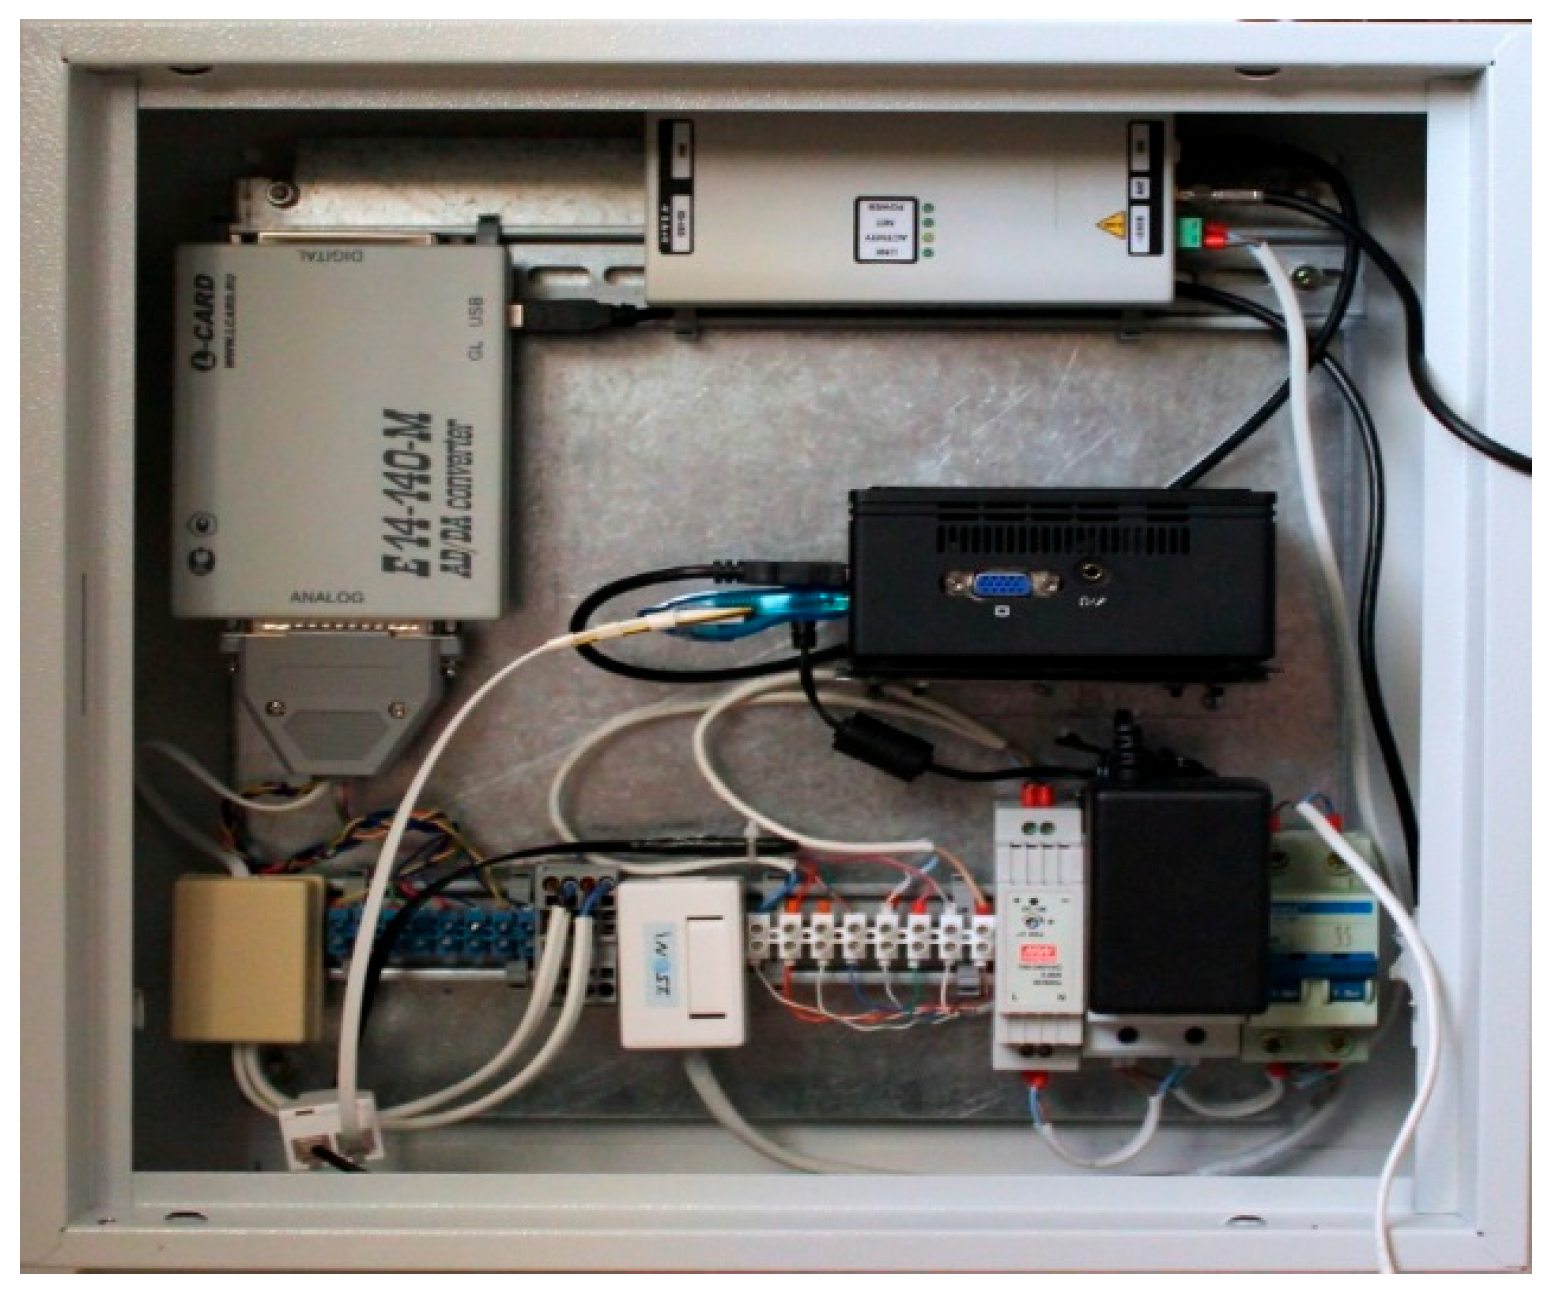
Figure 1. OLTC diagnostic system server.
Energies 18 05360 g001
Figure 2. Circuit breaker diagnostic system server.
Energies 18 05360 g002
Figure 3. Device for diagnosing electromagnetic parameters of a power transformer.
Energies 18 05360 g003
Figure 4. Structure of the ETL processes of the system.
Energies 18 05360 g004
Figure 5. Client–server architecture of the GIESD.
Energies 18 05360 g005
Figure 6. Platform for storing and organizing multiple neural network models.
Energies 18 05360 g006
Figure 7. Combined PNN algorithm.
Energies 18 05360 g007
Figure 8. Table file containing time series of dissolved gases in oil.
Energies 18 05360 g008
Figure 9. Example of transformer fault state prediction using a probabilistic neural network.
Energies 18 05360 g009
Figure 10. Performance Metrics of the Developed and Trained LSTM Network for Time Series Prediction.
Energies 18 05360 g010
Figure 11. Confusion matrix for the probabilistic neural network.
Energies 18 05360 g011
Figure 12. Results of electrical quantity measurements.
Energies 18 05360 g012
Figure 13. Looped VAC corresponding to one period of current and voltage variation.
Energies 18 05360 g013
Figure 14. Computed (single-valued) VAC for instantaneous values.
Energies 18 05360 g014
Table 1. Stages of information system development.
Development Stage and PropertyStandard ApproachAuthor’s Approach
Data extraction via APIStandard invocation using arbitrary programmatic meansInvocation within a local microservice
Noise removal in dataMissing values are approximated; anomalies and noise are addressed using robust statistical estimatorsMissing values are approximated. Noise and anomalies are detected using an autoregressive model tailored to data characteristics and tuned to specific time discretization or frequency [81], offering greater effectiveness than Z-score or other direct methods
Transformation of raw data into fact and dimension tablesTypically not performed; rarely implemented as an optimization techniqueAlgorithm splits a raw data table into two structured tables representing facts and dimensions respectively
Re-training countdown mechanismRarely used in practice; neural networks are often not retrained or fine-tunedThe countdown to the next stage of pre-training is underway
Vector search, transformation, and storageNo separation of numeric values, vectors, and other data typesAn additional layer significantly accelerates vector search in PostgreSQL compared to built-in VectorSearch, while saving disk space
Prediction and defect classification result generationModel weights are loaded; input is passed through the pre-trained model to produce an outputDue to a custom NN architecture, results are obtained significantly faster since most parameters reside in RAM, optimizing computational resource usage
Storage of prediction resultsSimply added to the databaseIdentical approach
System integrityMonolithic solution, difficult to scale and extendFlexible microservice-based architecture that can be easily scaled up or down based on hardware constraints and requirements
AvailabilityStandalone enterprise application for desktop systemsWeb application accessible from any device (phone, tablet, PC); supports service delivery models such as Software as a Service (SaaS)
Table 2. Stages of neural network development.
Time Series Forecasting
Process StageStandard ApproachProposed (Author’s) Approach
Data preprocessing, outlier and noise removalSelection of autoregression level based on predefined periodicity (e.g., lags 1, 2, 3)Selection of autoregressive order.
To move beyond the constraints of a Markovian process, a specific case of the coefficient is derived. Its suitability is verified using the Ordinary Least Squares (OLS) criterion.
The nearest integer value is then determined. A deliberate and data-informed choice of the autoregressive coefficient is regarded as a step toward increased predictive accuracy.
Classification Model Training
Process StageStandard ApproachProposed (Author’s) Approach
Architecture selectionTypically receives little attention in terms of resource allocation and hardware communication efficiencyArchitecture selection accounts not only for model accuracy, but also for efficient utilization of computational and switching resources
Batch preparationStandard partitioning into:
-
Training set
-
Testing set
-
Validation set
Same procedure applied
Neural network algorithm implementationOften lacks fine-tuning or algorithmic precision; architectures are frequently selected arbitrarily or approximated.The algorithm is designed to ensure that each retraining phase includes iterative subsampling, allowing the model to continuously refine itself using segmented training batches
Predictive Model TrainingRecurrent neural networks (RNN), convolutional neural networks (CNN), and LSTM are commonly usedLSTM networks are employed exclusively due to their capacity to retain relevant information across long temporal dependencies, making them especially well-suited for sequential diagnostics and forecasting
Table 3. Software specifics of the developed solution.
Compared AspectsStandard SolutionProposed Solution
Efficiency relative to computational unitsNot evaluated in terms of computational efficiency, which complicates scaling and/or deployment on real-world systemsThe architectures of both neural networks were selected with regard to relative accuracy and efficiency of computational resources
Preparedness for retrainingIt is generally assumed that neural network solutions function without retraining or require manual supervision, which limits the autonomy and scalability of the developed modelsThe framework described in the hardware section allows for efficient storage, retraining, or fine-tuning of models, while the Moth–Flame Optimization algorithm used in the classification model enables accurate parameter estimation at each iteration
Table 4. Diagnostic parameters.
Diagnostic ParameterParameter DesignationExpression
1No-load current from the j-th windingi0j,% i 0 j = U j н Z j j 100 I j н
2No-load losses from the j-th windingP0j P 0 j = U j н Z j j 2 Re Z j j
3Short-circuit impedance from the j-th windingZкj Z к j = 1 Y j j I j н U j н 100
4Short-circuit losses from the j-th windingPкj P к j = I j н 2 Re Y j j 1
5Transformation ratio (voltage transfer ratio)kZ k Z = Z 11 Z 12
6Current transfer ratiokY k Y = Y 12 Y 11
7Mutual active resistance between windingsRm R m = Re Z i j
8Mutual inductive reactance between windings (mutual inductance)Xm (M) X m = Im Z i j
M = ω 1 Im Z i j
9Active component of short-circuit impedanceRкj R к j = Re Y j j 1
10Inductive component of short-circuit impedance (short-circuit inductance)Xкj (Lкj) X к j = Im Y j j 1
  L к j = ω 1 Im Y j j 1
11Active resistance of the j-th windingRj R j = Re Z j j k j i Z j i
12Leakage inductive reactance of the j-th winding (leakage inductance of the j-th winding)Lσj L σ j = Im Z j j k j i Z j i
Table 5. Transformer Condition Indices Based on DGA Results.
Condition IndexState MappingInterpretation
1NWNormal Working
2NW on the vergeNormal Working (borderline)
3LTLow-Temperature Overheating
4PDPartial Discharge
5LPDCombined overheating and partial discharge
Table 6. Quality Metrics of the Developed Probabilistic Neural Network.
ClassPrecisionRecallF1-ScoreSupport
NW0.940.950.95357,801
PD0.590.990.7418,745
LPD0.570.460.5123,644
LT0.610.430.5040,810
Accuracy 0.88
Macro avg0.680.710.67441,000
Weighted avg0.870.880.87441,000
Table 7. Quality Metrics of Classification Using the Duval Method.
ClassPrecisionRecallF1-ScoreSupport
NW0.840.800.82357,801
PD0.290.260.2318,745
LPD0.000.000.0023,644
LT0.160.050.0940,810
Accuracy 0.67
Macro avg0.320.280.28441,000
Weighted avg0.700.670.68441,000
Table 8. Quality Metrics of Classification Using the Dornenburg Method.
ClassPrecisionRecallF1-ScoreSupport
NW0.930.130.23357,801
PD0.180.170.1718,745
LPD0.010.930.0123,644
LT0.070.000.0140,810
Accuracy 0.16
Macro avg0.300.310.10441,000
Weighted avg0.840.160.19441,000
Table 9. Some results of laboratory experiments on a physical transformer model.
Mode №Mode ParametersMeasured Voltages, VMeasured Currents, AZ-Parameter Matrix, Ohm
1Sampling frequency:
8 kHz
1—load 100%208.95223.26−26.96–104.78i−12.21–97.45i46.44 + 232.75i38.50 + 185.20i
2—load 61.5%228.52 + 19.63i231.24 + 24.45i33.00 + 130.65i14.58 + 121.23i39.09 + 185.47i32.61 + 147.17i
28 kHz
1—100%208.946211.4835.529–1.20i5.99–1.19i−87.22 + 66.56i−78.52 + 52.49i
2—97.3%228.52 + 19.63i237.40 + 19.79i−8.162 + 0.56i−8.725 + 0.575i−59.10 + 27.34i−65.41 + 20.29i
38 kHz
1—100%208.9462205.53–1.20i0.18–0.91i47.09 + 232.76i29.96 + 152.82i
2—no-load228.52 + 19.63i275.45 + 2.96i−8.16 + 0.56i055.83 + 292.06i39.63 + 189.97i
48 kHz
1—no-load22032.890.18–0.91i4.29–2.48i47.09 + 232.77i30.98 + 156.11i
2—short-circuit275.45 + 2.96i15.55 + 8.66i0−6.35 + 3.525i55.83 + 292.07i40.33 + 196.6i
5Sampling frequency: 50 kHz
1—100%211.94212.5−3.59 + 0.04i−3.68 + 0.06i72.94 + 210.76i48.46 + 163.94i
2—97.5%235.00 + 20.21i236.68 + 20.56i5.03–1.45i5.14–1.49i59.72 + 177.42i48.99 + 144.41i
650 kHz
1—100%211.936216.4975.894–1.162i0.249–0.944i56.56 + 214.42i33.23 + 144.84i
2—no-load235.00 + 20.21i265.97 + 2.04i−8.416 + 0.628067.46 + 263.95i42.61 + 176.32i
750 kHz
1—no-load216.49735.2530.25–0.94i4.47–2.25i56.56 + 214.42i33.49 + 135.87i
2—short-circuit265.97 + 2.04i16.89 + 8.27i0−6.96 + 3.43i67.46 + 263.95i43.37 + 167.82i
Disclaimer/Publisher’s Note: The statements, opinions and data contained in all publications are solely those of the individual author(s) and contributor(s) and not of MDPI and/or the editor(s). MDPI and/or the editor(s) disclaim responsibility for any injury to people or property resulting from any ideas, methods, instructions or products referred to in the content.