Abstract
The global shift towards renewable energy sources necessitates efficient methods for assessing solar potential in urban areas. Rooftop photovoltaic (PV) systems present a sustainable solution for decentralized energy production; however, their effectiveness is influenced by structural and environmental factors, including roof slope, azimuth, and shading. This study aims to develop and validate a UAV-based methodology for assessing rooftop solar potential in urban areas. The authors propose a low-cost, innovative tool that utilizes a commercial unmanned aerial vehicle (UAV), specifically the DJI Air 3, combined with advanced photogrammetry and 3D modeling techniques to analyze rooftop characteristics relevant to PV installations. The methodology includes UAV-based data collection, image processing to generate high-resolution 3D models, calibration and validation against reference objects, and the estimation of solar potential based on rooftop characteristics and solar irradiance data using the proposed Model Analysis Tool (MAT). MAT is a novel solution introduced and described for the first time in this study, representing an original computational framework for the geometric and energetic analysis of rooftops. The innovative aspect of this study lies in combining consumer-grade UAVs with automated photogrammetry and the MAT, creating a low-cost yet accurate framework for rooftop solar assessment that reduces reliance on high-end surveying methods. By being presented in this study for the first time, MAT expands the methodological toolkit for solar potential evaluation, offering new opportunities for urban energy research and practice. The comparison of PVGIS and MAT shows that MAT consistently predicts higher daily energy yields, ranging from 9 to 12.5% across three datasets. The outcomes of this study contribute to facilitating the broader adoption of solar energy, thereby supporting sustainable energy transitions and climate neutrality goals in the face of increasing urban energy demands.
1. Introduction
The global transition toward renewable energy sources necessitates improved methods for assessing solar potential in urban environments [1,2,3]. Rooftop photovoltaic (PV) systems offer a sustainable solution for decentralized energy production, yet their efficiency depends heavily on structural and environmental factors. Key parameters such as roof slope, azimuth, and shading play a crucial role in determining the feasibility and efficiency of solar panel installations [4].
To determine the parameters important for planning photovoltaic installations, roofs can be represented as 3D models. In order to create such models, spatial coordinates of their location must be obtained.
Traditional site assessments for PV installations involve on-site measurements or the use of Light Detection and Ranging (LiDAR) data, both of which can be time-consuming and costly [5,6]. Recent advances in Unmanned Aerial Vehicle (UAV)-based photogrammetry provide an alternative, enabling rapid and accurate roof analysis with minimal human intervention [7,8]. However, many existing solutions rely on expensive, specialized remote sensing equipment, limiting accessibility for widespread adoption [5].
Various methodologies have been developed to assess rooftop suitability for PV installations, with remote sensing and photogrammetry playing a crucial role in advancing solar potential estimation. Traditional approaches include manual on-site inspections and LiDAR data analysis, which provide high-precision surface models but are often cost-prohibitive. Recent advancements in Geographic Information System (GIS)-based modeling have enabled large-scale PV potential assessments using satellite imagery and digital surface models [9]. However, these methods often struggle with occlusions and inaccuracies due to low spatial resolution.
Recently, actions have also been undertaken to develop tools for collecting information on the usefulness of roofs for PV design. For instance, in study [10,11], UAV-derived 3D models were utilized to analyze rooftop solar potential, highlighting the method’s ability to accurately capture roof geometries and surrounding obstructions that impact solar exposure. Similarly, in paper [12], UAV technology was employed to obtain roof parameters affecting solar energy potential, including the determination of the area available for solar panels and estimating potential energy generation.
Regarding the development of tools for calculating rooftop solar exposure, several studies have introduced innovative methodologies. In [13], the authors presented SPAN, an open-source plugin designed for photovoltaic potential estimation of building rooftops, which utilizes UAV-derived data to assess solar potential. Additionally, in review [14], various methods for determining urban rooftop photovoltaic potential were discussed, including approaches that reconstruct virtual 3D roof segments and develop algorithms for fitting photovoltaic modules on rooftops.
Scientists also compared the possibility of obtaining data using UAV technology with other approaches. The study [15] aimed to assess the potential for installing solar photovoltaic (PV) panels on poultry house rooftops by accurately estimating their areas. Researchers employed a commercial UAV to capture overhead images of buildings. These images were processed using photogrammetry software to generate orthophotos and digital surface models. The study found that UAV-derived measurements had a mean error of 0.69% for planar dimensions, demonstrating high accuracy. Additionally, comparisons with satellite imagery indicated that satellite orthomosaics were more accurate for length estimations, while UAV orthomosaics were more precise for width measurements [16].
The use of UAVs has emerged as a promising alternative, offering rapid data acquisition, high-resolution imagery, and cost efficiency. Despite these advantages, most UAV-based solutions rely on high-end geodetic drones equipped with LiDAR or multispectral sensors, which limits their accessibility for widespread adoption [17].
This study proposes an innovative, low-cost tool leveraging a relatively inexpensive commercial UAV (DJI Air 3) instead of high-end geodetic drones or LiDAR scanners [18]. By utilizing affordable technology combined with advanced photogrammetry and 3D modeling techniques, the proposed approach offers an accessible and efficient method for determining roof characteristics and estimating solar power potential. The advantage of this approach lies in its affordability and adaptability. By leveraging widely available consumer-grade UAV technology, it reduces dependency on expensive LiDAR systems while maintaining high spatial accuracy.
The use of UAVs in environmental monitoring and photogrammetry has grown rapidly, yet several practical challenges constrain their adoption. Regulatory restrictions on flight zones, licensing, and data privacy may complicate mission planning [19,20]. UAV operations are also weather-dependent; strong winds, precipitation, or low visibility reduce both flight safety and image quality. Moreover, sensor limitations, including camera resolution, GNSS accuracy, and sensitivity to lighting, can affect the reliability of 3D reconstructions and geospatial data. These factors underscore the importance of careful mission design and equipment selection when applying UAVs in scientific studies.
The primary motivation behind this research is to enhance the accessibility and efficiency of rooftop solar assessments, particularly in regions where high-cost equipment is a limiting factor. As global urbanization increases energy demands [21], the ability to rapidly analyze potential solar sites at minimal cost becomes critical.
This study aims to develop and validate a UAV-based methodology for assessing rooftop solar potential in urban areas.
The detailed objectives of this study are:
- To develop a low-cost photogrammetry-based tool for extracting rooftop parameters relevant to PV installations.
- To provide an affordable, scalable solution that reduces reliance on expensive LiDAR or ground-based surveys, making solar assessments more accessible to a broader range of users.
The novelty of this study lies in the integration of consumer-grade UAVs, automated photogrammetry, and the tool into a unified, low-cost framework for rooftop solar assessment. Unlike existing methods that typically rely on LiDAR scanners, high-end geodetic UAVs, or costly ground-based surveys, the proposed approach leverages widely accessible commercial UAVs (DJI Air 3) in combination with advanced yet affordable photogrammetric processing. The innovation stems from (i) the ability to obtain high-accuracy 3D roof models using inexpensive hardware; (ii) the automation of rooftop parameter extraction through the proposed tool, which minimizes manual intervention; and (iii) the demonstration of cost-efficiency without compromising spatial accuracy, as validated by comparative studies.
By automating the assessment process and utilizing cost-effective drone technology, this tool aims to facilitate the wider adoption of solar energy, contributing to sustainable energy transitions and climate neutrality goals.
2. Methods
Methodology
The proposed study employs a combination of UAV-based photogrammetry and 3D modeling techniques to assess rooftop suitability for PV installations. The methodological framework consists of the following steps:
- Step 1: Data Collection
A commercial UAV (DJI Air 3) equipped with a wide-angle and telephoto camera captures high-resolution aerial images of rooftops. Flight paths are pre-planned using the DJI Mapper v. 1.2 tool to ensure comprehensive coverage.
- Step 2: Image Processing and 3D Reconstruction
Images are processed using Agisoft Metashape Pro to generate a high-resolution orthophoto and 3D models. Blender’s geometry nodes feature is utilized to extract roof-specific parameters such as slope, surface area, and azimuth.
At this stage, a proprietary tool has been developed—the Model Analysis Tool (MAT). The tool analyzes roof models using geometric data along with the provided input data to perform calculations. The calculation results are roof-specific attributes that enable further analysis regarding solar panel installations and allow for an estimation of their approximate energy performance.
The accuracy of the model is validated by using geospatial data (e.g., GeoTIFF files) for orientation corrections.
- Step 3: Solar Potential Estimation
A computational model predicts the peak solar energy production by integrating rooftop characteristics with solar irradiance data. Expected daily energy generation is estimated by considering local climate variables and PV panel efficiency.
At this stage, a MAT has also been used, which visualizes selected attributes by applying a gradient of two colors to improve the analysis of a large number of roofs.
The steps of the proposed methodology are presented in Figure 1.
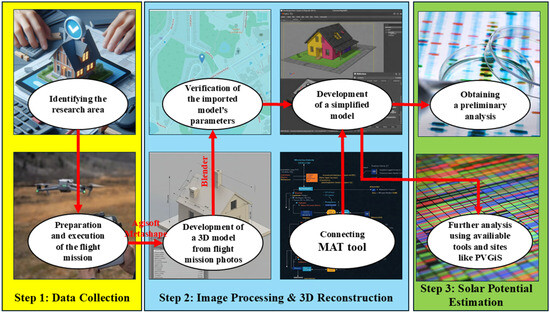
Figure 1.
Proposed methodology based on developed MAT.
3. Results
3.1. Data Collection
The study area selected for the research is a section of a single-family housing estate in Olsztyn, located on Świetlista Street. This location was chosen due to the street’s unusual shape, which results in buildings being positioned at varying orientations, with different alignments relative to the cardinal directions and distinct azimuths. This diversity in spatial arrangement provides an optimal setting for analyzing the effect of building orientation on various research parameters. The location of the study area is presented in Figure 2.
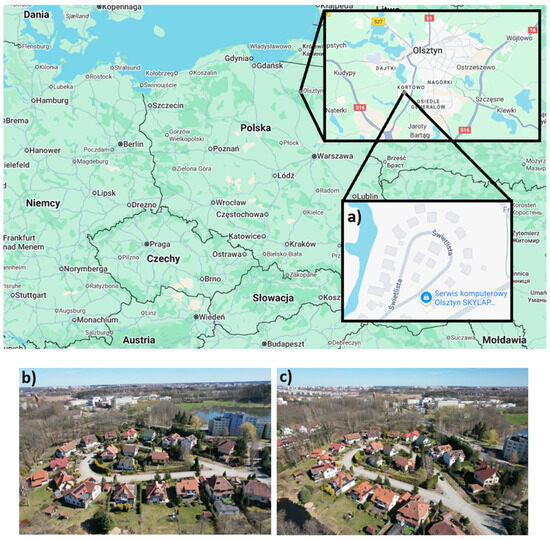
Figure 2.
Research object localization, (a) maps from Google Maps (downloaded on 20 February 2025), (b,c) photos from UAV.
3.2. Equipment
For the implementation of the project, we used the commercial unmanned aerial vehicle DJI Air 3 with the RC-N2 controller, equipped with a wide-angle camera and a medium telephoto lens. The UAV used for data collection is presented in Figure 3.
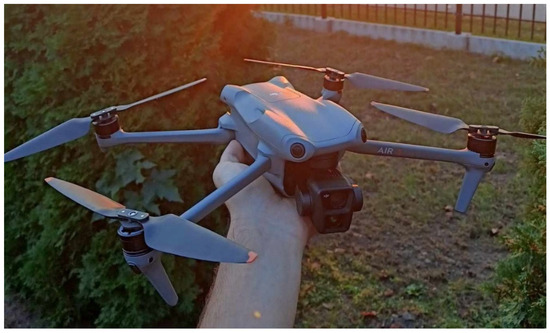
Figure 3.
UAV DJI Air 3 ready for measurements.
The technical parameters of the equipment used in the study are presented in Table 1.

Table 1.
Technical specification of the UAV DJI Air 3 with the RC-N2 controller.
For UAV route planning, the free DJI Mapper v. 1.2 application from Yaros Mallorca’s GitHub (v1.2) repository was utilized. This tool enabled the definition of the flight area along with key parameters such as the number of images, total coverage area, and flight distance. The application facilitates photogrammetric operations for unmanned aerial vehicles (UAVs) with a locked Software Development Kit (SDK). It is specifically designed for UAV models operating under the DJI Fly ecosystem, including the DJI Mini 4 Pro, DJI Air 3, DJI Mavic 3, Mavic 3 Cine, and Mavic 3 Classic.
The application integrates Google orthophoto maps and OpenStreetMap (OSM) as base mapping layers. Its functionality is based on calculating the UAV flight path coordinates along with georeferenced image capture points within the WGS84 coordinate system. By leveraging the georeferencing of the base map, the software ensures precise waypoint generation for aerial data acquisition.
The research area as displayed in the DJI Mapper v. 1.2 software is illustrated in Figure 4.
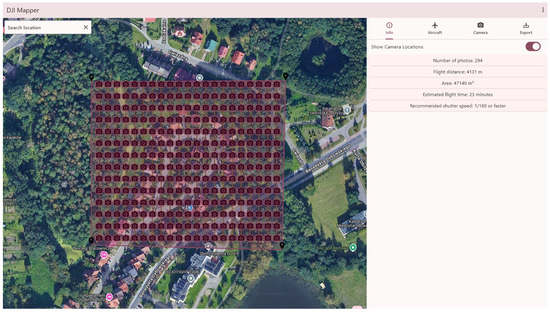
Figure 4.
The research area located in the DJI Mapper v. 1.2.
At the stage of preparing the UAV flight plan, a specially prepared data import and export methodology was needed.
Due to the use of the RC-N2 controller, the file import process required connecting the smartphone to a computer, from which the flight plan was subsequently imported as a Waypoint Mission file. Initially, after saving the newly designed flight plan, it was stored in the output.kmz format. Unfortunately, a file in this format is not correctly interpreted by the DJI Fly application. To successfully import the designed flight plan into DJI Fly, a new Waypoint Mission must first be created and saved within the application. After saving, the user must exit the application.
For Android users, the next step involves connecting the device to a computer and navigating to the designated directory via the file path: Android/data/dji.go.v5/files/waypoint. For iOS users, the corresponding directory is FILES/DJI Fly/wayline_mission/. Within the Waypoint folder, a subfolder is automatically generated, containing a *.kmz file that shares the same name as the subfolder. To properly integrate the pre-designed flight plan, the original mission file (output.kmz) must be renamed to match the filename generated during the initial mission creation. The modified file should then replace the existing *.kmz file within the appropriate directory.
By following this procedure, DJI Fly will successfully recognize and load the imported mission while preserving all predefined parameters. Figure 5 below shows an image from the DJI Fly application illustrating the correctly imported and interpreted flight plan.
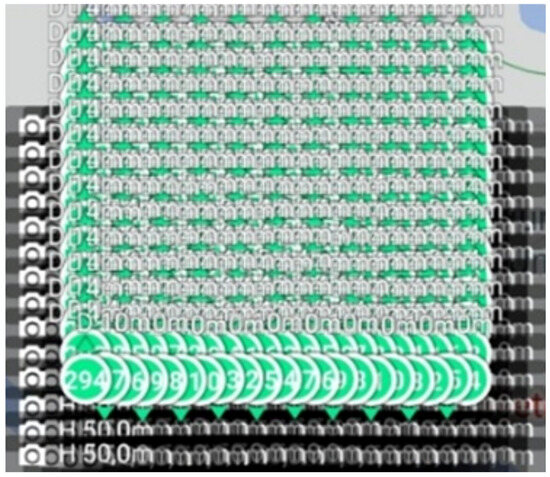
Figure 5.
Imported UAV flight plan (time of flight 19.12 min, distance 4.13 km).
Following the outlined procedure, a UAV flight was executed over the study area. The detailed flight plan is presented in the accompanying Figure 6.
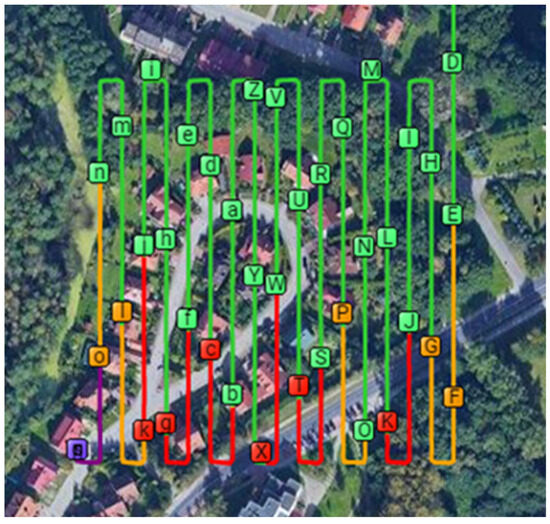
Figure 6.
The detailed flight plan (green is good signal, orange is fair, red is poor and purple is very poor).
The UAV flight parameters recorded during the mission indicate stable GPS satellite coverage and consistent altitude. At the start of the flight (1 min 02 s), the UAV maintained an altitude of 196.2 ft with a home distance of 0 ft, and the GPS satellite count ranged from 30 to 32, with the lowest recorded count being 30. By the end of the flight (22 min 32 s), the UAV had reached a distance of 1467 ft from the home point, with a slightly increased altitude of 196.8 ft. The GPS satellite count remained stable at 31, ensuring reliable positioning accuracy throughout the mission. For improved visibility of GPS satellite coverage, the color scale is based on the lowest satellite count within the special range. This information, as provided by the application, is presented in Table 2.

Table 2.
GPS satellite coverage and flight data summary.
3.3. Image Processing and 3D Reconstruction
Post-processing was conducted using Agisoft Metashape Pro. After importing 300 images into the software, an initial alignment process was performed to establish georeferencing. Following alignment, a sparse point cloud was generated. Utilizing tools such as “Filter by Confidence,” points with low confidence levels were identified and removed to enhance data accuracy in subsequent processing stages.
The next step involved generating a dense point cloud, which contained approximately 116.5 million points—an increase by a factor of 580 compared to the sparse point cloud, which consisted of 200,000 points. The dense point cloud served as the foundation for developing a high-quality 3D model, including a fully textured representation of the entire study area.
Below, in Figure 7, the three main stages of 3D model processing are presented.
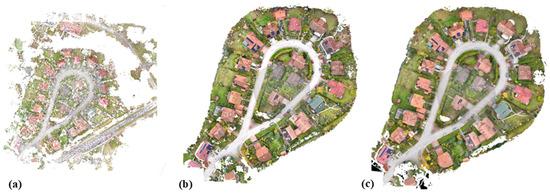
Figure 7.
Three main stages of 3D model processing, (a) tie points, (b) dense cloud, (c) 3D model.
The process of 3D reconstruction performed using Agisoft Metashape Pro is divided into three main sections:
- The Tie Points section indicates that 197,078 out of 225,672 points were used, with colors represented in 3 bands (RGB) in uint8 format. The average tie point multiplicity is 3.80214. Alignment parameters include high accuracy and the use of generic preselection to optimize processing.
- The Dense Cloud section details the generation of a high-density point cloud, consisting of approximately 116.5 million points, with color information stored in three bands (RGB). The depth map generation parameters include high quality, moderate filtering mode, and a maximum of 16 neighbors.
- The Model section describes the final 3D model, which consists of 12,142,973 faces and 6,077,213 vertices. Vertex colors are stored in 3-band (RGB) uint8 format, while the texture resolution is 8192 × 8192 with four bands. The depth map generation parameters remain consistent, with high quality and moderate filtering model.
The next software used in processing the acquired datasets was Blender, a free open-source software released and developed since 1995. Blender offers a vast array of tools, including those for 3D and 2D modeling, animation, 3D graphics, and simulation. Additionally, Blender allows for the creation of custom tools using Python v. 3.11 or its block-based language. Due to its popularity and long development history, learning Blender is extremely straightforward, and the capabilities it provides draw significant attention in various industries.
In this software, the position and orientation of the model were compared to the existing GeoTIFF files. To verify the metric accuracy and georeferencing of the point cloud independent check points were used.
The process of checking the correctness of the point cloud georeferencing in the initial model is presented in Figure 8.
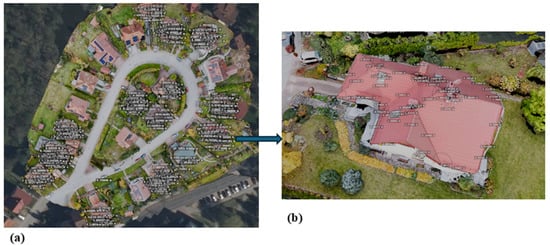
Figure 8.
Checking the correctness of the cloud georeferencing along with the displayed coordinates of points located on the roofs of buildings.
The next stage of processing is creating a simplified 3D models of buildings located in the study area while keeping the complexity of roofs. The generated 3D models of buildings are presented in Figure 9.
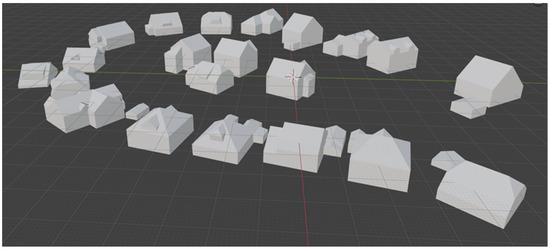
Figure 9.
Three-dimensional building models.
Model Analysis Tool (MAT)
The prepared 3D model must meet certain conditions to be implemented in the Model Analysis Tools. First, it must be free of excess data that could slow down the program (simplification of the input model). Second, it must be correctly oriented in space, which allows for accurate azimuth calculations. The last condition is that the scale and dimensions of the objects must be correct, enabling the calculation of roof slopes and areas.
The MAT utilizes the existing Geometry Nodes system in Blender. MAT is an original solution designed for analyzing roof models in the context of their suitability for photovoltaic design. The tool examines the geometric properties of the roof, such as the coordinates of the corners and the heights of the lowest and highest edges of the model. Based on this data, it determines the attributes required for further analysis of roofs regarding their potential use for photovoltaics, including azimuth, slope, usable roof area, and the maximum efficiency of the designed photovoltaic installation.
In addition to providing roof attributes for further analysis, the tool also uses these attributes to perform subsequent calculations, including a preliminary estimation of the daily energy production of the designed photovoltaic installation, based on the determined attributes and the input data provided.
The diagram in Figure 10 shows the order of calculations performed in the MAT and indicates which data are used in each step.
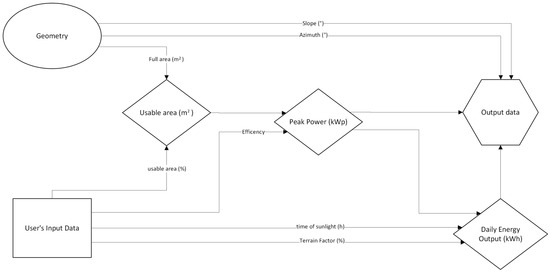
Figure 10.
Diagram of MAT’s calculations.
Based on the diagram, there are two types of input data. User input data that consists of values like: percentage of the roof’s total area that can be used for solar panels, efficiency of solar panels tested in study area, average daily hours of sunlight in study area and terrain factor. Values for each input data can be changed based on location and type of solar panels used on each roof. The other type of input data is based on the geometry of the roof that is calculated automatically for each roof individually inside the MAT by utilizing Blender’s Geometry nodes.
Geometry in Blender can be divided into three groups: vertices (point in 3D space), edges (lines connecting two vertices) and face (areas defined by at least three vertices and 3 edges between these points, that are on the same plane). Each of these groups has their own attributes, like coordinates for vertices or the direction that the face is oriented, called in Blender the “Normal”. Geometry nodes are used to utilize these attributes and other existing algorithms to calculate the required parameters of the roof. These are “Face area” to calculate the full area of the roof in m2 and “Normals” to calculate the slope and azimuth of the roof.
Having all input data, MAT begins to calculate the usable area of the roof, peak power of the solar panels and daily energy output and returns every value connected to the Output Data.
The MAT user interface and an example of a roof displayed with the calculated parameters are presented in Figure 11.
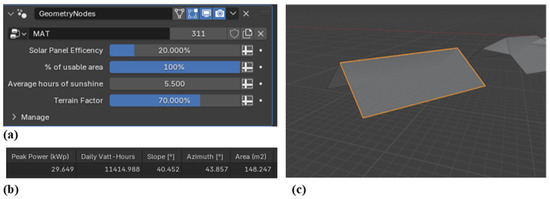
Figure 11.
The MAT user interface, (a) input geometry attributes, (b) calculated parameters, (c) roof.
The Geometry Nodes system, designed for modifying and extracting data from an object’s geometry, is highly adaptable and offers a wide range of tools. Instead of relying on a standard coding language, it uses node-based operations, making it both easy to read and accessible for new users. This system allows our tool, MAT, to go beyond simply estimating daily energy production and serve as a solution that provides precise numerical results.
As a novel tool introduced in this study, MAT represents an original and low-cost alternative to commercial photovoltaic assessment software. By combining UAV data with Blender’s open-source environment, it provides an accessible and practical framework for rooftop solar potential evaluation, lowering both financial and technical barriers.
3.4. Solar Potential Estimation
Solar potential estimation is a critical step in evaluating the feasibility and expected energy yield of rooftop PV installations. The proposed methodology integrates UAV-based 3D modeling with computational analysis to assess rooftop characteristics and estimate solar energy production.
Initially, a high-resolution 3D model of the research area is generated using photogrammetric techniques in Agisoft Metashape Pro. The model undergoes refinement in Blender, where geometric corrections ensure accurate spatial representation. The MAT is then applied to extract essential rooftop attributes, including azimuth, slope, and usable surface area, which directly influence solar energy capture efficiency.
Solar irradiance data, obtained from publicly available meteorological datasets, is integrated into the estimation process. The computational model predicts peak solar energy production by considering daily and seasonal variations in solar insolation. The expected daily energy generation is calculated by first calculating the peak power of the array, which is used then to compute the daily energy generation using:
where
- P—peak power that array can produce (kWp)
- —is the usable rooftop area (m2), calculated automatically for each roof with the MAT based on its total area and percentage of the roof’s total usable area,
- —is the overall PV system efficiency (value of 20% efficiency was used for all solar panels)
- —represents the estimated daily energy output (kWh),
- St—average amount of sunlight (h), 5.5 h were used for this study area
- Tf—terrain factor, inefficiencies caused by environment like shading, generally between 0.70 and 0.85, in this project 0.70 was used.
The MAT uses both equations for each studied roof to calculate the array’s peak power and daily energy output based on input values and geometry of the roof.
The MAT also applies a color-gradient visualization technique to highlight the solar potential of multiple rooftops within the study area, aiding in comparative analysis. The graphical presentation of results are shown in Figure 12.
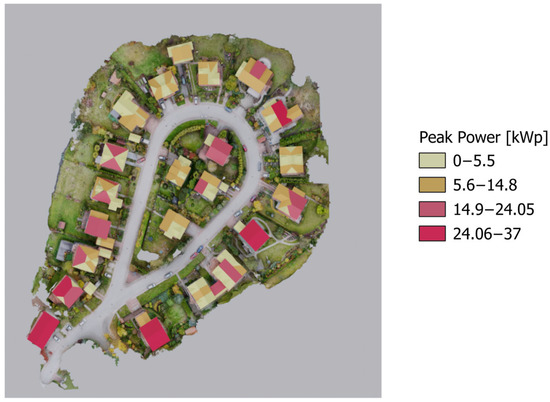
Figure 12.
Peak power across studied area.
The visualization is based on a color-gradient scheme, where different rooftops are categorized according to their estimated peak power generation capacity (measured in kilowatts peak, kWp). The legend defines the color mapping:
- light beige (0–5.5 kWp) represents rooftops with the lowest solar potential,
- light red (5.6–14.8 kWp) indicates moderate solar potential,
- darker red (14.9–24.05 kWp) highlights rooftops with a relatively higher power output,
- dark red (24.06–37 kWp) marks rooftops with the highest estimated solar generation capacity.
The spatial distribution of solar potential varies across the neighborhood, with certain rooftops demonstrating significantly higher peak power values.
3.5. Selecting Roof Sections Suitable for Solar Panels
Having computed peak power across studied area, estimated daily energy output can be calculated for each roof section. The MAT calculates this value only for roofs with azimuth less than 90 degrees, to ensure that the roof is facing the Sun. Assuming the average daily energy usage is around 30 kWh, the percentage of energy that would be covered by solar panels for that household can be computed. The results of these calculations are shown in Figure 13 and Table 3.
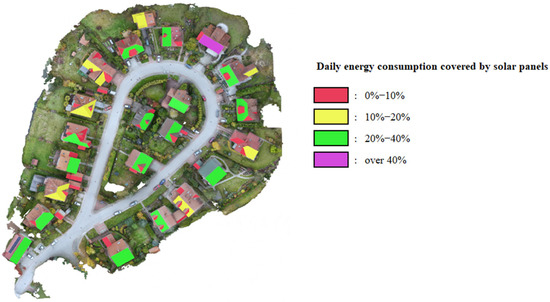
Figure 13.
Daily energy consumption covered by solar panels.

Table 3.
Number of roof sections covering daily energy consumption.
Table 3 shows that most of the roof sections are not applicable, meaning their azimuth is higher than 90 degrees and they are not facing the Sun. Among the remaining sections, the majority cover less than 10% of the daily energy consumption. The best roof sections for installing solar panels are those that can cover at least 10% of the daily energy consumption; these account for approximately 11% of all roof segments.
Figure 14 graphically illustrates the distribution of each type of roof segment. It also shows that every house has at least one roof segment capable of covering at least 10% of the daily energy consumption, making it suitable for potential solar panel installation.
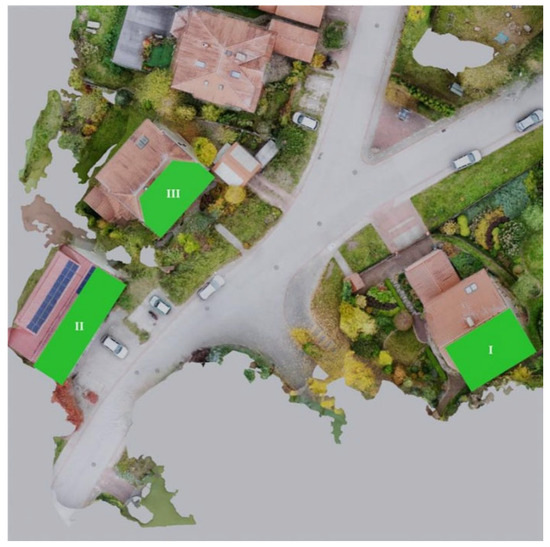
Figure 14.
Buildings roofs used for comparison (where I, II, III are parts of the roofs of buildings).
4. Discussion
To validate the MAT’s daily energy production calculations, its results were compared with those from PVGIS using the three buildings (I, II, III) parts of roofs with lowest azimuth shown in Figure 14.
Table 4 lists the input data for calculating average daily energy production, while Table 5 presents the calculated values of radiation intensity using MAT and PVGIS.

Table 4.
The input data.

Table 5.
Comparison between PVGIS and MAT results.
The comparison between the PVGIS and MAT for daily energy production calculations is presented in the tables. Table 4 outlines the input parameters used in both tools, highlighting the differences in data utilization. Parameters such as latitude, longitude, peak power, and slope are used exclusively in PVGIS, while solar panel efficiency, average hours of sunshine, and terrain factor are specific to MAT. The azimuth and area values are included in both tools, ensuring some degree of consistency in the input data. Variations in peak power, slope, azimuth, and area across the three datasets (I, II, III) indicate potential influences on the final energy production calculations.
Table 5 presents the results of the average daily energy production estimated by both tools. In all three datasets, the MAT consistently predicts higher energy yields compared to PVGIS. In Set I, MAT estimates an output of 105.593 kWh/d, which is 12% higher than PVGIS (94.312 kWh/d). Similarly, in Set II, the MAT predicts 98.364 kWh/d, surpassing the PVGIS estimation of 87.434 kWh/d by 12.5%. In Set III, the difference is slightly smaller, with MAT estimating 71.656 kWh/d compared to 65.646 kWh/d in PVGIS, resulting in a 9.2% increase.
These discrepancies can be attributed to the fact that MAT, in calculations, uses broad values for average amount of sunlight, which can vary dramatically across the year, and a terrain factor which is an assumed value based on urban characteristics of the area.
The current methodology is limited by accuracy of 3D models which are directly used for calculations. If 3D model is inaccurate then final results may be unreliable. Therefore, when planning a flight, it is essential to consider sensor constraints and complexity of roofs to ensure the highest 3D model accuracy. Furthermore, the MAT generalizes environmental conditions of the study area, meaning that the accuracy of the results may vary throughout the year.
Due to these discrepancies in the current form, the MAT is best suited for short-term analysis on small areas as a preliminary analysis. The structure of MAT allows it to be improved by using more accurate input data instead of broad ones, or by adding new modules to calculate them inside the program, which will be the next step in the research.
5. Conclusions
The proposed solution represents a significant advancement in addressing the identified problem by introducing an innovative and practical approach. By utilizing consumer-grade UAVs, automated photogrammetry, and computational modeling, this methodology offers a scalable and cost-effective solution for assessing rooftop solar potential. The automation and affordability of the process enhance accessibility, paving the way for the broader adoption of decentralized solar energy solutions in urban environments.
Solar potential is influenced by factors such as roof orientation, surface area, shading, and potential obstructions. The analysis of roofs in terms of their suitability for mounting PV installations was conducted using the MAT, which applies an automated classification method to estimate and visualize solar energy potential. This graphical representation facilitates comparative analysis and supports decision-making regarding solar panel placement and energy optimization within the study area.
Moreover, the research highlights potential future improvements that could further refine the model, making it adaptable to evolving industry needs. The proposed approach can reduce the cost of data acquisition by implementing the solution based on the MAT. The MAT plays a crucial role in the proposed methodology, as it enables precise modeling and simulation, providing accurate PV installation performance predictions.
The study showed that the PV energy production potential in the analyzed area varied (0–37 kWp), and the choice of calculation tool influenced the results. MAT yielded values on average ~11% higher than PVGIS. The installations can achieve annual production of 24–38 MWh, confirming the profitability of investing in micro-PV installations in Polish climatic conditions.
The results indicate that, despite the fact that the majority of roof sections are not optimally oriented with respect to solar azimuth, each analyzed building possesses at least one roof segment capable of supplying more than 10% of the daily energy demand. These findings confirm the technical feasibility of implementing photovoltaic systems in residential buildings and demonstrate the potential for achieving partial energy self-sufficiency even under conditions of limited roof suitability. Future work will refine the methodology by incorporating advanced shading analysis, seasonal variability, and larger datasets to enhance accuracy and adaptability. The approach has a broader societal impact by enabling cost-effective and scalable assessment of rooftop solar potential, supporting decentralized energy adoption in urban communities. Economically, the results confirm the profitability of micro-PV installations in Polish conditions, with the MAT offering improved performance predictions and reduced data acquisition costs, thereby strengthening the feasibility of widespread implementation.
In conclusion, the proposed methodology provides a robust and innovative framework that delivers tangible benefits in terms of efficiency, cost-effectiveness, and adaptability, making it a promising solution for future implementation. In particular, the introduction of the MAT represents a novel and low-cost contribution, enabling precise yet affordable assessment of rooftop solar potential. Its originality and accessibility make it a valuable addition to the methodological toolkit, supporting broader adoption of photovoltaic systems.
Author Contributions
Conceptualization, M.P., A.O.; methodology, W.B.-B., M.P., A.O.; software, M.P., A.O.; validation, W.B.-B., M.P. and A.O.; formal analysis, W.B.-B., M.P. and A.O.; investigation, W.B.-B., M.P. and A.O.; resources, W.B.-B., M.P. and A.O.; data curation, M.P., A.O.; writing—original draft preparation, W.B.-B., M.P. and A.O.; writing—review and editing, W.B.-B., M.P., A.O. and G.G.; visualization, W.B.-B., M.P. and A.O.; supervision, W.B.-B., G.G.; project administration, W.B.-B., G.G. All authors have read and agreed to the published version of the manuscript.
Funding
This research received no external funding.
Data Availability Statement
The raw data of measurements will be made available on request.
Conflicts of Interest
The authors declare no conflict of interest.
References
- Li, D.; Bou-Zeid, E.; Oppenheimer, M. The Effectiveness of Cool and Green Roofs as Urban Heat Island Mitigation Strategies. Environ. Res. Lett. 2014, 9, 055002. [Google Scholar] [CrossRef]
- Huang, X.; Hayashi, K.; Matsumoto, T.; Tao, L.; Huang, Y.; Tomino, Y. Estimation of Rooftop Solar Power Potential by Comparing Solar Radiation Data and Remote Sensing Data—A Case Study in Aichi, Japan. Remote Sens. 2022, 14, 1742. [Google Scholar] [CrossRef]
- Taminiau, J.; Byrne, J.; Kim, J.; Kim, M.H.; Seo, J. Inferential- and Measurement-Based Methods to Estimate Rooftop “Solar City” Potential in Megacity Seoul, South Korea. Wiley Interdiscip. Rev. Energy Environ. 2022, 11, e438. [Google Scholar] [CrossRef]
- Diab, A.A.Z.; Sultan, H.M.; Aljendy, R.; Al-Sumaiti, A.S.; Shoyama, M.; Ali, Z.M. Tree Growth Based Optimization Algorithm for Parameter Extraction of Different Models of Photovoltaic Cells and Modules. IEEE Access 2020, 8, 119668–119687. [Google Scholar] [CrossRef]
- Lukač, N.; Seme, S.; Žlaus, D.; Štumberger, G.; Žalik, B. Buildings Roofs Photovoltaic Potential Assessment Based on LiDAR (Light Detection and Ranging) Data. Energy 2014, 66, 598–609. [Google Scholar] [CrossRef]
- Srećković, N.; Lukač, N.; Žalik, B.; Štumberger, G. Determining Roof Surfaces Suitable for the Installation of PV (Photovoltaic) Systems, Based on LiDAR (Light Detection and Ranging) Data, Pyranometer Measurements, and Distribution Network Configuration. Energy 2016, 96, 404–414. [Google Scholar] [CrossRef]
- Harikesh; Singh, S.; Shrivastava, V.; Sharma, V. CityGML Based 3D Modeling of Urban Area Using Uav Dataset for Estimation of Solar Potential. In International Conference on Unmanned Aerial System in Geomatics; Springer International Publishing: Cham, Switzerland, 2020; Volume 51, pp. 355–367. [Google Scholar]
- Milidonis, K.; Eliades, A.; Grigoriev, V.; Blanco, M.J. Unmanned Aerial Vehicles (UAVs) in the Planning, Operation and Maintenance of Concentrating Solar Thermal Systems: A Review. Solar Energy 2023, 254, 182–194. [Google Scholar] [CrossRef]
- Yang, Q.; Huang, T.; Wang, S.; Li, J.; Dai, S.; Wright, S.; Wang, Y.; Peng, H. A GIS-Based High Spatial Resolution Assessment of Large-Scale PV Generation Potential in China. Appl. Energy 2019, 247, 254–269. [Google Scholar] [CrossRef]
- Nelson, J.R.; Grubesic, T.H. The Use of LiDAR versus Unmanned Aerial Systems (UAS) to Assess Rooftop Solar Energy Potential. Sustain. Cities Soc. 2020, 61, 102353. [Google Scholar] [CrossRef]
- Choi, Y.; Suh, J.; Kim, S.M. GIS-Based Solar Radiation Mapping, Site Evaluation, and Potential Assessment: A Review. Appl. Sci. 2019, 9, 1960. [Google Scholar] [CrossRef]
- Yuliza, E.; Lizalidiawati, L.; Ekawita, R. The Effect of Tilt Angle and Orientation of Solar Surface on Solar Rooftop Miniature System in Bengkulu University. Int. J. Energy Environ. Eng. 2021, 12, 589–598. [Google Scholar] [CrossRef]
- Özdemir, S.; Yavuzdoğan, A.; Bilgilioğlu, B.B.; Akbulut, Z. SPAN: An Open-Source Plugin for Photovoltaic Potential Estimation of Individual Roof Segments Using Point Cloud Data. Renew. Energy 2023, 216, 119022. [Google Scholar] [CrossRef]
- Fakhraian, E.; Forment, M.A.; Dalmau, F.V.; Nameni, A.; Guerrero, M.J.C. Determination of the Urban Rooftop Photovoltaic Potential: A State of the Art. Energy Rep. 2021, 7, 176–185. [Google Scholar] [CrossRef]
- Koc, A.B.; Anderson, P.T.; Chastain, J.P.; Post, C. Estimating Rooftop Areas of Poultry Houses Using Uav and Satellite Images. Drones 2020, 4, 76. [Google Scholar] [CrossRef]
- Surmen, H.K. Photogrammetry for 3D Reconstruction of Objects: Effects of Geometry, Texture and Photographing. Image Anal. Stereol. 2023, 42, 51–63. [Google Scholar] [CrossRef]
- Nguyen, H.T.; Pearce, J.M.; Harrap, R.; Barber, G. The Application of LiDAR to Assessment of Rooftop Solar Photovoltaic Deployment Potential in a Municipal District Unit. Sensors 2012, 12, 4534–4558. [Google Scholar] [CrossRef] [PubMed]
- Mugnai, F.; Tucci, G. A Comparative Analysis of Unmanned Aircraft Systems in Low Altitude Photogrammetric Surveys. Remote Sens. 2022, 14, 726. [Google Scholar] [CrossRef]
- Pochwała, S.; Gardecki, A.; Lewandowski, P.; Somogyi, V.; Anweiler, S. Developing of Low-Cost Air Pollution Sensor—Measurements with the Unmanned Aerial Vehicles in Poland. Sensors 2020, 20, 3582. [Google Scholar] [CrossRef] [PubMed]
- Alamouri, A.; Lampert, A.; Gerke, M. Impact of Drone Regulations on Drone Use in Geospatial Applications and Research: Focus on Visual Range Conditions, Geofencing and Privacy Considerations. PFG J. Photogramm. Remote Sens. Geoinf. Sci. 2023, 91, 381–389. [Google Scholar] [CrossRef]
- Gawley, D.; McKenzie, P. Investigating the Suitability of GIS and Remotely-Sensed Datasets for Photovoltaic Modelling on Building Rooftops. Energy Build. 2022, 265, 112083. [Google Scholar] [CrossRef]
Disclaimer/Publisher’s Note: The statements, opinions and data contained in all publications are solely those of the individual author(s) and contributor(s) and not of MDPI and/or the editor(s). MDPI and/or the editor(s) disclaim responsibility for any injury to people or property resulting from any ideas, methods, instructions or products referred to in the content. |
© 2025 by the authors. Licensee MDPI, Basel, Switzerland. This article is an open access article distributed under the terms and conditions of the Creative Commons Attribution (CC BY) license (https://creativecommons.org/licenses/by/4.0/).