Author Contributions
Conceptualization, M.K., T.P. and H.W.; methodology, M.K., T.P. and H.W.; validation, M.K., T.P. and H.W.; investigation, M.K., T.P. and H.W.; analysis, M.K. and D.W.; data curation, M.K. and D.W.; writing—original draft preparation, M.K.; writing—review and editing, M.K. and T.P.; theoretical modeling, M.K. and T.P.; software, M.K., T.P. and H.W.; resources, D.W.; visualization, M.K., T.P. and H.W.; supervision, M.K. and T.P.; project administration, T.P. All authors have read and agreed to the published version of the manuscript.
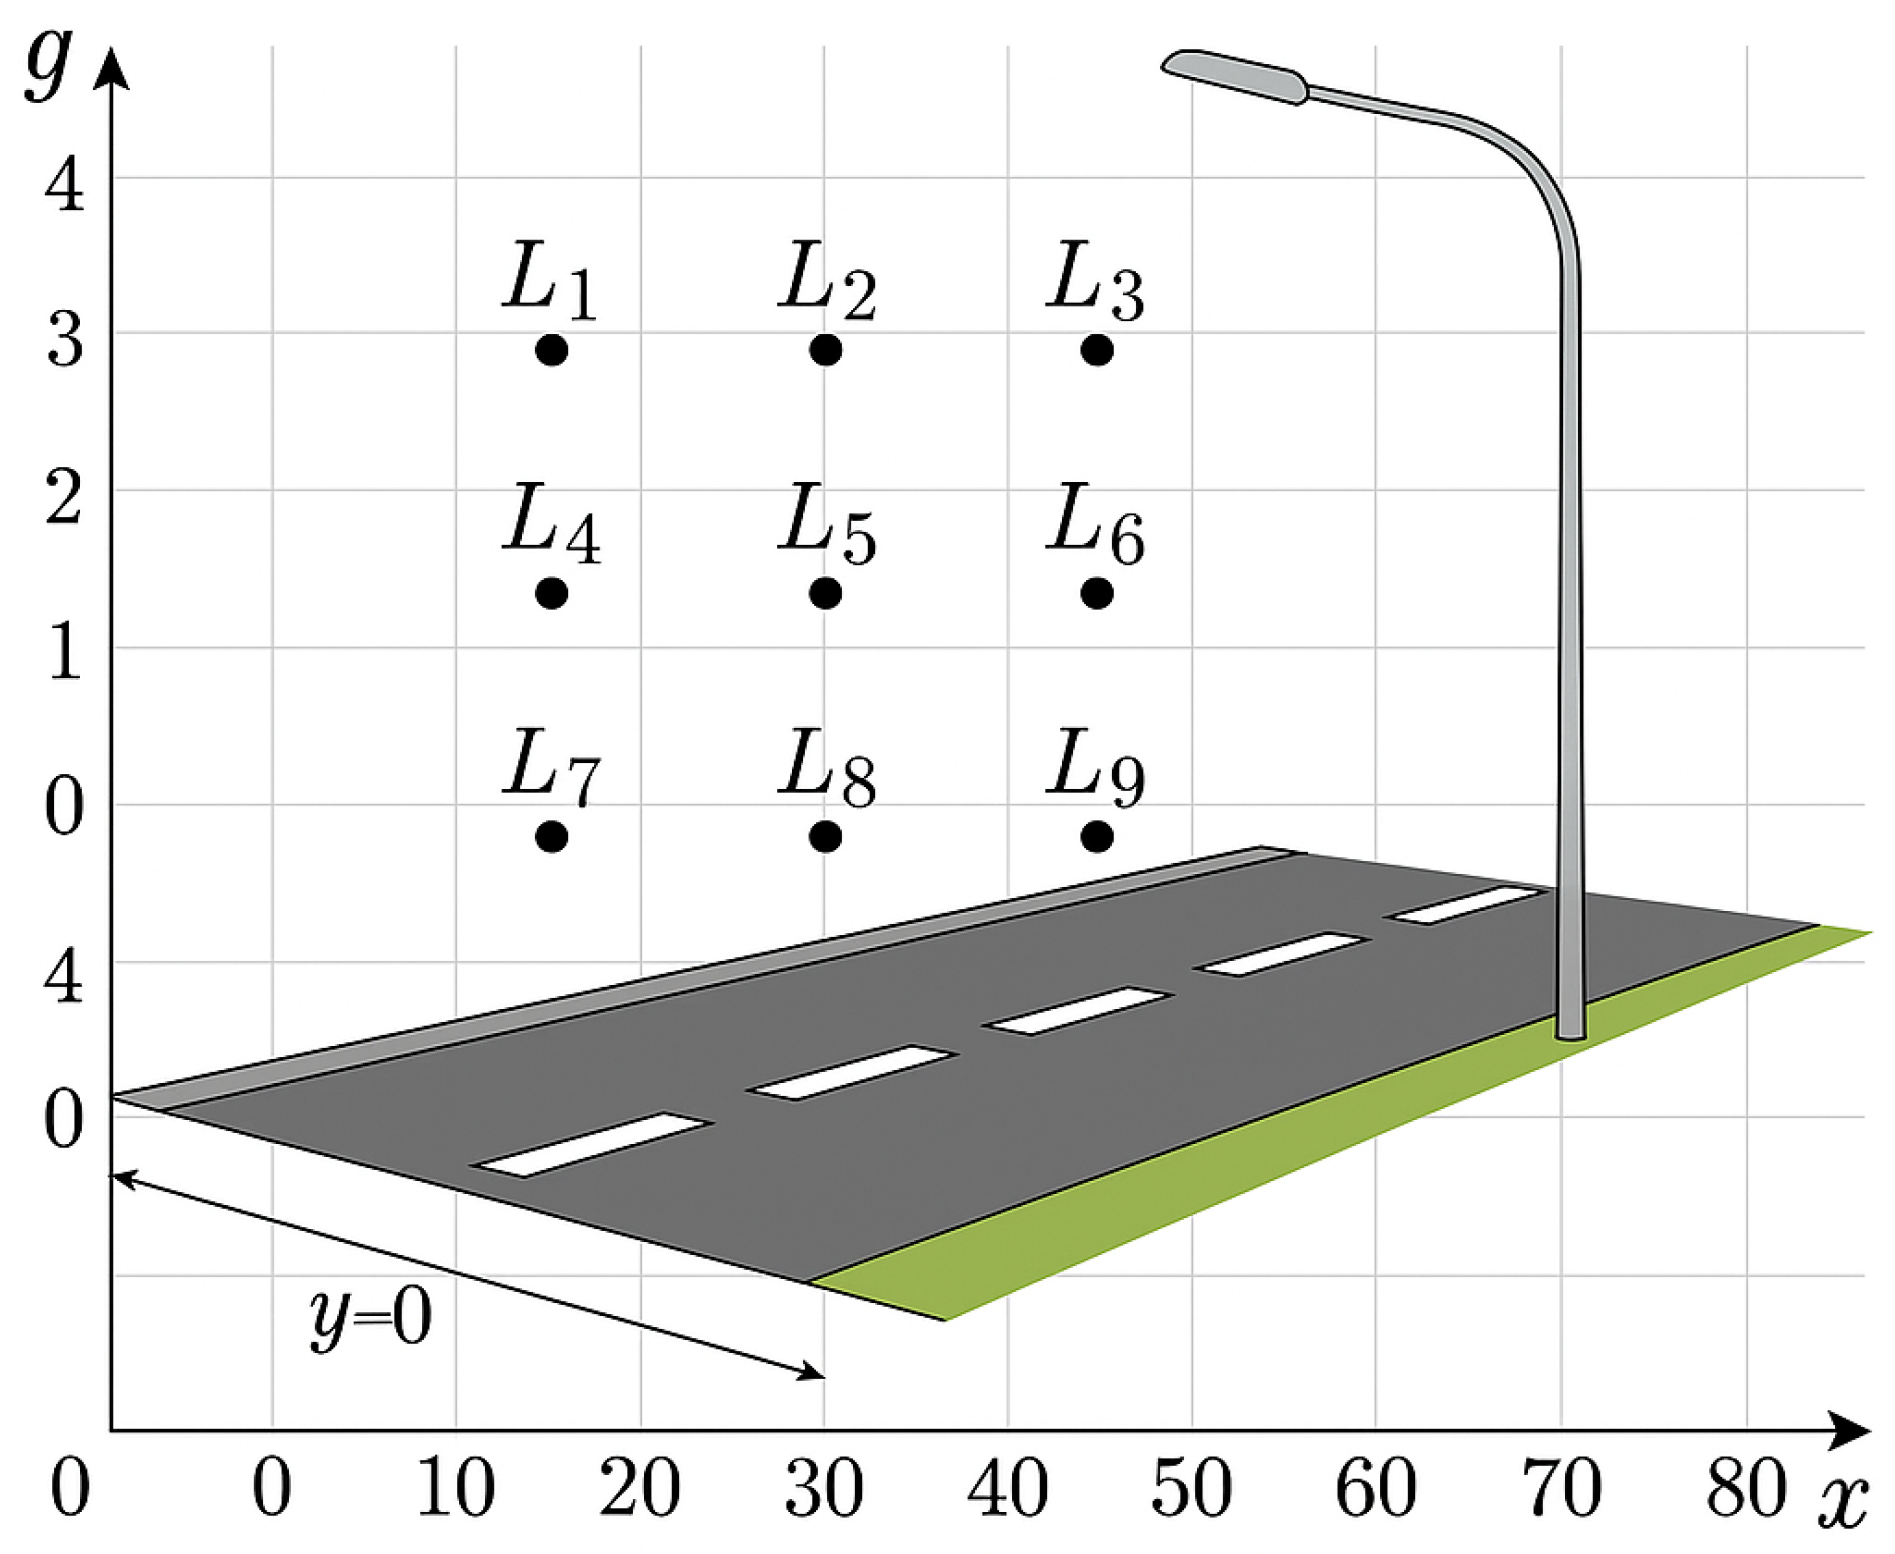
Figure 1.
Luminance measurement points on a road according to normative requirements in Poland. Source: author’s own study.
Figure 1.
Luminance measurement points on a road according to normative requirements in Poland. Source: author’s own study.
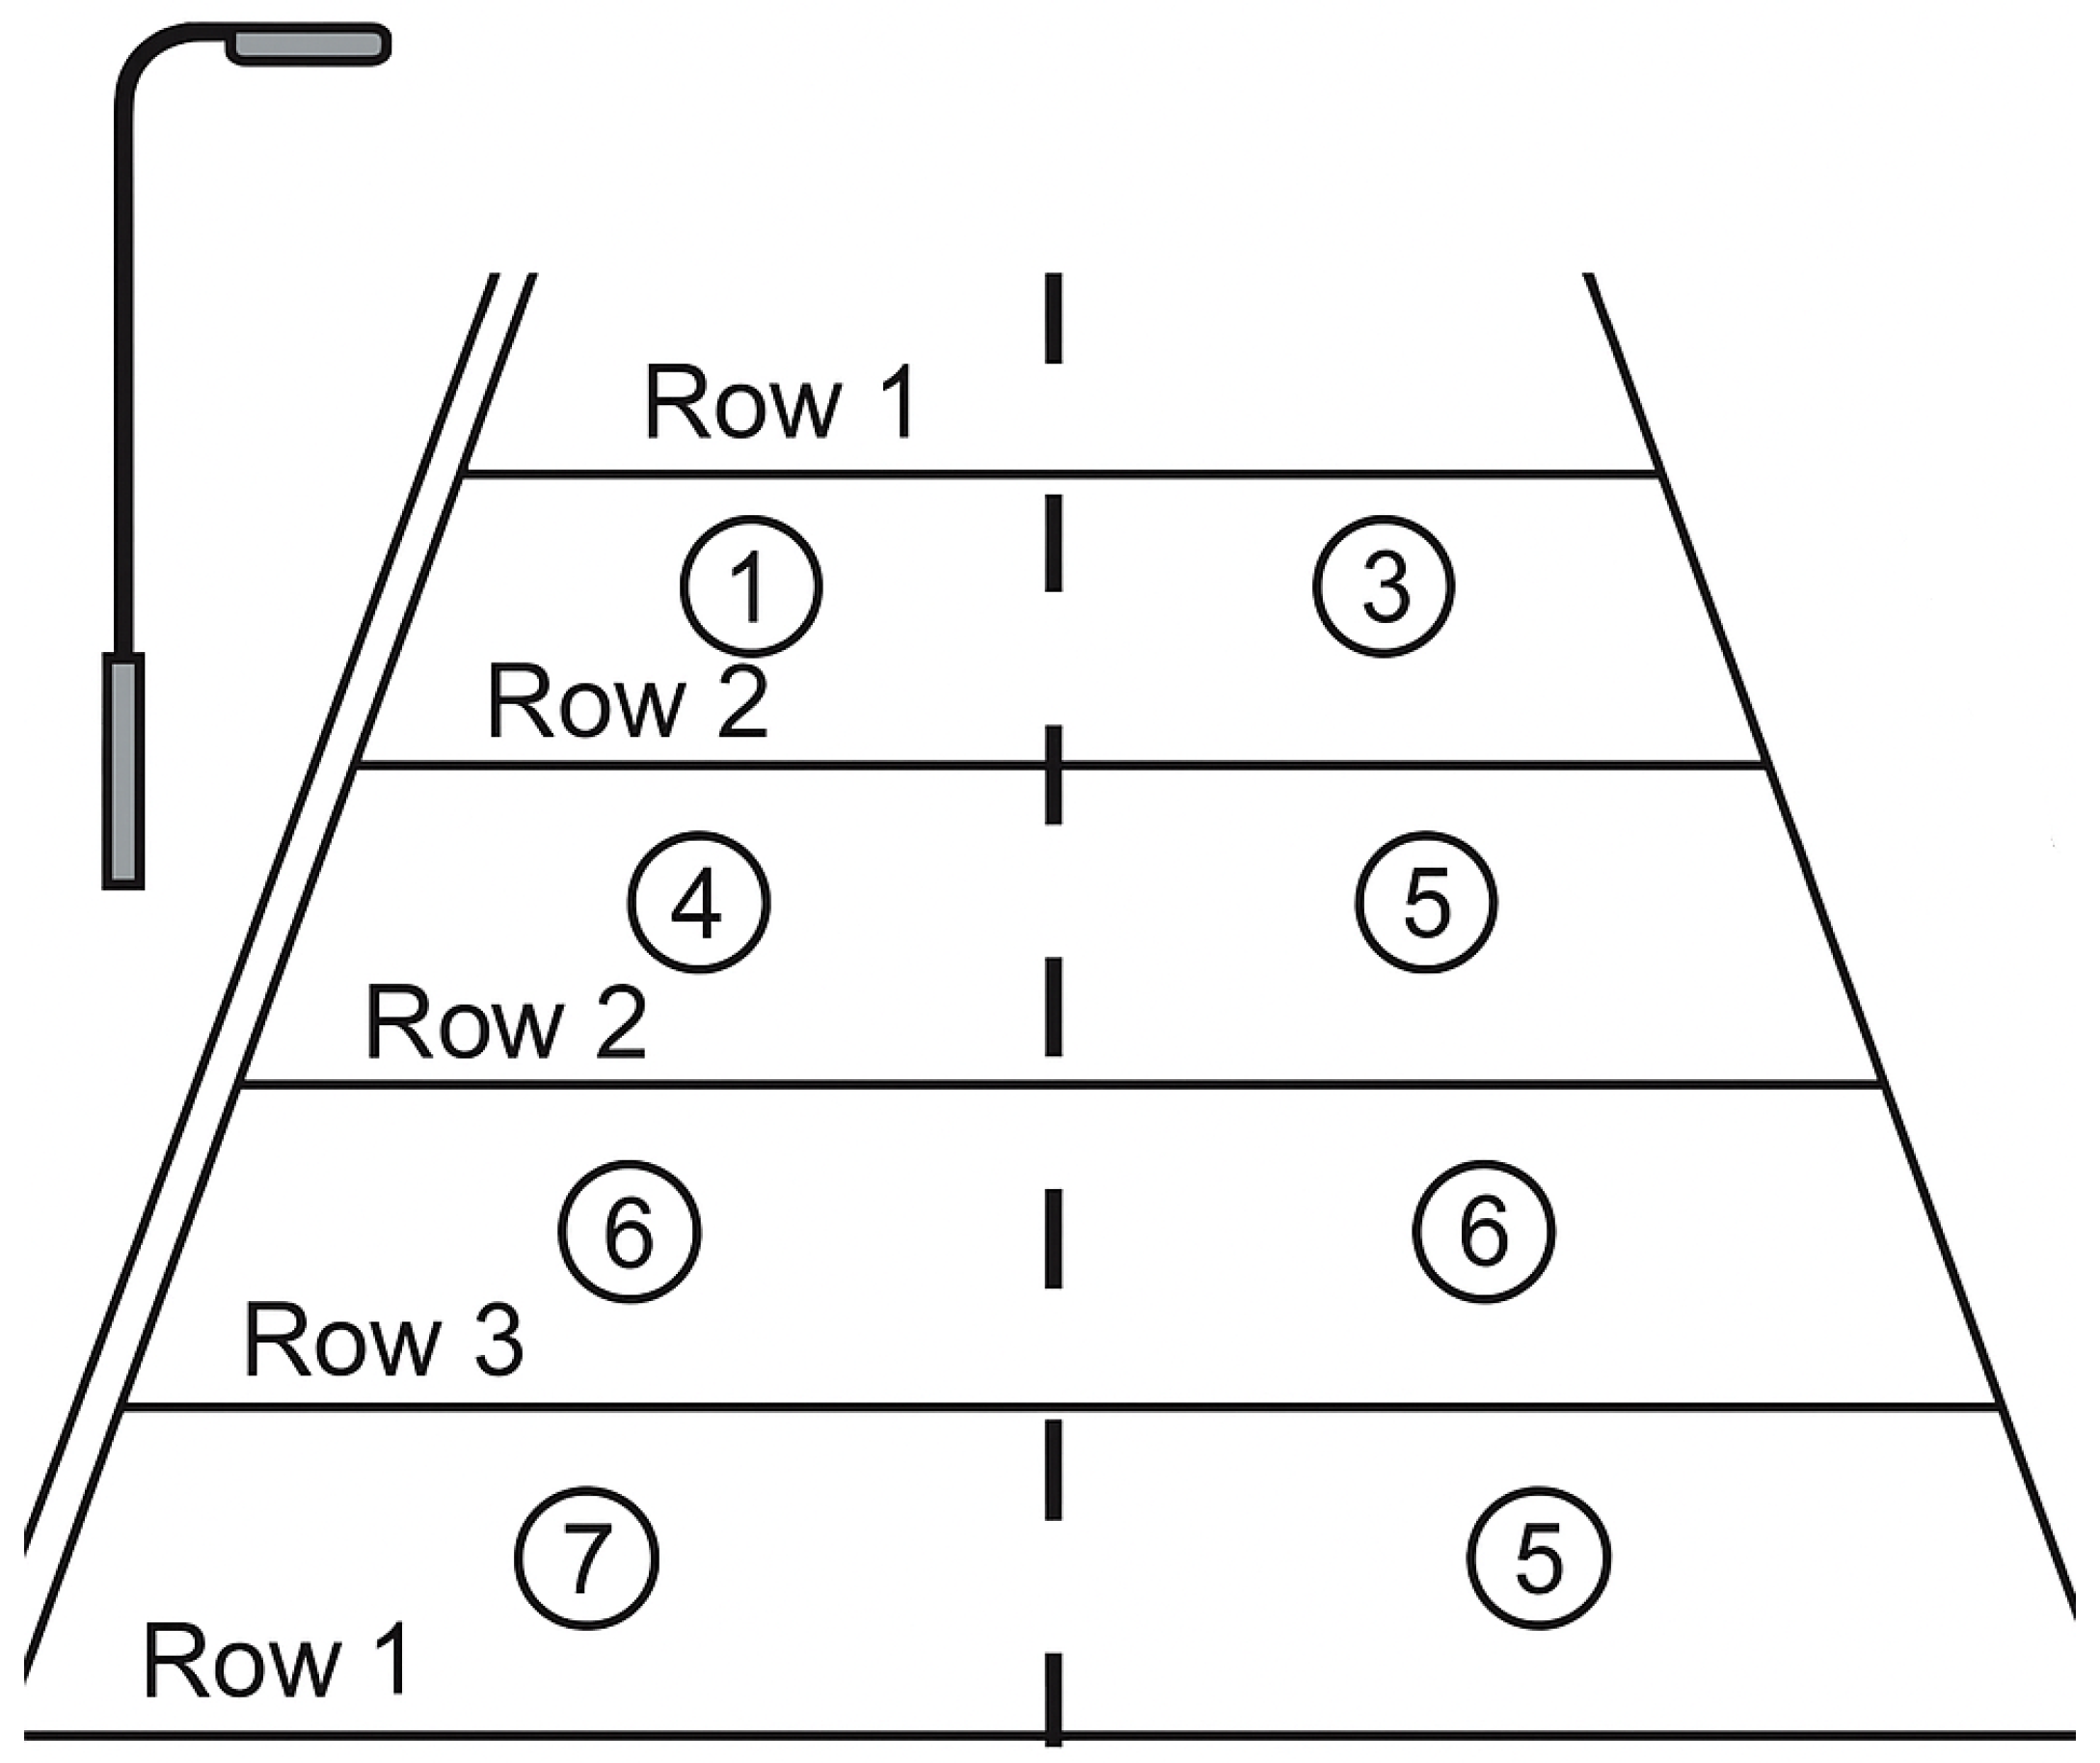
Figure 2.
Luminance measurement points. Source: author’s own study.
Figure 2.
Luminance measurement points. Source: author’s own study.
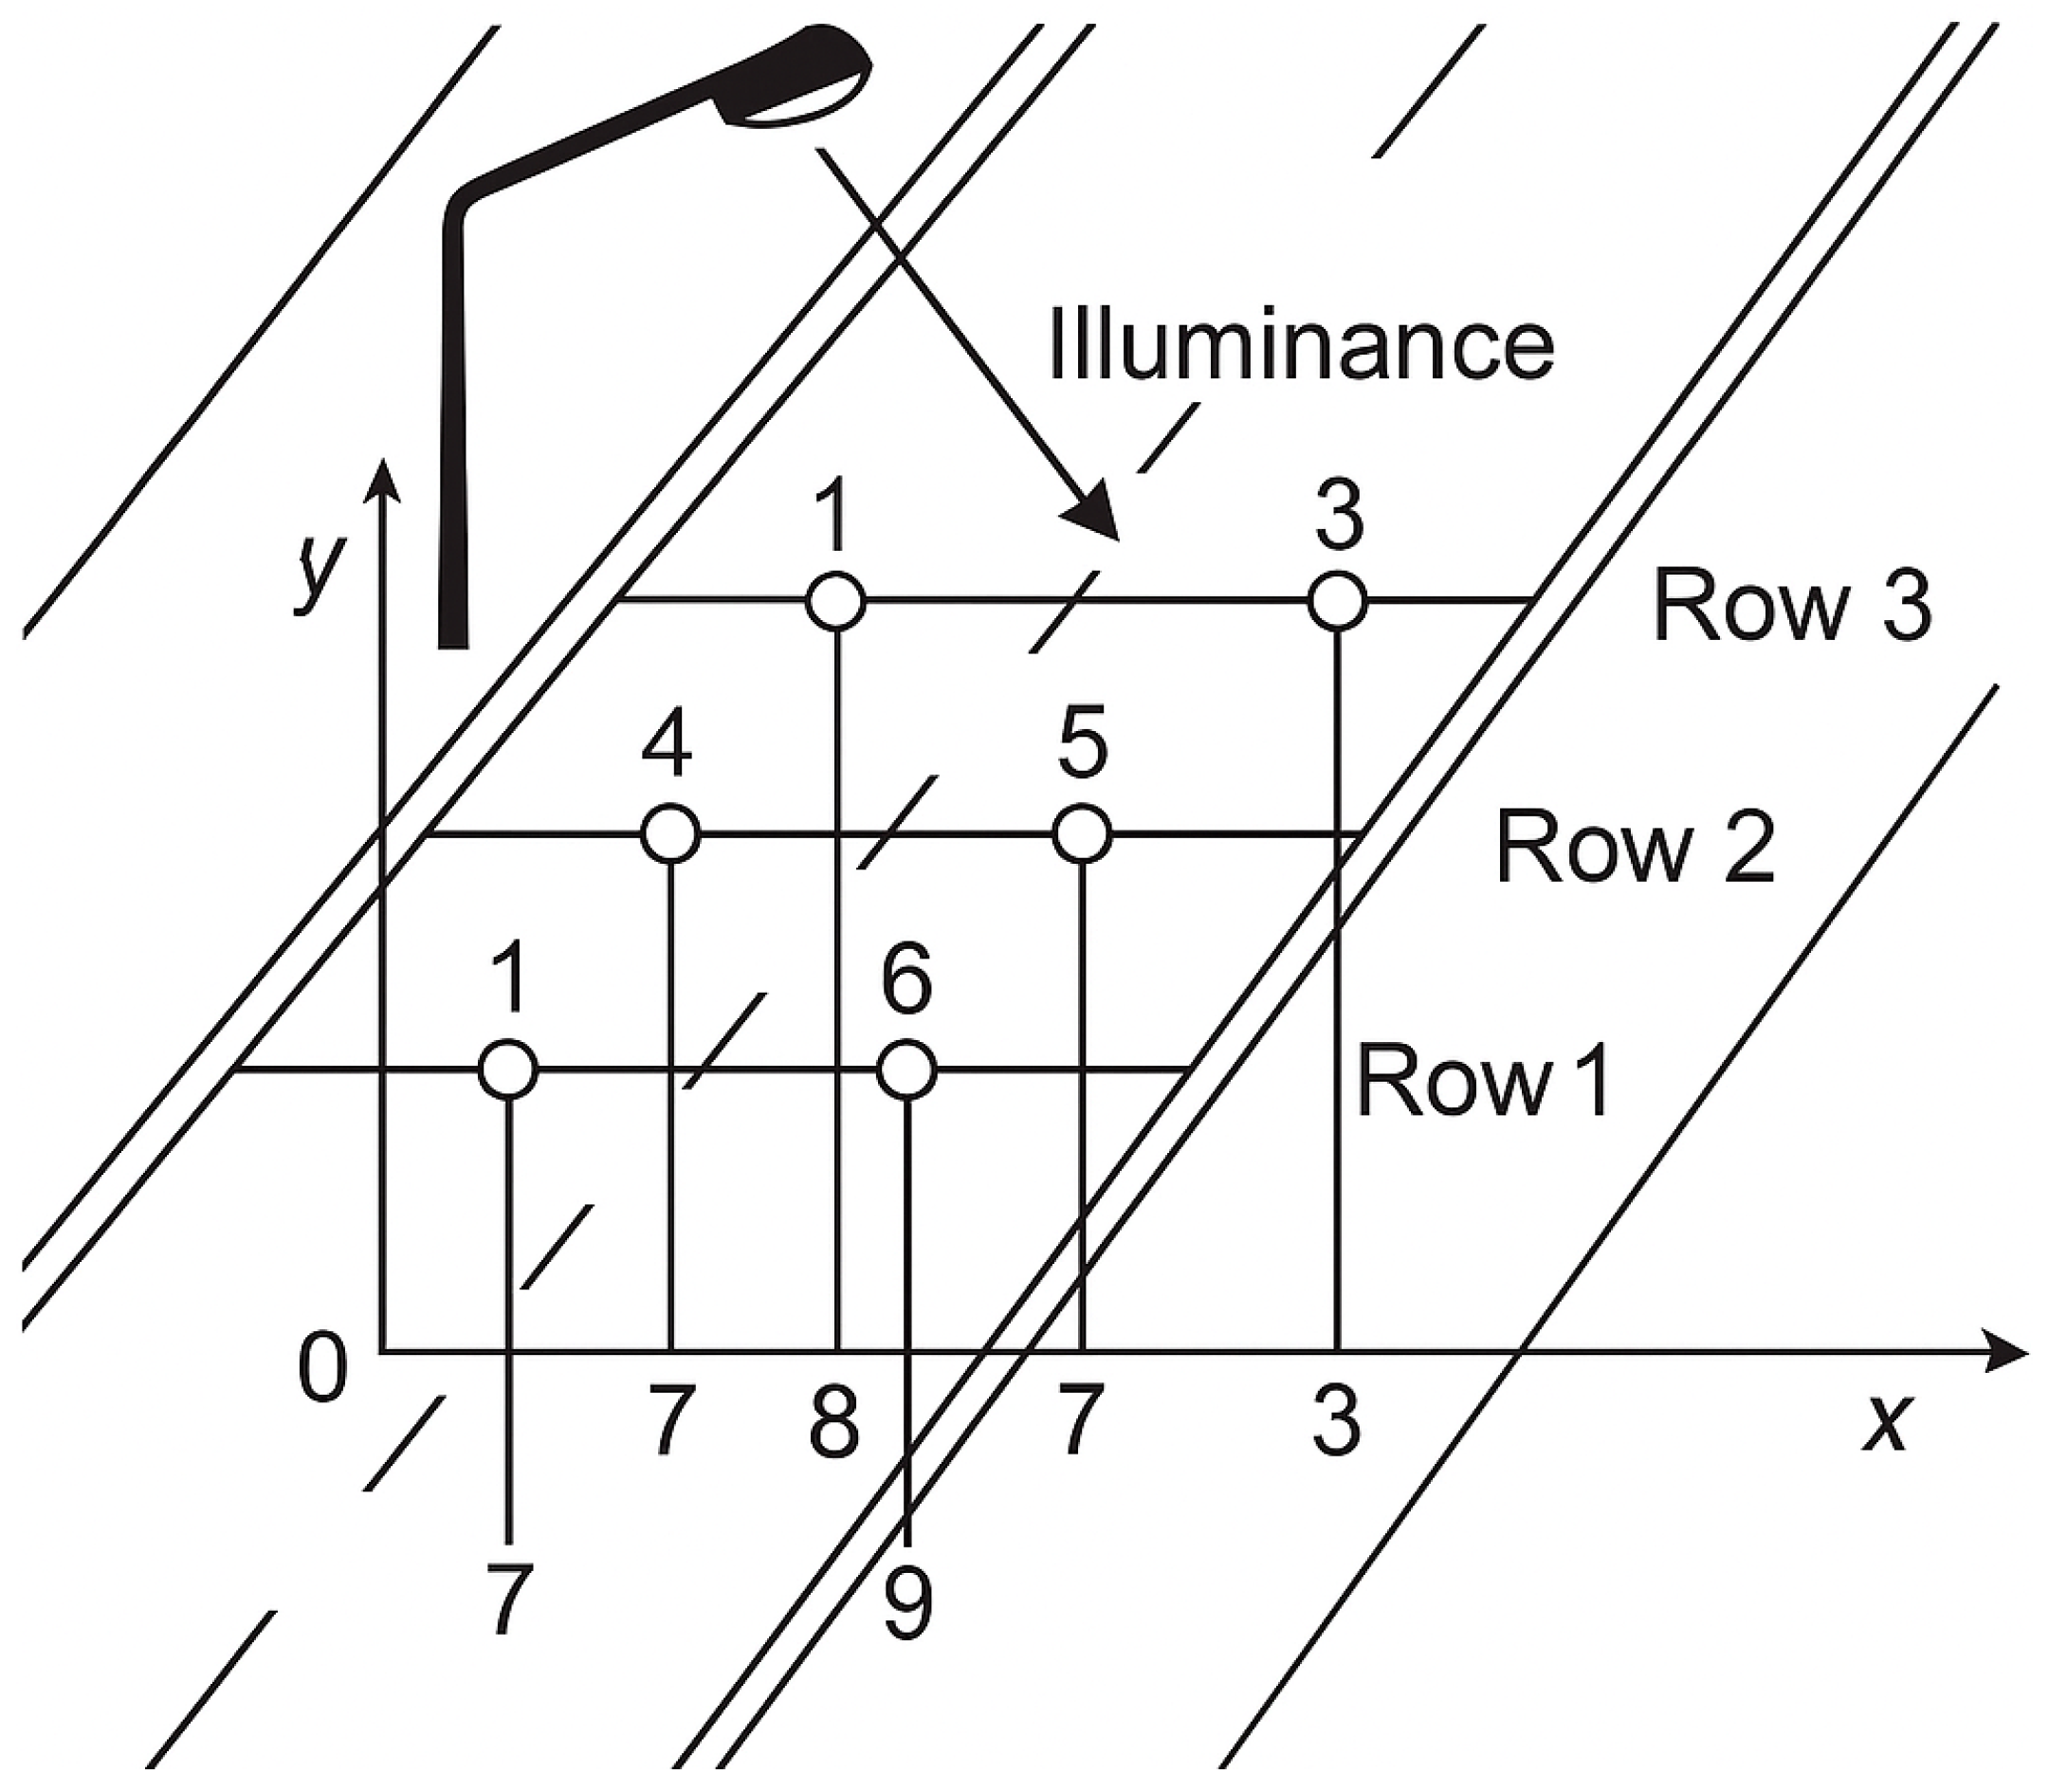
Figure 3.
Measurement points of illuminance. Source: author’s own study.
Figure 3.
Measurement points of illuminance. Source: author’s own study.
Figure 4.
Measuring grid of illuminance on the road with coordinate markings (x, y). Longitudinal axis of the road—y, transverse axis—x. Source: author’s own study.
Figure 4.
Measuring grid of illuminance on the road with coordinate markings (x, y). Longitudinal axis of the road—y, transverse axis—x. Source: author’s own study.
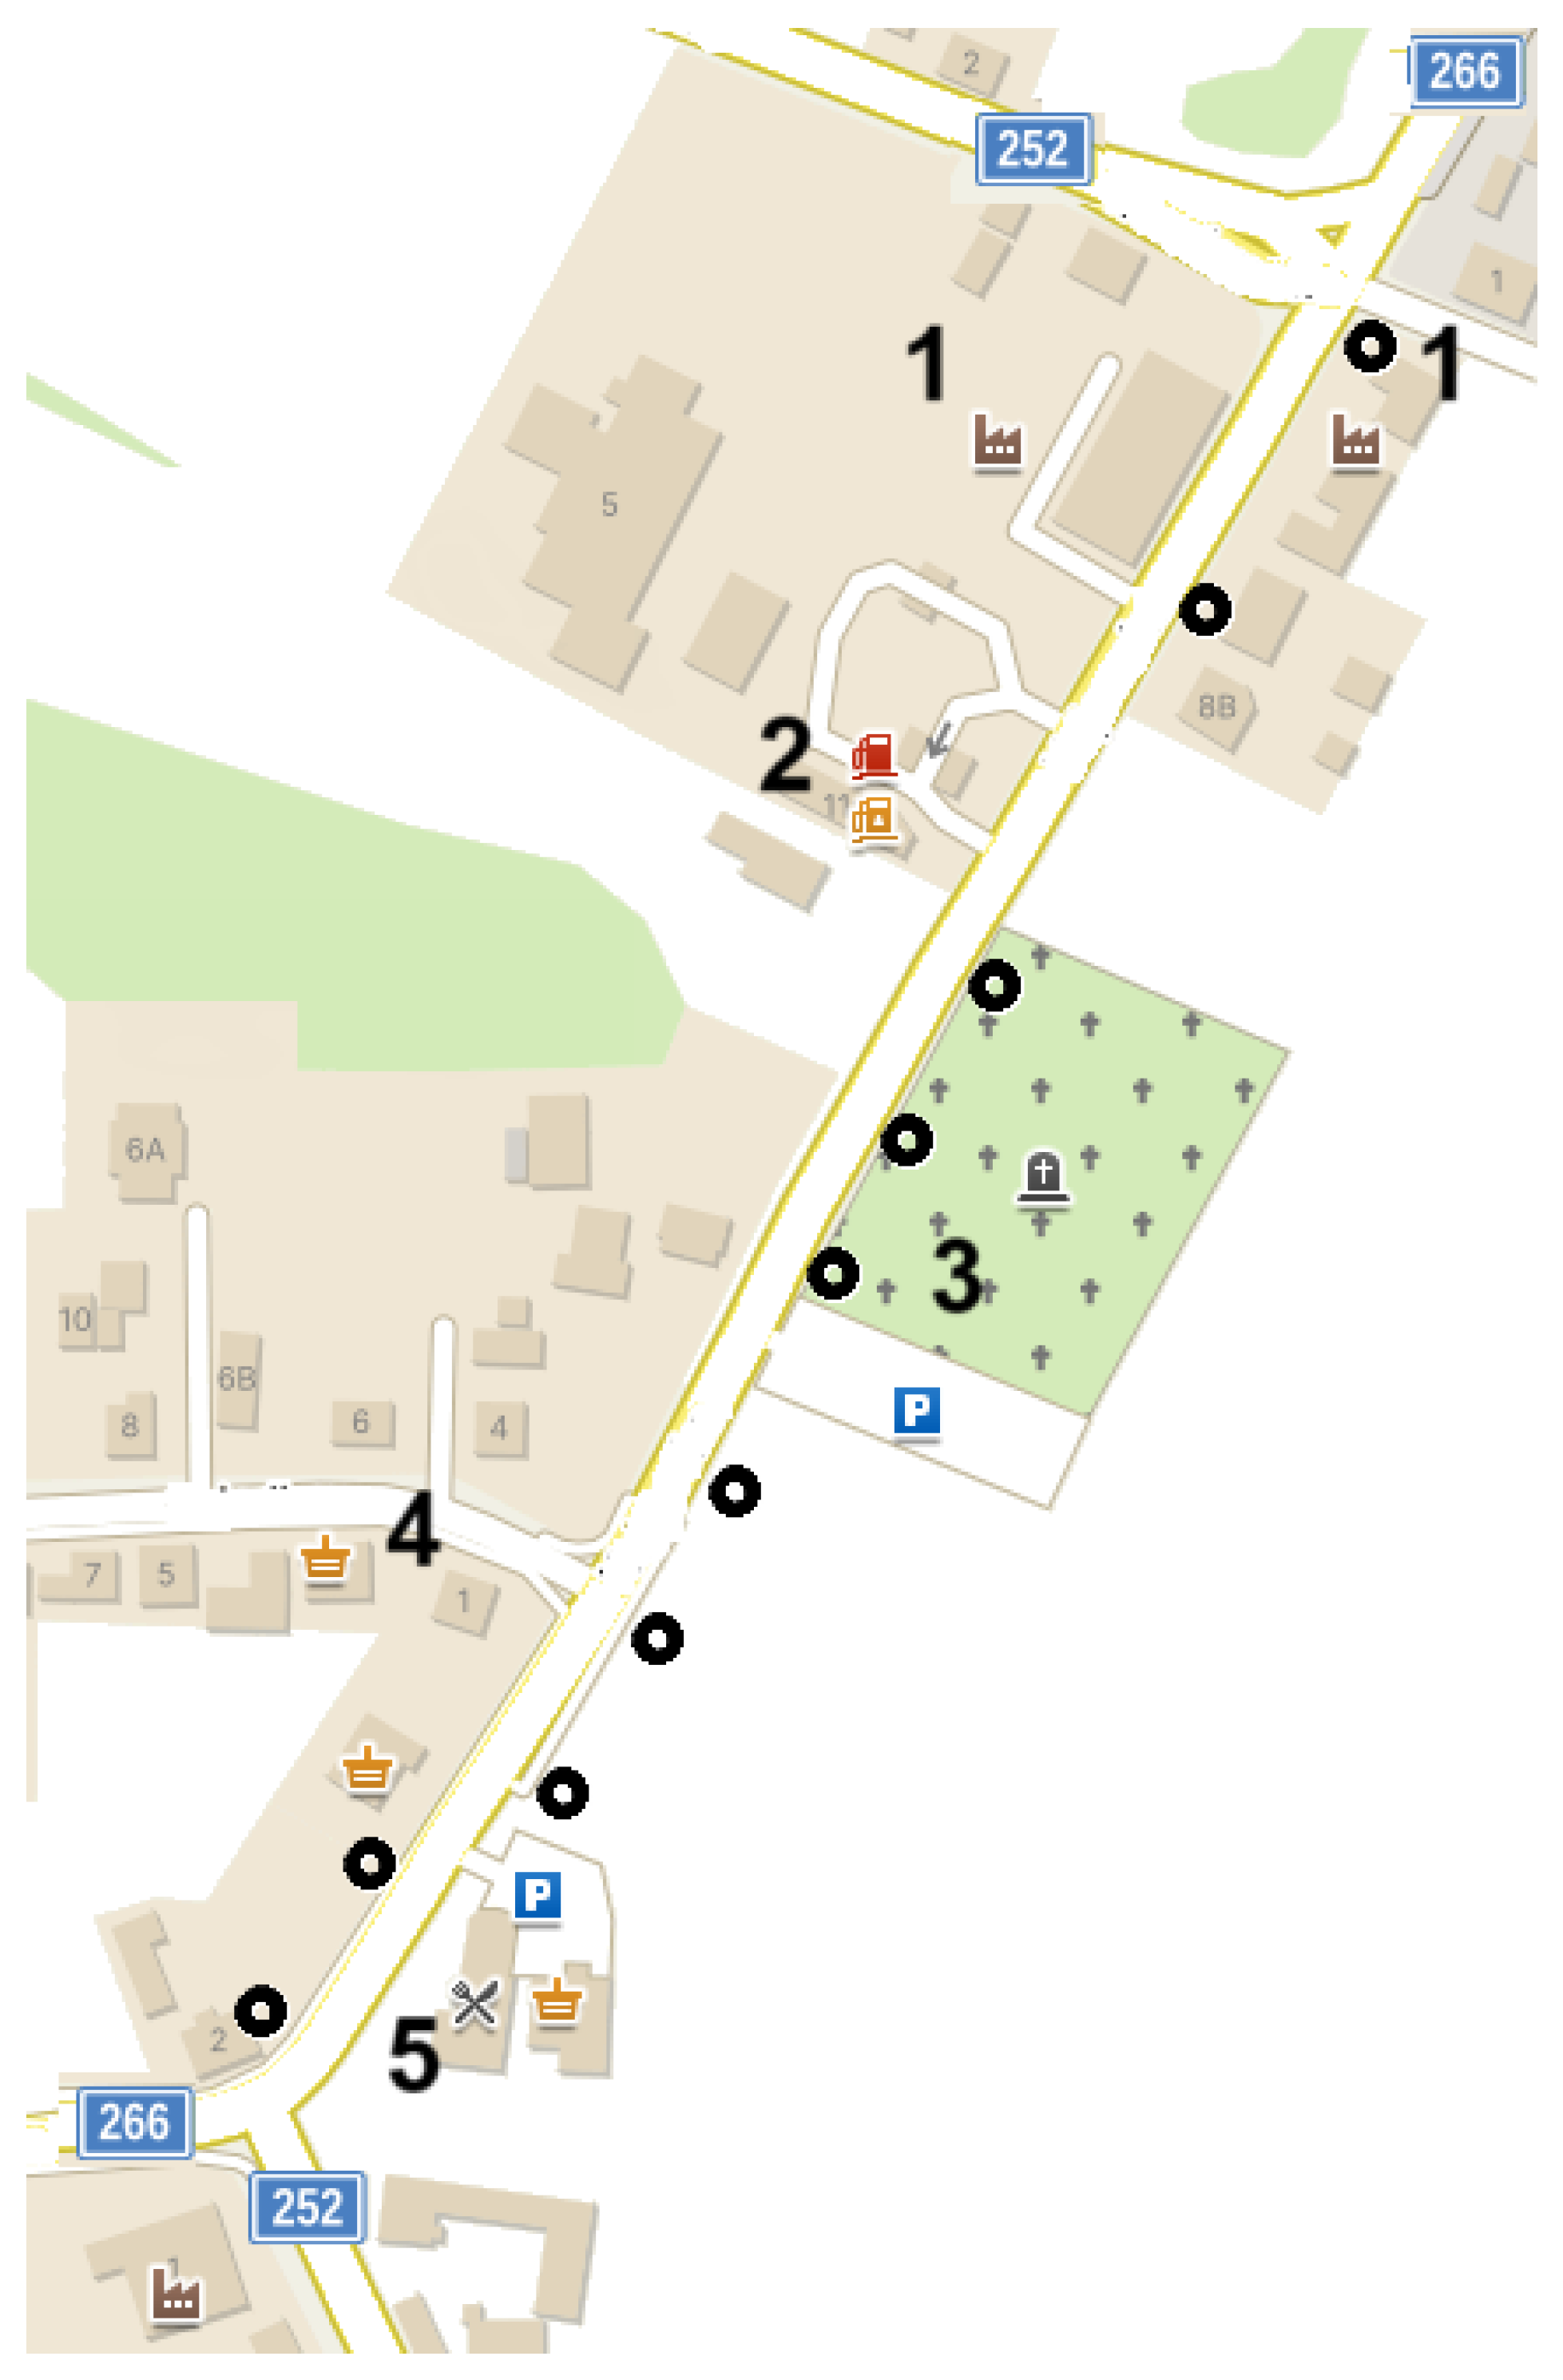
Figure 5.
Analyzed road section. 1—industrial zone, 2—gas station, 3—cemetery, 4—office/school, 5—food zone, “black circles”—operating sodium light fixtures. Source: author’s own study.
Figure 5.
Analyzed road section. 1—industrial zone, 2—gas station, 3—cemetery, 4—office/school, 5—food zone, “black circles”—operating sodium light fixtures. Source: author’s own study.
Figure 6.
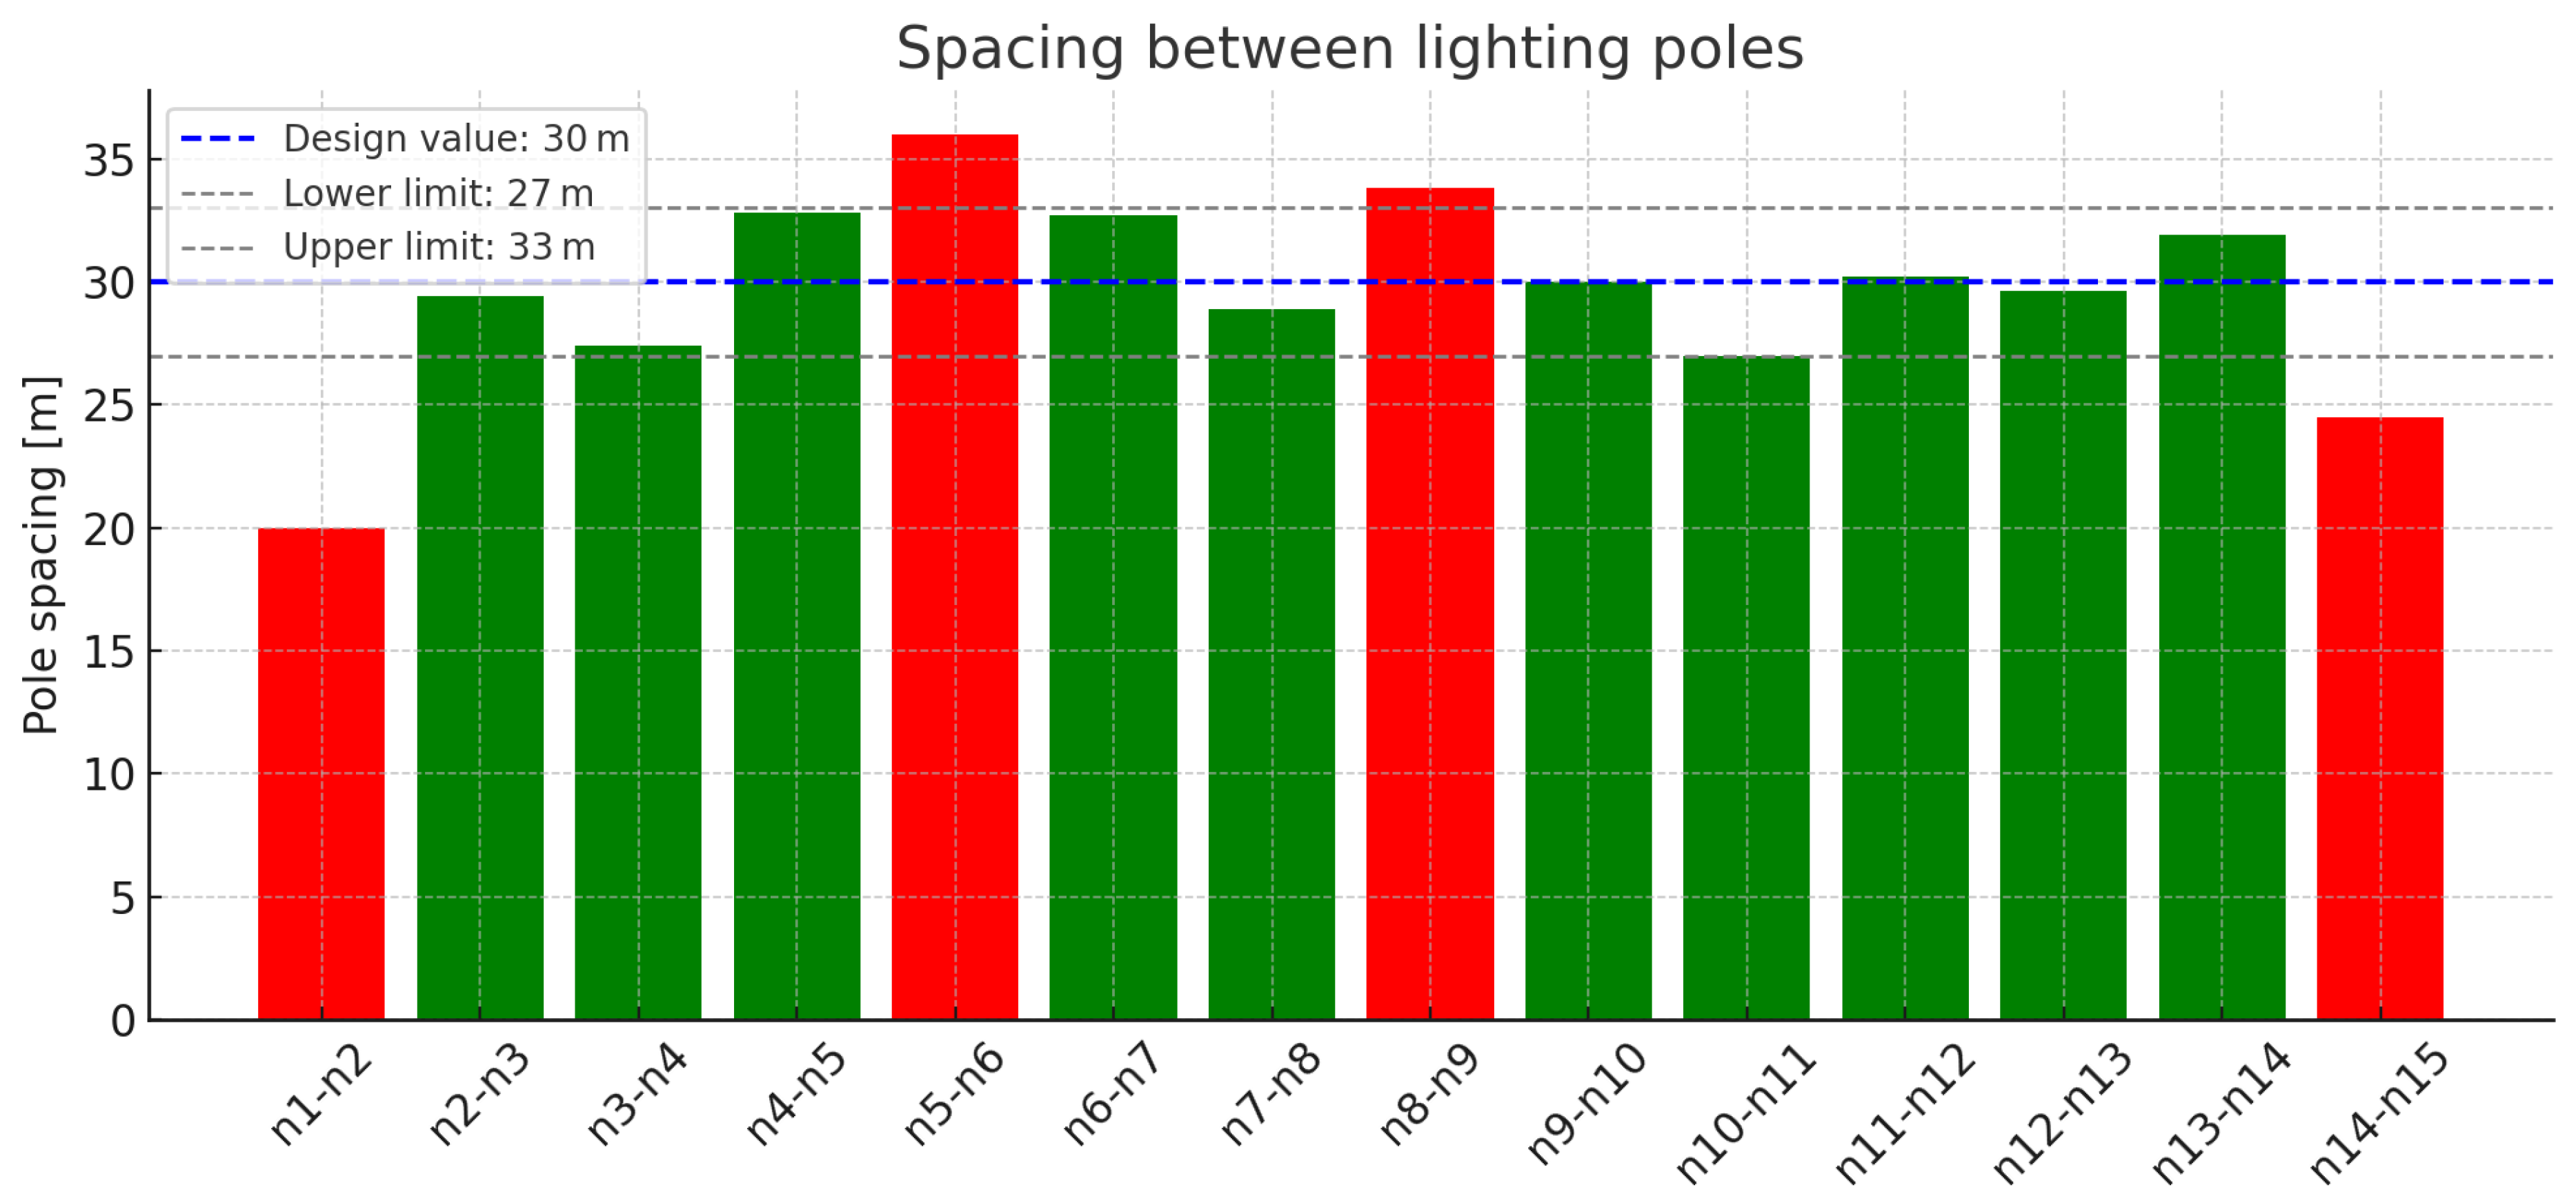
Spacing between lighting poles in variant M(1:1). Source: author’s own study.
Figure 6.
Spacing between lighting poles in variant M(1:1). Source: author’s own study.
Figure 7.
Spacing between lighting poles under variant M(N). Source: author’s own study.
Figure 7.
Spacing between lighting poles under variant M(N). Source: author’s own study.
Figure 8.
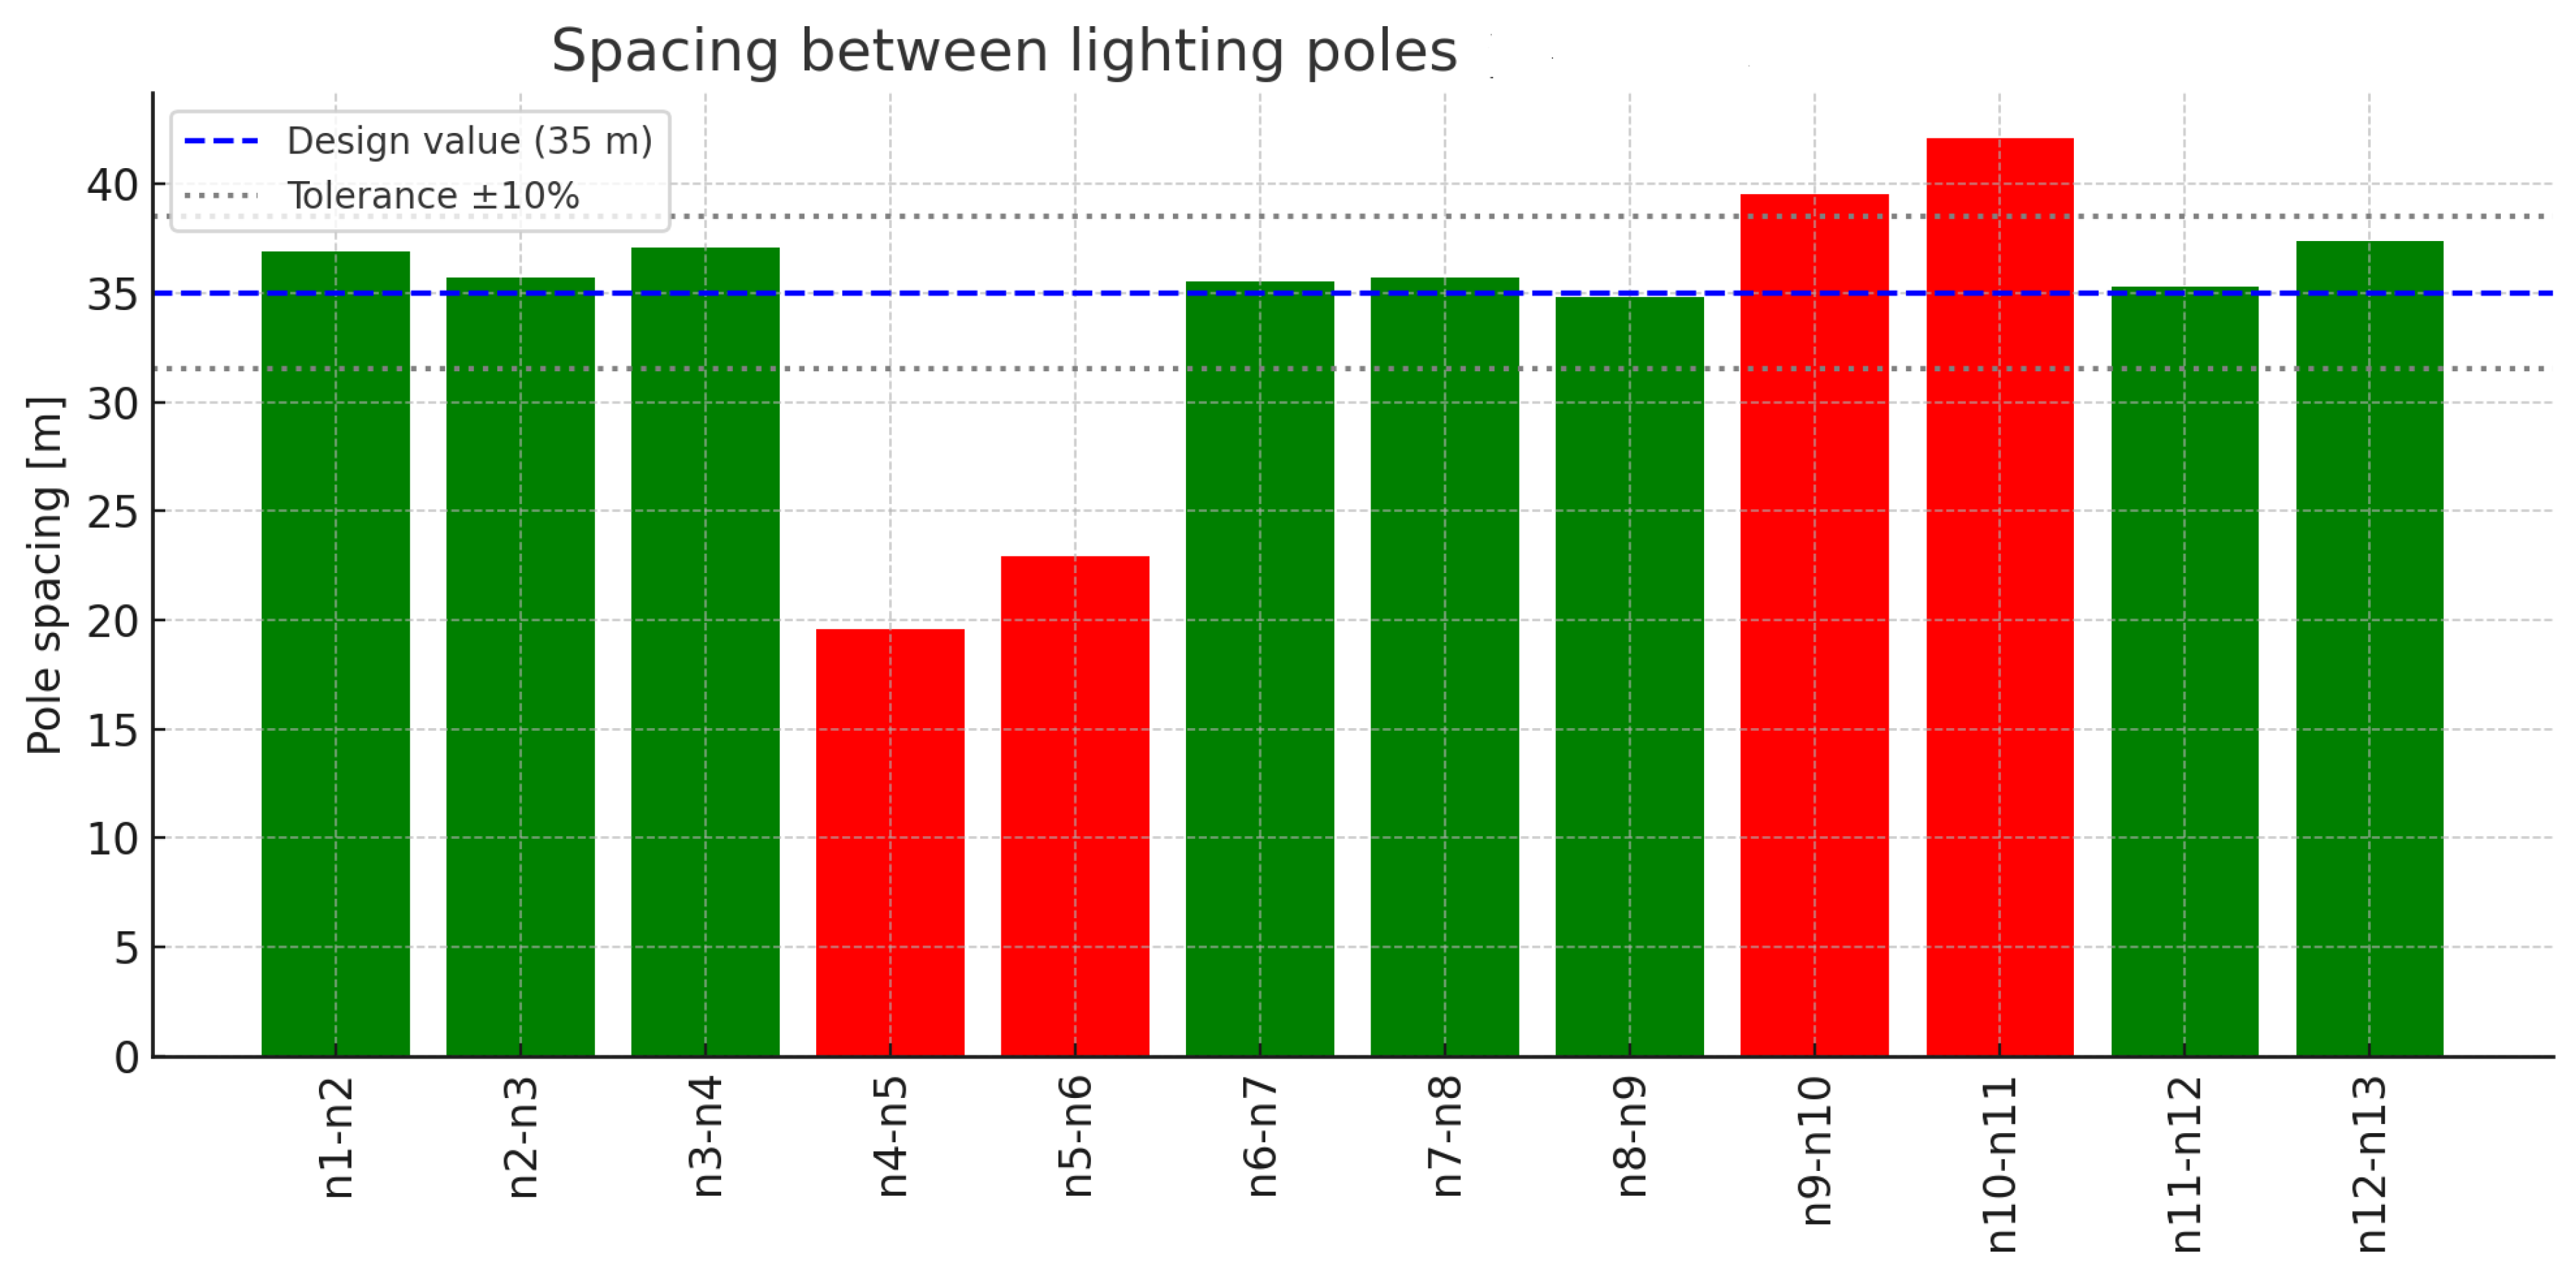
Spacing between lighting poles in variant C(N). Source: author’s own study.
Figure 8.
Spacing between lighting poles in variant C(N). Source: author’s own study.
Figure 9.
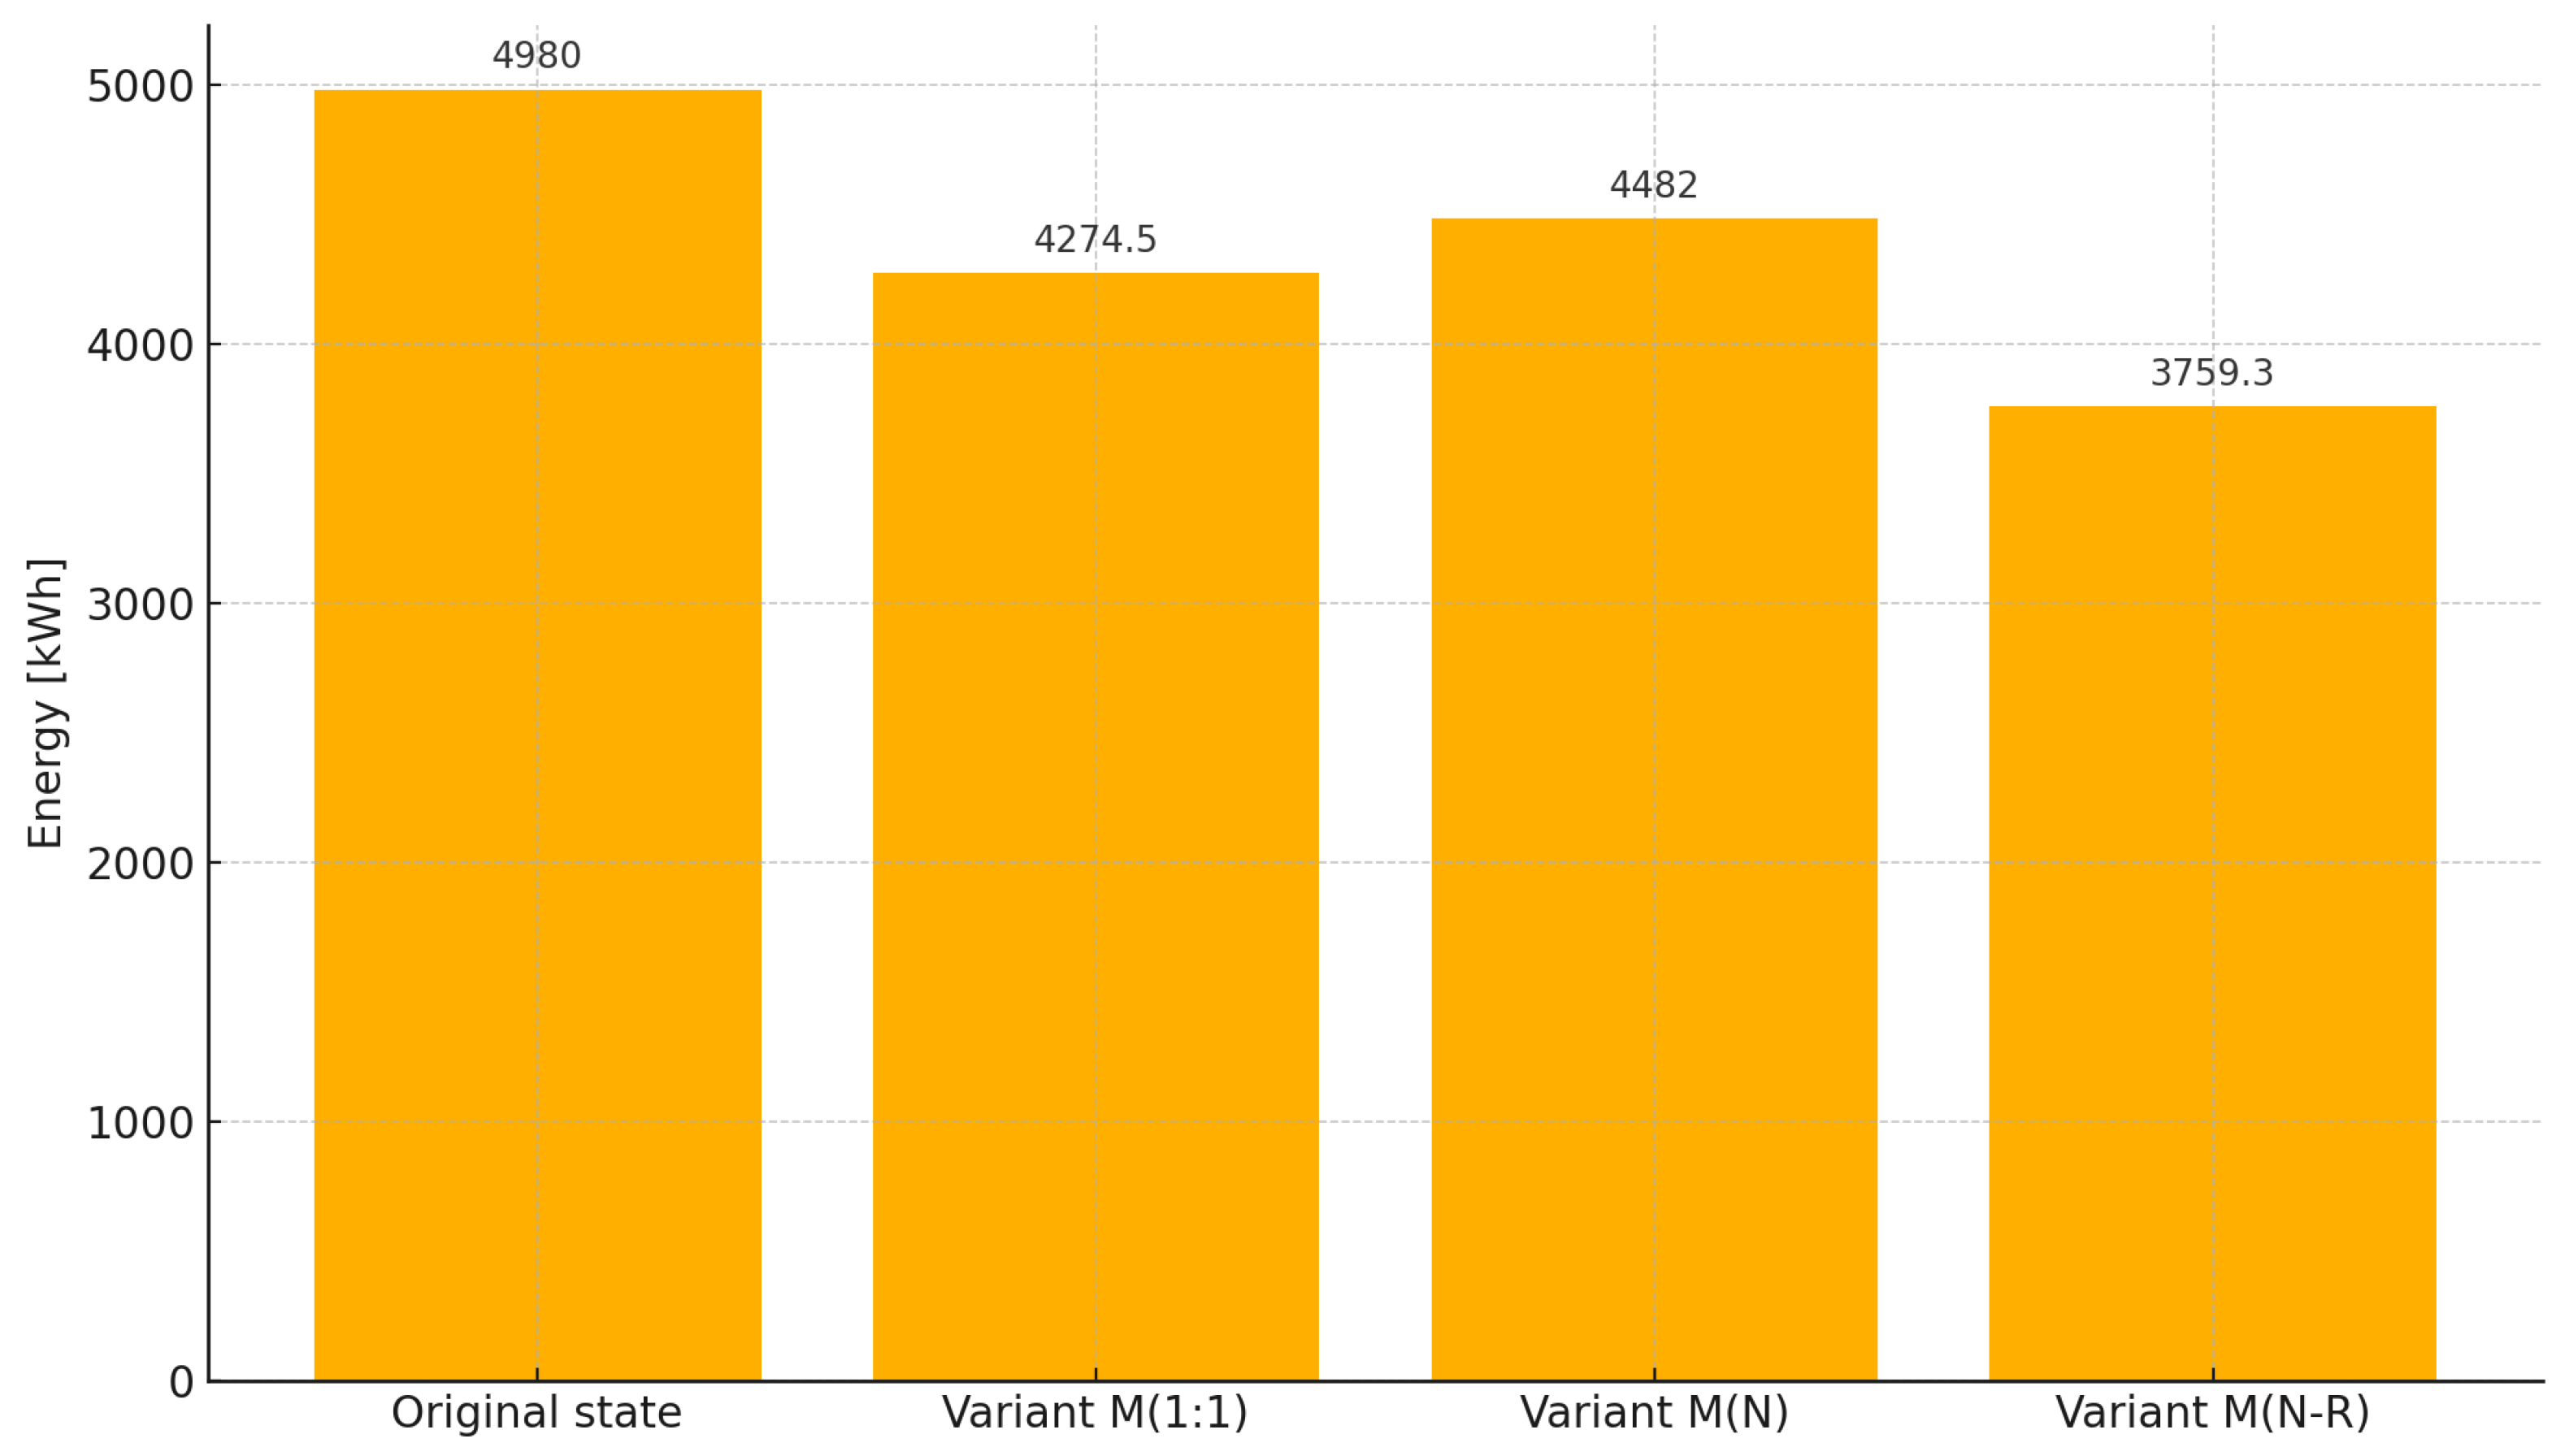
Estimated electricity consumption for the lighting installations: original state, variant M(1:1), variant M(N), and variant M(N-R) with power reduction. Source: author’s own study.
Figure 9.
Estimated electricity consumption for the lighting installations: original state, variant M(1:1), variant M(N), and variant M(N-R) with power reduction. Source: author’s own study.
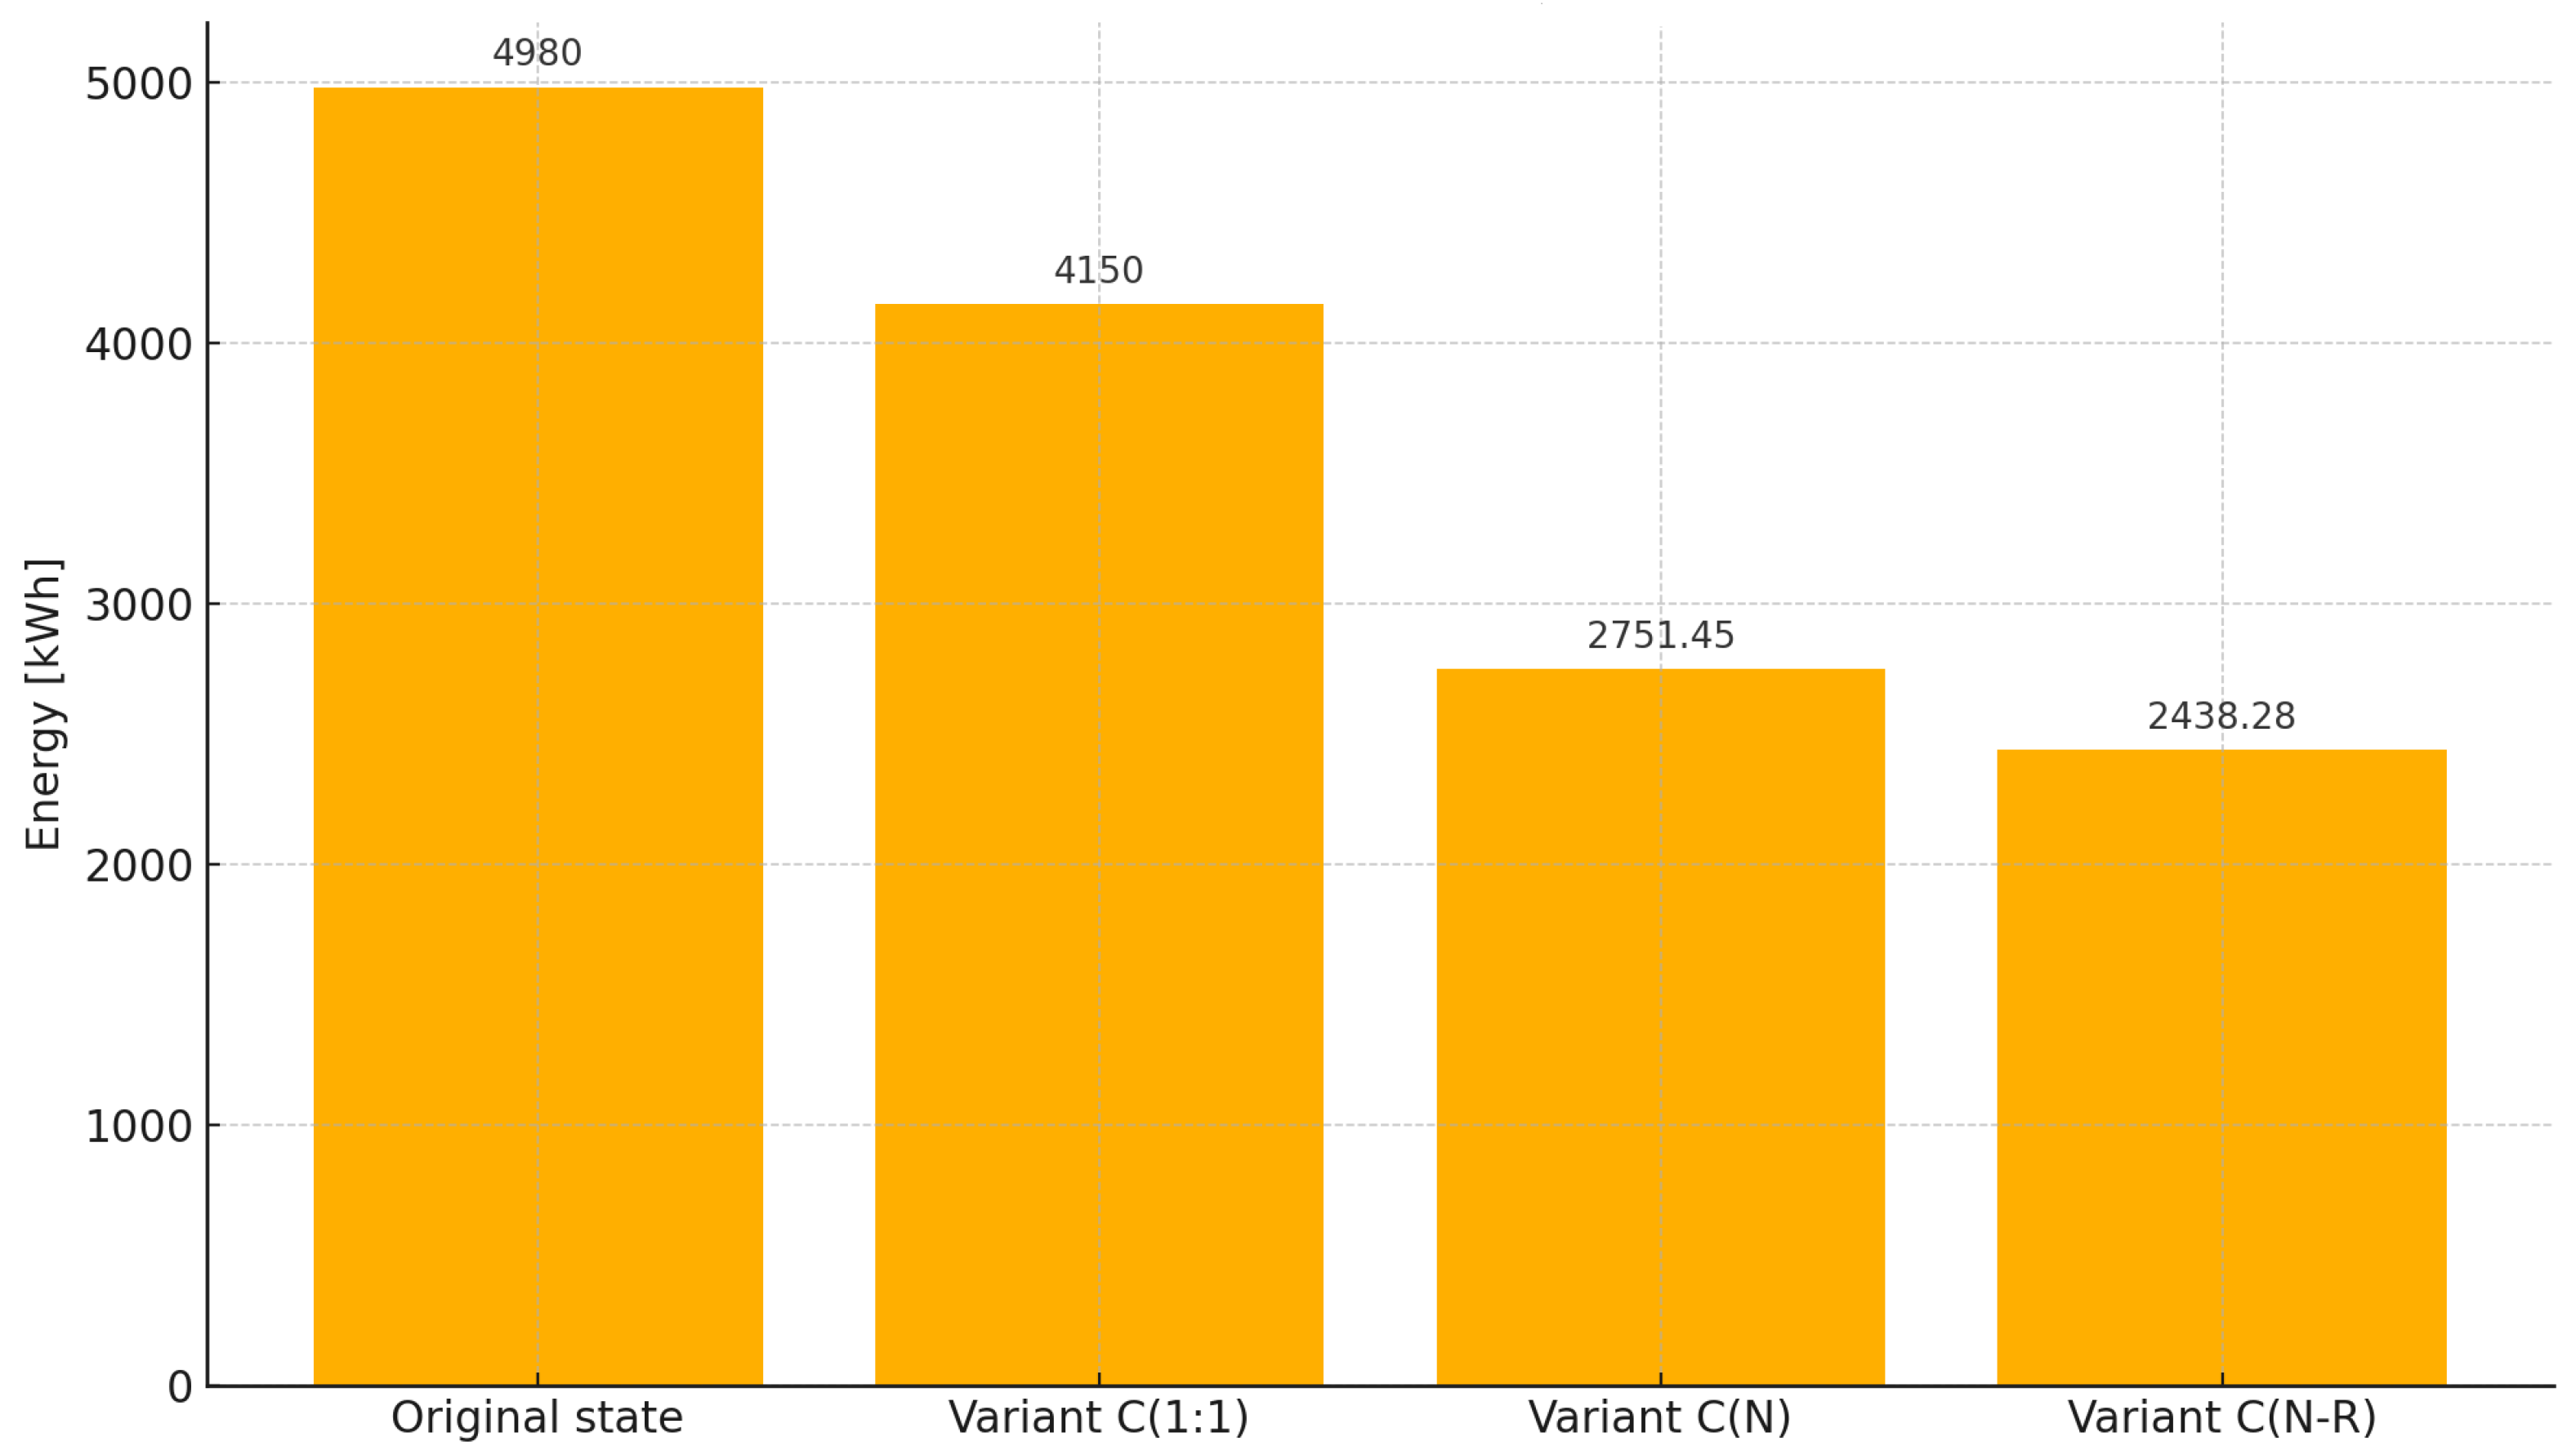
Figure 10.
Estimated electricity consumption for the lighting installations: original state, variant C(1:1), variant C(N), and variant C(N-R) with power reduction. Source: author’s own study.
Figure 10.
Estimated electricity consumption for the lighting installations: original state, variant C(1:1), variant C(N), and variant C(N-R) with power reduction. Source: author’s own study.
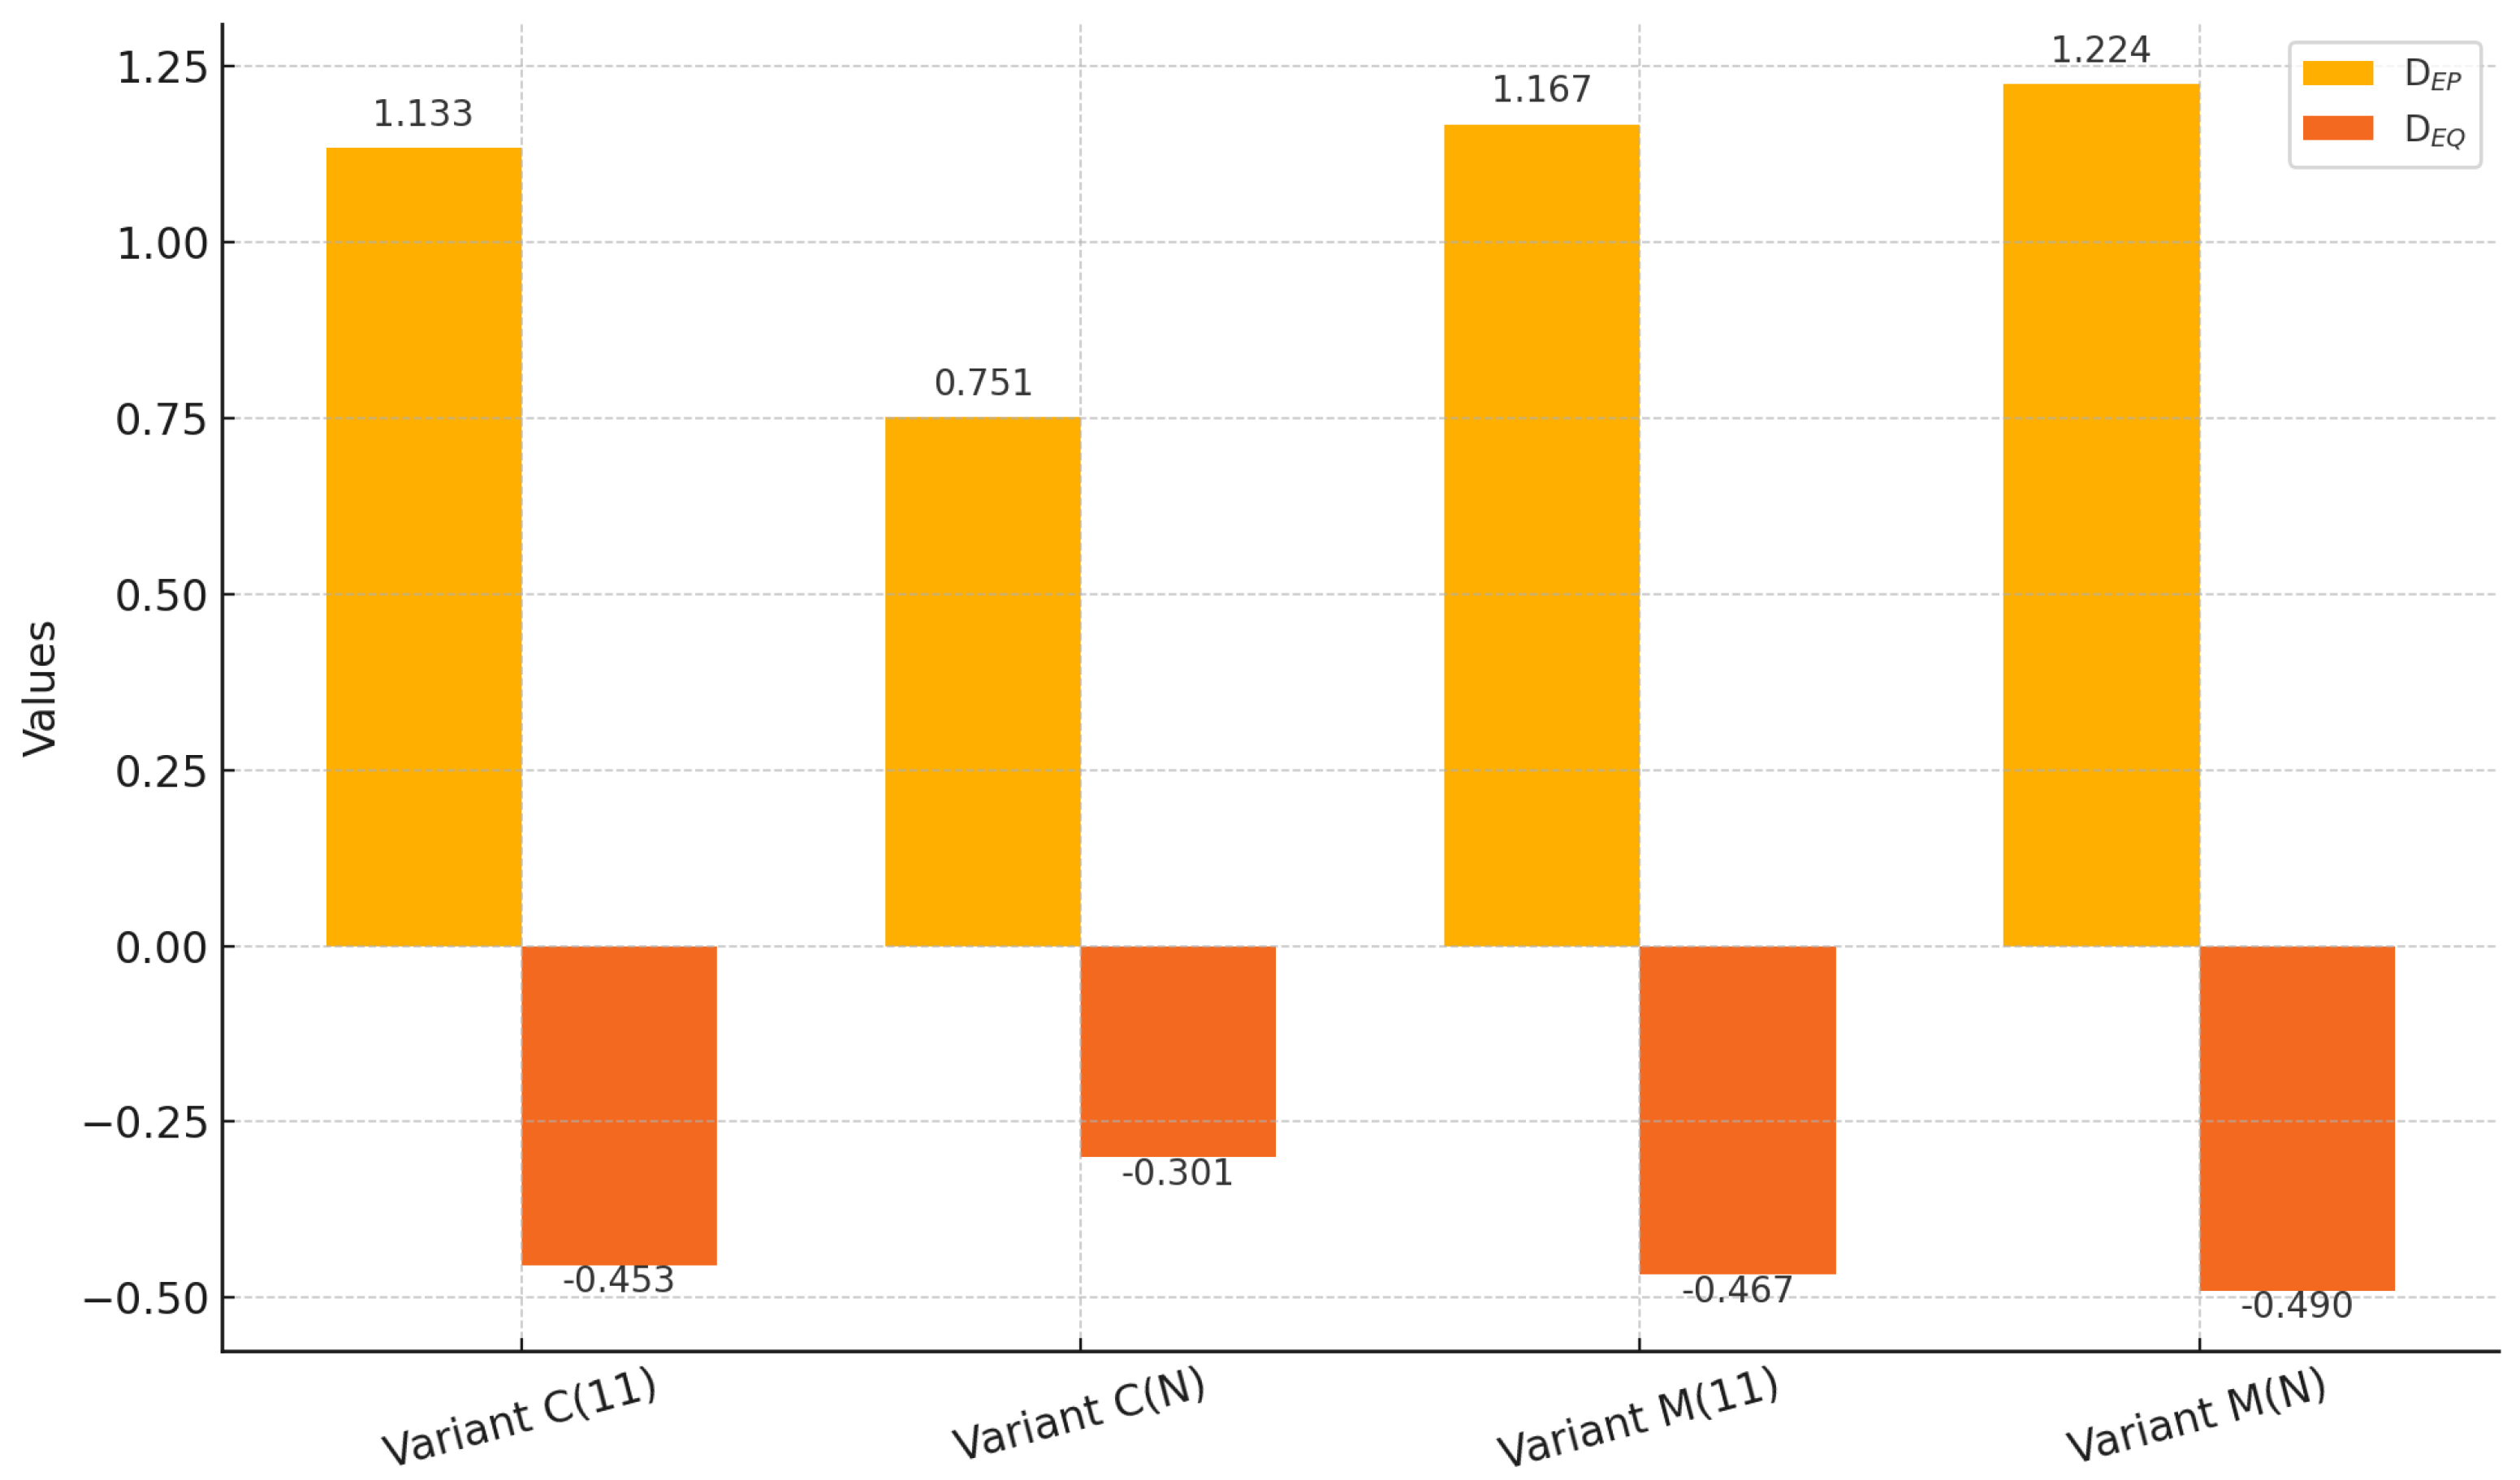
Figure 11.
Determined active and reactive power density indicators: Variant C(1:1), variant C(N), variant M(1:1), and variant M(N). Source: author’s own study.
Figure 11.
Determined active and reactive power density indicators: Variant C(1:1), variant C(N), variant M(1:1), and variant M(N). Source: author’s own study.
Figure 12.
Determined indicators of annual active and reactive energy consumption: Variant C(1:1), variant C(N), variant M(1:1), and variant M(N). Source: author’s own study.
Figure 12.
Determined indicators of annual active and reactive energy consumption: Variant C(1:1), variant C(N), variant M(1:1), and variant M(N). Source: author’s own study.
Figure 13.
Annual financial savings and CO2 emissions for the analyzed variants. Source: author’s own study.
Figure 13.
Annual financial savings and CO2 emissions for the analyzed variants. Source: author’s own study.
Table 1.
Lighting classes M and C of comparable lighting levels for different values of
for road surfaces, according to [
5].
Table 1.
Lighting classes M and C of comparable lighting levels for different values of
for road surfaces, according to [
5].
| Lighting Class M | | | M1 | M2 | M3 | M4 | M5 | M6 |
|---|
| Lighting Class C | | | | | | | | |
|
If: [lx]
| | | C0 | C1 | C2 | C3 | C4 | C5 |
|
If: [lx]
| | C0 | C1 | C2 | C3 | C4 | C5 | C5 |
|
If: [lx]
| C0 | C1 | C2 | C3 | C4 | C5 | C5 | C5 |
Table 2.
Electrical and photometric parameters of the tested lighting lamps.
Table 2.
Electrical and photometric parameters of the tested lighting lamps.
| | | | | Technology | | |
|---|
|
Source
| | |
LED
|
LED
|
LED
|
Soda
|
|---|
| Power | P | [W] | 103 | 100 | 72 | 120 |
| Luminaire flux | | [lm] | 16,140 | 12,447 | 11,479 | 8526 |
| Luminous efficiency | | [lm/W] | 157 | 124 | 159 | 71 |
| Color | CCT | [K] | 4000 | 4000 | 4000 | 2000 |
| Color rendering | Ra | [-] | 70.0 | 72.0 | 71.5 | 30.0 |
| Power factor | cos (100% load) | [-] | 0.95 | 0.95 | 0.95 | 0.85 |
Table 3.
Exact location of the poles of the modernized lighting installation.
Table 3.
Exact location of the poles of the modernized lighting installation.
| Pole Numbers | Pole Spacing [m] |
|---|
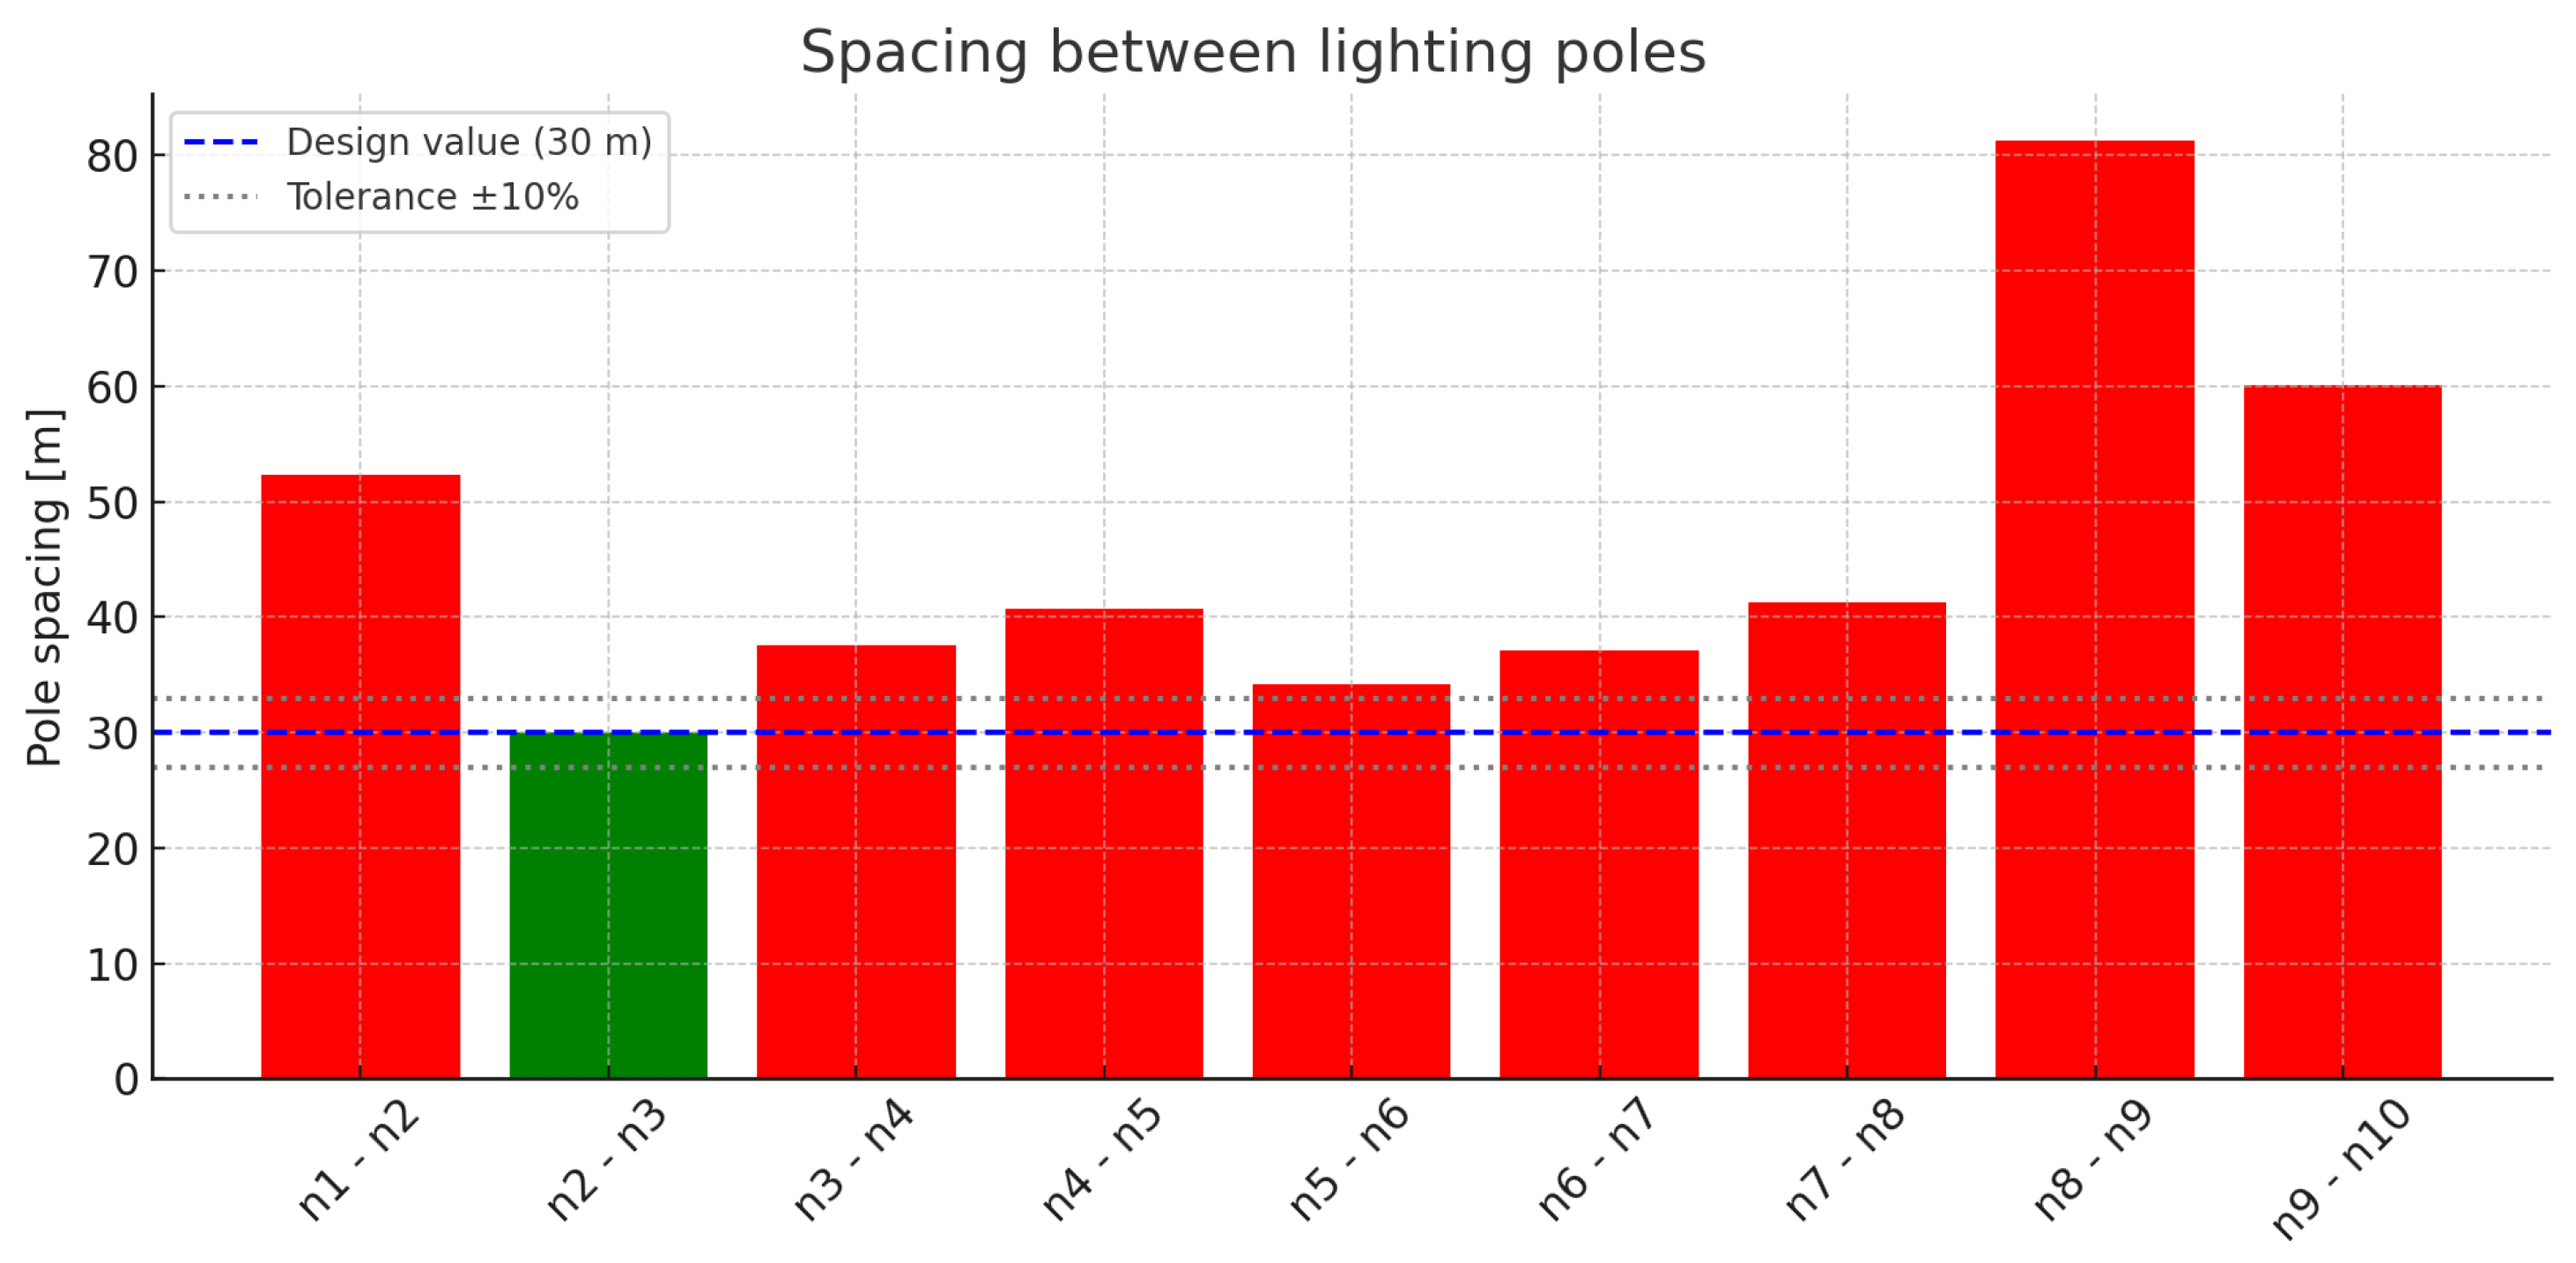
| n1–n2 | 52.3 |
| n2–n3 | 30.0 |
| n3–n4 | 37.6 |
| n4–n5 | 40.7 |
| n5–n6 | 34.2 |
| n6–n7 | 37.1 |
| n7–n8 | 41.3 |
| n8–n9 | 81.3 |
| n9–n10 | 60.1 |
Table 4.
Summary of total power and costs.
Table 4.
Summary of total power and costs.
| The power of the source | | [W] | 100 |
| Number of lighting fixtures | n | [pcs.] | 10 |
| Total power | | [W] | 1200 |
| Price for electricity | C | [zł/kWh] | 1.199 * |
| Number of hours per year | t | [h] | 4150 |
| Annual costs | N | [zł] | 5971.02 |
Table 5.
Estimated CO2 emissions related to electricity consumption.
Table 5.
Estimated CO2 emissions related to electricity consumption.
| Parameter | Unit | Value |
|---|
| Energy consumption | [kWh] | 4980.0 |
| CO2 emission index | [kg/kWh] | 0.597 |
| Reduction of CO2 emissions | [kg] | 2973.06 |
Table 6.
Power requirement for a set of lighting fixtures with variant M(1:1).
Table 6.
Power requirement for a set of lighting fixtures with variant M(1:1).
| Parameter | Unit | Value |
|---|
| Number of lighting fixtures (n) | [pcs.] | 10 |
| Power of one fixture () | [W] | 103 |
| Total power () | [W] | 1030 |
Table 7.
Summary of measurement results with variant M(1:1).
Table 7.
Summary of measurement results with variant M(1:1).
| Type of Lighting | Class | [cd/m2] | [-] |
|---|
| High-pressure sodium lamps | | 0.30 | 0.01 |
| LED | | 0.77 | 0.01 |
| Requirements | Class M4 | 0.75 | 0.40 |
Table 8.
Potential annual savings with variant M(1:1).
Table 8.
Potential annual savings with variant M(1:1).
| Parameter | Unit | Value |
|---|
| Total power before modernization | [W] | 1200.0 |
| Power after modernization | [W] | 1030.0 |
| Number of hours per year | [h] | 4150.0 |
| Price for electricity | [zł/kWh] | 1.199 * |
| Annual savings | [zł] | 845.89 |
Table 9.
Impact of power reduction on CO2 emissions with variant M(1:1).
Table 9.
Impact of power reduction on CO2 emissions with variant M(1:1).
| Parameter | Unit | Value |
|---|
| Power reduction | [W] | 170.0 |
| CO2 emission index | [kg/kWh] | 0.597 |
| Reduction in CO2 emissions | [kg] | 421.18 |
Table 10.
Analysis of spacing between lighting poles with variant M(N).
Table 10.
Analysis of spacing between lighting poles with variant M(N).
| Pole Numbers | Pole Spacing [m] |
|---|
| n1–n2 | 20.0 |
| n2–n3 | 29.4 |
| n3–n4 | 27.4 |
| n4–n5 | 32.8 |
| n5–n6 | 36.0 |
| n6–n7 | 32.7 |
| n7–n8 | 28.9 |
| n8–n9 | 33.8 |
| n9–n10 | 30.0 |
| n10–n11 | 27.0 |
| n11–n12 | 30.2 |
| n12–n13 | 29.6 |
| n13–n14 | 31.9 |
|
n14–n15
| 24.5 |
Table 11.
Power requirement for a set of lighting fixtures with variant M(N).
Table 11.
Power requirement for a set of lighting fixtures with variant M(N).
| Parameter | Unit | Value |
|---|
| Number of lighting fixtures (n) | [pcs.] | 15 |
| Power of one fixture () | [W] | 72 |
| Total power () | [W] | 1080 |
Table 12.
Summary of measurement results with variant M(N).
Table 12.
Summary of measurement results with variant M(N).
| Type of Lighting | Class | [cd/m2] | [-] |
|---|
| High-pressure sodium lamps | | 0.71 | 0.15 |
| LED | | 0.84 | 0.43 |
| Requirements | Class M4 | 0.75 | 0.40 |
Table 13.
Potential annual savings with variant M(N).
Table 13.
Potential annual savings with variant M(N).
| Parameter | Unit | Value |
|---|
| Total power before modernization | [W] | 1200.0 |
| Power after modernization | [W] | 1080.0 |
| Number of hours per year | [h] | 4150.0 |
| Price for electricity | [zł/kWh] | 1.199 * |
| Annual savings | [zł] | 597.10 |
Table 14.
Impact of power reduction on CO2 emissions with variant M(N).
Table 14.
Impact of power reduction on CO2 emissions with variant M(N).
| Parameter | Unit | Value |
|---|
| Power reduction | [W] | 120.0 |
| CO2 emission index | [kg/kWh] | 0.597 |
| Reduction in CO2 emissions | [kg] | 297.31 |
Table 15.
Financial savings resulting from the use of additional power reduction for the entire route with variant M(N).
Table 15.
Financial savings resulting from the use of additional power reduction for the entire route with variant M(N).
| Parameter | Unit | Value |
|---|
| Reduced power of a single luminaire | [W] | 22 |
| Number of hours per year | [h] | 2190.0 |
| Price for electricity | [zł/kWh] | 1.199 * |
| Annual savings | [zł] | 750.98 |
Table 16.
Additional reduction in CO2 emissions as a result of the use of reduced luminaire power with the M(N) variant.
Table 16.
Additional reduction in CO2 emissions as a result of the use of reduced luminaire power with the M(N) variant.
| Parameter | Unit | Value |
|---|
| Power reduction | [W] | 330 |
| CO2 emission index | [kg/kWh] | 0.597 |
| Reduction in CO2 emissions | [kg] | 431.45 |
Table 17.
Power requirement for a set of lighting fixtures with variant C(1:1).
Table 17.
Power requirement for a set of lighting fixtures with variant C(1:1).
| Parameter | Unit | Value |
|---|
| Number of lighting fixtures (n) | [pcs.] | 10 |
| Power of one fixture () | [W] | 100 |
| Total power () | [W] | 1000 |
Table 18.
Summary of measurement results with variant C(1:1).
Table 18.
Summary of measurement results with variant C(1:1).
| Type of Lighting | Class | [lx] | [-] |
|---|
| High-pressure sodium lamps | | 5.0 | 0.014 |
| LED | | 11.0 | 0.06 |
| Requirements | Class C4 | 10.0 | 0.40 |
Table 19.
Potential annual savings with variant C(1:1).
Table 19.
Potential annual savings with variant C(1:1).
| Parameter | Unit | Value |
|---|
| Total power before modernization | [W] | 1200.0 |
| Power after modernization | [W] | 1000.0 |
| Number of hours per year | [h] | 4150.0 |
| Price for electricity | [zł/kWh] | 1.199 * |
| Annual savings | [zł] | 995.17 |
Table 20.
Impact of power reduction on CO2 emissions with variant C(1:1).
Table 20.
Impact of power reduction on CO2 emissions with variant C(1:1).
| Parameter | Unit | Value |
|---|
| Power reduction | [W] | 200.0 |
| CO2 emission index | [kg/kWh] | 0.597 |
| Reduction of CO2 emissions | [kg] | 495.5 |
Table 21.
Analysis of spacing between lighting poles with variant C(N).
Table 21.
Analysis of spacing between lighting poles with variant C(N).
| Pole Numbers | Pole Spacing [m] |
|---|
| n1–n2 | 36.9 |
| n2–n3 | 35.7 |
| n3–n4 | 37.1 |
| n4–n5 | 19.6 |
| n5–n6 | 22.9 |
| n6–n7 | 35.5 |
| n7–n8 | 35.7 |
| n8–n9 | 34.8 |
| n9–n10 | 39.5 |
| n10–n11 | 42.1 |
| n11–n12 | 35.3 |
| n12–n13 | 37.4 |
Table 22.
Power requirement for a set of lighting fixtures with variant C(N).
Table 22.
Power requirement for a set of lighting fixtures with variant C(N).
| Parameter | Unit | Value |
|---|
| Number of lighting fixtures (n) | [pcs.] | 13 |
| Power of one fixture () | [W] | 51 |
| Total power () | [W] | 663 |
Table 23.
Summary of measurement results with variant C(N).
Table 23.
Summary of measurement results with variant C(N).
| Type of Lighting | Class | [lx] | [-] |
|---|
| High-pressure sodium lamps | | 10.4 | 0.40 |
| LED | | 10.2 | 0.40 |
| Requirements | Class C4 | 10.0 | 0.40 |
Table 24.
Potential annual savings with variant C(N).
Table 24.
Potential annual savings with variant C(N).
| Parameter | Unit | Value |
|---|
| Total power before modernization | [W] | 1200.0 |
| Power after modernization | [W] | 663.0 |
| Number of hours per year | [h] | 4150.0 |
| Price for electricity | [zł/kWh] | 1.199 * |
| Annual savings | [zł] | 2672.03 |
Table 25.
Impact of power reduction on CO2 emissions with variant C(N).
Table 25.
Impact of power reduction on CO2 emissions with variant C(N).
| Parameter | Unit | Value |
|---|
| Power reduction | [W] | 663.0 |
| CO2 emission index | [kg/kWh] | 0.597 |
| Reduction in CO2 emissions | [kg] | 1330.4 |
Table 26.
Financial savings resulting from additional power reduction for the entire route with variant C(N).
Table 26.
Financial savings resulting from additional power reduction for the entire route with variant C(N).
| Parameter | Unit | Value |
|---|
| Reduced power of a single luminaire | [W] | 11 |
| Number of hours per year | [h] | 2190.0 |
| Price for electricity | [zł/kWh] | 1.199 * |
| Annual savings | [zł] | 375.5 |
Table 27.
Additional reduction in CO2 emissions as a result of reduced luminaire power with variant C(N).
Table 27.
Additional reduction in CO2 emissions as a result of reduced luminaire power with variant C(N).
| Parameter | Unit | Value |
|---|
| Power reduction | [W] | 143 |
| CO2 emission index | [kg/kWh] | 0.597 |
| Reduction in CO2 emissions | [kg] | 186.96 |
Table 28.
Calculated energy efficiency indicators and of the analyzed lighting installation. The calculations took into account the value of the analyzed area, .
Table 28.
Calculated energy efficiency indicators and of the analyzed lighting installation. The calculations took into account the value of the analyzed area, .
| | | M(1:1) | M(N) | C(1:1) | C(N) |
|---|
| Number of luminaires | [-] | 10 | 15 | 10 | 13 |
| [W] | 1030 | 1080 | 1000 | 663 |
| [W] | 20.6 | 21.6 | 20 | 13.3 |
| [lx] | 18.5 | 20 | 11 | 10.2 |
| t | [h] | 4150 | 4150 | 4150 | 4150 |
| [mW/lx· ] | 15.205 | 14.747 | 24.827 | 17.752 |
| —typical values | | | | | |
| [] | 1.167 | 1.224 | 1.133 | 0.751 |
| —typical values | | | | | |
Table 29.
Calculated energy efficiency indicators and for the analyzed lighting installation. The calculations took into account the value of the analyzed area, .
Table 29.
Calculated energy efficiency indicators and for the analyzed lighting installation. The calculations took into account the value of the analyzed area, .
| | | M(1:1) | M(N) | C(1:1) | C(N) |
|---|
| Number of luminaires | [-] | 10 | 15 | 10 | 13 |
| [-] | 0.93 | 0.93 | 0.93 | 0.93 |
| [-] | −0.4 | −0.4 | −0.4 | −0.4 |
| [var] | −494.4 | −518.4 | −480 | −318.4 |
| t | [h] | 4150 | 4150 | 4150 | 4150 |
| [mvar/lx· ] | −6.082 | −5.899 | −9.931 | −7.101 |
| [] | −0.467 | −0.49 | −0.453 | −0.301 |

