Article

Experimental Investigation of Hydraulic Fracturing Damage Mechanisms in the Chang 7 Member Shale Reservoirs, Ordos Basin, China

1
Research Institute of Shaanxi Yanchang Petroleum (Group) Co., Ltd., Xi’an 710065, China
2
Petroleum Engineering College, Xi’an Shiyou University, Xi’an 710065, China
3
Petroleum Systems Engineering, University of Regina, Regina, SK S4S 0A2, Canada
*
Authors to whom correspondence should be addressed.
Energies 2025, 18(20), 5355; https://doi.org/10.3390/en18205355 (registering DOI)
Submission received: 22 August 2025 / Revised: 12 September 2025 / Accepted: 19 September 2025 / Published: 11 October 2025
(This article belongs to the Section H: Geo-Energy)

Abstract

The Chang 7 member of the Ordos Basin hosts abundant shale oil and gas resources and plays a vital role in the development of unconventional energy. This study investigates differences in damage evolution and underlying mechanisms between representative shale oil and shale gas reservoir cores from the Chang 7 member under fracturing fluid hydration. A combination of high-temperature expansion tests, nuclear magnetic resonance (NMR), and micro-computed tomography (Micro-CT) was used to systematically characterize macroscopic expansion behavior and microscopic pore structure evolution. Results indicate that shale gas cores undergo faster expansion and higher imbibition rates during hydration (reaching stability in 10 h vs. 23 h for shale oil cores), making them more vulnerable to water-lock damage, while shale oil cores exhibit slower hydration but more pronounced pore structure reconstruction. After 72 h of immersion in fracturing fluid, both core types experienced reduced pore volumes and structural reorganization; however, shale oil cores demonstrated greater capacity for pore reconstruction, with a newly formed pore volume fraction of 34.5% compared to 24.6% for shale gas cores. NMR and Micro-CT analyses reveal that hydration is not merely a destructive process but a dynamic “damage–reconstruction” evolution. Furthermore, the addition of clay stabilizers effectively mitigates water sensitivity and preserves pore structure, with 0.7% identified as the optimal concentration. The research results not only reveal the differential response law of fracturing fluid damage in the Chang 7 shale reservoir but also provide a theoretical basis and technical support for optimizing fracturing fluid systems and achieving differential production increases.

Graphical Abstract

1. Introduction

In recent years, advances in exploration and development technologies have significantly enhanced the potential of unconventional oil and gas resources. Among them, shale oil and gas—characterized by abundant reserves and strong commercial viability—are emerging as strategic alternative energy sources for the 21st century. These resources have become an increasingly important focus of China’s petroleum industry, playing a pivotal role in reserve replacement and production growth. Notably, substantial breakthroughs in shale exploration have been achieved, with commercially recoverable reserves confirmed in key basins such as the Songliao, Ordos, and Sichuan [1,2].
The Chang 7 member of the Ordos Basin hosts complex and heterogeneous shale oil and gas reservoirs that can be subdivided into three sub-members—Chang 71, Chang 72, and Chang 73—based on lithological and petrophysical variations. The Chang 73 sub-member corresponds to the basin’s maximum lacustrine flooding event, marking the peak of lake inundation and the most active stage of lacustrine fluid dynamics. Prolific algal and planktonic productivity during this period provided abundant organic matter, forming thick deposits of organic-rich black shale with localized thin sandstone interbeds [3,4]. In contrast, deposition of the Chang 71 and Chang 72 sub-members occurred during a regressive phase, producing thick sandy successions within the organic-rich mud shale sequences. These are characterized by rhythmic interbedding of siltstone to fine-grained sandstone with mudstone, formed under the influence of gravity flows [5,6].
Crucially, these distinct depositional settings have resulted in significant geological heterogeneity between the primary shale oil and shale gas producing areas. The shale gas reservoirs, typified by the Fuxian area, are predominantly associated with the distal, deep-lacustrine facies of the Chang 73 sub-member. This low-energy environment facilitated the deposition of fine-grained, clay-rich sediments, which, after burial and diagenesis, developed a pore system dominated by nanopores hosted by organic matter and intracrystalline clay pores. Conversely, the shale oil reservoirs, represented by the Dingbian area, are linked to the more proximal, delta-front to semi-deep lacustrine facies of the Chang 71 and Chang 72 sub-members. These settings experienced higher influxes of coarser, quartz-rich material, resulting in a rock fabric with lower clay content and a pore network characterized by larger intergranular and dissolution pores. The thick, organic-rich mud shale succession of the Chang 7 member constitutes both an excellent source rock and a significant reservoir. Its lithology is diverse, including fine sandstone–siltstone, argillaceous siltstone, oil shale, and carbonaceous shale, with occasional tuff interbeds. Shale oil predominantly occurs in intergranular and dissolution pores within sandstone “sweet spots,” whereas shale gas is largely stored in organic matter-hosted nanopores and microfracture networks within clay mineral interlayers [7,8]. These mud shales, deposited from delta-front to semi-deep and deep lacustrine environments, are characterized by high organic matter content, high thermal maturity, and are in the late stage of hydrocarbon generation, containing substantial in-place oil and gas resources [9,10].
Multi-stage cluster fracturing in horizontal wells is the core technology enabling the commercial development of such unconventional resources, significantly boosting production. Internationally, the United States has led the shale revolution, with hydraulic fracturing innovations transforming it from an energy importer into a net exporter and achieving strategic energy independence [11,12]. However, formation damage arising from fracturing fluid–rock interactions remains a critical factor limiting stimulation efficiency. Shale reservoirs are particularly susceptible due to their high clay mineral content and sensitivity to both fluids and stress. Clay minerals such as illite–smectite and chlorite undergo crystalline structure changes upon hydration. This can cause volumetric expansion, reducing porosity and permeability [13], and also alter microstructure and interparticle cementation through dissolution–recrystallization, thereby weakening mechanical strength and compromising rock stability [14,15]. During fracturing, hydration expansion and fluid retention may block pore throats, restrict hydrocarbon flow, and reduce the post-fracturing productivity. Reservoir heterogeneity exacerbates fine particle migration and water-lock damage, while clay expansion can narrow fractures, limiting effective permeability enhancement [16,17,18]. Additionally, fracturing fluids invade the pore–fracture network via capillary imbibition, disrupting in situ fluid flow pathways.
Numerous studies have examined hydration-induced damage in shale. For example, Zhao et al. [19] reported pore and fracture development after fracturing fluid exposure, while Liu and Sheng et al. [20] identified clay mineral content as the dominant control on permeability loss and found that increased salinity could mitigate hydration damage. Other studies have linked expansion degree to initial moisture content, clay composition, and applied stress [21], correlated hydration fracture propagation with clay expansion rate and particle size [22], and revealed fracture evolution dynamics through multi-scale characterization techniques such as acoustic emission, NMR, and CT imaging [23].
Despite these insights, most prior research has examined shale oil or shale gas reservoirs in isolation. Direct comparative studies that explicitly link the known geological heterogeneity—stemming from different depositional environments and diagenetic pathways—of the Chang 7 member’s shale oil (Dingbian area) and shale gas (Fuxian area) reservoirs to their specific hydration damage responses are lacking. Such a comparison is essential for elucidating their distinct damage-response mechanisms, which are likely rooted in their primordial geological differences. Moreover, hydration should not be regarded solely as detrimental; mineral dissolution and secondary pore formation during hydration can also reconstruct the pore network and potentially improve flow capacity. Against this backdrop, this study systematically investigates hydration-induced damage in representative shale oil and shale gas cores from the Chang 7 member. Using high-temperature expansion testing, nuclear magnetic resonance (NMR), and micro-computed tomography (Micro-CT), we compare macroscopic expansion behavior and microscopic pore structure evolution in both reservoir types. The findings offer a scientific basis for optimizing fracturing fluid formulations and designing reservoir-specific stimulation strategies in the Ordos Basin.

2. Materials and Methods

2.1. Experimental Samples

This study collected the shale oil reservoir cores from the Chang 7 member of the Yanchang Formation in the Dingbian area of the Ordos Basin. The core’s permeability ranged from 0.023 mD to 0.058 mD, with an average value of 0.039 mD. Mineralogical analysis indicated average content of 34.4% quartz and 28.6% clay minerals, with chlorite constituting over 30% of the clay mineral fraction.
The shale gas reservoir cores were collected from the Chang 7 member of the Yanchang Formation in the Fuxian area of Ordos Basin. The core’s permeability ranged from 0.0011 mD to 0.0026 mD, with an average value of 0.0017 mD. Mineralogical analysis indicated an average content of 34.1% quartz and 46.6% clay minerals, with the combined illite and chlorite constituting over 60% of the clay mineral fraction.
The fracturing fluid samples used in the experiment were identical to field formulations, with the following weight percentage composition: 0.36% guar gum, 0.2% bactericide, 0.3% flowback aid, 0–0.7% clay stabilizer, 3% gel breaker, and 0.4% crosslinker.
A comprehensive experimental program was conducted using a total of thirty-one cores. For the high-temperature expansion tests, twenty-one cores were systematically tested across three sample types (montmorillonite, shale oil, and shale gas cores) and seven different fluid systems. For the nuclear magnetic resonance (NMR) analysis, eight cores from the two shale types were used to investigate the effects of aqueous fluids. Additionally, two representative cores were selected for micro-computed tomography (Micro-CT) scanning to provide direct visual evidence of the damage mechanisms.

2.2. Experimental Methods

2.2.1. High-Temperature Expansion Test

Montmorillonite and two types of shale cores were selected as samples for the high-temperature expansion tests. The rock samples were ground and sieved to prepare rock powders with particle sizes ranging from 0.15 mm to 0.044 mm. The high-temperature expansion characteristics of the samples were tested using the shale expansion tester, as shown in Figure 1, in compliance with the Petroleum and Natural Gas Industry Standard of the People’s Republic of China SY/T 5613-2016 [24].
The rock powder was loaded into a cylindrical sample holder, and the pressure was applied at 10 MPa and maintained for 5 min to compact the samples to form cylindrical shapes with an approximate diameter of 2 cm. Seven samples were prepared for each rock type. The sample masses ranged from 6.09 g to 7.20 g (mean mass: 6.7 g), and heights varied from 7.4 mm to 9.3 mm (average height: 8.0 mm). The prepared samples were placed in the sample chamber of the shale expansion tester. Under simulated formation temperature conditions (65 °C), immersion tests were conducted using three fluid systems: (1) clear water, (2) kerosene, and (3) fracturing fluids with clay stabilizer concentrations of 0%, 0.3%, and 0.7%, respectively. During the 30-h experimental period, the expansion height of the sample was dynamically recorded. To accurately capture the rapid expansion characteristics of the initial stage, high-frequency (minute-level–approximately every 15 min) data acquisition was performed within the first 2 h. As the expansion rate slowed, the recording interval was adjusted to once per hour and continued until the expansion curve became gentle.

2.2.2. Nuclear Magnetic Resonance Experiment

NMR technology has the advantages of a wide measurement range, high testing accuracy, and minimal sample requirements. It has become a pivotal technique for full-scale comprehensive characterization of reservoir pore structures. It is extensively used for pore-fracture system distribution characterization, multi-type pore structure analysis, wettability evaluation, fluid mobility assessment, and fluid classification [25].
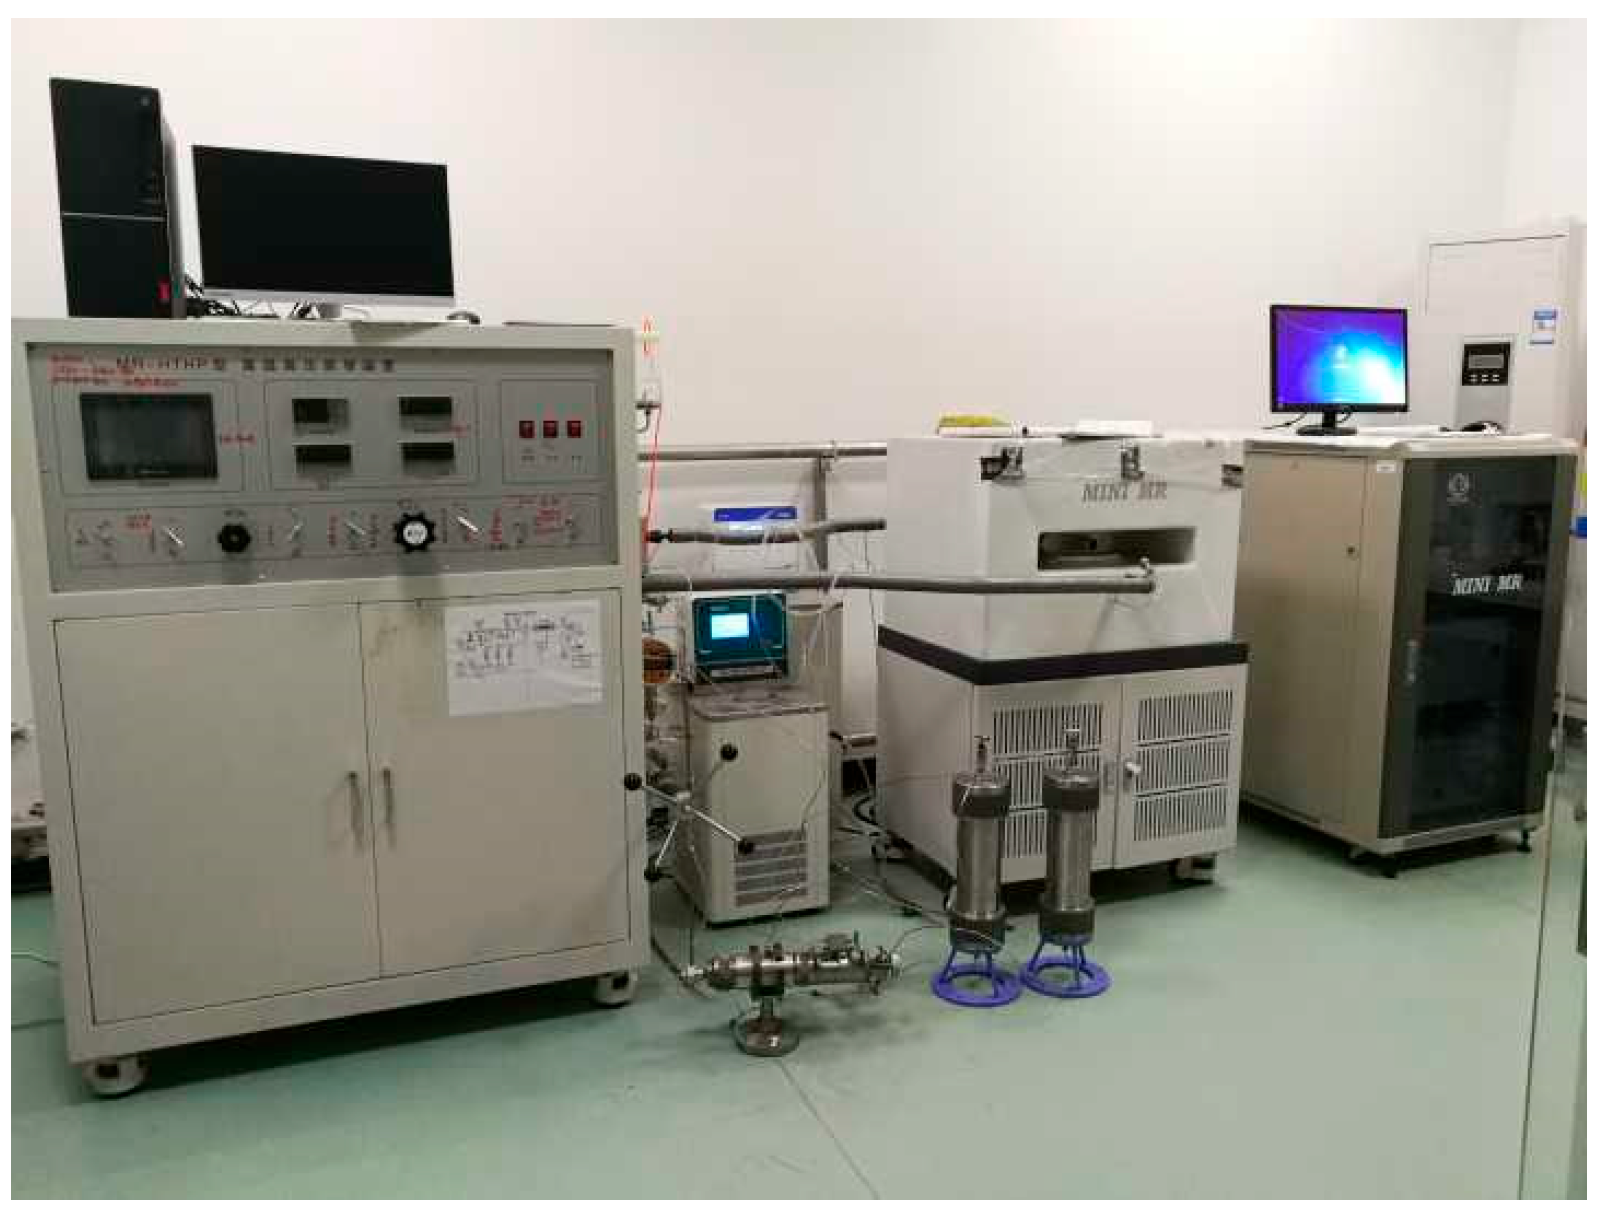
Core samples were first subjected to a 5-day oil removal process in an oil washing device. Subsequently, the cores were dried to constant weight in a constant-temperature drying oven. Finally, initial NMR scanning was performed on the dried samples to obtain baseline data, using the testing apparatus as shown in Figure 2.
Under simulated formation temperature conditions, the processed cores were immersed in different test liquids, including clear water and fracturing fluids containing clay stabilizer concentrations of 0%, 0.3%, and 0.7%. NMR T2 spectra were acquired at specified intervals (2 h, 6 h, 12 h, 24 h, 42 h, and 72 h) to monitor dynamic changes in pore structure and fluid response characteristics.

2.2.3. Micro Computed Tomography

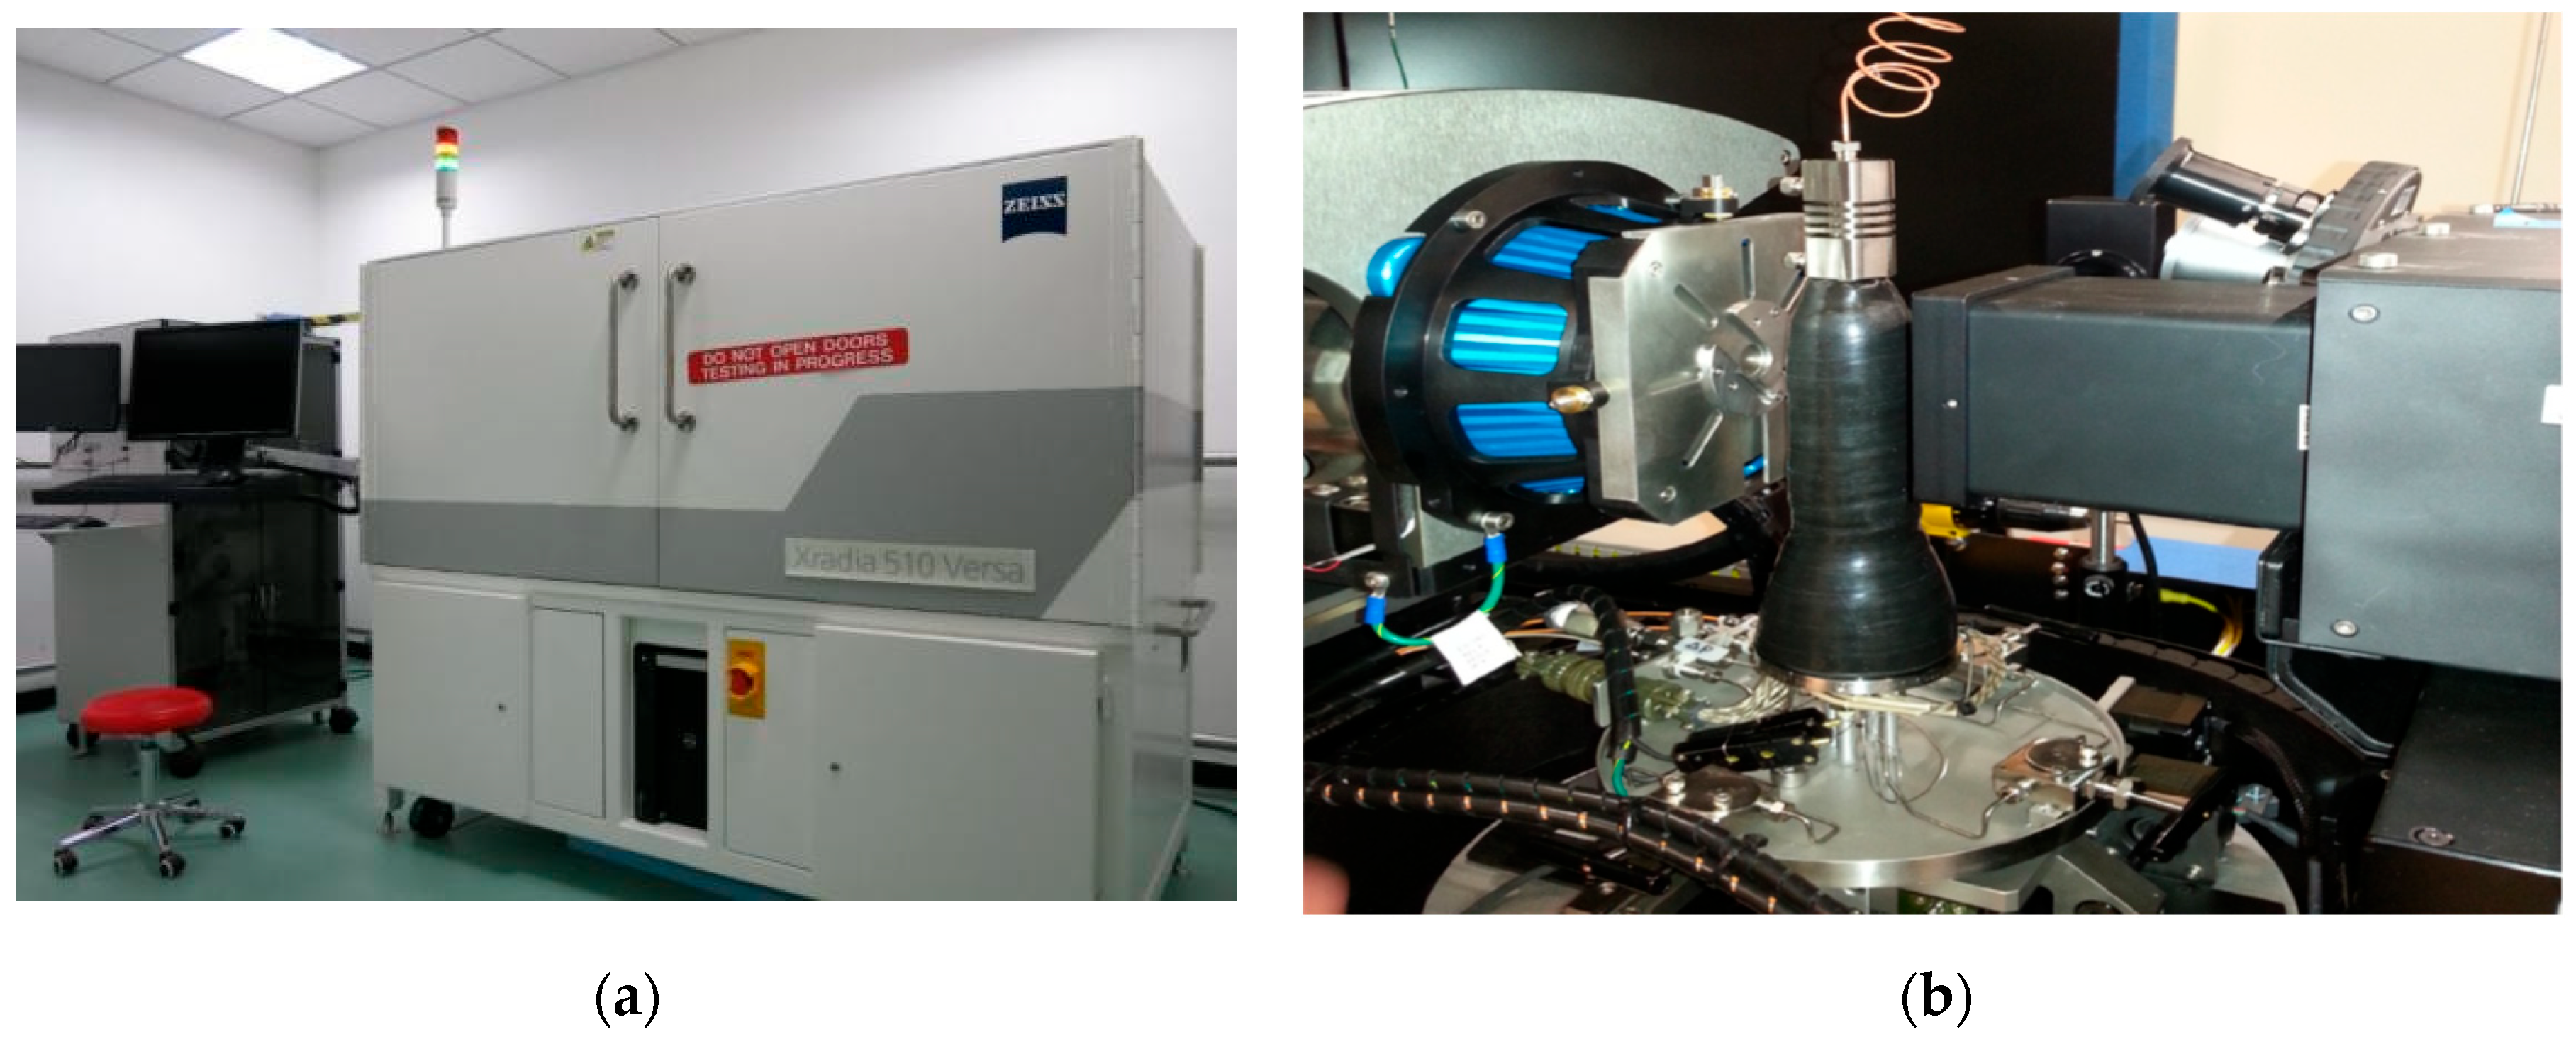
Computed tomography (CT) enables damage-free, precise detection of three-dimensional (3D) internal structures in rock samples while preserving their integrity, providing high-resolution images of the microstructures [26,27]. This study employed the Carl Zeiss Xradia 510 Versa Micro-CT (Carl Zeiss X-ray Microscopy, Inc. Pleasanton, CA, USA.) system (maximum resolution: 0.7 µm) for high-precision 3D scanning, as shown in Figure 3. The scanning parameters were set to a voltage of 50 kV, power of 4 W, and a single scan duration of 10 h.
Before testing, metallic tracer particles were carefully placed at specific locations on the core’s end face using a high-precision positioning system to establish an accurate 3D spatial coordinate system, providing a reliable reference for the positioning and calibration of subsequent CT image reconstruction. The optimal scanning mode and spatial resolution parameters were set based on the lithological characteristics of the core samples and the morphological features of the target scanning areas. Additionally, the coaxial alignment between the core axis and the rotary platform axis must be ensured while maintaining the average X-ray transmission rates within the ideal detection range of 25% to 50% and a 10-h scanning.
Following scanning completion, the core was temporarily removed from the X-ray field to acquire reference background images, then precisely repositioned to its original scanning coordinates for a 360° continuous rotation data acquisition. The acquired data were processed for background subtraction and physical drift correction before selecting multiple reference planes to optimize the reconstruction parameters. This operation enabled accurate segmentation of mineral phase boundaries and microfracture networks. This process ultimately completed the high-resolution three-dimensional image reconstruction of the core’s internal architecture.
The reconstructed images were processed in 3D analysis software through cropping, noise reduction, and smoothing operations, with image enhancement techniques applied to improve visualization. Ultimately, the threshold segmentation method was implemented to differentiate between matrix, pores, and fractures based on grayscale distribution, enabling precise identification of microstructures.
After 72 h of fracturing fluid immersion, the cores were scanned again using identical protocols to comparatively analyze the microstructural evolution characteristics induced by fluid–rock interactions.

3. Results and Discussion

3.1. Hydration Expansion Characteristics of Minerals

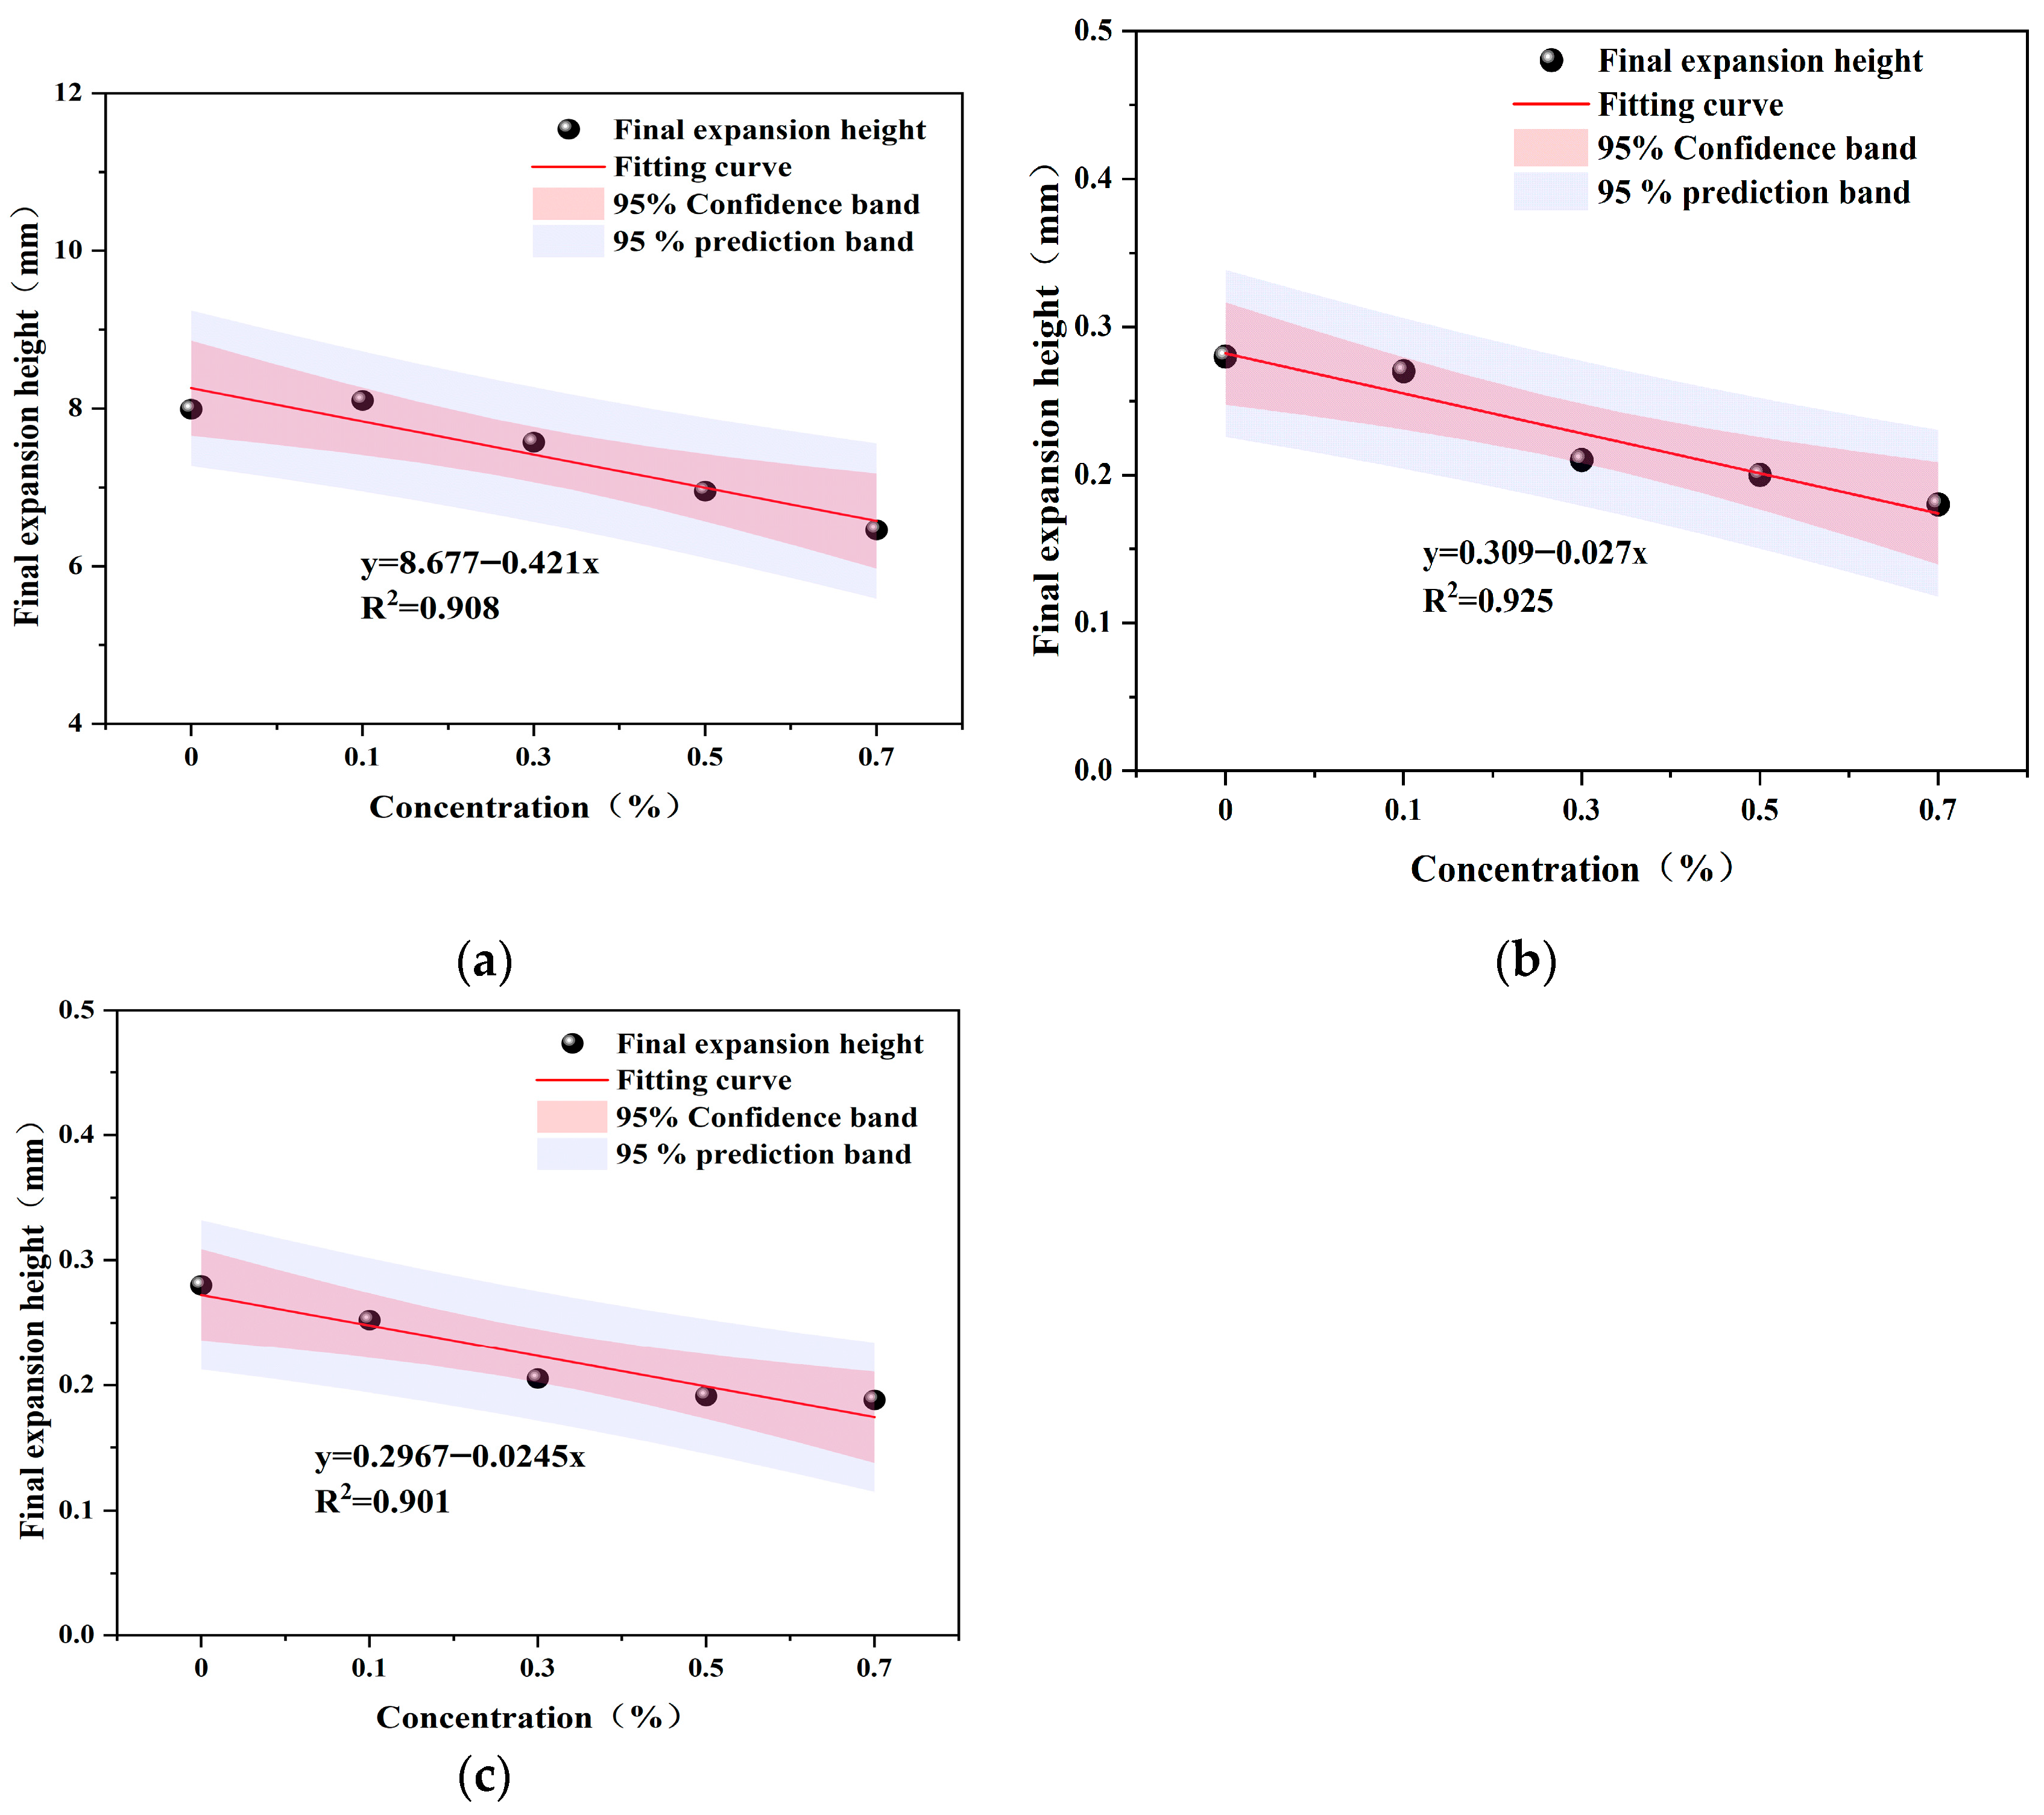
Hydration expansion experiments revealed distinct response characteristics for the two core types when exposed to fracturing fluids (Figure 4). In the control tests, montmorillonite exhibited pronounced water sensitivity, with an expansion rate reaching 120.66% in clear water. The addition of 0.7% clay stabilizer effectively suppressed this expansion, reducing the rate by 14.77%. These results clearly demonstrate the stabilizer’s efficacy in mitigating swelling in pure clay minerals. To quantitatively evaluate the inhibitory effect of the clay stabilizer and its concentration-dependent behavior, the relationship between stabilizer concentration and final expansion height under different conditions was linearly fitted. As shown in Figure 5, within the test concentration range, the inhibition effect on hydration expansion is directly and effectively proportional to the concentration of clay stabilizer.
In contrast to montmorillonite, shale reservoir cores exhibited more complex hydration expansion behaviors, highlighting distinct differences between shale oil and shale gas systems. Although their final expansion rates were similar, 3.73% for shale oil cores and 3.68% for shale gas cores, the expansion dynamics differed markedly. Shale gas cores expanded more rapidly and intensely, reaching an absolute expansion height of 0.374 mm, approximately 25% greater than the 0.300 mm observed for oil-bearing cores. Gas-bearing cores also achieved expansion equilibrium within 10 h, whereas oil-bearing cores required 23 h to reach stability. Petrographic analysis attributed this faster response in gas-bearing cores to their higher average clay mineral content (46.6%), dominated by water-sensitive illite and chlorite (exceeding 60% of total clays), compared to only 28.6% clay content in oil-bearing cores. This mineralogical difference accounts for the more rapid and pronounced macroscopic expansion when fracturing fluid infiltrates the gas-bearing samples.
The two core types also differed in their sensitivity to clay stabilizers. At a 0.7% stabilizer concentration, oil-bearing cores showed a 1.33% reduction in expansion rate, slightly greater than the 1.16% reduction in gas-bearing cores. This difference is likely due to the slower water uptake and expansion of oil-bearing cores, allowing more time for stabilizer molecules to adsorb effectively onto clay surfaces and exert their inhibitory effect. Overall, shale gas reservoirs are more vulnerable to rapid hydration damage, whereas shale oil reservoirs experience slower, more gradual hydration processes and respond more strongly to stabilizer treatment.
Both core types exhibited maximum expansion in clean water and minimal expansion in kerosene. Increasing stabilizer concentration generally reduced expansion heights for both, though the marginal benefit diminished at higher concentrations. The expansion degree of Chang 7 shale gas cores remained significantly higher than that of oil-bearing cores, while the resistance to expansion correlated positively with stabilizer concentration. Optimal inhibition was achieved at 0.7%, which is therefore recommended as the preferred technical parameter for controlling shale expansion.

3.2. Dynamic Evolution Characteristics of Pore Structure

In this study, NMR T2 spectra were used to qualitatively assess changes in pore structure. The underlying principle is that for fluids in tight porous media, the observed T2 relaxation time is dominated by surface relaxation and is directly proportional to the pore size. Consequently, the T2 distribution spectrum effectively mirrors the pore size distribution, where peaks at shorter T2 times correspond to smaller pores and peaks at longer T2 times correspond to larger pores or microfractures. While a quantitative conversion to an absolute pore size in micrometers requires a specific calibration of a conversion factor (C), which was not performed in this work, this method provides a powerful tool for comparing the relative changes in pore structure before and after fluid interaction.
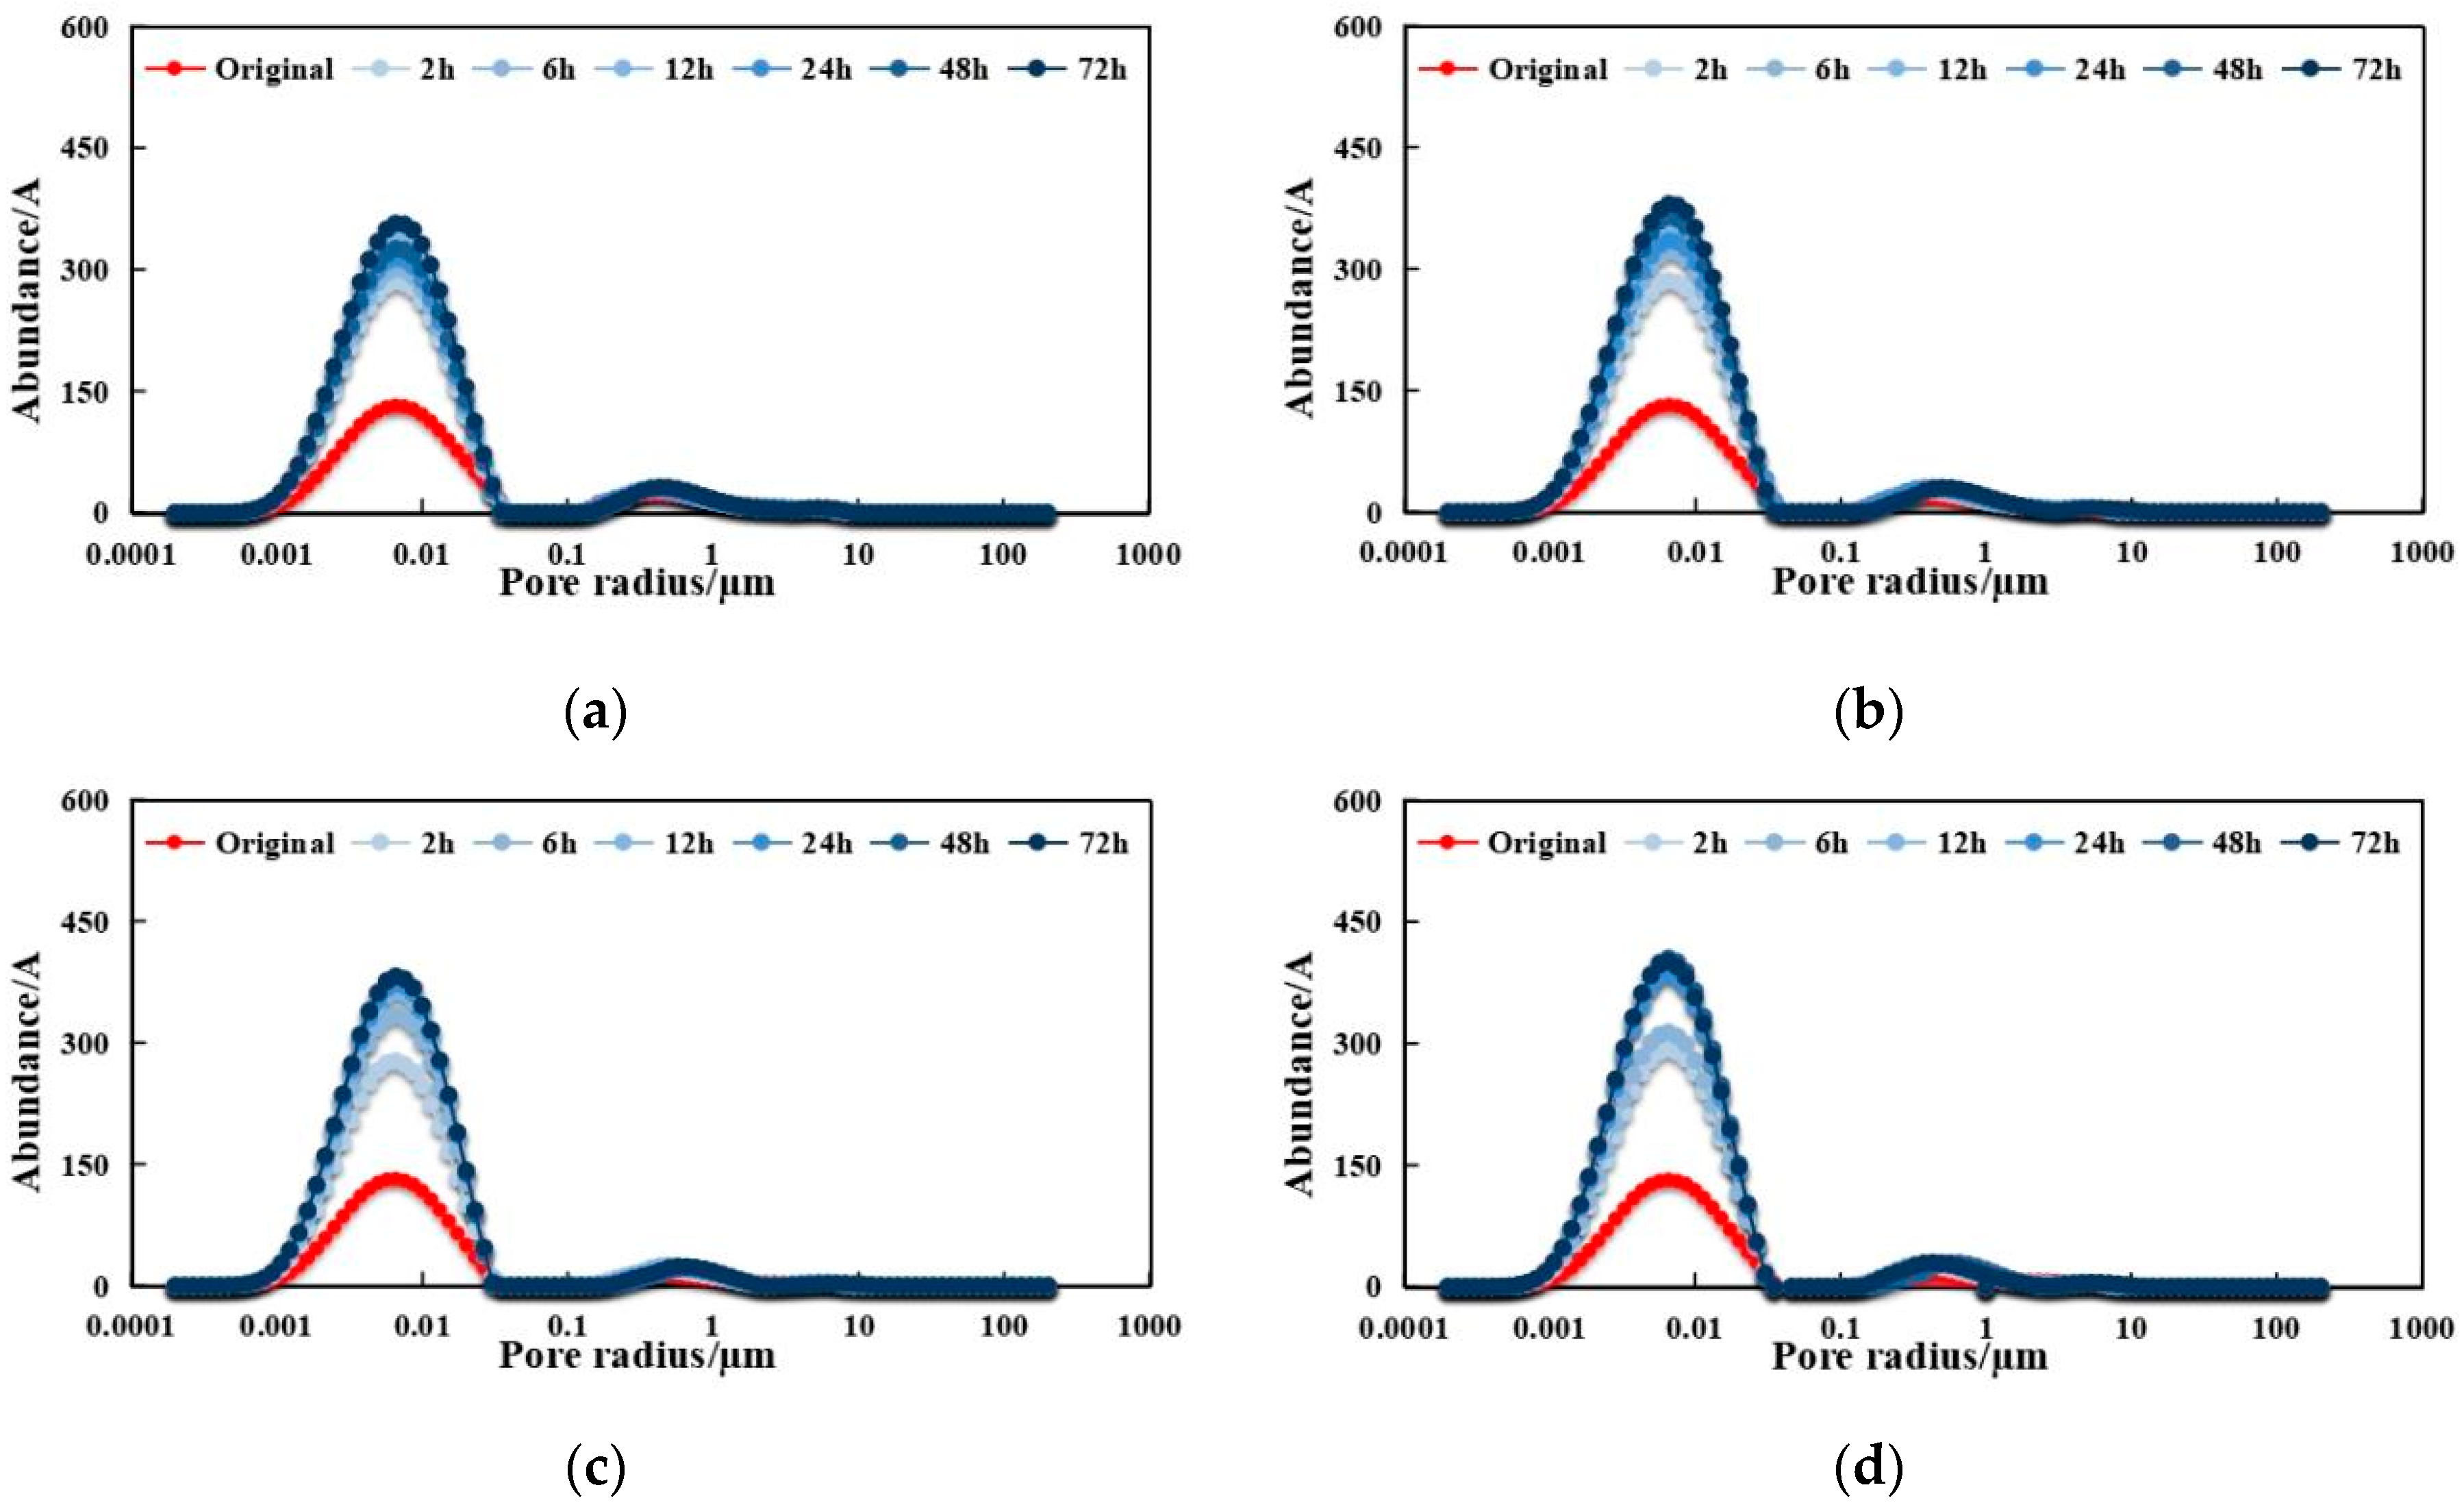
NMR T2 spectra of cores immersed in water and clay stabilizer solutions (Figure 6 and Figure 7) revealed that both oil-bearing and gas-bearing cores from the Chang 7 member exhibited similar pore size distributions, ranging from 0.001 μm to 1 μm. The most pronounced variations in signal amplitude occurred within the 0.001–0.1 μm range, indicating that these micropores were particularly susceptible to fluid invasion. For oil-bearing cores, signal amplitude increased rapidly during the initial stage of imbibition, then the rate of increase gradually slowed, reaching stability after approximately 24 h (Figure 6). In contrast, gas-bearing cores also showed a rapid initial increase in signal amplitude but reached equilibrium sooner, after about 12 h, following a more sustained early uptake phase (Figure 7). Comparative analysis confirmed that oil-bearing cores required a longer period to stabilize than their gas-bearing counterparts.
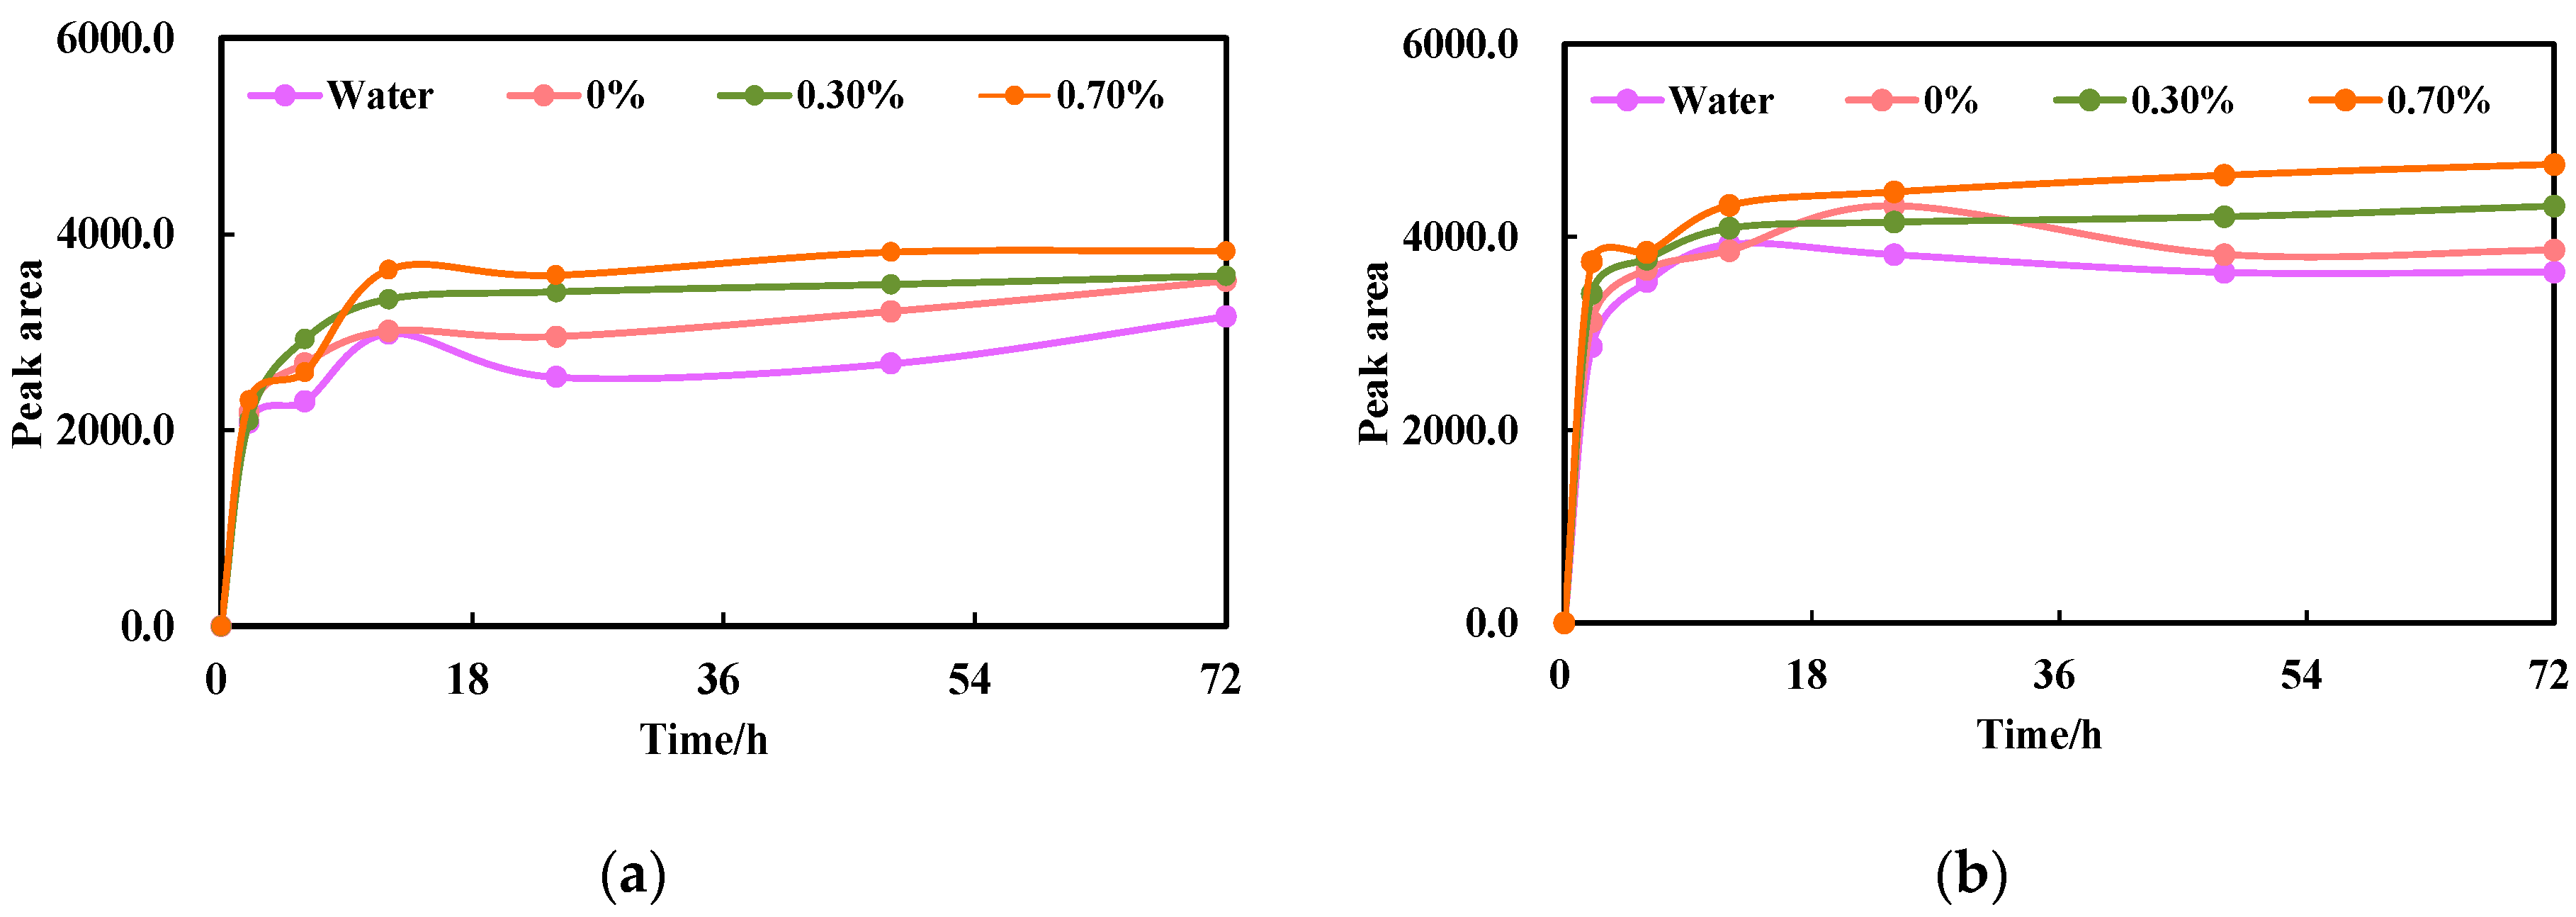
In this investigation, a 72-h timeframe was designated as the pivotal normalization threshold to mitigate the influence of intrinsic variations in pore structure, mineral composition, and permeability between the two core types, thereby enhancing the comparability of the experimental datasets. At this juncture, fluid imbibition within the cores approached near-saturation levels, with concomitant pore structural alterations nearing equilibrium. By normalizing the NMR signal peak areas to their average values at this point, a quantitative assessment of pore evolution across diverse cores during hydration-induced damage becomes feasible. This methodological refinement effectively attenuates perturbations from extraneous non-experimental variables, establishing a robust and uniform framework for delineating the differential hydration damage profiles between the cores. The normalization procedure was executed using Equation (1), with the resultant data visualized in Figure 8.
A N = A · A N   72 h A 72 h
In the formula, the following applies:
A N —Normalized NMR signal peak area of rock samples at different time points;
A —NMR signal peak area of rock samples at different time points before normalization;
A 72 h —NMR signal peak area of rock samples after 72 h of imbibition;
A N   72 h —Average NMR signal peak area of a set of rock samples after 72 h of imbibition.
During the immersion of shale reservoir cores, the NMR peak area exhibited a continuous increase, stabilizing after approximately 48 h. In the control group, devoid of clay stabilizers, the peak area remained consistently lower, indicative of diminished fluid uptake. Conversely, cores treated with clay stabilizers displayed a progressive increase in fluid imbibition as stabilizer concentrations escalated from 0.3% to 0.7%. Notably, the 0.7% concentration group achieved the highest imbibition volume at the 48-h mark.
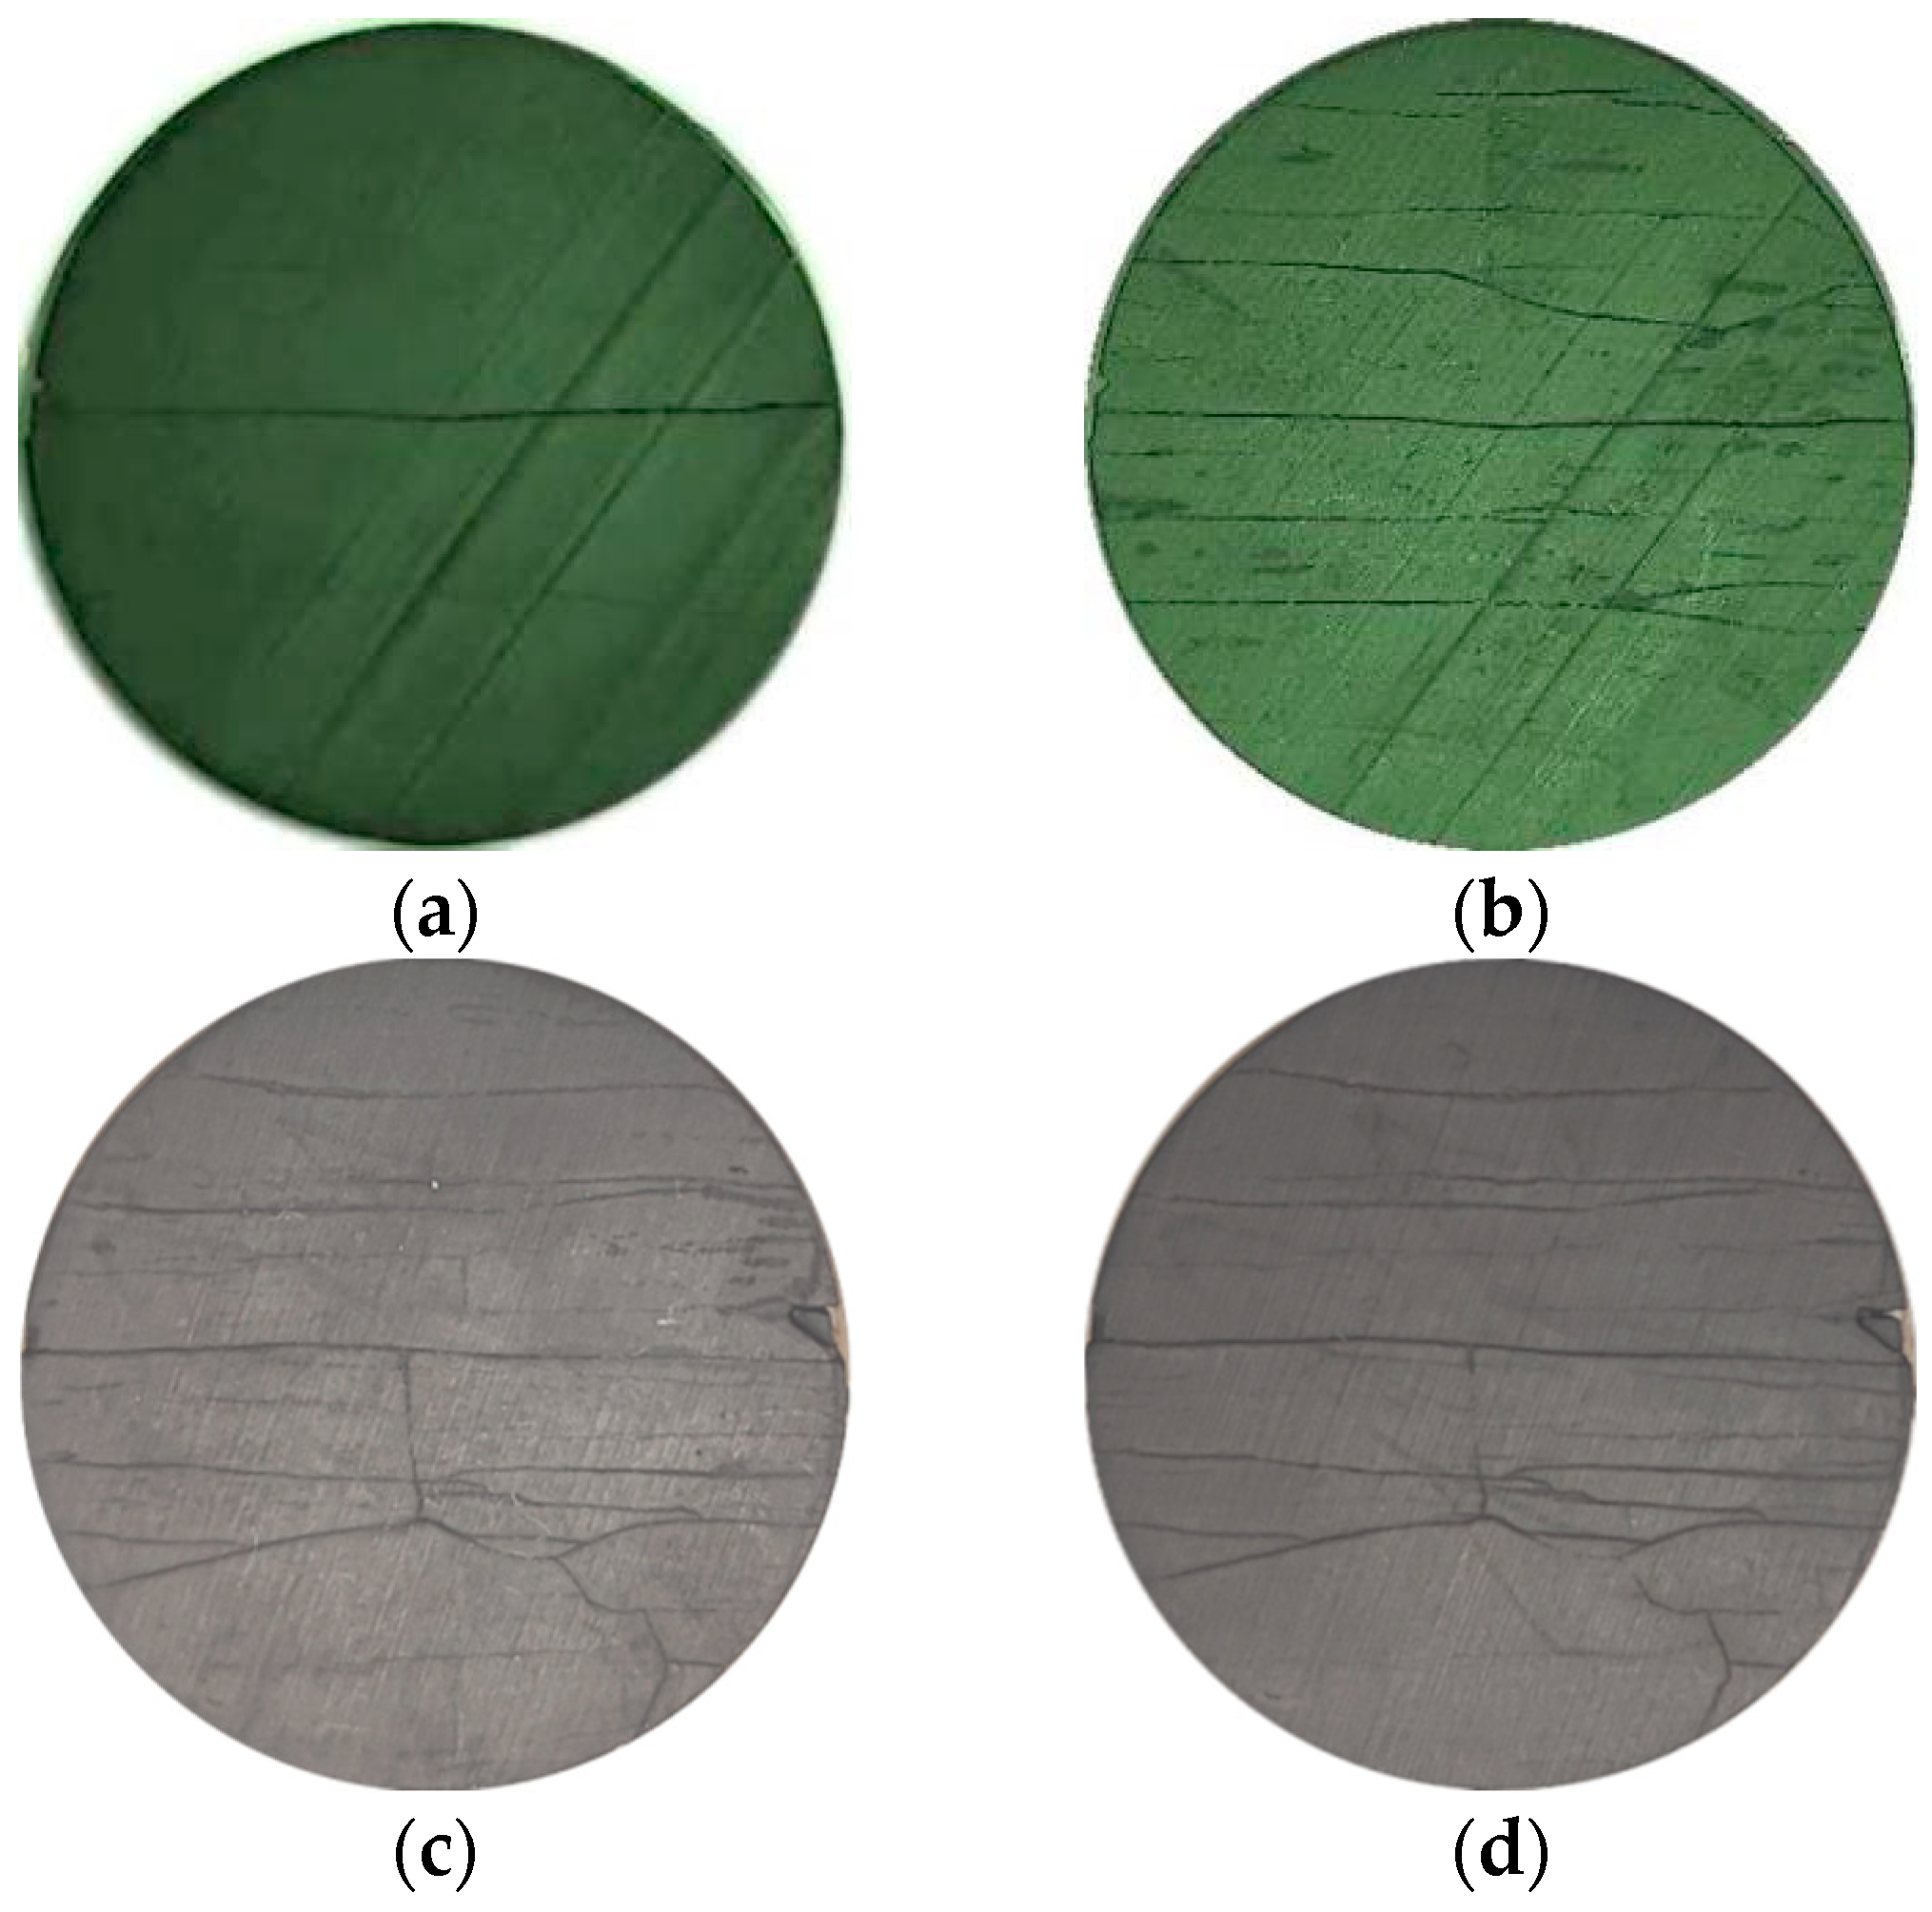
With increasing clay stabilizer concentrations, the pore-throat architectures within shale oil and gas reservoir cores underwent continuous modification due to clay hydration. Shales, characterized by abundant micro-fractures, experienced hydration-driven mesoscale damage that evolved into macro-fractures, as illustrated in Figure 9.
The NMR peak areas of shale oil and gas reservoir cores revealed a spontaneous imbibition profile characterized by an initial rapid increase followed by gradual stabilization. This behavior delineated two distinct imbibition phases: (1) an initial rapid-imbibition phase (0–12 h), marked by a pronounced surge in peak areas, reflecting accelerated fluid uptake; and (2) a saturation–equilibrium phase, where imbibition rates markedly declined, and the curves approached a plateau, signifying near-saturation and system equilibrium. For shale oil cores, after immersion for 72 h, the addition of 0.3% and 0.7% stabilizers increased the final peak area by approximately 1.4% and 8.6%, respectively, compared to the 0% concentration stabilizer. The data quantitatively show that the additive can promote the fluid to enter the pore system of the shale oil core, and the higher the concentration, the more obvious the effect of increasing permeability. For shale gas cores, more significant changes were observed. After 72 h of immersion, the final peak area increased by about 11.8% and 22.9% with 0.3% and 0.7% stabilizers, respectively, compared to the 0% concentration stabilizer. Across both core types, a consistent trend emerged: the final NMR peak areas in fracturing fluid groups containing clay stabilizers significantly surpassed those in the base fluid and water-only groups. Furthermore, the efficacy of the 0.7% clay stabilizer concentration notably exceeded that of the 0.3% concentration. These results underscore the capacity of clay stabilizers to mitigate water-sensitivity damage, preserve the integrity of reservoir pore structures, and enhance overall imbibition volumes.
A comparison of the experimental results from the two types of cores showed that gas-bearing cores exhibited significantly higher initial imbibition rates and total imbibition volumes compared to oil-bearing cores. This difference is primarily due to shale gas reservoirs possessing more developed organic matter-hosted pores than oil reservoirs. Additionally, the water-sensitive clay minerals undergo a rapid and intense expansion reaction upon contact with water. This reaction quickly blocks the micro-scale pore-throat channels, damaging the water-lock and restricting access for subsequent fluids to penetrate the pore networks. As a result, this mechanism contributes to a more rapid imbibition process [28,29]. Consequently, shale gas reservoirs are more susceptible to higher rates of fracturing fluid leak-off during production operations and face a greater risk of severe water-lock damage than shale oil reservoirs.

3.3. Evolution Law of Pore Structure

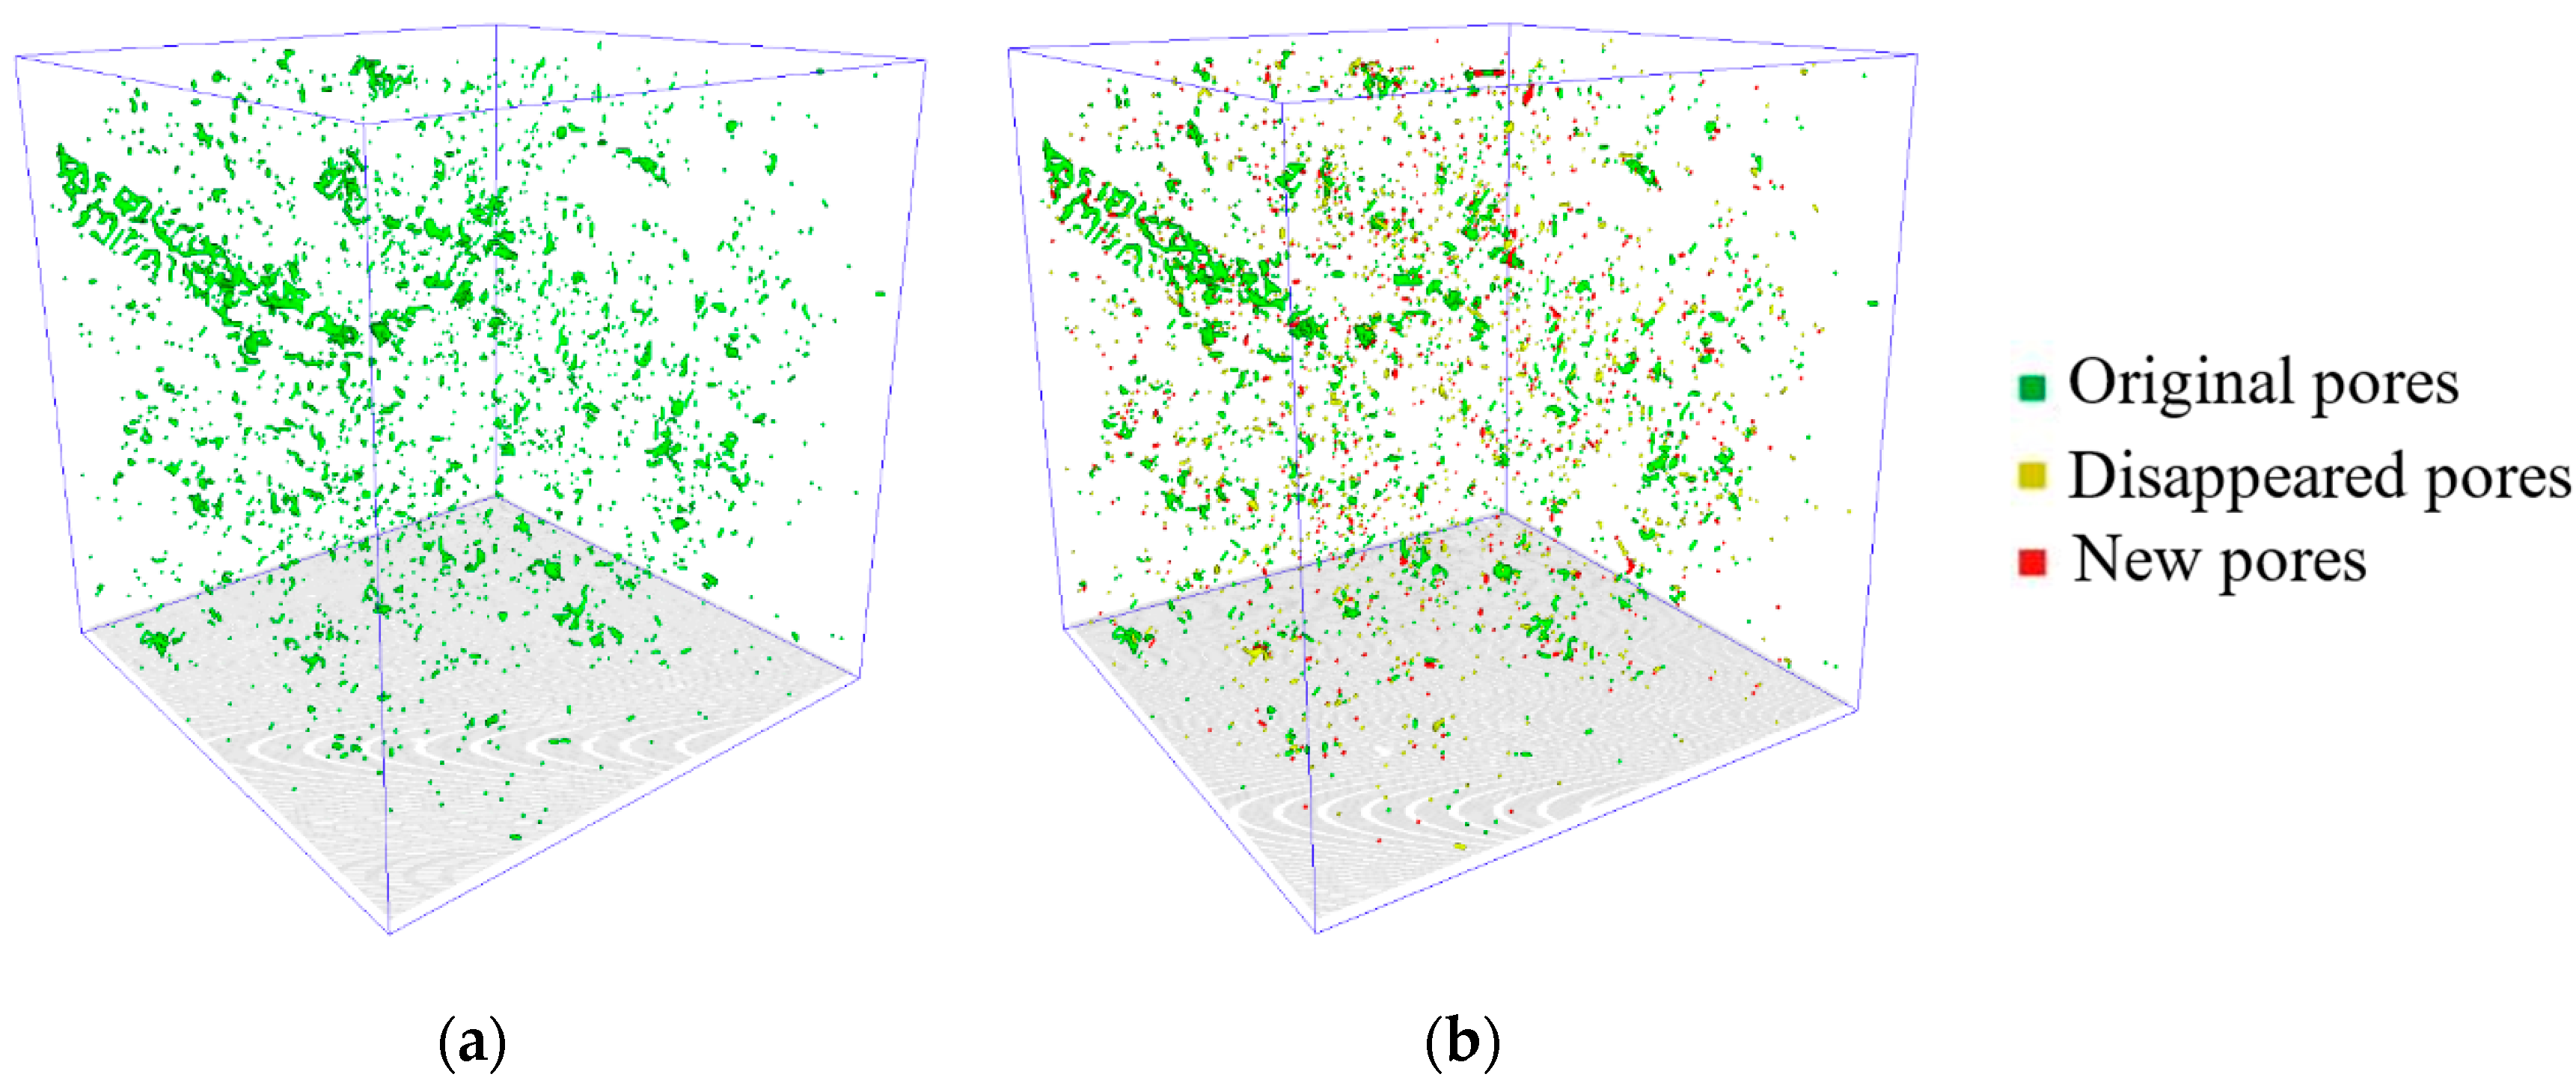
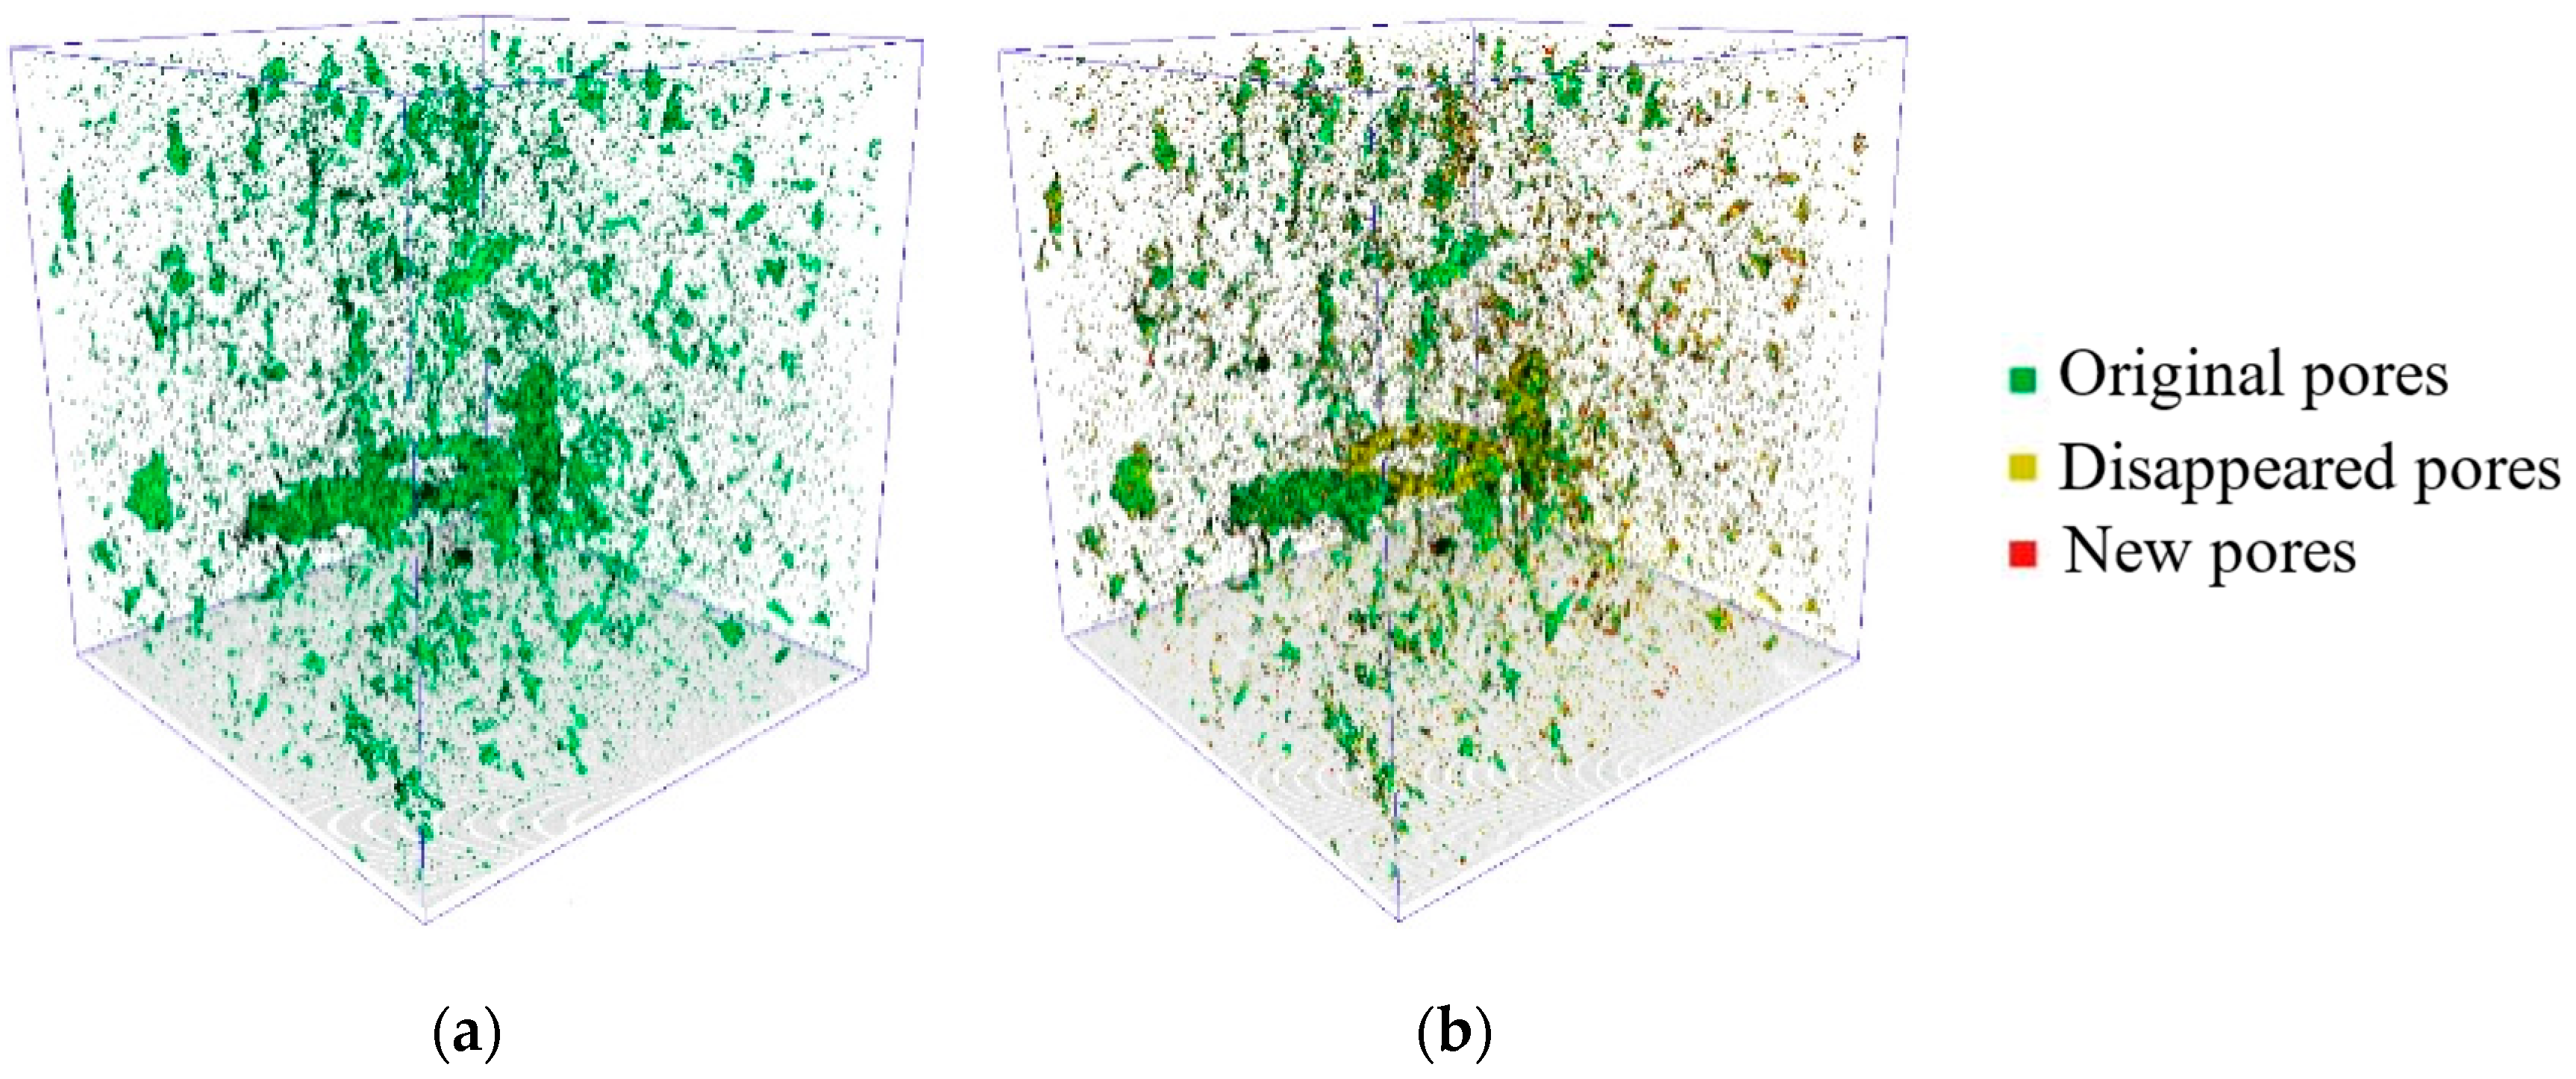
The Micro-CT scanning results are shown in Figure 10 and Figure 11. The shale oil core used in this experiment had an original pore volume of 1.97 × 106 µm3, and a porosity of 0.50%. After 72 h of immersion in fracturing fluid, significant changes occurred in the pore structure: the original pore volume decreased by 1.08 × 106 µm3, resulting in a residual pore volume of 8.95 × 105 µm3. Additionally, newly generated pores contributed 4.73 × 105 µm3 of volume, bringing the total pore volume to 1.37 × 106 µm3 and reducing the porosity to 0.35%. In contrast, the gas-bearing core involved in this experiment had an original pore volume of 7.64 × 105 µm3, and a porosity of 0.19%. After treatment with fracturing fluid, the original pore volume decreased by 2.61 × 105 µm3, leaving a remaining original pore volume of 5.03 × 104 µm3. Meanwhile, 1.64 × 105 µm3 of new pores were generated, resulting in a total pore volume of 6.67 × 105 µm3 and a correspondingly reduced porosity of 0.17%.
Post-immersion analysis revealed substantial reductions in pore volume for both oil and gas reservoir cores. The shale oil core exhibited a 54.8% decrease in pore volume, whereas the shale gas core experienced a 34.2% reduction. Notably, newly generated pores constituted 34.5% of the total pore volume in the oil-bearing core, compared to 24.6% in the gas-bearing core. These observations indicate that, while the shale oil core demonstrates a greater propensity for pore restructuring under the influence of fracturing fluids, evidenced by a higher proportion of new pores, the intensified clay hydration expansion results in a more significant net loss of pore volume. Consequently, a comprehensive evaluation of damage effects in the Chang 7 member shale reservoirs of the Ordos Basin must consider not only the extent of pore structure deterioration but also the intricate interplay between damage and restorative processes.
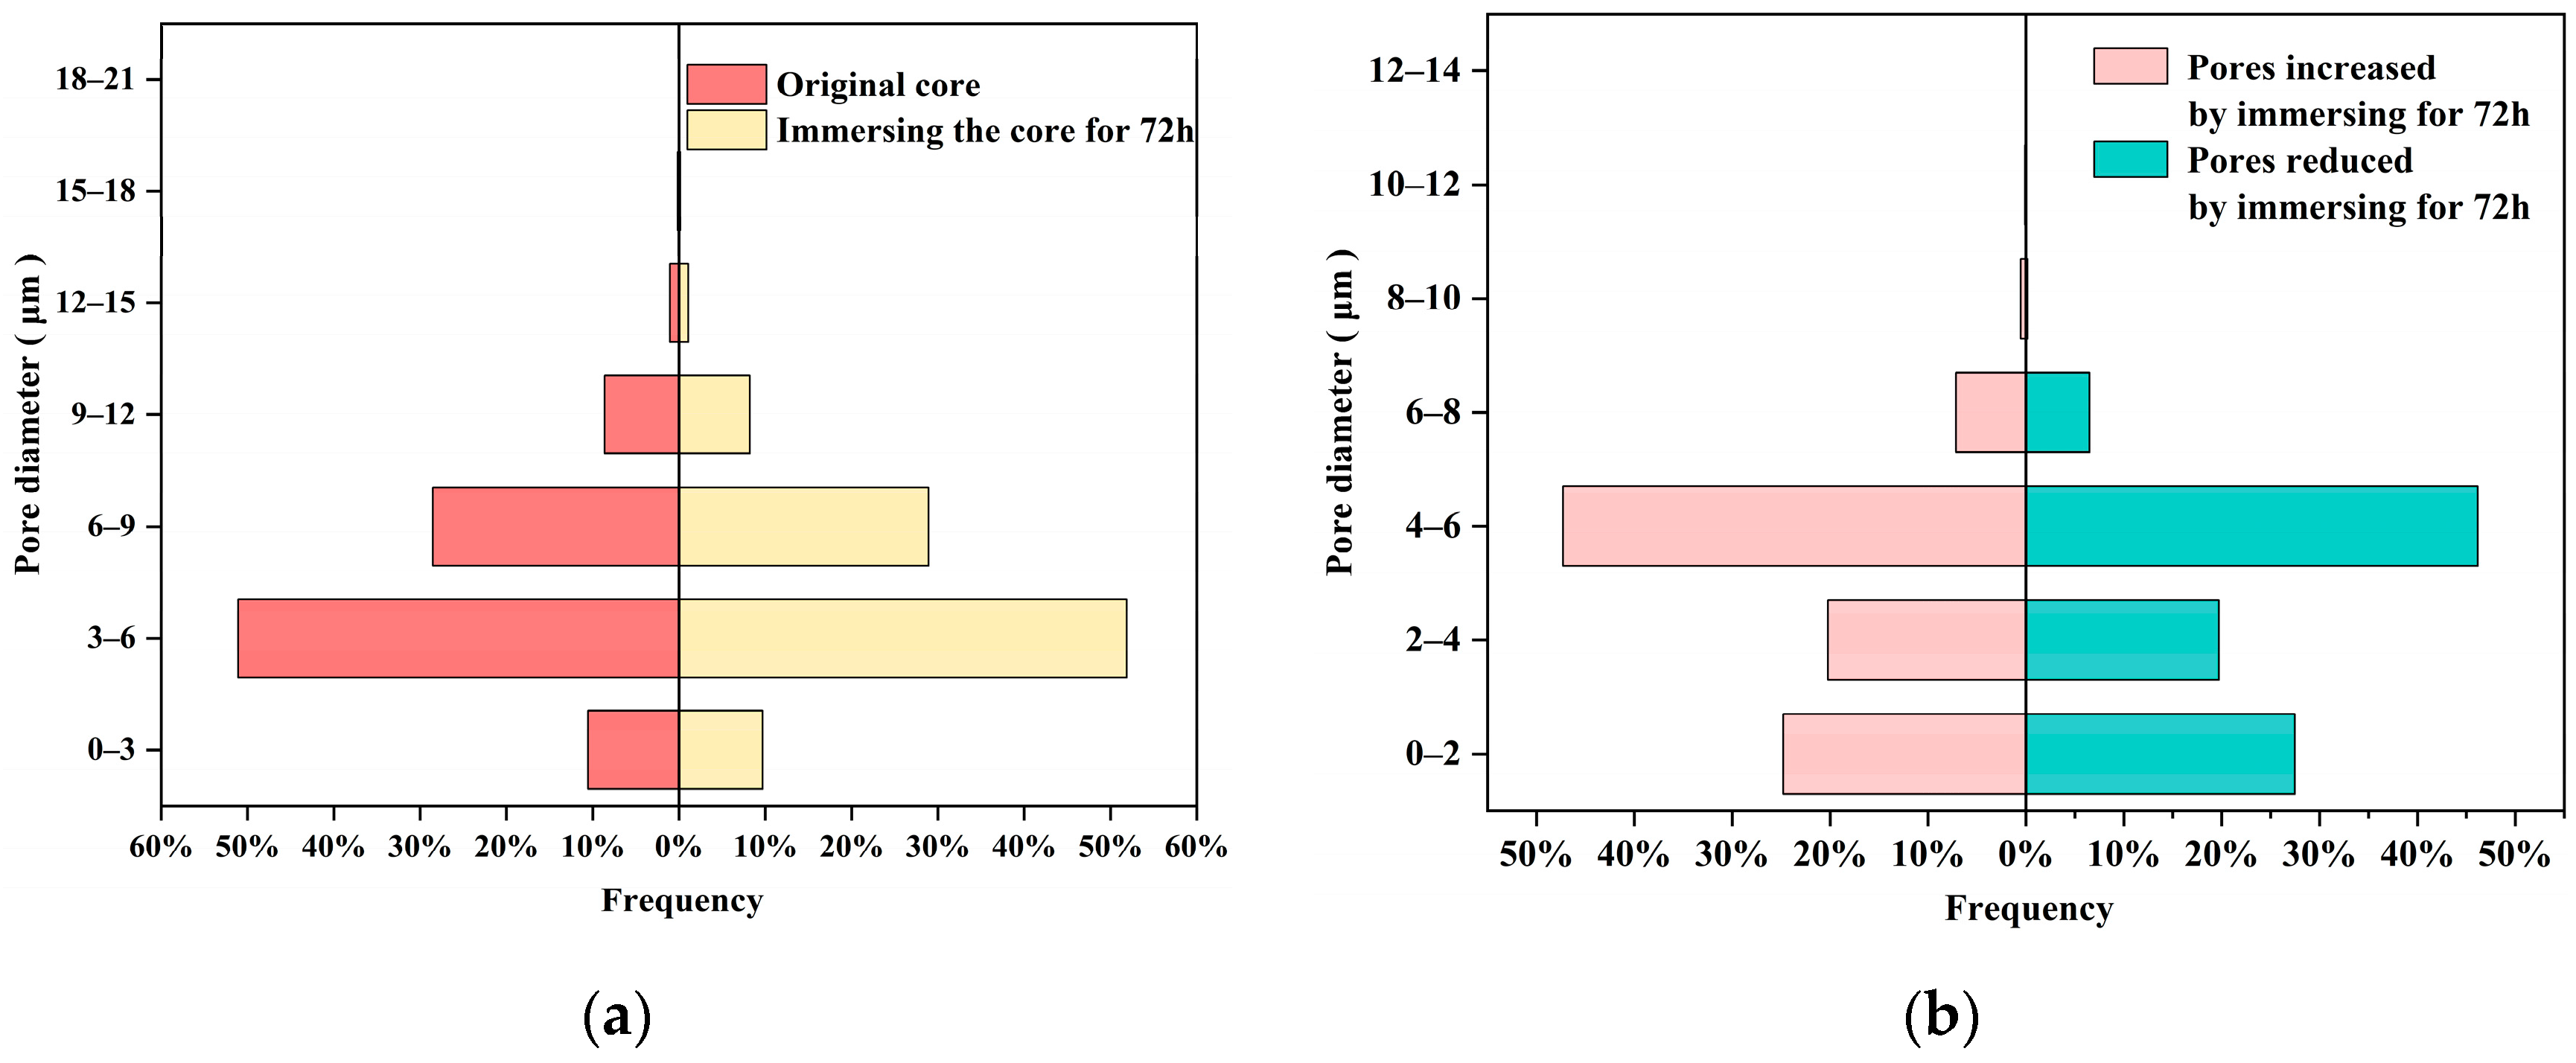
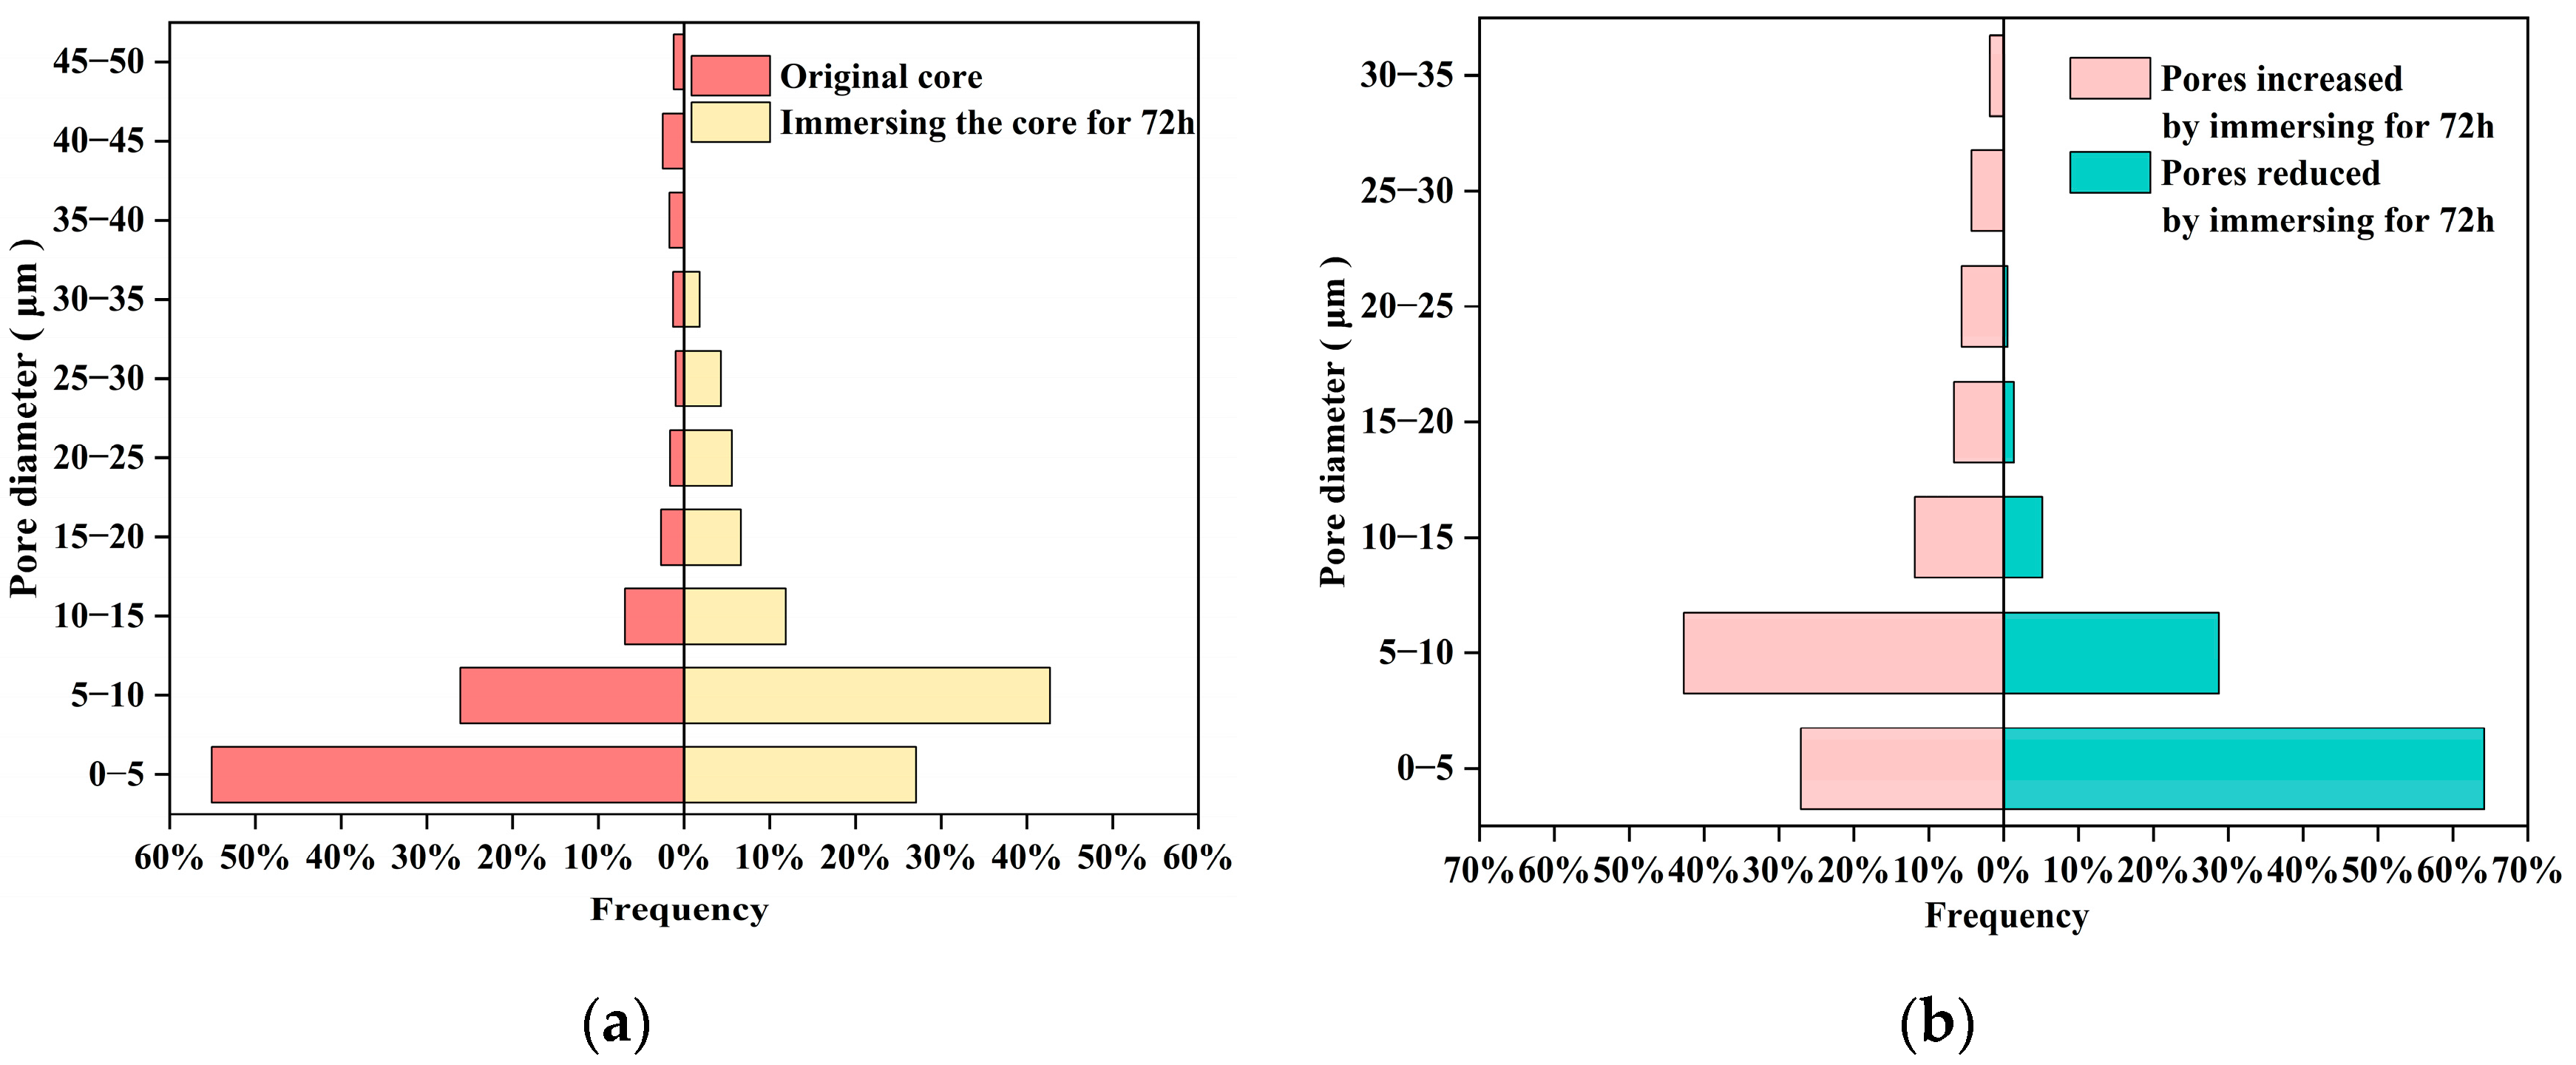
The frequency distribution of pore sizes in core samples, as shown in Figure 12 and Figure 13, revealed that for shale gas cores, the pore diameters ranged from 1.40 µm to 18.62 µm, with most pores smaller than 12 µm. The peak distribution was observed between 3 µm and 6 µm. In contrast, for shale oil cores, the pore diameters varied from 0.48 µm to 48.42 µm, with most pores smaller than 20 µm. The core’s peak distribution was between 0 µm and 5 µm.
The evolution of pore structures in gas reservoir cores is more complex than in shale oil reservoir cores, yet it exerts a relatively limited impact on total porosity. Fracturing fluid induces the formation of new pores, predominantly in the 0–6 µm range, through processes such as dissolution. Concurrently, clay mineral hydration expansion and the migration of dissolution-derived debris can obstruct existing pores. This interplay results in a dynamic equilibrium in pore size distribution and quantity, leading to only marginal changes in the overall pore size distribution.
In contrast, shale oil reservoir cores exhibit more pronounced alterations in pore evolution, effectively reconstructing the matrix pore system. The dominant micropores (0–5 µm) undergo significant destruction and structural reorganization, fostering the development of larger-scale pore networks, particularly with a marked increase in pores ranging from 5 to 10 µm. The mechanism of driving pore reconstruction is also related to the chemical interaction between fracturing fluid and rock matrix. The fracturing fluid system used in this study contains components such as gel breaker (persulfate) and cleanup agent, which are hydrolyzed under simulated reservoir conditions (65 °C) to produce acidic by-products. This locally formed acidic environment will strongly corrode the chemically unstable minerals in the shale matrix. Mineralogical analysis reveals the presence of acid-sensitive minerals, including carbonates (such as calcite and dolomite) and feldspar, in the core, which are readily dissolved. The wall surface of the original tiny pores is eroded by the acidic fluid, causing the mineral particles that separate the adjacent pores to dissolve. This process prompts multiple small pores to connect and merge into a larger pore cavity, indicating that the influence of the pore structure on the shale reservoir core is transformable. The reservoir has great potential for pore optimization under fluid transformation.
The three-dimensional image of Micro-CT intuitively reveals the evolution mechanism of the physical structure. Although the total porosity of the core decreased (from 0.50% to 0.35% in shale reservoirs and from 0.19% to 0.17% in shale gas reservoirs), significant pore reconstruction occurred inside. The pore size distribution analysis (Figure 12) further confirms that this reconstruction is primarily characterized by the dissolution and merging of the original micropores, resulting in a significantly increased number of larger pores, ranging from 5 μm to 10 μm. This CT-confirmed pore network with a larger size and better connectivity perfectly explains the macroscopic fluid dynamics measured by NMR. It is precisely because of these new “high-speed channels” that the final total liquid uptake of the core can be increased when 0.7% stabilizer is used, thereby increasing the peak area of the NMR (Figure 7).

4. Conclusions

This study conducted a comprehensive multi-scale investigation of representative shale oil and gas reservoir cores from the Chang 7 member of the Ordos Basin, employing high-temperature expansion tests, NMR scans, and micro-computed tomography (Micro-CT) imaging. Through systematic analysis of the damage mechanisms and pore structure evolution induced by fracturing fluid hydration, the following key conclusions were drawn:
(1)
Both shale oil and gas reservoir cores exhibit water-sensitive expansion characteristics upon exposure to fracturing fluids, yet they display distinct reaction kinetics and processes. Shale gas cores, characterized by pronounced microporosity, narrow fractures, and strong capillary forces, undergo rapid and intense hydration expansion. This heightened reactivity increases the risk of water-lock damage and permeability impairment. Conversely, shale oil cores exhibit slower hydration reactions and a more stable expansion process, reflecting greater resilience to hydration-induced damage.
(2)
Hydration by fracturing fluids induces a dynamic evolution in reservoir pore structures, termed “damage–reconstruction.” After 72 h of hydration, both core types experience a net reduction in pore volume. However, shale oil cores demonstrate a superior capacity for pore reconstruction, wherein original micropores interconnect and coalesce to form larger pore networks, highlighting their enhanced potential for structural modification compared to gas cores.
(3)
NMR results reveal a biphasic imbibition pattern in both shale oil and gas cores, characterized by an initial rapid-imbibition phase followed by a saturation–equilibrium stage during fracturing fluid uptake. The incorporation of clay stabilizers, particularly at a 0.7% concentration, significantly mitigates hydration-induced damage, enhances pore connectivity, and augments fluid absorption capacity, thereby bolstering reservoir integrity.
(4)
Micro-CT imaging and pore size distribution analyses corroborate that shale oil cores undergo substantial pore expansion and structural reorganization during hydration, driven by the formation of larger pore networks. In contrast, shale gas cores, constrained by denser matrices and hydration-induced particle migration and pore blockage, exhibit a more intricate pore evolution process, resulting in limited overall changes to pore structure.
(5)
For the Chang 7 shale oil reservoir, its pore reconstruction potential indicates that the fracturing fluid can be used as a “matrix transformation” tool, not just a crack maker. By optimizing the fluid chemical formula to enhance dissolution and controlling clay expansion, it is expected to significantly increase the effective transformation volume and improve single-well productivity. In the shale gas development area, the “remodeled” pore network with improved connectivity may form more persistent flow channels, leading to a gentler production decline and higher ultimate recovery.
(6)
To further combine the microscopic mechanism with the macroscopic application, future research should focus on the following three directions: (1) according to the mineral characteristics of different lithofacies in Chang 7 member, a “customized” fracturing fluid formula is developed; (2) core displacement experiments under real confining pressure conditions are conducted to understand the coupling relationship between chemical action and stress-induced changes; and (3) the “damage–reconstruction” dual-mechanism reaction migration model is established and verified to more accurately simulate the effective transformation volume and mass, fracturing fluid filtration and ultimate recovery at the reservoir scale.

Author Contributions

Conceptualization and Writing (original draft & review & editing), W.W.; Resources and Data curation, L.B.; Methodology and Validation, P.X.; Investigation and Visualization, Z.F.; Formal analysis, M.W.; Supervision, B.W. and F.Z. All authors have read and agreed to the published version of the manuscript.

Funding

This research was funded by Shaanxi Province Technology Innovation Guidance Special Program (Fund), grant number 2024CG-CGZH-31; National Natural Science Foundation of China, grant number 52474040; Shaanxi Province Key Research and Development Plan, grant number 2024GX-YBXM-496; and Shaanxi Key Laboratory of Carbon Dioxide Sequestration and Enhanced Oil Recovery, grant Number YJSYZX25SKF0010.

Data Availability Statement

The data are available from the corresponding author upon reasonable request. However, data availability may be restricted due to the inclusion of proprietary and confidential information and the need to comply with privacy and data protection regulations.

Conflicts of Interest

Authors Weibo Wang, Peiyao Xiao, Zhen Feng and Meng Wang were employed by the company Research Institute of Shaanxi Yanchang Petroleum (Group) Co., Ltd. The remaining authors declare that the research was conducted in the absence of any commercial or financial relationships that could be construed as a potential conflict of interest.

Abbreviations

Micro-CTMicro-Computed Tomography
CTComputed Tomography
NMRNuclear Magnetic Resonance
SRVStimulated Reservoir Volume
T2Transverse Relaxation Time
3DThree-Dimensional

References

  1. Yang, H.; Niu, X.; Xu, L.; Feng, S.; You, Y.; Liang, X.; Wang, F.; Zhang, D. Exploration potential of shale oil in Chang7 member, upper Triassic Yanchang formation, Ordos Basin, NW China. Pet. Explor. Dev. 2016, 43, 560–569. [Google Scholar] [CrossRef]
  2. Fu, J.; Li, S.; Niu, X.; Deng, X.; Zhou, X. Geological characteristics and exploration of shale oil in Chang 7 member of Triassic Yanchang Formation, Ordos Basin, NW China. Pet. Explor. Dev. 2020, 47, 931–945. [Google Scholar] [CrossRef]
  3. Fu, J.; Niu, X.; Dan, W.; Feng, S.; Liang, X.; Xin, H.; You, Y. The geological characteristics and the progress on exploration and development of shale oil in Chang7 Member of Mesozoic Yanchang Formation, Ordos Basin. China Pet. Explor. 2019, 24, 601–614. [Google Scholar]
  4. Guo, Q.; Li, S.; Jin, Z.; Zhou, X.; Liu, C. Characteristics and exploration targets of Chang 7 shale oil in Triassic Yanchang Formation, Ordos Basin, NW China. Pet. Explor. Dev. 2023, 50, 878–893. [Google Scholar] [CrossRef]
  5. Chen, G.; Gang, W.; Chang, X.; Wang, N.; Zhang, P.; Cao, Q.; Xu, J. Paleoproductivity of the Chang 7 unit in the Ordos Basin (North China) and its controlling factors. Palaeogeogr. Palaeoclimatol. Palaeoecol. 2020, 551, 109741. [Google Scholar]
  6. Cui, J.-W.; Zhu, R.-K.; Luo, Z.; Li, S. Sedimentary and geochemical characteristics of the Triassic Chang 7 member shale in the southeastern Ordos Basin, Central China. Pet. Sci. 2019, 16, 285–297. [Google Scholar] [CrossRef]
  7. He, X.; Chen, S.; Hu, C.; Zhang, H.; Mou, F.; Dai, L.; Lu, Y.; Fu, X.; Han, M. Pore Structure Change in the Continental Shale Oil Reservoir and Its Main Influencing Factors: A Case Study of the Chang 7 Member in the Ordos Basin. Processes 2023, 11, 2314. [Google Scholar] [CrossRef]
  8. Zou, C.; Pan, S.; Horsfield, B.; Yang, Z.; Hao, S.; Liu, E.; Zhang, L. Oil retention and intrasource migration in the organic-rich lacustrine Chang 7 shale of the Upper Triassic Yanchang Formation, Ordos Basin, central China. AAPG Bull. 2019, 103, 2627–2663. [Google Scholar] [CrossRef]
  9. Li, Q.; You, X.; Li, J.; Zhou, Y.; Lu, H.; Wu, S.; Yue, D.; Zhang, H. Pore structure and factors controlling shale reservoir quality: A case study of Chang 7 Formation in the Southern Ordos Basin, China. Energies 2024, 17, 1140. [Google Scholar] [CrossRef]
  10. Cao, S.; Li, S.; Dang, H.; Xing, H.; Zhang, L.; Zhang, T.; Bai, P. Pore Characteristics and controlling factors of Chang 7 shale in southeastern Ordos Basin. Xinjiang Pet. Geol. 2022, 43, 11–17. [Google Scholar]
  11. Zhang, F.; Li, G.; Zheng, X.; Wu, Q.; Li, Z.; Qi, Z.; Wang, J.; Zhang, L. Enlightenment from the post shale revolution era in North America. China Pet. Explor. 2022, 27, 26–39. [Google Scholar]
  12. He, X.; Zhang, P.; Gao, Y.; Wang, K.; He, G.; Ren, J.; Gao, Q.; Zang, S. Challenges and countermeasures for beneficial development of unconventional oil and gas resources in China. China Pet. Explor. 2025, 30, 26–41. [Google Scholar]
  13. You, L.; Xie, Y.; Chen, Y.; Kang, Y.; Huang, C.; Zhai, H. Development directions of formation damage evaluation and fracturing fluids in tight and shale oil reservoirs. Petroleum 2025, 11, 125–142. [Google Scholar] [CrossRef]
  14. Nath, F.; Garcilazo, R., Jr.; Collazo, J., Jr. Optimizing Hydraulic Fracturing in Water-Sensitive Shales: A Comparative Study of Frac Fluid Performance. In Proceedings of the SPE/AAPG/SEG Unconventional Resources Technology Conference, Houston, TX, USA, 9–11 June 2025. [Google Scholar]
  15. Ding, Y.; Yu, X.; Liu, X.; Gan, R.; Liang, L.; Xiong, J. Investigating dynamic spontaneous imbibition and hydration damage in shale. Fuel 2025, 386, 134243. [Google Scholar] [CrossRef]
  16. Chen, M.; Ning, X.; Kang, Y.; Wu, J.; Li, B.; Shi, Y.; Lai, Z.; Bai, J.; Yan, M. Effect of Fracturing Fluid Properties on the Flowback Efficiency of Marine and Continental Transitional Shale Gas Reservoirs in Ordos Basin. Processes 2025, 13, 1398. [Google Scholar] [CrossRef]
  17. Li, Q.; Li, Q.; Cao, H.; Wu, J.; Wang, F.; Wang, Y. The crack propagation behaviour of CO2 fracturing fluid in unconventional low permeability reservoirs: Factor analysis and mechanism revelation. Processes 2025, 13, 159. [Google Scholar] [CrossRef]
  18. Pang, J.; Wu, T.; Yu, X.; Zhou, C.; Chen, H.; Gao, J. The Effect of Water–Rock Interaction on Shale Reservoir Damage and Pore Expansion. Processes 2025, 13, 1265. [Google Scholar] [CrossRef]
  19. Zhao, P.; Fan, X.; Zhang, Q.; Yao, B.; Zhang, M.; He, L.; Qiang, Y.; Liu, J. Characteristics of Hydration Damage and Its Influence on Permeability of Lamellar Shale Oil Reservoirs in Ordos Basin. Geofluids 2021, 2021, 6646311. [Google Scholar] [CrossRef]
  20. Liu, K.; Sheng, J.J. Experimental study of the effect of stress anisotropy on fracture propagation in Eagle Ford shale under water imbibition. Eng. Geol. 2019, 249, 13–22. [Google Scholar] [CrossRef]
  21. Lyu, Q.; Ranjith, P.; Long, X.; Kang, Y.; Huang, M. A review of shale swelling by water adsorption. J. Nat. Gas Sci. Eng. 2015, 27, 1421–1431. [Google Scholar] [CrossRef]
  22. Lu, Q.; Kuang, B.; Guo, J.; Mu, Q.; Bai, J.; Gong, X. Research on the mechanism of fracture propagation induced by shale hydration. Geosystem Eng. 2025, 28, 375–389. [Google Scholar] [CrossRef]
  23. Liu, K.; Ding, W.; Peng, M.; Song, F.; Zhuang, Y.; Zhao, X.; Wang, C. Experimental Study on the Expansion Mechanism of Secondary Fractures Formed by Shale Hydration in Fracturing Development. ACS Omega 2025, 10, 13928–13942. [Google Scholar] [CrossRef] [PubMed]
  24. SY/T 5613-2016; Testing of Drilling Fluids–Testing Method of Physical and Chemical Properties for Shale. National Energy Administration: Beijing, China, 2016.
  25. Wang, L.; Du, Y.; Wu, G.; Fu, X.; Xu, C.; Pan, Z. Application of nuclear magnetic resonance technology in reservoir characterization and CO2 enhanced recovery for shale oil: A review. Mar. Pet. Geol. 2025, 177, 107353. [Google Scholar] [CrossRef]
  26. Cheng, Y.; Li, Z.; Xu, L. Effects of Fracturing Fluids on Properties of Shale Reservoir: A Case Study of the Longmaxi Formation in the Sichuan Basin. Minerals 2025, 15, 392. [Google Scholar] [CrossRef]
  27. Zheng, H.; Yang, F.; Guo, Q.; Liu, K. Upscaling characterizing pore connectivity, morphology and orientation of shale from nano-scale to micro-scale. Mar. Pet. Geol. 2025, 172, 107213. [Google Scholar]
  28. Yang, F.; Ma, D.; Duan, Z.; Ren, D.; Tian, T.; Fu, D. Micropore Structural Characteristics and Influence Factors of Triassic Shale Gas Adsorption in the Ordos Basin. Front. Phys. 2022, 10, 851131. [Google Scholar] [CrossRef]
  29. Shi, P.; Zhou, W.; Zhang, J.; Yin, J.; Chen, Y. Geological Characteristics and Exploration Practices of Multilayer Shale Oil and Gas in the Yanchang Formation, Fuxian–Ganquan Area, Ordos Basin. Appl. Sci. 2024, 14, 7013. [Google Scholar] [CrossRef]
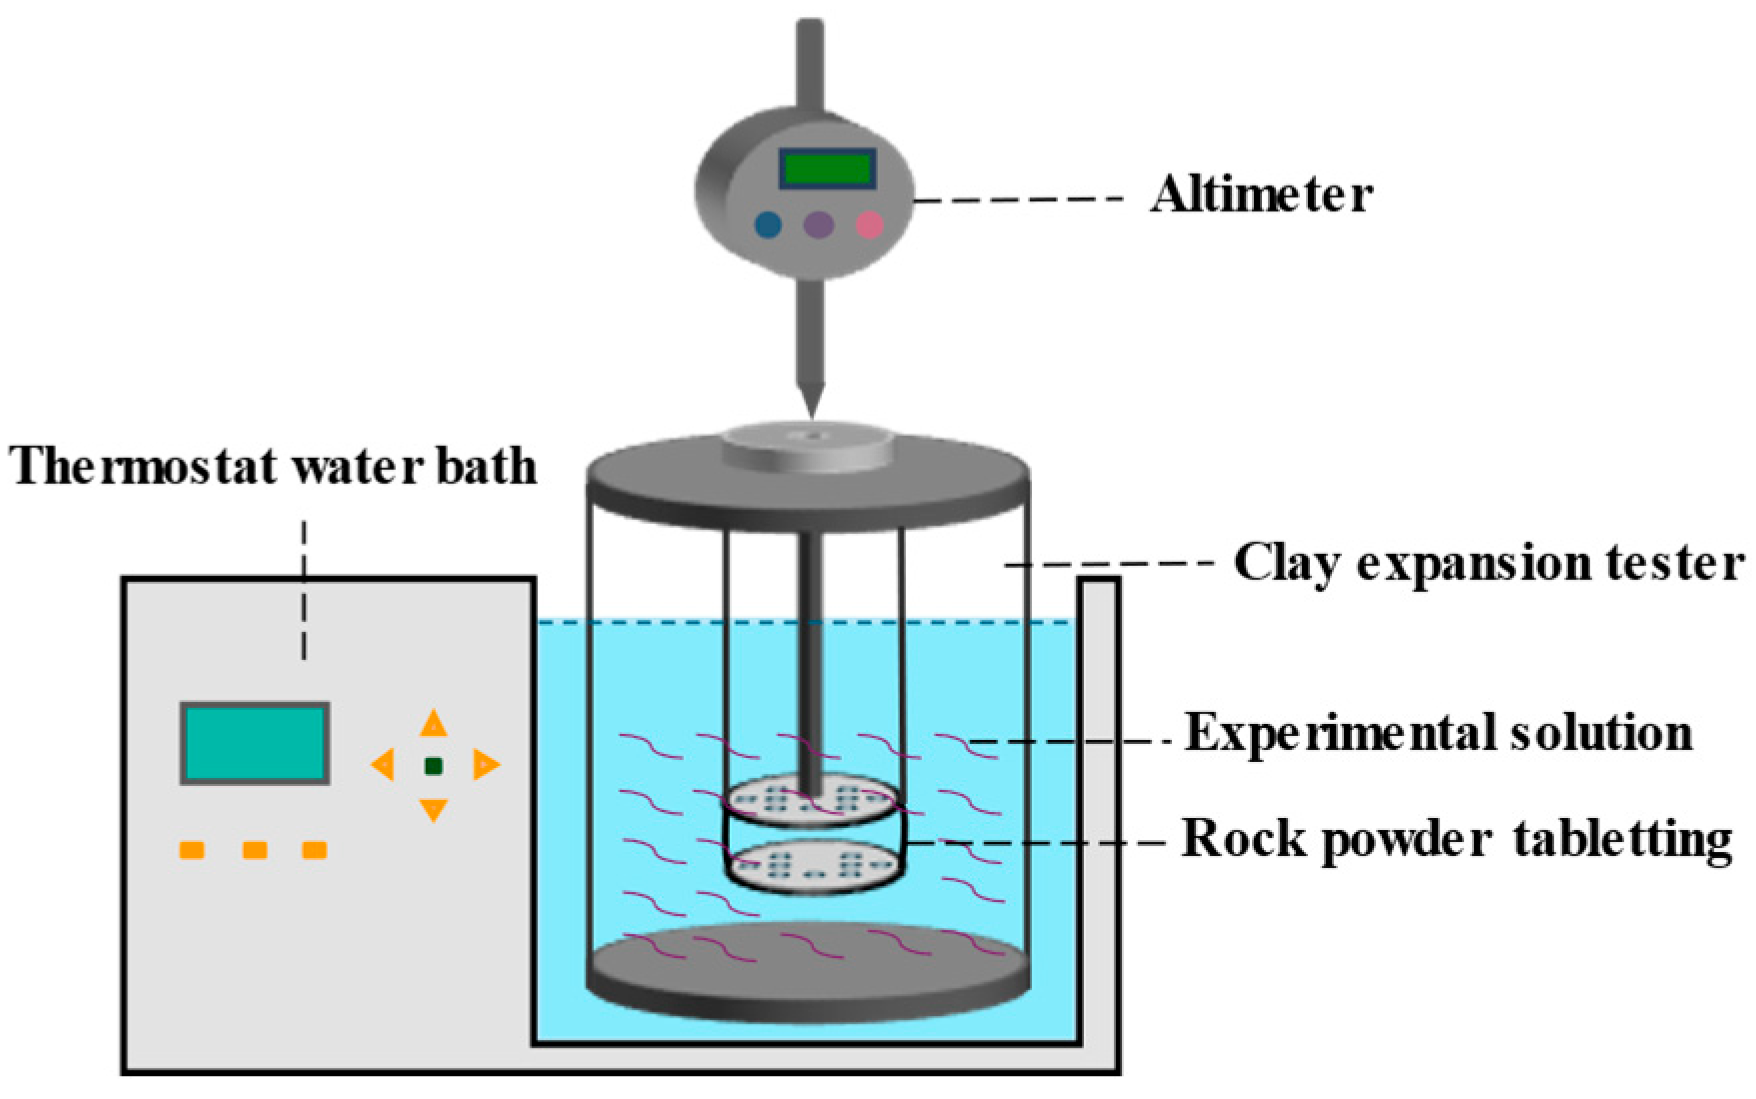
Figure 1. Schematic diagram of high-temperature expansion tester.
Energies 18 05355 g001
Figure 2. Actual image of the nuclear magnetic resonance system employed in this study.
Energies 18 05355 g002
Figure 3. Actual images of the high-resolution three-dimensional X-ray computed tomography system employed in this study: (a) External structure diagram; (b) Internal structure diagram.
Energies 18 05355 g003
Figure 4. The change in the expansion height of different samples over time in liquids: (a) Montmorillonite; (b) Shale oil reservoir cores; (c) Shale gas reservoir cores.
Energies 18 05355 g004
Figure 5. Linear fitting of the effect of concentration on the final expansion height under different conditions: (a) Montmorillonite; (b) Shale oil reservoir cores; (c) Shale gas reservoir cores.
Energies 18 05355 g005
Figure 6. T2 spectra of shale oil cores immersed in different test liquids: (a) Clean water; (b) Clay stabilizer concentration of 0%; (c) Clay stabilizer concentration of 0.3%; (d) Clay stabilizer concentration of 0.7%.
Energies 18 05355 g006
Figure 7. T2 spectra of shale gas cores immersed in different test liquids: (a) Clean water; (b) Clay stabilizer concentration of 0%; (c) Clay stabilizer concentration of 0.3%; (d) Clay stabilizer concentration of 0.7%.
Energies 18 05355 g007
Figure 8. The variation curve of the NMR signal peak area of different cores immersed in various liquids over time: (a) Shale oil reservoir cores; (b) Shale gas reservoir cores.
Energies 18 05355 g008
Figure 9. Comparison of the end face of shale samples before and after hydration process: (a) Shale oil core before hydration; (b) Shale oil core after hydration; (c) Shale gas core before hydration; (d) Shale gas core after hydration.
Energies 18 05355 g009
Figure 10. Comparison of the Micro-CT scanning results on the shale gas core before and after immersion: (a) Original sample; (b) Immersion for 72 h.
Energies 18 05355 g010
Figure 11. Comparison of the Micro-CT scanning results on the shale oil core before and after immersion: (a) Original sample; (b) Immersion for 72 h.
Energies 18 05355 g011
Figure 12. Comparison of pore size distribution frequency characteristics in shale gas core: (a) Comparison between the original core and immersed core after 72 h; (b) Comparison between increased pores and reduced pores after a 72-h immersion.
Energies 18 05355 g012
Figure 13. Comparison of pore size distribution frequency characteristics in shale oil core: (a) Comparison between the original core and immersed core after 72 h; (b) Comparison between increased pores and reduced pores after a 72-h immersion.
Energies 18 05355 g013
Disclaimer/Publisher’s Note: The statements, opinions and data contained in all publications are solely those of the individual author(s) and contributor(s) and not of MDPI and/or the editor(s). MDPI and/or the editor(s) disclaim responsibility for any injury to people or property resulting from any ideas, methods, instructions or products referred to in the content.