Article

Game Theory-Based Bi-Level Capacity Allocation Strategy for Multi-Agent Combined Power Generation Systems

1
College of Hydraulic and Environmental Engineering, China Three Gorges University, Yichang 443002, China
2
Hubei Provincial Key Laboratory for Operation and Control of Cascaded Hydropower Station, China Three Gorges University, Yichang 443002, China
3
Guohua (Hubei) New Energy Co., Ltd., Wuhan 430077, China
*
Author to whom correspondence should be addressed.
Energies 2025, 18(20), 5338; https://doi.org/10.3390/en18205338
Submission received: 21 June 2025 / Revised: 22 September 2025 / Accepted: 29 September 2025 / Published: 10 October 2025

Abstract

The wind–solar–storage–thermal combined power generation system is one of the key measures for China’s energy structure transition, and rational capacity planning of each generation entity within the system is of critical importance. First, this paper addresses the uncertainty of wind and photovoltaic (PV) power outputs through scenario-based analysis. Considering the diversity of generation entities and their complex interest demands, a bi-level capacity optimization framework based on game theory is proposed. In the upper-level framework, a game-theoretic method is designed to analyze the multi-agent decision-making process, and the objective function of capacity allocation for multiple entities is established. In the lower-level framework, multi-objective optimization is performed on utility functions and node voltage deviations. The Nash equilibrium of the non-cooperative game and the Shapley value of the cooperative game are solved to study the differences in the capacity allocation, economic benefits, and power supply stability of the combined power generation system under different game modes. The case study results indicate that under the cooperative game mode, when the four generation entities form a coalition, the overall system achieves the highest supply stability, the lowest carbon emissions at 30,195.29 tons, and the highest renewable energy consumption rate at 53.93%. Moreover, both overall and individual economic and environmental performance are superior to those under the non-cooperative game mode. By investigating the capacity configuration and joint operation strategies of the combined generation system, this study effectively enhances the enthusiasm of each generation entity to participate in the energy market; reduces carbon emissions; and promotes the development of a more efficient, environmentally friendly, and economical power generation model.

1. Introduction

Under the strategic guidance of “carbon peak” and “carbon neutrality”, the global energy structure is undergoing a historic transformation, with the traditional power system dominated by fossil energy accelerating its evolution toward a new-type power system centered on renewable energy [1,2]. In this process, renewable energies such as wind and solar power have achieved large-scale development due to their clean and low-carbon characteristics. However, their inherent intermittency and volatility pose severe challenges to the safe and stable operation of power grids [3]. Against this backdrop, multi-source combined power generation systems, by integrating the complementary characteristics of different energy sources, have become a core path to solving the problem of renewable energy absorption and promoting sustainable development in the energy sector. The wind–solar–storage–thermal combined power generation mode has shown great potential in ensuring the stability of the power supply, improving system efficiency, and supporting sustainable power generation [4]. Nevertheless, this mode also leads to the diversification of power supply entities—different power generation links belong to various investment subjects, whose economic goals, risk preferences, and market strategies vary significantly, thus greatly increasing the operational complexity of the power system [5]. Therefore, it is urgent to construct a joint operation framework that balances the stability of power supply and the interests of multiple parties and promotes the efficient utilization of renewable energy. This paper focuses on the capacity configuration of wind–solar–storage–thermal combined power generation systems involving multiple subjects, aiming to explore configuration strategies that coordinate the interests of all parties and optimize the economy and stability of the system. It is expected to provide theoretical support and practical guidance for the clean transformation of China’s energy structure, the improvement of power system efficiency, and the realization of “double carbon” goals.

2. Literature Review and Contributions

2.1. Literature Review

At present, scholars have conducted capacity configuration studies of multi-source combined power generation systems from different perspectives, providing a foundation for subsequent research. Reference [6] shows that the capacity of PV, wind turbine (WT), and energy storage should be increased simultaneously in a combined generation system rather than increasing only the storage capacity. Reference [7], in order to make full use of PV resources and address the inherent problems of PV generation systems, establishes a capacity optimization configuration method for a PV–storage hybrid system considering life-cycle economic optimization. Reference [8] considers the uncertainty of renewable energy in a combined generation system to achieve optimal configuration of capacity specifications and operation strategies for different devices. Reference [9] exploits the dynamic regulation capabilities of hydropower and the flexibility of energy-intensive controllable loads to mitigate the uncertainties of renewable energy output. Considering four types of generation—wind turbines, photovoltaic, hydropower, and thermal power plants (TPSs)—it proposes a bi-level optimization model for wind–solar–hydro–thermal capacity allocation, including planning and operation layers. Reference [10] considers the planning problem of distributed energy and proposes a time-of-use pricing model based on reinforcement learning, where a deep reinforcement learning algorithm is employed to train agents so that they can make accurate sequential decisions in distributed energy scheduling. Reference [11] proposes a random forest-based interpretable analysis framework to study the collaborative planning of renewable energy and multi-time-scale energy storage systems. However, capacity configuration optimization of such systems typically involves combining the operational characteristics of different energy devices to achieve coordinated supply and complementarity among multiple energy sources [12]. The above studies lack a thorough explanation of the interaction mechanisms among multiple energy entities and fail to reveal the intrinsic physical significance of the capacity allocation results.
Game theory originated in economics and has gradually been applied to the electricity market. In the field of energy system planning and capacity optimization, game theory has also played an important role. Reference [13] proposes a microgrid optimal capacity and power management configuration method based on cooperative games, where the optimal result is obtained through the Nash bargaining solution. Reference [14], to improve the energy utilization efficiency and economic benefits of multi-park integrated energy systems, first constructs a joint planning model with shared energy storage and then proposes an ex post cost allocation algorithm based on the improved nucleolus method. Reference [15] quantifies the incremental benefits generated from the joint operation of a wind–PV–hydropower complementary generation system and allocates the additional benefits using the Shapley value method and the Aumann–Shapley value method. Reference [16] considers the operators of new-energy, combined heat and power (supply), and compressed air energy storage subsystems as participants, taking equipment capacity as the optimization strategy and net present value as the utility function, and establishes a game-theoretic model for multi-agent capacity configuration of the energy station integrating generation–supply–storage. Reference [17], to realize the coordinated planning of distribution systems with multiple integrated energy microgrids, combines a Stackelberg game with a nested cooperative game and proposes a mixed-game and carbon-oriented two-stage planning model for photovoltaic (PV) and energy storage (ES) systems. In these studies, cooperative games are applied to analyze benefit allocation in energy systems, enabling a win–win balance between group and individual interests. However, the above research ignores the inherent uncertainties of renewable energy generation, such as wind and PV, which may pose potential risks to system security.
In the field of energy optimization, effectively addressing the uncertainty of wind and PV power output is crucial for improving renewable energy consumption capacity and system security. At present, the scenario method has been widely applied to address uncertainty issues in power system operation, and it typically relies on stochastic programming methods to solve such problems [18]. Reference [19] considers the uncertainty of renewable energy in combined power generation systems to optimize the capacity configuration and operation strategies of different devices. Reference [20] applies the K-means clustering algorithm to reduce randomly generated scenarios and obtain typical forecasting scenarios of wind and PV generation. Reference [21] identifies 20 representative wind and PV scenarios through the fuzzy C-means clustering method. Reference [22] takes into account the uncertainty of wind and PV output, as well as the natural inflow of hydropower; develops a first-order seasonal stochastic model based on the Copula function using multi-year data; and proposes a Fair Gain cooperative game allocation strategy based on mixed-integer programming. However, although scenario set construction has addressed the calculation of wind–solar uncertainty to some extent, traditional wind–solar scenario generation that relies on completely random sampling of wind and solar data still suffers from poor representativeness in scenarios.

2.2. Contributions

In conclusion, Table 1 contrasts the proposed research with recent references. Based on the above research, this paper focuses on capacity optimization of a multi-agent combined power generation system, including wind turbines (WTs), photovoltaic (PV), pumped hydro storage (PHS), and thermal power plants (TPSs). Considering the uncertainty of wind and photovoltaic outputs, a game theory-based multi-agent capacity allocation model is embedded into a bi-level optimization framework. Ultimately, the Nash equilibrium of the non-cooperative game and the Shapley value of the cooperative game are solved, and case studies covering all fifteen coalition scenarios formed by the four participating entities are conducted. The specific contributions of this paper are as follows:
  • A scenario generation method combining Latin Hypercube Sampling (LHS) and the Kantorovich distance-based SBR algorithm is proposed to handle the uncertainty of wind–solar output. The SBR algorithm continuously filters scenarios to minimize the probability distance between the original and the retained scenario sets, thereby better reflecting the original probability distribution. This approach not only improves scheduling accuracy but also reduces cost increases caused by forecasting errors.
  • A bi-level optimization model considering the interaction between capacity allocation and operation scheduling is developed, enabling dynamic parameter interaction between the two levels. The upper-level focuses on the capacity configuration of different generation entities to determine the optimal capacity mix, while the lower-level addresses multi-objective operation scheduling, balancing conflicting objectives such as “profitability–stability” under operational constraints. Through the deep integration of long-term and short-term decision-making, the model enhances system economy and energy utilization efficiency.
  • A game theory-based multi-agent capacity optimization method is proposed, considering the diversity of energy forms and the complexity of interest relationships in a combined power generation system. Specifically, the operators of wind power, photovoltaic, pumped hydro storage, and thermal power subsystems are modeled as participants, with equipment capacity as the optimization strategy and net profit as the utility function. On this basis, a non-cooperative game model for multi-agent capacity allocation is established, the existence of a Nash equilibrium is proved, and the model is solved using an improved particle swarm optimization algorithm. Furthermore, considering the complementary characteristics of different energy forms, the feasibility of cooperative alliances is explored, and the Shapley value method is employed to address benefit allocation in the cooperation process, thereby ensuring both stability and fairness.

3. Models and Methods

3.1. Generation of Typical Wind and Photovoltaic Power Output Scenarios

3.1.1. Scenario Generation and Reduction

The power output of wind and photovoltaic (PV) systems is characterized by uncertainty and volatility [23,24]. Due to the limited accuracy of existing forecasting models, achieving high-precision prediction remains challenging [25]. Directly incorporating such uncertain outputs into optimization models often leads to computational difficulties or unreasonable results. Therefore, it is necessary to transform the uncertainties into deterministic representations. When the probability distributions of wind and PV outputs are available, the scenario analysis method can be employed [26,27], which is a type of stochastic optimization [28]. This method generates a set of representative scenarios with associated probabilities, thereby converting the problem into a deterministic one. Scenario analysis consists of two stages: scenario generation and scenario reduction [29]. In this study, the Latin Hypercube Sampling (LHS) method [30] is applied to generate a large number of wind and PV output scenarios, and the Scenario-Based Reduction (SBR) algorithm based on Kantorovich distance [31] is used for scenario reduction. The resulting typical scenario sets and their probabilities are then obtained. The detailed process is illustrated in Figure 1.

3.1.2. Indices for Determining the Number of Typical Scenarios

The choice of cluster count is crucial for optimal results. A high number yields precise but complex clusters, whereas a low number risks errors, underscoring the importance of prudent center selection. The optimal number of clusters is determined based on effective indicators of the clustering algorithm. A combination of the sum of squared errors (SSEs) in clusters, used in the elbow method, and Calinski–Harabasz (CH) index [32] is employed to calculate the sum of the squared errors of each sample relative to its cluster center [33,34] The expression for the SSE indicator ( S SSE ) is as follows:
S SSE = l = 1 c j c l X j l C l 2
where C l represents the cluster center. X j l represents the feature vector of the j-th sample belonging to the l-th cluster. S SSE decreases gradually as the number of clusters increases. When each sample forms its own cluster, the clustering result is the most precise but also highly complex. Conversely, if the number of clusters is too small, the clustering result is inaccurate. Therefore, the optimal number of clusters is typically determined by the point at which S SSE decreases the most rapidly.
The CH index ( S CH ) is used to calculate the ratio of between-cluster dispersion to within-cluster dispersion, and it is computed as follows:
S CH = l , k = 1 , l k c C l C k 2 j , g = 1 , j g N X j X g 2 × N k k 1
where C k represents the feature vector of the k-th cluster center. X j represents the feature vector of the j-th sample in the denominator. X g represents the feature vector of the g-th sample. The denominator represents the within-cluster sum of squared distances, which should be as small as possible, while the numerator represents the between-cluster sum of squared distances, which should be as large as possible. Therefore, the optimal number of clusters should correspond to a relatively large S CH .

3.2. Game Theory-Based Capacity Configuration Method for Multi-Agent Combined Power Generation Systems

Game theory provides a theoretical framework for the collaborative decision-making of multi-source combined power generation systems, covering two types of scenarios: non-cooperative games and cooperative games. Moreover, it can achieve a balance between system economy and stability through tools such as equilibrium analysis and benefit distribution mechanism design.
(1)
Participants
We define the set of subjects for the participation capacity configuration game: N = W T , P V , P H S , T P S .
(2)
Strategy Set
The capacity configuration decisions of each subject constitute the strategy space, denoted as S = S w t , S p v , S p h s , S t p s .
(3)
Utility Function
The utility function of each subject under capacity configuration decisions is denoted as u w t ( S w t , S p v , S p h s , S t p s ) u p v ( S w t , S p v , S p h s , S t p s ) u p h s ( S w t , S p v , S p h s , S t p s ) u t p s ( S w t , S p v , S p h s , S t p s ) .
The benefit of participants is measured by their net profit during the dispatching cycle, i.e., total revenue minus total cost. Here, the total revenue mainly comes from the proceeds of electricity sales.
u i = I e , i C i n v , i C o m , i C e n , i C t p s , i C q , i
The total cost includes the annualized net value allocation of the equipment investment and construction cost, C i n v , i ; the operation and maintenance expenditure, C o m , i ; the environmental pollution treatment fee, C e n , i ; the fuel cost, C t p s ; and the loss cost due to wind curtailment or light curtailment, C q , i . Therefore, the utility function of the participant can be defined as the difference between the total income and the total cost within a specific dispatching cycle. Due to the distinct output characteristics and functions of different power supply systems, their manifestations in the utility function also vary. For detailed information, please refer to Table 2.

3.2.1. Non-Cooperative Game and Nash Equilibrium

(1)
Nash Equilibrium
As a core concept in non-cooperative games, Nash equilibrium was proposed by mathematician and economist John Nash [35] in 1951. Its connotation is defined as follows: when any participant’s chosen strategy is optimal given the fixed strategies of all other participants, this strategy combination is termed a Nash equilibrium [36].
Mathematically, the pure-strategy Nash equilibrium satisfies the following: let the strategy of participant i be σ i and the strategy combination of the remaining participants be σ i , if the strategy combination σ * = ( σ i , σ i * )   S i satisfies u i ( σ i * , σ i * ) u i ( σ i , σ i * ) for all σ i S i (1). In the formula, S is the strategy space of all participants, S i is the strategy set of participant i , σ i * is the optimal strategy of participant i , and u i is the utility function of participant i .
When Formula (1) holds, σ * is a pure-strategy Nash equilibrium.
(2)
Equilibrium Conditions and Existence
For a given game model, if its strategy combination, S = s 1 , s 2 , s 3 , ... , s n , is a Nash equilibrium, it must satisfy the following conditions:
(1)
For each participant, i , when the strategies, S j ( j i ) , of other participants are determined, S i is its optimal strategy.
(2)
For each participant, i , there is no incentive to unilaterally change their own strategy, S i .
Before finding the Nash equilibrium, it is necessary to first prove its existence; that is, the strategy set, S i , of all participants is a nonempty convex set in Euclidean space, and the utility function, u i , is a continuous quasi-concave function. The proof of the existence of Nash equilibrium can be found in Appendix A.

3.2.2. Cooperative Game and Shapley Value Allocation Method

(1)
Basic Characteristics of Cooperative Game
When there are synergistic benefits among subjects, an alliance can be formed through a cooperative game to pursue the maximization of overall benefits, and the benefits can be fairly distributed via the Shapley value [37].
(2)
Shapley Value Allocation Method
The Shapley value method essentially distributes benefits fairly based on members’ marginal contributions to the alliance, i.e., the additional benefits brought about after joining the alliance. Its core logic is to determine each participant’s benefit share by calculating their marginal contribution. Assume there are N members in the alliance; excluding the empty set, there are 2 N 1 different combinations. For a subset, C N , of the participant set, N , the benefit of member, n , can be expressed as
φ i = i C v ( C ) v ( C \ i ) · n C ! C 1 ! n !
In the formula, i C represents all alliances that include the subject;   C is the number of subjects in the alliance, C ; and v ( C )   v ( C \ i ) is the marginal contribution of subject i to the alliance.

3.3. Objective Function of the Upper-Level Capacity Planning Model

The planning layer aims to maximize the revenue of the combined power generation system during the scheduling period, optimizing the power output of each power generation entity. The objective function is formulated as follows:
(1)
Objective Function of Non-Cooperative Game Model
f 1 = σ w t * = arg max ( u w t σ w t , σ p v * , σ p h s * , σ t p s * ) σ p v * = arg max u p v ( σ w t * , σ p v , σ p h s * , σ t p s * ) σ p h s * = arg max u p h s ( σ w t * , σ p h s * , σ p h s , σ t p s * ) σ t p s * = arg max u t p s ( σ w t * , σ p v * , σ p h s * , σ t p s )
In the formula, u w t , u p v , u p h s , and u t p s are the revenues of wind power, photovoltaic power, pumped-storage, and thermal power in the non-cooperative game, respectively. σ w t * , σ p v * , σ p h s * and σ t p s * are the optimal capacity strategies of wind power, photovoltaic power, pumped-storage, and thermal power, respectively. arg max ( ) is the capacity set that maximizes the objective function.
(2)
Objective Function of Cooperative Game Model
S ( σ w t * , σ p v * , σ p h s * , σ t p s * ) = arg max u ( σ w t , σ p v , σ p h s , σ t p s )
In the formula, u represents the total net revenue of the alliance.
(3)
Constraints of the Upper-Level Capacity Planning Model
The constraints of the planning layer primarily pertain to the capacity planning of each power generation entity, including maximum/minimum capacity limits and siting constraints.
min C A P w t P w _ 0 × c a p w t max C A P w t min C A P p v P p v 0 × c a p p v max C A P p v min C A P p h s P p h s _ 0 × c a p p h s max C A P p h s
In the formula, min C A P w t , min C A P p v , and min C A P p h s are, respectively, the minimum capacity limits of the system’s wind power, photovoltaic power, and pumped-storage power stations; P w _ 0 , P p v 0 , and P p h s _ 0 are, respectively, the rated capacities of a single wind power, photovoltaic power, or pumped-storage power station; c a p w t , c a p p v , and c a p p h s are, respectively, the quantities of installed wind power, photovoltaic power, and pumped-storage units; max C A P w t , max C A P p v , and max C A P p h s are, respectively, the maximum capacity limits of the system’s wind power, photovoltaic power, and pumped-storage power stations.

3.4. Objective Function of the Lower-Level Optimal Scheduling Model

At the operation level, with the goal of maximizing the revenue (excluding the system investment cost) within the scheduling period of the combined power generation system and minimizing the system voltage deviation, the power output of each power generation entity in the system is optimized. The objective function is as follows:
(1)
Objective Function of Non-Cooperative Game
max f 2 , w t = I e , w t C o m , w t C q , w t C w s , w t C cip , w t f 2 , p v = I e , p v C o m , p v C q , p v C w s , p v C cip , p v f 2 , p h s = I e , p h s C o m , p h s C w s , p h s C cip , p h s f 2 , t p s = I e , t p s C o m , t p s C e n , t p s C t p s , t p s C w s , t p s C cip , t p s min f 3 = Δ V
In the formula, f 2 , wt , f 2 , pv , f 2 , phs , and f 2 , t ps are, respectively, the revenue functions of wind power, photovoltaic power, pumped-storage power station, and thermal power, excluding investment costs; Δ V is the index of the total voltage deviation within the dispatching cycle of the power grid where the operating system is located (unit: p.u.). Its physical purpose is to measure the deviation degree between the voltage of each node and the average voltage of the system, directly reflecting the safety of the power grid operation. The real-time monitoring of the voltage amplitude in the power system is the key to protecting equipment from voltage damage.
Δ V = s = 1 S n = 1 N t T ( ( U t , s n U ¯ s ) / U ¯ × 100 % ) × P s
In the formula, U t , s n represents the voltage amplitude of node i at time t in scenario s (unit: kV), and U ¯ s represents the average voltage amplitude of all nodes at time t in scenario s (unit: kV). N is the total number of system nodes. The normal operating range of the voltage deviation is usually controlled within ±5% (i.e., 0.95–1.05 p.u.). Exceeding this range may cause abnormal operation or damage the equipment.
(2)
Objective Function of Cooperative Game
max f 2 = I e C o m C e n C t p s C q C w s C cip min f 3 = Δ V
In the formula, f 2 represents the total revenue of the system excluding the investment cost, and f 3 represents the indicator of the total voltage deviation within the dispatching period of the power grid where the operating system is located.
(3)
Constraints of the Lower-Level Optimal Scheduling Model
a.
Power Flow Constraints
P m = U m n = 1 N U n G m n cos θ m n + B m n sin θ m n Q m = U m n = 1 N U n G m n sin θ m n B m n cos θ m n
In the formula, P m and Q m are the active power and reactive power of node m (units: kW, kVar), respectively, reflecting the power injection situation of the node; U m and U n are the voltage amplitudes of nodes m and n (unit: kV), and their value range is usually 0.9–1.1 p.u. (per unit value) to ensure the safe and stable operation of the power grid; G m n and B m n are the conductance and susceptance between nodes m and n (unit: S), respectively, characterizing the conductivity and energy storage characteristics of the line; θ m n is the voltage phase angle between nodes m and n (unit: rad), reflecting the phase difference between nodes. Its value is usually small (generally in the range of −0.5–0.5 rad), and an excessively large value may lead to line overload.
b.
Output Power Balance Constraints
P t , s w t + P t , s p v + P t g o + P t t p s = P t , s l o a d + P t p i + P t , s q
In the formula, P t , s w t and P t , s p v , respectively, represent the actual output of wind power and photovoltaic power at time t under scenario s (unit: kW); P t g o and P t p i , respectively, represent the generating power and pumping power of the pumped-storage power station at time t (unit: kW, where a negative value of the pumping power indicates electric energy consumption); P t t p s is the active power transmitted from thermal power to the power grid at time t (unit: kW); P t , s l o a d represents the total load of the power grid at time t under scenario s (unit: kW); and P t , s q represents the total amount of curtailed wind and photovoltaic power at time t under scenario s (unit: kW).
c.
Power Acceptance Constraints of the Power Grid
P m i n P t , s w t + P t , s p v + P t g o + P t t p s P m a x
In the formula, P min and P max , respectively, represent the minimum and maximum active power that the power grid is allowed to accept (unit: kW).
d.
Energy Balance of the Upper Reservoir
E t = E t 1 + η p P t 1 p i P t 1 g o / η g
In the formula,   E t 1 and   E t are the energies stored in the upper reservoir of the pumped-storage power station at times   t 1 and   t , respectively (unit: kWh);   P t 1 g o and   P t 1 pi are the generating power and pumping power of the pumped-storage power station at time   t , respectively (unit: kW); η p and η g are the power generation efficiency and pumping efficiency of the pumped-storage power station, respectively, usually taking values between 0.75 and 0.85, reflecting losses during the energy conversion process.
e.
Pump Constraints of Pumped-Storage Power Station
P t g o t = 2 24 η p P t p i P t 1 g o / η g P t p i P m a x p i
In the formula, P t g o and P t p i are the generating power and pumping power of the pumped-storage power station at time t , respectively (unit: kW); η p P t p i represents the effective energy stored in the upper reservoir after the pumping power at time t is converted by the pumping efficiency; P t 1 g o / η g represents the energy consumed from the reservoir at time   t 1 . P m a x p i represents the upper limit of the pumping power of the pumped-storage power station at time t . Formula (15) is used to ensure that the energy storage and release process of the pumped-storage power station conforms to actual physical laws.
f.
Wind and PV Curtailment Constraints
P t w t q P t w t P t w   ; P t p v q P t p v P t v P t w q = P t w P t w o   ;         P t p v q = P t v P t p v
In the formula, P t w q is the wind curtailment power at time t (unit: kW); P t w t is the actual wind power injected into the grid at time t (unit: kW); and P t w is the theoretical maximum exploitable wind power at time t (unit: kW). The relationship between the three reflects the wind power consumption situation. Similarly, P t p v q , P t p v , and P t v are, respectively, the photovoltaic curtailment power, the photovoltaic power injected into the grid, and the theoretical maximum exploitable photovoltaic power at time t (unit: kW).
g.
Constraints of Thermal Power Units
The output constraints of thermal power units are as follows:
P m i n t p s < P t t p s < P m a x t p s
In the formula, P m i n t p s and P m a x t p s are, respectively, the lower and upper limits of the maximum output of the thermal power unit (unit: kW).
h.
The ramp constraints of thermal power units are as follows:
V d o w n t p s < P t + 1 t p s P t t p s < V u p t p s
In the formula, V u p t p s is the maximum output power ramp-up rate of the thermal power unit, representing the maximum value by which the output power of the thermal power unit can increase within a unit time; V d o w n t p s is the maximum output power ramp-down rate, representing the maximum value by which the output power of the thermal power unit can decrease within a unit time (unit: kW/h).

3.5. Model Solution

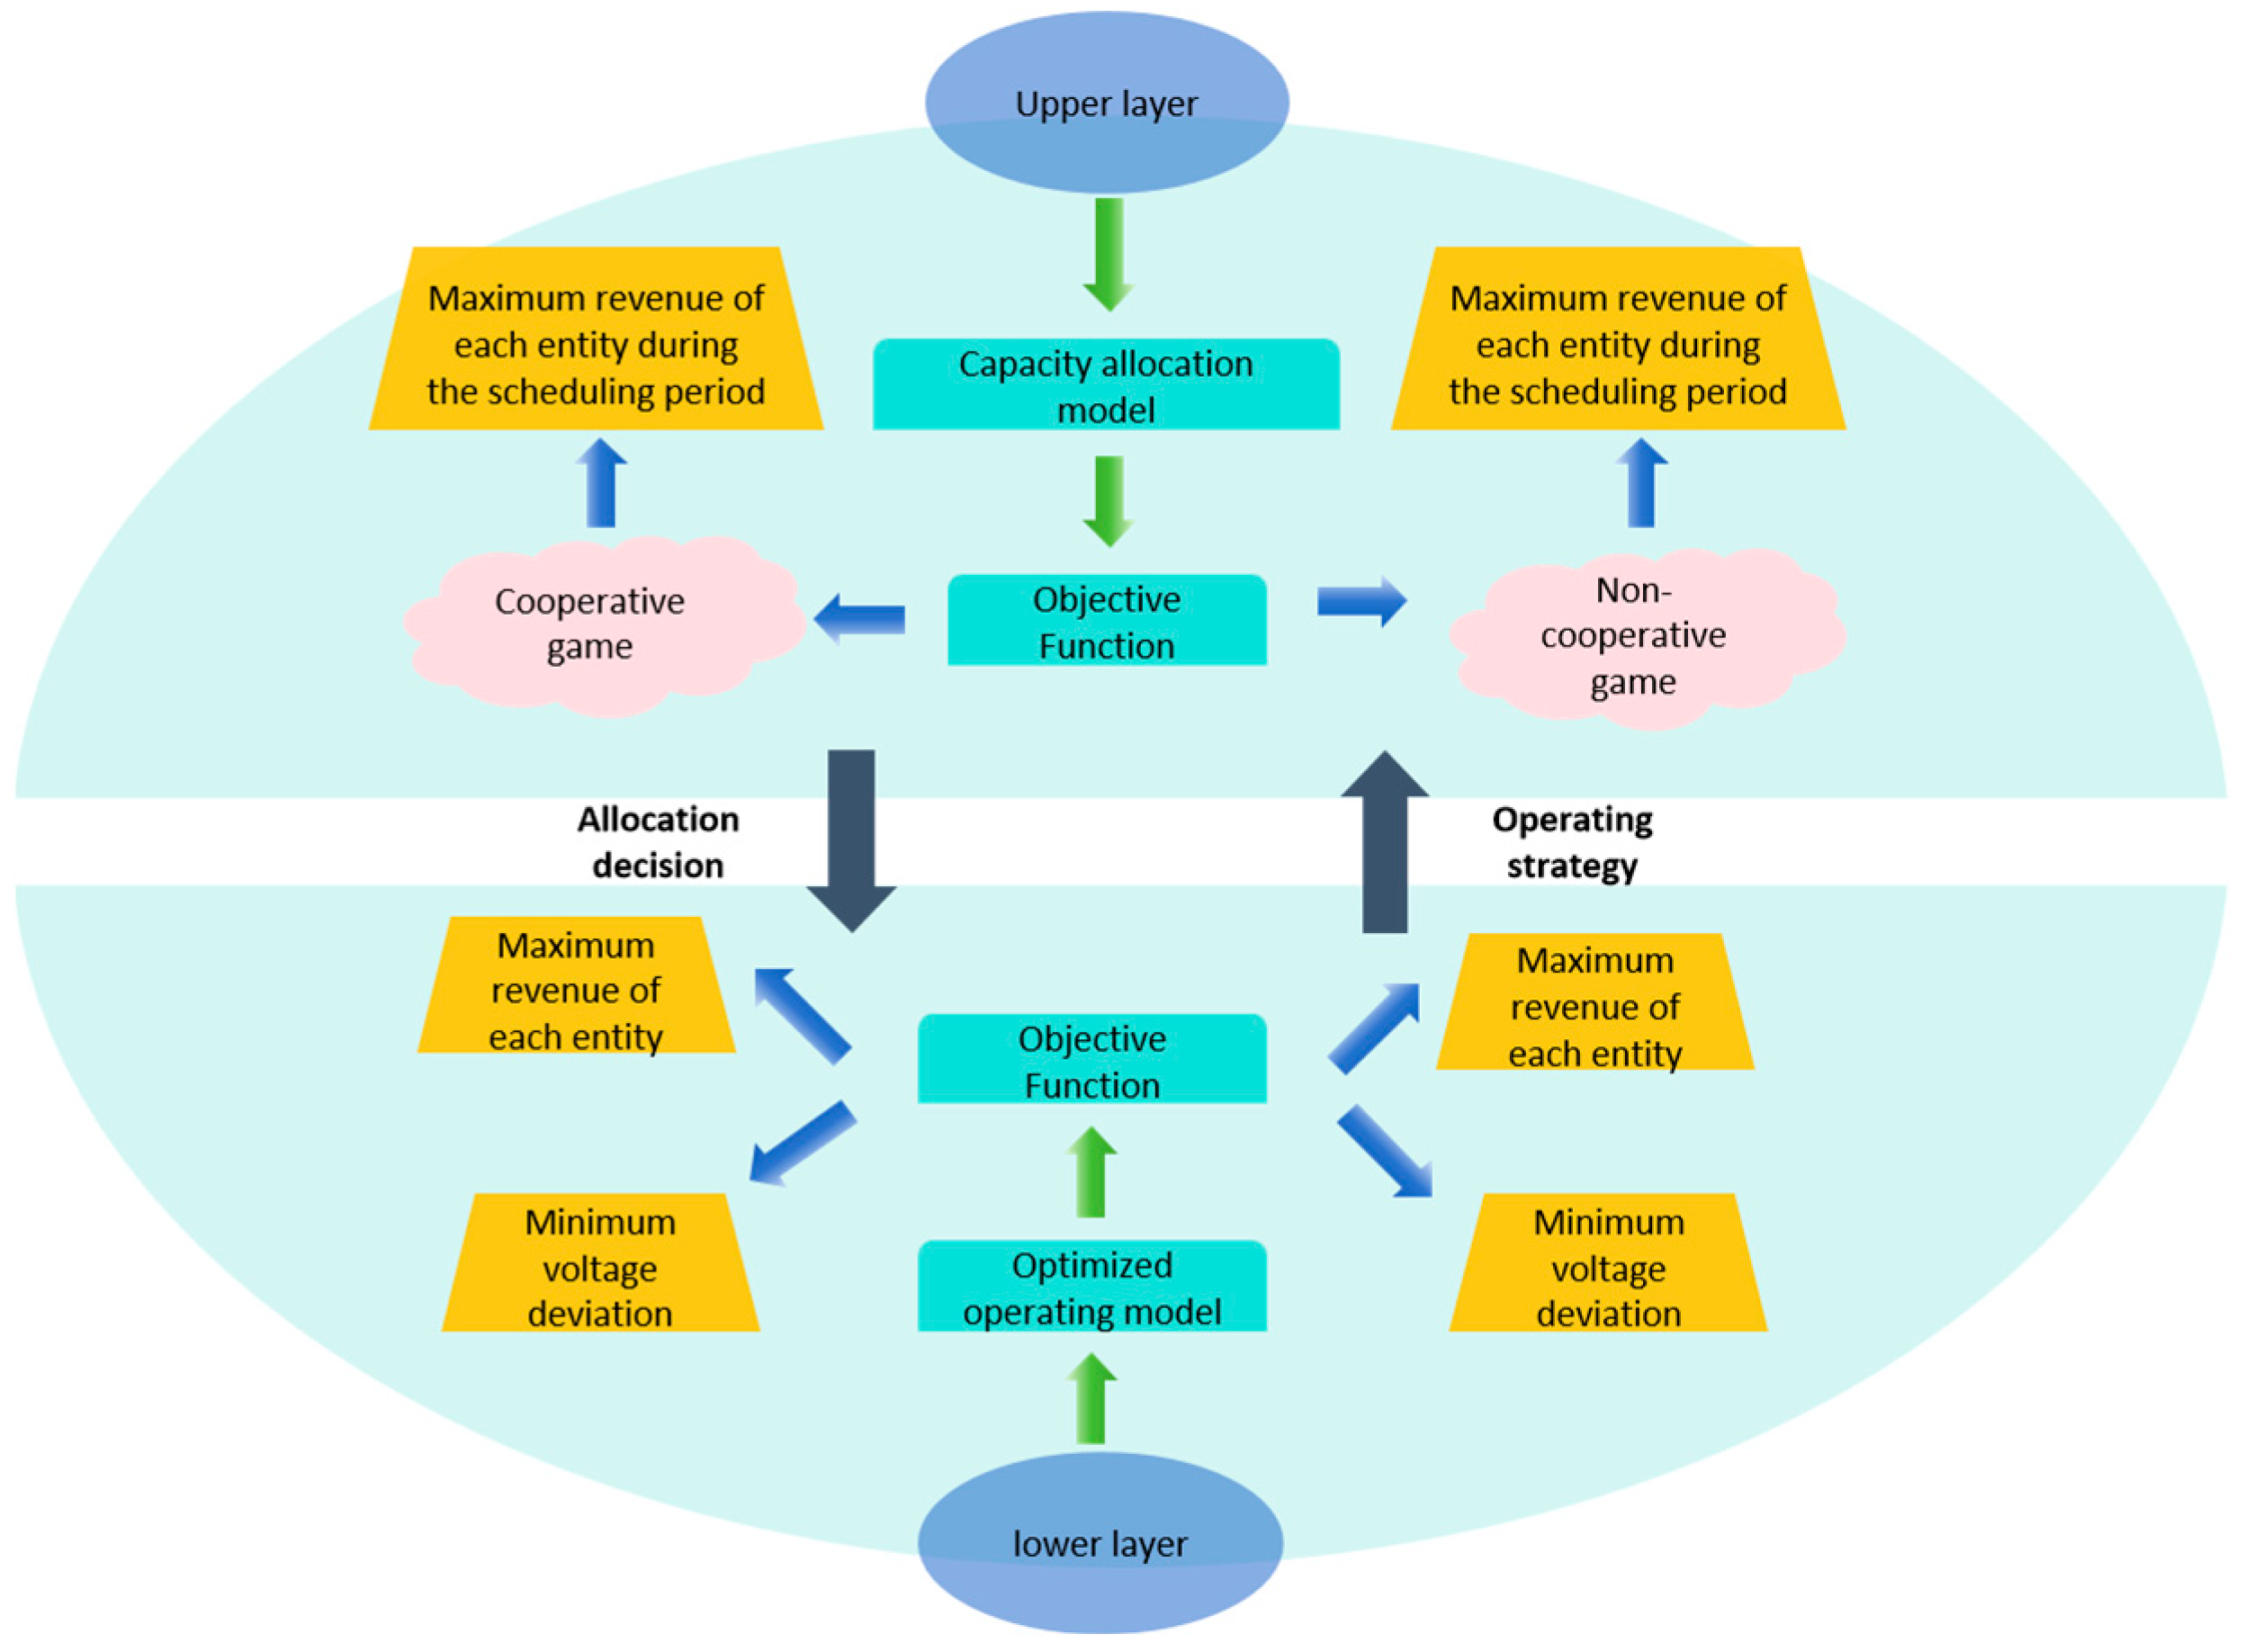
This paper constructs a bi-level nested optimization model for energy systems, in which the solution process requires dynamic interaction between upper- and lower-layer parameters. The upper layer emphasizes single-objective capacity configuration, aiming to determine the optimal capacity ratio of each power generation entity in the system. The lower layer focuses on multi-objective operation scheduling, which seeks to balance conflicting objectives such as “profit–stability” under operational constraints, thereby generating a Pareto optimal solution set. The architecture of the bi-level optimization model is illustrated in Figure 2.
Given the inherent conflicts among objectives in multi-objective optimization, an additional step of “optimal solution selection” is required after solving, which essentially constitutes a multi-attribute decision-making problem. To address this, the paper employs the information entropy–TOPSIS method. First, the weights of each objective are calculated using information entropy, and then TOPSIS is applied to screen the comprehensive optimal solution from the Pareto solution set. In terms of algorithm adaptability, the PSO algorithm is suitable for single-objective constrained optimization and can efficiently search for the global optimum in the upper-layer capacity configuration. The IMOPSO algorithm, on the other hand, supports parallel multi-objective optimization and can obtain multiple non-dominated solutions in a single iteration, which aligns with the requirements of coordinating conflicting objectives in the lower-layer scheduling. Therefore, the upper-layer capacity configuration model is solved using PSO, while the lower-layer optimal scheduling model relies on IMOPSO, forming a solution logic of “iteration between layers with algorithms matched to objectives.” The overall algorithmic process is presented in Algorithm 1.
Algorithm 1: The pseudo-code of bi-level particle swarm optimization algorithm.
1:
Initialization: Set the upper-level iteration counter K = 1, and initialize the positions and velocities of the particles in the upper-level population (representing equipment capacities and site selections).
2:
for K = 1:Kmax do
3:
Set the lower-level iteration counter A = 1, and initialize the positions and velocities of the particles in the lower-level population (representing equipment output schemes).
4:
for A = 1:Amax do
5:
Calculating the fitness values of the lower-level particles, update the personal best and global best of the lower-level particles, and update the equipment output schemes of the lower-level model.
6:
if AAmax then
        break
    end if
    A = A + 1
    end for
7:
Calculate the fitness values of the upper-level particles, update the personal best and global best of the upper-level particles, and update the equipment capacity and siting schemes of the upper-level model.
8:
if K ≥ Kmax then
                 break
     end if
     K = K + 1
          end for
9:
Output the optimal capacity configuration and operation schemes of each generation entity.

4. Case Analysis

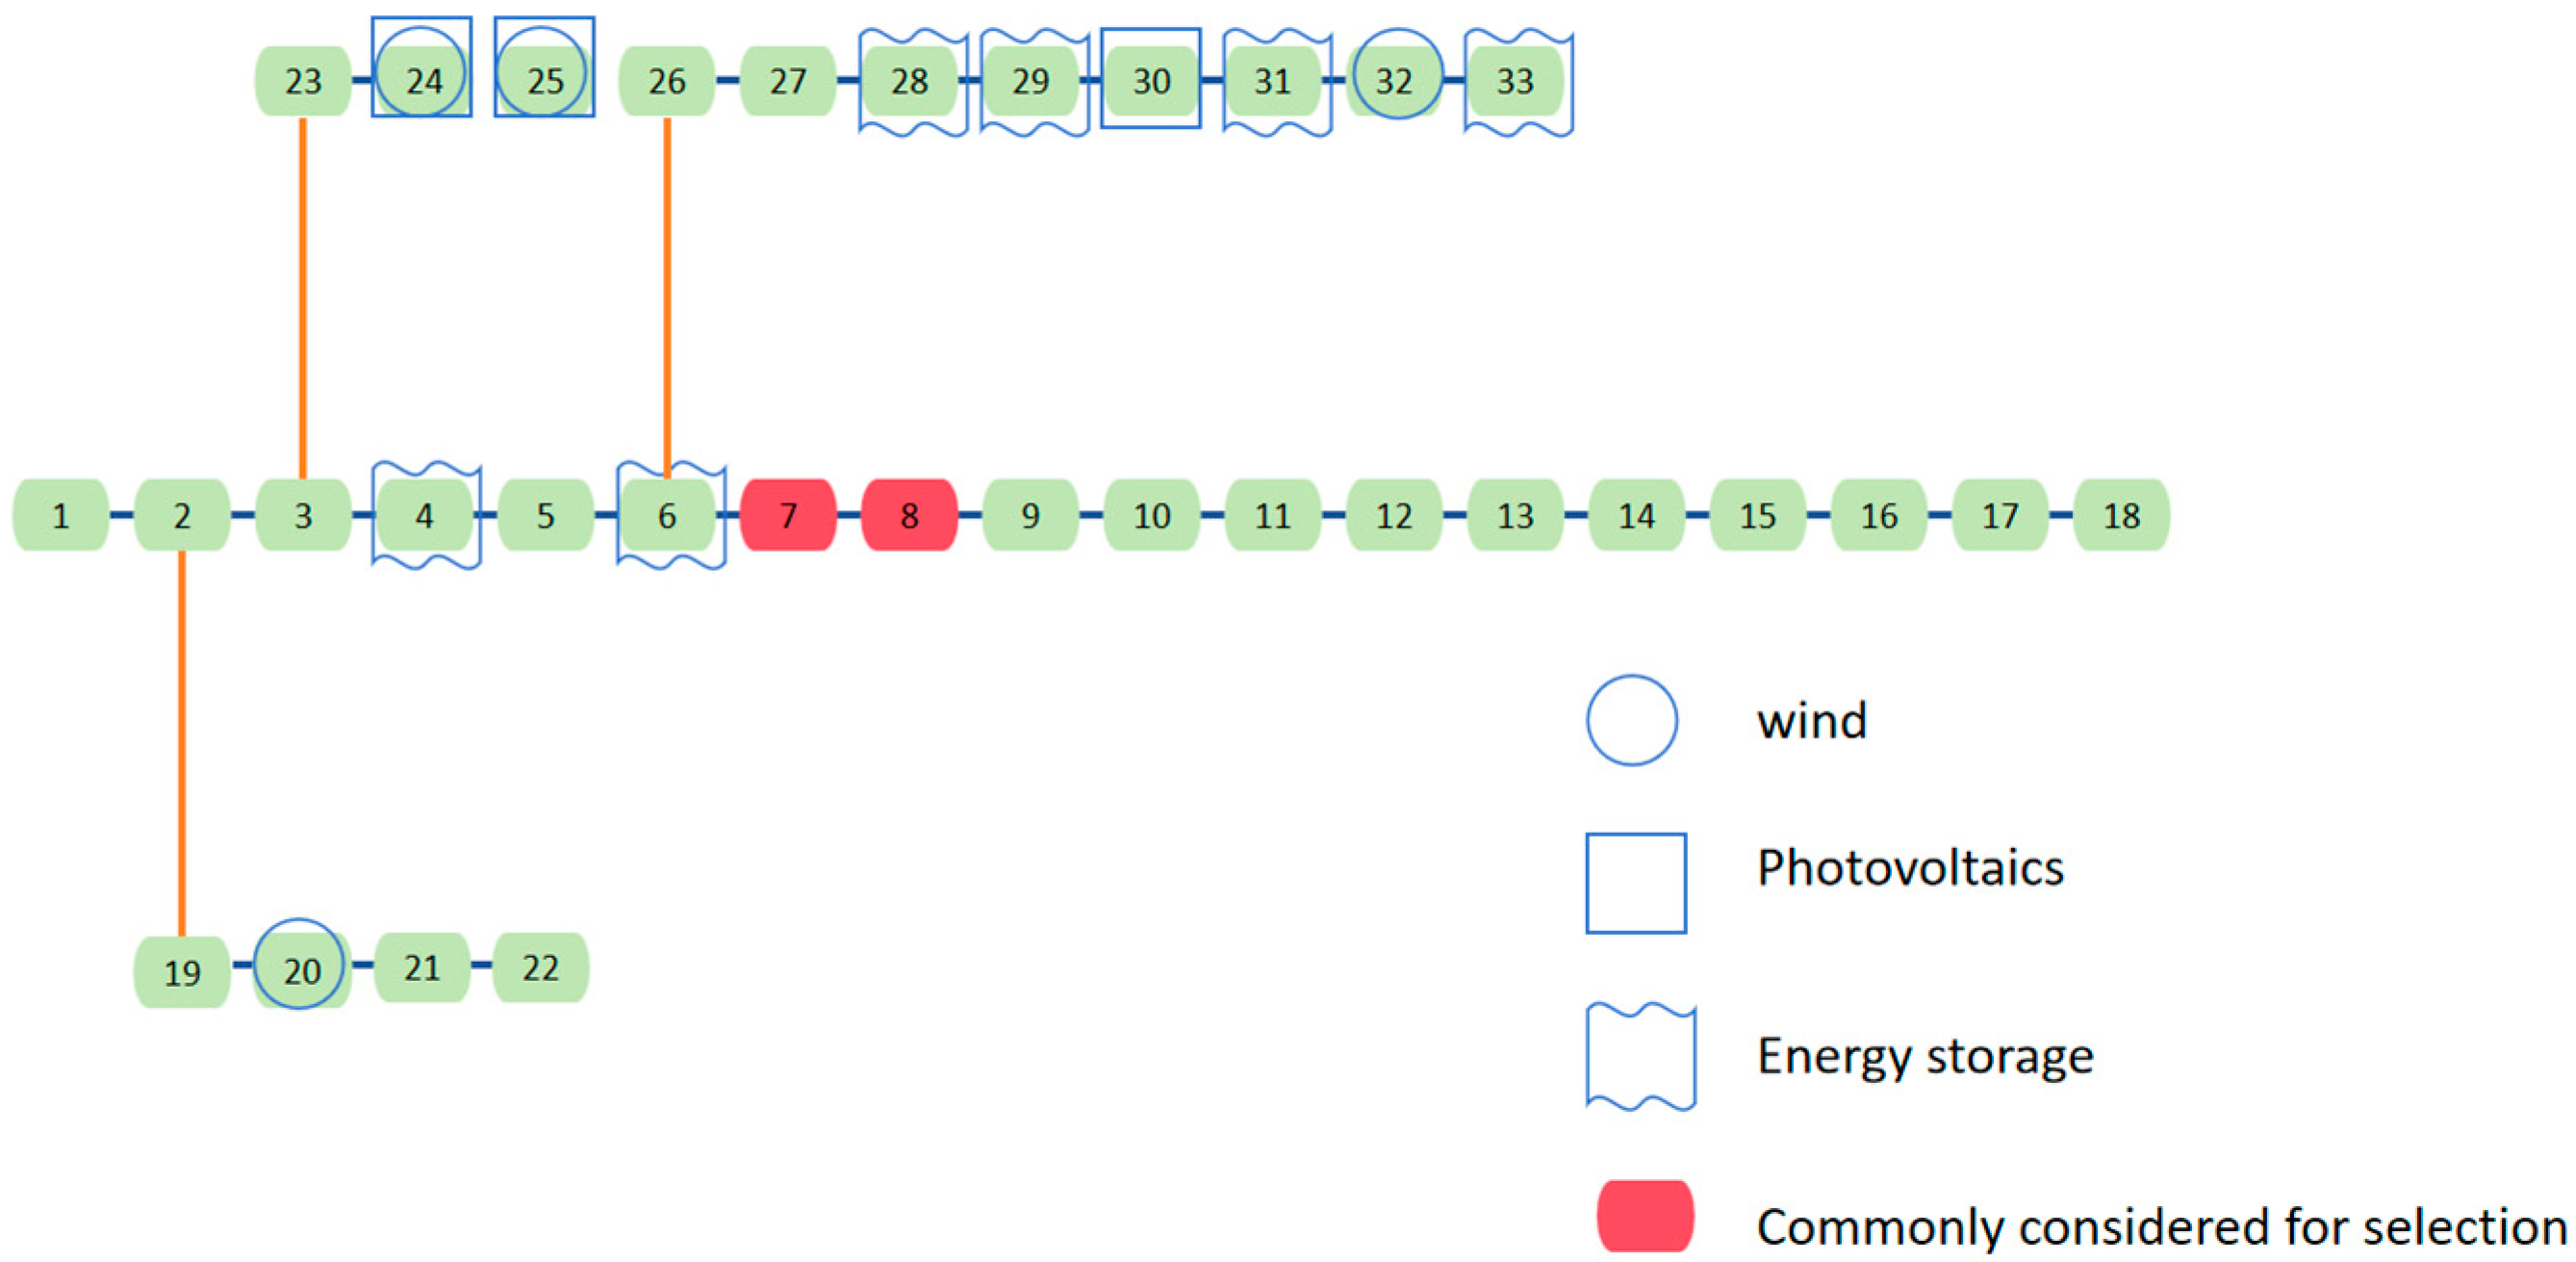
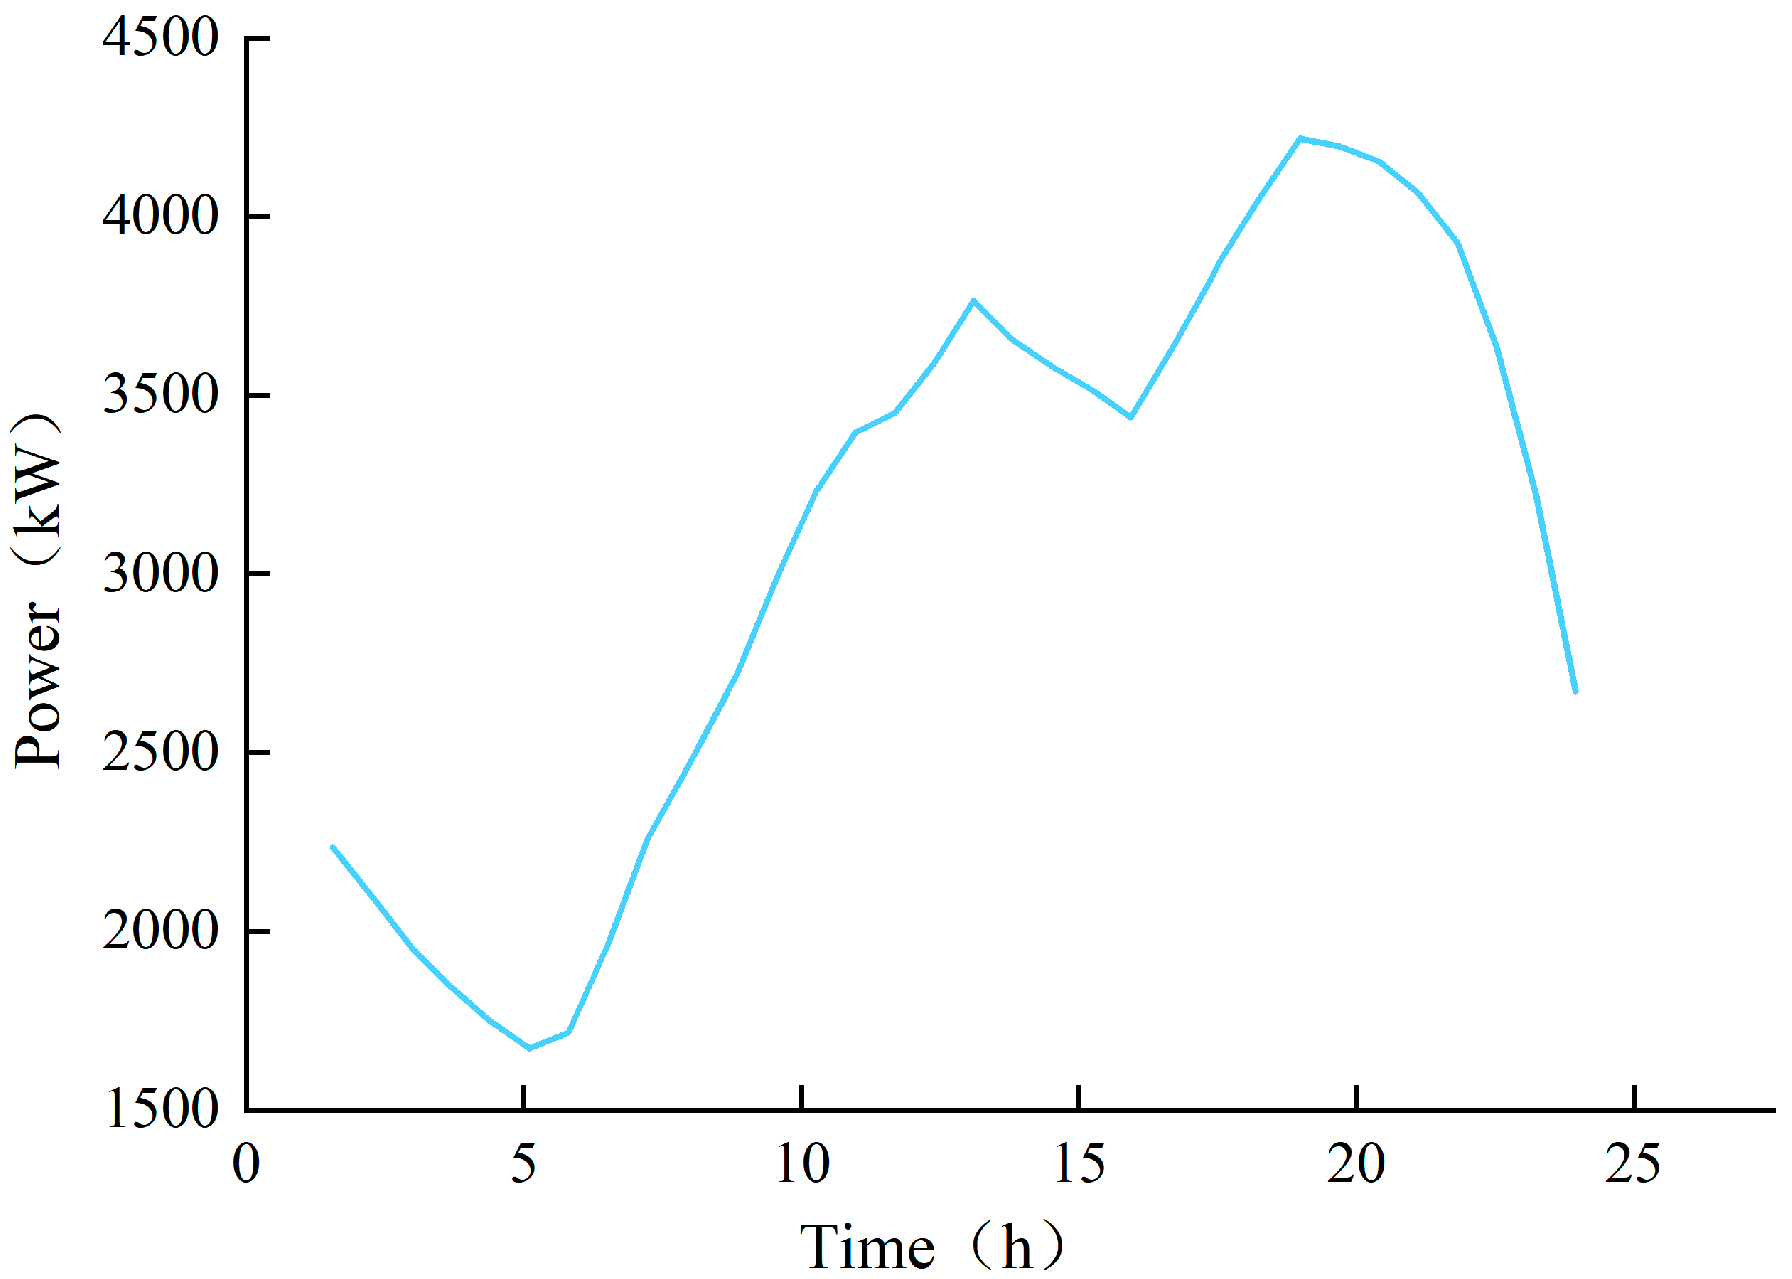
This paper conducts a case study based on the modified IEEE 33-bus distribution network [38], with its topological structure shown in Figure 3. The voltage level is 12.66 kV, and the typical daily load curve is shown in Figure 4. Bus 1 is a thermal power generator, serving as a PV bus and operating under droop control to maintain system voltage and frequency stability. In the simulation, the droop coefficient of the thermal power generator is set to 5%. Buses 2–33 include new energy stations, energy storage facilities, and load units, and are all treated as PQ buses.
In terms of algorithm implementation, programs are written using MATLAB 2021a, and the MATPOWER toolbox is used to complete the power flow calculation; the simulation is conducted on a computer with an Intel (R) Core (TM) i5-8500 CPU (3.00 GHz) and 8 GB of memory.
Considering the differences in optimization requirements, the upper-layer capacity configuration focuses on global planning, with the particle population size set to 50 and the number of iterations to 30; the lower-layer operation scheduling requires refined search, so the population size is also set to 50, while the number of iterations is increased to 200. The convergence characteristic curves of the PSO algorithm and the IMOPSO algorithm are shown in Figure 5a and Figure 5b, respectively. As illustrated, equilibrium is reached at the 18th iteration in Figure 5a and at the 159th iteration in Figure 5b. This adjustment enables better exploration of the global optimal solution and ensures the coordinated adaptation of the upper- and lower-layer models to complex energy scenarios.
The candidate nodes for wind power installation are {7, 8, 20, 24, 25, 32}, those for photovoltaic installation are {7, 8, 24, 25, 30}, and those for energy storage systems are {4, 6, 7, 8, 28, 29, 30, 31, 33}. The thermal power unit is fixed at node {1}. The maximum and minimum voltage magnitudes for each node are specified as 1.1 and 0.9 per unit (p.u.), respectively.
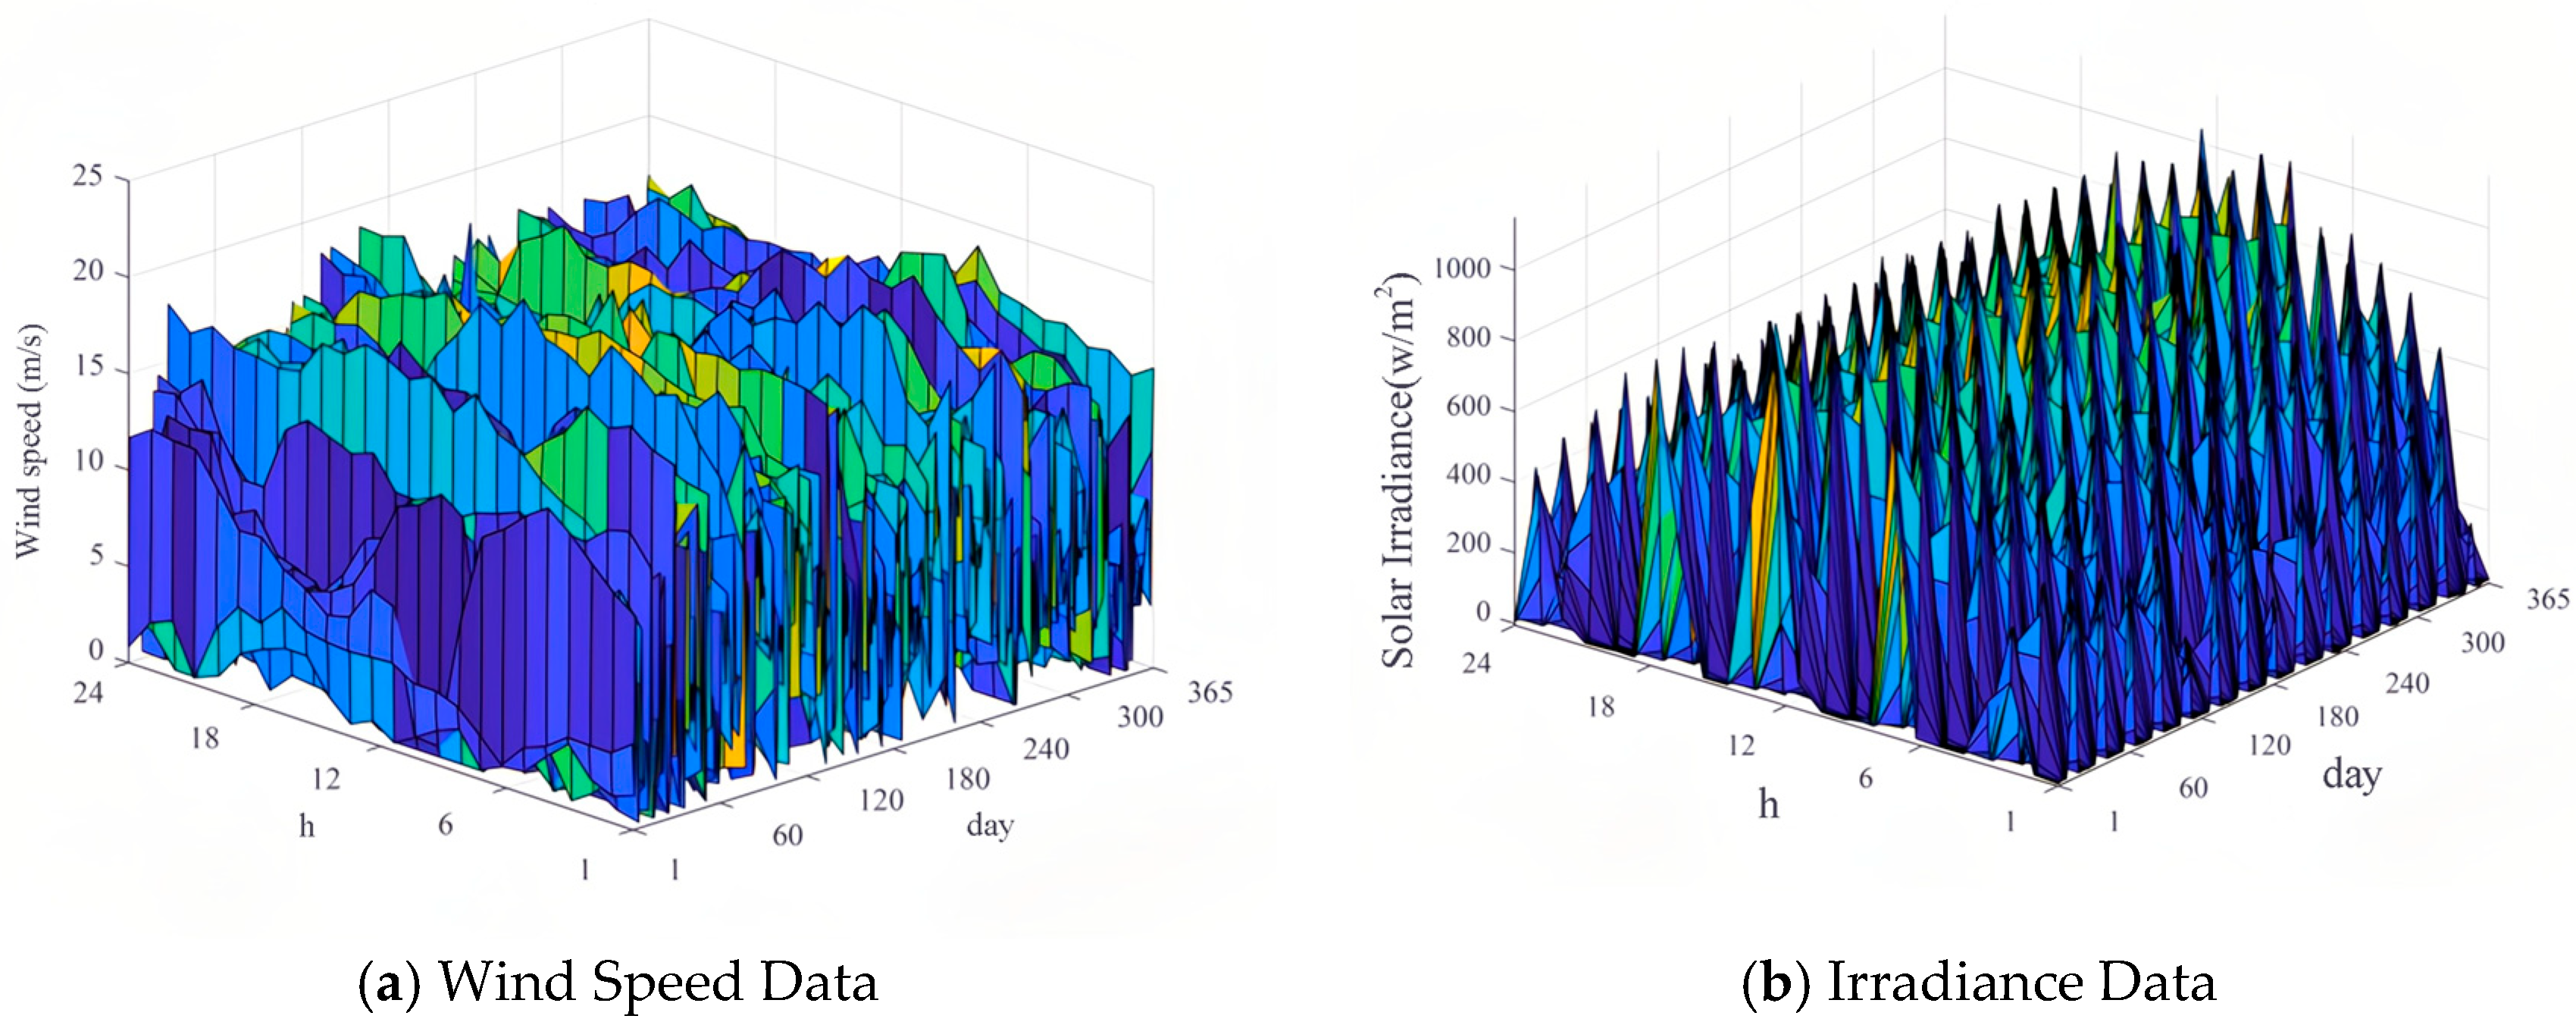
This paper takes Wangjiashan in Qichun County, Huanggang City, Hubei Province, as the site for its wind power and photovoltaic projects. The hourly wind speed and light intensity data collected from 1 January 2022 to 31 December 2022 are shown in Figure 6. The wind power generation system uses GW1.570 wind turbines with a hub installation height of 70 m, which can efficiently utilize wind energy. For photovoltaic systems, fixed monocrystalline silicon solar panels are adopted, and the elevation angle of the solar panels is set to 43 degrees to accurately simulate the field environment. The basic parameters of the equipment in this region are shown in Table 3.
To reduce the computational time of the subsequent model, the wind power capacity is divided into units of 150 kW each, while the photovoltaic capacity is divided into units of 100 kW each. Each pumped-storage power unit has a capacity of 200 kW, with a reservoir capacity nine times the installed capacity. The adjustable storage range is set between 0.1 and 0.9 times the reservoir capacity, and the initial storage level is set to 0.5 times the reservoir capacity. The maximum number of installable pumped-storage units is six. The capacity of each thermal power unit is 2000 kW, with the upper and lower output limits set at 15% and 100% of the installed capacity, respectively. The ramp rate of each thermal power unit is set to ±300 kW/h. The time-of-use electricity prices are as follows:
C t = 0.3104   Yuan / kW ;        23 t < 7 C t = 0.5976   Yuan / kW ;        7 t < 9 ,   15 t < 20 ,   22 t < 23 C t = 0.8683   Yuan / kW ;        9 t < 15 C t = 1.0395   Yuan / kW ;        20 t < 22

5. Results Analysis

5.1. Results of Wind and PV Output Uncertainty

5.1.1. Results of Wind and Photovoltaic Power Output Scenarios Generation

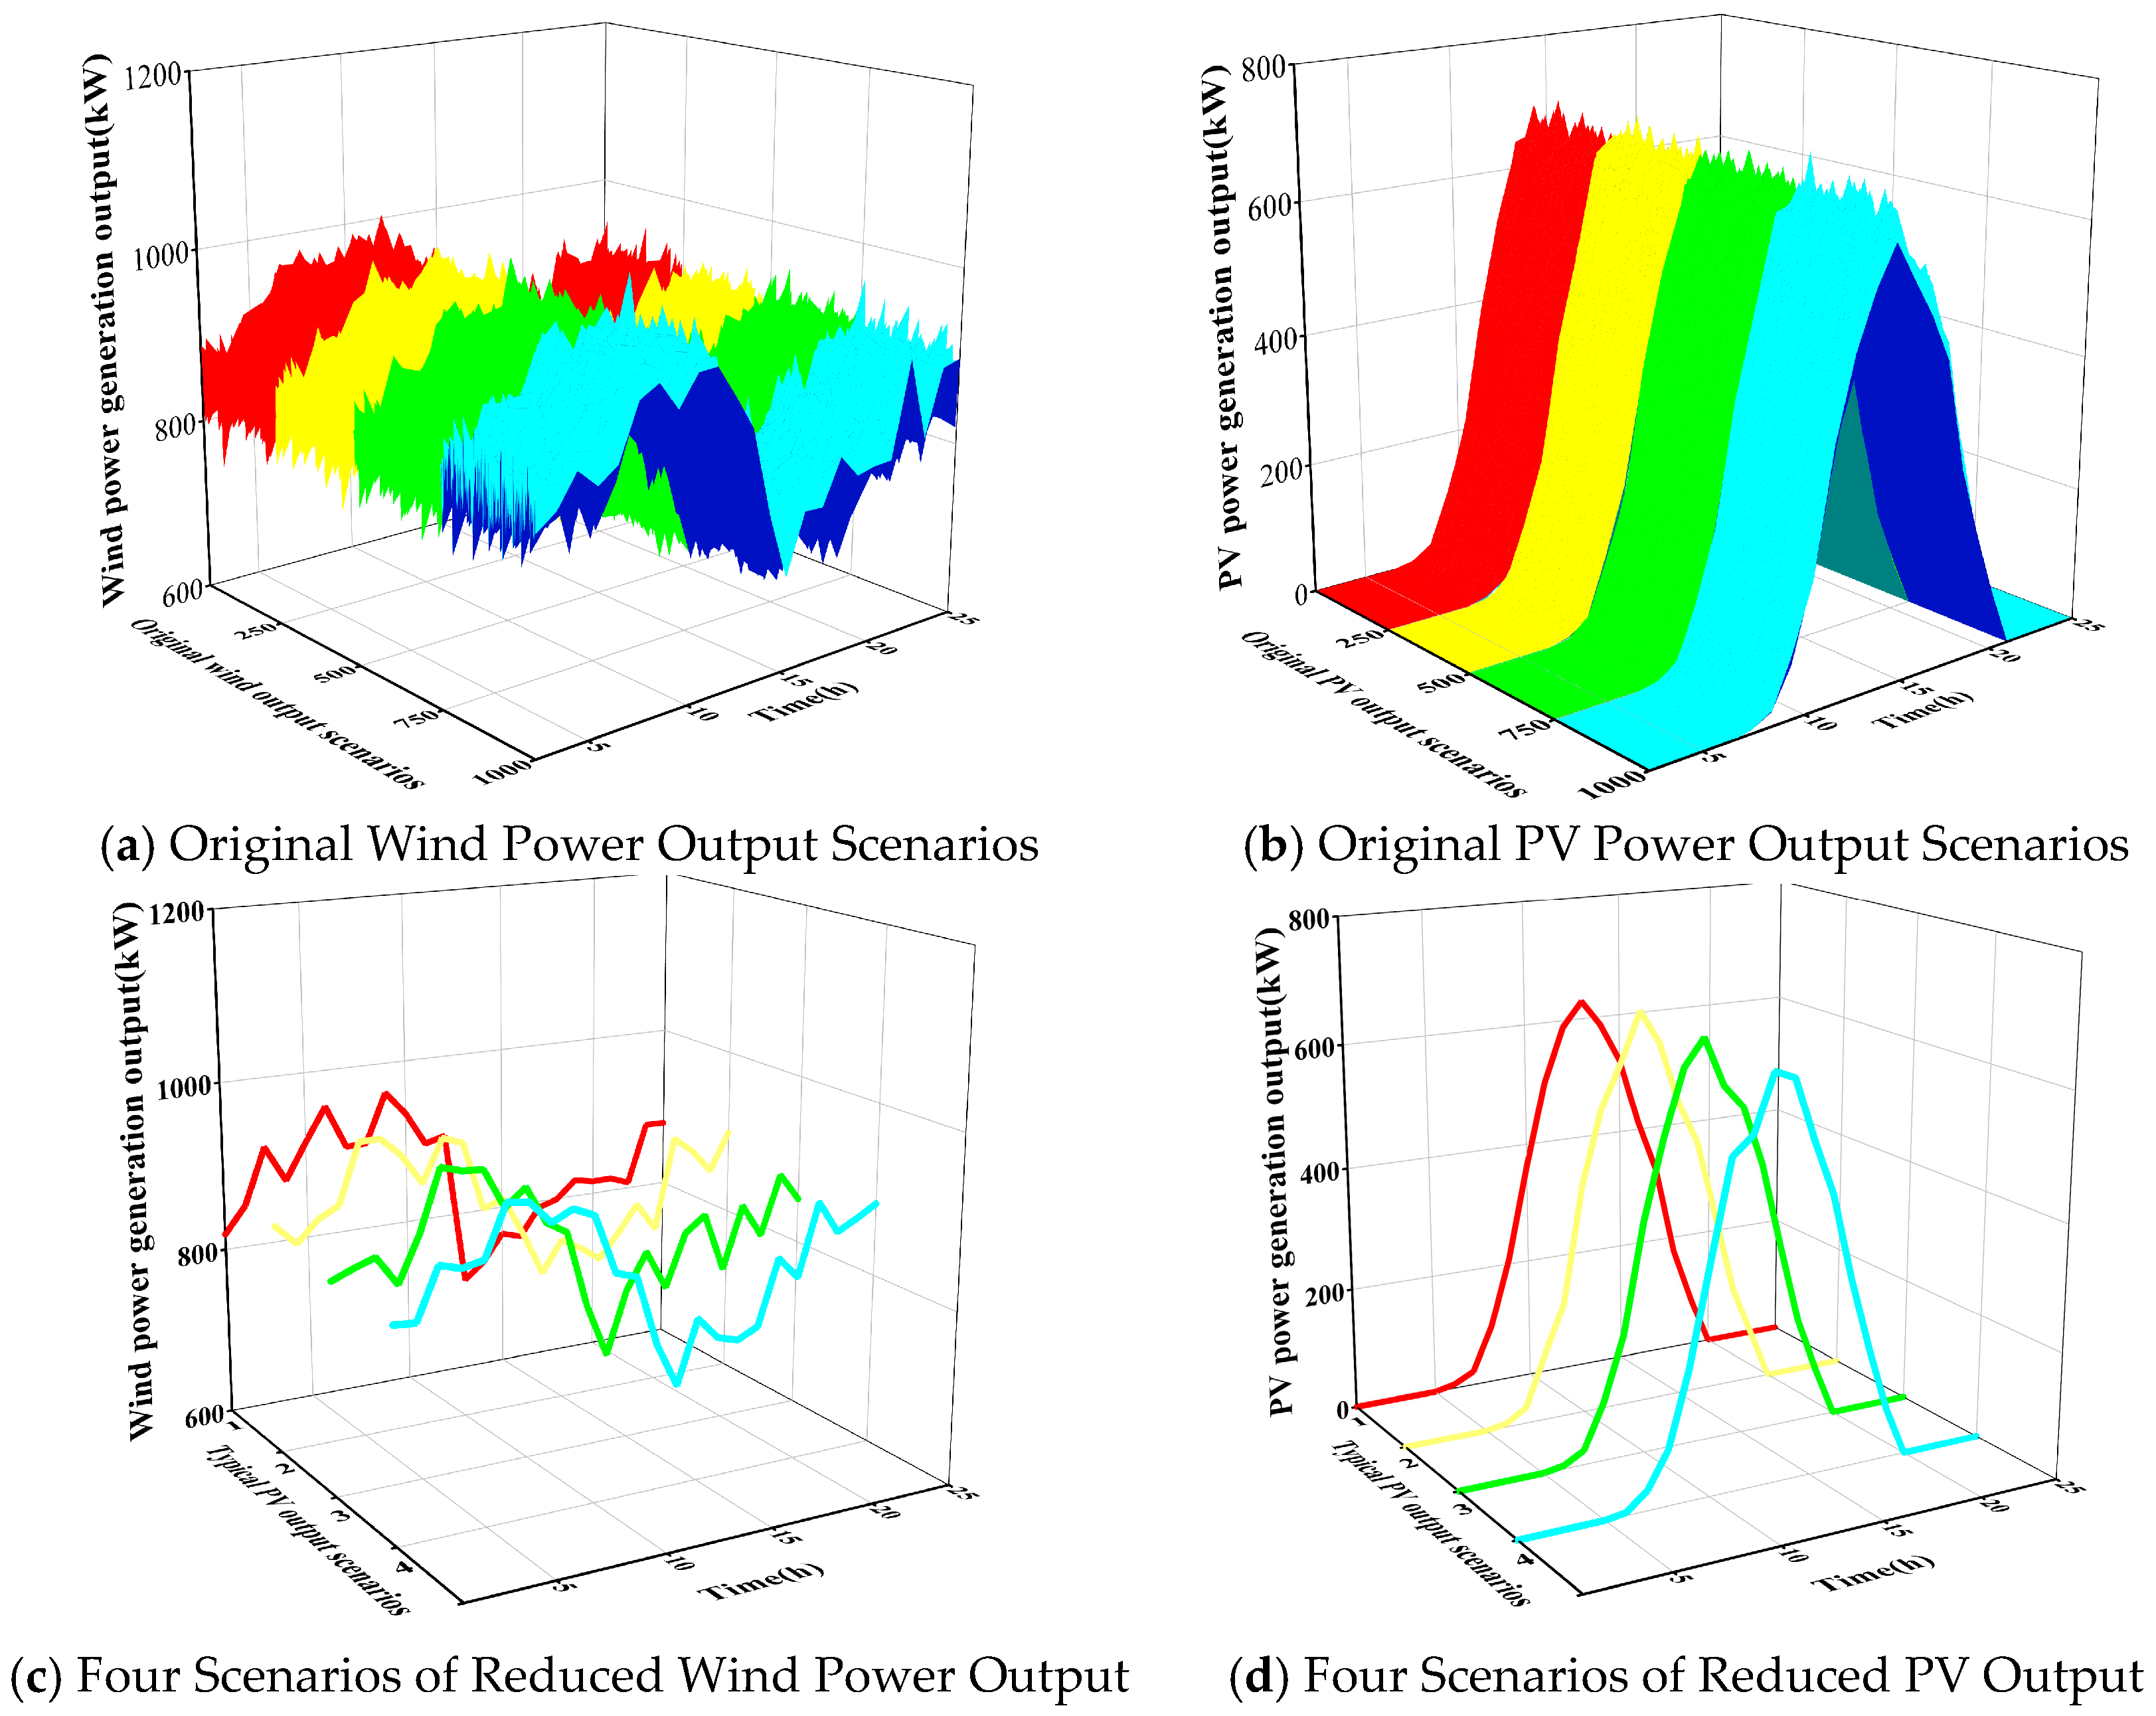
This paper uses the LHS method [30] to perform 1000 samplings for each unit of wind and photovoltaic power and employs the SBR algorithm based on Kantorovich distance for scenario reduction in the sampled data [31]. Finally, four groups of wind power, PV, and load scenarios with corresponding probabilities are obtained, as shown in Figure 7 and listed in Table 4. It can be seen that, after reduction, the trend of the scenarios is basically consistent with that of the original scenario set, while the number of scenarios is significantly reduced. This indicates that the scenario reduction technique adopted in this study is highly effective for handling the uncertainty of renewable energy output.

5.1.2. Performance Analysis of Scenario Reduction

Table 5 compares optimization results between the original and reduced scenario sets. Using stochastic optimization [28] to handle renewable energy uncertainty, the results are expressed as expected values. As shown in Table 5, profits and capacity configurations remain nearly identical before and after the reduction. This consistency arises because the SBR algorithm iteratively removes scenarios with minimal probability distance to others, preserving the original distribution accuracy. However, optimizing the original 1000 scenarios required 201.62 s, whereas after reduction into 4 typical scenarios, the solving time drops to 56.32 s.

5.1.3. Sensitivity Analysis of the Number of Typical Scenarios

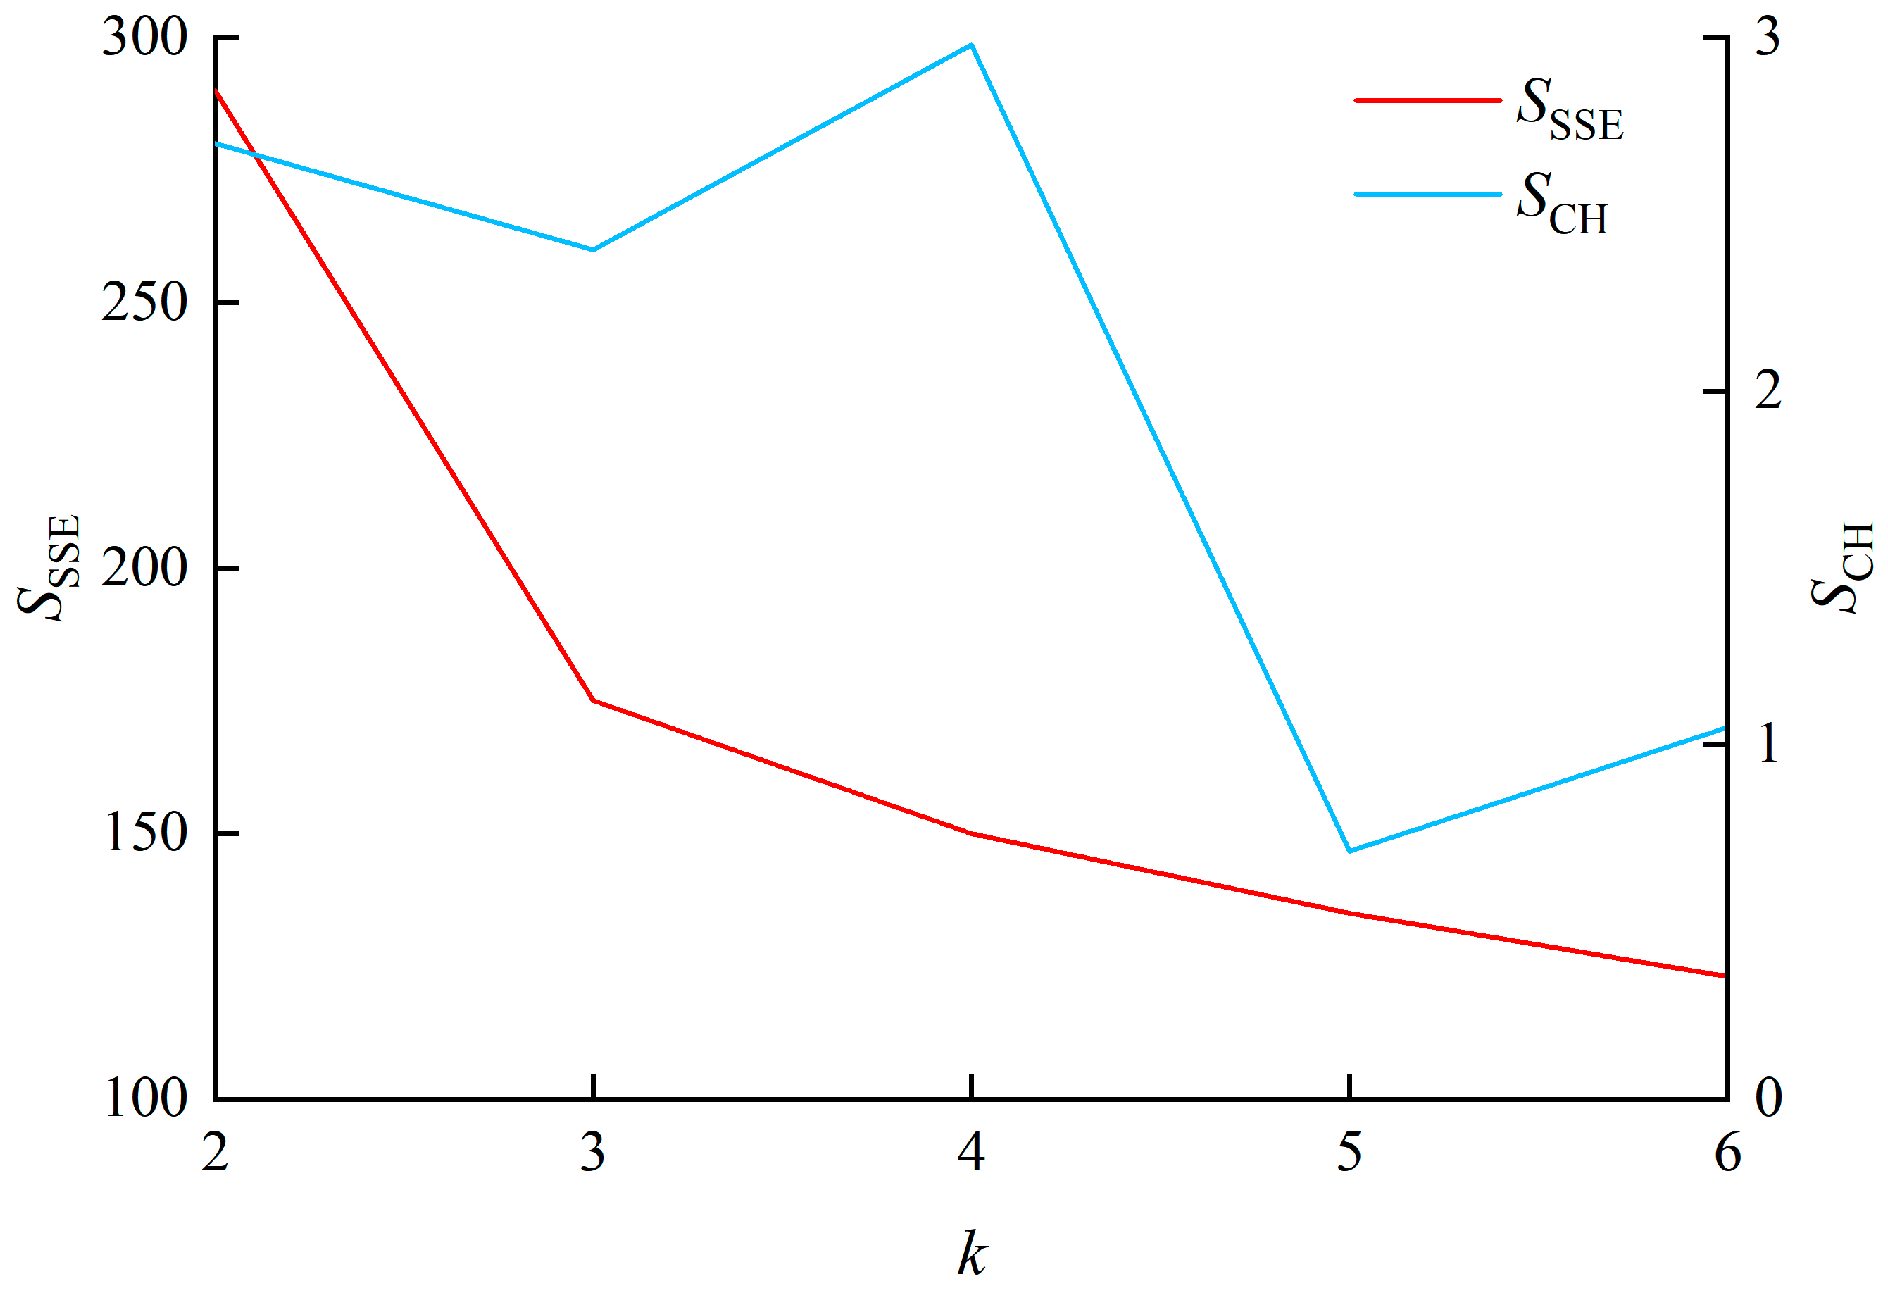
Figure 8 shows the clustering validity indicators for renewable energy output in this paper. Both the SSE and CH indices are used to evaluate the clustering performance. As the number of clusters increases, S SSE gradually decreases; when each sample forms an individual cluster, the clustering result is most accurate, whereas too few clusters lead to less precise results. In the theoretical analysis of Section 3.1.2, the S CH index also needs to be considered, and the number of clusters corresponding to a larger S CH should be selected. When the number of clusters reaches a certain value, the combined value of these two indicators is optimal, and the corresponding cluster number is taken as the optimal number of clusters. When k = 4, S CH reaches its maximum value, while S SSE decreases at a slower rate as the number of clusters exceeds four. Therefore, the optimal number of clusters is chosen as four. Accordingly, the number of reduced scenarios is set to four, resulting in the four typical scenarios shown in Figure 7c,d. It is worth noting that during the LHS sampling process, the renewable energy output is considered the sum of the wind and photovoltaic outputs.

5.1.4. Verification of the Superiority of Scenario Reduction

The traditional K-means algorithm [34] is applied to reduce the renewable energy output scenarios in order to verify the superiority of the SBR algorithm. Using the combination of the clustering validity indices S SSE and S CH as evaluation parameters, the clustering results are presented in Table 6. As shown in Table 6, the SBR algorithm outperforms the traditional K-means algorithm in terms of scenario reduction results. However, the SBR algorithm requires more computation time than the traditional K-means algorithm because it needs to continuously traverse the scenarios in the retained set, resulting in higher computational complexity. In contrast, K-means directly performs scenario clustering by setting the number of clusters, which is a simpler method compared to the SBR algorithm, but its scenario reduction performance is not as good as that of the SBR algorithm.

5.2. Analysis of Capacity Configuration Results for Multi-Agent Combined Power Generation Systems Under Non-Cooperative Game

(1)
Sensitivity Analysis of Each Participant’s Utility Function and Installed Capacity
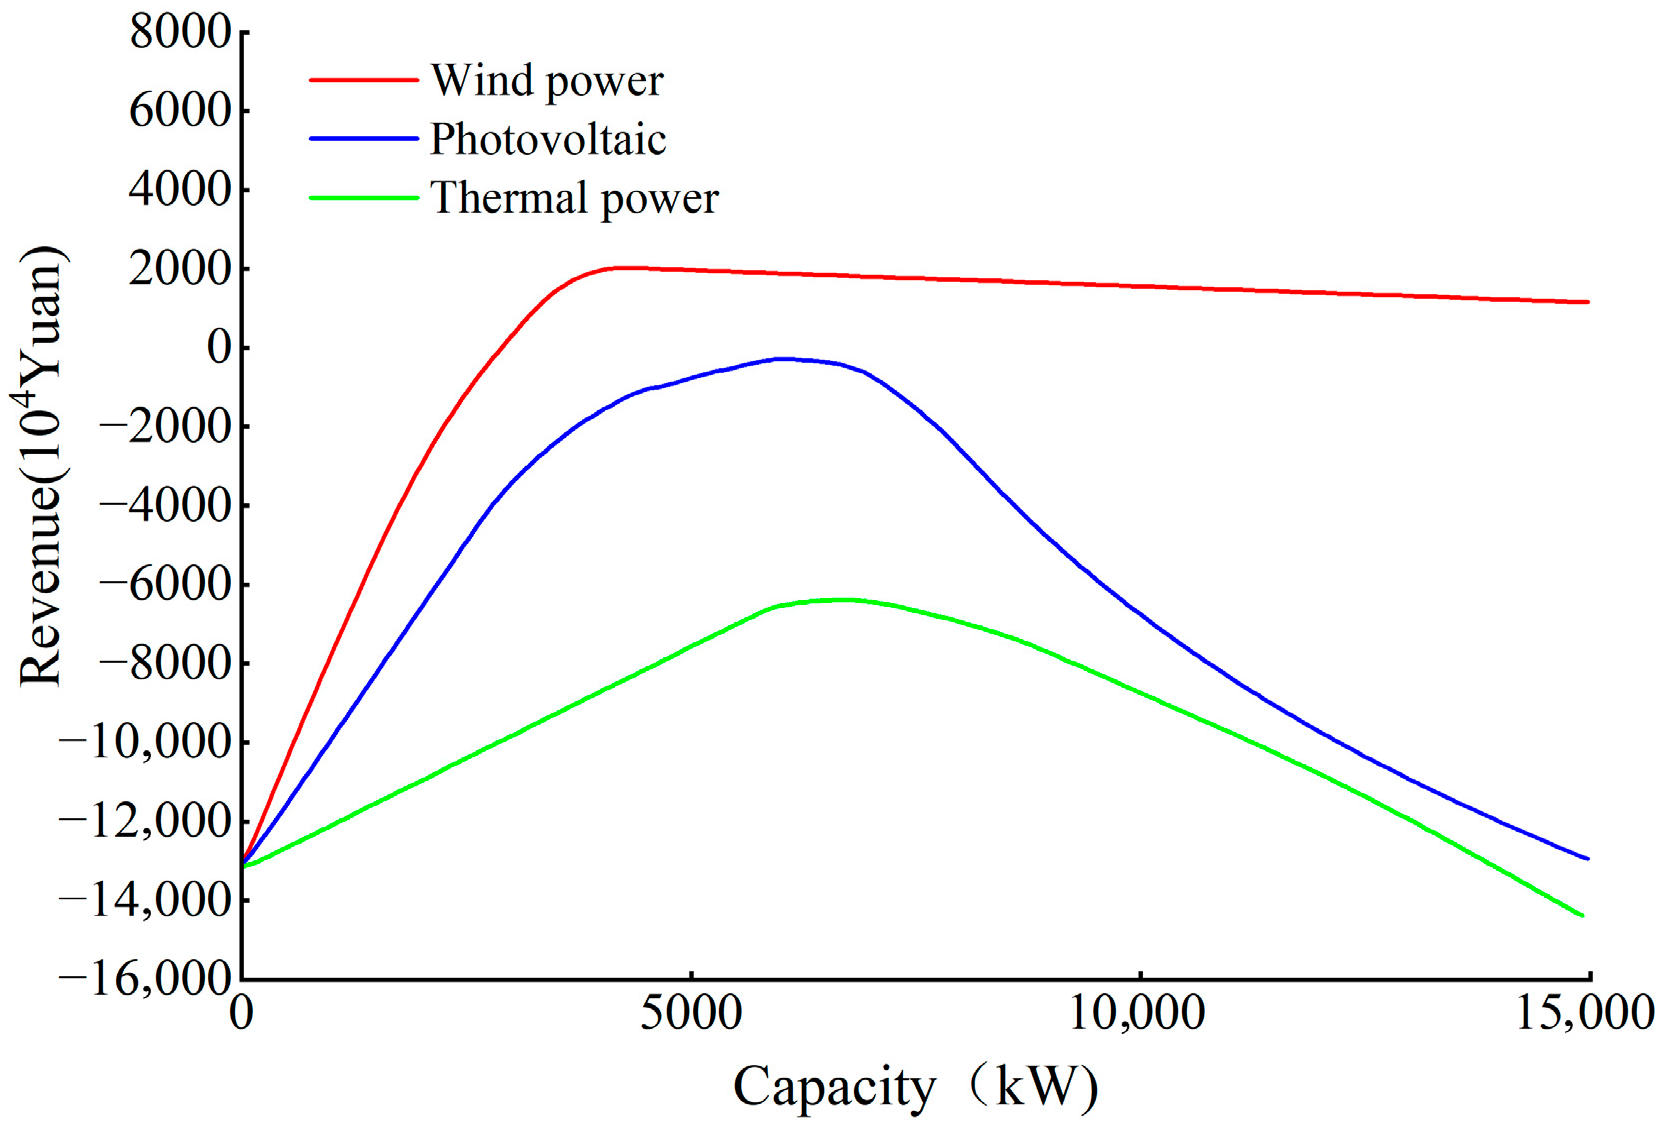
The relationship between the utility functions of each energy subsystem and their installed capacities is shown in Figure 9. The analysis indicates that initially increasing the installed capacities of wind, photovoltaic, and thermal power significantly boosts profits, with the utility functions rising rapidly. However, as capacities continue to grow, load constraints slow down the growth of electricity sales revenue, while investment and operation–maintenance costs increase, causing the utility functions to decline after reaching their peaks, exhibiting extremum behavior. The peak utility of wind power is higher than that of PV because the outage penalty for wind decreases with capacity growth, whereas the nighttime penalty for PV remains unchanged. Beyond the peak points, increased wind/PV curtailment and higher capacity costs lead to profit reduction. For thermal power, profit decline is mainly driven by rising installed capacity costs. The utility functions of wind, PV, and thermal power systems, when other systems have zero capacity, show that at installed capacities of 6075 kW, 6710 kW, and 4212 kW, their utility values are CNY −2.9576, CNY −63.9525, and CNY 17.28438 million, respectively. The results indicate that relying solely on wind or PV for grid supply is uneconomical, as their inherent uncertainty and variability make it difficult to reliably and continuously meet load demand.
(2)
Results Analysis under Non-Cooperative Game Mode
In a non-cooperative game environment, each energy supplier pursues the maximization of its own utility function [39]. The optimal installed capacities of wind power, photovoltaic power, pumped-storage power stations, and thermal power under the non-cooperative game framework are 2700 kW, 3000 kW, 600 kW, and 4000 kW, respectively, as shown in Table 7; the expected revenues of these energy suppliers within a scheduling cycle are CNY 10.0583 million, CNY 6.5670 million, CNY 1.7384 million, and CNY 18.0845 million, respectively. At this point, the installed capacity of renewable energy accounts for 68.54% of the total installed capacity, while that of pumped-storage power stations accounts for 6.15%. The utilization efficiency of wind power is 94.66% and that of PV is 91.77%, and the overall utilization efficiency of renewable energy is 92.94%. The total voltage deviation of the system network nodes is 18.43.
Compared with independent operation, wind and PV are more suitable for integration with other energy types, which helps improve their power generation efficiency and economic returns. The utilization rate of wind power is higher than that of PV under the non-cooperative game mode. In the wind–PV–storage–thermal joint power generation system under this mode, the pumped-storage power station generally remains in standby, resulting in relatively low economic benefits. However, the real-world value of pumped-storage power stations lies in their significant contribution to power system stability and reliability, especially by providing critical reserve capacity during peak power demand periods. The non-cooperative game mode ignores the contribution of pumped-storage participants to system stability, which may affect their interest in further investment and expansion.

5.3. Analysis of Capacity Configuration Results for Multi-Agent Combined Power Generation Systems Under Cooperative Game

In previous studies, the multi-source joint power generation system often aims at overall optimization, pursuing maximum benefits. However, in reality, joint power generation systems are usually composed of multiple investment entities, and reasonable profit and risk allocation is crucial for alliance stability [40]. Under the cooperative game mode, operators of subsystems such as wind power, photovoltaic, and energy storage share profits and risks through cooperation, emphasizing fair allocation and overall optimization to improve system operation efficiency and economic benefits, thereby attracting more investors. This mode provides a new, effective path for the optimization of joint power generation systems. In the cooperative game model, the four participants of wind, solar, storage, and thermal power, namely, {WT, PV, PHS, TPS}, can form 15 different alliances. Analysis of these alliances yields the optimal solutions under different alliances, as shown in Table 8. The economic benefits brought by any form of alliance are significantly higher than the sum of the benefits when each member operates independently, confirming that the cooperative game in this paper has superadditivity. For example, the economic benefit of the wind–solar combination {WT, PV} reaches CNY 16.5885 million, while their individual benefits are both zero. When the alliance consists of wind power, photovoltaic, and pumped-storage hydropower stations {WT, PV, PHS}, the economic benefit rises to CNY 21.8057 million, which is CNY 5.2172 million more than the sum of {WT, PV} and {PHS}. Additionally, the Shapley value method is used to allocate the benefits of the wind–solar–storage–thermal alliance in the cooperative game model, resulting in allocated benefits of CNY 10.8759 million for wind power, CNY 6.8768 million for photovoltaic power, CNY 5.8030 million for the pumped-storage hydropower station, and CNY 19.9628 million for thermal power. All of these exceed their benefits under independent operation, indicating that under the cooperative game model, participants can form alliances through resource sharing to achieve a higher economic benefit incentive mechanism.
In the analysis, it was found that the benefits obtained under the five cases of Alliances 11 to 15 are relatively significant. Therefore, the study focuses on these five cases, deeply discussing the performance of each alliance in key indicators such as wind curtailment rate, solar curtailment rate, system stability (evaluated by voltage deviation), and pollutant emissions. The specific optimization results are shown in Table 9. Alliance 13 has a significant increase in economic benefits compared to Alliance 14, with an increase of CNY 7.6210 million. The increase in economic benefits in Alliance 13 is accompanied by a significant reduction of 27,536.59 tons of carbon emissions, which not only reflects the progress of Alliance 13 in promoting environmental sustainability but also achieves a win–win situation in economic benefits. However, in terms of system stability, Alliance 14 shows smaller fluctuations, indicating that it has relatively better power supply stability and provides a more stable power supply. Further comparison reveals that Alliance 14 has a higher demand for the installed capacity of pumped-storage hydropower stations, mainly because photovoltaic power generation has more significant periodicity than wind power, with a large difference between the maximum and minimum power generation. The power generation period is mainly concentrated from 10:00 to 16:00, while the peak power consumption of the system is from 16:00 to 22:00. This requires the alliance to have strong peak shaving capability at this time, so the system has high requirements for pumped-storage hydropower.
When comparing the indicators of Alliance 11 {WT, PV, PHS} and Alliance 12 {WT, PV, TPS}, it was found that Alliance 12 significantly outperforms Alliance 11 in economic benefits. The fundamental reason for this difference is that although Alliance 11 has a high proportion of renewable energy supplemented by a 1200 kW pumped-storage power station to regulate energy supply uncertainty, it still faces significant waste in renewable energy utilization. Moreover, in terms of voltage deviation—a metric for system stability—Alliance 11 also demonstrates better performance, indicating its higher power supply stability. From the perspectives of economic benefits and system security, the wind–PV–thermal alliance is superior to the wind–PV–storage alliance.
Further comparison between Alliance 12 and Alliance 13 shows that Alliance 12 has CNY 1.1792 million-higher economic benefits and 32,282.58 tons-fewer carbon emissions. These two alliance modes exhibit nearly identical levels of power grid supply stability. The above results indicate that the combination of wind and PV power generation has complementarity, which can enhance the stability of the system’s power supply.
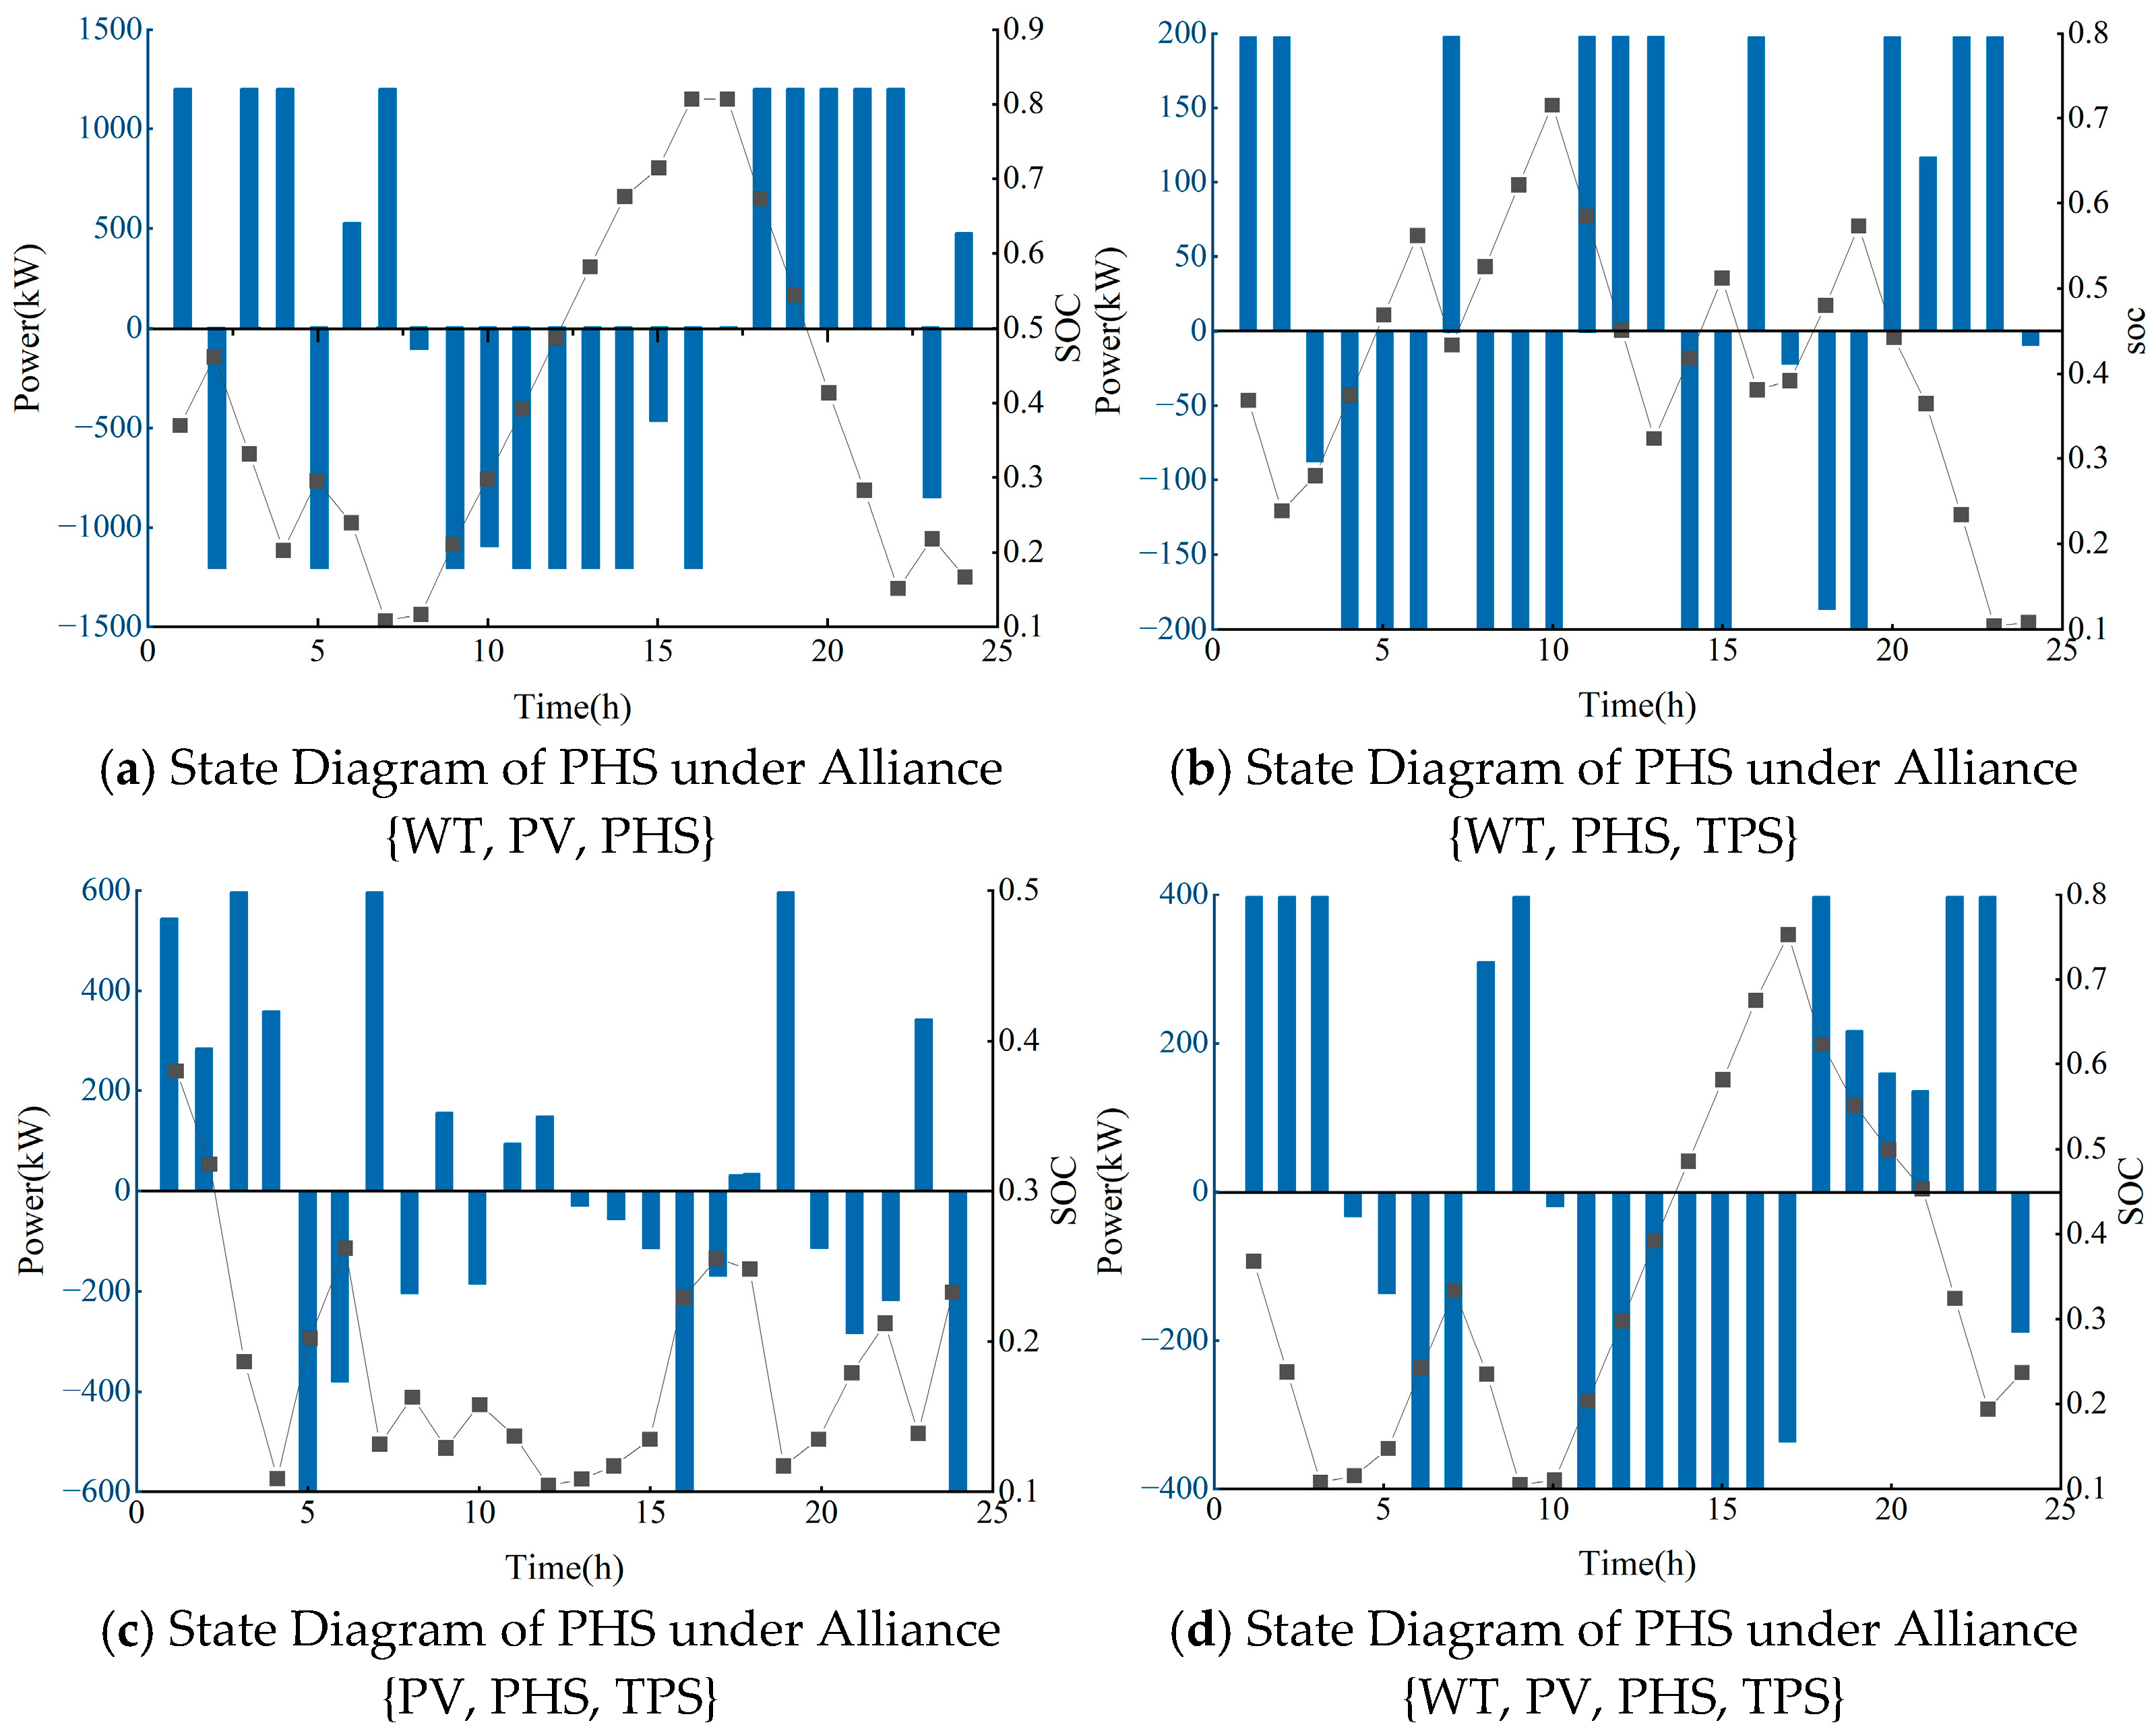
When comparing the operation status of pumped-storage hydropower stations (as shown in Figure 10 for Alliances 11, 13, 14, and 15 in terms of SOC (State of Charge)), it can be observed that the pumped-storage hydropower stations in Alliances 11, 13, and 15 operate at full capacity during many periods, with their reservoir utilization rates reaching 80% and 70%. In Alliance 14, although the pumped-storage hydropower station also reaches full capacity, its capacity utilization rate is only 50%. This observation indicates that the utilization efficiency of pumped-storage hydropower stations, when combined with wind power, is higher than that when combined with photovoltaic power, and the utilization efficiency of pumped-storage hydropower is the highest when wind power, photovoltaic power, and pumped-storage hydropower are used in combination.

5.4. Comparative Analysis of Optimization Results Between Non-Cooperative and Cooperative Games

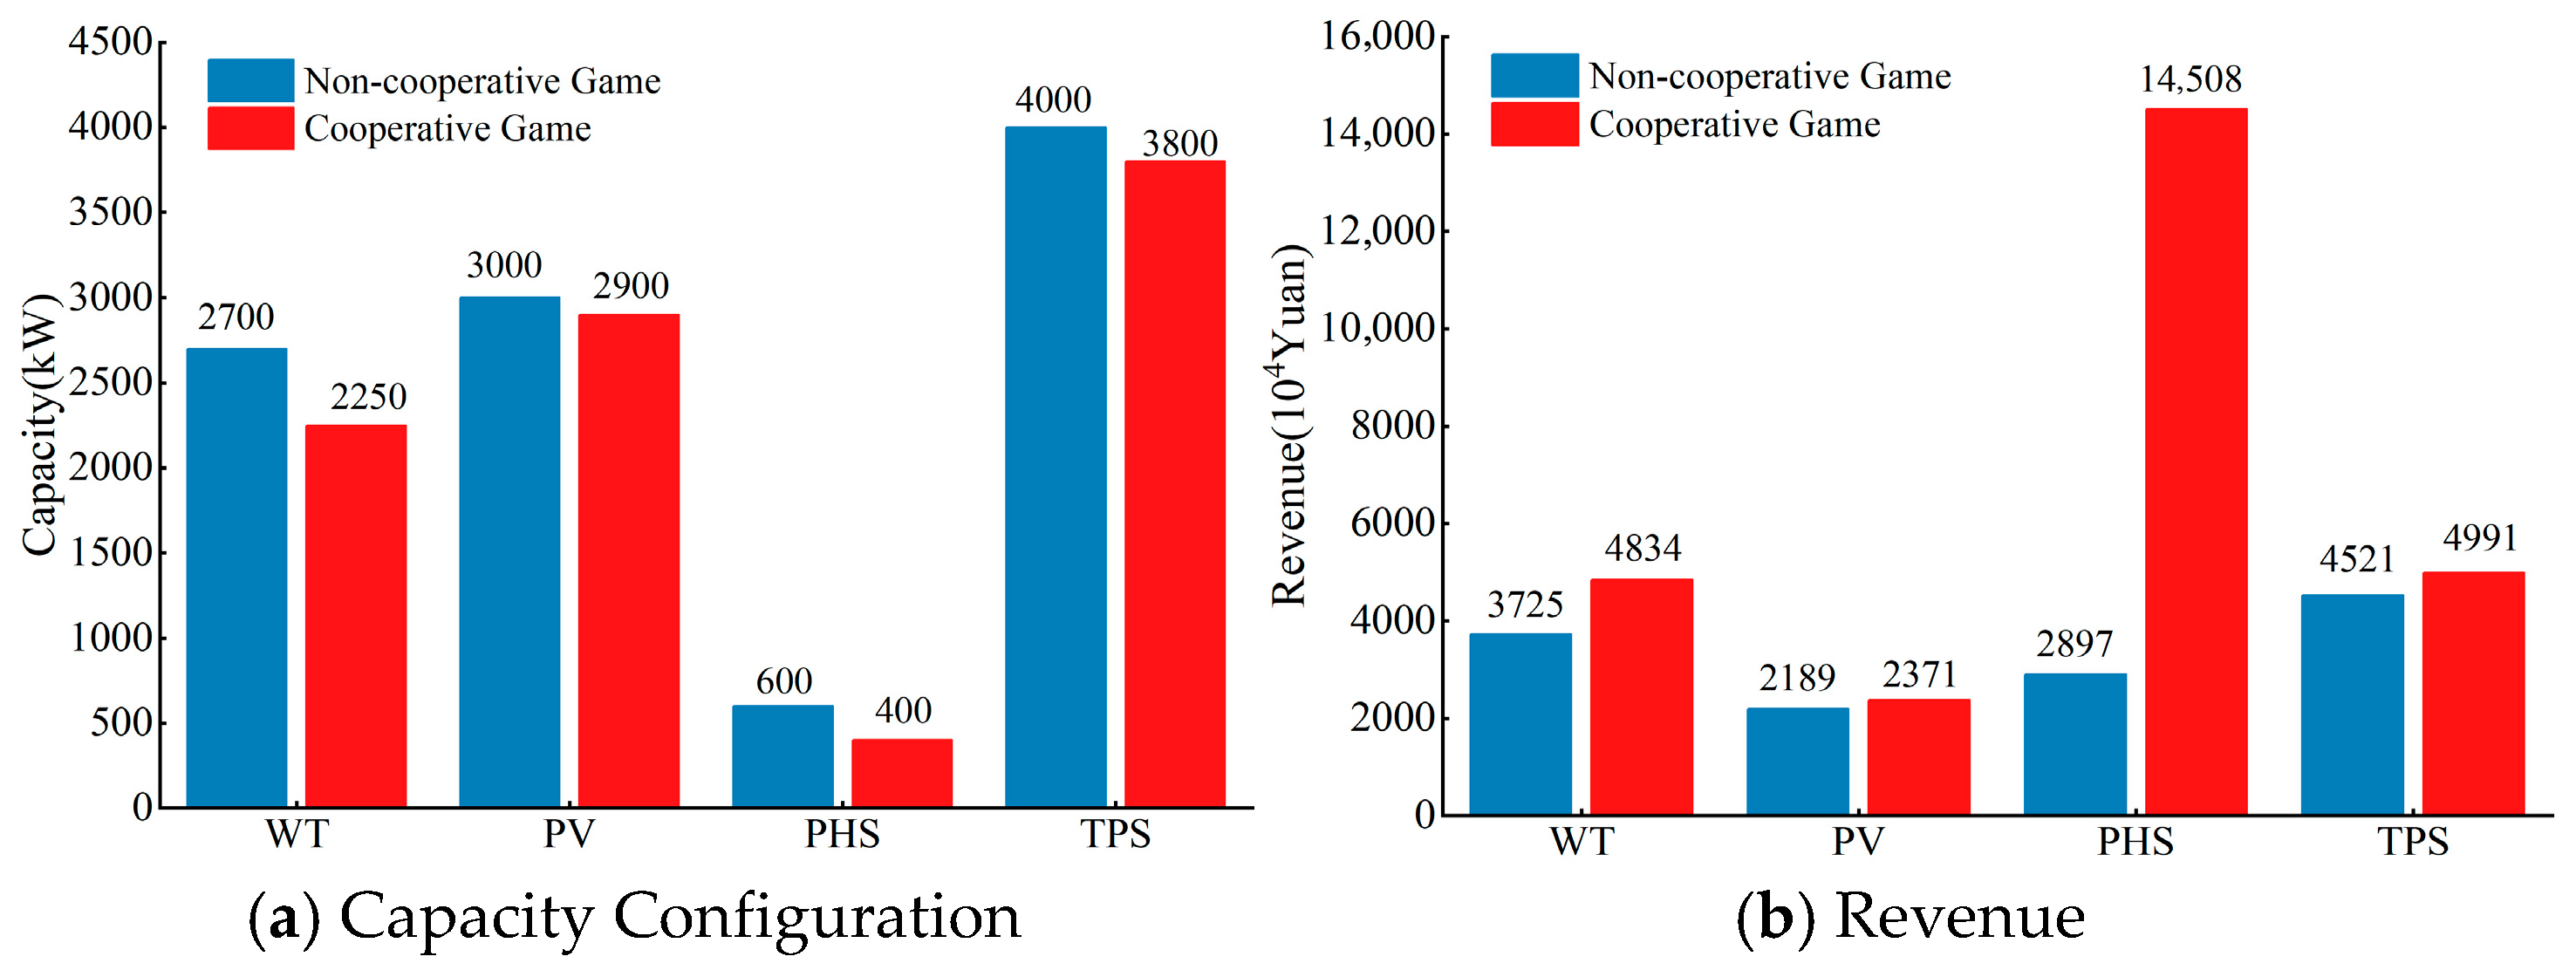
Compared with the non-cooperative game model, the cooperative game model achieves significant improvements in the economic benefits, environmental benefits, and voltage stability of the integrated power generation system. As shown in Figure 11a, under the cooperative game model, the required capacities of WT, PV, PHS, and TPS are reduced compared with those in the non-cooperative game model, indicating a lower configuration cost. Moreover, the reduction in PHS further contributes to a decrease in carbon emissions. As illustrated in Figure 11b, under the non-cooperative game model, the unit capacity revenues of the wind power, photovoltaic power, pumped hydro storage, and thermal power stations are CNY 3725, CNY 2189, CNY 2897, and CNY 4521, respectively. In contrast, under the cooperative game model, the revenues of the corresponding energy supply systems increase to CNY 4834, CNY 2371, CNY 14508, and CNY 4991. This indicates that when different energy suppliers adopt the cooperative game model, their revenues are generally higher than those under the non-cooperative model.
From the perspective of environmental benefits, Figure 12a shows that CO2 emissions amount to 35,701.24 tons under the non-cooperative game model, whereas they are reduced to 30,195.29 tons under the cooperative game model. As further illustrated in Figure 12b, SO2 and CO emissions under the non-cooperative game model are 5.36 tons and 25.78 tons, respectively, while under the cooperative game model, they decrease to 4.54 tons and 21.80 tons, respectively. Compared with the non-cooperative game model, the cooperative game model demonstrates a more significant reduction in pollutant emissions, with decreases of 5505.95 tons in CO2, 0.82 tons in SO2, and 3.98 tons in CO. These results highlight the potential of the cooperative game model in promoting environmental protection. The comparison optimization results between the non-cooperative and cooperative game models are presented in Table 10.
Figure 13 clearly shows the specific voltage deviations in each time period. By comparing the economic benefits, environmental impacts, and system stability under non-cooperative and cooperative game modes, it can be clearly seen that the cooperative game mode provides higher benefits for all participants, while making greater contributions to environmental protection and performing better in ensuring power grid stability. These findings highlight the importance of promoting cooperation within the energy sector, which can not only enhance economic benefits but also effectively reduce environmental pollution and enhance system stability.
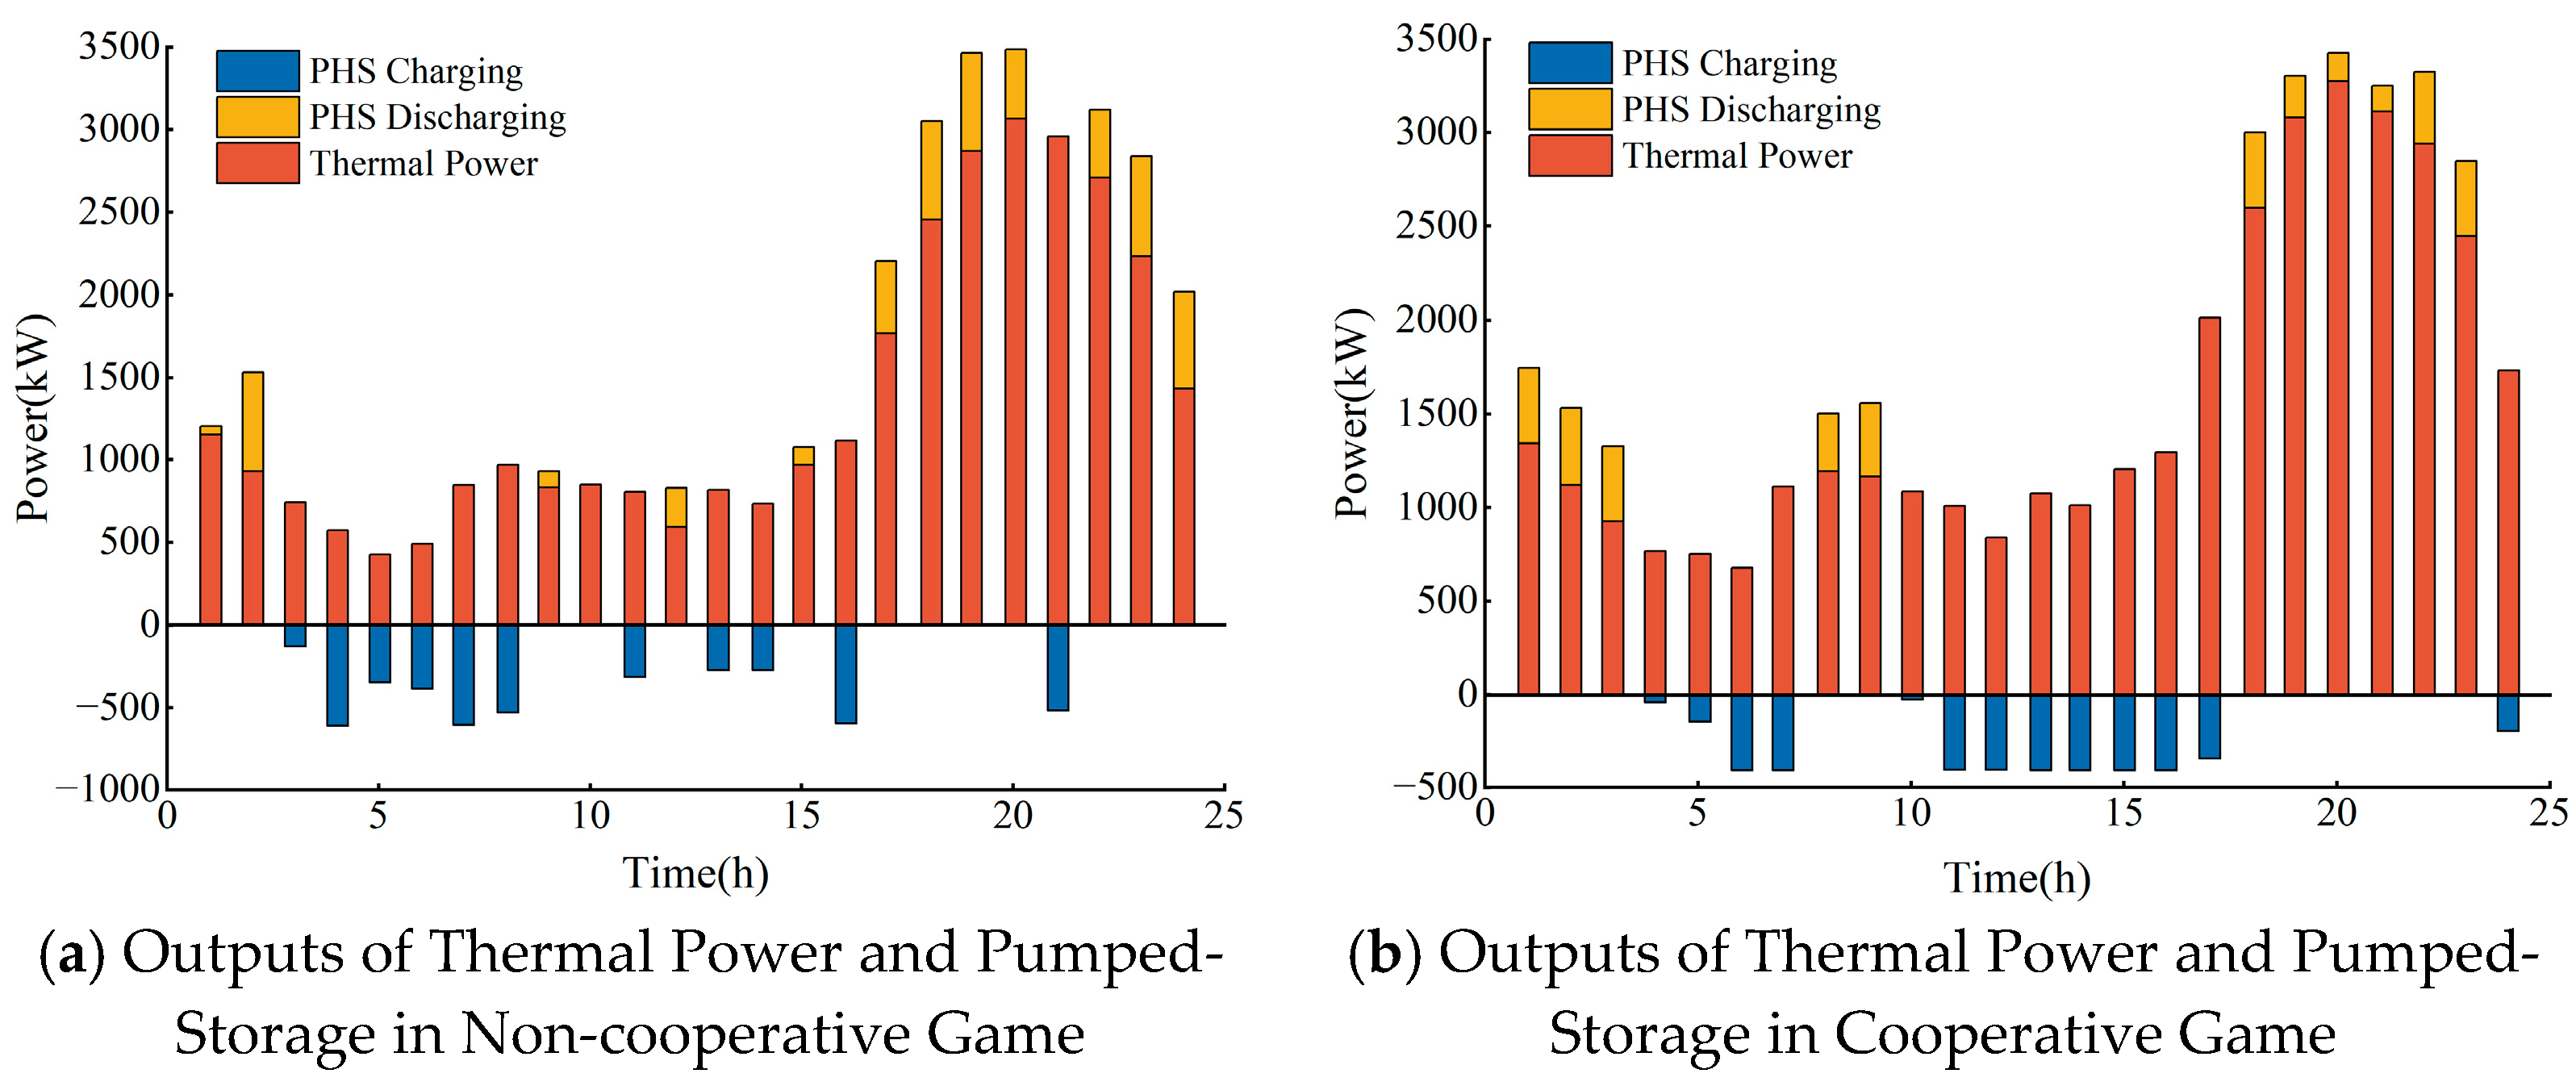
The power outputs of thermal power and pumped-storage hydropower under non-cooperative and cooperative game modes are shown in Figure 14. When analyzing the volatility of thermal power, it was found that the volatility is relatively low under the non-cooperative game mode. This phenomenon is mainly attributed to the fact that, in the cooperative game mode, to maximize the overall benefits, not only pumped-storage hydropower stations but also thermal power plants participate in regulating the volatility of wind and photovoltaic power. This is because participants in the cooperative game work together to address the fluctuations of the overall system, thereby achieving overall optimization. In contrast, in the non-cooperative game mode, each participant primarily focuses on maximizing their own interests. When faced with output fluctuations beyond their individual regulation capabilities, they usually do not actively engage in additional regulation activities.

5.5. Sensitivity Analysis

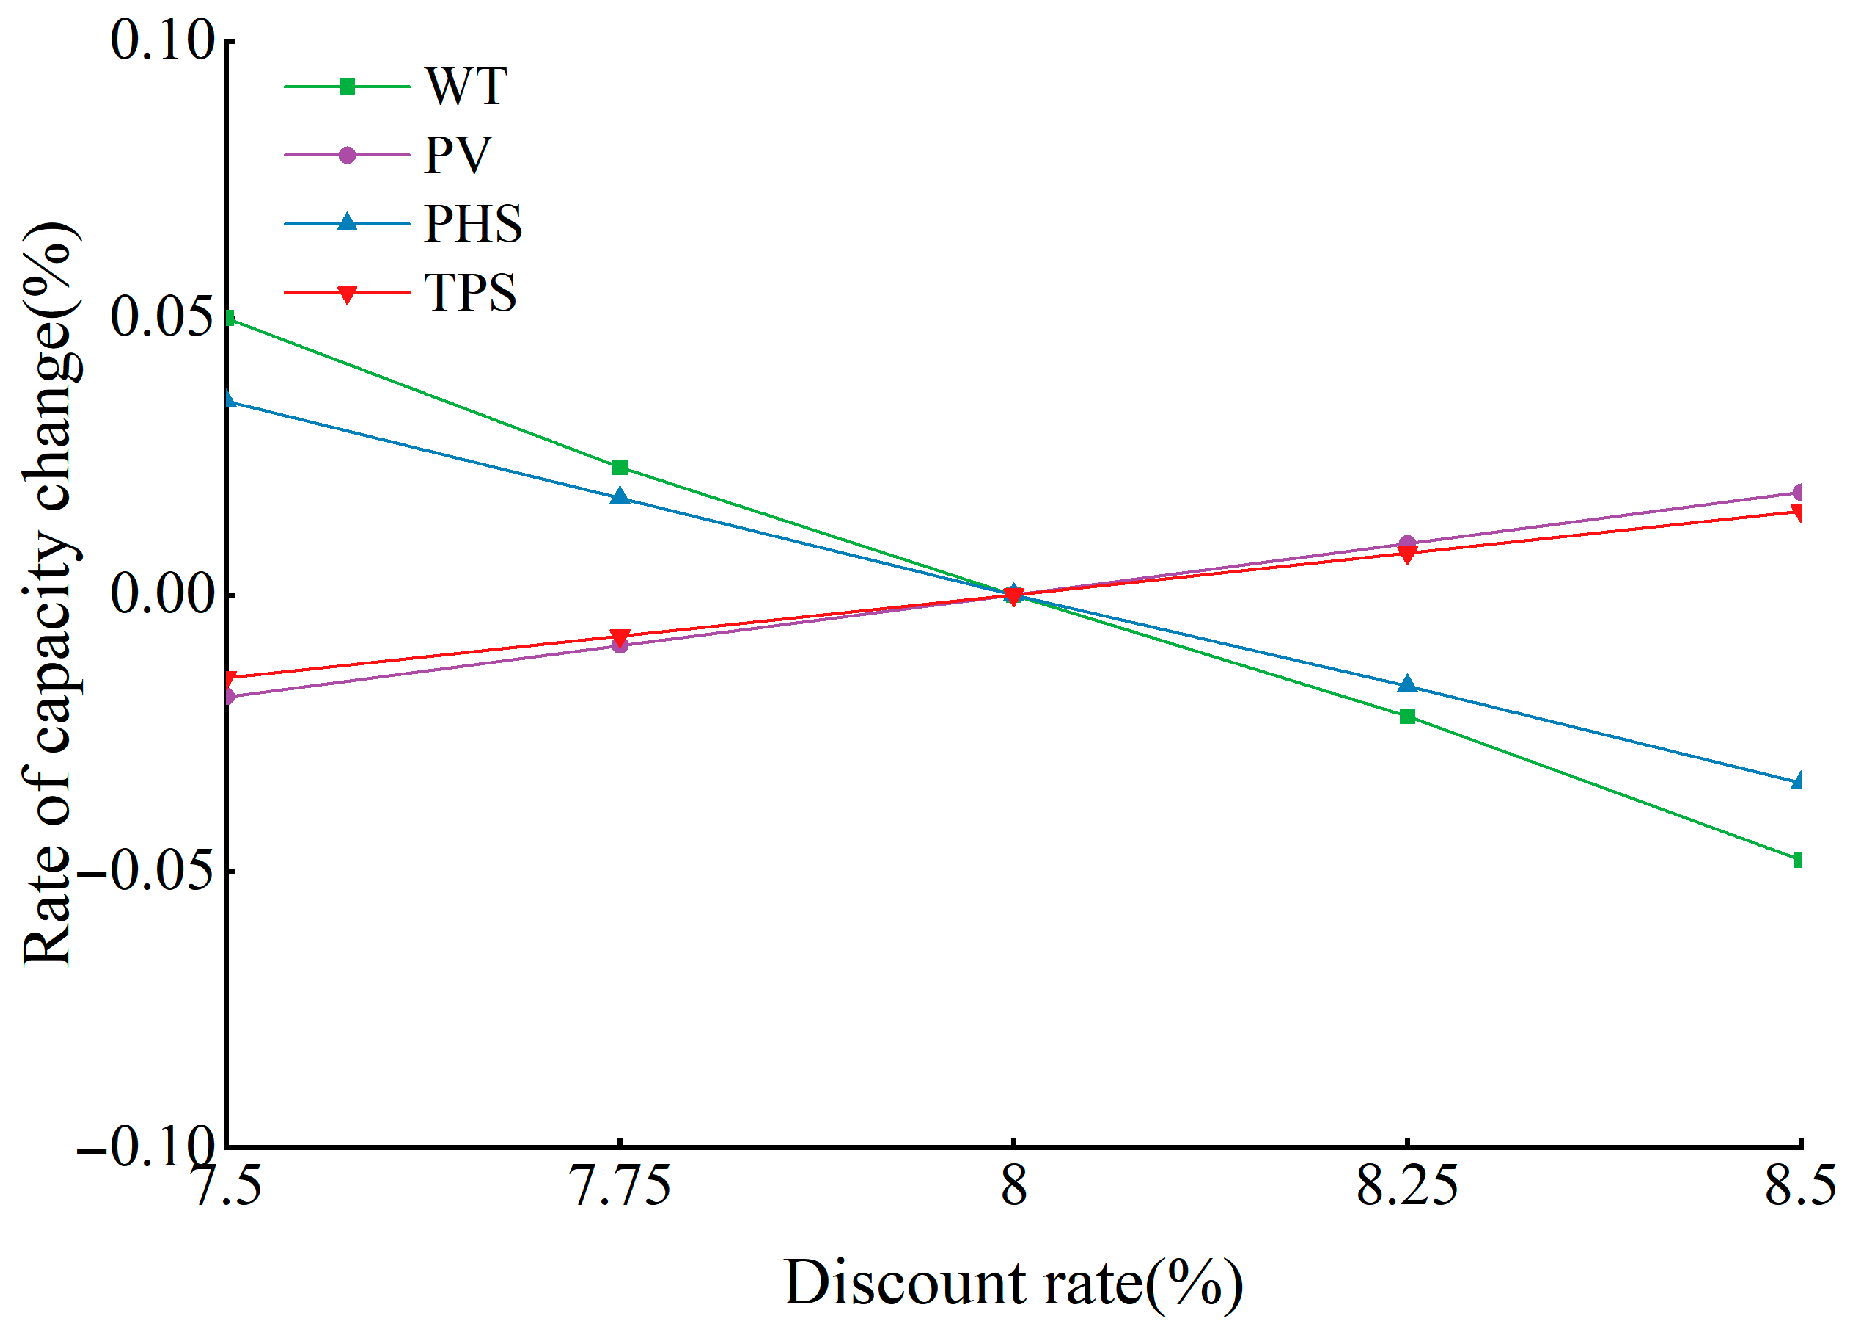
In practical applications, the discount rate is an important factor influencing the acquisition cost. Based on the results of the cooperative game capacity optimization, this section conducts a sensitivity analysis of the discount rate, which can provide auxiliary information for operators and government authorities. Its relationship with the capacities of various energy supply units is shown in Figure 15. As the discount rate increases from 7.5% to 8.5%, the capacities of WT and PHS decrease significantly due to their relatively high unit costs. In contrast, PV and PHS, with lower unit costs, see their capacities increase accordingly, thereby ensuring the energy station’s supply.

5.6. Performance Comparison of the Proposed and Traditional Bi-Level Optimization Models

This paper compares the traditional bi-level optimization model used in [9] with the proposed method, which incorporates a cooperative game mode into the bi-level optimization framework. The performance analysis is shown in Table 11. Compared with the traditional bi-level optimization model, the proposed model demonstrates advantages in economic benefits, capacity utilization, and environmental performance: the expected revenues of each energy entity, particularly the per-unit-capacity revenue of PHS, increase significantly; installed capacities are better allocated; and CO2, SO2, and CO emissions are substantially reduced. This is because the cooperative game not only achieves the same overall optimality as centralized optimization but also enables a fairer allocation of individual benefits.

6. Conclusions and Prospects

6.1. Conclusions

With the large-scale integration of renewable energy sources such as wind, photovoltaic, and hydropower, power generation entities have become increasingly diverse, making the traditional capacity configuration rules for conventional energy systems no longer applicable. Considering the complex interests of generation entities and the diversified development of the electricity market, this paper proposes a game theory-based bi-level capacity optimization model for multi-agent power generation systems. The main conclusions are as follows:
  • Independent power supply from wind, photovoltaic, or pumped-storage hydropower stations alone is not economically viable. The penalty for insufficient system power supply is the main factor restricting the standalone generation of wind and photovoltaic power. Under non-cooperative games, the benefits of pumped-storage hydropower stations are far less than those of other power supply subsystems in the system, mainly because the contribution of pumped-storage hydropower stations to system stability is ignored in non-cooperative game modes.
  • By comparing the results of 15 different alliances under the cooperative game mode, it is found that the wind–solar–thermal alliance outperforms the wind–solar–storage alliance. Photovoltaic power stations rely more on the regulation capacity of energy storage than wind power stations. The joint grid connection of wind and photovoltaic power helps reduce system voltage deviation and enhance power supply stability. The introduction of pumped-storage hydropower stations reduces the system’s dependence on thermal power generation, significantly reduces pollution emissions, and improves stability. The participation of pumped-storage hydropower stations enhances the efficient utilization of renewable energy and the economic benefits of the system. When the alliance consists of {wind power, photovoltaic, pumped-storage hydropower, thermal power}, the system achieves the highest power supply stability, the lowest carbon emissions (30,195.29 t), and the highest renewable energy utilization rate, with a renewable energy to pumped-storage capacity ratio of 12.875:1 and a renewable energy penetration rate of 53.93%. When this ratio exceeds 12.875:1, further increasing the installed capacity of renewable energy will lead to reduced system benefits and wasted renewable energy.
  • Comparing the cooperative and non-cooperative game modes in the combined power generation system, the benefits per unit capacity of wind power, photovoltaic power, pumped-storage hydropower stations, and thermal power under the cooperative game mode are CNY 0.111 million/kW, CNY 0.018 million/kW, CNY 1.161 million/kW, and CNY 0.047 million/kW higher than those under the non-cooperative game mode, respectively. Additionally, the renewable energy utilization rate increases by 4.33%. In terms of pollutant emissions, CO2 emissions decrease by 5505.95 tons, SO2 emissions by 0.82 tons, and CO emissions by 3.98 tons. In terms of system stability, the total system voltage deviation is reduced by 5.51.

6.2. Prospect

This paper establishes a multi-agent capacity configuration and optimization method based on game theory, which provides certain theoretical guidance and practical reference for the capacity configuration and operation of joint power generation systems involving multiple agents. However, due to constraints on research time and experimental conditions, this paper still has several limitations and unresolved issues, specifically as follows:
  • In the current model, the site selection of renewable energy is mostly based on the macro-zoning of resource endowments and does not elaborate on the micro-level transient weather characteristics—such as the impact of local strong winds and heavy rains on site selection. Meanwhile, since the research focuses on the collaborative optimization of the energy supply side, it has not yet involved surveys on the acceptance of end-users toward receiving facilities such as substations and transmission lines. Future research can introduce refined weather datasets and establish a correlation model between weather risks and site selection costs.
  • This study addresses the uncertainty of wind power and photovoltaic power using measured historical data on wind speed and solar irradiance, but the data used does not incorporate the uncertainty in wind power generation that may be caused by wind turbine wake effects. Future research can introduce a wake effect model, integrate measured and simulated data, and consider the impact of wakes on the uncertainty of wind power generation in the planning and operation of joint operation systems. This will provide better guidance for the rational planning and grid-connected operation of renewable energy.

Author Contributions

Conceptualization, Z.C.; Data curation, Z.C. and Y.H.; Funding acquisition, Z.C.; Methodology, Y.D.; Project administration, Z.C.; Software, Y.H. and Y.D.; Writing—original draft, Y.H. and Y.D.; Writing—review and editing, Z.C., Y.D. and Z.N. All authors have read and agreed to the published version of the manuscript.

Funding

This paper was supported by the Open Fund Project of Hubei Provincial Key Laboratory for Operation and Control of Cascaded Hydropower Station, China Three Gorges University (No. 2024KJX06).

Data Availability Statement

Some or all data, models, or codes that support the findings of this study are available from the corresponding author upon reasonable request.

Conflicts of Interest

The authors declare that they have no known competing financial interests or personal relationships that could have appeared to influence the work reported in this paper.

Abbreviations

The following abbreviations are used in this manuscript:
PVPhotovoltaic
WTWind turbine
PSHPumped hydro storage
TPSThermal power station
LHSLatin Hypercube Sampling
SBRScenario-Based Reduction
SOCState of Charge

Appendix A

Theorem A1 ([16]).
If, in a game model, each participant’s decision space is a nonempty compact convex subset of a Euclidean space, and each player’s utility function is continuous and quasi-convex (upper-convex), then a Nash equilibrium exists in this game model.
Theorem A2 ([41]).
The existence and uniqueness of a Nash equilibrium in a game model must satisfy the following conditions: (1) For each participant,  i , given the strategies,  S j ( j i ) , of the other participants,  S i  is the optimal strategy of  i . (2) For each participant,  i , there is no incentive to unilaterally deviate from their own strategy,  S i .
Proof A1.
Obviously, the strategy set S = S w t , S p v , S p h s , S t p s is a nonempty compact convex set, which satisfies Theorem 1. □
Proof A2.
(1)
Take the wind power system as an example:
Given the wind speed, the wind power output is a linear function of the installed capacity.
P t , s , WT = α t , s E w t
The utility function, u w t , is expressed as
u w t = I e , w t C i n v , w t C o m , w t C q , w t   = s S t = 0 T P s P t , s , w t C t E w t k w t l l + 1 n ( l + 1 ) n 1 365   s = 0 S t = 0 T P t , s , w t σ w t P s s = 1 S t = 1 T i = 1 N ( P t , s , w t 0 - P t , s , w t ) C t P s   = s S t = 0 T P s α t , s C t k w t l l + 1 n ( l + 1 ) n 1 365 s = 0 S t = 0 T α t , s σ w t P s s   + s = 1 S t = 1 T i = 1 N α t , s C t P E w t s = 1 S t = 1 T i = 1 N P t , s , w t 0 C t P s   = K w t E w t M
where K w t and M are constants. It can be seen from Equation (A2) that u w t is a continuous, monotonic, convex function and that a unique optimal solution exists.
Similarly, it can be shown that u p v and u p h s are continuous, monotonic, convex functions.
(2)
Thermal power system:
The output power of a thermal power plant is a linear function of its capacity:
P t , s , TPS = β t , s E t p s
u t p s = I e , t p s C i n v , t p s C o m , t p s C e n , t p s C t p s   = s S t = 0 T P s P t , s , t p s C t E t p s k t p s l l + 1 n ( l + 1 ) n 1 365   s = 0 S t = 0 T P t , s , t p s θ t p s P s s = 1 S t = 1 24 ( c + b P t , s , t p s + a ( P t , s , t p s ) 2 ) P s   = s S t = 0 T P s β t , s E t p s C t E t p s k t p s l l + 1 n ( l + 1 ) n 1 365   s = 0 S t = 0 T β t , s E t p s θ t p s P s s = 1 S t = 1 24 ( c + b β t , s E t p s + a ( β t , s E t p s ) 2 ) P s
u tps E tps = s = 0 S t = 0 T P s β t , s C t k tps l ( l + 1 ) n ( l + 1 ) n 1 365 s = 0 S t = 0 T β t , s θ tps P s s = 1 S t = 1 24 b β t , s + 2 a β t , s 2 E tps
2 u tps E tps 2 = s = 1 S t = 1 24 2 a β t , s 2 P s
It can be seen from the second-order partial derivatives that their values are always less than 0. Therefore, the Hessian matrix is negative-definite, which implies that the optimal capacity configuration for the thermal power plant exists and is unique. Hence, Proof 2 satisfies Theorem 2. □

References

  1. Li, X.L.; Zhu, X.N.; Li, X.G.; Zhao, X.T.; Wei, G.L.; Gao, W.H.; Nie, C.C.; Yan, S.; Ge, L.H.; Wang, Z.Y. Recent advances in the extraction of critical metals from spent lithium-ion batteries: Challenges and solutions—A review. Sep. Purif. Technol. 2025, 376, 134070. [Google Scholar] [CrossRef]
  2. Cui, R.Y.; Hultman, N.; Cui, D.; McJeon, H.; Yu, S.; Edwards, M.R.; Sen, A.; Song, K.; Bowman, C.; Clarke, L.; et al. A plant-by-plant strategy for high-ambition coal power phaseout in China. Nat. Commun. 2021, 12, 1468. [Google Scholar] [CrossRef]
  3. Li, C.; Shah, N.; Li, Z.; Liu, P. Modelling of wind and solar power output uncertainty in power systems based on historical data: A characterisation through deterministic parameters. J. Clean. Prod. 2024, 484, 144233. [Google Scholar] [CrossRef]
  4. Javed, M.S.; Ma, T.; Jurasz, J.; Amin, M.Y. Solar and wind power generation systems with pumped hydro storage: Review and future perspectives. Renew. Energy 2020, 148, 176–192. [Google Scholar] [CrossRef]
  5. Liu, J.; He, D. Profit Allocation of Hybrid Power System Planning in Energy Internet: A Cooperative Game Study. Sustainability 2018, 10, 388. [Google Scholar] [CrossRef]
  6. Fu, H.; Shi, M.; Feng, M. Capacity optimization strategy for energy storage system to ensure power supply. Int. J. Low Carbon Technol. 2023, 18, 622–627. [Google Scholar] [CrossRef]
  7. Li, J.; Zhang, Z.; Shen, B.; Gao, Z.; Ma, D.; Yue, P.; Pan, J. The capacity allocation method of photovoltaic and energy storage hybrid system considering the whole life cycle. J. Clean. Prod. 2020, 275, 122902. [Google Scholar] [CrossRef]
  8. Xue, Y.; Zhang, C.; Jiang, F.; Dou, W.; Zhang, H.; Yang, C. Optimal capacity allocation method of integrated energy system considering renewable energy uncertainty. Front. Energy Res. 2022, 10, 1016756. [Google Scholar] [CrossRef]
  9. Yang, H.; Yu, Q.; Liu, J.; Jia, Y.; Yang, G.; Ackom, E.; Dong, Z.Y. Optimal Wind-Solar Capacity Allocation With Coordination of Dynamic Regulation of Hydropower and Energy Intensive Controllable Load. IEEE Access 2020, 8, 110129–110139. [Google Scholar] [CrossRef]
  10. Chen, L.; Wang, C.; Wu, Z. Reinforcement Learning-Based Time of Use Pricing Design Toward Distributed Energy Integration in Low Carbon Power System. IEEE Trans. Netw. Sci. Eng. 2025, 12, 997–1010. [Google Scholar] [CrossRef]
  11. Chen, Z.; Wu, Z.; Wei, L.; Yang, L.; Yuan, B.; Zhou, M. Understanding the synergy of energy storage and renewables in decarbonization via random forest-based explainable AI. Appl. Energy 2025, 390, 125891. [Google Scholar] [CrossRef]
  12. Si, Y.; Chen, L.; Zhang, X.; Chen, X.; Mei, S. Capacity Allocation of Hybrid Power System with Hot Dry Rock Geothermal Energy, Thermal Storage, and PV Based on Game Approaches. J. Mod. Power Syst. Clean. Energy 2023, 11, 290–301. [Google Scholar] [CrossRef]
  13. Zenginis, I.; Vardakas, J.S.; Echave, C.; Morató, M.; Abadal, J.; Verikoukis, C.V. Cooperation in microgrids through power exchange: An optimal sizing and operation approach. Appl. Energy 2017, 203, 972–981. [Google Scholar] [CrossRef]
  14. Chen, C.; Liu, C.; Ma, L.; Chen, T.; Wei, Y.; Qiu, W.; Lin, Z.; Li, Z. Cooperative-game-based joint planning and cost allocation for multiple park-level integrated energy systems with shared energy storage. J. Energy Storage 2023, 73, 108861. [Google Scholar] [CrossRef]
  15. Xie, J.; Zhang, L.; Chen, X.; Zhan, Y.; Zhou, L. Incremental Benefit Allocation for Joint Operation of Multi-Stakeholder Wind-PV-Hydro Complementary Generation System With Cascade Hydro-Power: An Aumann-Shapley Value Method. IEEE Access 2020, 8, 68668–68681. [Google Scholar] [CrossRef]
  16. Wang, H.; Zhang, C.; Li, K.; Ma, X. Game theory-based multi-agent capacity optimization for integrated energy systems with compressed air energy storage. Energy 2021, 221, 119777. [Google Scholar] [CrossRef]
  17. Li, Y.; Ling, F.; Qiao, X.; Zhong, J.; Zhao, X.; Li, C.; Liu, J.; Xing, X.; Yang, K.; Lan, W. Mixed Game-Based Two-Stage Planning of PV and Energy Storage in Distribution System with Multiple Integrated Energy Microgrids. IEEE Trans. Ind. Appl. 2024, 60, 8054–8066. [Google Scholar] [CrossRef]
  18. Dai, B.; Wang, H.; Li, B.; Li, C.; Tan, Z. Capacity model and optimal scheduling strategy of multi-microgrid based on shared energy storage. Energy 2024, 306, 132472. [Google Scholar] [CrossRef]
  19. Wu, W.; Li, Y.; Wang, S.; Wang, Z.; Zhou, S.; Zhang, Y.; Zheng, M. Coordinated Planning for Multiarea Wind-Solar-Energy Storage Systems That Considers Multiple Uncertainties. Energies 2024, 17, 5242. [Google Scholar] [CrossRef]
  20. Zheng, F.; Meng, X.; Wang, L.; Zhang, N. Operation Optimization Method of Distribution Network with Wind Turbine and Photovoltaic Considering Clustering and Energy Storage. Sustainability 2023, 15, 2184. [Google Scholar] [CrossRef]
  21. Ali, A.; Abbas, G.; Keerio, M.U.; Touti, E.; Ahmed, Z.; Alsalman, O.; Kim, Y.S. A Bi-Level Techno-Economic Optimal Reactive Power Dispatch Considering Wind and Solar Power Integration. IEEE Access 2023, 11, 62799–62819. [Google Scholar] [CrossRef]
  22. Xie, J.; Duan, J. Firm generation capacity allocation strategy of wind-solar-hydro complementary generation system based on cooperative game. Autom. Electr. Power Syst. 2023, 47, 79–88. (In Chinese) [Google Scholar]
  23. Xu, B.; Zhu, F.; Zhong, P.; Chen, J.; Liu, W.; Ma, Y.; Guo, L.; Deng, X. Identifying long-term effects of using hydropower to complement wind power uncertainty through stochastic programming. Appl. Energy 2019, 253, 113535. [Google Scholar] [CrossRef]
  24. Khan, N.A.; Awan, A.B.; Mahmood, A.; Razzaq, S.; Zafar, A.; Sidhu, G.A.S. Combined emission economic dispatch of power system including solar photo voltaic generation. Energy Convers. Manag. 2015, 92, 82–91. [Google Scholar] [CrossRef]
  25. Li, Q.; Zhang, Y.; Cheng, F.; Yao, L.; Xu, Y.; Liang, S.; Liu, W.; Li, Z. Generation expansion planning for Guizhou province based on the complementary characteristics of wind and solar. Energy Rep. 2022, 8, 574–584. [Google Scholar] [CrossRef]
  26. Zang, P.; Sun, G.; Zhao, Y.; Luo, Y.; Yuan, X. Stochastic optimization based on a novel scenario generation method for midstream and downstream petrochemical supply chain. Chin. J. Chem. Eng. 2020, 28, 815–823. [Google Scholar] [CrossRef]
  27. Kumar, L.; Khedlekar, U.K. Stochastic optimization of thermal energy storage for multi-energy systems with hydrogen and renewable integration: A scenario-based cost minimization model for dispatch, emissions, and cross-sector energy utilization. J. Energy Storage 2025, 132, 117830. [Google Scholar] [CrossRef]
  28. Liu, Y.; Nair, N.K.C. A Two-Stage Stochastic Dynamic Economic Dispatch Model Considering Wind Uncertainty. IEEE Trans. Sustain. Energy 2016, 7, 819–829. [Google Scholar] [CrossRef]
  29. Kim, M.; Park, T.; Jeong, J.; Kim, H. Stochastic optimization of home energy management system using clustered quantile scenario reduction. Appl. Energy 2023, 349, 121555. [Google Scholar] [CrossRef]
  30. Zhou, R.; Chen, S.; Han, Y.; Liu, Q.; Chen, Z.; Hu, W. Probabilistic spatiotemporal scenario generation method for dynamic optimal power flow in distribution networks. Int. J. Electr. Power Energy Syst. 2024, 155, 109667. [Google Scholar] [CrossRef]
  31. Xie, Y.; Huo, Z.; Wu, C.; Yao, W.; Wang, J.; Qiao, Y. Improved Backward Scenario Reduction Method for Generation Planning Considering Extreme Scenarios. In Proceedings of the IEEE 7th Conference on Energy Internet and Energy System Integration (EI2), Hangzhou, China, 15–18 December 2023; pp. 499–504. [Google Scholar] [CrossRef]
  32. Khan, I.K.; Daud, H.B.; Zainuddin, N.B.; Sokkalingam, R.; Naheed, N.; Janisar, A.A.; Inayat, A.; Rana, M.S. Standardization of expected value in gap statistic using Gaussian distribution for optimal number of clusters selection in K-means. Egypt. Inform. J. 2025, 30, 100701. [Google Scholar] [CrossRef]
  33. Bai, B.; Han, M.; Lin, J.; Sun, W. Scenario reduction method of renewable energy including wind power and photovoltaic. Power Syst. Prot. Control 2021, 15, 141–149. (In Chinese) [Google Scholar]
  34. Chen, X.; Dai, P.; Zhong, H.; Li, X.; Li, W. Photovoltaic typical output scenario clustering method considering comprehensive similarity measurement. Proc. CSEE 2024, 21, 8462–8474. (In Chinese) [Google Scholar]
  35. Myerson, R.B. John Nash’s Contribution to Economics. Games Econ. Behav. 1996, 14, 287–295. [Google Scholar] [CrossRef]
  36. Kang, K.; Zhang, Y.; Cheng, S.; Lu, X.; Tu, Z. Sensitivity analysis of renewable energy coupled hydrogen system to government reward and punishment policies based on multi-agent Nash equilibrium. Int. J. Hydrogen Energy 2025, 145, 862–881. [Google Scholar] [CrossRef]
  37. Yang, D.; Zhang, R.; Liu, C.; Bian, G. The Study of Long-Term Trading Revenue Distribution Models in Wind-Photovoltaic-Thermal Complementary Systems Based on the Improved Shapley Value Method. Energy Eng. 2025, 122, 2673–2694. [Google Scholar] [CrossRef]
  38. Baran, M.E.; Wu, F.F. Network reconfiguration in distribution systems for loss reduction and load balancing. IEEE Trans. Power Deliv. 1989, 4, 1401–1407. [Google Scholar] [CrossRef]
  39. Lin, C.H.; Chen, S.J.; Kuo, C.L.; Chen, J.L. Non-Cooperative Game Model Applied to an Advanced Metering Infrastructure for Non-Technical Loss Screening in Micro-Distribution Systems. IEEE Trans. Smart Grid 2014, 5, 2468–2469. [Google Scholar] [CrossRef]
  40. Feng, L.; Zhang, Y.; Wei, X.; Wang, M.; Niu, Z.; Wang, C. Interpretable prediction of coagulant dosage in drinking water treatment plant based on automated machine learning and SHAP method. J. Water Process Eng. 2025, 75, 107925. [Google Scholar] [CrossRef]
  41. Chouikhi, S.; Merghem-Boulahia, L.; Esseghir, M.; Snoussi, H. A Game-Theoretic Multi-Level Energy Demand Management for Smart Buildings. IEEE Trans. Smart Grid 2019, 10, 6768–6781. [Google Scholar] [CrossRef]
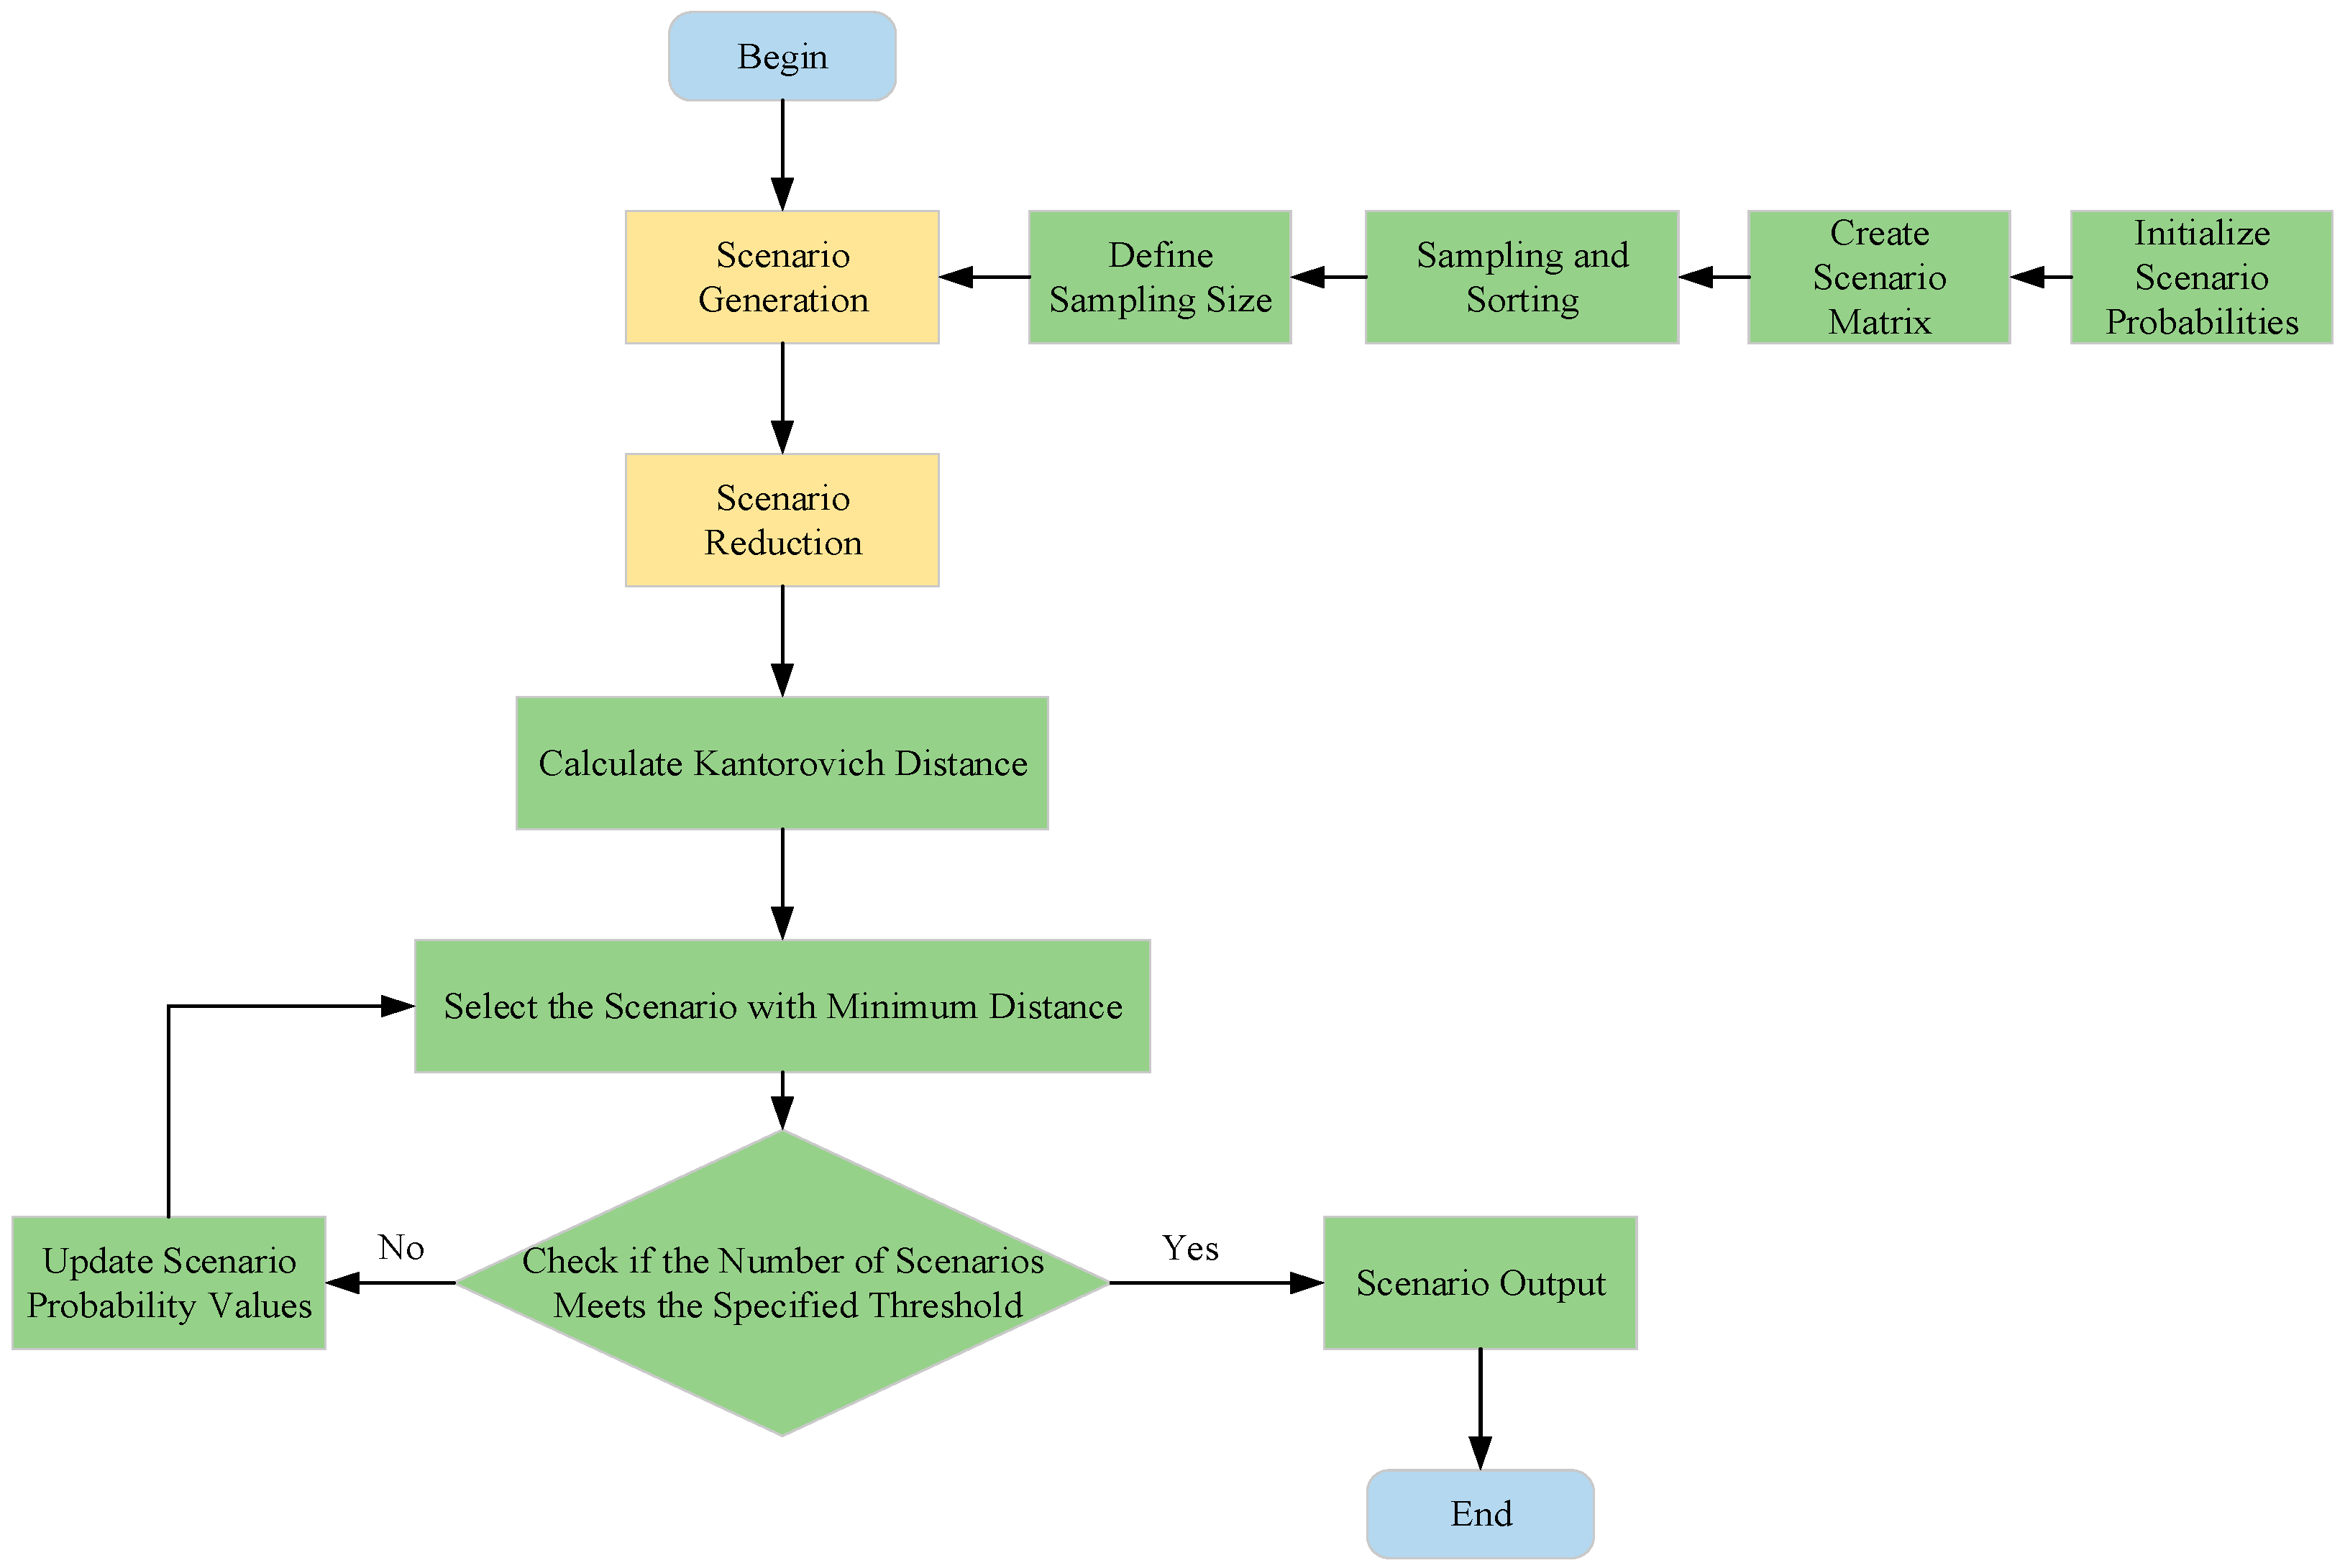
Figure 1. Flowchart of wind–PV output scenario generation and reduction.
Energies 18 05338 g001
Figure 2. Framework of the bi-level optimization model.
Energies 18 05338 g002
Figure 3. Topological diagram of IEEE 33-bus network.
Energies 18 05338 g003
Figure 4. Typical daily load curve.
Energies 18 05338 g004
Figure 5. Iteration process diagram.
Energies 18 05338 g005
Figure 6. Wind speed and irradiance data diagram.
Energies 18 05338 g006
Figure 7. Scenario reduction results for SBR algorithm based on Kantorovich distance.
Energies 18 05338 g007
Figure 8. Analysis of clustering validity indices.
Energies 18 05338 g008
Figure 9. Utility function curve of energy supply subsystem.
Energies 18 05338 g009
Figure 10. State diagrams of pumped-storage hydropower under different alliances.
Energies 18 05338 g010
Figure 11. Analysis of economic benefits under different game modes.
Energies 18 05338 g011
Figure 12. Analysis of pollutant emissions under different game modes.
Energies 18 05338 g012
Figure 13. Voltage deviations under different game modes.
Energies 18 05338 g013
Figure 14. Outputs of thermal power and pumped-storage under different game modes.
Energies 18 05338 g014
Figure 15. Impact of discount rate variation on the capacity optimization structure under the cooperative game.
Energies 18 05338 g015
Table 1. Comparison of the relevant literature and the proposed model.
Ref.WTPVESTPSBi-Level Optimal ModelGame
Theory
Uncertainties Considered
[6]××××
[7]×××××
[8]×××
[9]××
[10]×××××
[11]××××
[13]××××
[15]×××
[16]××××
[17]×××
[22]××
This paper
Table 2. Composition of utility functions for each energy supply subsystem.
Energy Supply SubsystemCost Within a Scheduling Cycle
C i n v , i C o m , i C e n , i C t p s C q , i I e , i
Wind Power Generation
Photovoltaic Generation
Pumped-Storage Power Generation
Thermal Power Generation
Table 3. Basic parameters of each piece of equipment.
TermInstalled Capacity RangeUnit Capacity Investment Cost (CNY/kW)Service Life (Year)Operation and Maintenance Cost (CNY/kW)Charge–Discharge Efficiency
Wind Power Generation[90 kW, 6000 kW]5000250.100
Photovoltaic Generation[90 kW, 6000 kW]3500250.100
Pumped-Storage Power Generation[200 kW, 1200 kW]6700500.0500.85
Thermal Power Generation[2000 kW 4000 kW]3600400.050
Table 4. Probabilities of reduced scenarios.
ScenarioProbability
Scenario 10.3135
Scenario 20.2179
Scenario 30.2653
Scenario 40.2033
Table 5. Comparison of optimization results before and after scenario reduction.
Scenario SetTermExpected Revenue (104 CNY)Installed Capacity (kW)Renewable Energy Utilization Rate (%)Times (s)
Reduced scenario setWind Power Generation1005.83270094.6656.32
Photovoltaic Generation656.70300091.77
Pumped-Storage Power Generation173.84600
Thermal Power Generation1808.454000
Original scenario setWind Power Generation1001.73270093.52201.62
Photovoltaic Generation649.45300092.32
Pumped-Storage Power Generation178.35600
Thermal Power Generation1815.524000
Table 6. Performance comparison of different scenario reduction algorithms.
Algorithm S SSE S CH Times (s)
Traditional K-means algorithm225.130.68110.54
SBR algorithm147.622.95256.32
Table 7. Results of non-cooperative game.
TermExpected Revenue (104 CNY)Revenue per Unit Capacity (104 CNY/
kW)
Siting NodeInstalled Capacity (kW)Renewable Energy Utilization Rate (%)Total Voltage Deviation of Network Nodes (pu)Proportion of Renewable Energy Installed Capacity (%)Proportion of Pumped-
Storage Hydropower (%)
Wind Power Generation1005.830.3725{24}270094.6618.4354.826.15
Photovoltaic Generation656.700.2189{7}300091.77
Pumped-Storage Power Generation173.840.2897{4}600
Thermal Power Generation1808.450.4521{1}4000
Table 8. Marginal contributions of participants in different alliances.
Sequence NumberAllianceRevenue Within Scheduling Period (104 CNY)Marginal Contribution
WTPVPHSTPS
1{WT}00
2{PV}0 0
3{PHS}0 0
4{TPS}1678.43 1678.43
5{WT, PV}1658.851658.851658.85
6{WT, PHS}1533.581533.58 1533.58
7{WT, TPS}2378.39699.96 2378.39
8{PV, PHS}896.57 896.57896.57
9{PV, TPS}2040.11 361.68 2040.11
10{PHS, TPS}2109.58 431.152109.58
11{WT, PV, PHS}2180.571284.00646.99521.72
12{WT, PV, TPS}3505.891465.781127.50 1847.04
13{WT, PHS, TPS}3361.661252.08 983.271828.08
14{PV, PHS, TPS}2599.57 489.99559.451703.00
15{WT, PV, PHS, TPS}4351.861752.29990.20845.972171.29
Table 9. Optimization results under different alliances.
Alliance Serial Number1112131415
Alliance Composition{WT, PV, PHS}{WT, PV, TPS}{WT, PHS, TPS}{PV, PHS, TPS}{WT, PV,
PHS, TPS}
Revenue within Scheduling Period
(CNY 10,000)
2180.573479.583361.662599.574037.86
Installed Capacity (kW)WT510022502700 2250
PV60003100 32002900
PHS1200 200600400
TPS 4000400040004000
Revenue per Unit Capacity (104 CNY/
kW)
WT0.18820.36220.3048 0.4834
PV0.10690.2245 0.13220.2371
PHS0.4824 2.94280.51301.4508
TPS 0.49870.48750.46720.4991
Wind Curtailment (kW) 13,520.103007.63105.583570.851018.92
Renewable Energy Utilization Rate (%) 83.9595.1196.1796.7897.52
Voltage Deviation (p.u.) 13.6018.4018.4217.4512.92
Pollutant Emissions (t)CO2/17,143.1749,425.7576,962.3430,195.29
SO2/2.587.4211.564.54
CO/12.3935.6955.5821.80
Table 10. Comparison of optimization results between non-cooperative game and cooperative game.
ModelNon-Cooperative GameCooperative Game
ParticipantWTPVPHSTPSWTPVPHSTPS
Installed Capacity (kW)270030006004000225029004003800
Revenue per Unit Capacity (104 CNY/kW)0.37250.21890.28970.45210.48340.23711.45080.4991
CO2 Emissions (t)35,701.2430,195.29
SO2 Emissions (t)5.364.54
CO Emissions (t)25.7821.80
Voltage Deviation (pu)18.4312.92
Thermal Power Volatility (%)52.6562.75
Renewable Energy Utilization Rate (%)93.618797.9521
Proportion of Pumped-Storage Installed Capacity (%)6.194.37
Ratio of Renewable Energy to Pumped-Storage9.5:112.875:1
Average Electricity Cost (CNY/kWh)0.3580.345
Payback Period (Years)12.310.8
Table 11. Performance comparison between the proposed bi-level optimization model and the traditional bi-level optimization model.
MethodTraditional Bi-Level Optimization
Model [9]
The Bi-Level Optimization Model Proposed in This Paper
ParticipantWTPVPHSTPSWTPVPHSTPS
Expected Revenue (104 CNY)922.83624.96149.521724.81087.65687.59580.321896.58
Installed Capacity (kW)285032006004000225029004003800
Revenue per Unit Capacity (104 CNY/kW)0.32380.19530.24920.43120.48340.23711.45080.4991
CO2 Emissions (t)39,235.3030,195.29
SO2 Emissions (t)5.894.54
CO Emissions (t)28.7821.80
Disclaimer/Publisher’s Note: The statements, opinions and data contained in all publications are solely those of the individual author(s) and contributor(s) and not of MDPI and/or the editor(s). MDPI and/or the editor(s) disclaim responsibility for any injury to people or property resulting from any ideas, methods, instructions or products referred to in the content.