Abstract
To address the issue of economic dispatch imbalance in virtual power plant (VPP) systems caused by the influence of operators and distribution networks, this study introduces an optimized economic dispatch method based on bi-level game theory. Firstly, a bi-level game model is formulated, which integrates the operational and environmental expenses of VPPs with the revenues of system operators. To avoid local optima during the search process, an enhanced reinforcement learning algorithm is developed to achieve rapid convergence and obtain the optimal solution. Finally, case analyses illustrate that the proposed method effectively accomplishes multi-objective optimization for various decision-making stakeholders, including VPP and system operators, while significantly reducing curtailment costs associated with the extensive integration of distributed renewable energy. Furthermore, the proposed algorithm achieves fast iteration and yields superior dispatch outcomes under the same modeling conditions.
1. Introduction
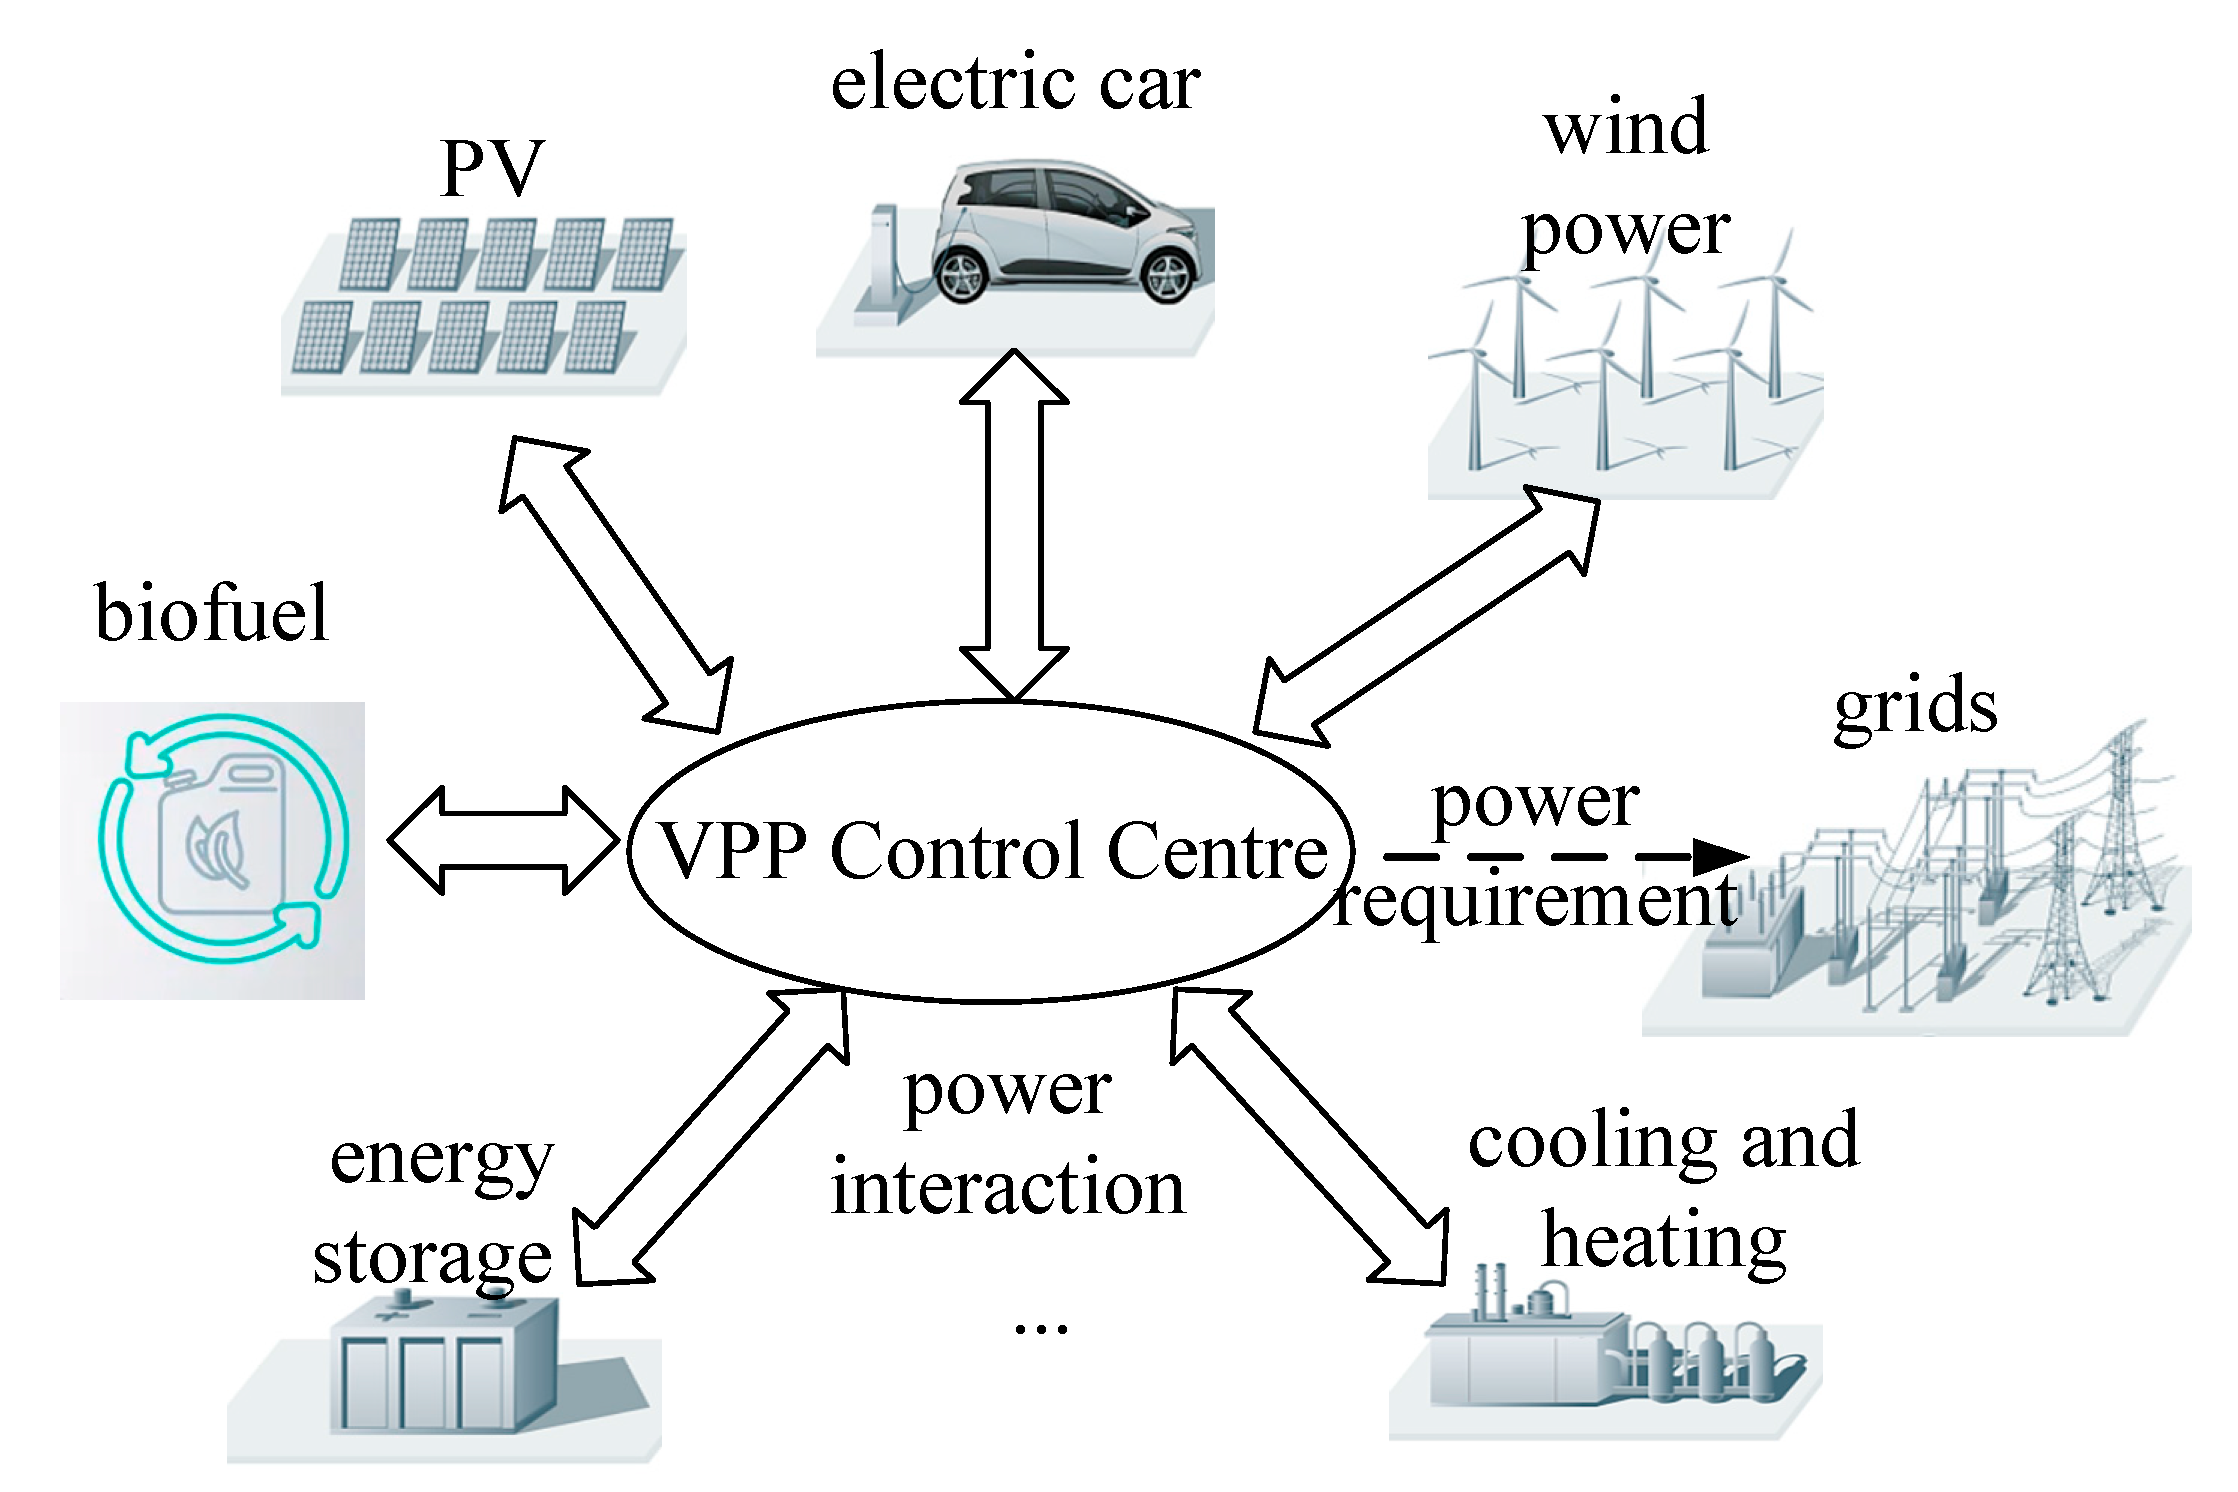
In order to achieve the “Dual Carbon” goal, distributed renewable energy sources, predominantly wind and solar power, have emerged as the dominant trends in the energy sector. However, the extensive integration of wind and solar energy into the power system introduces a degree of unpredictability and instability, which presents substantial challenges for the grid’s operations and reliability [1]. Virtual power plants (VPPs) are recognized as an innovative energy management paradigm that aggregate distributed energy resources into a cohesive system, including electric vehicles [2], renewable energy generation [3], and controllable loads [4]. This facilitates streamlined and coordinated resource dispatch, making virtual power plants a centerpiece of attention within the energy industry. For ease of understanding, Figure 1 illustrates the prototypical architecture of a virtual power plant, integrating diverse domains to constitute a holistic electricity trading marketplace. By leveraging optimized information sharing and energy supplementation among VPPs, a multitude of small-scale, diverse prosumers can be seamlessly integrated into a cohesive power system [5].
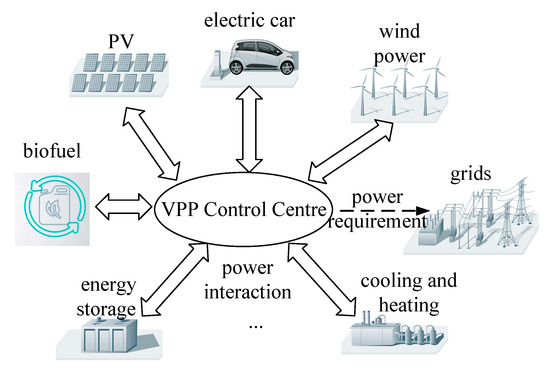
Figure 1.
Schematic diagram of VPP.
To enhance the incentives for resource aggregation within VPPs and maximize their comprehensive regulatory capabilities, it is essential to construct an advanced optimization scheduling model and precisely outline the corresponding objective functions
In VPP optimization scheduling models, it is usually established with a method that prioritizes economic and/or technical indicators [6]. For instance, Zhou et al. [7] implemented a “stimulus-feedback” control mechanism to achieve adaptive online load tracking control for VPPs. Lin et al. [8] applied a DRL-based algorithm to effectively learn the characteristics of generation units and the demands of industrial users, making selective decisions to reduce VPP operational costs. Yang et al. [9] introduced a cost allocation algorithm that simultaneously addressed post-network loss deviations. Generally speaking, economic indicators are generally considered more pivotal than technical indicators.
To refine the economic indicators, existing methods can typically be classified into linear programming, multi-objective programming, and multi-layer programming problems. Alahyari et al. [10] introduced uncertainty parameters related to electric vehicles and other sources of unpredictability, incorporating randomness into a linear programming framework. Wang et al. [11] constructed a multi-objective optimization scheduling model with the goal of maximizing VPP operational profits while minimizing system operating costs and the expenses associated with energy curtailment, thus addressing multiple decision objectives. Li et al. [12] proposed a bi-level optimization model, where the upper level focuses on optimizing inter-regional power dispatch and the lower level concentrates on intra-regional dispatch, thereby effectively reducing system operating costs and grid power demand.
In the dynamically evolving electricity market, it is imperative to examine the competitive or collaborative dynamics among VPPs and to understand how bidding strategies influence individual outcomes. Game theory is frequently employed to articulate the scheduling processes of VPP clusters. HOU et al. [13] introduced a cooperative game optimization method for multi-VPP coalitions under a carbon trading scheme, substantially enhancing the efficiency of distributed resource and energy utilization. To address the limitations of cooperative games, Li et al. [14] developed a Nash negotiation-based optimization model for multi-VPPs. Xu et al. [15] formulated non-cooperative game strategies by formulating two sub-problems focused on renewable energy systems (RESs) and thermal generators. Chen et al. [16] explored dynamic decision-making for heterogeneous prosumers through evolutionary game theory and devised pricing strategies for sellers based on Stackelberg games principles. However, economic dispatch is frequently bounded by multiple objective functions between VPPs and the Virtual Power Plant Operators, and the optimization strategies have not adequately addressed this issue.
In this work, a strategy to refine the economic dispatch method is proposed for VPPs within a bi-level gaming framework. The proposed approach is divided into two levels. The lower level concentrates on minimizing the operational expenses and environmental pollution costs associated with the virtual power plant. The upper level constructs a competitive market framework between the system operator (referred to as the Virtual Power Plant Operator, VPO) and the virtual power plant itself. By employing a two-level equilibrium solution strategy, the interests of both the VPO and the virtual power plant are maximized using an improved reinforcement learning algorithm. The main contributions are as follows:
- (1)
- Two-level structure to build the optimization methods for economic dispatch: the lower level focuses on the operational costs and environmental pollution costs of VPPs; the upper level establishes a game market framework between the VPO and the VPPs.
- (2)
- An improved reinforcement learning algorithm validates the feasibility of the proposed strategy.
The organization of this paper is as follows: in Section 2, the constraints and the associated objective function are introduced, and a bi-level game model and its architecture are described in Section 3. In Section 4, the experimental results are presented, and the performance of the proposed method is tested to demonstrate its effectiveness. Finally, conclusions are drawn in Section 5.
2. Virtual Power Plant and Its Objective Function
In this study, the VPP is composed of micro-resources such as wind turbines, photovoltaic panels, and energy storage batteries. These components collectively fulfill the electrical load requirement while also performing the power transmission functions of the VPP [17,18,19]. In the following sections, the constraints and the associated function will be discussed.
2.1. Constraints of VPP
2.1.1. Load Constraints
The total energy supply from a single VPP must meet the energy demand under the condition that the battery is in charging. The constraint must satisfy the following:
where t represents time, and the superscript i denotes the i-th VPP; , , and represent the wind power, photovoltaic power, and battery power within the i-th VPP, respectively; is the power demand, while and represent the power purchased from and sold to the VPO, which are the decision variables subject to optimization.
2.1.2. Energy Storage Constraints
To manage peak shaving, valley filling, and prolong battery life, the state of charge (SOC) of batteries must remain within a specified range, and is constrained by the following:
where and indicate the lower and upper bounds of the permissible SOC for the battery within the i-th VPP, respectively.
2.1.3. Power Exchange Constraints with VPO
To mitigate fluctuations stemming from excessive power transactions between the VPP and the system operator, the power purchase and sale, the purchase and sale and are bound by the following constraints:
where , , , and represent the lower and upper limits of the purchase and sale power for the i-th VPP.
2.2. Objective Functions of VPP
The optimization objectives of the VPP are centered on two primary facets: prioritizing the minimization of operational costs to guarantee economic viability and diminishing environmental costs to promote sustainable development [20].
2.2.1. VPP Operational Cost Model
The operational expenditure of the VPP encompasses costs associated with wind and photovoltaic maintenance, curtailment, and battery operations, which can be built as follows:
where NT represents the time horizon (e.g., NT = 24 for hourly intervals); μ1 and μ2 are the coefficients for the cost of wind and photovoltaic curtailment, respectively; λ1, λ2, and λ3 signify the operational expenses related to batteries, wind power, and photovoltaic systems. and represent the curtailed power from wind and photovoltaic sources, respectively, while and indicate the forecasted power output for wind and photovoltaic generation.
2.2.2. Environmental Pollution Cost Model
The environmental cost is primarily associated with electromagnetic contamination from power transmission lines and chemical seepage from batteries, and the objective function is built as follows:
where Wbat and Wb denote the cost factors for chemical leakage from batteries and for the management of purchased power, respectively.
3. Bi-Level Game Model and Its Design
3.1. Energy Trading Framework of the Bi-Level Game Model
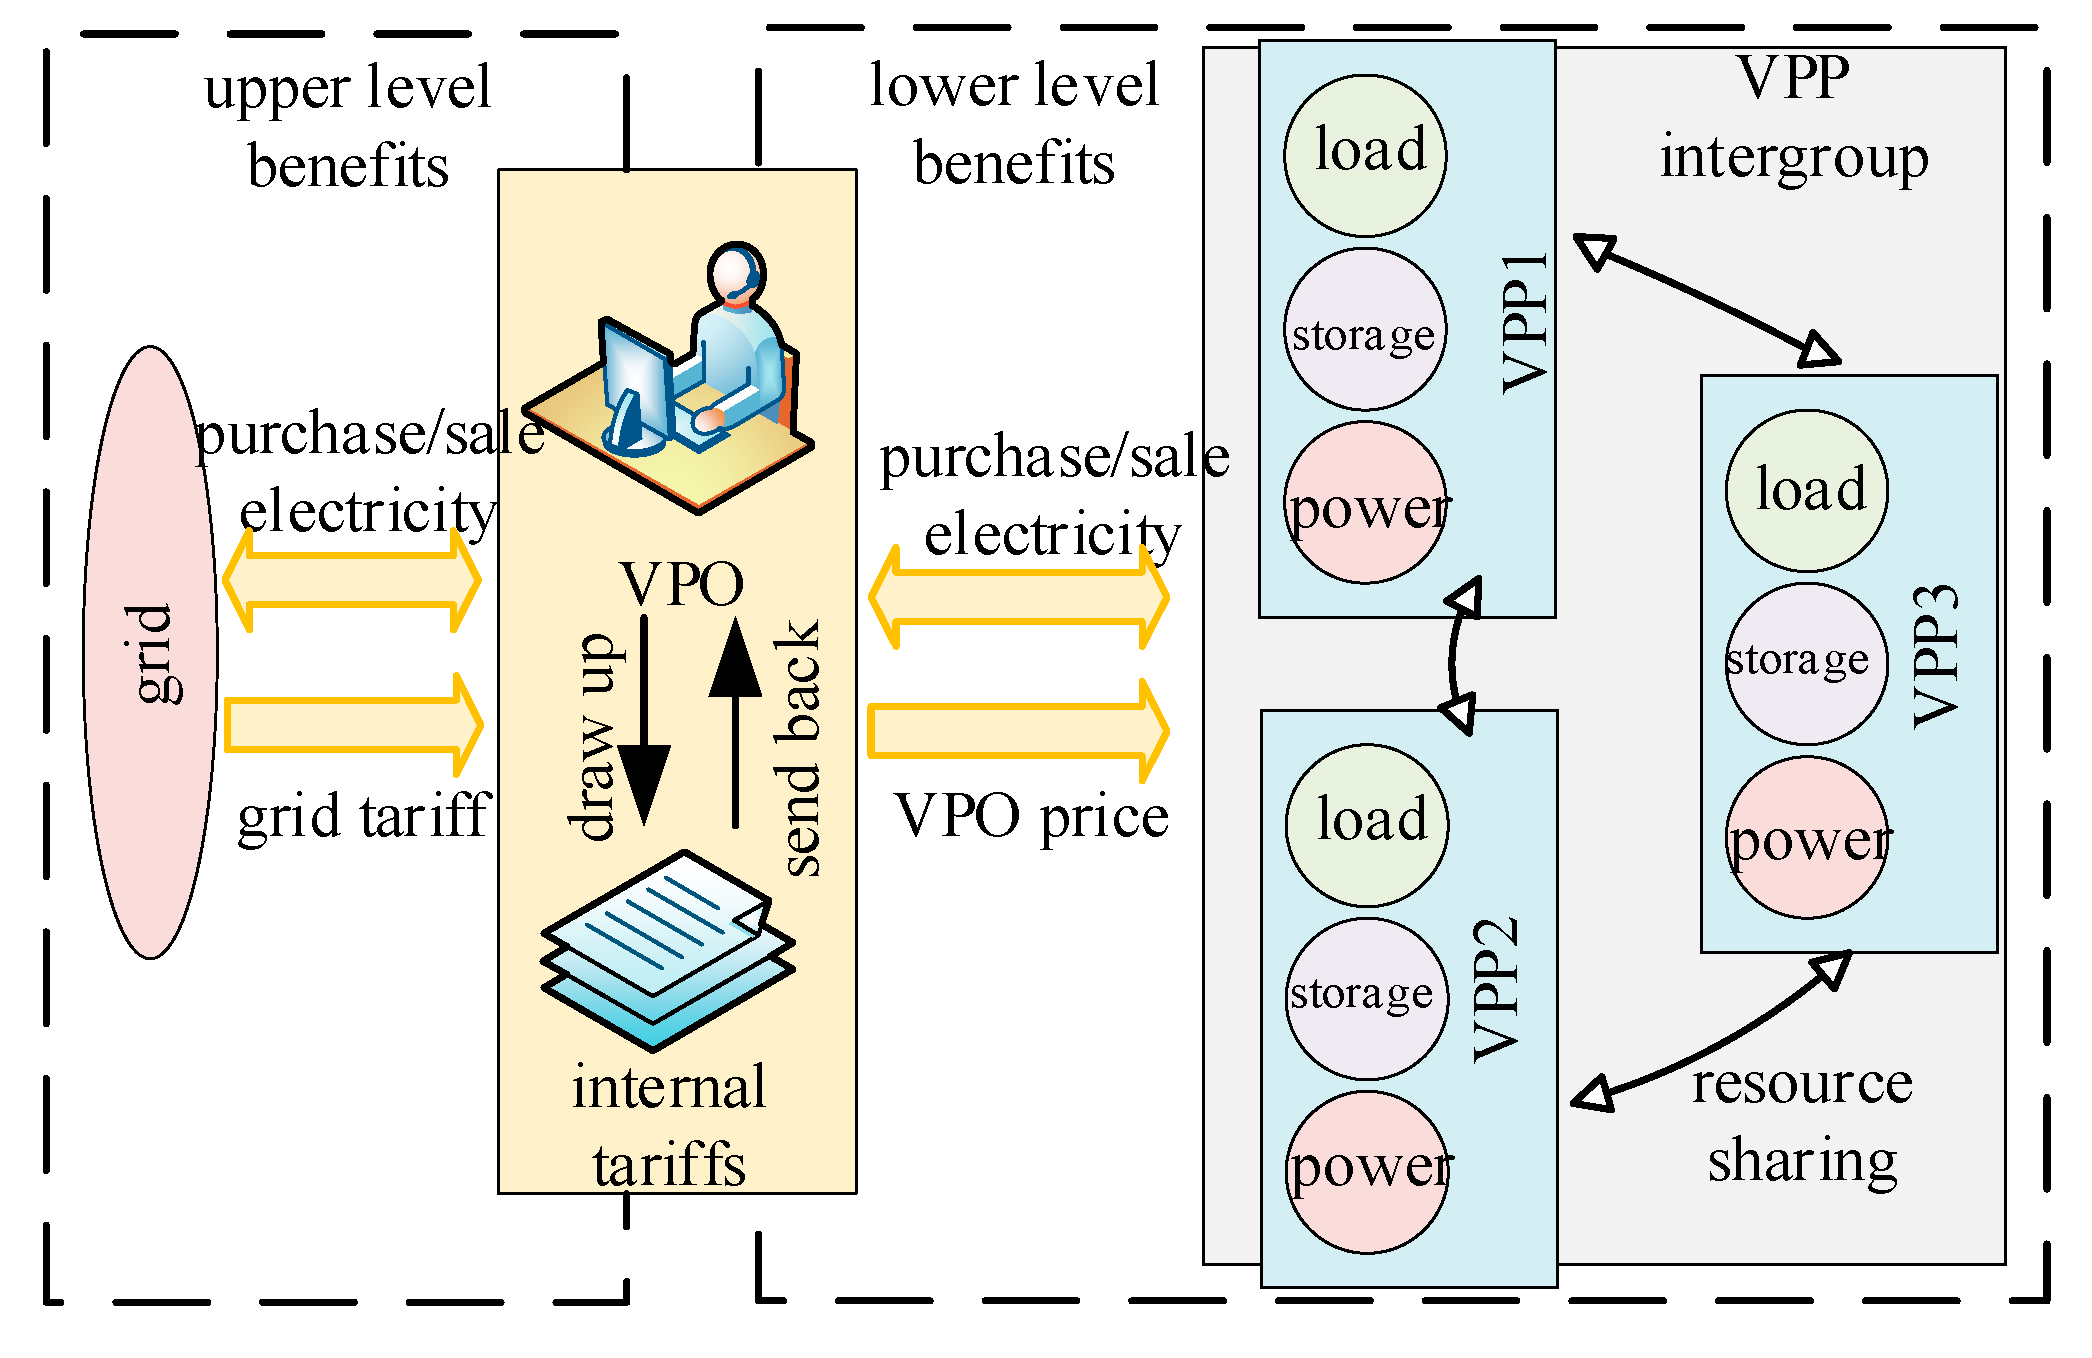
For the ease of description, Figure 2 illustrates the energy-sharing framework of the VPP, encompassing three principal entities: the VPPs, the VPO, and the distribution network. Within the VPO’s lower-level profit structure, VPPs can assume one of three statuses: energy surplus, deficit, or self-sufficiency. Energy trade is facilitated through either intragroup transactions among VPPs or through exchanges with the distribution network, all of which are orchestrated by the VPO. In the upper-level profit hierarchy, the VPO proactively participates in power trading with the distribution network, bolstering energy-sharing and interaction functionalities to amplify its revenue streams.
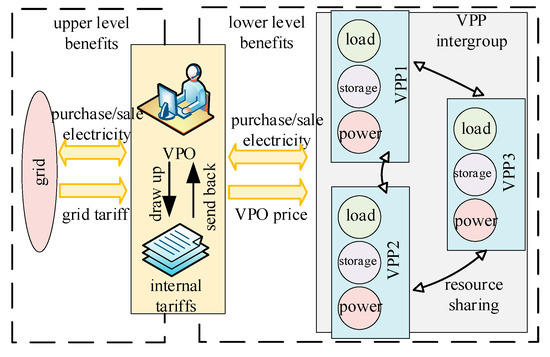
Figure 2.
Energy sharing system structure of VPP and VPO.
To optimize the collective benefits of both the VPPs and the VPO, i.e., minimizing the internal cost of the VPP and maximizing the VPO’s profit, the VPO must establish suitable internal pricing mechanisms that reflect daily consumer demand and the supply of distributed generation. The equilibrium solution of the bi-level game model is crafted to determine the optimal electricity pricing strategy.
3.2. Lower-Level Cost Model
The lower level of the model is dedicated to optimizing the costs of VPPs in response to the electricity price regulation set by the VPO. The cost associated with the i-th VPP can be formulated as follows:
Since the lower-level electricity price is governed by the VPO, the collective optimization of benefits for both the VPO and the VPPs is defined as follows:
where Cb(t) and Cs(t) represent the purchase and sale price of electricity by the VPO at time t.
3.3. Upper-Level Benefit Model
The upper level of the model concentrates on maximizing the VPO’s benefits in transactions with the distribution network and the VPPs. The VPO’s benefit model for electricity trading is delineated as follows:
where , , where I represents the total number of VPPs, and Cgridb(t) and Cgridb(t) represent the electricity purchase and sale prices of the distribution network at time t, respectively. These prices are established by national regulations and adhere to the condition where Cgridb < Cgrids. ΔE denotes the power exchange balance between the VPO and the distribution network, which must fulfill the following criterion:
where Pess(t) represents the charging/discharging power of the VPO’s energy storage device at time t.
3.4. Bilevel Game Model and Objective Functions
3.4.1. Bilevel Game Model
To facilitate the modeling of the interaction between VPPs and the VPO, the virtual power plant system is categorized into three states: Ib (number of VPPs purchasing electricity), Is (number of VPPs selling electricity), and Io (number of VPPs in power balance). These states satisfy the condition that Ib + Is + Io = I, where I is the total number of VPPs. To guarantee that the VPO derives benefits from electricity trading, a critical boundary condition is established such that IbIs ≠ 0. As a result, the collection of power transaction states can be expressed as PI = {Pbi, Psi, Poi}.
Both VPPs and the VPO strive to maximize their individual benefits while conforming to specified constraints and engaging in market transactions [21]. The designed game model can be expressed as follows:
3.4.2. Nash Equilibrium Model
To guarantee that the strategy combination selected by the VPO and the collective of the VPP ensemble is mutually optimal and yields balanced benefits, a Nash equilibrium solution is embraced. This equilibrium is defined as follows:
where Cb and Cs are the effective prices of purchasing and selling electricity, while and denote the prices for electricity purchase and sale given the chosen strategy set combination; signifies the strategy set for electricity procurement and sale by the virtual power plant within the Nash equilibrium framework; represents the power balance strategy of the distribution network at the Nash equilibrium, and refers to the strategy set for electricity purchase and sale for all other virtual power plants (excluding the i-th plant) under the equilibrium scenario.
In the context of the Nash equilibrium, no virtual power plant or system operator can enhance their benefits or decrease their costs through a unilateral alteration of their strategy set, while others remain unchanged.
3.5. Algorithm and Solution Process
In the work, to circumvent the issue of local optima and to ensure an effective global search, the classical Particle Swarm Optimization (PSO) algorithm is enhanced by integrating it with reinforcement learning techniques [21]. This integration serves to steer the population’s optimization and evolutionary process, thereby enhancing overall performance and adaptability, and is named as an Improved Reinforcement Learning Algorithm (IRLA).
3.5.1. Adjustment Factor
To preserve population diversity, an adjustment factor βd is incorporated, which facilitates the search and migration of particles.
where is the adjustment factor for particle k at iteration d; τ is the penalty factor; g(z) is the action factor, defined as follows:
Here, denotes the fitness value of particle k at iteration d; σ denotes a random value drawn from the standard normal distribution. If σ > 0, the adjustment factor used in the next search remains the same as the previous iteration; if σ < 0, a fresh adjustment factor is employed for the next search.
3.5.2. Particle Search
The particle population search follows the PSO framework. The current and global optimal fitness functions for the particles are calculated using Equation (11). The updates for the position and velocity of particle k are expressed as follows:
Here, d represents the iteration number; and denote the search velocity and the current position of particle k at iteration d, respectively; and represent the particle’s individual best and global best positions at iteration d, respectively; c1 and c2 are the acceleration coefficients that govern the particle’s individual and social learning processes, respectively; r1 and r2 are random factors within the interval [0,1]; is the inertia weight associated with particle k at iteration d.
To enhance the impact of the inertia weight on the search efficacy of the particle swarm, the weight values are fine-tuned to narrow the discrepancy between the predicted values and target solutions, and are defined as follows:
where represents the optimal target weight for the current iteration, which shares the same index as ; ρ is a random variable drawn from a uniform distribution within the range [0,1].
3.5.3. Particle Transfer
To facilitate a wider exploration of the search space with particles during the initial phase, and a more refined local search in subsequent stages, a non-uniform mutation operator is utilized to perturb the particles [22]. The formula for updating the position of particle k is given by the following:
where xmax and xmax represent the upper and lower bounds of the search space dimension, respectively; r is a random number in the interval [0,1]. The value of ∆(d,z) is defined as follows:
where T represents the maximum number of iterations, and α is a parameter that governs the level of uniformity in the mutation process.
3.5.4. Population Feedback
To enhance the optimization capability of the algorithm, a feedback mechanism is designed for the particles. This mechanism incorporates both current and local feedback to facilitate refined updates in velocity and position.
where κ1 and κ2 are two random variables drawn from a standard normal distribution; m represents particle m at the d-th iteration (distinct from particle k); and are the fitness value and velocity of particle m at iteration d, respectively; S(·) denotes the hyperbolic tangent (tanh) activation function; and represents the position of particle i within the historical population at generation d.
The algorithm flow is shown in Table 1. To circumvent local optima, particles employ the search strategy outlined in Equation (16) when the adjustment factor β ≥ 0.5; otherwise, they adopt the transition strategy outlined in Equation (18). Following each iteration, population feedback is executed to refine the velocity of the subsequent generation. Throughout the iterations, the fitness function pbest is utilized to adjust the “velocity” and “position” attributes, thereby attaining the optimal target value. This facilitates the optimal scheduling of the distributed renewable energy within the virtual power plant architecture.

Table 1.
IRLA flowchart.
4. Case Study
4.1. Basic Data
To validate the effectiveness of the proposed method, the analysis was conducted in the Matlab 2022b environment using the Yalmip toolbox with the CPLEX solver as an auxiliary tool. The simulated virtual power plant system encompasses three distinct virtual power plants, each consisting of wind power, PV systems, and energy storage (ES) for multi-objective demand response (DR). The total ES capacity for different VPPs, the inter-VPP power exchange limits per time period, and the battery capacity ranges are shown in Table 2.
Table 2.
The status of batteries.
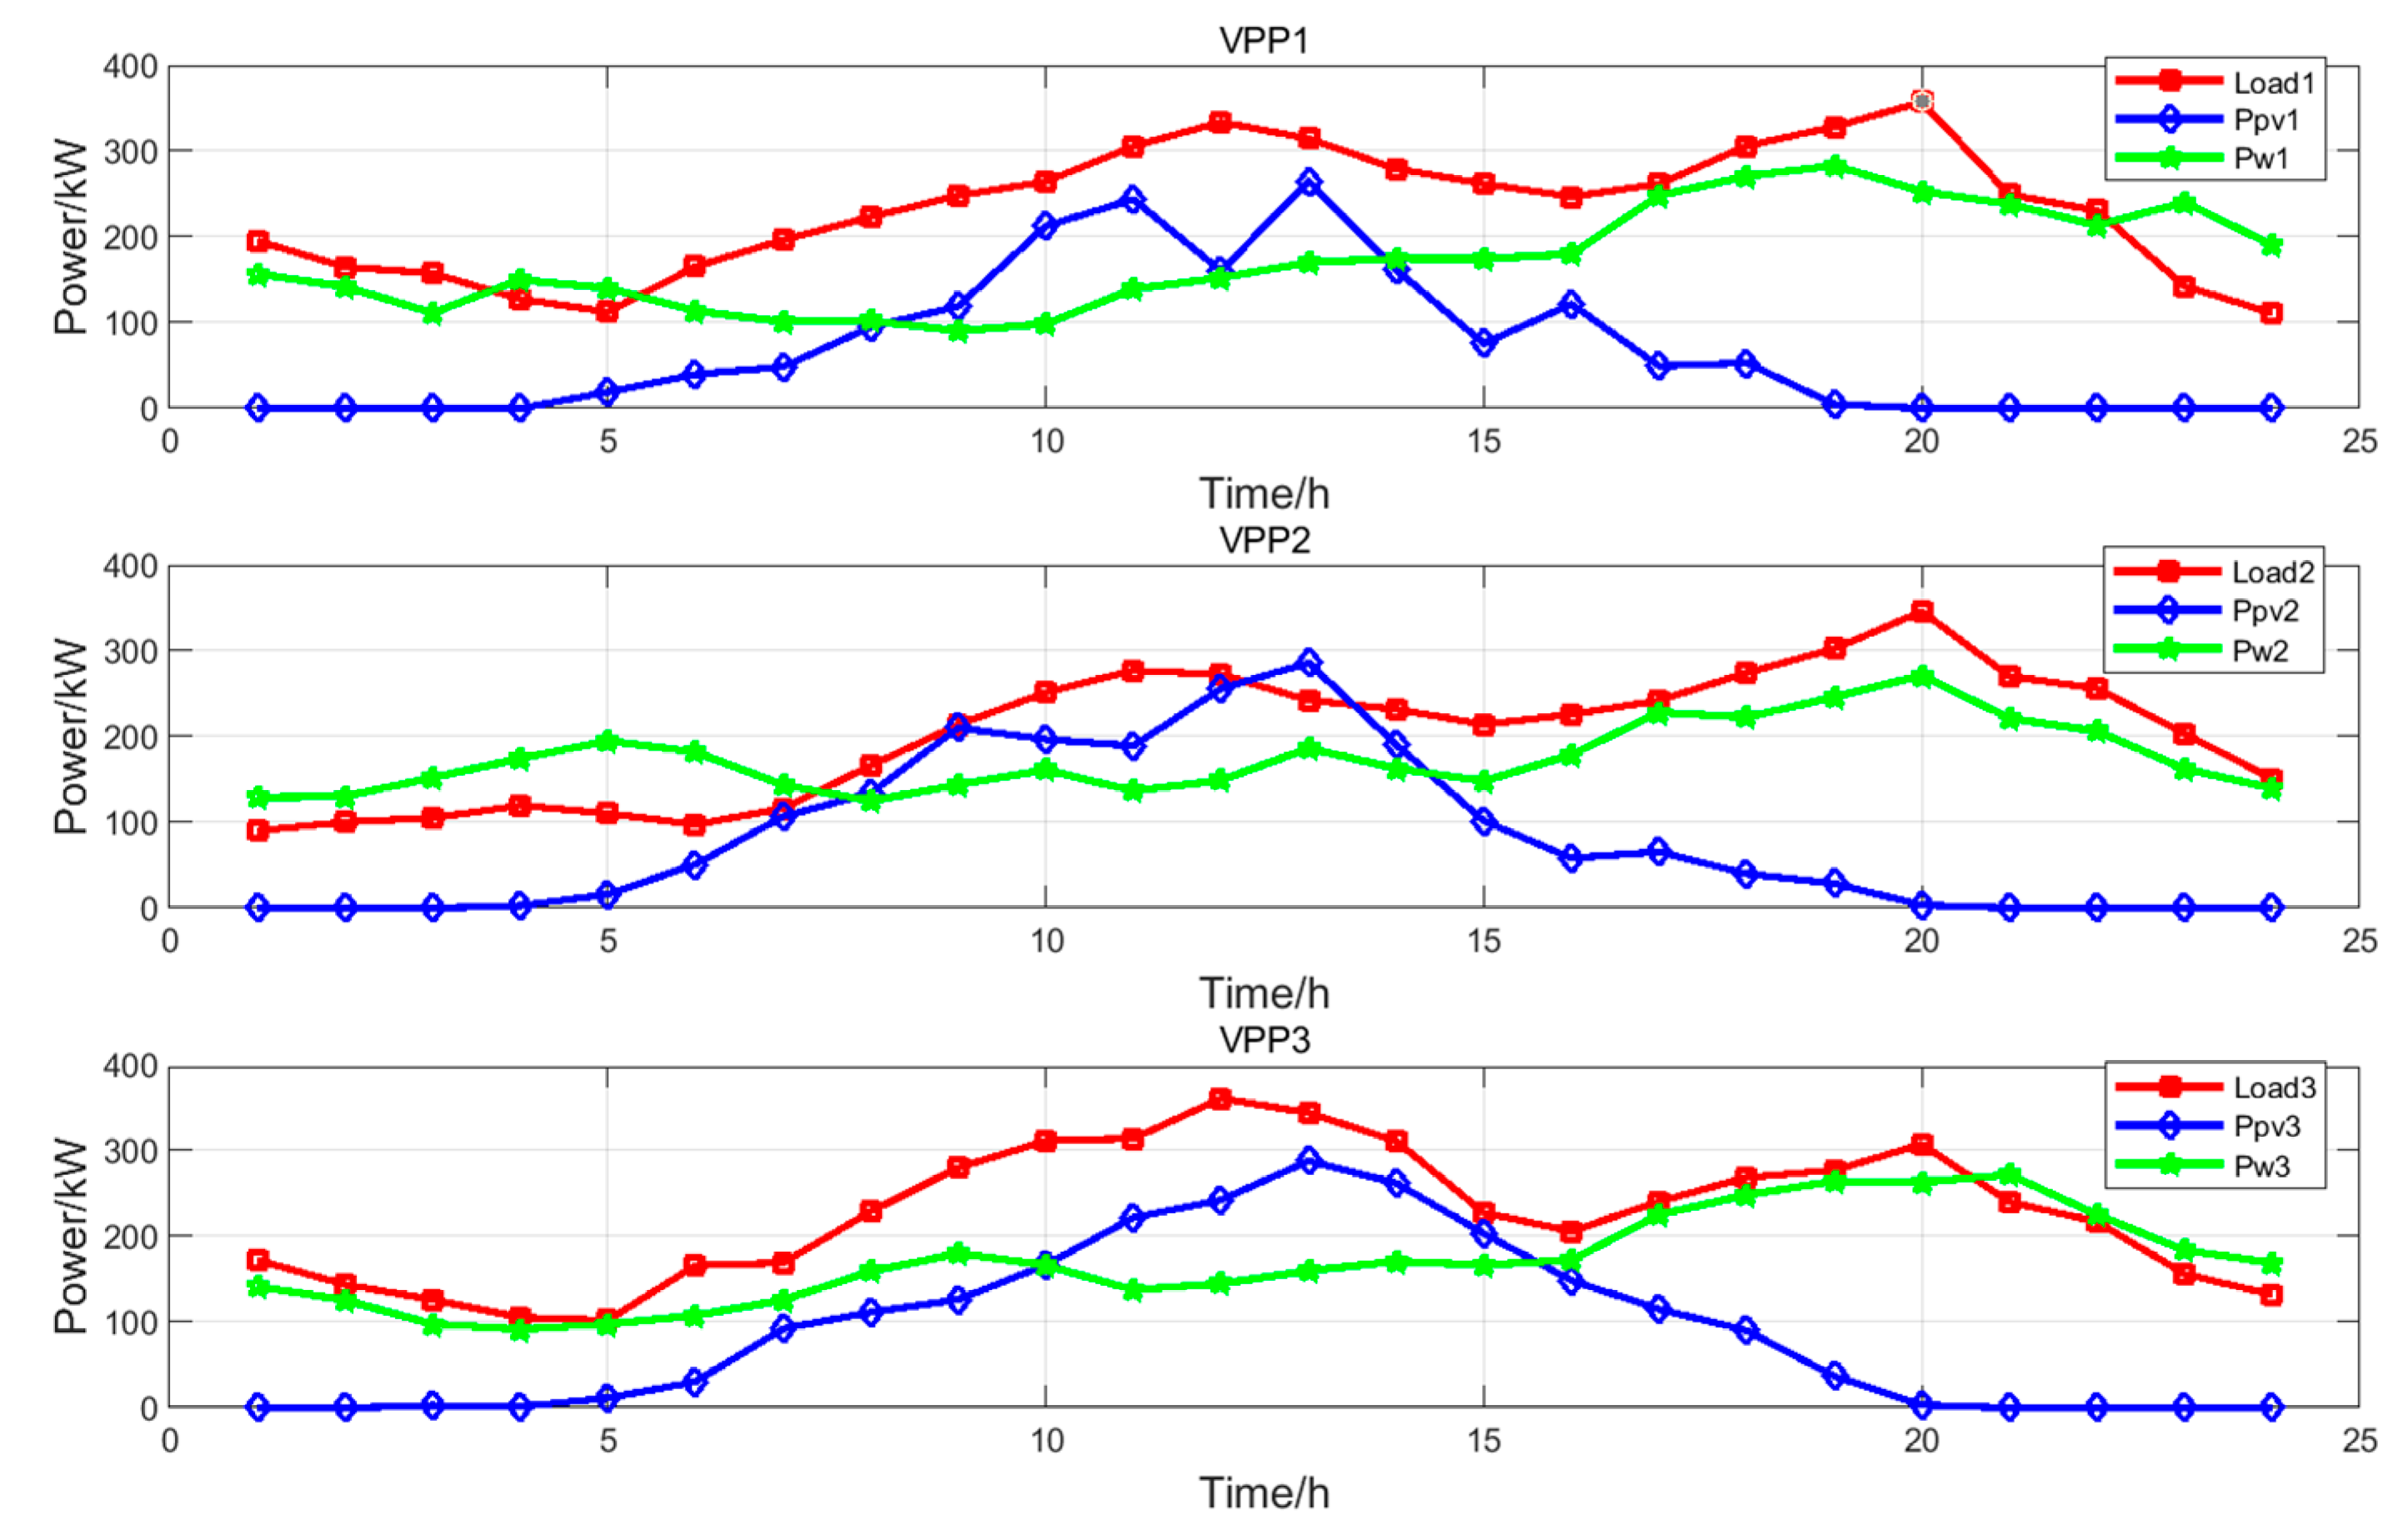
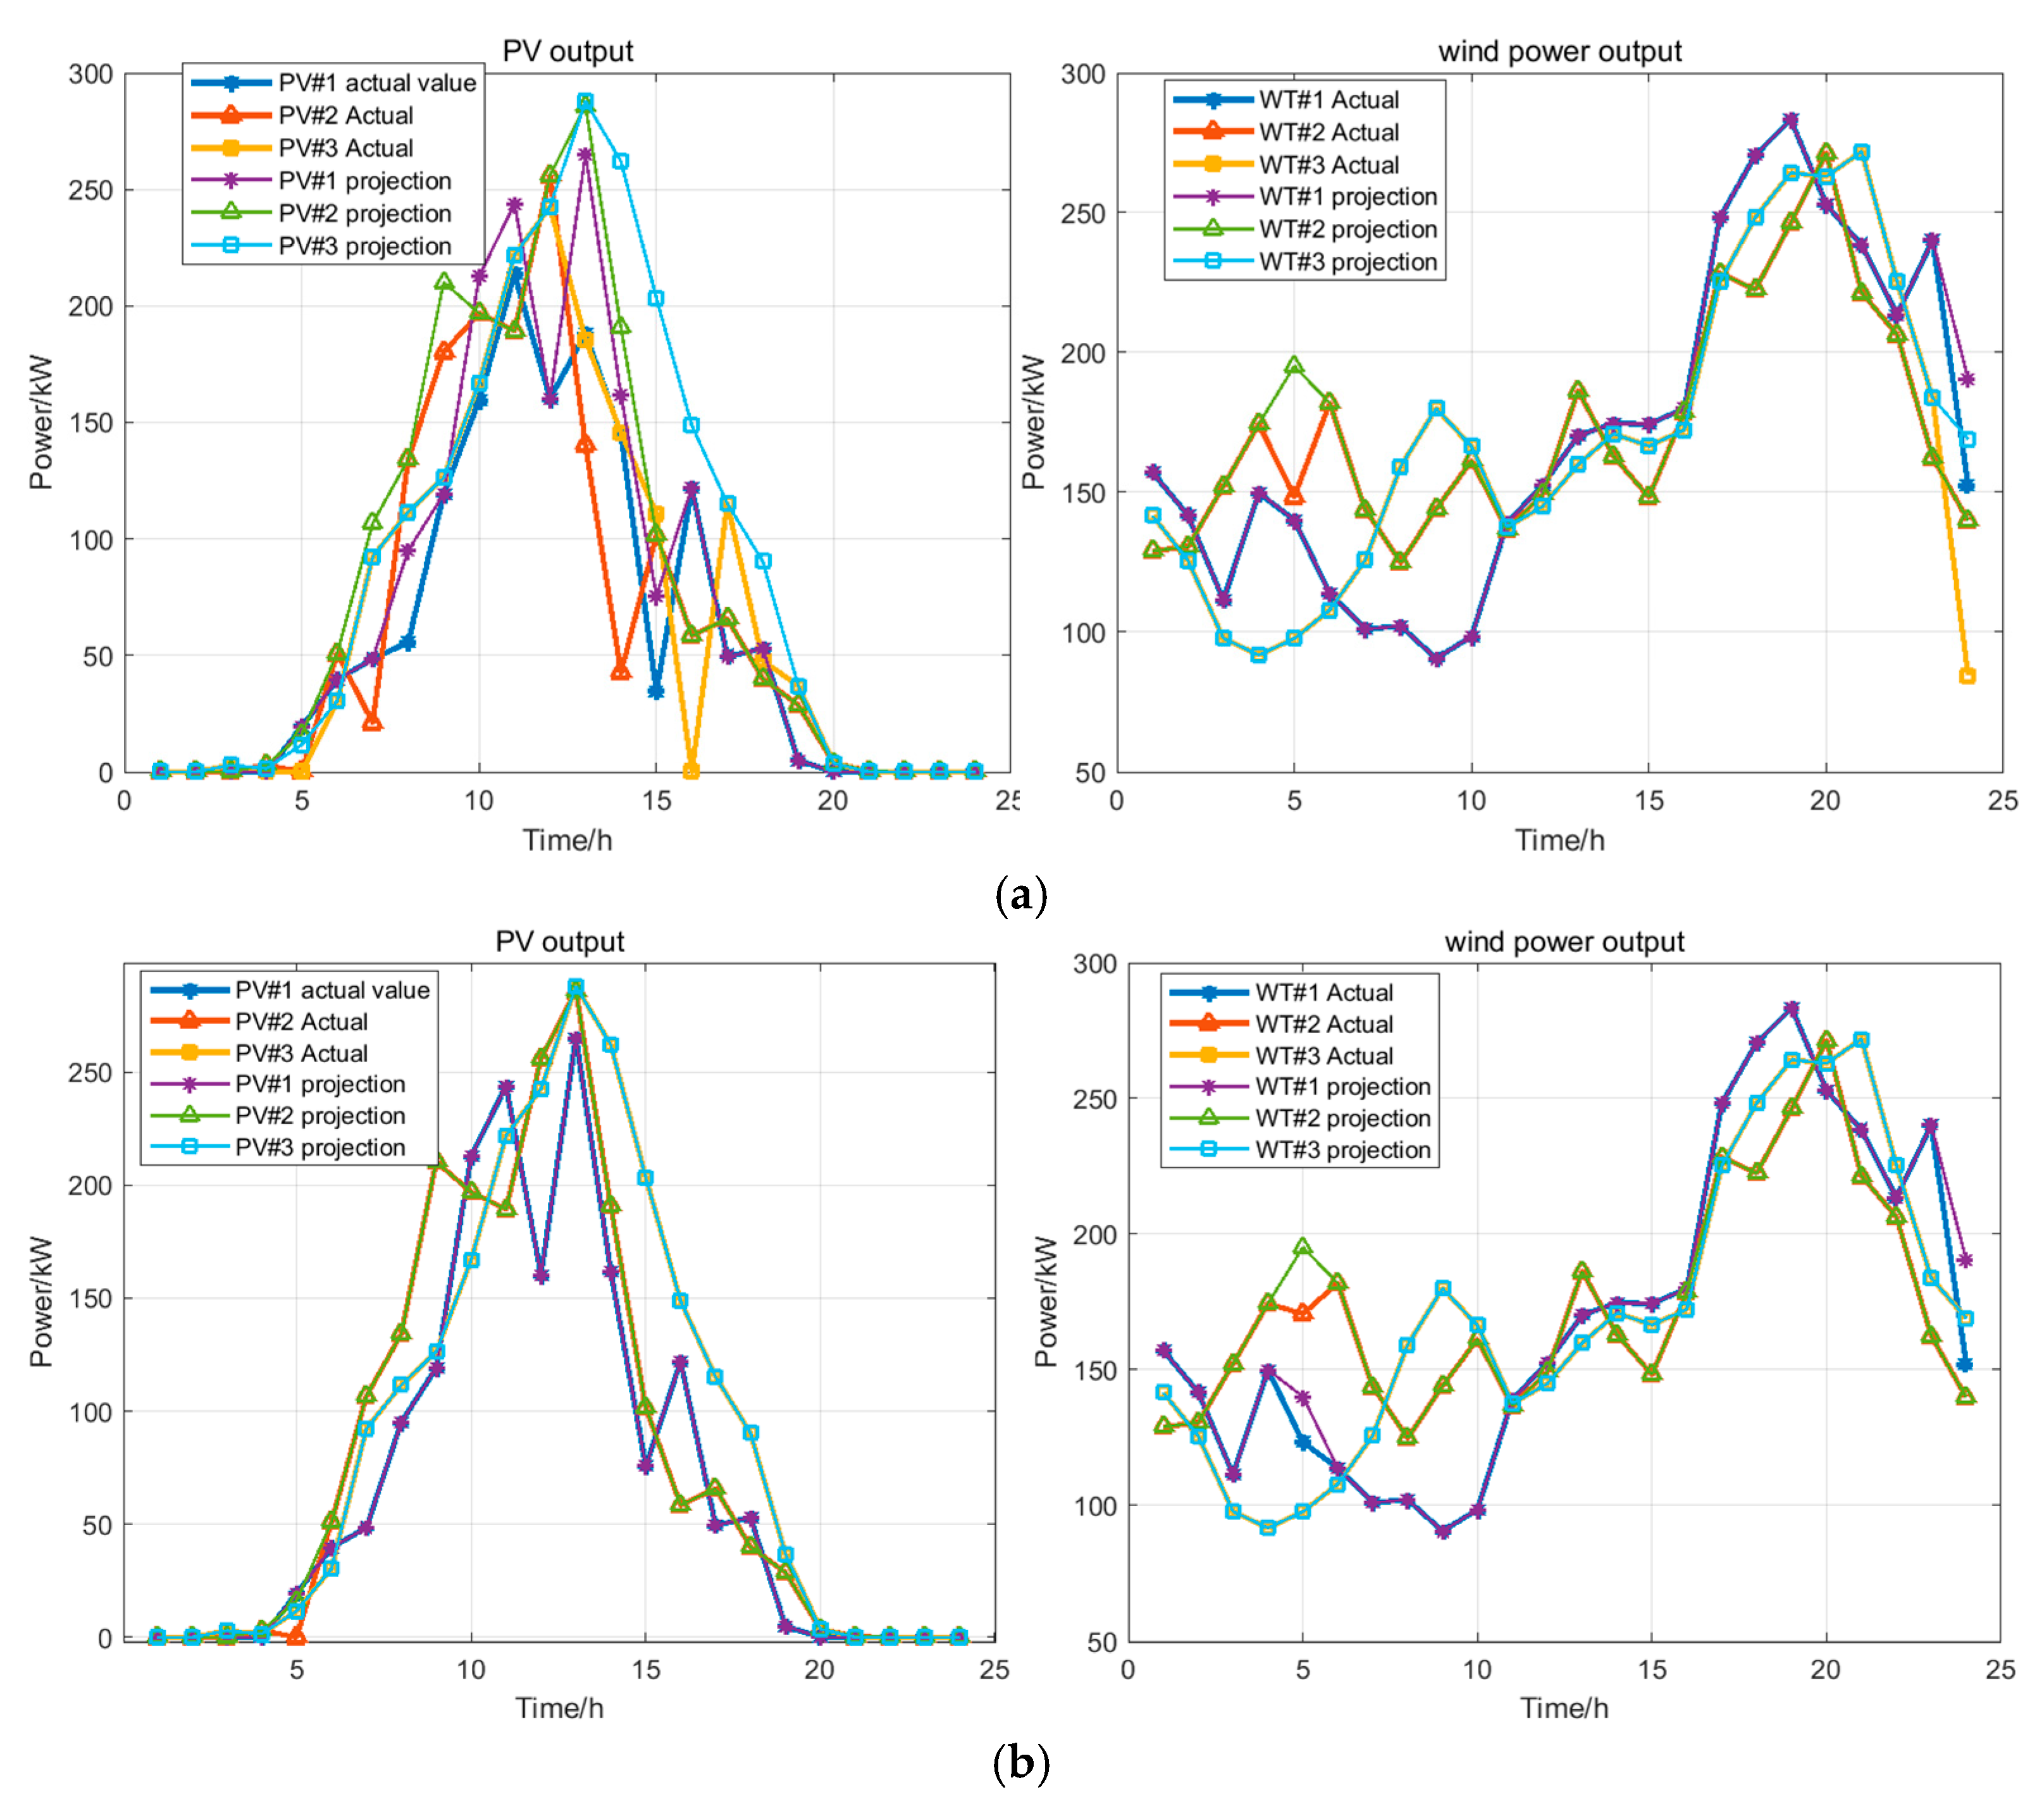
Figure 3 illustrates the predicted wind and photovoltaic generation data along-side the load demand for a specific day in a county. The system’s reserve margin is set at 10%, while the permissible fluctuation limits for wind and solar power are set at 30% above and below the predicted levels. Taking VPP1 as an example, it can be observed that the integration of large-scale distributed renewable energy sources leads to an energy surplus between 10:00 and 15:00, with the peak penetration rate reaching an impressive 138.10% at 13:00. Conversely, during late evening or early morning hours, such as 20:00–22:00 and 1:00–3:00, reliance on wind power alone may not suffice, resulting in energy shortfalls. For instance, at 20:00, an additional 104.17 kW of generation is required to meet the demand. Consequently, the deployment of energy storage batteries is essential for peak shaving and valley filling to mitigate grid instability. This strategy motivates virtual power plants to engage in distribution network electricity trading, thereby reducing both consumer electricity costs and generation expenses.
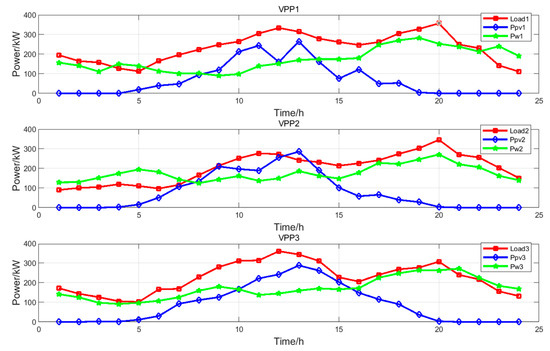
Figure 3.
Wind PV and load day-ahead forecasts.
Table 3 displays a reference electricity pricing schedule for the local distribution network for a specify day. These values, when integrated with Equations (6) and (9), facilitate the computation of the internal cost incurred by the VPPs and the total earnings of the VPO.
Table 3.
Daily electricity prices for the grid.
4.2. Results Analysis of the Bi-Level Game Optimization Strategy
Analysis of Electricity Trading Results
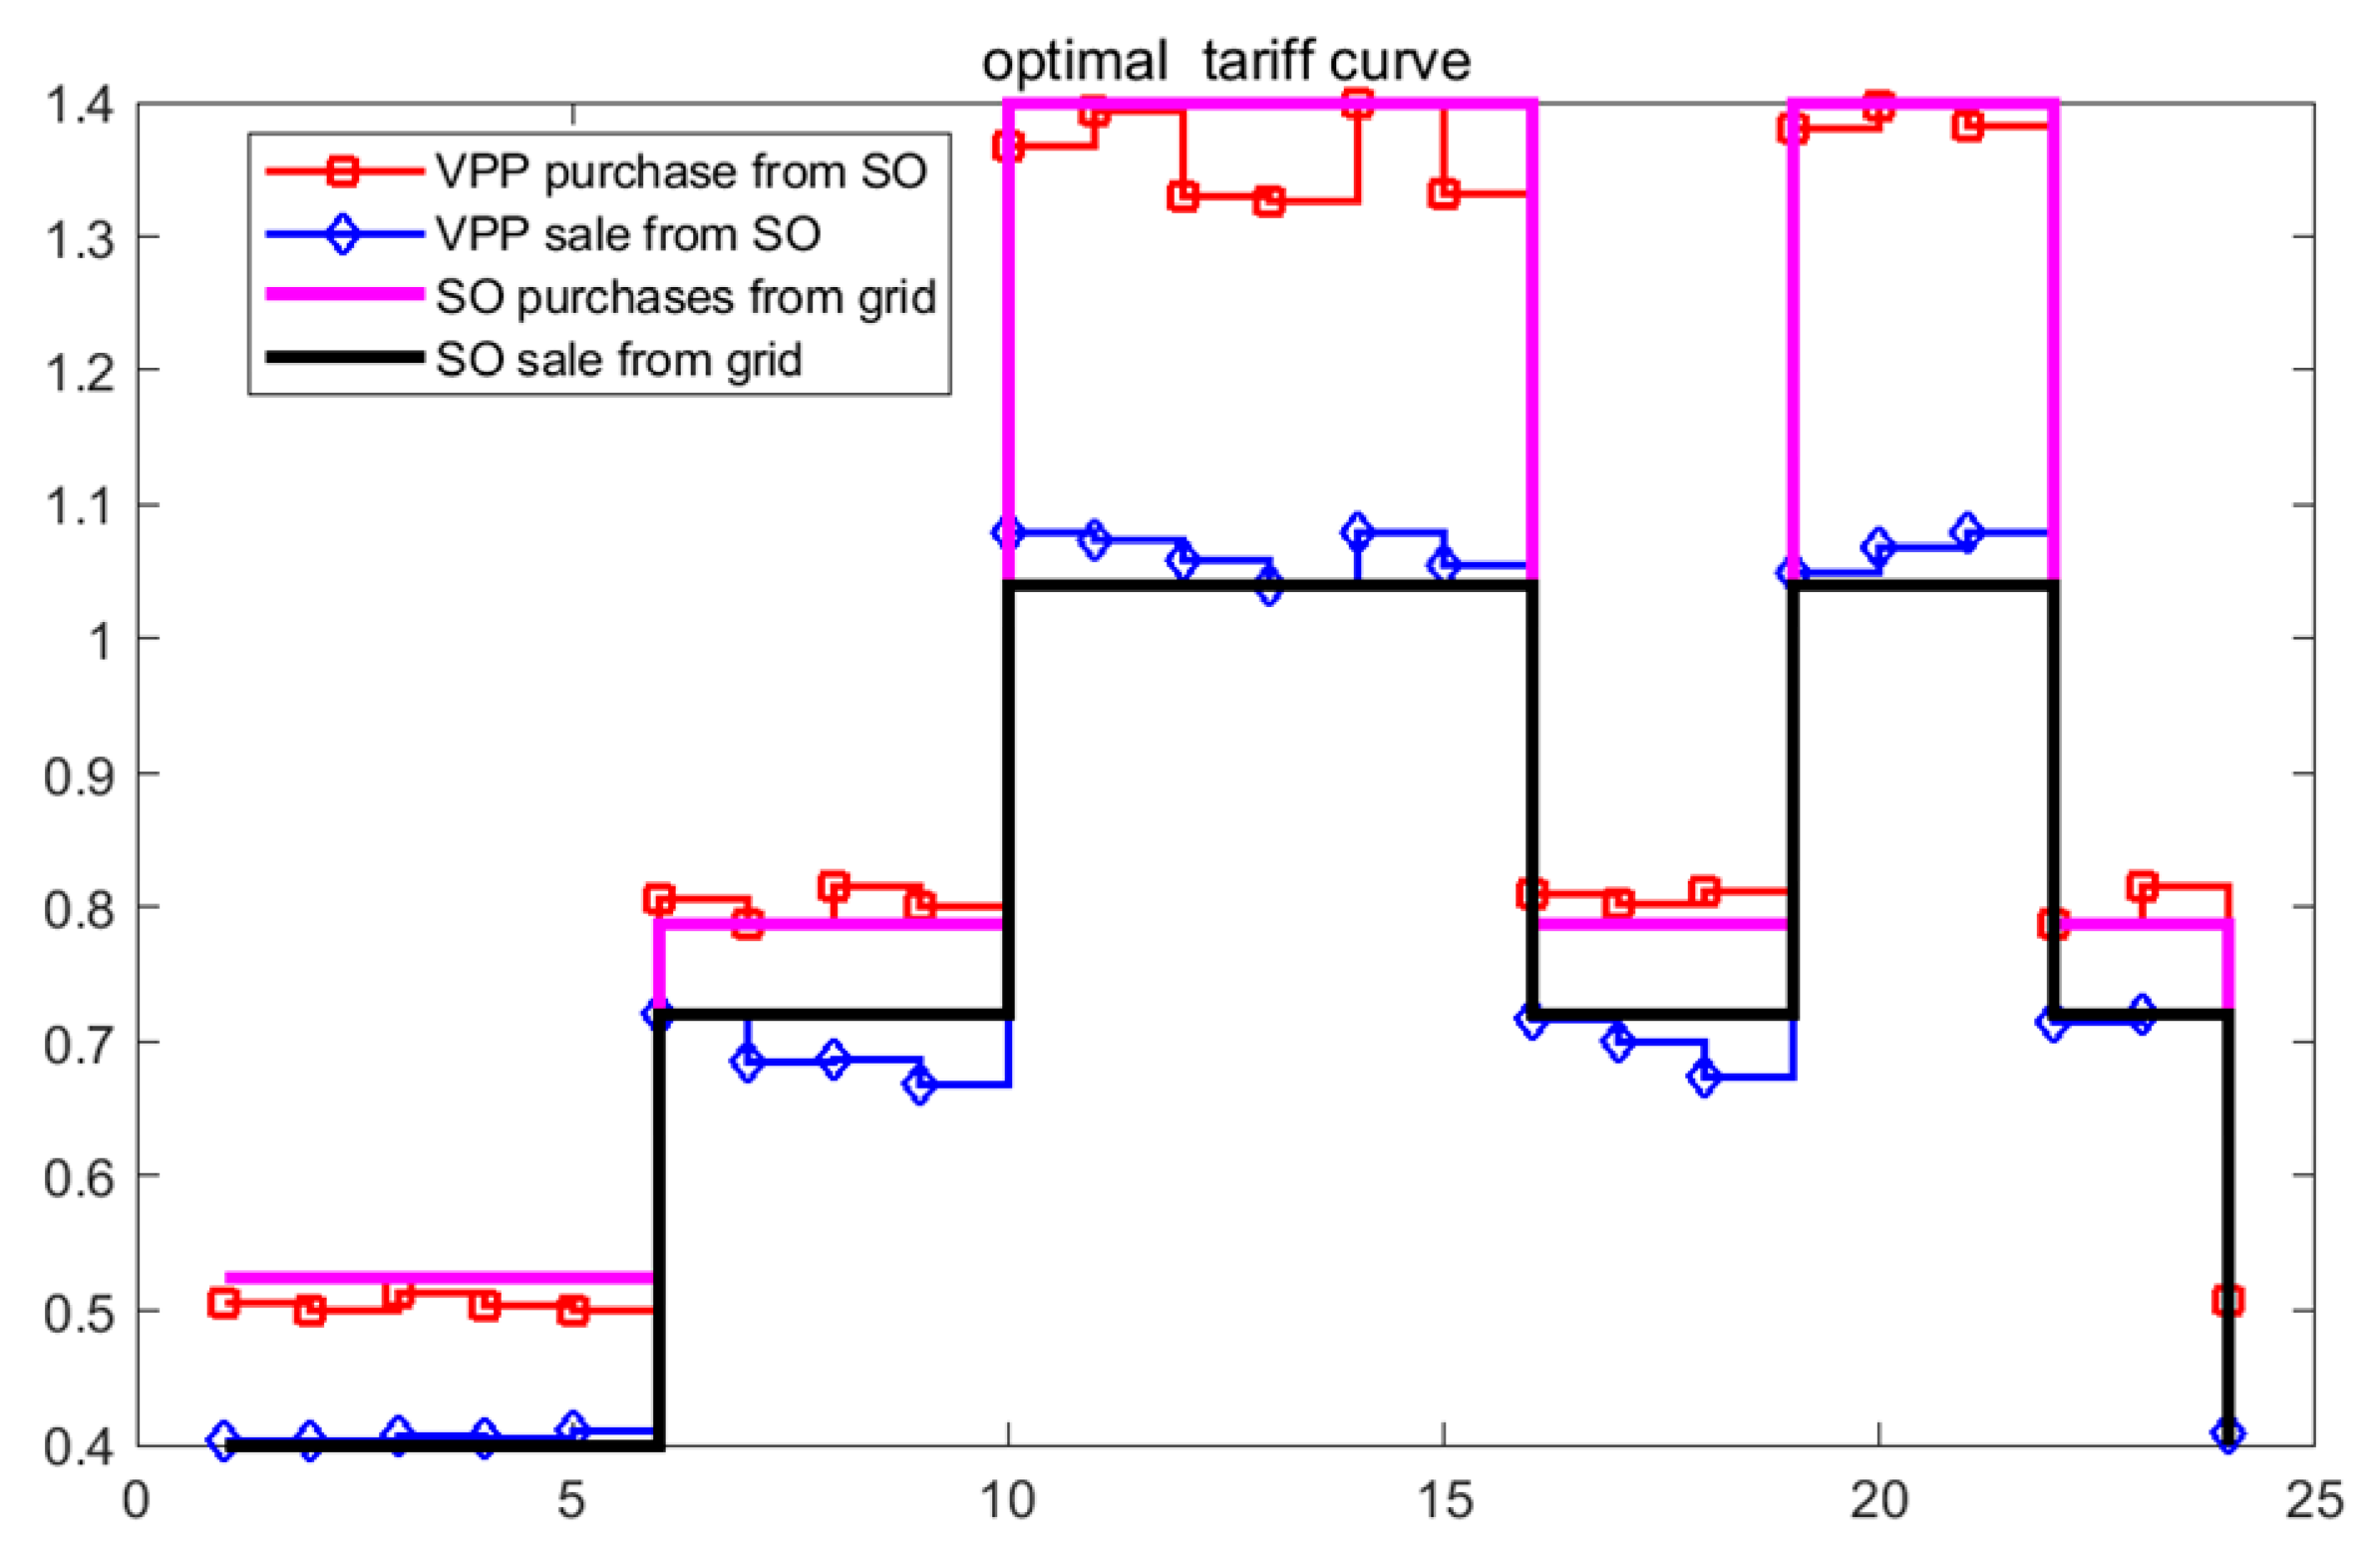
Figure 4 shows the optimized internal electricity pricing schema of the VPO. Meanwhile, the outcomes of the electricity trading transactions between the VPO and VPP clusters are visualized in Figure 5.

Figure 4.
VPO, and grid and VPP electricity prices.
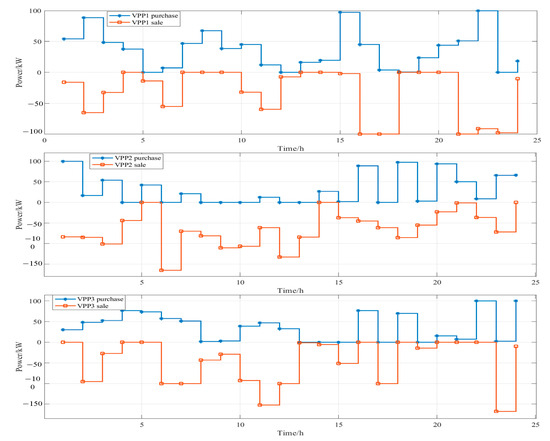
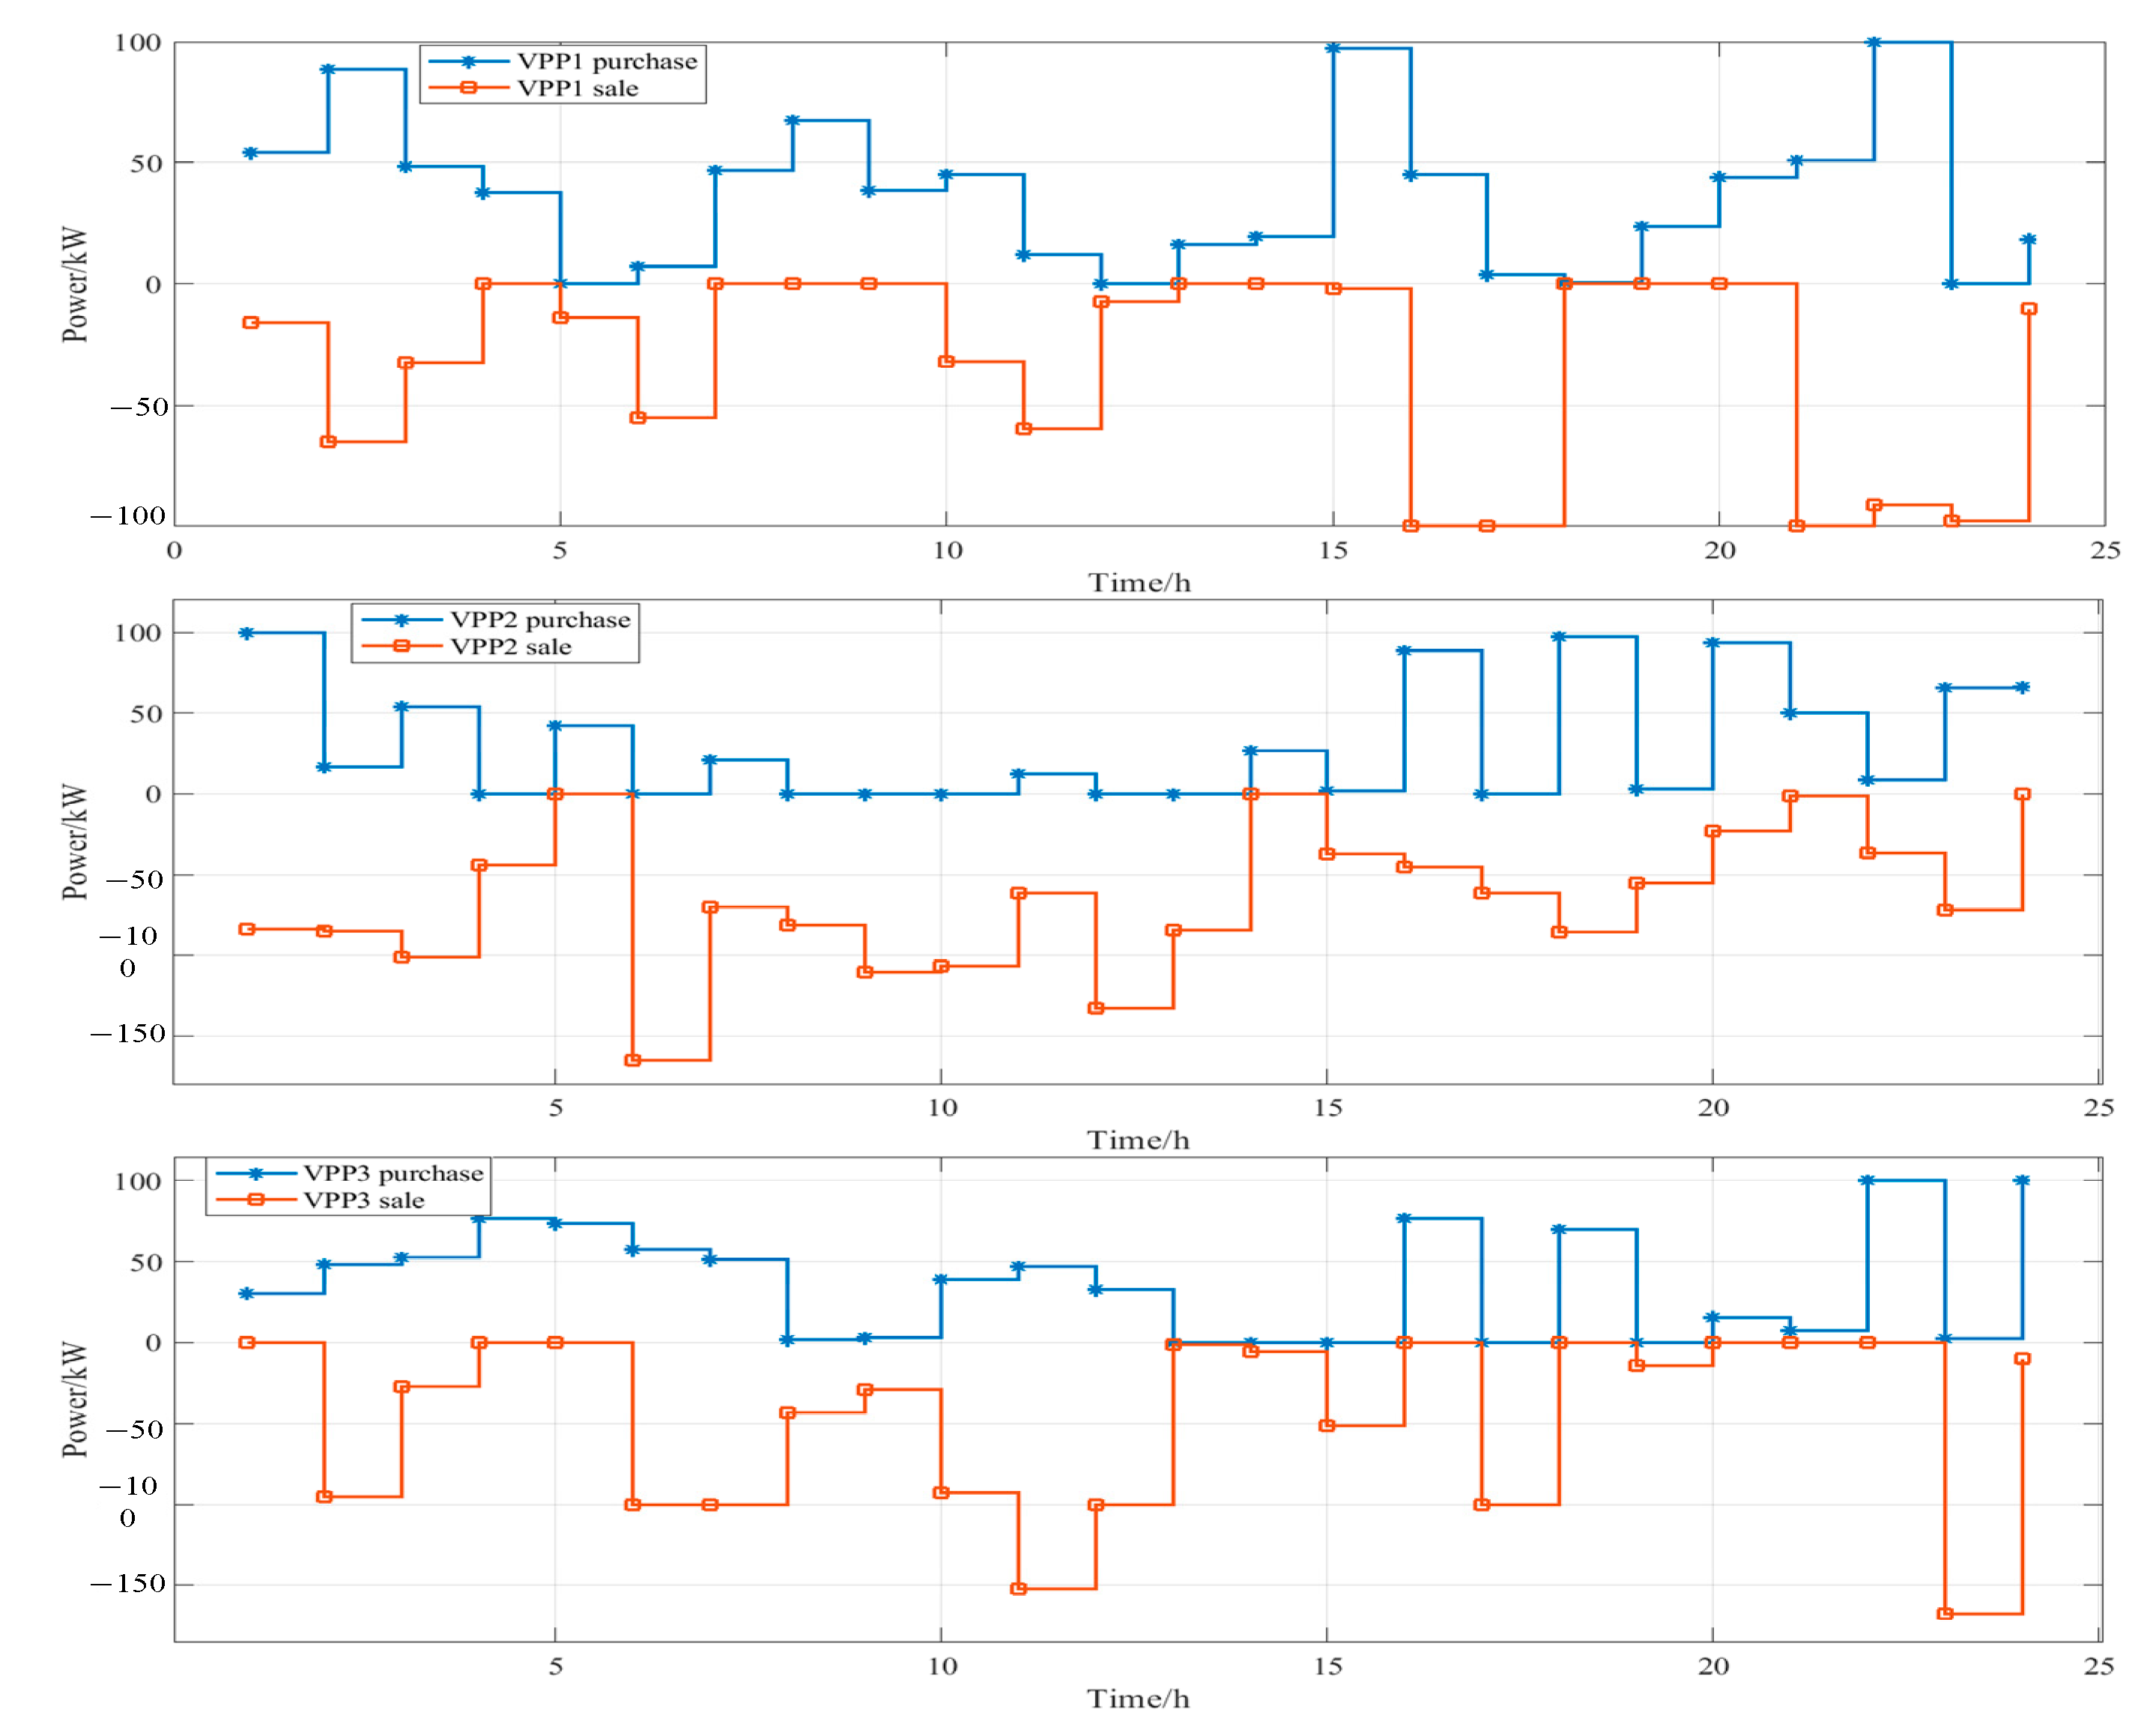
Figure 5.
VPO and VPP purchased and sale.
It can be seen from Figure 5 that under the VPO’s internal electricity pricing mechanism, the electricity sold by each virtual power plant surpasses its procurement volume. This dynamic results in a decrease in the internal costs for the lower-level VPPs and an increase in the revenue benefits for the VPO from electricity sales to the distribution network. The electricity trading channels for VPPs encompass both the other lower-level VPPs and the upper-level distribution network, markedly boosting energy interchangeability. This configuration facilitates a swift response to energy imbalances, thereby guaranteeing a stable power supply.
Figure 6 illustrates the daily profit trajectory of the VPO. From 6:00 to 13:00, as the generation of distributed renewable energy within the VPP cluster intensifies, the VPO is able to procure electricity and resell it to the distribution network at a profit. Conversely, between 14:00 and 16:00, as well as 0:00 and 5:00, when the supply of distributed energy wanes, the VPO increases its electricity purchases from the distribution network and sells it to the VPPs, thereby securing margin-based profits.
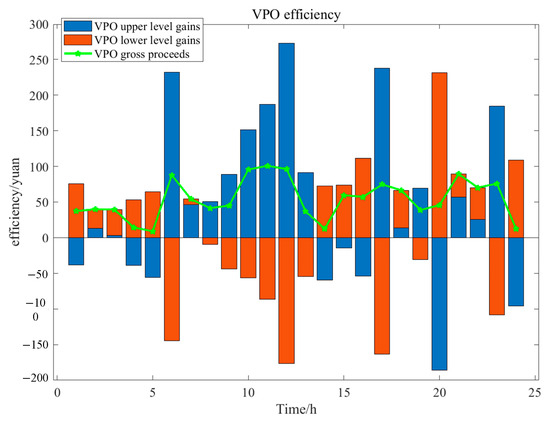
Figure 6.
VPO profit curve.
4.3. Comparative Analysis
To further validate the effectiveness of the bi-level game model, a comparative analysis was conducted between two optimization models as follows:
- Model 1: This model dispenses with day-ahead forecasting, wherein the VPO does not establish dynamic lower-level pricing. Instead, it directly adopts the electricity prices from the distribution network as presented in Table 3 to formulate the internal prices for the VPP cluster.
- Model 2: This model employs the bi-level game optimization model introduced in this research, which yields the optimized dynamic electricity prices depicted in Figure 5.
4.3.1. Wind and Solar Power Results Analysis
Figure 7 illustrates the actual power generation from wind and solar under the two different dispatch strategies. With Model 2, the VPO adeptly manages the energy flow between the virtual power plants and the distribution network, substantially mitigating the curtailment costs associated with surplus wind and solar power. This approach effectively tackles the challenges posed by the high penetration rates resulting from the extensive integration of distributed energy resources.

Figure 7.
Forecasted vs. actual wind and solar power output curves. (a) Model 1. (b) Model 2.
4.3.2. VPP Internal Power Generation Analysis
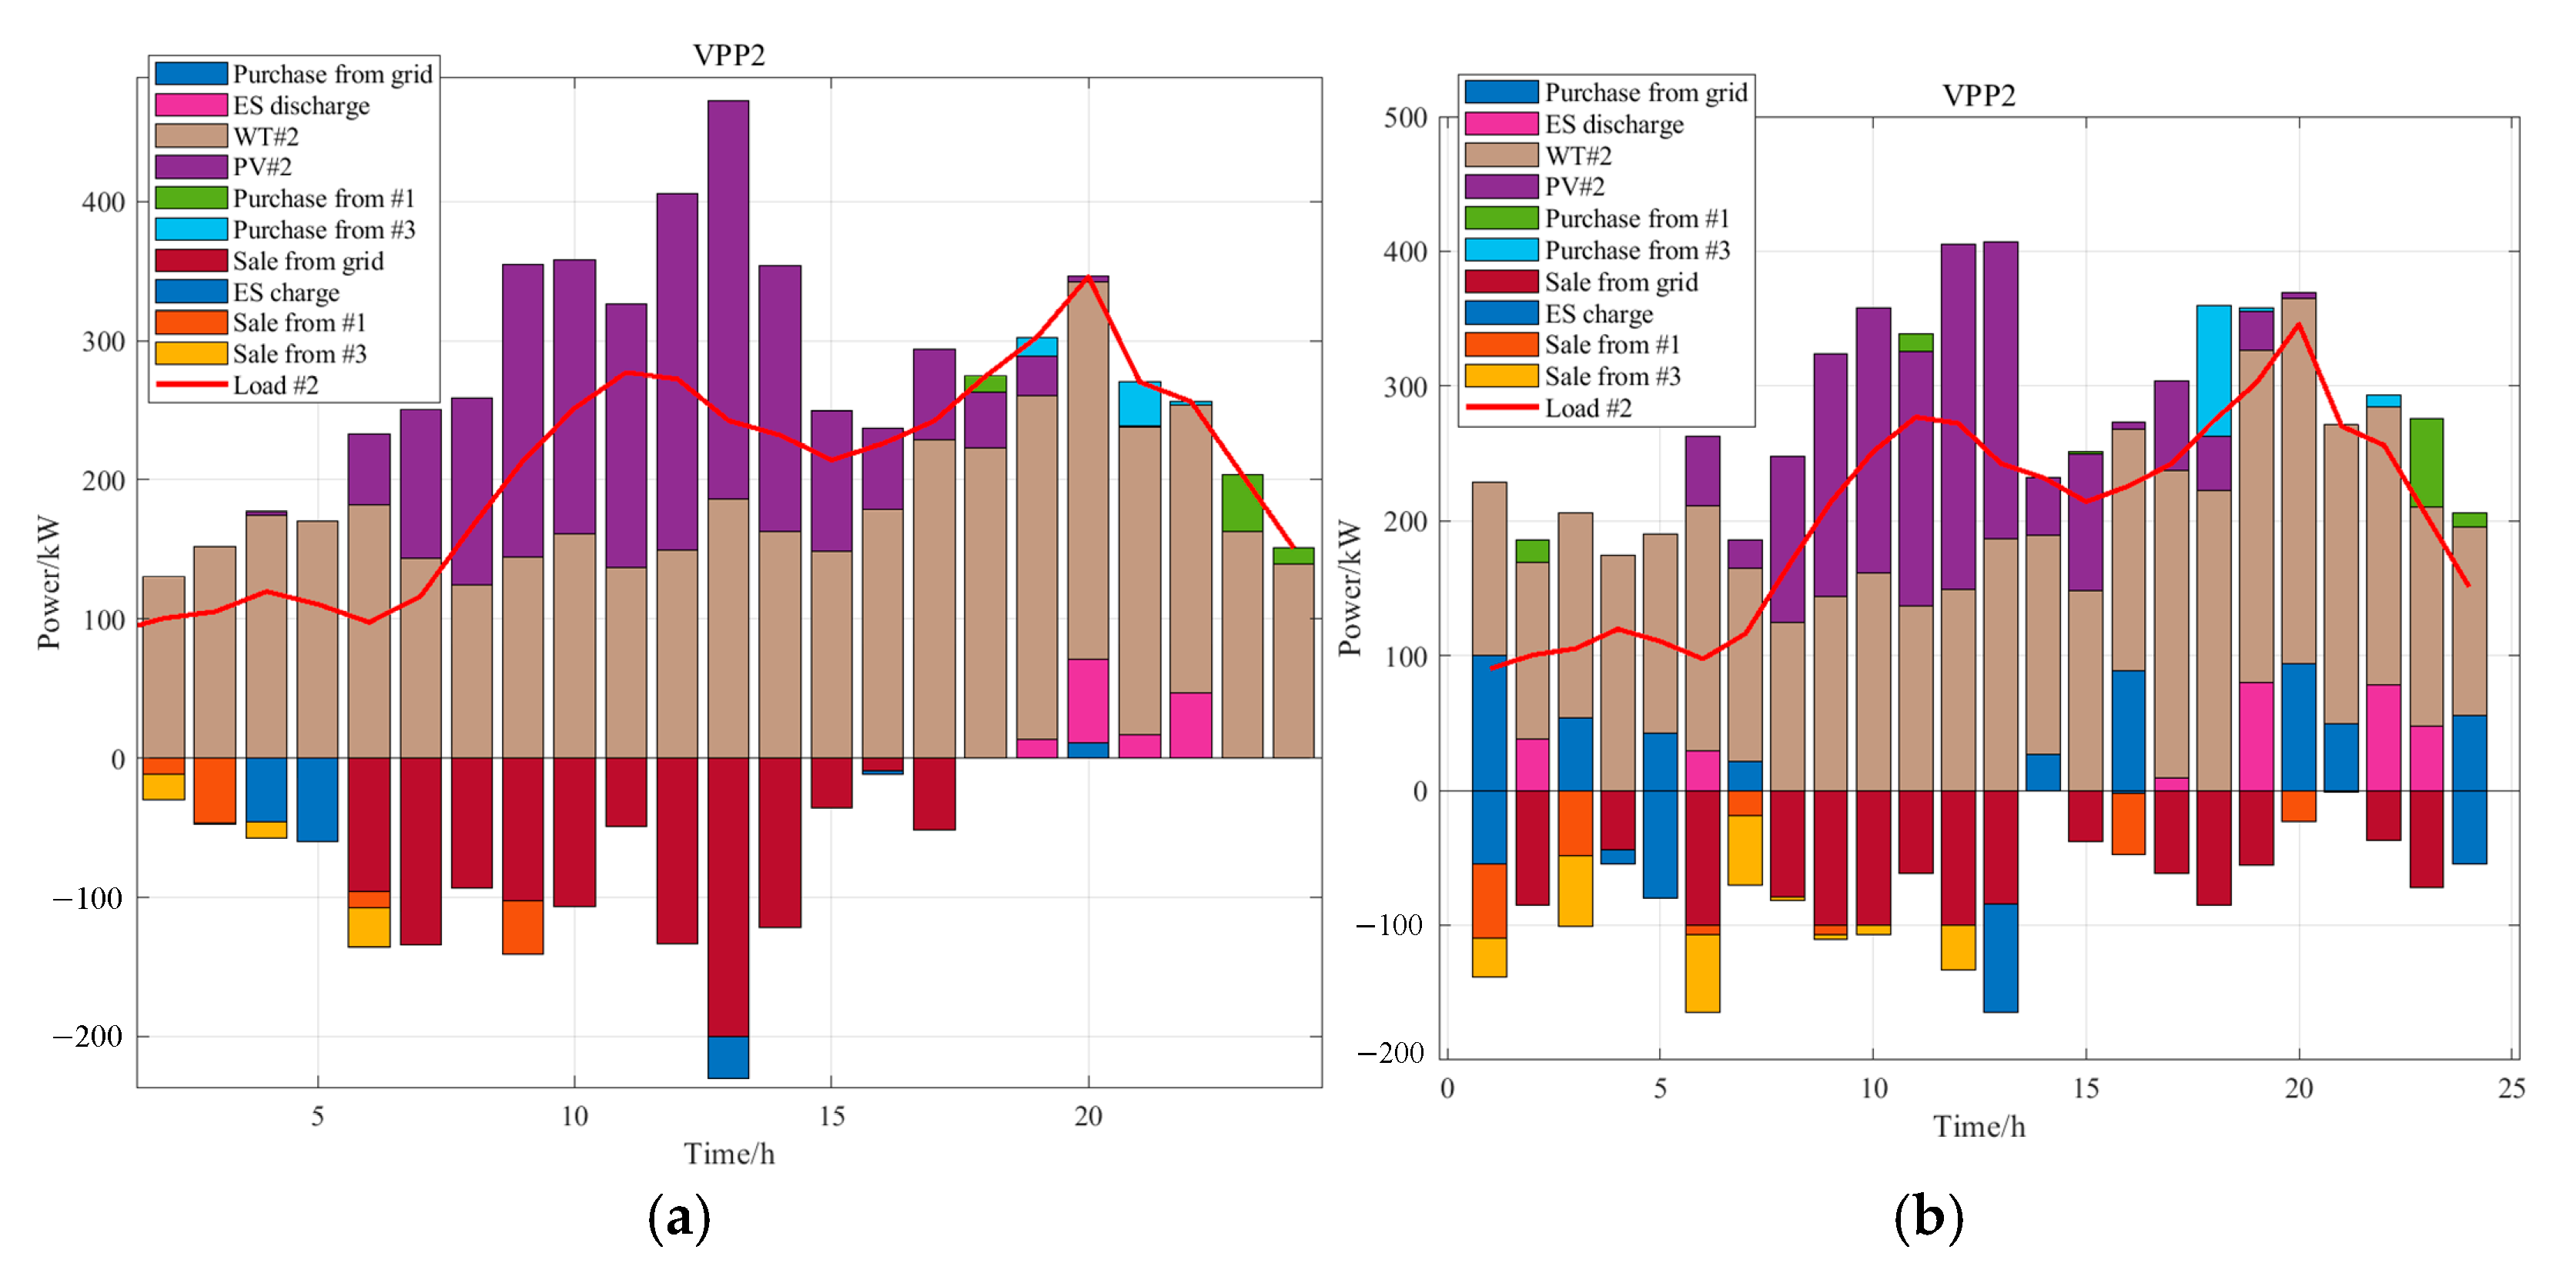
Figure 8 shows the power load and energy composition of VPP2 under both models. Through the optimization of Model 2, the VPO adeptly manipulates electricity prices, resulting in a notable surge in electricity trading volumes between VPP2 and the distribution network, as well as with VPP1 and VPP3. This demonstrates the VPO’s proficiency in fostering energy optimization and dispatch coordination among the VPPs and the distribution network.
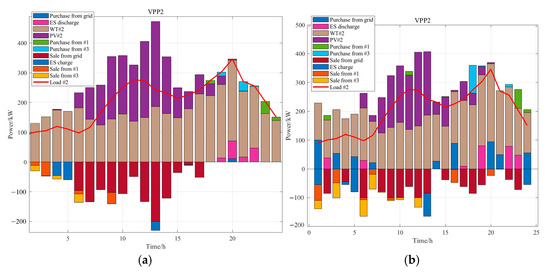
Figure 8.
VPP2 power generation composition. (a) Mode 1. (b) Mode 2.
4.3.3. Total Cost Analysis
Table 4 illustrates the costs incurred by the lower-level VPPs and the benefits accrued to the VPO under the bi-level game model. It is apparent that in order to promote energy dispatch among virtual power plants and to address the challenges posed by wind and solar power generation, the aggregate internal cost for the VPPs under Model 2 is marginally higher by 292.59 CNY than under Model 1. Nevertheless, the VPO realizes a substantial benefit of 1300.84 CNY. This suggests that the bi-level game model not only intensifies energy transactions between the VPP cluster and the distribution network but also amplifies the VPO’s profitability. Each stakeholder derives tangible benefits from the bi-level game optimization model, underscoring its efficacy as a strategic approach for the dispatch and operation of multi-VPP systems.
Table 4.
The internal costs of VPPs and the benefits of VPO.
4.3.4. Fitness Analysis
To demonstrate the superiority of the proposed algorithm, the execution capability, adaptability, and global search ability of the algorithm were tested against the classic PSO and GA algorithms under the same bi-level game model. The results of the classic Genetic Algorithm, PSO algorithm, and the proposed algorithm are shown in Figure 9. Experimental results indicate that the proposed method demonstrates enhanced optimization capabilities and faster computational efficiency when dealing with the bi-level game model. Specifically, the proposed method converges to the optimal solution by the 9th iteration, whereas the genetic algorithm and PSO algorithm reaches the optimal state at the 22nd and 26th iteration, respectively. Furthermore, in terms of algorithm performance, the fitness result under the GA algorithm is 12,466.8 CNY, for the PSO algorithm, it is 12,569.5 CNY, and for the IRLA algorithm, it is 12,278.9 CNY. Compared to PSO and GA, the IRLA algorithm achieves cost savings of 290.6 CNY and 187.9 CNY, respectively, indicating a superior convergence state.
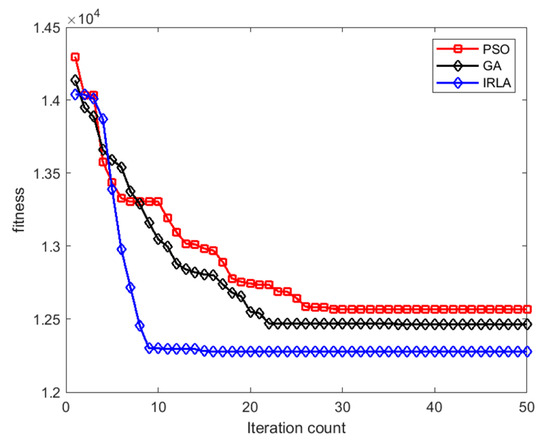
Figure 9.
Fitness function curves for the comparison between the PSO and the proposed method.
4.3.5. Multi-Objective Model Analysis
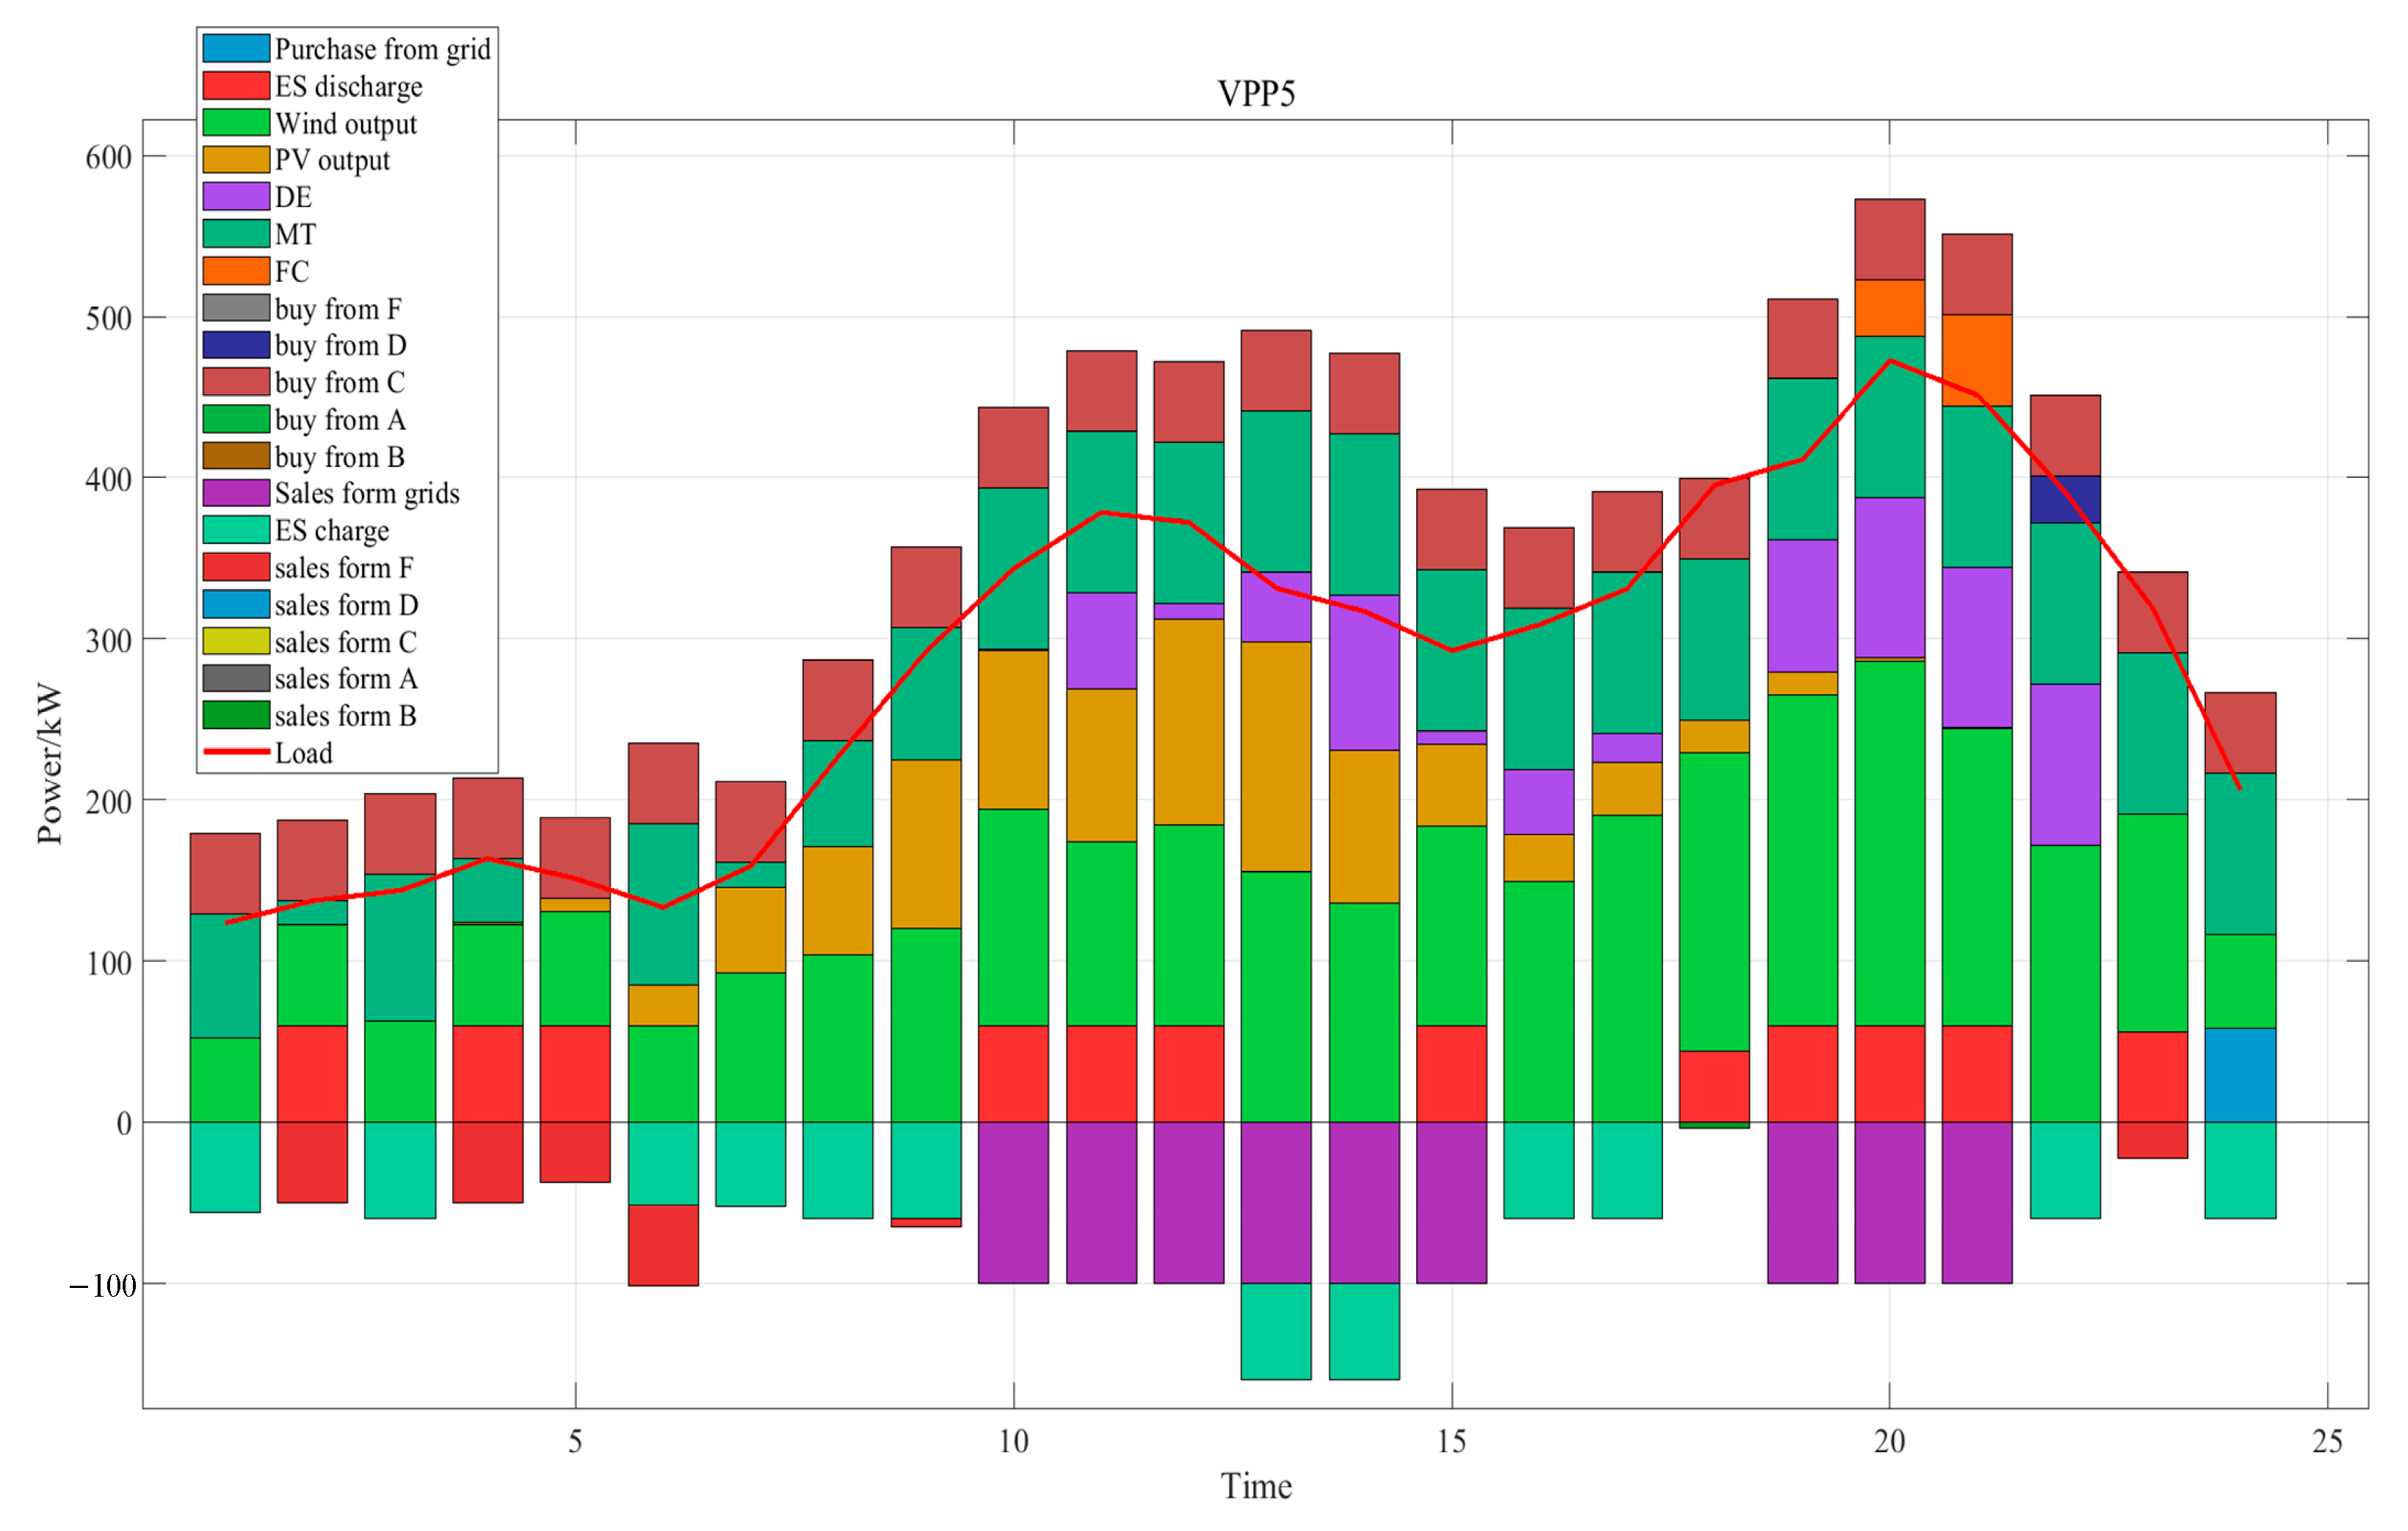
This study primarily focuses on the bi-level game model that encompasses wind, solar, and energy storage within three VPPs. To illustrate the wide applicability of the IRLA algorithm, the number of VPPs was increased to six. Each VPP comprises wind power, photovoltaic systems, and energy storage, with additional components such as microturbines (MTs), fuel cells (FCs), and diesel generators (DEGs) integrated to create a multi-objective optimization framework. The experimental results under the proposed algorithm are presented in Figure 10. The results indicate that the IRLA algorithm, founded on the bi-level game theory, effectively captures the complexity of real-world issues. This makes it appropriate for managing large-scale optimization challenges and securing globally optimal solutions.
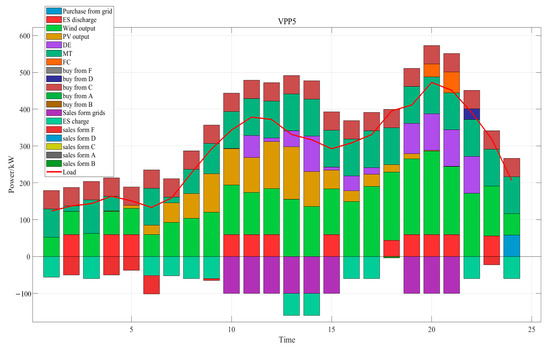
Figure 10.
VPP5 power generation composition.
5. Conclusions
This work tackles the issue of optimizing decision-making benefits in the interaction between VPPs and the VPO, framed within multi-objective modeling. A Bi-level game optimization framework has been introduced. At the lower level, the model quantifies the costs related to the generation, operation, maintenance, and environmental pollution for each individual virtual power plant. Conversely, the upper level delineates the benefits pertaining to electricity procurement and sales for the VPO. Subsequently, an enhanced reinforcement learning algorithm is developed, leveraging particle swarm optimization strategies to navigate beyond local optima and promote efficient population-based exploration. The results of the simulations confirm that the proposed two-tier game model is highly appropriate for multi-objective virtual power plant systems, markedly improving energy efficiency and economic gains while reducing the costs associated with wind and solar energy curtailment. Furthermore, the algorithm introduced herein can rapidly iterate to identify the optimal state, yielding superior game outcomes within the same modeling framework. In the near future, we will involve other renewable energy sources, such as electronic car, as described in Figure 1.
Author Contributions
Methodology, Z.L. and L.X.; validation, G.G.; data curation, D.G. and F.H.; writing—review and editing, X.W. and D.Z.; project administration, Z.L. All authors have read and agreed to the published version of the manuscript.
Funding
This research was funded by the Southern Power Grid Network-level Science and Technology Project, grant number GDKJXM20222474.
Data Availability Statement
The original contributions presented in the study are included in the article; further inquiries can be directed to the corresponding author.
Conflicts of Interest
Author Zhu Liu was employed by China Southern Power Grid Research Technology Co., Ltd.; author Guowei Guo was employed by Guangdong Electric Power Co., Ltd., Foshan Power Supply Bureau; authors Dehuang Gong, Lingfeng Xuan, and Feiwu He were employed by Guangdong Electric Power Co., Ltd., Qingyuan Yingde Power Supply Bureau. The remaining authors declare that the research was conducted in the absence of any commercial or financial relationships that could be construed as potential conflicts of interest.
References
- Liu, K.X.; Zhou, X.N.; Chen, X.M.; Liu, Y.; Yan, P.F.; Liu, M. Daily electricity forecast of regional power grid considering large scale access of distributed generation. Renew. Energy Resour. 2022, 40, 1407–1414. [Google Scholar]
- Hu, J.; Zhou, H.; Li, Y.; Hou, P.; Yang, G. Multi-time scale energy management strategy of aggregator characterized by photovoltaic generation and electric vehicles. J. Mod. Power Syst. Clean Energy 2020, 8, 727–736. [Google Scholar] [CrossRef]
- Yang, Y.; Wu, W.; Wang, B.; Li, M.; Zhu, T. Optimal decomposition of stochastic dispatch schedule for renewable energy cluster. J. Mod. Power Syst. Clean Energy 2021, 9, 711–719. [Google Scholar] [CrossRef]
- Yu, Y.; Quan, L.; Mi, Z.; Lu, J.; Chang, S.; Yuan, Y. Improved model predictive control with prescribed performance for aggregated thermostatically controlled loads. J. Mod. Power Syst. Clean Energy 2022, 10, 430–439. [Google Scholar] [CrossRef]
- Wang, S.; Wu, W. Aggregate flexibility of virtual power plants with temporal coupling constraints. IEEE Trans. Smart Grid 2021, 12, 5043–5051. [Google Scholar] [CrossRef]
- Ge, X.X.; Fu, Z.Y.; Xu, F.; Wang, F.; Wang, J.L.; Wang, T. Business Model and Key Technologies of Virtual Power Plant for New Power System. Autom. Electr. Power Syst. 2022, 46, 129–146. [Google Scholar]
- Wang, H.; Wang, J.; Wang, C.; Zhang, G.; Fan, M. Risk-constrained Energy Management Modeling of Virtual Power Plant. Proc. CSEE 2021, 41, 8334–8349. [Google Scholar]
- Lin, L.; Guan, X.; Peng, Y.; Wang, N.; Maharjan, S.; Ohtsuki, T. Deep Reinforcement Learning for Economic Dispatch of Virtual Power Plant in Internet of Energy. IEEE Internet Things J. 2020, 7, 6288–6301. [Google Scholar] [CrossRef]
- Yang, Y.; Wang, Y.; Wu, W. Allocating Ex-post Deviation Cost of Virtual Power Plants in Distribution Networks. J. Mod. Power Syst. Clean Energy 2023, 11, 1014–1019. [Google Scholar] [CrossRef]
- Alahyari, A.; Ehsan, M.; Mousavizadeh, M.S. A hybrid storage-wind virtual power plant (VPP) participation in the electricity markets: A self-scheduling optimization considering price, renewable generation, and electric vehicles uncertainties. J. Energy Storage 2019, 25, 100812. [Google Scholar] [CrossRef]
- Liu, Z.; Zheng, W.; Qi, F.; Wang, L.; Zou, B.; Wen, F.; Xue, Y. Economic Dispatch of a Virtual Power Plant Considering Demand Response in Electricity Market Environment. Electr. Power 2017, 50, 107–113. [Google Scholar]
- Li, Y.; Tang, H.; Lv, K.; Wang, K.; Wang, G. Optimization of Dynamic Dispatch for Multiarea Integrated Energy System Based on Hierarchical Learning Method. IEEE Access 2020, 8, 72485–72497. [Google Scholar] [CrossRef]
- Hou, H.Y.; Ge, X.L.; Cao, X.D. Coalition game optimization method for multiple virtual power plants considering carbon trading. Proc. CSU-EPSA 2023, 35, 77–85. [Google Scholar]
- Liu, Z.; Zheng, W.; Qi, F.; Wang, L.; Zou, B.; Wen, F.; Xue, Y. Pricing strategy of energy service provider based on non-cooperative game and revenue sharing contract. Electr. Power Autom. Equip. 2022, 42, 1–8. [Google Scholar]
- Xu, Z.; Guo, Y.; Sun, H. Competitive Pricing Game of Virtual Power Plants: Models, Strategies, and Equilibria. IEEE Trans. Smart Grid 2022, 13, 4583–4595. [Google Scholar] [CrossRef]
- Chen, W.; Qiu, J.; Zhao, J.; Chai, Q.; Dong, Z.Y. Customized Rebate Pricing Mechanism for Virtual Power Plants Using a Hierarchical Game and Reinforcement Learning Approach. IEEE Trans. Smart Grid 2023, 14, 424–439. [Google Scholar] [CrossRef]
- Chen, Z.H.; Chen, S.H.; Chen, H. Large-scale FJSP based on improved multi-group NSGA-II algorithm. Transducer Microsyst. Technol. 2021, 40, 51–54. [Google Scholar]
- Mirjalili, S.; Saremi, S.; Mirjalili, S.M.; Coelho, L.D.S. Multi-objective grey wolf optimizer: A novel algorithm for multi-criterion optimization. Expert Syst. Appl. 2016, 47, 106–119. [Google Scholar] [CrossRef]
- Gu, W.; Wu, Z.; Wang, R. Muti-objective optimization of combined heat and power microgrid considering pollutant emission. Autom. Electr. Power Syst. 2012, 36, 183–191. [Google Scholar]
- Chen, J.D.; Hou, Z.F.; Zhao, R.F.; Li, B.; Wang, C.; Lin, G.H. Autonomous optimal economic dispatch of active distribution system based on multi-microgrid access. Electr. Meas. Instrum. 2024, 61, 150–156. [Google Scholar]
- Zhang, Y. Neural Network Algorithm with Reinforcement Learning for Parameters Extraction of Photovoltaic Models. IEEE Trans. Neural Netw. Learn. Syst. 2023, 34, 2806–2816. [Google Scholar] [CrossRef] [PubMed]
- Zhang, B.D.; Zhang, Y.N.; Guo, L.M.; Jiang, J.L.; Zhao, Y.Z. Moth-flame optimization algorithm based on crossover operator and non-uniform mutation operato. Comput. Digit. 2020, 48, 2622–2627. [Google Scholar]


Disclaimer/Publisher’s Note: The statements, opinions and data contained in all publications are solely those of the individual author(s) and contributor(s) and not of MDPI and/or the editor(s). MDPI and/or the editor(s) disclaim responsibility for any injury to people or property resulting from any ideas, methods, instructions or products referred to in the content. |
© 2025 by the authors. Licensee MDPI, Basel, Switzerland. This article is an open access article distributed under the terms and conditions of the Creative Commons Attribution (CC BY) license (https://creativecommons.org/licenses/by/4.0/).