Abstract
The double-skin façade (DSF), referred to hereinafter as a passive façade, represents an alternative technology aimed at improving the energy performance of buildings with glass envelopes. A passive façade consists of a traditional façade supplemented on the interior by a secondary layer, which is separated by a ventilated cavity with a variable width. Numerous studies have been conducted to optimize the control of passive façades with the aim of improving building energy performance. This study focuses on comparing experimental data for the passive façade with numerical simulations conducted in ANSYS Fluent 17, proposing optimization options based on the analysis of temperature and velocity fields within the façade. The results reveal the dynamics of natural free convection within the passive façade, the presence of recirculation zones in the experimental model, and the manifestation of the “chimney effect” observed in the temperature analysis of the façade’s interior in both experimental and numerical models. ANSYS Fluent 17 is a numerical simulation software used extensively in engineering and research to provide precise and comprehensive solutions for complex fluid dynamics problems. Although there is a body of existing research, the need for further investigation into façade design, control, and optimization continues.
1. Introduction
Measures to improve the energy performance of a building and protect the environment must be addressed differently in various phases of a project (design, construction, operation, post-use) [1]. Different methodologies are used in selecting the most appropriate action or strategy for improving energy efficiency and reducing environmental impact whether in the design phase or the operational phase [2].
In most cases, the designer creates a simulation of the building model to assess design aspects and solutions, of course, subject to the client’s subjective preferences (building cost, energy efficiency, aesthetics, etc.) [3].
Creating a high-quality indoor environment at an affordable cost has always been a challenge for the construction industry. As current demands are high, the list of client requirements now includes aspects related to sustainability [4] as well as the availability of new materials and systems that can be used [5]. This new challenge increasingly tests the qualities, expertise, and skills of engineers.
Buildings with passive façades are of interest to architects because they provide increased natural light during the day, create aesthetic value, and offer enhanced acoustic comfort. However, compared to buildings with conventional exterior enclosures, glazed buildings are generally more sensitive to current climatic conditions due to their high exposure to solar radiation, which affects the thermal comfort of the occupants [6].
Numerous studies have highlighted the significant impact of passive façades on the energy and indoor thermal performance of buildings. A study conducted by a team of researchers [7] demonstrated that the transition from a conventional façade to a passive one reduced the buildings energy demand and minimized overheating during the warmer season. Additionally, reducing the window-to-wall ratio contributed to energy efficiency. The results also suggest that solar control strategies may be necessary even in Nordic climates for buildings with glazed façades. The research conducted [8] analyzes various passive façade systems for air-conditioned buildings located in hot and humid climates, highlighting that the energy performance of these façades is influenced by the airflow within the channel and the level of exposure to solar radiation. The study evaluated design solutions for an energy-efficient passive façade [9] for a high-rise office building with a glazed façade, located in a temperate climate, highlighting that the type of glazing and the window-to-wall ratio were among the most important parameters analyzed. In a recent analysis of indoor thermal comfort and energy savings in residential buildings located in hot climates, another study [10] analyzed the impact of the window-to-wall ratio, glazing type, and influence of building orientation relative to the sun and the placement of shading elements on cooling demand and indoor thermal comfort during the summer for a building in Taiwan.
A team of researchers [11] conducted a sensitivity analysis to evaluate the impact of various glazing and shading design parameters on the energy performance and indoor thermal comfort of a passive façade office building in Amritsar, India. Another study [12] investigated natural ventilation during the day and night in a multi-story office building with a passive façade connected to rooms on each floor. When the building was exposed to variable wind speeds and solar radiation, it was shown that façade ventilation was primarily driven by wind at the upper floors.
The study conducted [13] presents a combination of an energy simulation program and a CFD package OpenFOAM (software that provides tools for performing thermal simulations for fluid flow scenarios. This software offers high simulation accuracy and is used for the experimental validation of projects). It investigated a passive façade with a cavity containing a shading device exposed to solar radiation. The results show that the air temperature in the façade cavity increases fairly linearly toward the upper part of the façade with the air reaching higher temperatures near the shading device. Another two-dimensional study of a numerical model for a passive façade [14], both mechanically and naturally ventilated, was based on the finite volume method. The conclusions state that obtaining an accurate expression for the heat transfer coefficient is challenging due to the complexity of the system, and the numerical results depend on the accuracy of input parameters, the value of the convective heat transfer coefficient, and numerical errors. Another two-dimensional numerical study [15] was conducted to examine fluid heat transfer through natural convection in a tall cavity under both laminar and turbulent flow regimes (using the k-ε turbulence model). The study found that the Nusselt number in turbulent convection increases with an increasing aspect ratio, whereas in laminar convection, the Nusselt number decreases as the aspect ratio increases. For modeling thermal flux and temperature within a double-skin façade, a research team conducted a study [16] using the zonal energy equation, which illustrated the temperature distribution within the façade. The results revealed that the zonal approach could be employed to provide insights into façade performance more quickly, requiring fewer computational resources. Regarding the measurement of airflow velocity in a double-skin façade, another study [17] compared three traditional techniques used for measuring fluid flow in ventilated façades. These techniques are distinguished by pressure testing through an orifice in the façade, anemometry, and fluid flow visualization using a marking gas with specific properties.
Numerous case studies have explored the energy performance benefits of implementing passive façades. Several examples are presented below. In the context of the tropical climate in Malaysia [18], high exposure to solar radiation on east–west facing façades leads to overheating of the interior spaces adjacent to the glazed openings. The placement of passive façades is one of the effective solutions for managing solar gains in tropical regions. The results obtained suggest that the passive façade effectively contributes to controlling heat gains due to the temperature differences between the exterior and interior and the variability of surface temperatures. The case study enabled a comparison between experimental data and numerical model results for a passive façade in a hot Iranian climate [19]. The model’s validity was confirmed by the strong agreement between the two datasets. In terms of energy performance, thermographic images highlighted an energy savings of 0.27–0.42 kW/h/m2/day due to a reduction in the supply air temperature of the air conditioning system by 4–6 °C.
In the context of older residential buildings with suboptimal thermal performance situated in Mediterranean climates [20], enhancing thermal insulation has demonstrated superior efficacy in reducing energy consumption and improving thermal comfort compared to the implementation of double skin façades. These findings underscore the importance of customizing renovation strategies to accommodate the unique characteristics of each building and prioritizing interventions that maximize energy efficiency and occupant well-being. In this study [21], a novel passive façade configuration with an intelligent greenhouse effect control system was developed and numerically simulated using a two-dimensional Computational Fluid Dynamics (CFD) method. The numerical model integrated an optically smart thin material based on tungsten (W) doped vanadium dioxide (VO2) and a high-absorbing aluminum nitride (AlN) layer. Through a parametric analysis of the air cavity thickness, results were obtained that highlighted a significant reduction in thermal loads both in the heating and cooling seasons. Additionally, an improvement in indoor thermal comfort was observed with significant variations in the indoor surface temperature depending on the season. The interaction between natural convection and radiation phenomena in the air cavity was analyzed in detail, highlighting a significant influence on the system performance.
The above literature highlights that passive façades have recently become a topic of growing interest. However, there remains a need to acquire the necessary knowledge for their design and control. They are applied both quantitatively and qualitatively across a wide range of building types and climatic conditions.
The main contributions and novelty elements of this paper can be summarized as follows: the experimental modeling revealed the occurrence of air recirculation zones within the passive façade, observed in the velocity field analysis, which exhibited a nonlinear behavior with pronounced oscillations in the lower and upper parts of the façade. The temperature field analysis in the experimental modeling highlighted the dynamics of airflow generated by buoyancy forces, which are caused by density differences between warm air rising and cool air descending. This process creates a continuous vertical movement supported by pressure differences that draw fresh air into the base of the façade. In the numerical modeling, at the lateral extremities of the façade, the analysis of velocity field variations revealed the influence of the boundary layer, leading to a non-uniform distribution within the façade.
The paper is organized as follows: Section 2 presents the research materials and methods used. Section 3 discusses the case study on experimental and numerical modeling of a passive façade and the results obtained through both investigation methods. Section 4 provides a comparison of the results obtained using the two methods and discussions on their implications for energy efficiency. Finally, the conclusions of this article are summarized in Section 5.
2. Materials and Methods
In the process of analyzing a passive façade, a crucial step is the detailed examination of numerous variables followed by their implementation into a model suitable for simulation.
This section describes the physical–mathematical modeling of heat transfer processes that occur in passive façades. This modeling will serve to establish the conditions required for simulations with the ultimate goal of validating the processes within the system and subsequently comparing them with values obtained from experimental measurements.
The equations describing flow phenomena are partial differential equations. In general, these equations can be linear, where no products between variables and their derivatives are present, or nonlinear, where such products appear. Based on the order of the derivatives, they can be first-order or second-order with the latter being most suitable for flow modeling. Flow modeling employs conservation equations and transport equations, which include various terms reflecting the influence of different phenomena. These equations provide a comprehensive framework for representing the complex behavior of airflow and heat transfer within passive façades.
The physical model of natural convection flow coupled with radiation in a cavity includes the transport equations of mass, momentum, energy [22] and radiative transfer [23] (Equations (1)–(6)), which are solved numerically using the finite volume method [24]. The numerical simulations are carried out for a three-dimensional, steady and turbulent flow. The thermo-physical properties of the fluid are assumed to be dependent on the temperature because Boussinesq approximation is not valid in the used temperature range [25].
The governing equations are shown below:
Continuity equation:
Momentum equations:
Energy equation [22]:
The radiative transfer equation [23] for an absorbing and scattering medium emissivity at a position in the direction is
Boundary conditions are as follows:
At the cube wall: T = 22 °C; ε = 0.01;
At the channel glass (left side): ε = 0.89;
At the channel glass (left side): heat flux = 196 w/m2;
At the channel glass (left side): δ = 0.006 m;
At the channel wall: ε = 0.28;
At the channel wall: δ = 0.01 m;
Boundary conditions are constraints imposed on the boundaries of the analysis domain. These constraints can be of two types:
- -
- Dirichlet boundary conditions, where the values of the dependent variable are specified on the given boundary;
- -
- Neumann boundary conditions, where the gradient of the dependent variable is specified in the normal direction on the given boundary;
If both Dirichlet and Neumann conditions are imposed on a specified boundary, they are referred to as Cauchy boundary conditions. If linear combinations of Dirichlet and Neumann conditions are imposed on the specified boundary, they are referred to as Robin boundary conditions. When different types of boundary conditions are applied to various parts of the domain boundary, they are called mixed boundary conditions. In the studied case, the boundary conditions are mixed.
To explain the boundary conditions, we will define the concepts of the dynamic boundary layer and the thermal boundary layer.
The dynamic boundary layer is defined as the region where the fluid velocity varies from zero at the surface of the body to the value corresponding to the region where the presence of the body is no longer felt. The thickness of the boundary layer, δ, is the distance y from the surface of the body where u = 0.99 uf.
The velocity profile in the boundary layer (the variation in velocity in the direction tangent to the surface with distance from the surface), u(y), allows the calculation of the unit tangential shear stress at the surface of a body in relative motion with respect to a fluid:
In the turbulent dynamic boundary layer, the particle motion is irregular and exhibits three-dimensional velocity fluctuations. These fluctuations enhance the mixing motion, leading to a thicker boundary layer and flatter velocity profiles compared to laminar flow. The appearance of the first velocity fluctuations and the homogeneous establishment of turbulent vortices delimit the transient flow region. Qualitative jumps occur here regarding the increase in boundary layer thickness. As the mixing motion improves, a better thermal (or mass) energy transfer is achieved with convective coefficients being higher under turbulent flow conditions.
In more complex models, the boundary layer is designed as consisting of three distinct regions:
- -
- Laminar or viscous sublayer—a predominantly viscous region near the surface, where momentum transfer occurs mainly through friction mechanisms and molecular diffusion, and the velocity profile is nearly linear;
- -
- Transition layer—where the diffusion and turbulent motion are comparable;
- -
- Turbulent boundary layer region—where momentum transfer is dominated by turbulent mixing motion;
For heat transfer between a fluid and a surface, most of the temperature variation occurs in a very narrow region near the surface.
Consider a fluid at temperature tf flowing over a plate with temperature ts. The fluid particles that come into contact with the plate reach thermal equilibrium at the temperature of the plate surface. These particles exchange energy with the fluid particles in the neighboring layer, which in turn exchange energy with the particles in the next layer, establishing a temperature gradient in the fluid.
The region in the fluid where the temperature gradient establishes is called the thermal boundary layer. The thickness of this layer is defined as the distance y from the contact surface at which 99% of the temperature variation occurs.
The unit thermal flux qs transferred at the contact surface can be expressed by Fourier’s law as a function of the thermal conductivity λf and the temperature gradient at the surface (y = 0).
Outside the purely conductive boundary layer in the immediate vicinity of the surface, the same thermal flux is transferred through the fluid both by conduction and, to a greater extent, by the bulk movement of the fluid. Thus, the local heat transfer coefficient by convection, α, will be:
One of the earliest attempts in the laminar case using an integral formalism for Pr > 0.6 and suggesting the thermal to velocity layer thickness ratio ∆ to be only Prandtl number dependent was that of [26]. Deduced results showed a good agreement against both experimental data [27] and numerical ones from the similarity method [28]. Since there are no results in literature dealing with the growth of viscous and thermal layers, the present theory is established under the rough assumption that these laminar results can be easily extended to the turbulent regime:
The values of the ∆ ratio for different Prandtl numbers cover the physical situation where ∂(x) > ∂t(x), which correspond to common fluids such as Pr > 0.636. Therefore, using assumption (10), the integral forms of the energy and motion equations in the boundary layer are [29].
The local Nusselt number is defined by
Introducing as a function of the ∆ boundary layer ratio
both the dynamical boundary layer and the Nusselt number result from the Prandtl number (Δ is only Pr dependent) and are expressed by
is the local modified Rayleigh number defined by
3. Experimental and Numerical Modeling (Case Study)
3.1. Experimental Modeling
3.1.1. Geometry of the Experimental Model of the Passive Façade
This section presents the experimental research on the dynamics of natural free convection created inside double façades with the following dimensions: 1.40 × 2.08 m, as described in Figure 1. The passive façade is made of a single layer of glass with a thickness of 6 mm, and the interior façade is double-glazed with two layers of glass: one with a thickness of 6 mm and the other with a thickness of 5 mm. The space between these layers is 16 mm. The distance between the façades is 0.12 m. The inlet and outlet sections are 0.08 m.
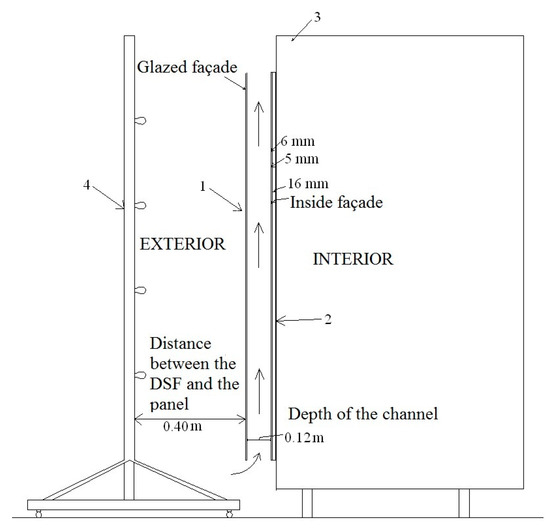
Figure 1.
The experimental setup of the passive façade. 1. glazed façade (1.90 m × 1.40 m); 2. interior façade (1.90 m × 1.40 m); 3. a chamber adjacent to the passive façade; 4. a panel equipped with 12 OSRAM solar lamps type Ultra Vitalux with the power of 300 W.
The channel inside the passive façade (the one that we are actually studying) has the dimensions: 1.40 × 1.90 m. The thermo-optical characteristics of the passive façade are shown in Table 1.

Table 1.
Thermo-optical characteristics.
The thermo-aerodynamic behavior of the passive façade depends on the heat transfer mode: convection (natural, forced, or mixed), solar radiation, and conduction. The flow model studied is natural convection, and it is characterized by the fact that the airflow is driven by Archimedean forces and determined by air density differences. The evolution of the velocity and temperature fields inside is mainly influenced by convection and radiation. As such, the thermal balance is defined based on the components of the façade and its characteristics. The air temperature at the entrance to the channel, corresponding to the temperature in the laboratory, was 22 °C.
3.1.2. Measuring Devices
For measuring the relevant parameters, the experimental setup was equipped with a series of measuring instruments and data acquisition devices presented in Table 2.

Table 2.
Measuring parameters and devices.
3.1.3. Measurement and Data Acquisition Methods
To measure the temperatures inside the façade, temperature sensors were placed following a matrix of three rows and five columns. The sensors were positioned to cover the areas of interest relevant to the study of heat transfer within the system as follows.
The first row of sensors was placed at the lower part of the façade, which is also known as the entry. The second row of sensors was positioned at the middle of the façade at a height of 1.04 m. The last row of sensors was placed at the upper part of the façade, also known as the exit, at a height of 2.08 m.
All temperature sensors are positioned inside the glazing surfaces and are connected to the temperature data acquisition system, Data Logger MS5, which was programmed to record measurements every 120 s. All temperature measurements were made continuously, monitored for 2 h and 15 min, as shown in the graphs in Figure 2 and Figure 3, where the temperature variation is presented until the temperature stabilizes in steady-state conditions.
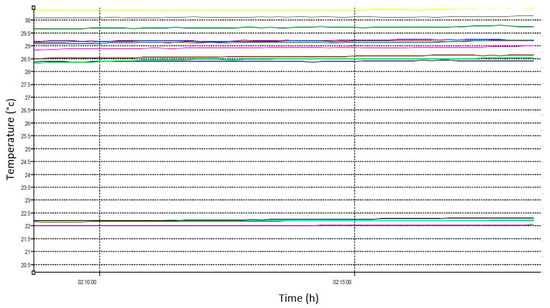
Figure 2.
The temperature variation in the façade over 2 h and 10 min until steady-state conditions.
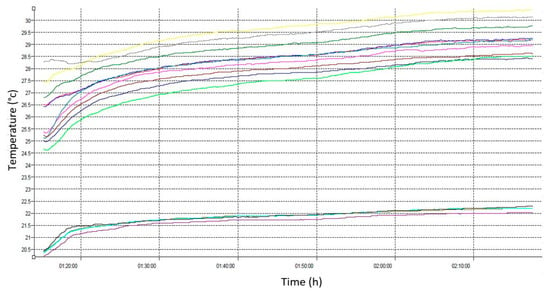
Figure 3.
The temperature variation in the façade during the last 5 min.
The temperatures in the cavity were measured using 14 temperature probes, which were placed as follows: four probes in the entrance section (y = 0 m), five probes in the middle of the façade (y = 1.40 m), and five probes in the exit section (y = 2.80 m). The placement of the temperature sensors in the input, middle, and output sections is shown in Figure 4.
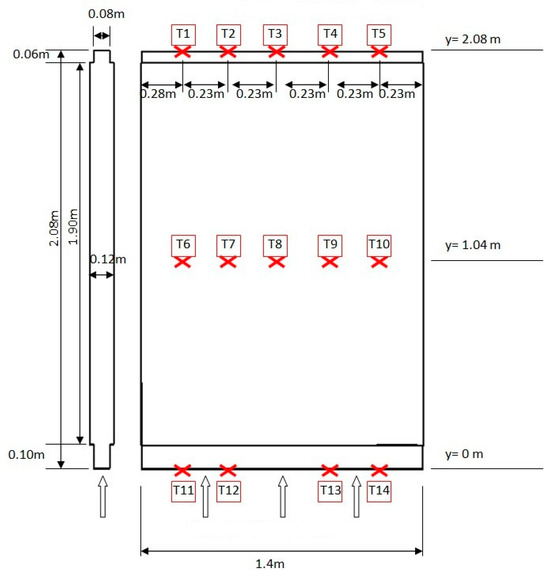
Figure 4.
The placement of the temperature sensors in the input, middle, and output sections.
Therefore, different temperatures were recorded: in the entrance section, an average temperature of 22 °C, and in the exit section, an average temperature of 29.76 °C, as shown in Figure 5.
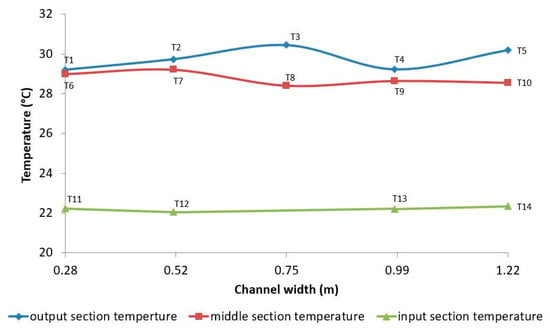
Figure 5.
The variation in temperatures measured in the input, middle, and output sections.
The radiant flux is applied over the entire surface of the façade using a simulator equipped with 12 OSRAM Ultra Vitalux 300 W solar lamps (OSRAM GmbH, Munich, Germany) which were placed equidistantly at 0.42 m on four lines and three columns. The radiative spectrum of the lamps is shown in Figure 6.
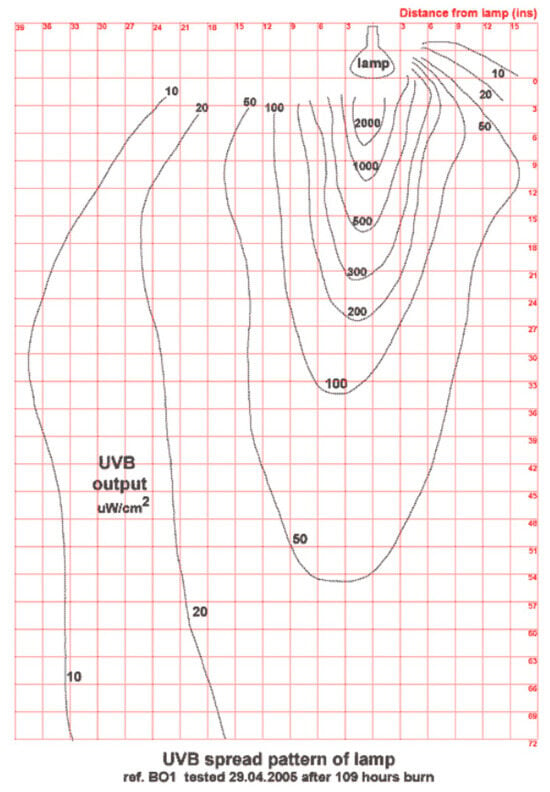
Figure 6.
The radiative spectrum of the OSRAM Ultra Vitalux 300 W solar lamps.
The solar radiation intensity was measured at several points on the outer side of the first glazing and on the inner side of the first glazing (inside the channel). The measurements were performed through direct readings, as the portable device used does not allow for the acquisition and storage of the measured data. Based on the measured values presented in Table 3, iso-flux lines were drawn by interpolation using the TopoLt application 17 running under AutoCAD 2024.

Table 3.
Measured values of radiative flux intensity.
The panel is placed parallel to the glazed façade at a distance of 0.40 m. The average heat flux transmitted through the radiant flux on the glazed façade is 196 W/m2, as shown in Figure 7. The light source emits UVA rays between 320 and 400 nanometers (nm), UVB rays between 300 and 400 nm, and infrared radiation starting from 780 nm.
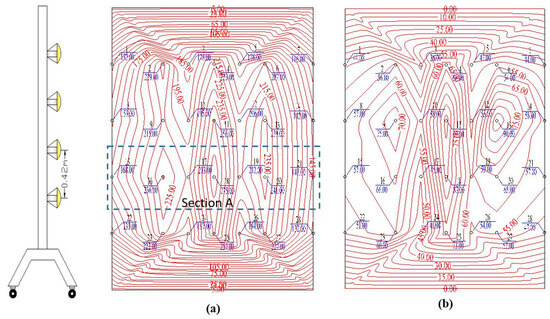
Figure 7.
Spectra of radiant flux intensity: (a) exterior glazing (b) interior glazing.
Figure 8 and Figure 9 provide detailed information on the intensity spectra of the radiative flux within section A.
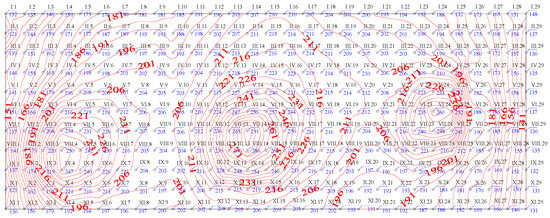
Figure 8.
Details regarding the spectra of radiant flux intensity in section A, exterior glazing, outer side.
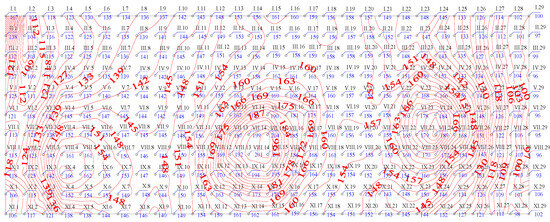
Figure 9.
Details regarding the spectra of radiant flux intensity in section A, exterior glazing, inner side (inside the channel).
The velocity measurements were taken under natural ventilation conditions, 2 h and 15 min after the lamps were turned on, at various points relevant to this study. Since long-term simultaneous measurements could not be made at all the points of interest, local measurements were performed with the available equipment for shorter periods of time. The first velocity measurements in the system were made perpendicular to the airflow direction. The measurements were taken under natural ventilation conditions.
All these measurements were performed using a turbine anemometer and a hot-wire anemometer. The first set of velocity measurements was made in the air intake area inside the façade cavity. The last set of velocity measurements was made in the air outlet area from the inside of the façade cavity at a height of 2.08 m.
Various velocities were recorded: in the inlet section, an average velocity of 0.326 m/s, and in the outlet section, an average velocity of 0.322 m/s. A graph of these velocities is presented in Figure 10.
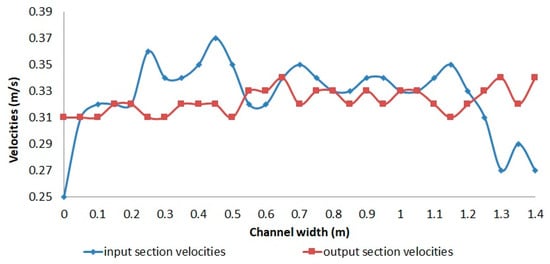
Figure 10.
The variation in velocities measured in the input and output sections.
3.2. Numerical Modeling
3.2.1. Geometry and Creation of the Discretization Mesh
The transport equations for mass, momentum, and energy are solved numerically using the finite volume method [30]. This method is based on the spatial integration of the transport equations with respect to control volumes. The coupling between velocity and pressure is achieved through the “coupled scheme” algorithm, which simultaneously solves the continuity and momentum equations, providing an advantage in handling flows with a strong interdependence between dynamic and thermal fields.
Also, for radiation modeling, the “Surface to Surface” radiation model can be used with a method based on shape factors. This model considers the radiative heat exchange between gray walls and Lambertian surfaces [31]. Natural convection flow, coupled with radiation in a cavity, is turbulent. The turbulence is modeled using the k-ω SST turbulence model [32]. Numerical simulations were carried out using the commercial CFD software ANSYS Fluent 17.
The discretization grid in the electric heater area was made fine and structured. The grid (1,890,000 cells) is structured and refined near the walls to meet the turbulence model condition (y+ = 1), as shown in Figure 11. This grid becomes coarser as it moves away from the walls in order to optimize the computation time. The convergence criteria were based on the residuals resulting from the integration of the conservation Equations (1)–(6) over the finite control volumes. During the iterative calculation process, these residuals were continuously monitored and analyzed. For all simulations performed in this study, convergent solutions were achieved with residuals smaller than 10−5 (or smaller) for all governing equations.
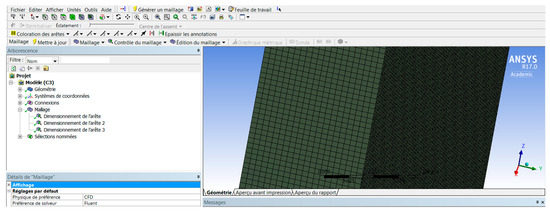
Figure 11.
Creation of the discretization grid in ANSYS Fluent 17 Mesh.
During the calculation process of solving the system of equations, it is necessary to know the adjacent cells of each cell, as well as which nodes, edges, and faces are common to two or more cells. This information is stored in the connectivity matrix. If the grid nodes are arranged regularly, the information in the connectivity matrix can be generated in real time through an algorithm, and the existence of the connectivity matrix is not required. In this case, the grid is structured. Generally, structured grids are simple grids. For complex geometries or discretization modes, where there is no algorithm (e.g., the grid nodes were distributed irregularly), or the algorithm is unavailable (e.g., the grid was generated with another application, and its algorithm was not transferred to the solution routine), the connectivity matrix is necessary, and the grid is considered unstructured. However, an unstructured discretization grid can be adapted based on the intermediate results of the calculation, and it can be refined (densified) or coarsened in certain areas, as deemed necessary.
Any discretization method for the equations and the analysis domain leads, in the case of steady problems (time-independent), to the resolution of a linear system of equations, while for unsteady problems, it leads to the resolution of a system of differential equations, which must also be linearized. The solution of the global system of equations can be found through various methods: direct or iterative methods [33].
3.2.2. Selection of Calculation Models
In the setup section of the ANSYS Fluent 17 application, the pressure-based solver method was chosen because it applies to most flow types and offers high efficiency. However, it requires 1.5–2 times more memory than the density-based method.
Regarding the turbulence model, the standard k-ω model was initially selected, as it is a model that solves two transport equations (the kinetic energy equation k and the turbulence frequency equation ω). This model allows for a more accurate analysis of the boundary layer and is highly efficient in modeling flows with a low Reynolds number. It is much more effective under unfavorable conditions of negative pressure gradient.
The advantages of the mentioned model include high performance for the boundary layer, reverse shear, and flows with low Reynolds numbers. It can also be used for transient flows.
A major disadvantage is that it requires a finer node grid near the wall. After several attempts with the previous turbulence model, which led to inconclusive results, the transient SST k-ω turbulence model [34] was chosen. It is a model that uses four equations. The SST (“shear stress transport”) term combines the best features of the two terms. Using k-ω within the boundary layer allows the model to be applied throughout the dynamic layer down to the viscous sublayer. Thus, the SST k-ω model can be used as a turbulence model for low Reynolds numbers without additional damping functions. The SST k-ω model produces somewhat higher turbulence levels in certain regions, such as stagnation areas and regions with strong acceleration. However, this tendency is less pronounced than with a standard model.
This model provides similar benefits to the standard k-ω model and can offer detailed predictions of reverse shear between fluid layers, highlighting very accurate predictions of flow and the amount of flux separated by negative pressure gradients. The SST model is recommended for high precision in boundary layer simulations [35].
As a disadvantage, similar to the standard model, it also requires higher node grid precision near the wall. The chosen radiation model is surface-to-surface (S2S), as it allows the simulation of steady-state and transient processes, one-dimensional, two-dimensional, and three-dimensional processes, cylindrical shape processes with polar coordinates or body-fitted coordinates (BFCs), radiative heat transfer in laminar or turbulent flows, thermal transfer processes involving heat transfer, surfaces with a given heat flux or a given temperature in the boundary layer, and surfaces with radiative properties.
This model is essentially a zonal method, where the surfaces involved in the radiative heat exchange process are subdivided into a number of isothermal zones. The radiative heat exchange between surfaces requires the determination of the corresponding geometric factors or radiative exchange factors. In solving the energy equation, the model allows for radiative exchange between surfaces by imposing thermal equilibrium at each thermal zone.
Regarding the solution methods, a model using a velocity–pressure coupling scheme (Coupled) was chosen because it allows for faster convergence than the solution method using the model without velocity–pressure coupling.
In this analysis, an important factor is the interpolation of calculation methods, which is necessary for evaluating diffusion fluxes, calculating velocity deviations, as well as for higher-order discretization systems. The (least-squares cell-based) method was chosen because it is recommended for hexahedral grids.
As for the pressure calculation method, the (body force weighted) method was chosen because it is the most suitable for natural convection with a high Rayleigh number.
Regarding the momentum calculation method, the (Upwind) scheme is one of the simplest and most stable discretization schemes; however, the (Upwind) method is more dissipative depending on the flux it attempts to simulate. The (Upwind) method uses values from the extremes of a cell to calculate the value at the center of the cell, considering the flow direction.
Additionally, the main difference between first-order and second-order schemes is that the Second-Order Upwind method is much more accurate than the First-Order Upwind.
The flow field was initialized using the hybrid initialization (Initialization Hybrid) because it provides a quick approximation of the flow field through a variation in methods, solving Laplace’s equation to determine the velocity and pressure in the fields and all other variables such as temperature, turbulence, form factors, volume fractions, etc.
The simulator must perform enough iterations to obtain a convergent solution. To achieve the convergence of a solution, the following must be satisfied: all discrete conservation equations (momentum, energy, etc.) are respected in all cells with the specified tolerance (residuals), the overall mass, momentum, energy, and scalar balances are met, and the physical quantities we want to obtain reach constant values. Residuals measure the imbalance of the current numerical solution, and they are related but not equal to numerical error.
The numerical research was conducted under the following assumptions and boundary conditions:
Natural convection;
Flow regime: turbulent;
Façade geometry: 1.90 × 1.40 × 0.12 m;
Hydraulic diameter of the façade: 0.221 m;
Heat transfer coefficient: 8 W/m2 K;
Internal emissivity of the glass: 0.89;
Radiative flux intensity: 196 W/m2 (transmitted through the exterior glazed surface);
Inlet air temperature: 22 °C.
3.2.3. Measurement and Data Acquisition Strategies
The heat transfer and energy performance of passive façades are influenced by the velocity and temperature fields inside the cavity, thus by the convective heat transfer coefficients, which can vary depending on the ventilation strategy chosen for the cavity (in this case, natural ventilation) and the presence or absence of solar radiation (in this case with the presence of radiation). The present numerical study aims to investigate these factors in detail, based on the existing model of the passive façade shown in Figure 12, as presented in Section 3.1.
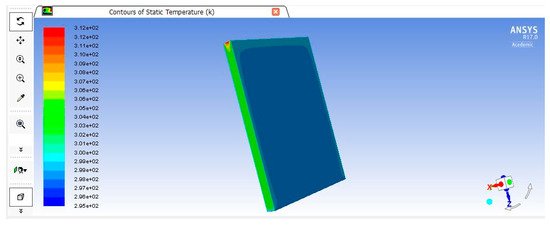
Figure 12.
The passive façade in ANSYS Fluent 17.
Following the simulation and after achieving convergence, the temperatures on the façade surface are presented, which are highlighted by temperature sections located at the middle of the input, middle, and output sections.
As can be seen from the figures presented below, in Figure 13 and Figure 14, the temperature lines evolve linearly and are directly proportional to the height of the passive façade. It is also observed that in the entry, middle, and exit sections, the temperature at the lateral extremities of the façade is higher compared to the temperature recorded in the middle part of the façade, where the evolution is constant, according to the data in Table 4.
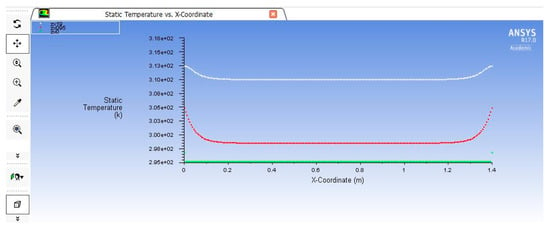
Figure 13.
The variation in temperatures in the input, middle, and output sections of the passive façade in ANSYS Fluent 17.
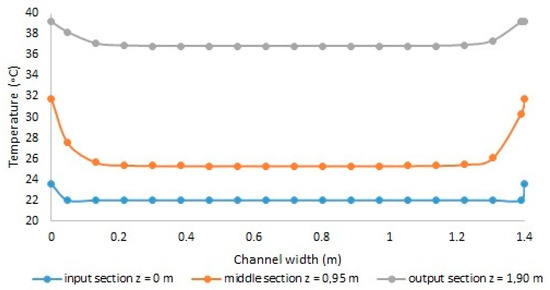
Figure 14.
The variation in temperatures in the input, middle, and output sections.

Table 4.
The variation in temperatures in the input, middle, and output sections.
For better visualization of the velocity variations, Figure 15 and Figure 16 present data highlighting the velocity differences.
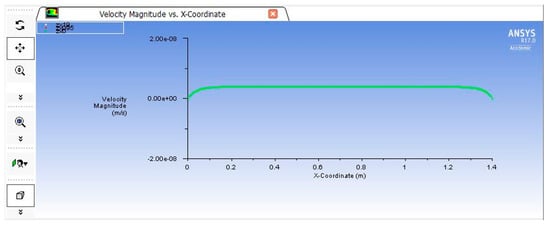
Figure 15.
Variation in velocities in the input, middle, and output sections of the passive façade in ANSYS Fluent 17.
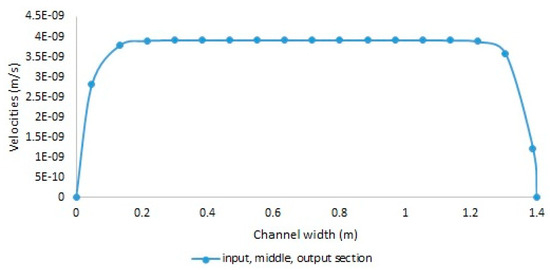
Figure 16.
Variation in velocities in the input, middle, and output sections.
From the figures describing the velocity lines in the passive façade, it can be observed that the velocity evolves linearly only at the lateral parts of the façade, while in the middle section, the velocity remains constant. It is also observed that the velocity does not change with the height of the façade, which means that the velocity gradient is either constant or zero, according to the data in Table 5.

Table 5.
The variation in velocities in the input, middle, and output sections.
4. Results
4.1. Comparison of Temperatures
As a result of comparing the experimental model with the numerical model, it is observed that in the case of the experimental model, temperatures in the entrance, middle, and exit sections vary non-linearly, as shown in Figure 17, indicating the presence of recirculation zones [36]. Additionally, the temperature lines change very little in the upper part of the façade (from the middle to the exit). In the case of the numerical model, temperatures between the entrance, middle, and exit sections follow a linear progression across the entire height of the façade, as shown in Figure 18, suggesting that there are no recirculation zones inside the façade cavity.
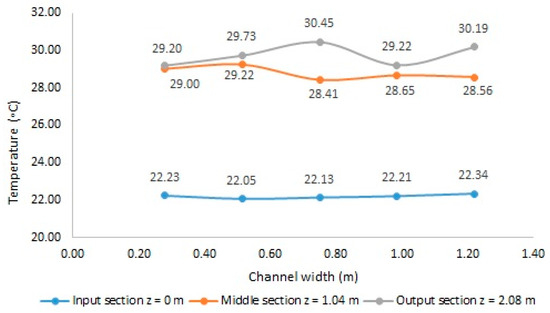
Figure 17.
Variation in temperatures measured in the input, middle, and output sections, experimentally.
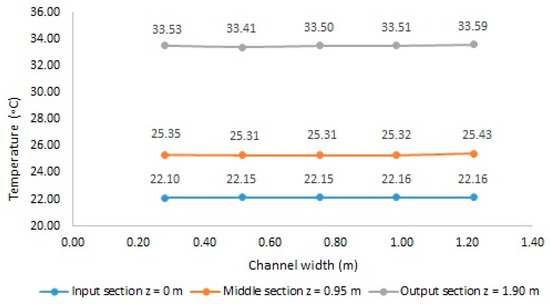
Figure 18.
Variation in temperatures measured in the input, middle, and output sections, numerically.
In the process of analyzing the thermal behavior of the passive façade, the experimental model shows a minimum recorded temperature in the façade cavity of 22.05 °C and a maximum temperature of 30.45 °C. In the numerical model, a minimum recorded temperature of 22.10 °C and a maximum temperature of 33.59 °C are observed. The difference between the minimum absolute temperatures recorded is 0.50 °C, and the difference between the maximum absolute temperatures recorded for the two models is 3.14 °C.
4.2. Comparison of Velocities
In the case of the analysis of the velocity lines in the experimental model, it is observed that the velocity lines do not follow a linear progression, as shown in Figure 19, and there is a possibility of recirculation zones within the cavity of the façade. In contrast, in the numerical model, the velocity lines evolve linearly, as shown in Figure 20, and it is observed that the velocity is constant toward the middle of the façade (velocity does not vary with the height of the façade). Additionally, in the numerical model, there is no variation in velocity between the inlet and outlet sections.
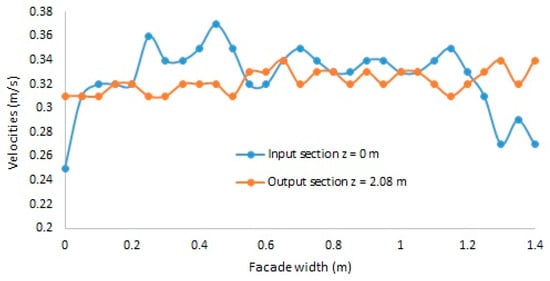
Figure 19.
The variation in the velocities measured in the input, middle, and output sections, experimentally.
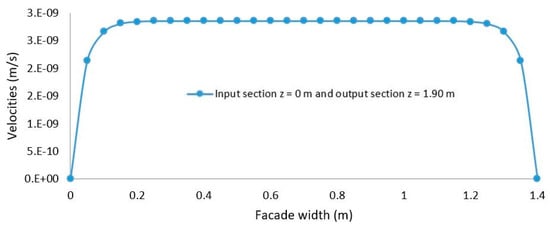
Figure 20.
The variation in the velocities measured in the input, middle, and output sections, numerically.
Analyzing the behavior of the passive façade in terms of the velocity lines, it is found that in the experimental model, the velocity increases with height, whereas in the numerical model, the velocity gradient is constant or null [37]. A significant difference is also observed between the experimental model, where the velocities are of the order of 10−1, and the numerical model, where the velocity order of magnitude is 10−9.
The flow model analyzed is that of natural convection [38], where the air flow is generated by the Archimedean forces that arise due to the density differences in the air caused by temperature variations. This phenomenon is crucial in the spaces between the two layers of the façade, where warm air rises, creating a continuous circuit that helps achieve thermal transfer.
The evolution of the velocity and temperature fields inside the cavity is mainly dictated by the interaction between convection and thermal radiation [39]. For example, solar radiation heats the glazed surfaces and the air in the cavity, amplifying the natural convection effect. At the same time, the thermal characteristics of the materials used (such as the thermal transfer coefficient and emissivity) play an important role in how heat is transferred by conduction and emitted by radiation.
The overall thermal balance of the façade is defined by these processes and is influenced by specific components of the façade, such as the type of glass used, the thickness of the cavity, and its ventilation level [40]. Therefore, the overall performance of the passive façade depends on optimizing these variables to minimize heat loss in the cold season and reduce excessive solar gains in the hot season in order to achieve high thermal comfort inside the building.
5. Discussion
The temperature field analysis in the experimental model indicated the dynamics of the airflow generated by the Archimedean forces, produced by the differences between the warm air, which has a lower density and rises naturally, while the cooler, denser air descends. This exchange creates continuous vertical movement. Pressure decreases with altitude in enclosed spaces, and the rising warm air generates a low-pressure zone at the top, drawing fresh air from the outside at the base. This pressure difference supports air circulation, improving natural ventilation. The phenomenon described above was observed in the spaces between the two layers of the façade, where the temperature gradient has a linear evolution and increases proportionally with the height of the façade.
Additionally, the numerical modeling allowed for a detailed analysis of the variations in the velocity field at the lateral extremities of the façade, revealing the role of the boundary layer in modulating airflows. The boundary layer, defined by rapid variations in velocity near solid surfaces, significantly influences the distribution of air inside the façade, contributing to the creation of a complex and non-uniform circulation. These findings offer new perspectives for optimizing the design of passive façades, emphasizing the importance of a deep understanding of the dynamic phenomena involved.
Directions for improving the energy performance of the passive façade can be considered based on the analysis of the experimental model, where an increase in velocity with height was observed. Additional opening systems (ventilation hatches) can be implemented at the lower and upper parts of the passive façades of buildings, which can facilitate natural ventilation during summer. When the hatches are open on a sunny day, warm air rises and exits through the open hatches at the top, drawing in cool air through the façade cavity. This phenomenon, known as the “chimney effect”, allows for interior cooling and ventilation without the need for mechanical ventilation systems.
The optimal sizing of the cavity between the glazed layers of the passive façade can bring significant energy gains by reducing the need for cooling or heating. The numerical research conducted regarding the temperature and velocity lines can be repeated by selecting different cavity dimensions of the façade, allowing for various energy optimization scenarios.
The implementation of integrated shading devices inside the façade cavity can bring significant improvements to the building’s energy performance by reducing excessive heating during the warm season and optimizing energy use for air conditioning. These devices can be designed to automatically adjust to the level of solar radiation, ensuring an optimal balance between interior thermal comfort and energy consumption. The previously conducted analysis of the experimental data can be repeated using the same input parameters, but with the integration of these shading systems, in order to compare and evaluate the direct impact on the building’s energy performance. By incorporating these shading devices, consistent data can be obtained regarding the reduction in energy demand for cooling and heating, thus highlighting the potential of this solution to improve energy efficiency.
Furthermore, this approach can contribute to increasing the sustainability of modern buildings and reducing their carbon footprint, providing long-term benefits both for users and the environment.
Future research aims to extend this study through a series of experiments evaluating the influence of varying cavity depth on the energy performance of passive façades. By systematically adjusting the cavity depth between 0.04 m and 0.12 m, the hypothesis that increasing cavity width enhances system energy efficiency will be rigorously tested. While theoretical models support this relationship, experimental and numerical validation is essential. A detailed analysis of velocity fields and temperature distribution within the cavity will provide insights into the underlying physical mechanisms and how varying depths impact natural convection and air recirculation patterns. The findings of this study will contribute to optimizing passive façade design, leading to more energy-efficient building solutions and addressing the pressing need for reduced energy consumption in the built environment.
Future research could explore the introduction of an additional glass layer, trans-forming the façade into a triple-glazing configuration, which could significantly reduce thermal losses by improving insulation. This solution could have the potential to substantially enhance the building’s energy performance while ensuring a more efficient control of interior thermal comfort in varying climatic conditions. The analysis of the impact of adding an extra layer could include evaluating the influence on airflow within the cavity, solar transmittance, and the overall efficiency of the façade, thus contributing to the development of innovative, sustainable, and energy-efficient solutions for contemporary buildings.
6. Conclusions
The conclusions of the conducted research highlight the thermo-aerodynamic behavior of passive façades, focusing on the identification and characterization of the complex phenomena that influence energy efficiency and natural ventilation. The experimental modeling revealed the formation of air recirculation zones within the cavity of the passive façade, which are associated with the analysis of the velocity field. The observed nonlinear behavior is manifested through significant oscillations in the lower and upper regions of the façade, affecting the air flow distribution and heat transfer.
This study makes a significant contribution to the existing body of knowledge regarding fluid dynamics in passive façades. The direct observation of the “chimney effect” both in the experiment and in the numerical simulation substantially strengthens the theoretical understanding of these complex systems. Furthermore, the identification of recirculation zones in the experimental model reveals an unexpected complexity of internal flows, suggesting the existence of not fully understood physical mechanisms. These results open up promising avenues for future research, which could explore in detail the interactions between the various physical phenomena present in the cavity of passive façades.
A limitation of the presented study is the absence of a quantitative evaluation of the experimental model energy performance through thermal simulations. Integrating specialized thermal simulation software would enable a detailed analysis of heat fluxes through the façade, allowing for a more accurate validation of the experimental results. Additionally, a complementary approach would be to develop a mathematical model of the façade structural elements, considering thermal parameters such as thermal conductivity, thermal resistance, and heat transfer coefficient. A thorough comparison between the results obtained through numerical simulation and analytical calculations would provide a deeper understanding of the façade thermal behavior and allow for the identification of any discrepancies between the theoretical model and experimental reality.
The presented work can be enhanced by including a section dedicated to a comparative analysis of heat fluxes through the passive façade both in the heating and cooling seasons. By comparing values obtained in these simulation scenarios and calculating energy losses for each scenario, it is possible to accurately determine energy losses and heat gains, providing an objective assessment of the efficiency of the proposed conditions (heating/cooling). The analysis will answer the research question: How do heat losses/gains change in the heating/cooling season as a result of the simulation?
Passive façades are promoted by architects and clients primarily for their remarkable architecture, but they present a true challenge for HVAC engineers, who must present the benefits of the system from the perspective of thermal ambiance, depending on various external climatic conditions, natural lighting, cooling and heating requirements, ventilation, CO2 emissions control, potential condensation, noise reduction, fire risk, the evacuation of hot gases and smoke in case of fire, etc. In this context, engineers have three approaches at their disposal to address these issues: conducting experiments by building a scaled-down model, computer simulations, or using physical–mathematical methods. This paper analyzed all three approaches.
Each of the three methods used has its advantages and disadvantages. In short, the experimental method provides valuable information but comes with high costs; the physical–mathematical method produces theoretical results that must always be verified with another method and also requires consulting a considerable bibliography; while computer simulations bridge theoretical principles with practical results, often requiring a high-performance workstation paired with powerful software, which ultimately means a significant initial investment.
Due to the fact that only a limited number of cases have exact analytical solutions, the majority of studies are conducted using either numerical or experimental methods. Calculations made using solely numerical methods can lead to inaccurate results due to the influence of dynamic and thermal boundary layers or errors in computation. On the other hand, using only experimental methods presents difficulties, as it is limited by specific characteristics and often does not allow for a complete solution to the problem. Hence, there is a significant interest in combining analytical, numerical, and experimental methods. The numerical method using finite volumes is increasingly developing and being implemented in flow analysis with the programs used being powerful and increasingly specialized in different fields. Overall, even though the costs of such software platforms are high, the finite volume method is the most cost-effective in terms of the total cost of the result obtained.
Numerical simulation allows for an easy determination of velocity, temperature, pressure fields, and boundary layer calculations. However, to validate the numerical model, experimental analyses are necessary to provide comparable data for model validation. Once a numerical model is validated with experimental data, the possibilities for processing analysis results are limitless.
In the case studied in this paper, the numerical model was not validated with experimental data but serves as a good starting point for future research and represents an important step toward validation.
In the long term, integrating passive façades into building design can contribute to sustainability by optimizing energy consumption and reducing carbon emissions. However, a detailed and personalized analysis for each project is needed, depending on the climatic context and building use, to maximize their potential and justify the investment. Thus, passive façades offer a promising opportunity for the development of modern, energy-efficient, and environmentally friendly buildings.
Author Contributions
All authors contributed equally to the idea and the design of the methodology proposed, and to the production of the research paper. Conceptualization, E.I., P.A. and C.U.; methodology, E.I. and P.A.; software, E.I. and L.D.M.; validation, P.A., C.U. and L.D.M.; formal analysis, C.U. and P.A.; investigation, E.I. and P.A.; resources, L.D.M.; writing—review and editing, E.I. and P.A.; visualization, E.I. and L.D.M.; supervision, L.D.M. and P.A. All authors have read and agreed to the published version of the manuscript.
Funding
This research received no external funding.
Data Availability Statement
The original contributions presented in the study are included in the article, further inquiries can be directed to the corresponding author.
Conflicts of Interest
The author declares no conflicts of interest.
Nomenclature
| a | surface area of the object, m2 |
| Cp | specific heat capacity, J/kg K |
| g | acceleration of gravity, m/s2 |
| k | thermal conductivity, W/m K |
| H | height, m |
| I | radiation intensity |
| n | surface normal, m |
| Nu | Nusselt number |
| Pr | Prandtl number (Cpμ/k) |
| Ra* | modified Rayleigh number |
| position vector | |
| s | path length |
| direction vector | |
| scattering direction vector | |
| T | temperature, K |
| V | speed of flow in convection m/s |
| u, v, w | axial and transverse velocity components, m/s |
| x, y, z | axial and transverse coordinates |
| Greek letters | |
| β | coefficient of thermal expansion k−1 |
| Δ | boundary layer ratio |
| Δt | time step |
| ∂ | dynamical boundary layer thickness, m |
| ∂t | thermal boundary layer thickness, m |
| ε | emissivity |
| ρ | density, kg/m3 |
| ν | kinematic viscosity, m2/s |
| λ | coefficient of Darcy |
| μ | dynamic viscosity, Pa s |
| φ | heat flux density, W/m2 |
| ΠΔ | function of the Δ boundary layer ratio |
| σ | Stefan–Boltzmann constant |
| Ω | solid angle |
| Φ | phase function |
References
- Cho, B.J.; Yoo, C.; Kim, Y. Viability of exterior shading devices for high-rise residential buildings: Case study for cooling energy saving and economic feasibility analysis. Energy Build. 2014, 82, 771–785. [Google Scholar] [CrossRef]
- Gil-Baez, M.; Padura, Á.B.; Huelva, M.M. Passive actions in the building envelope to enhance sustainability of schools in a Mediterranean climate. Energy 2019, 167, 144–158. [Google Scholar] [CrossRef]
- Harkouss, F.; Fardoun, F.; Biwole, P.H. Passive design optimization of low energy buildings in different climates. Energy 2018, 165, 591–613. [Google Scholar] [CrossRef]
- Ifrim, V.C.; Milici, L.D.; Atănăsoae, P.; Irimia, D.; Pentiuc, R.D. Future Research Tendencies and Possibilities of Using Cogeneration Applications of Solar Air Heaters: A Bibliometric Analysis. Energies 2022, 15, 7114. [Google Scholar] [CrossRef]
- Pop, T.; Ungureanu, C.; Pentiuc, R.D.; Afanasov, C.; Ifrim, V.C.; Atănăsoae, P.; Milici, L.D. Off-Grid Hybrid Renewable Energy System Operation in Different Scenarios for Household Consumers. Energies 2023, 16, 2992. [Google Scholar] [CrossRef]
- Oliveira, A.; Pedrini, A. Thermal performance of highly glazed office buildings in the tropics: Contradicting architectś expectations. Energy Build. 2023, 296, 113344. [Google Scholar] [CrossRef]
- Bhattacharjee, S.; Lidelöw, S.; Shadram, F. Energy and indoor thermal performance analysis of a glazed façade high-rise building under various Nordic climatic conditions. Energy Rep. 2023, 10, 3039–3053. [Google Scholar] [CrossRef]
- Haase, M.; Marques da Silva, F.; Amato, A. Simulation of ventilated façades in hot and humid climates. Energy Build. 2009, 41, 361–373. [Google Scholar] [CrossRef]
- Raji, B.; Tenpierik, M.J.; van den Dobbelsteen, A. An assessment of energy-saving solutions for the envelope design of high-rise buildings in temperate climates: A case study in the Netherlands. Energy Rep. 2016, 124, 210–221. [Google Scholar] [CrossRef]
- Hwang, R.-L.; Shu, S.-Y. Building envelope regulations on thermal comfort in glass façade buildings and energy-saving potential for PMV-based comfort control. Build. Environ. 2011, 46, 824–834. [Google Scholar] [CrossRef]
- Singh, R.; Buddhi, D.; Thapa, S.; Prakash, C.; Singh, R.; Sharma, A.; Sheoran, S.; Saxena, K.K. Sensitivity Analysis for Decisive Design Parameters for Energy and Indoor Visual Performances of a Glazed Façade Office Building. Sustainability 2022, 14, 14163. [Google Scholar] [CrossRef]
- Gratia, E.; Herde De, A. Optimal operation of a south double-skin façade. Energy Build. 2004, 36, 41–60. [Google Scholar] [CrossRef]
- Pappas, A.; Zhai, Z. Numerical investigation on thermal performance and correlations of double skin façade with buoyancy-driven airflow. Energy Build. 2008, 40, 466–475. [Google Scholar] [CrossRef]
- Saelens, D.; Carmeliet, J.; Hens, H. Energy Performance Assessment of Multiple-Skin Façades. HVACR Res. 2003, 9, 167–185. [Google Scholar] [CrossRef]
- Xamán, J.; Álvarez, G.; Lira, L.; Estrada, C. Numerical study of heat transfer by laminar and turbulent natural convection in tall cavities of façade elements. Energy Build. 2005, 37, 787–794. [Google Scholar] [CrossRef]
- Darkwa, Y.; Li, J.; Su, W. Investigation on Thermal Performance of an Integrated Phase Change Material Blind System for Double Skin Façade Buildings. Energy Procedia 2019, 158, 5116–5123. [Google Scholar] [CrossRef]
- Rashmi, S.; Mishra, S. Thermal Performance of Building Envelope. Int. J. Eng. Res. 2020, 9, 07. [Google Scholar] [CrossRef]
- Qahtan, A.M. Thermal performance of a double-skin façade exposed to direct solar radiation in the tropical climate of Malaysia: A case study. Case Stud. Therm. Eng. 2019, 14, 100419. [Google Scholar] [CrossRef]
- Radmard, H.; Ghadamian, H.; Esmailie, F.; Ahmadi, B.; Adl, M. Examining a numerical model validity for performance evaluation of a prototype solar oriented Double skin Façade: Estimating the technical potential for energy saving. Sol. Energy 2020, 211, 799–809. [Google Scholar] [CrossRef]
- Escamilla, A.L.; Limones, R.H.; Rodríguez, A.L.L. Double-Skin Façades for Thermal Comfort and Energy Efficiency in Mediterranean Climate Buildings: Rehabilitating Vulnerable Neighbourhood. Buildings 2024, 14, 326. [Google Scholar] [CrossRef]
- Iken, O.; Fertahi, S.D.; Dlimi, M.; Agounoun, R.; Kadiri, I.; Sbai, K. Thermal and energy performance investigation of a smart double skin façade integrating vanadium dioxide through CFD simulations. Energy Convers. Manag. 2019, 195, 650–671. [Google Scholar] [CrossRef]
- Bejan, A. Convection Heat Transfer, 4th ed.; John Wiley & Sons: Hoboken, NJ, USA, 2013; pp. 322–326. [Google Scholar]
- Sparrow, E.M. Radiation Heat Transfer; Thermal Science Series; Brooks, Pub. Co.: Belmont, CA, USA, 1966; pp. 177–179. [Google Scholar]
- Elmalky, A.M.; Araji, M.T. Computational fluid dynamics using finite volume method: A numerical model for Double Skin Façades with renewable energy source in cold climates. J. Build. Eng. 2022, 60, 105231. [Google Scholar] [CrossRef]
- Gray, D.D.; Giorgini, A. The validity of the boussinesq approximation for liquids and gases. Int. J. Heat Mass Transf. 1976, 19, 545–551. [Google Scholar] [CrossRef]
- Polidori, G.; Popa, C.; Mai, T.H. Transient flow rate behaviour in an external natural convection boundary layer. Mech. Res. Commun. 2003, 30, 615–621. [Google Scholar] [CrossRef]
- Polidori, G.; Padet, J. Transient free convection flow on a vertical surface with an array of large-scale roughness elements. Exp. Therm. Fluid Sci. 2003, 27, 251–260. [Google Scholar] [CrossRef]
- Tao, Y.; Yan, Y.; Chew, M.Y.L.; Tu, J.; Shi, L. A theoretical model of natural ventilation enhanced by solar thermal energy in double-skin façade. Energy 2023, 276, 127534. [Google Scholar] [CrossRef]
- Bhushan, S.; Elmellouki, M.; Walters, D.K.; Hassan, Y.A.; Merzari, E.; Obabko, A. Analysis of turbulent flow and thermal structures in low-Prandtl number buoyant flows using direct numerical simulations. Int. J. Heat Mass Transf. 2022, 189, 122733. [Google Scholar] [CrossRef]
- Popa, C.; Ospir, D.; Fohanno, S.; Chereches, C. Numerical simulation of dynamical aspects of natural convection flow in a double-skin façade. Energy Build. 2012, 50, 229–233. [Google Scholar] [CrossRef]
- Gratia, E.; Herde De, A. Are energy consumptions decreased with the addition of a double-skin? Energy Build. 2007, 39, 605–619. [Google Scholar] [CrossRef]
- Barbosa, S.; Ip, K. Perspectives of double skin façades for naturally ventilated buildings: A review. Renew. Sustain. Energy Rev. 2014, 40, 1019–1029. [Google Scholar] [CrossRef]
- Chakib, A.; Khalil, I.; Ouaissa, H.; Sadik, A. On a numerical approach for solving some geometrical shape optimization problems in fluid mechanics. Commun. Nonlinear Sci. Numer. Simul. 2024, 128, 107651. [Google Scholar] [CrossRef]
- Raje, P.; Sinha, K. Anisotropic SST turbulence model for shock-boundary layer interaction. Comput. Fluids 2021, 228, 105072. [Google Scholar] [CrossRef]
- Liu, J.; Hui, Y.; Yang, Q.; Wang, G. Numerical study of impact of façade ribs on the wind field and wind force of high-rise building under atmospheric boundary layer flow. J. Wind Eng. Ind. Aerodyn. 2023, 236, 105399. [Google Scholar] [CrossRef]
- Sedki, A.M.; Qahiti, R. Unsteady Magnetohydrodynamic Radiative Casson Nanofluid within Chemically Reactive Flow over a Stretchable Surface with Variable Thickness through a Porous Medium. Energies 2023, 16, 7776. [Google Scholar] [CrossRef]
- Maidi, A.; Paulen, R.; Corriou, J.P. Velocity control design of hyperbolic distributed parameter systems using zeroing dynamics and zeroing-gradient dynamics methods. J. Process Control 2024, 138, 103210. [Google Scholar] [CrossRef]
- Li, H.; Guo, H.; Lu, X.; Hu, J.; Zhong, K. Zero-Energy Purification of Ambient Particulate Matter Using a Novel Double-Skin Façade System Integrated with Porous Materials. Sustainability 2024, 16, 2489. [Google Scholar] [CrossRef]
- Lv, S.; Lai, Y. Study of Photovoltaic Double-Skin Façade Windows in Passenger Ships. Sustainability 2024, 16, 3724. [Google Scholar] [CrossRef]
- Liu, X.; Wang, W.; Ding, Y.; Wang, K.; Li, J.; Cha, H.; Saierpeng, Y. Research on the Design Strategy of Double–Skin Facade in Cold and Frigid Regions—Using Xinjiang Public Buildings as an Example. Sustainability 2024, 16, 4766. [Google Scholar] [CrossRef]
Disclaimer/Publisher’s Note: The statements, opinions and data contained in all publications are solely those of the individual author(s) and contributor(s) and not of MDPI and/or the editor(s). MDPI and/or the editor(s) disclaim responsibility for any injury to people or property resulting from any ideas, methods, instructions or products referred to in the content. |
© 2025 by the authors. Licensee MDPI, Basel, Switzerland. This article is an open access article distributed under the terms and conditions of the Creative Commons Attribution (CC BY) license (https://creativecommons.org/licenses/by/4.0/).


