
Experimental and Simulation Study on Reducing the Liquid Film and Improving the Performance of a Carbon-Neutral Methanol Engine

 ,
,  , and
, and
Abstract
1. Introduction
2. Analytical Methodology
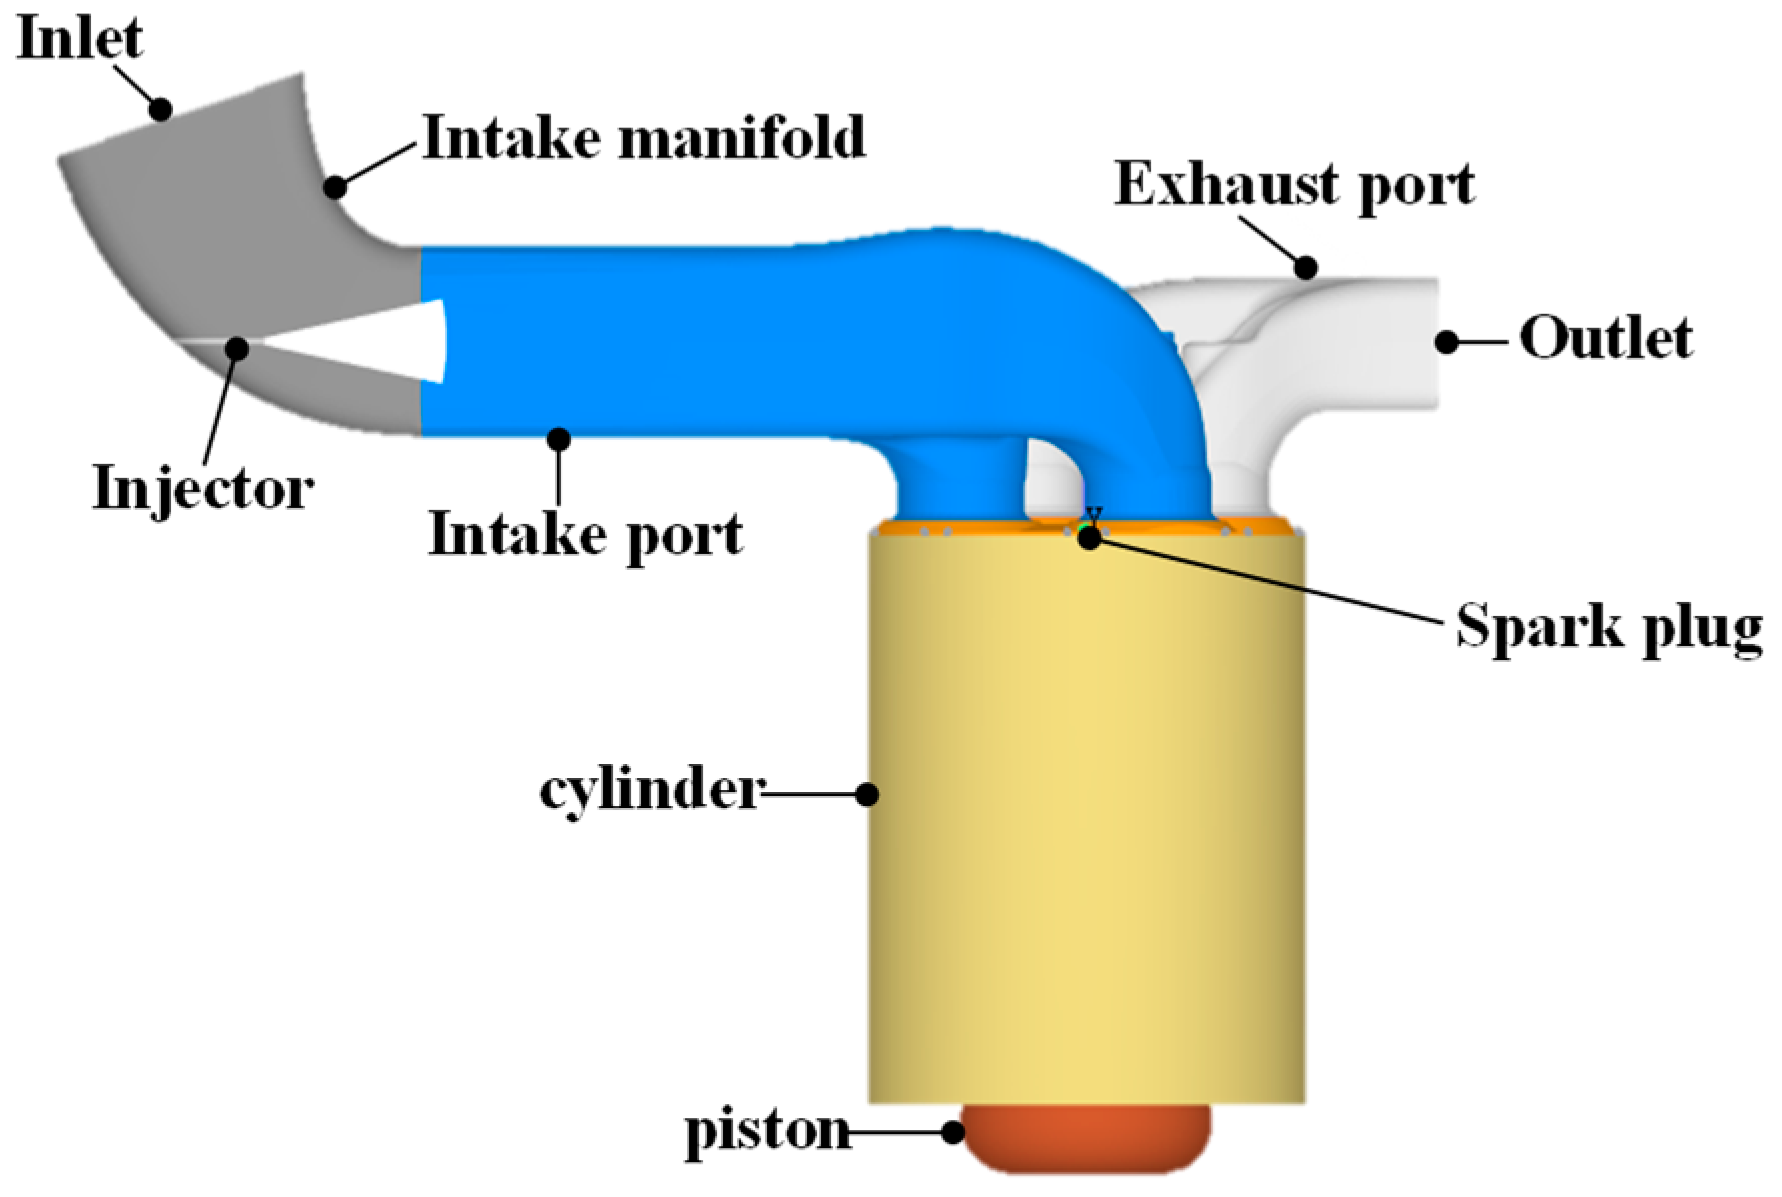
2.1. Experimental Setup
2.2. Experimental Methodology
2.3. Numerical Study
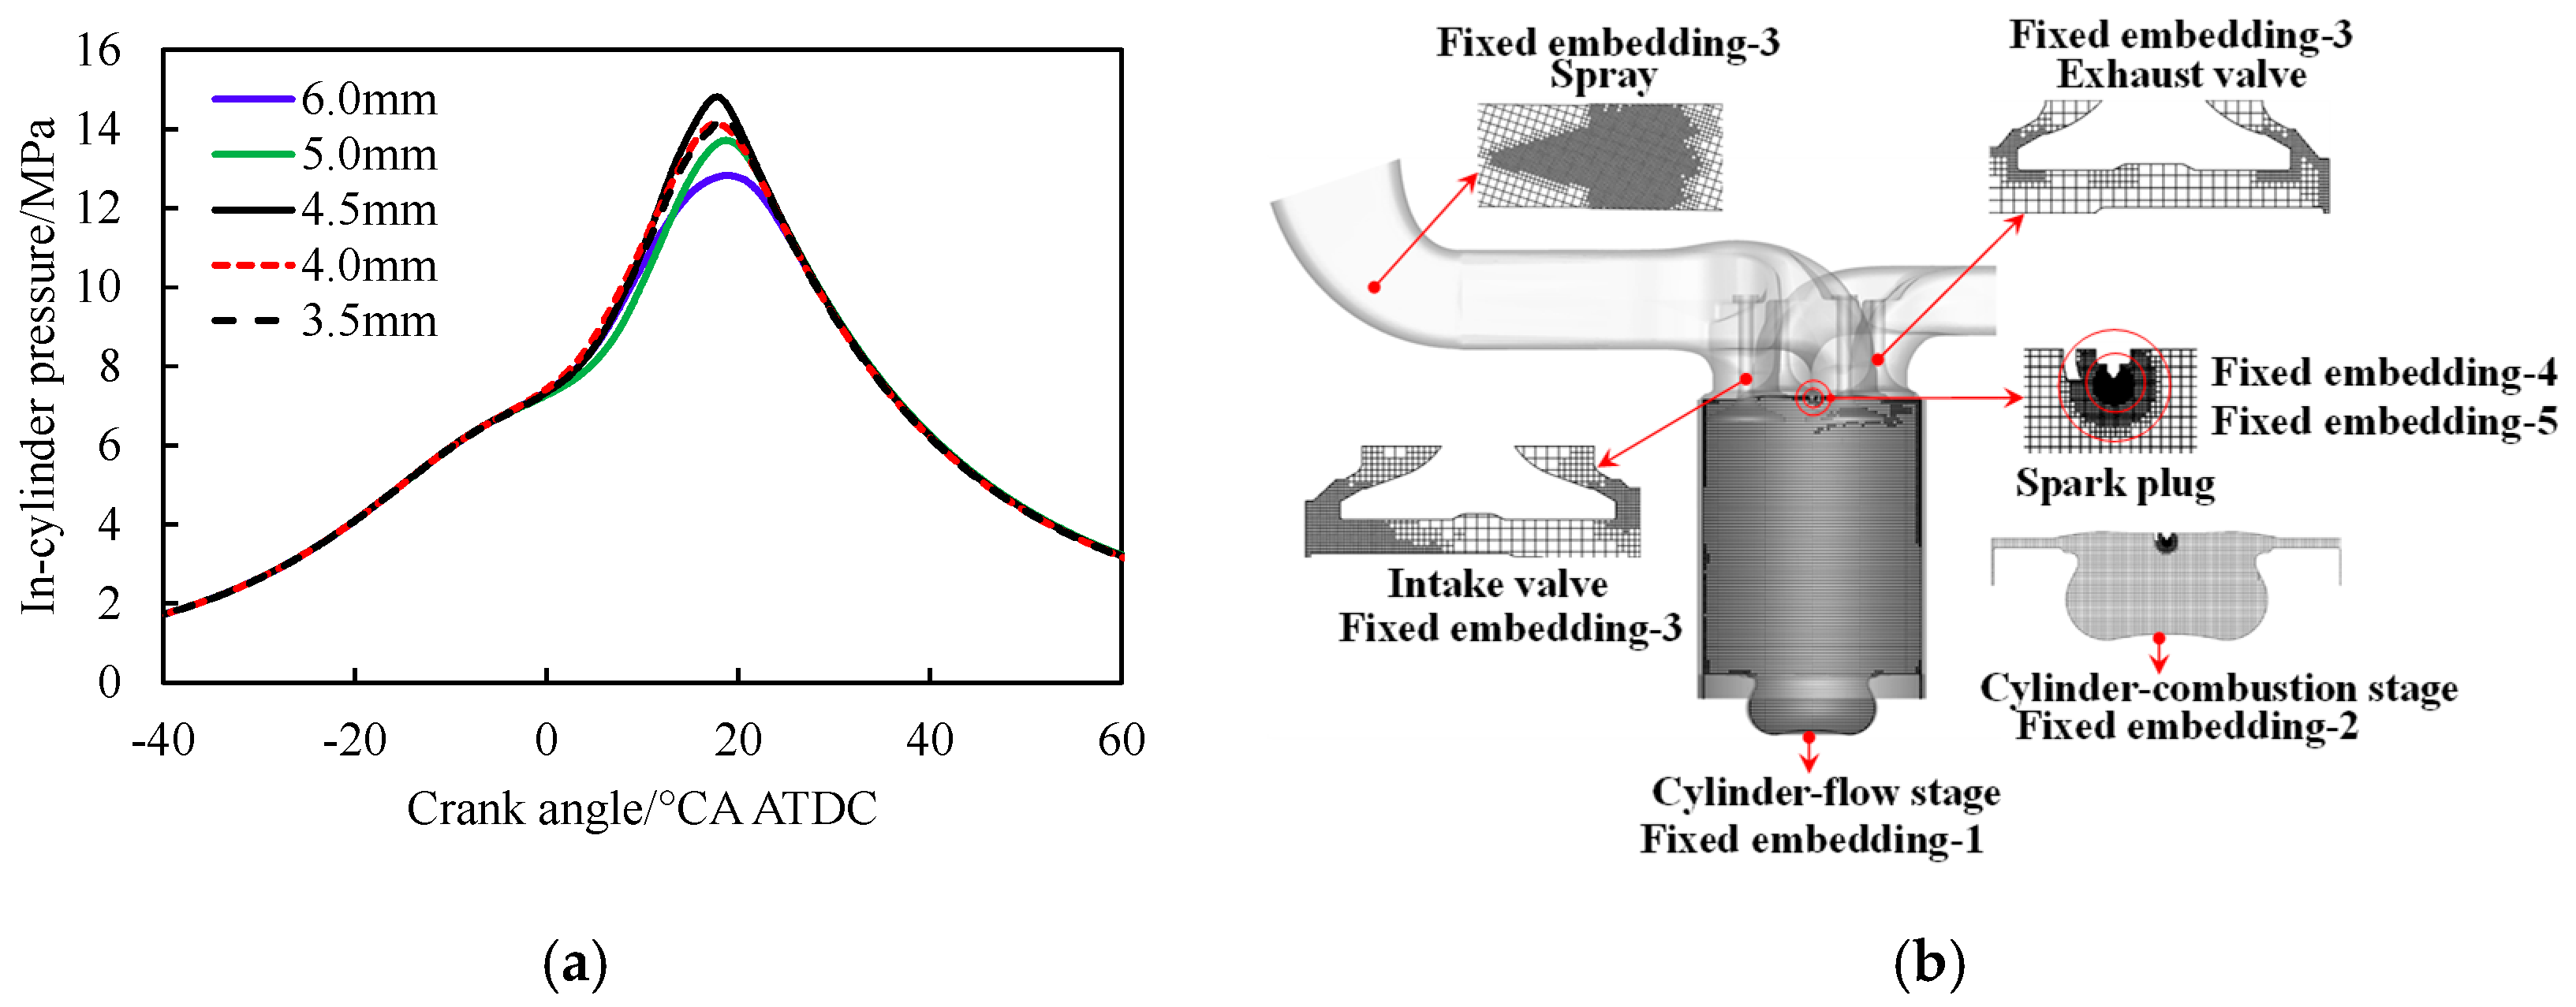
2.3.1. Computational Mesh and Models
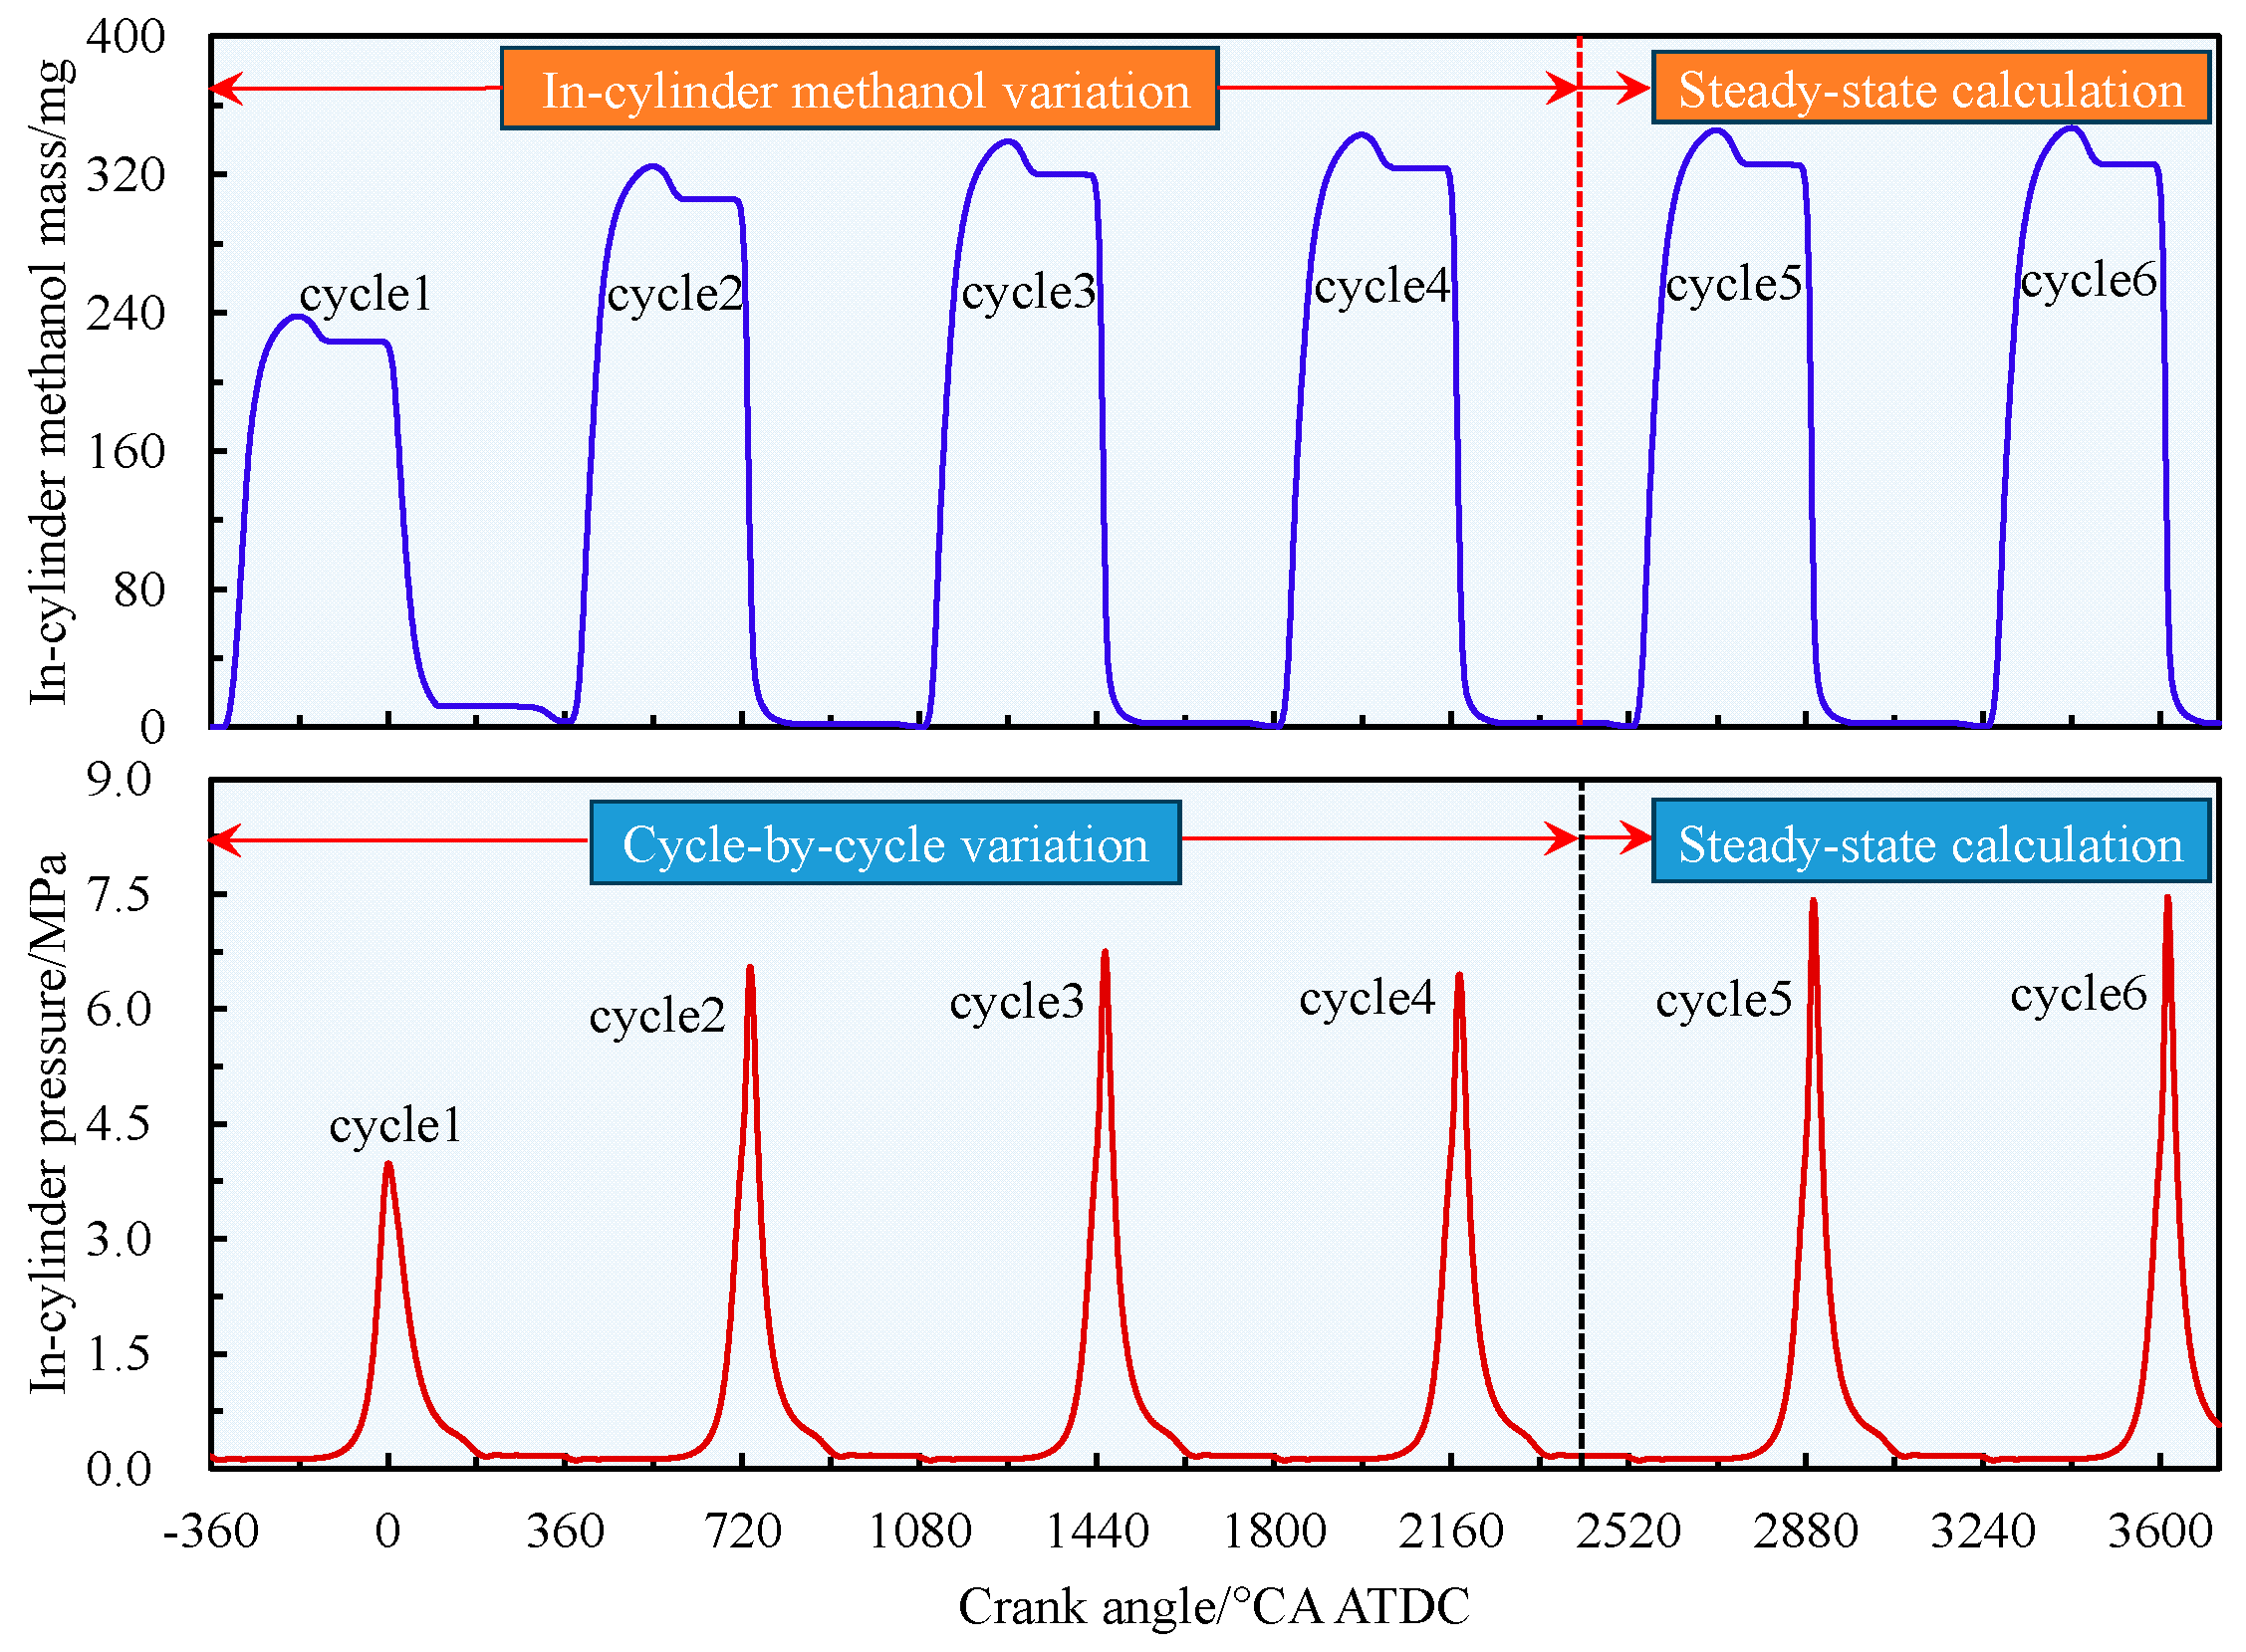
2.3.2. Model Validation
3. Results and Discussion
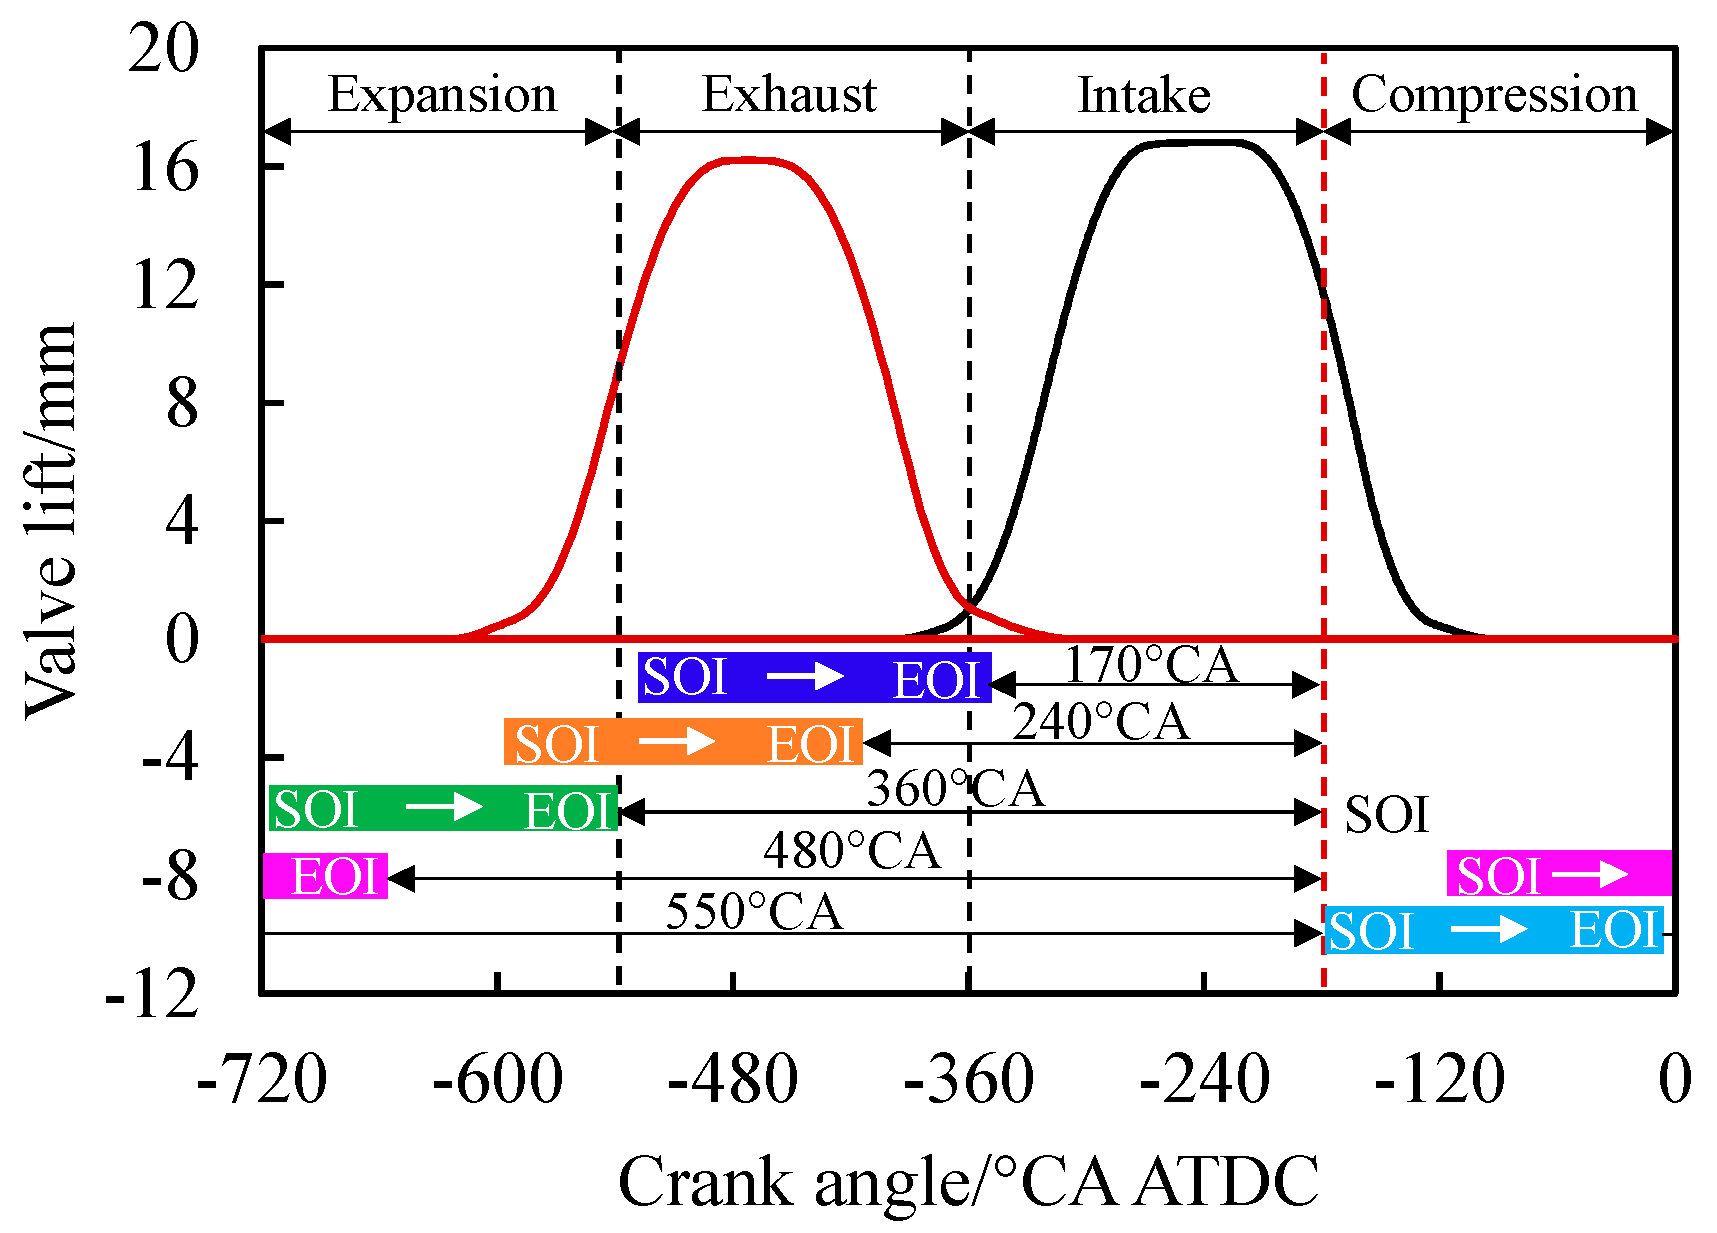
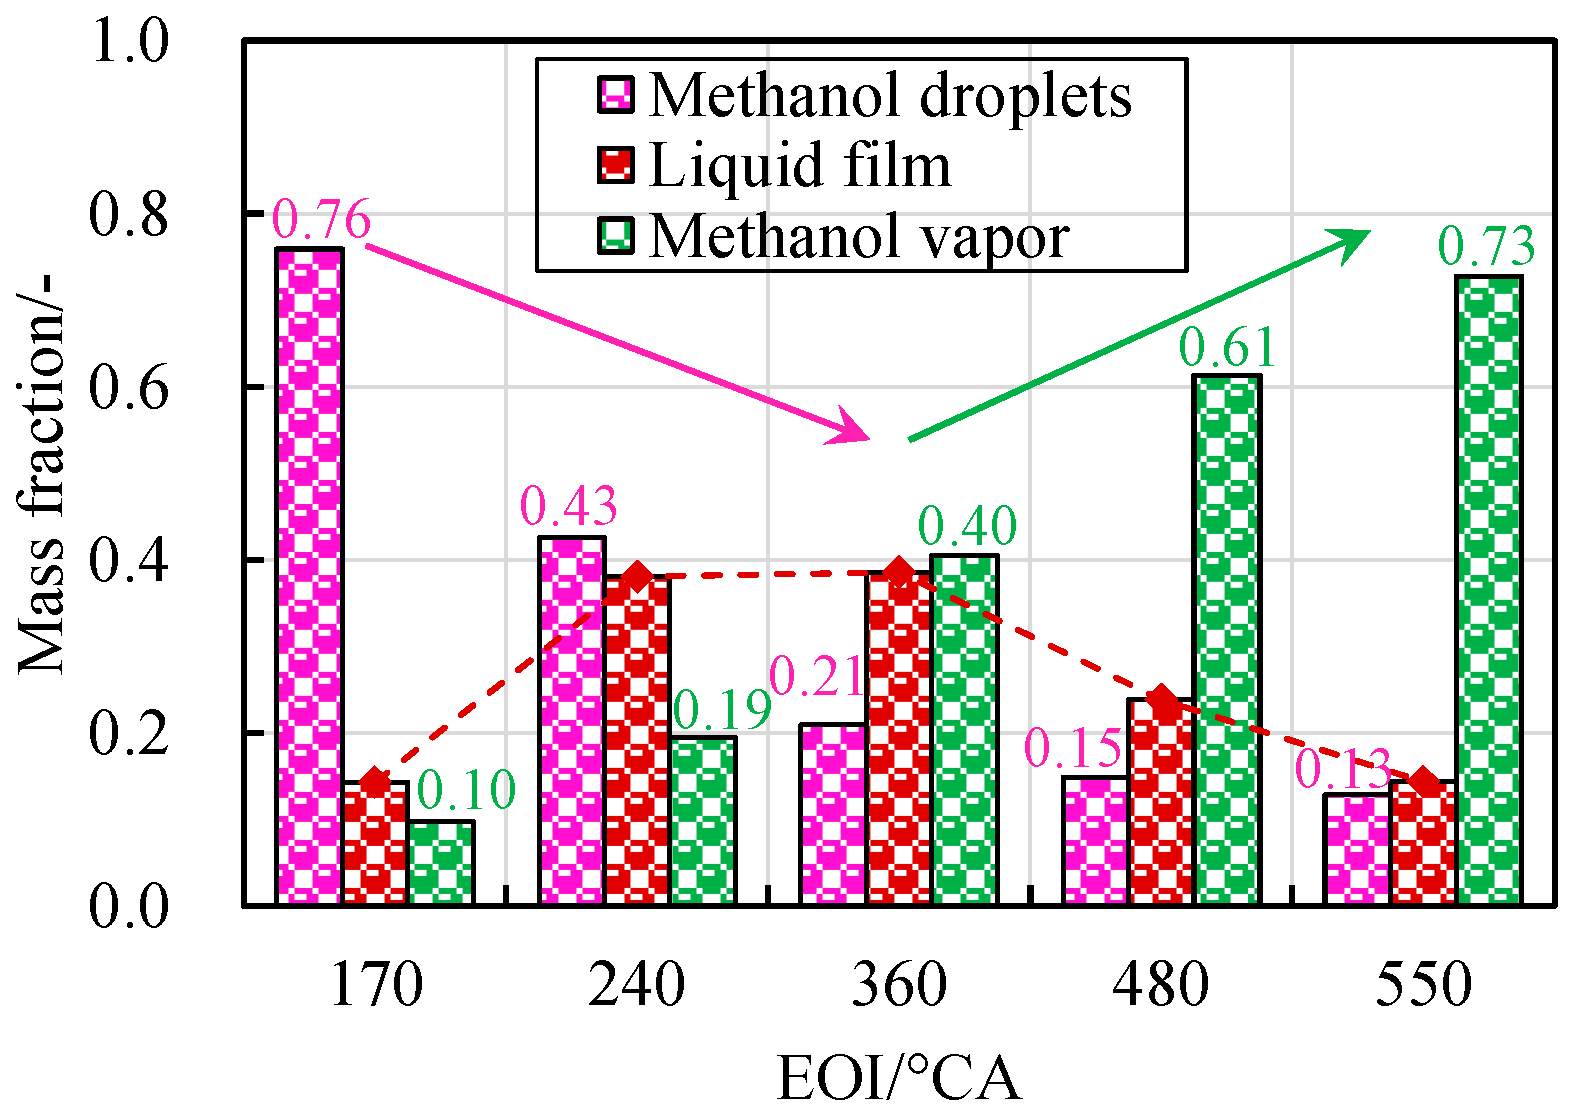
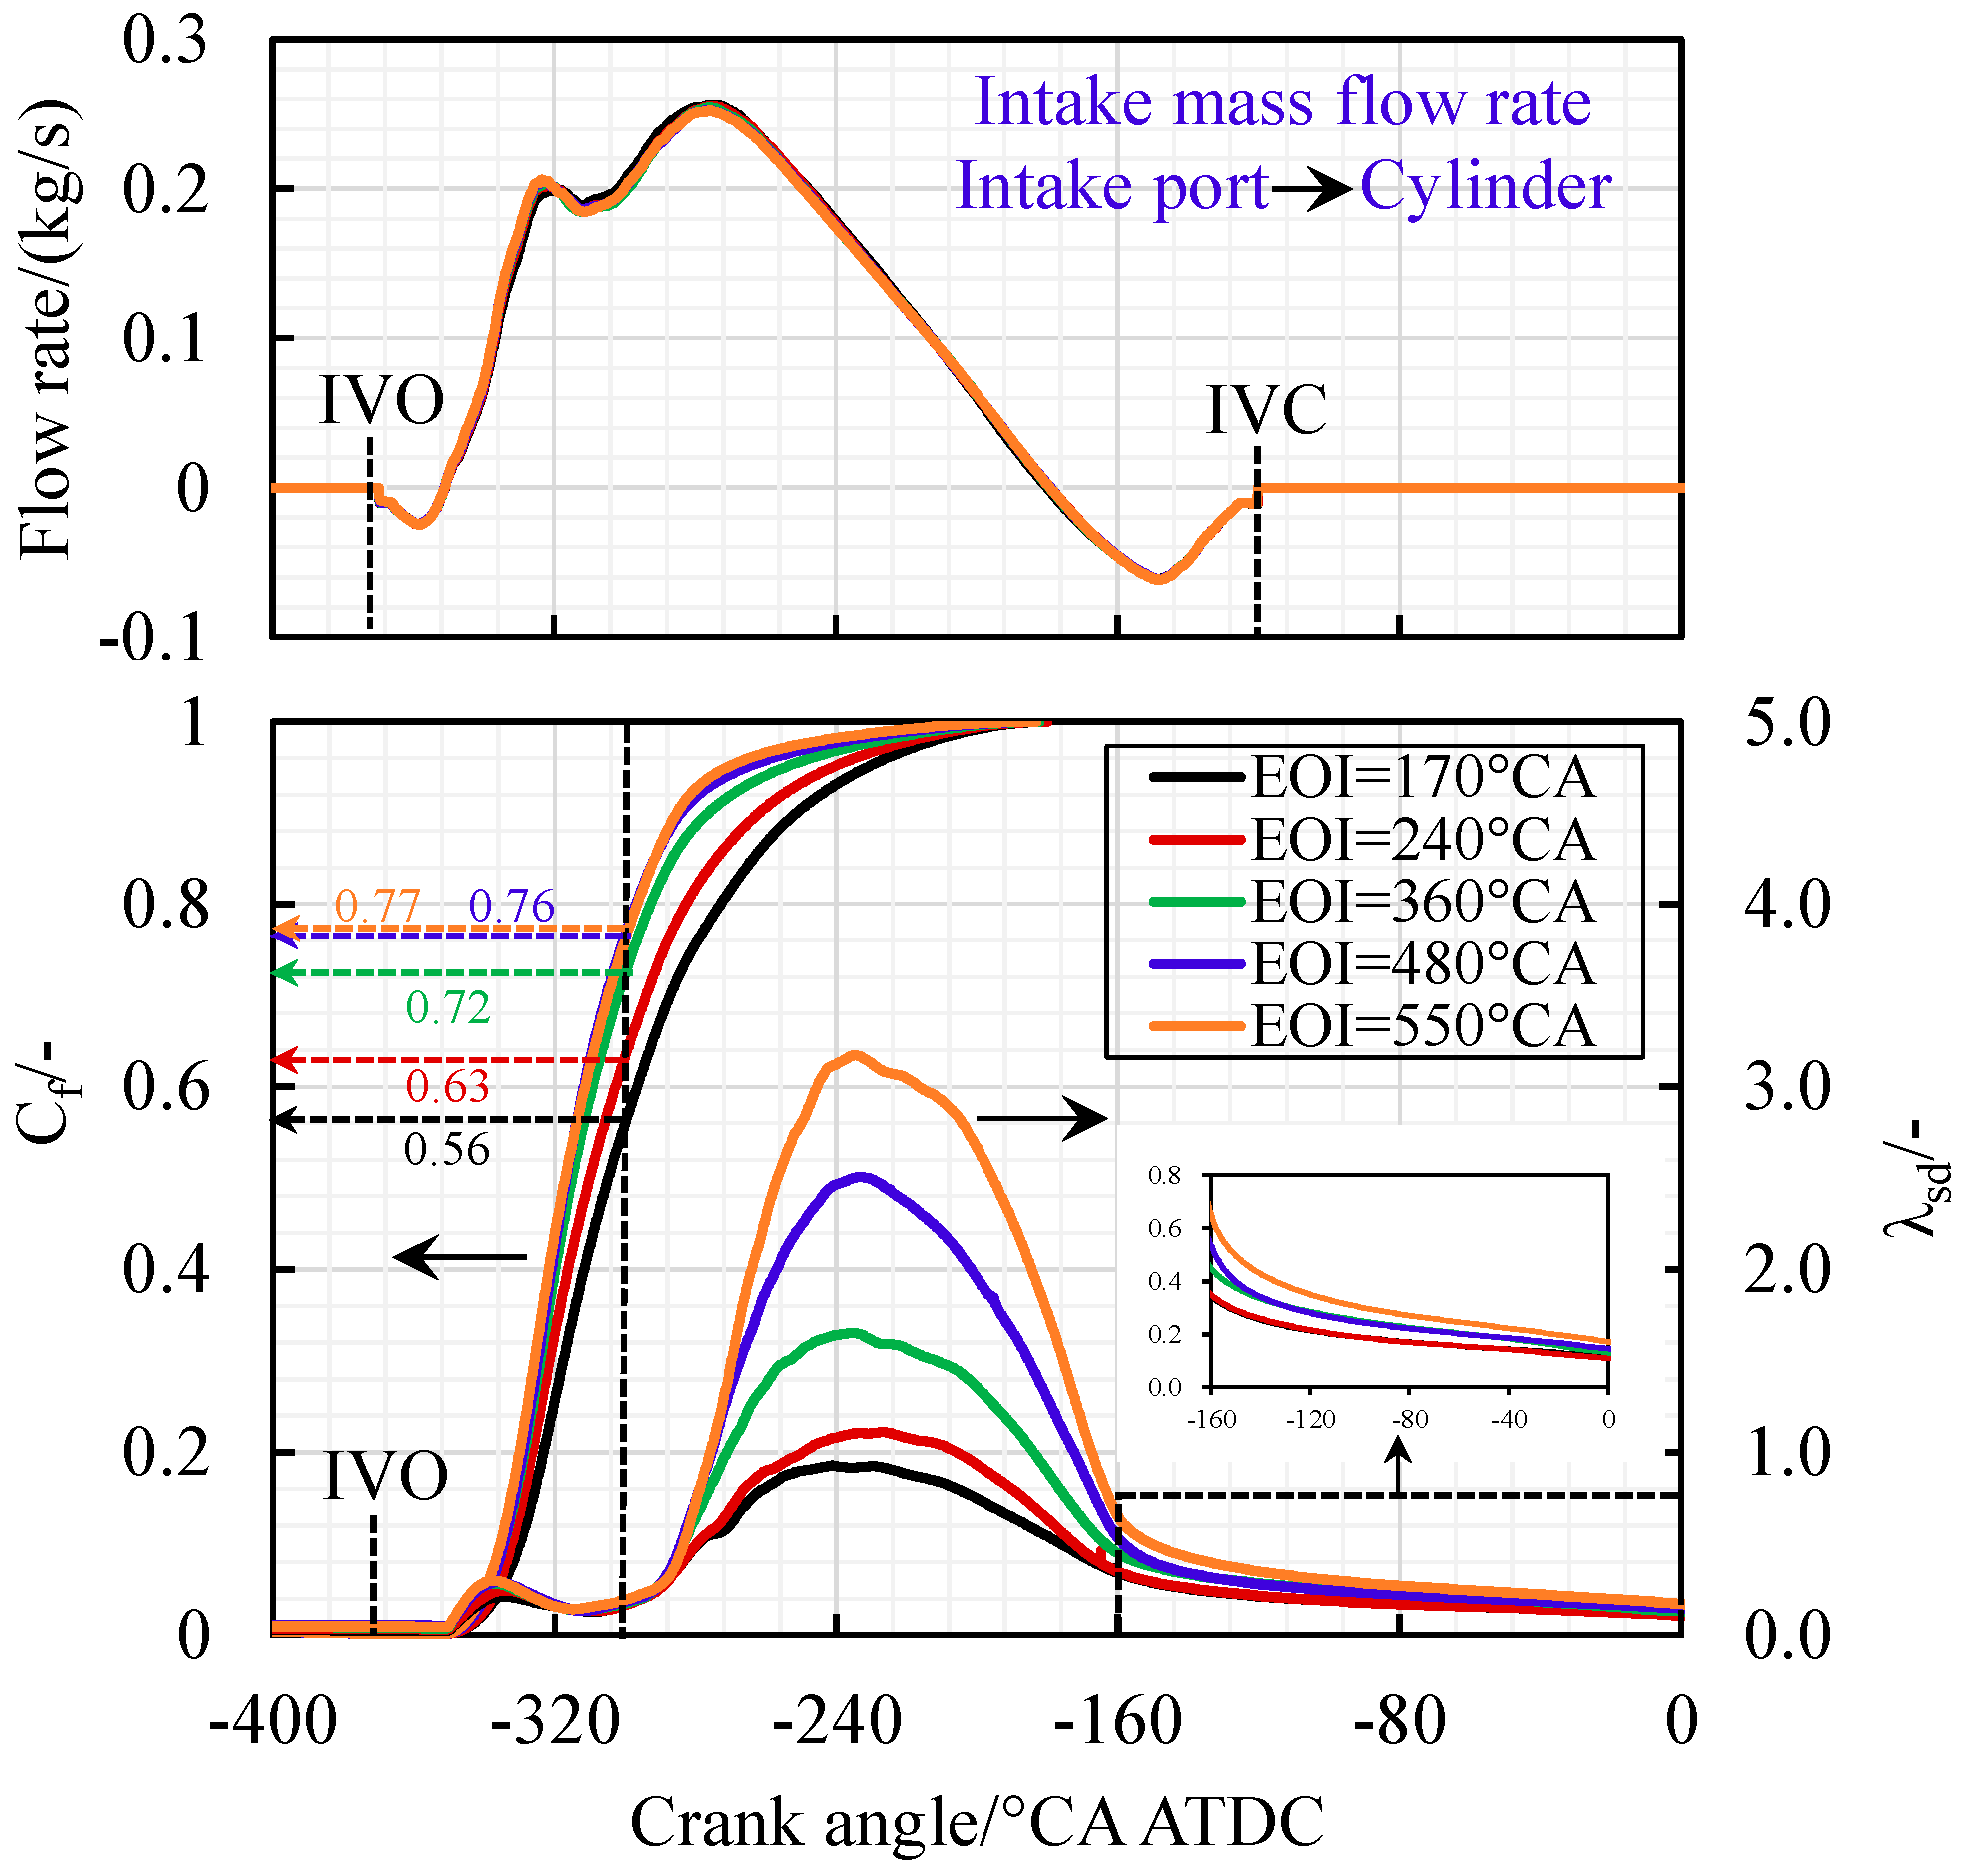
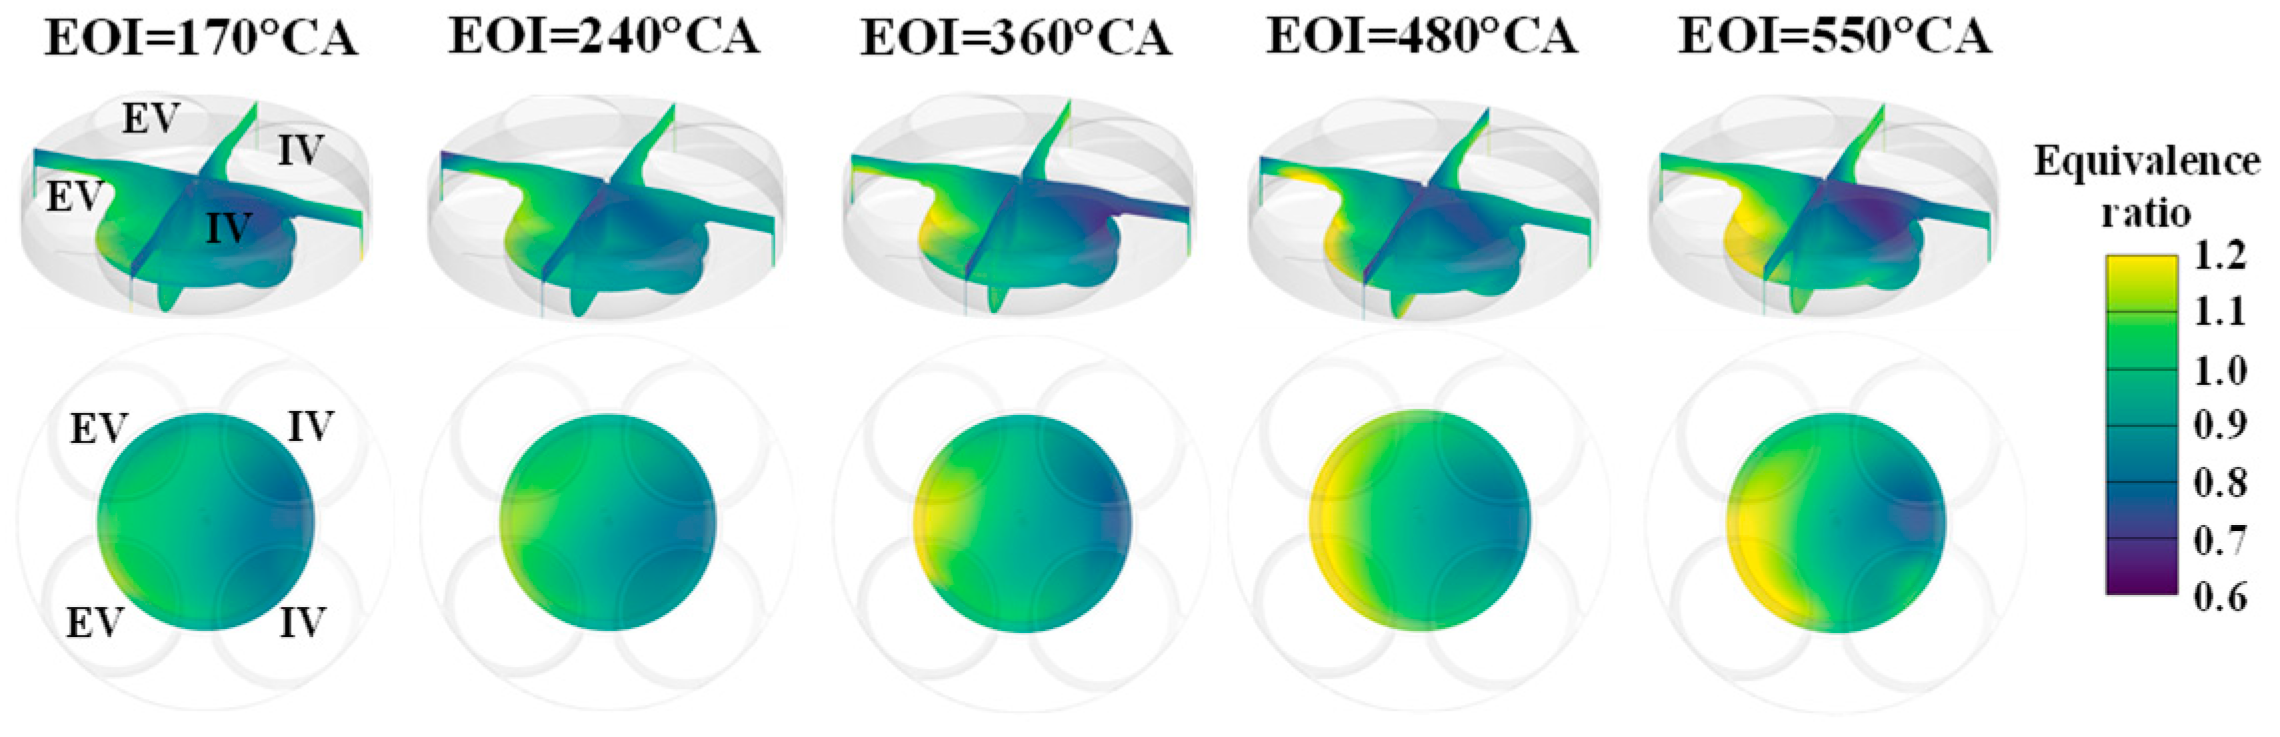
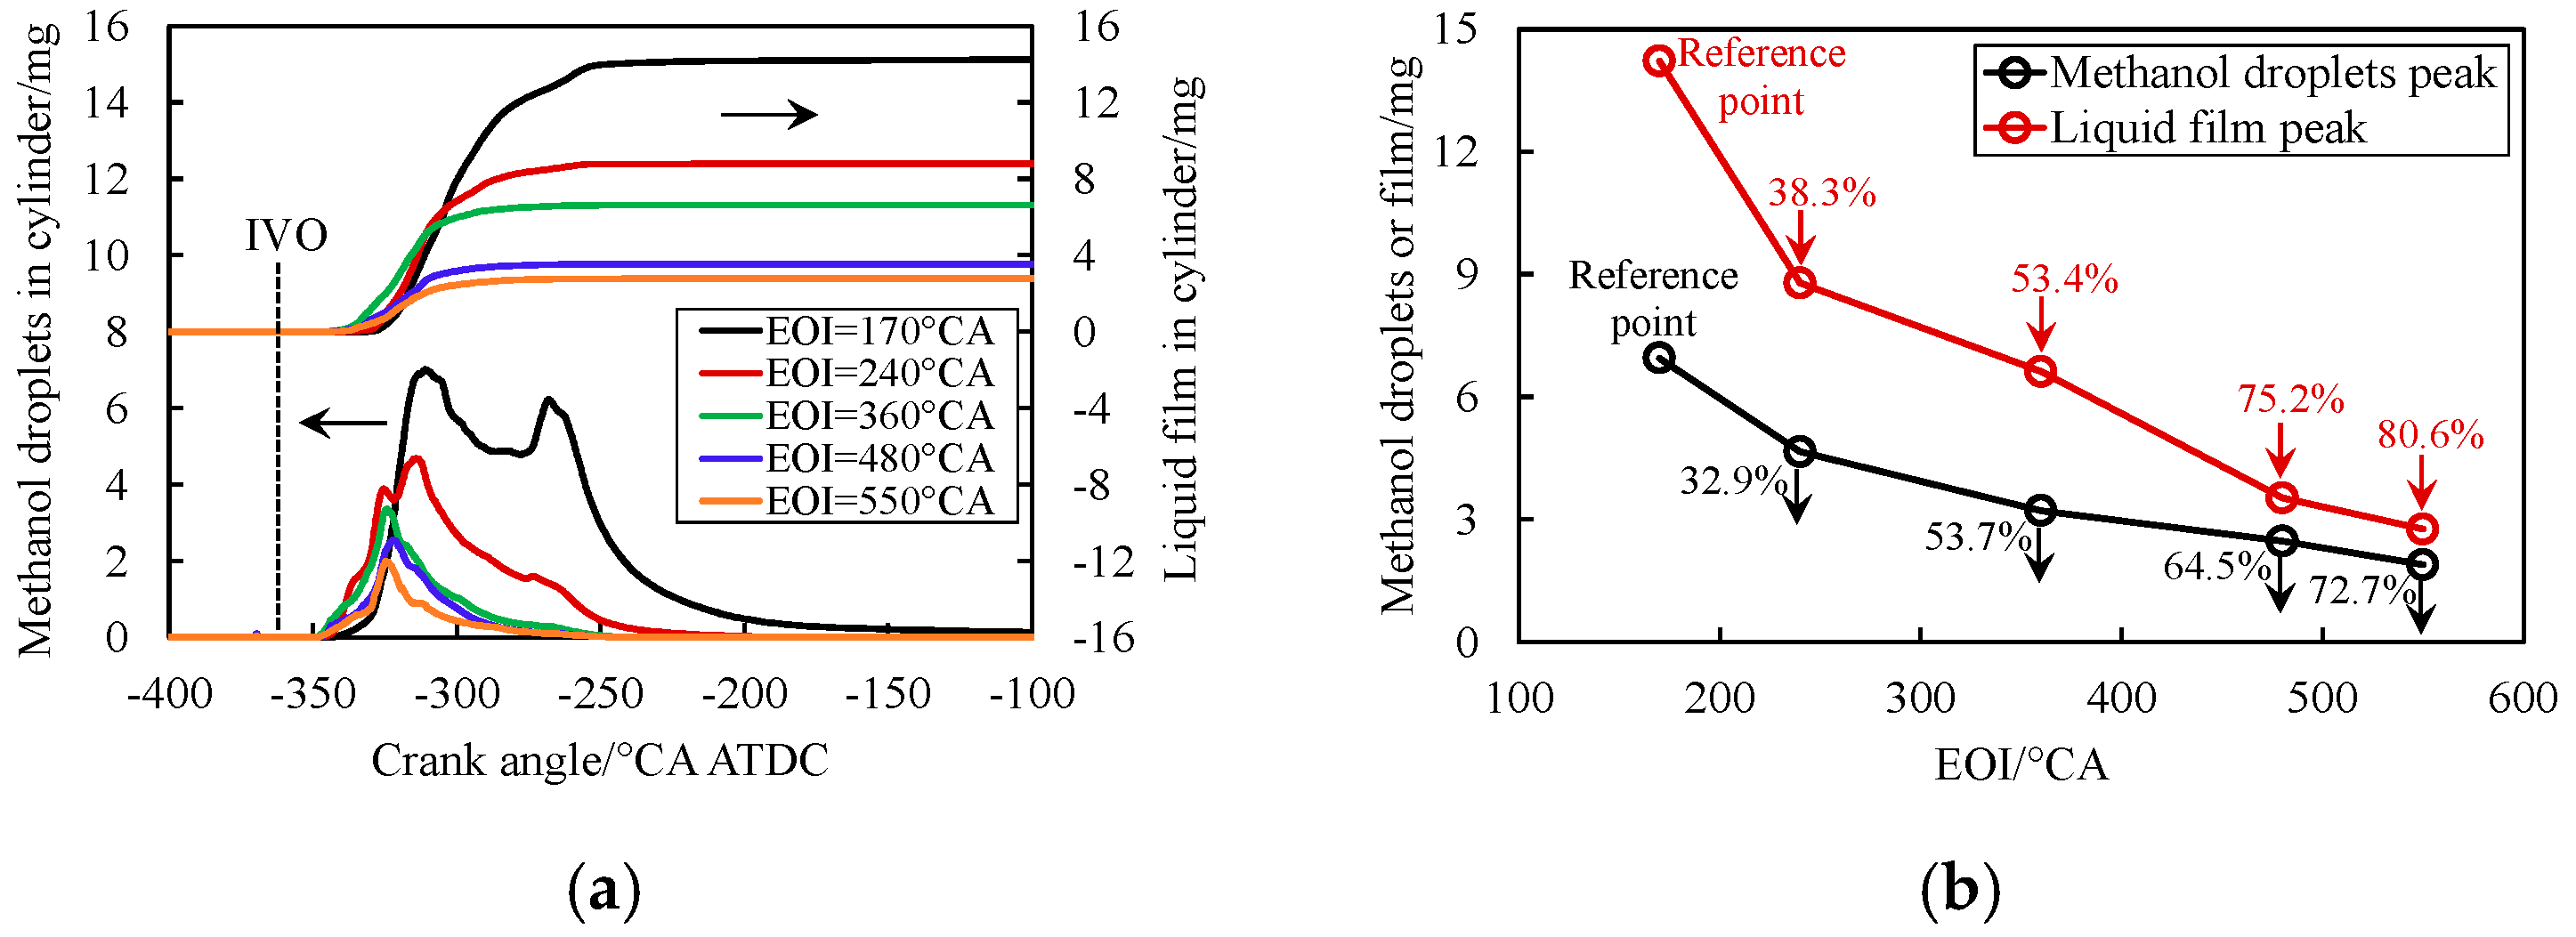
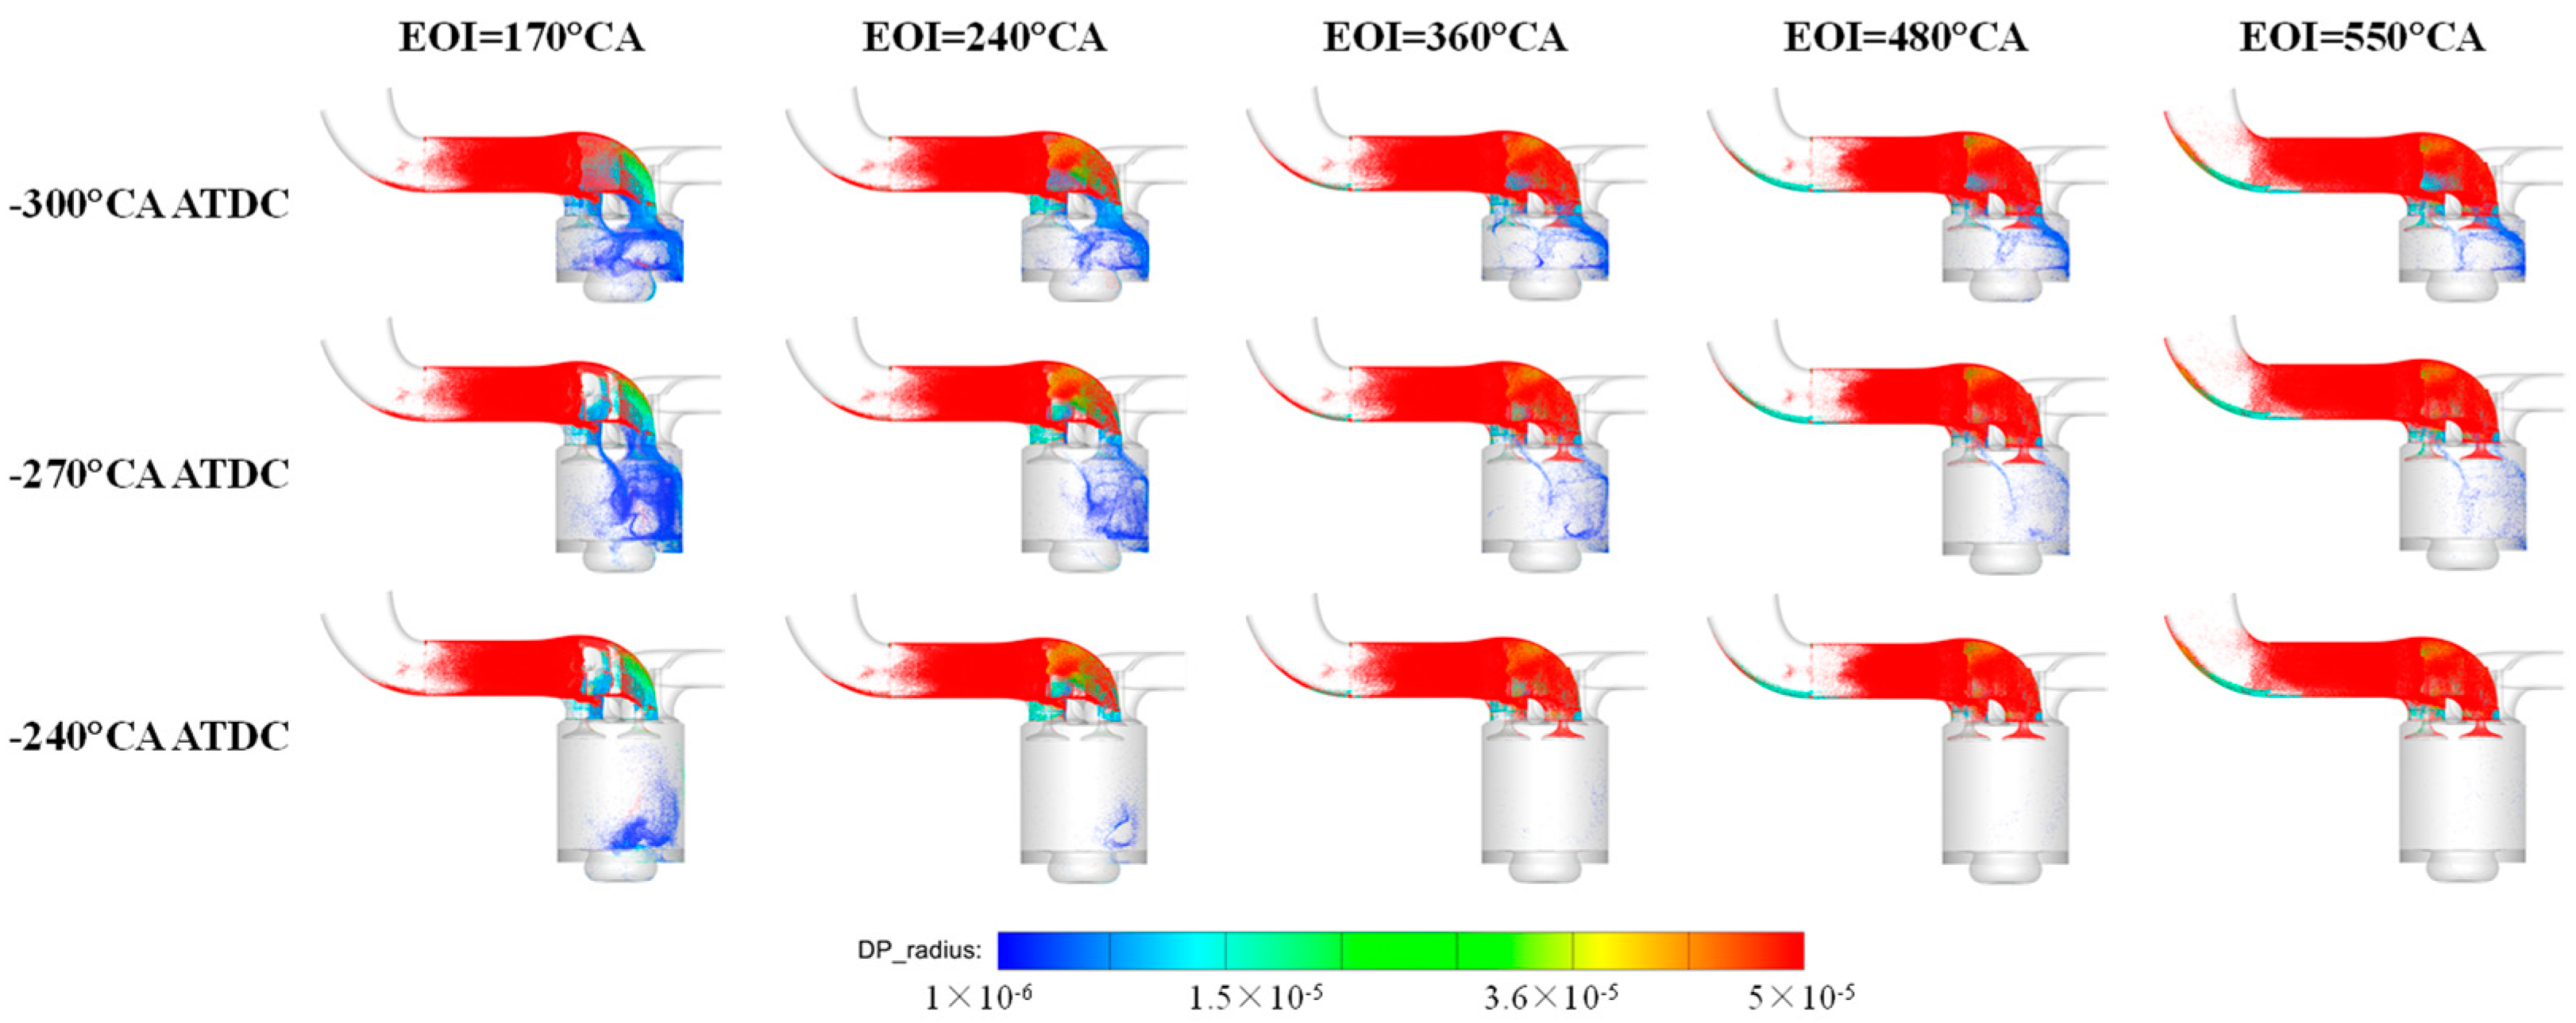
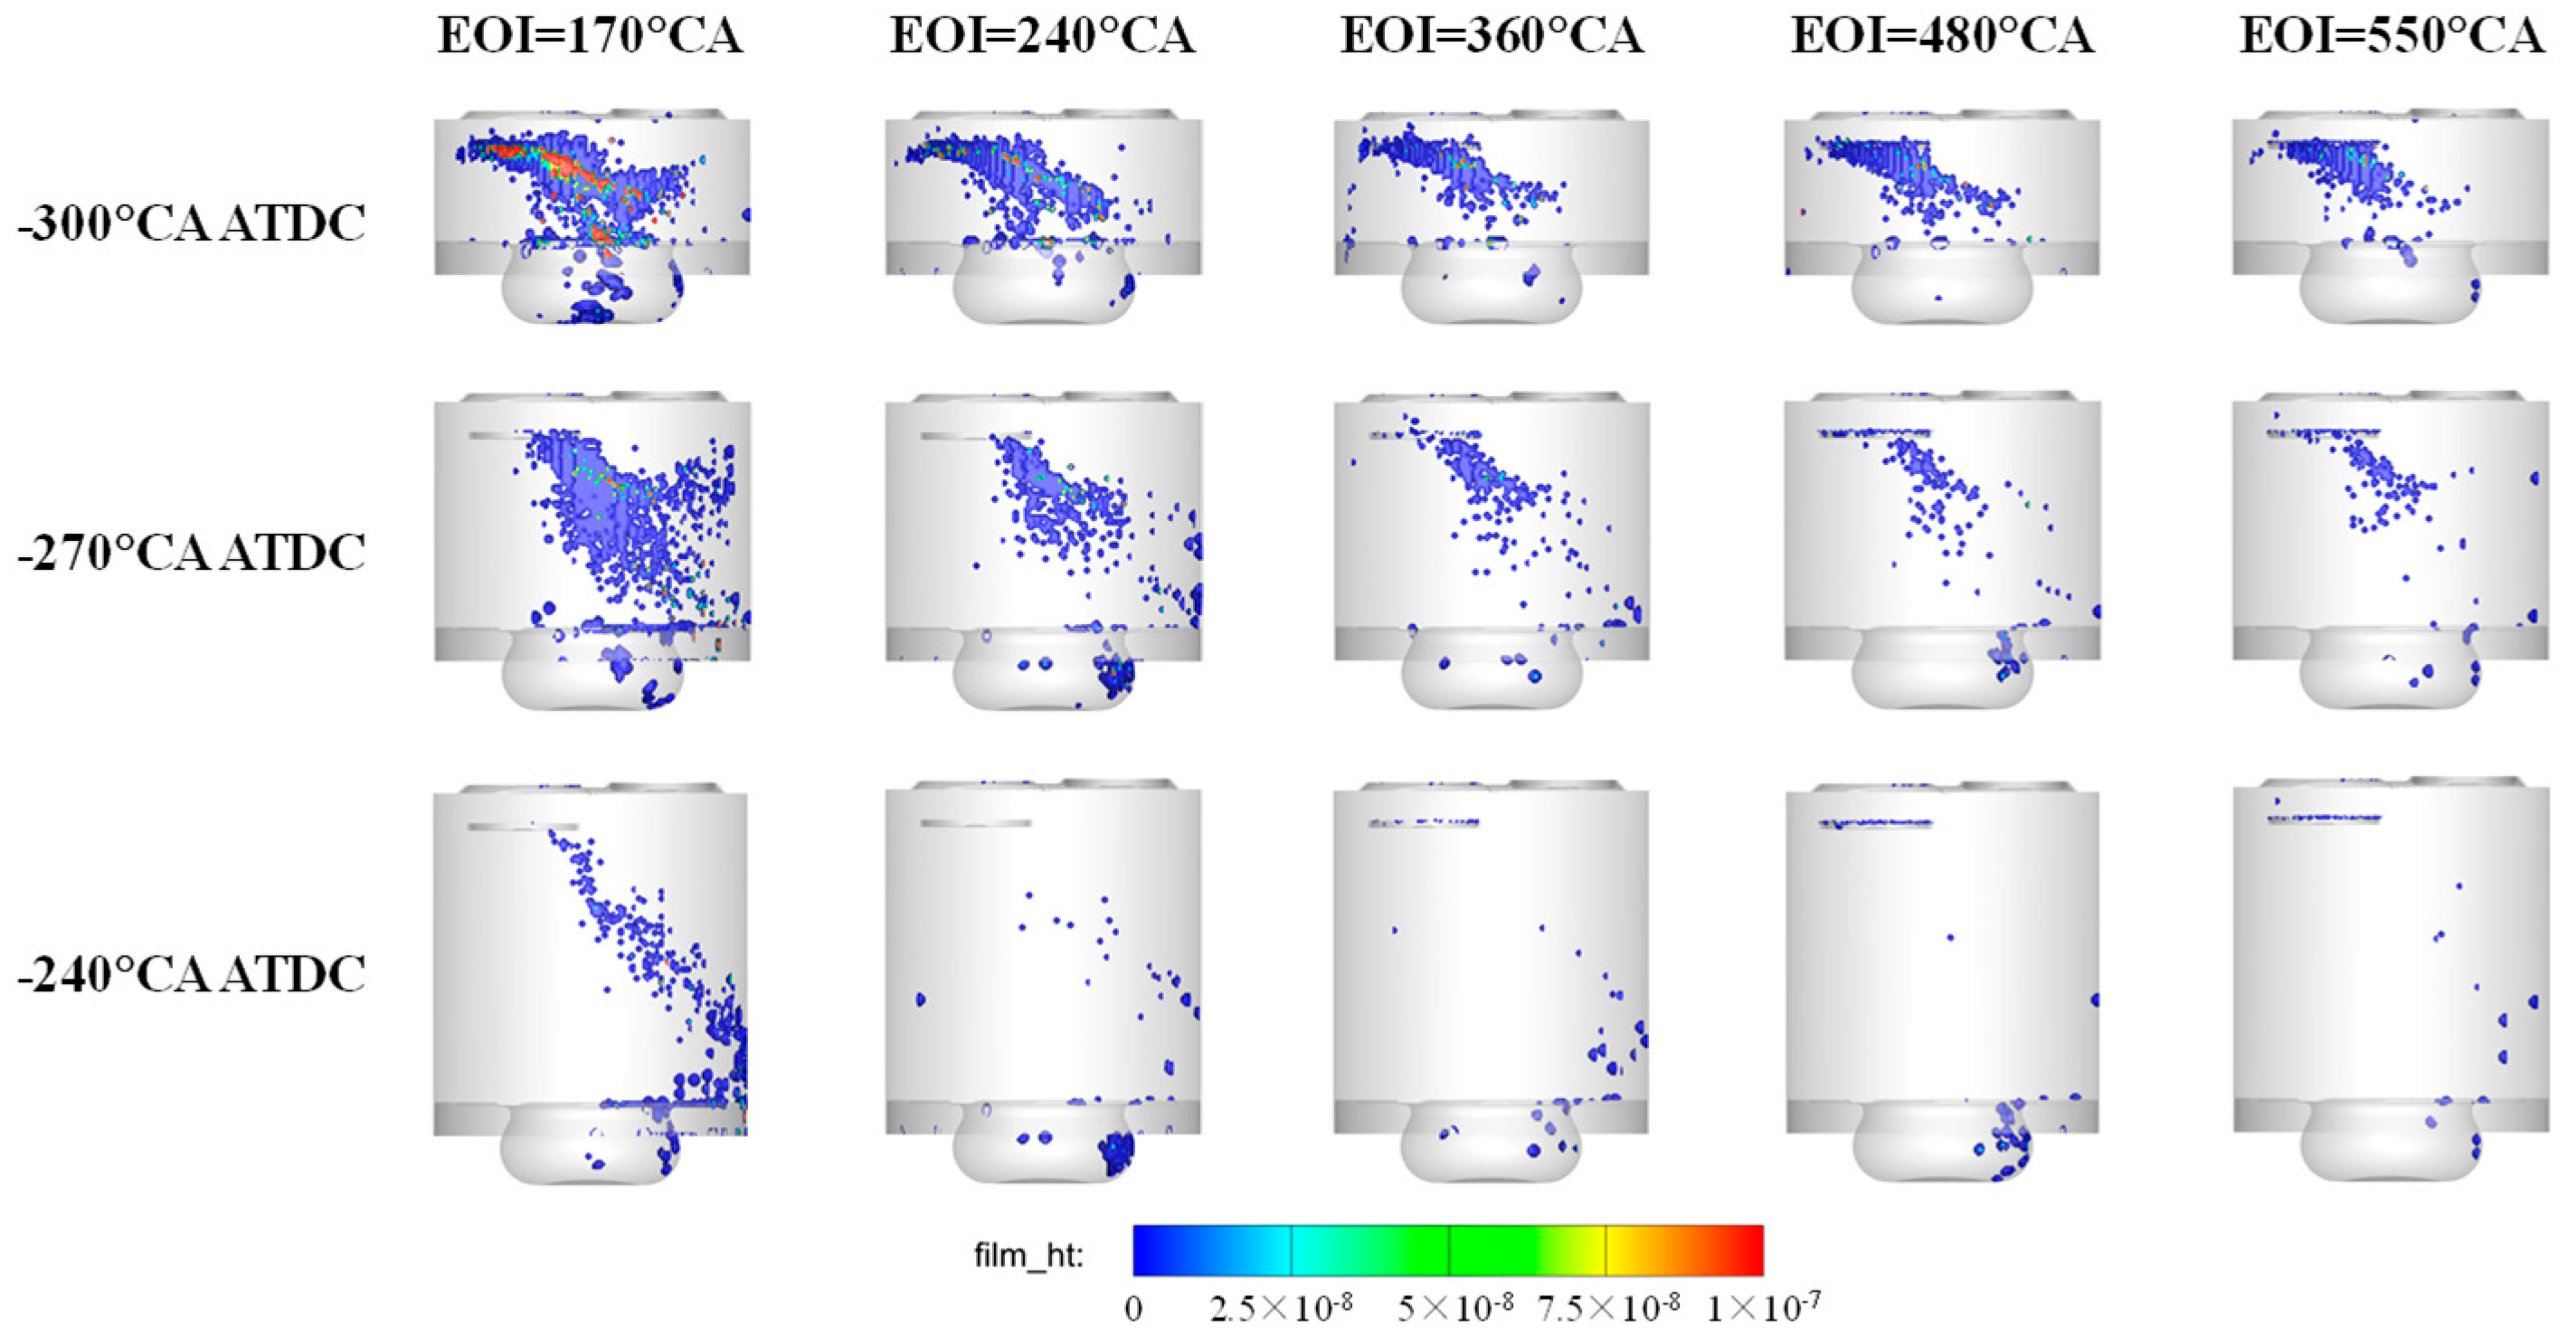
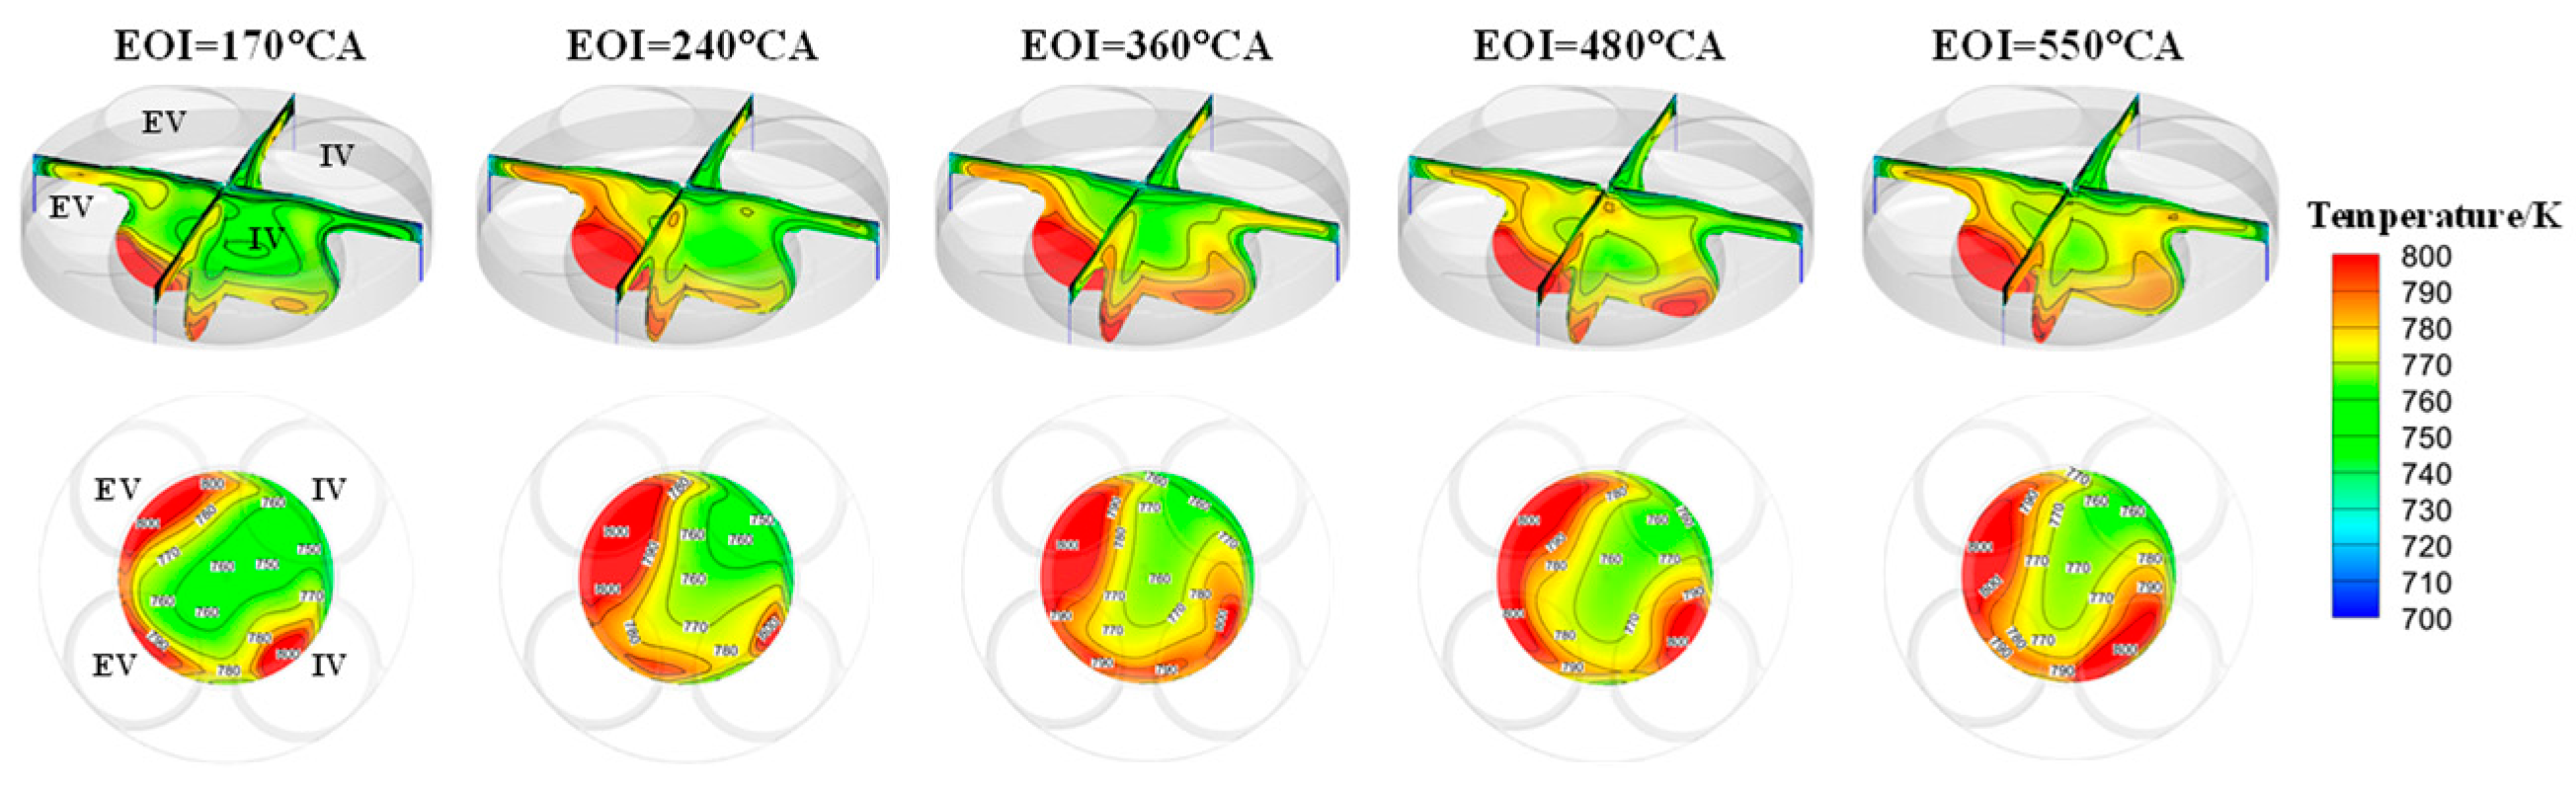
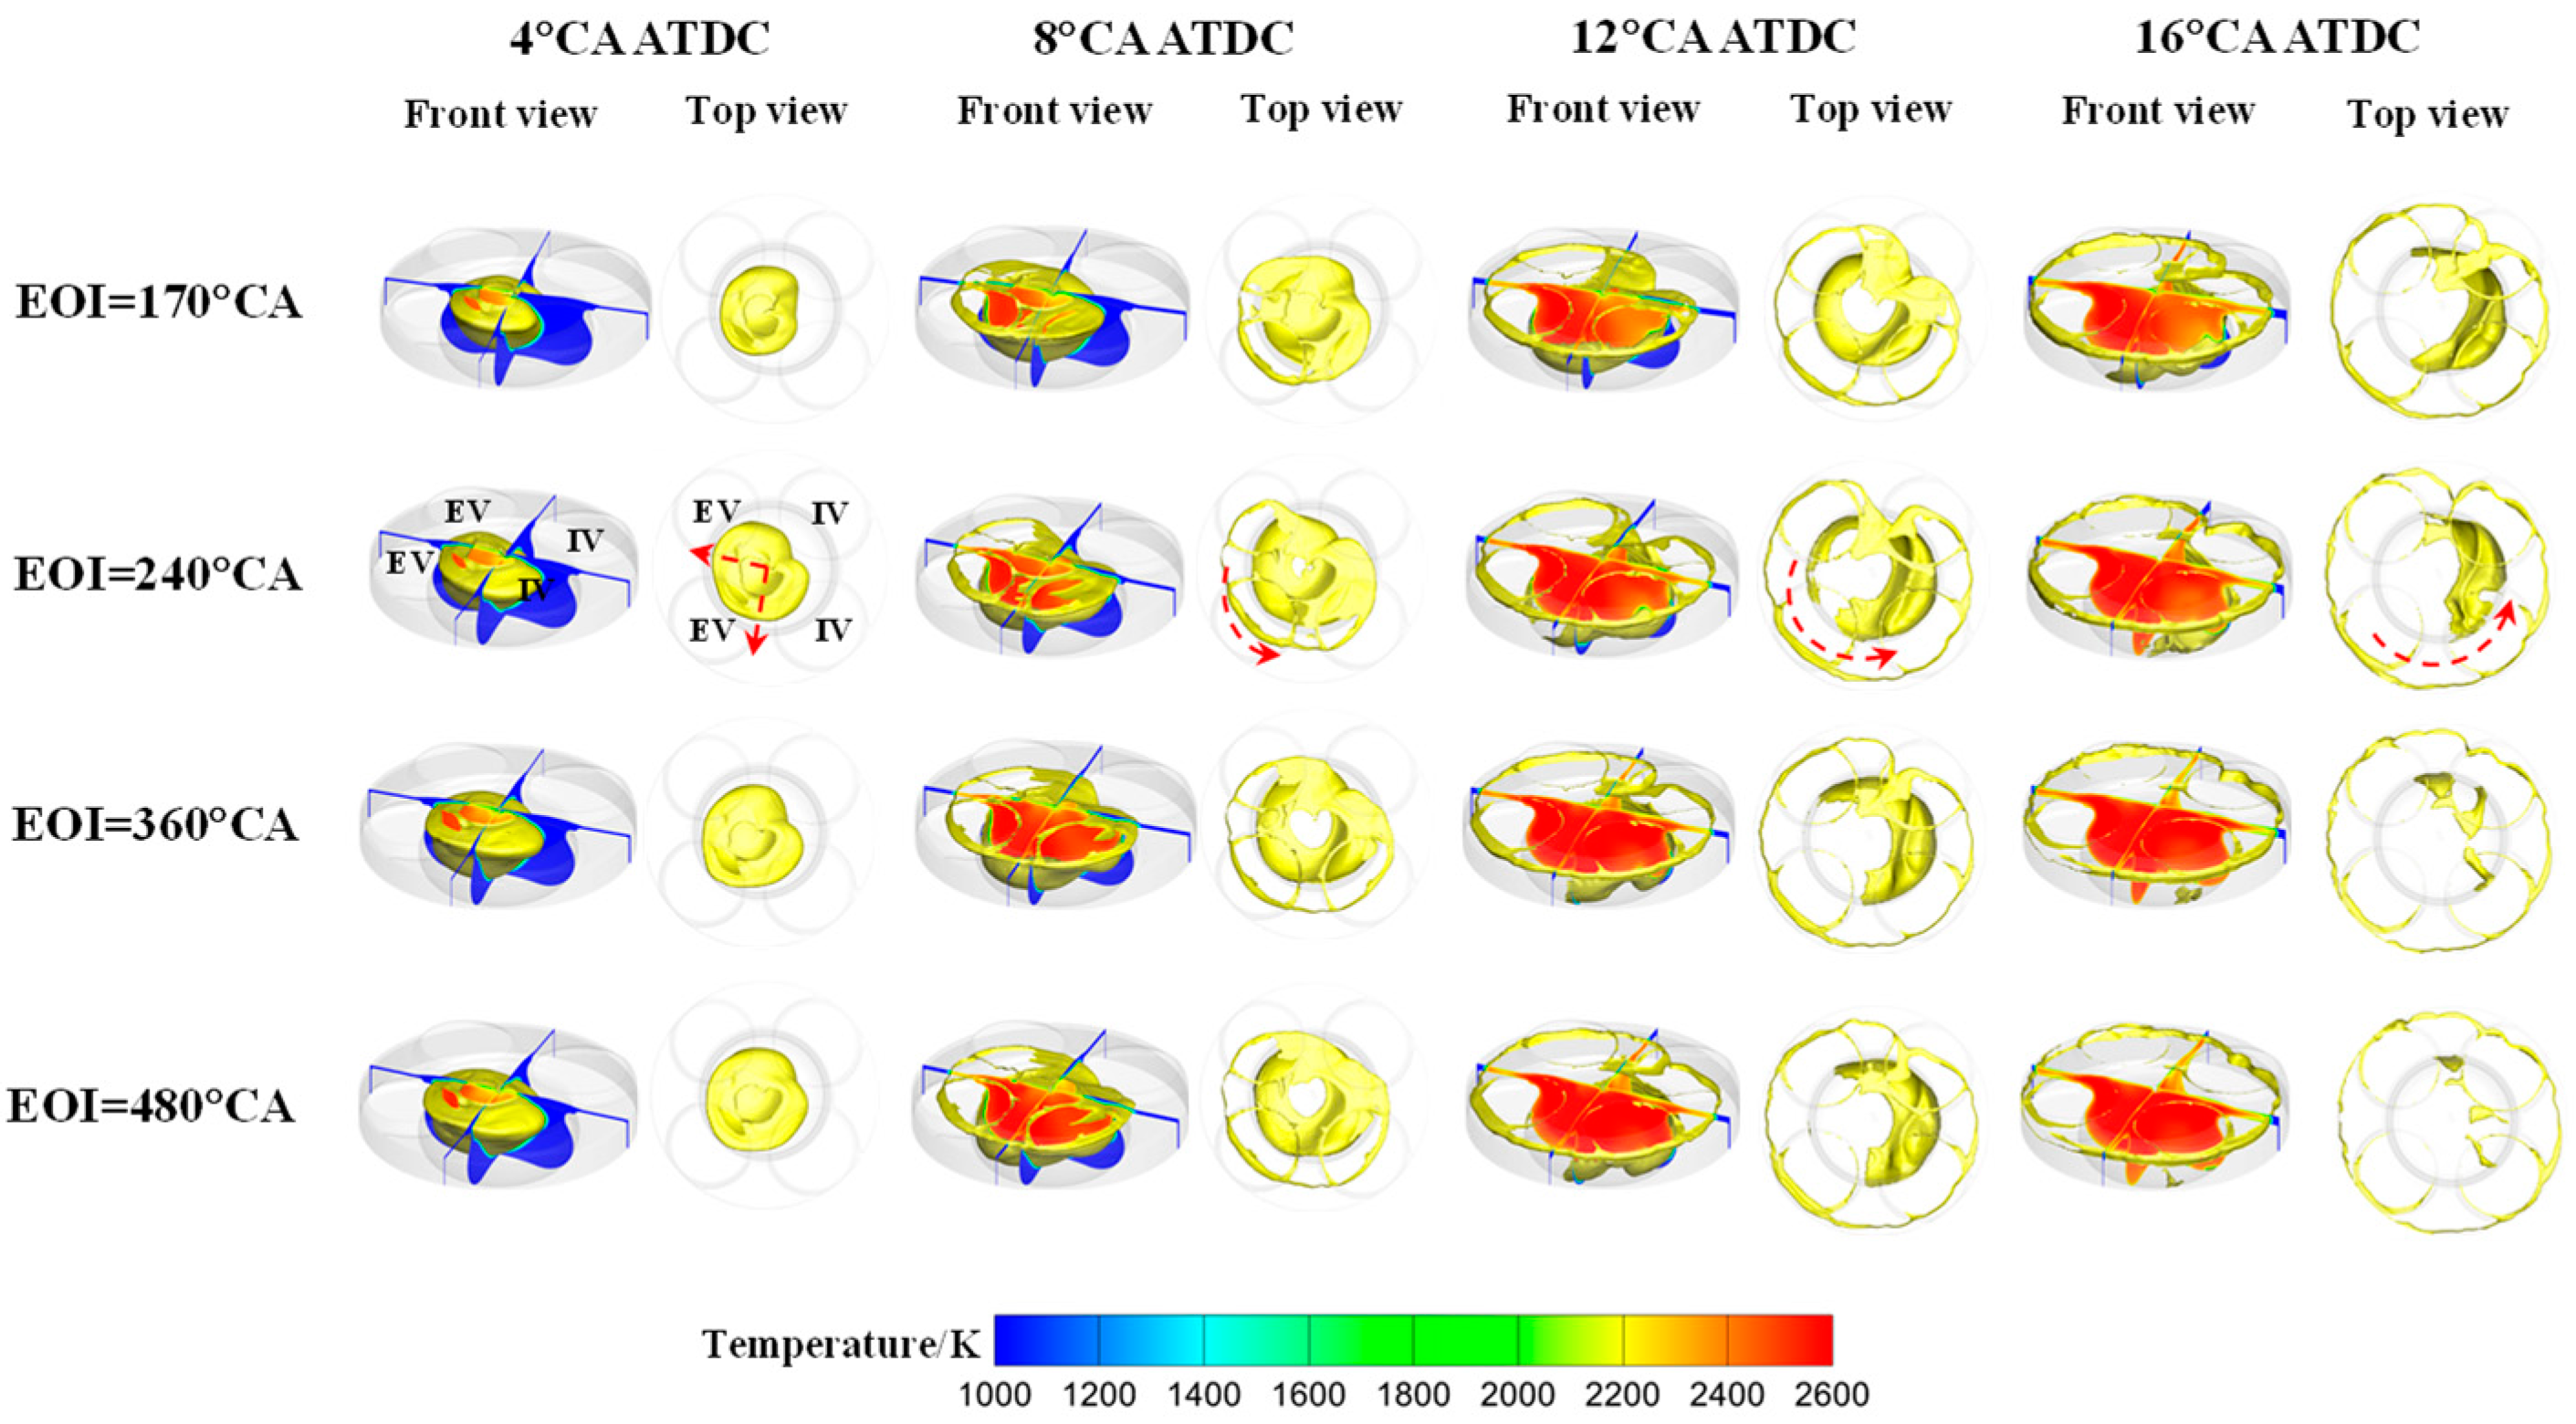
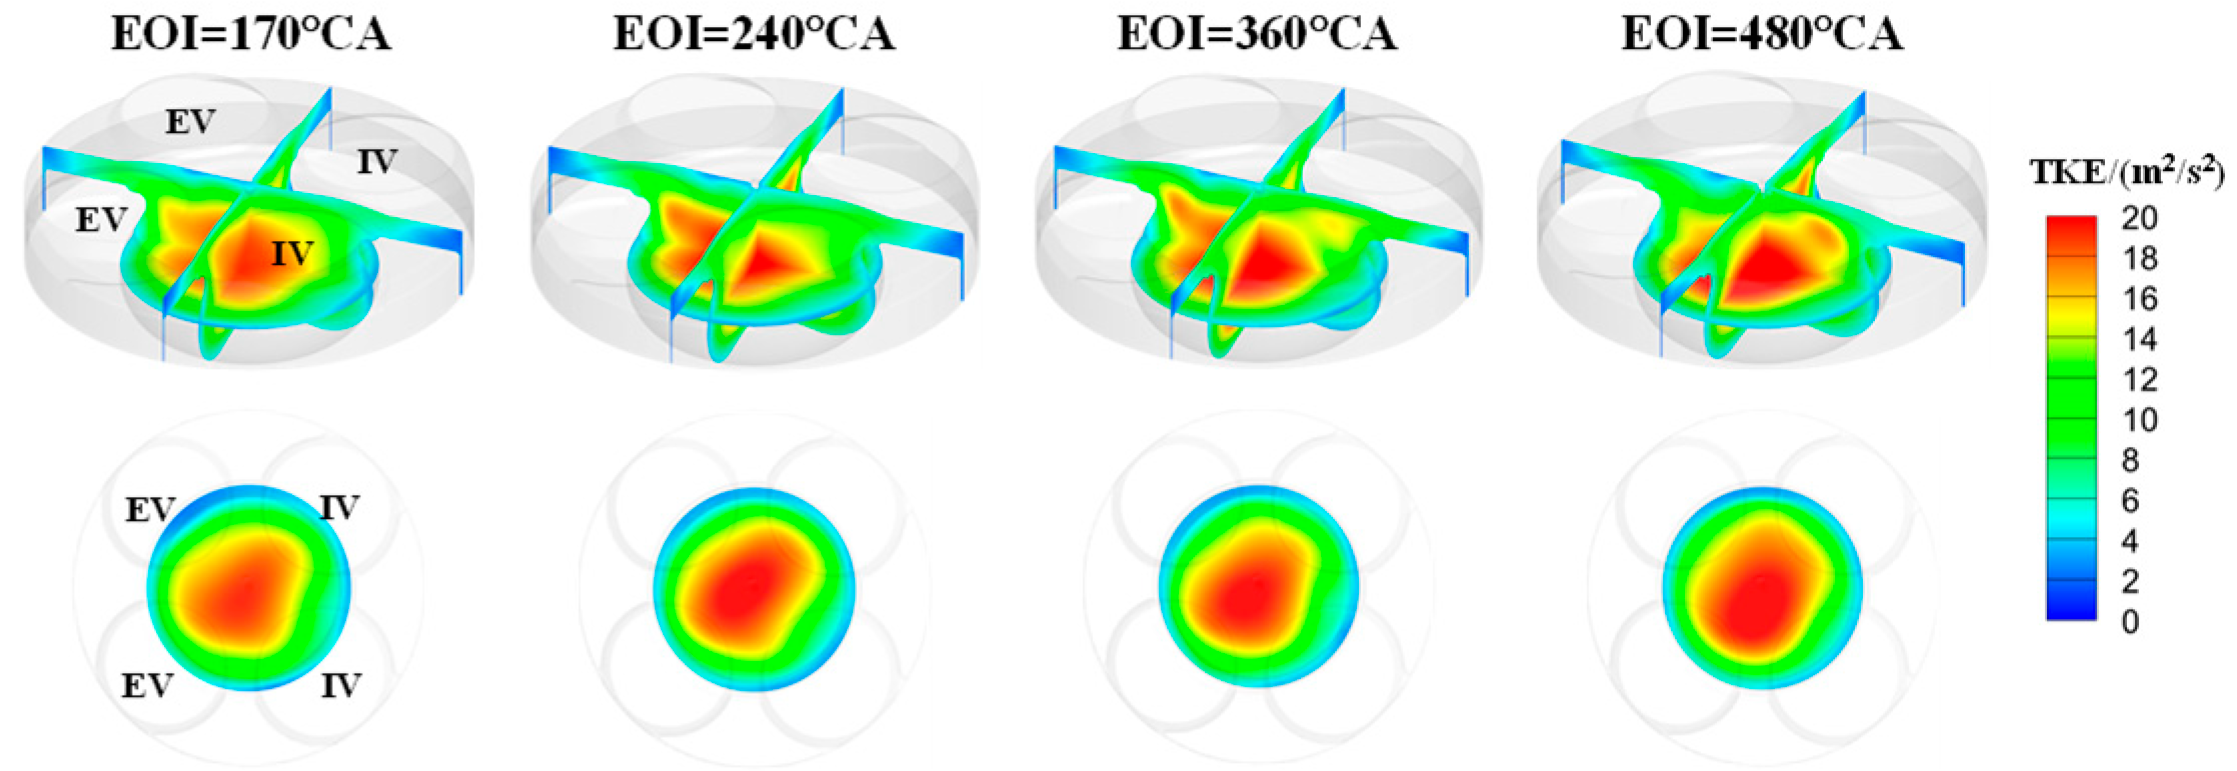
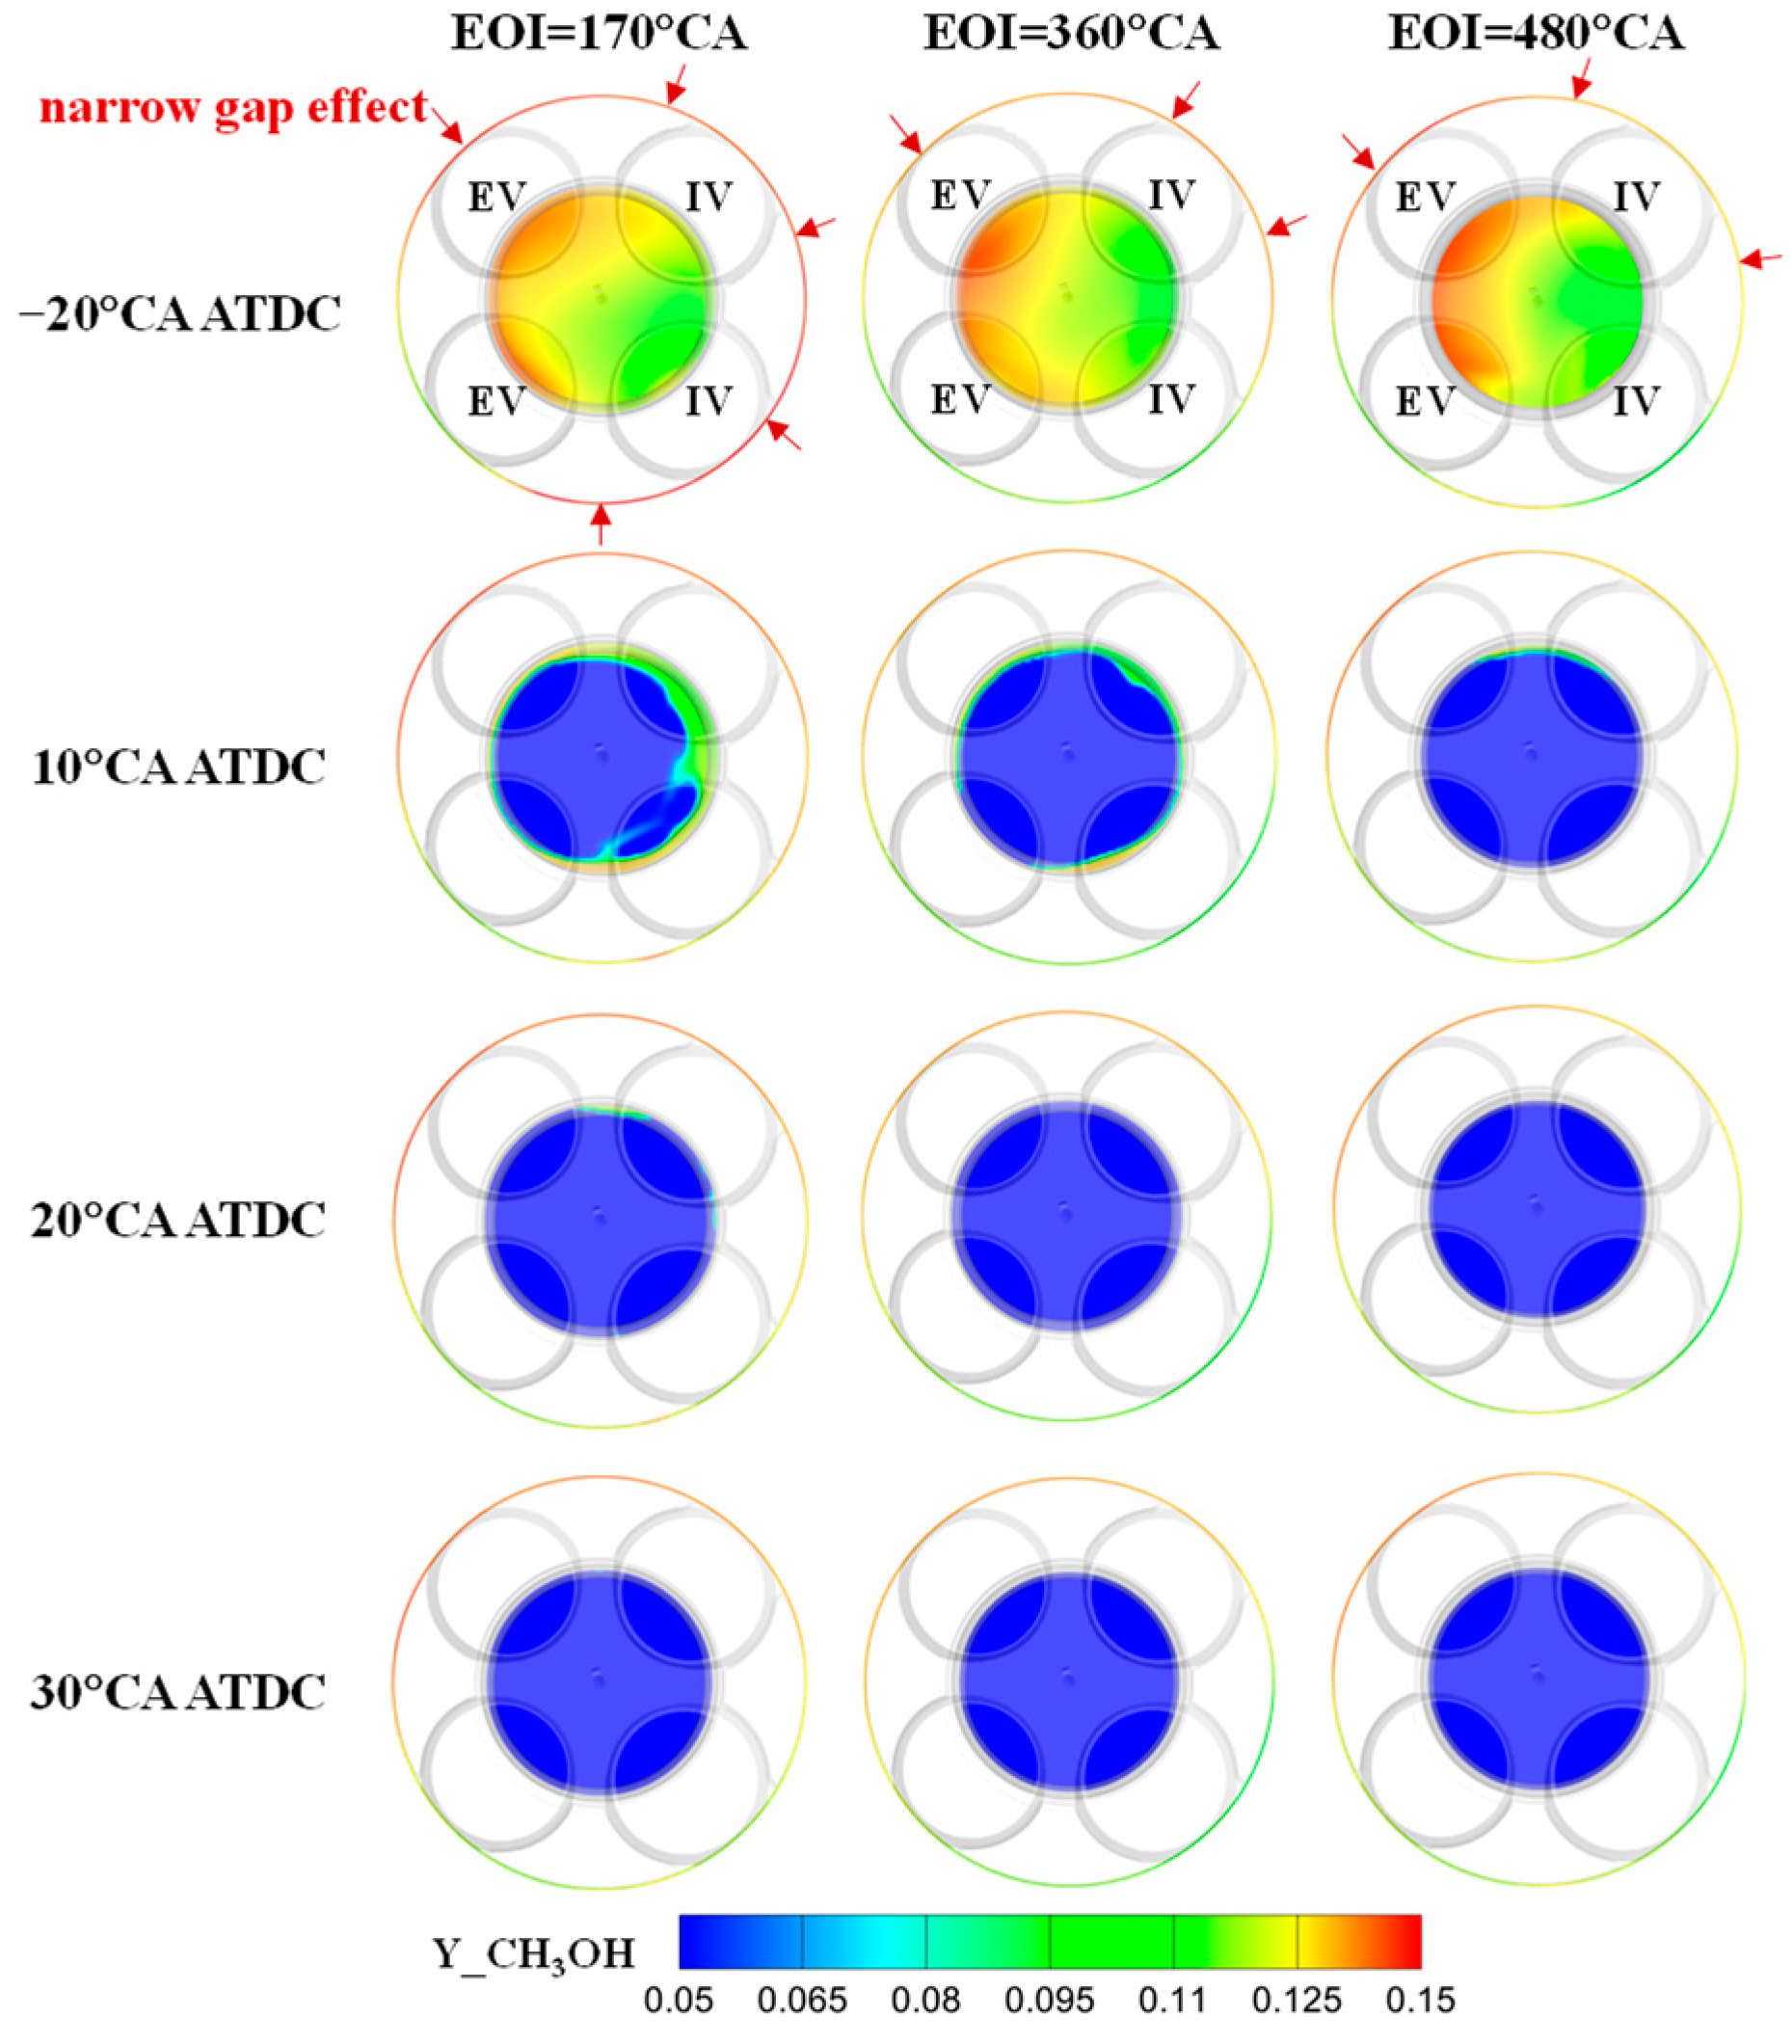
3.1. Effect of Injection Timing on the Methanol–Air Mixing Process
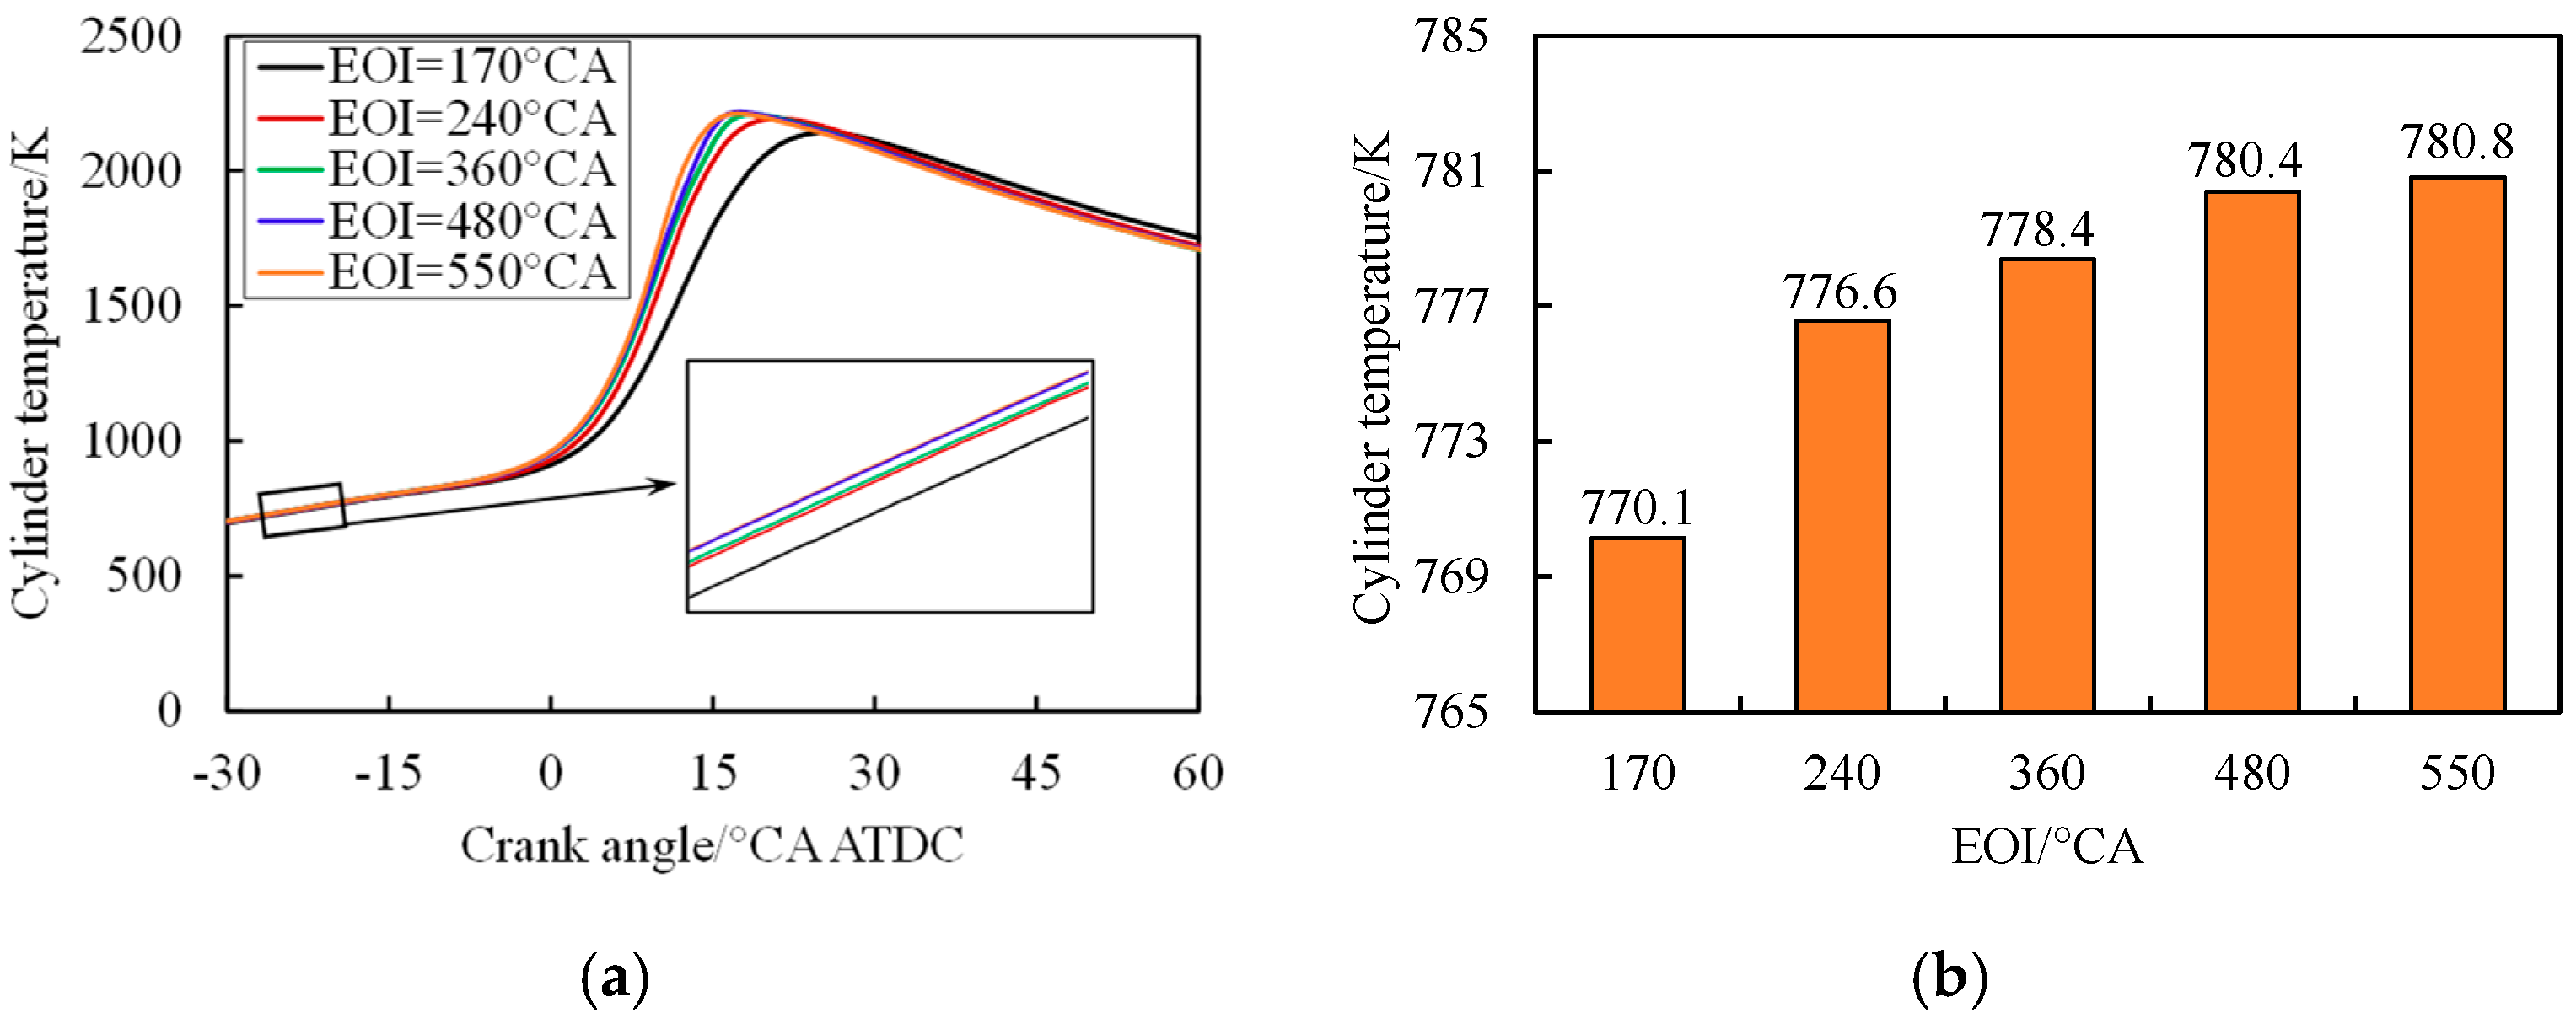
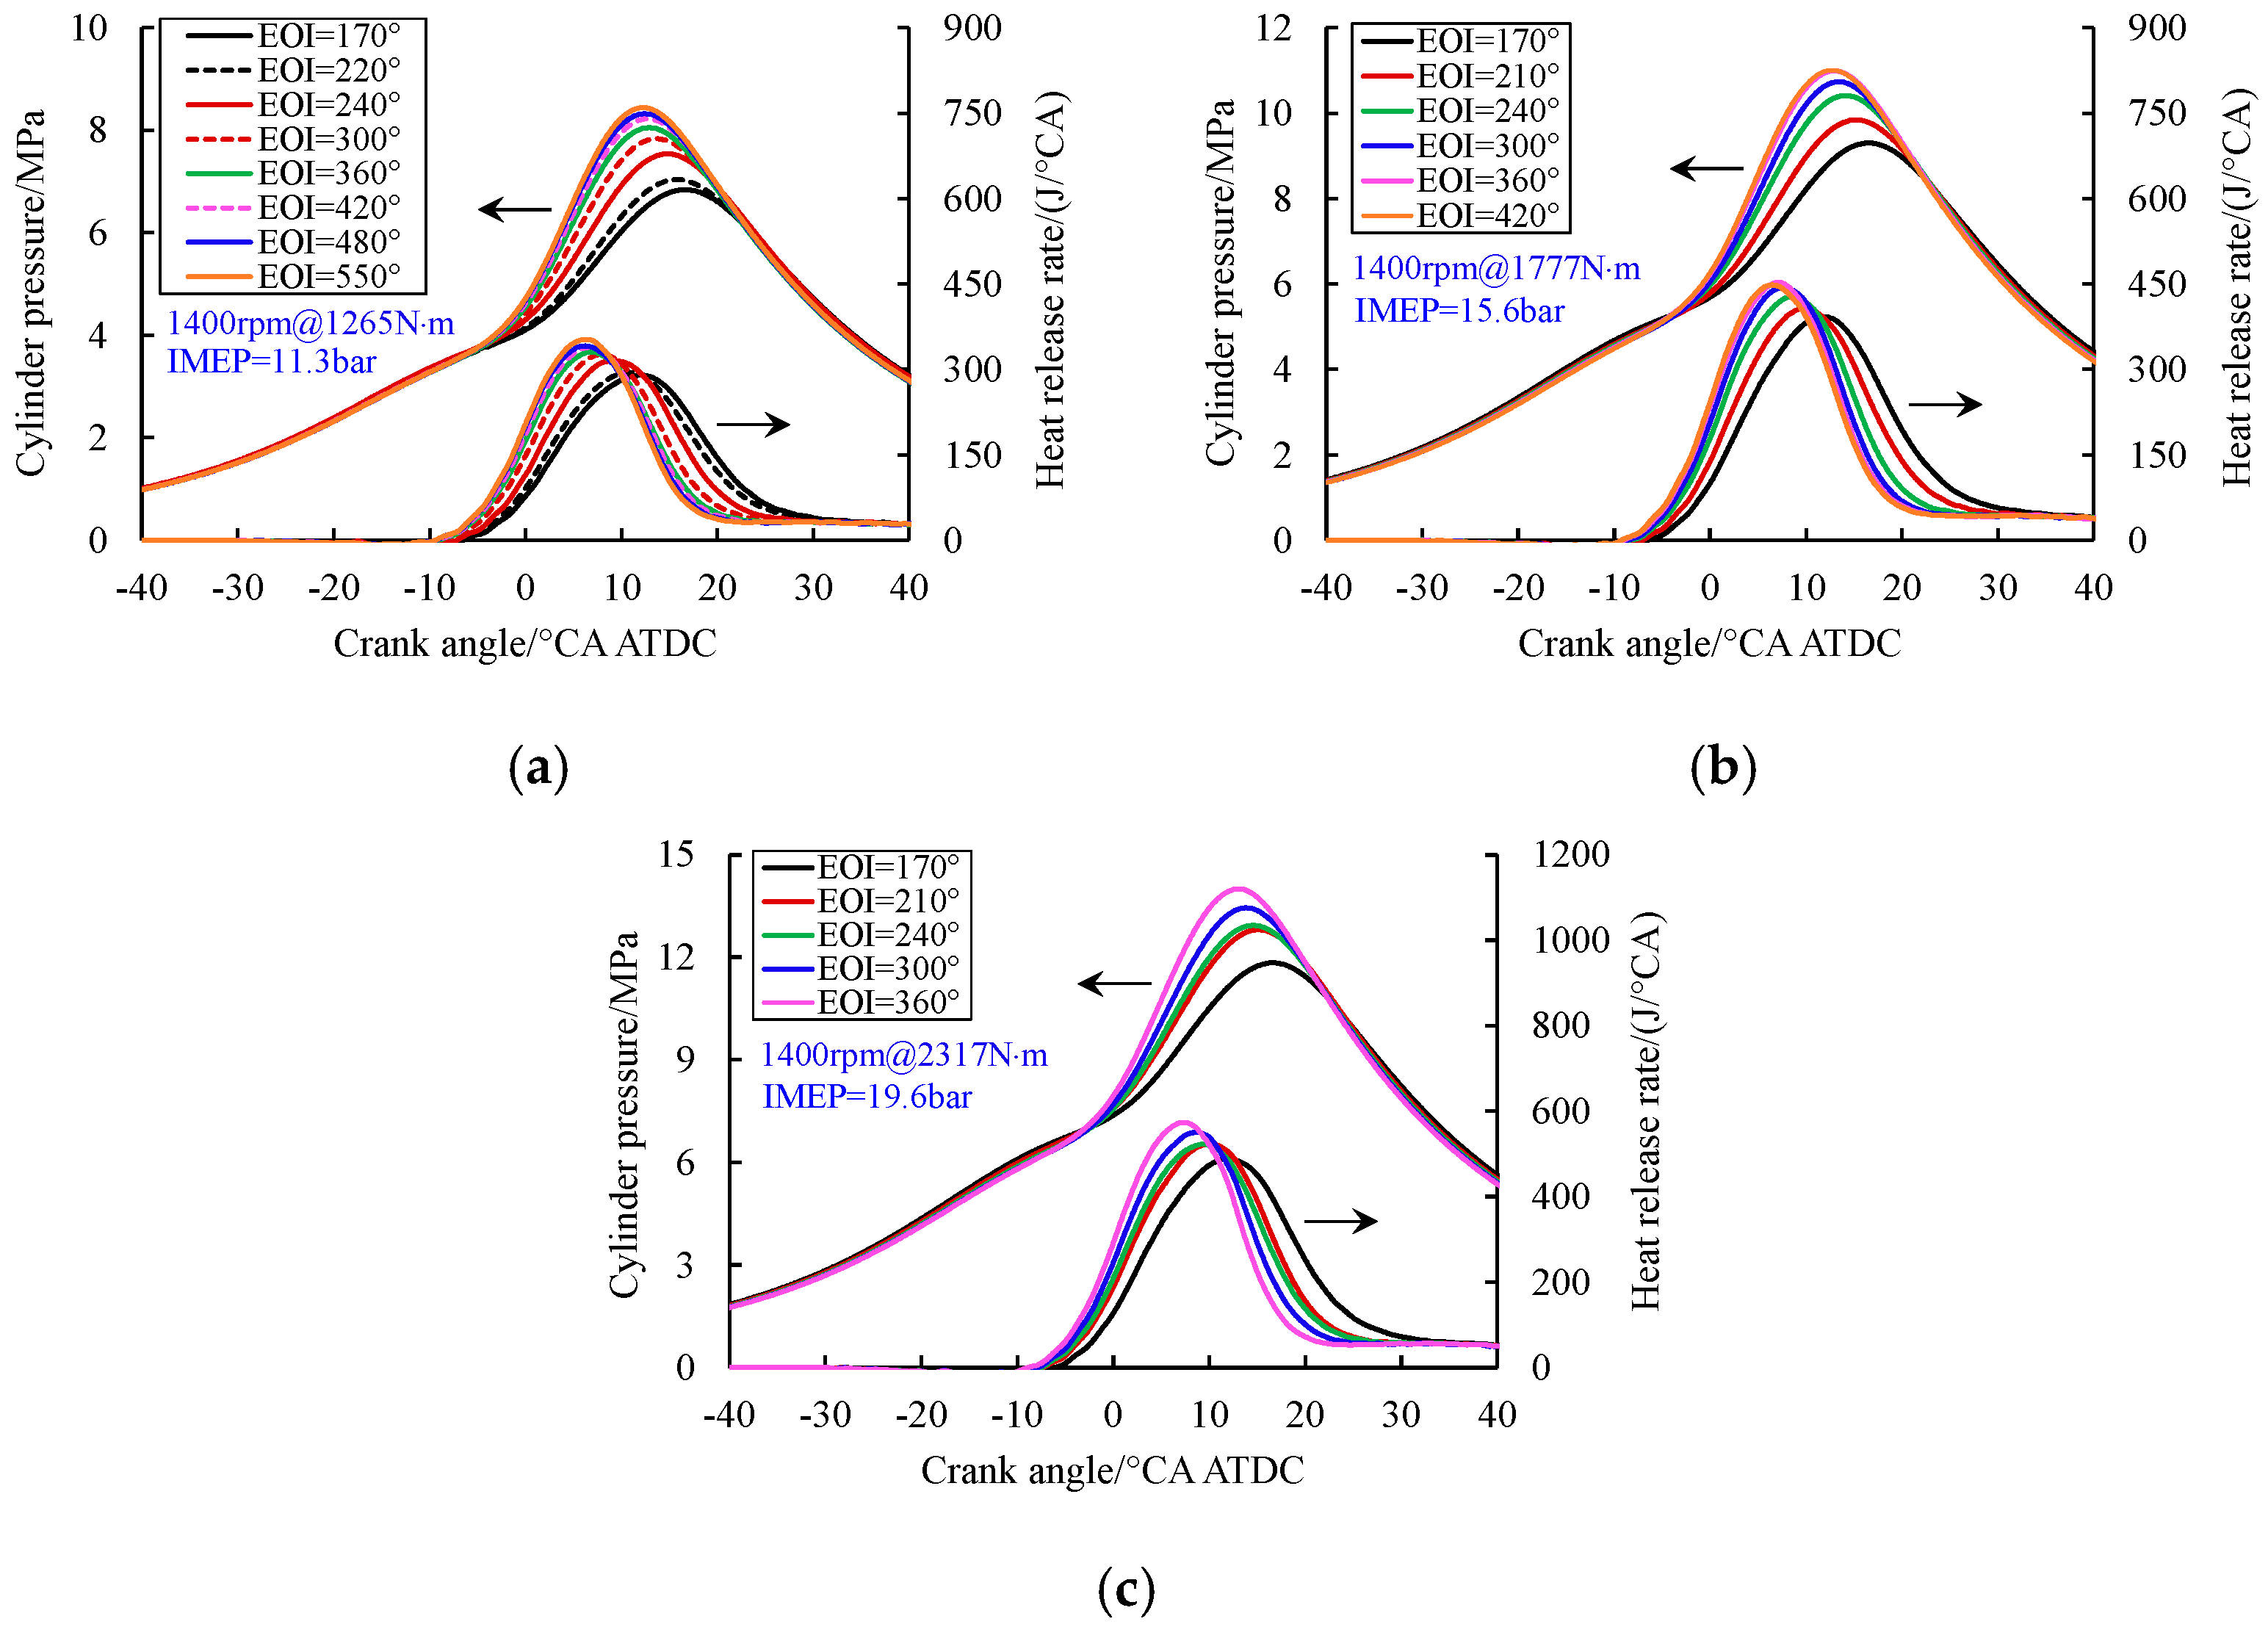
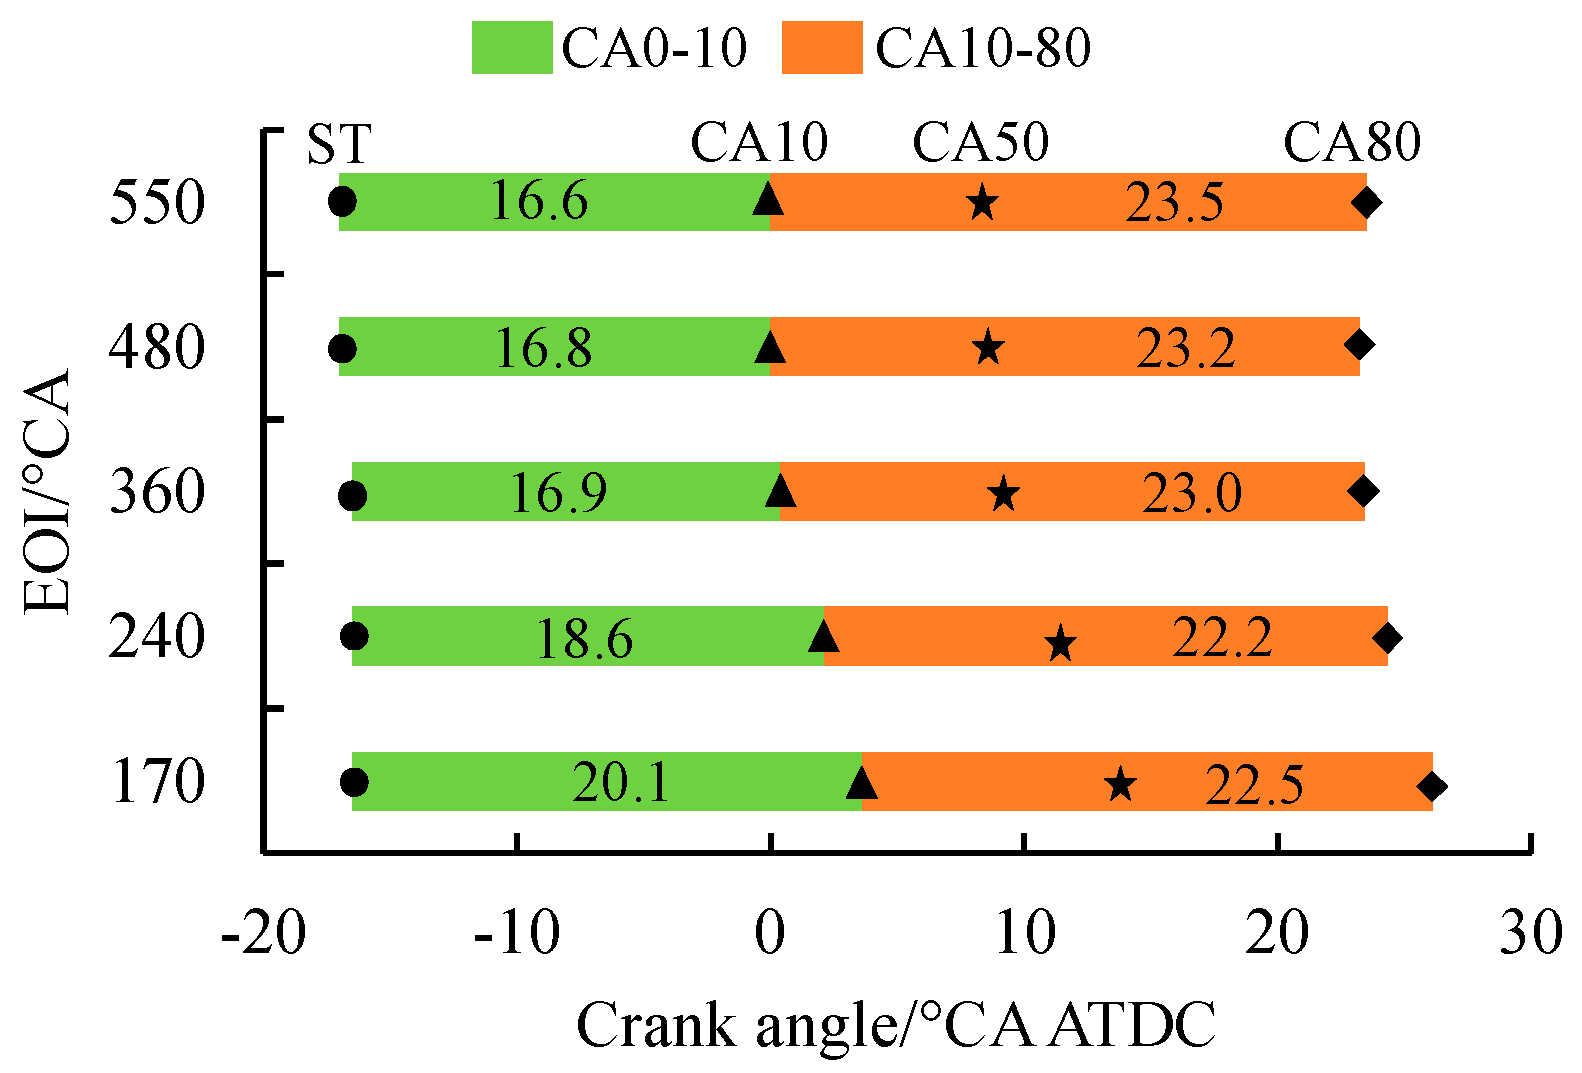
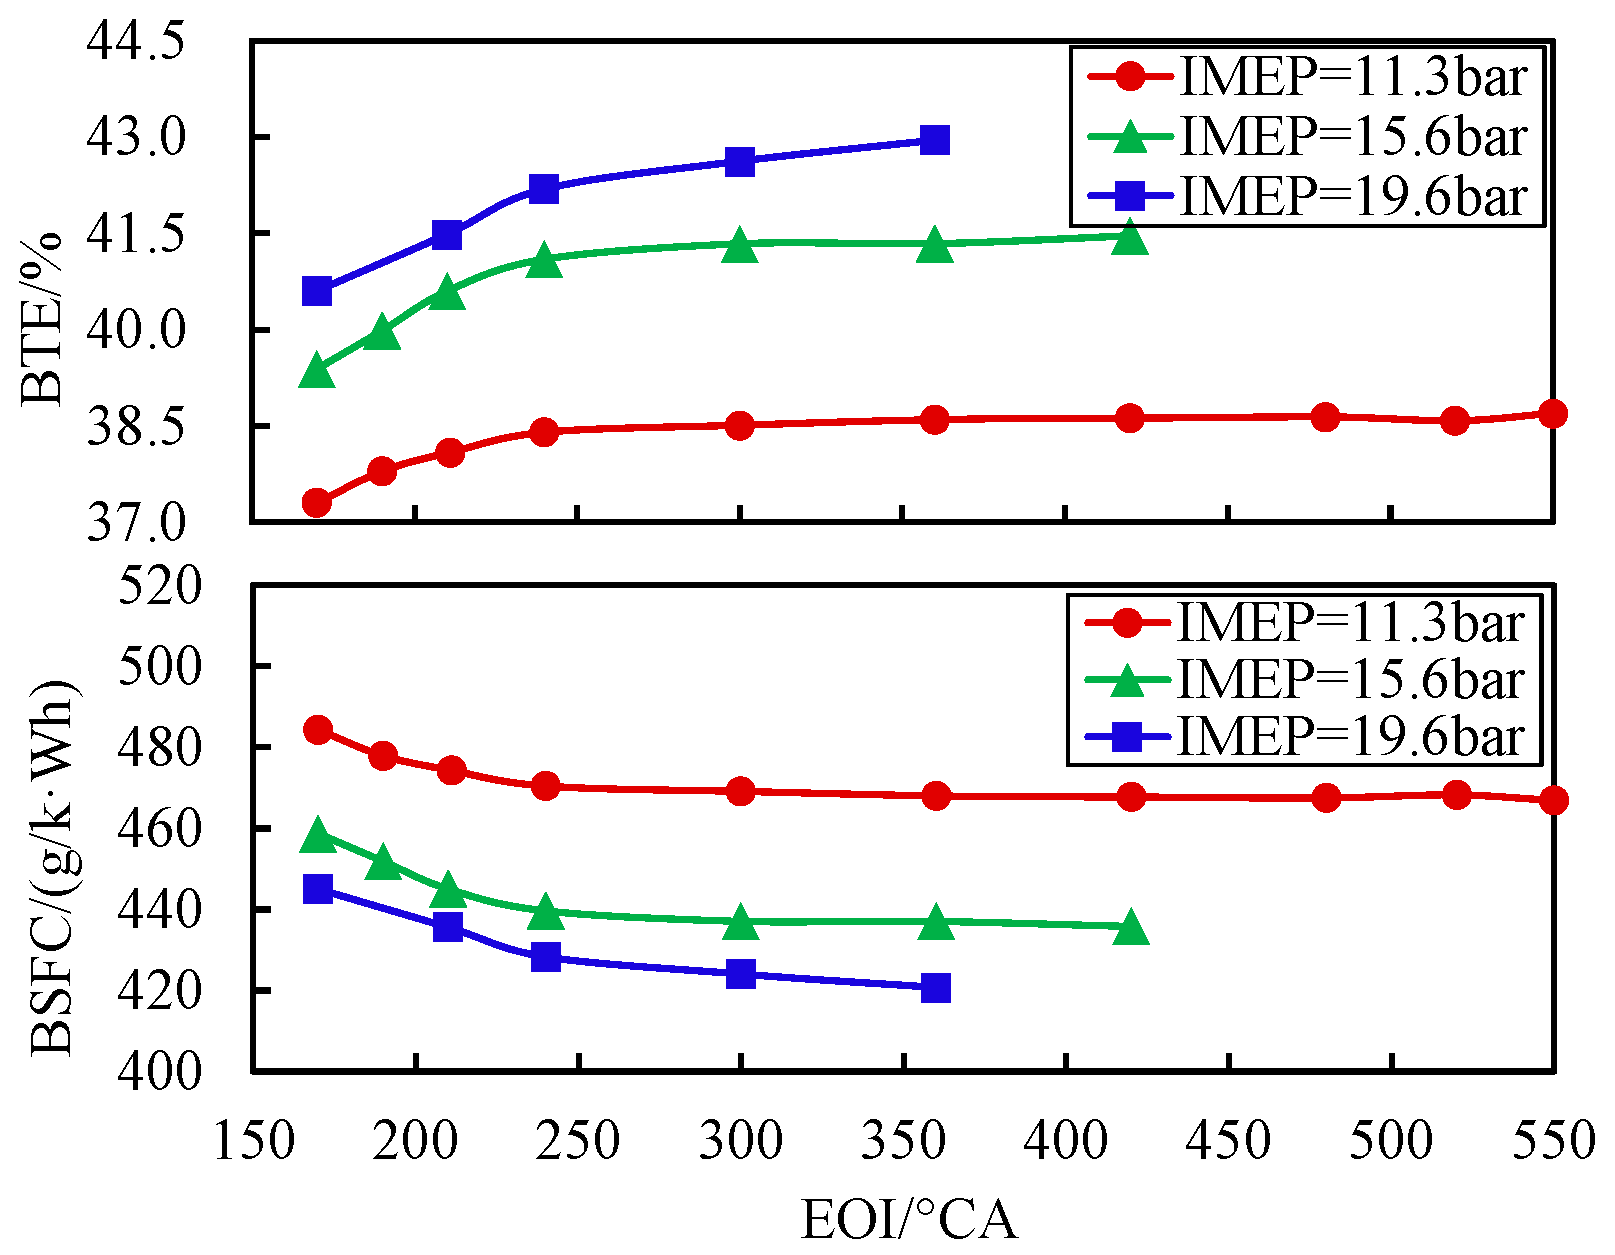
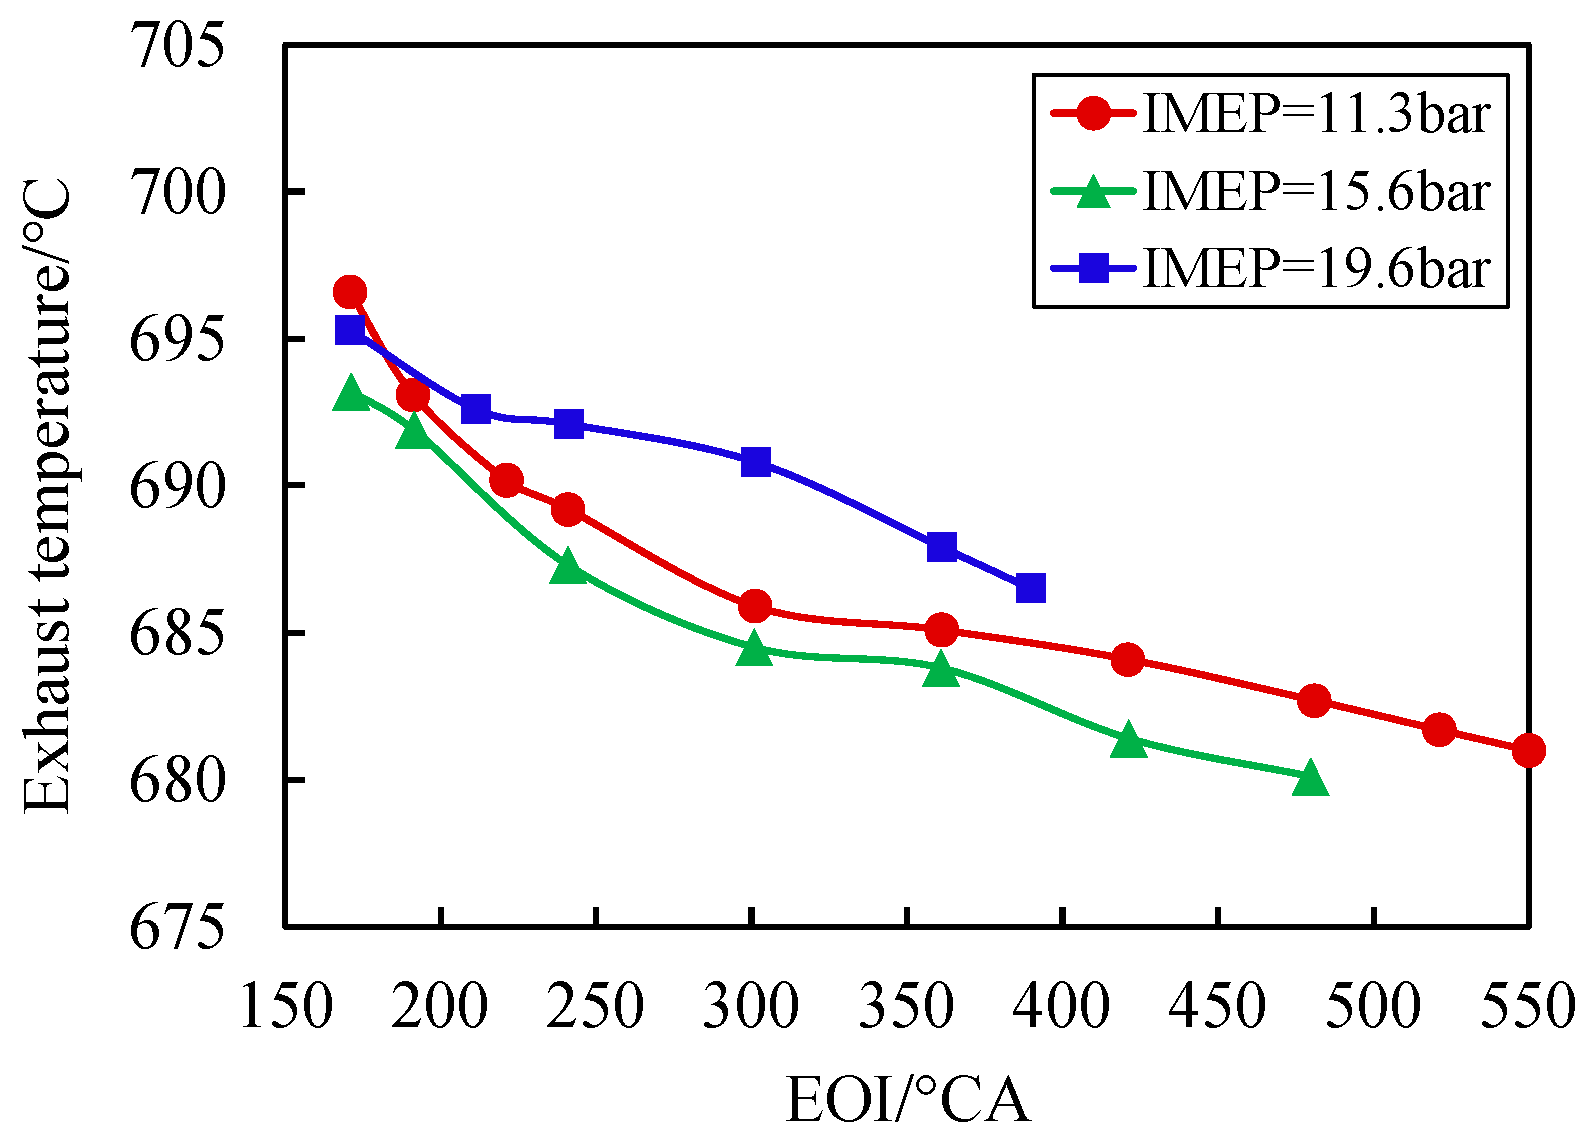
3.2. Effect of Injection Timing on Combustion Performance
3.3. Effect of Injection Timing on Emission Characteristics
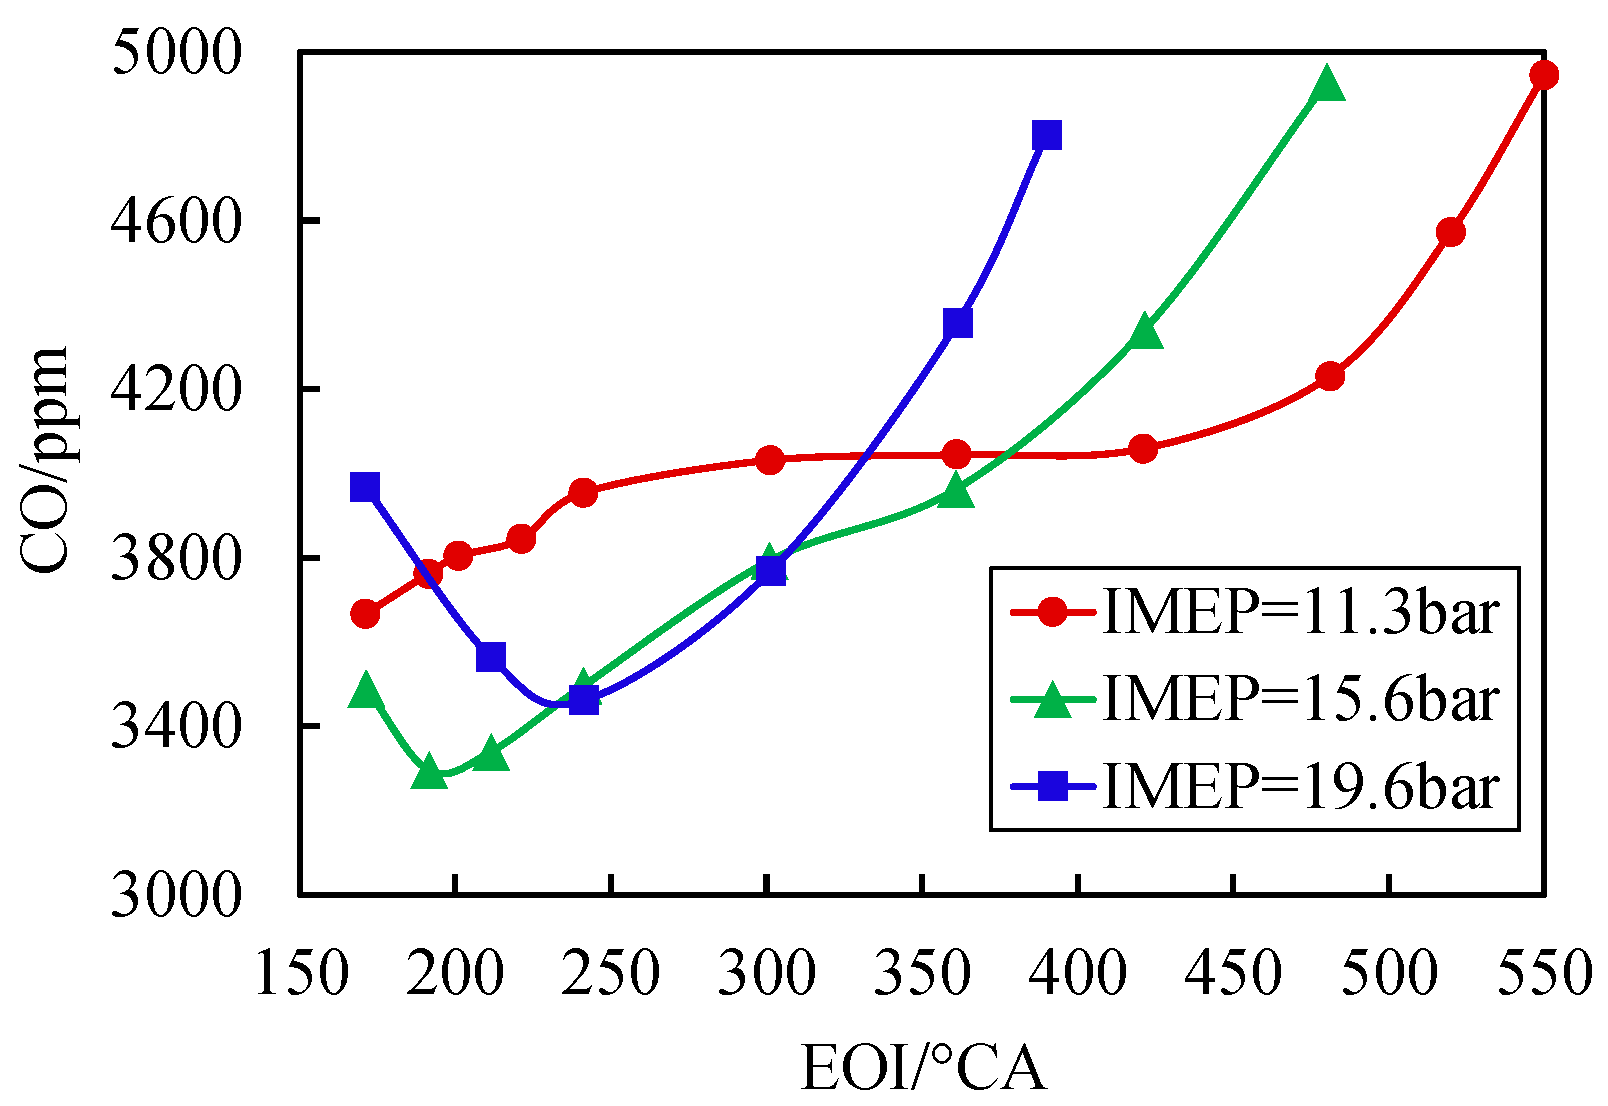
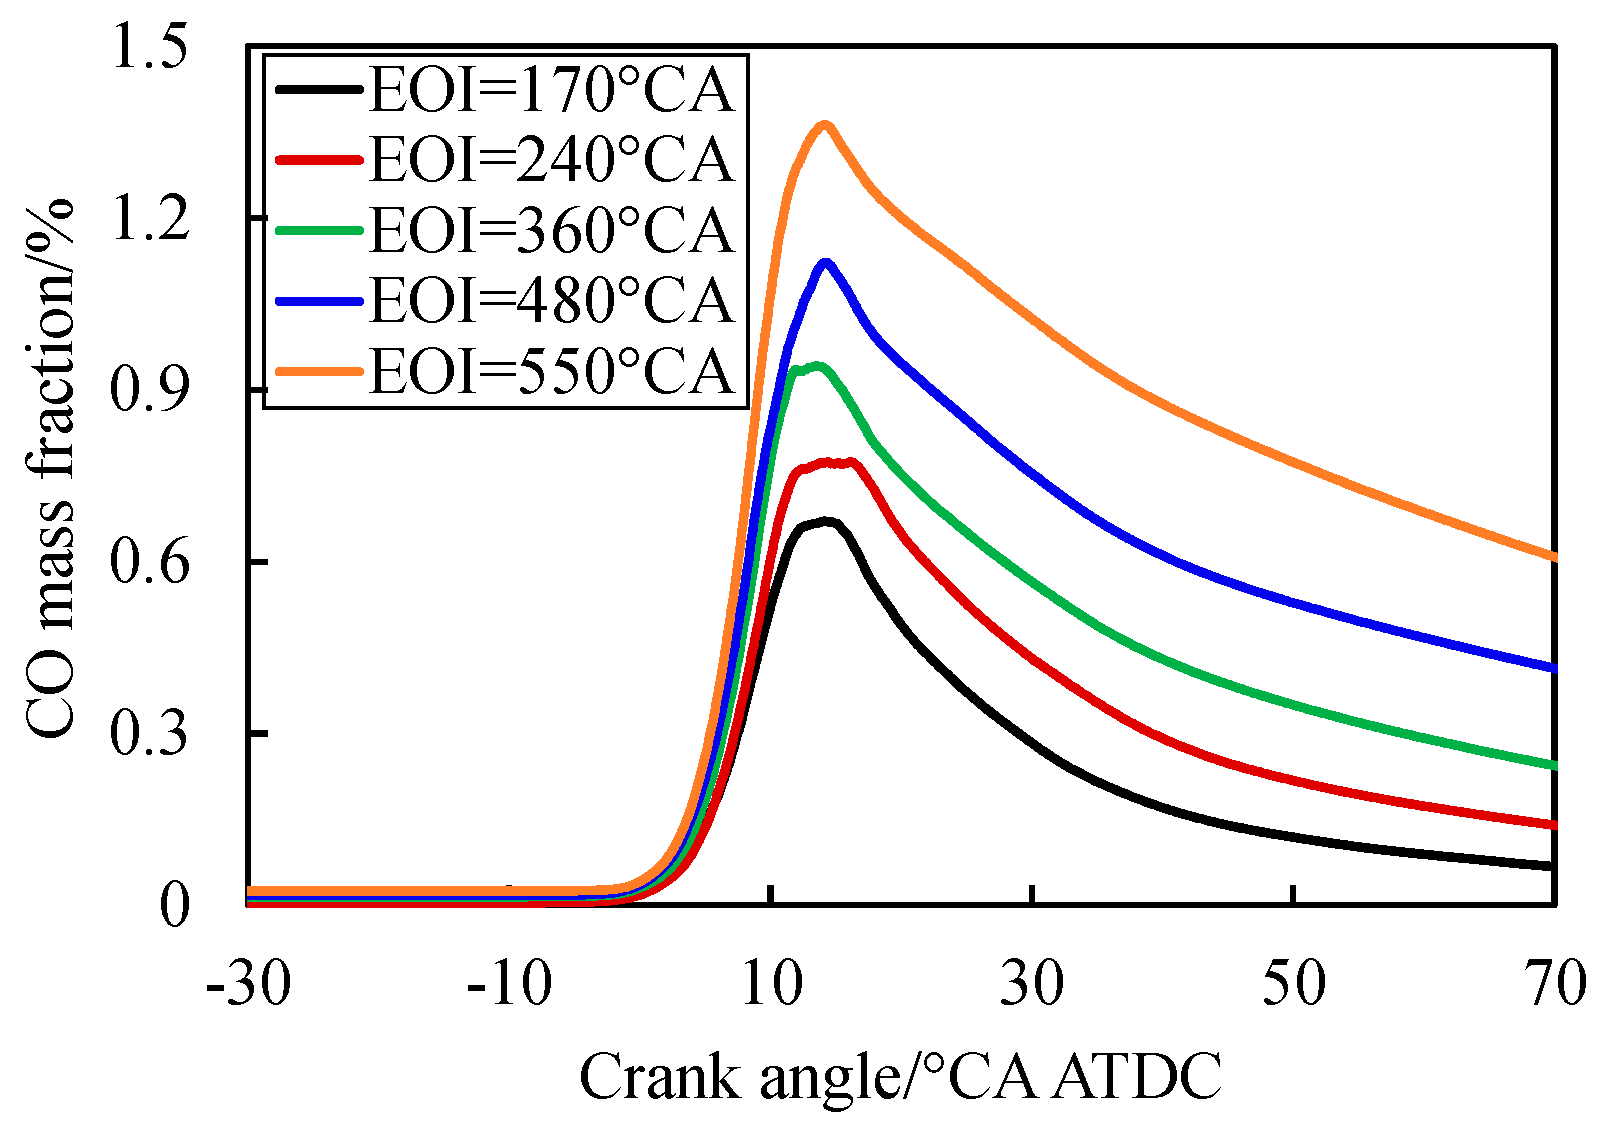
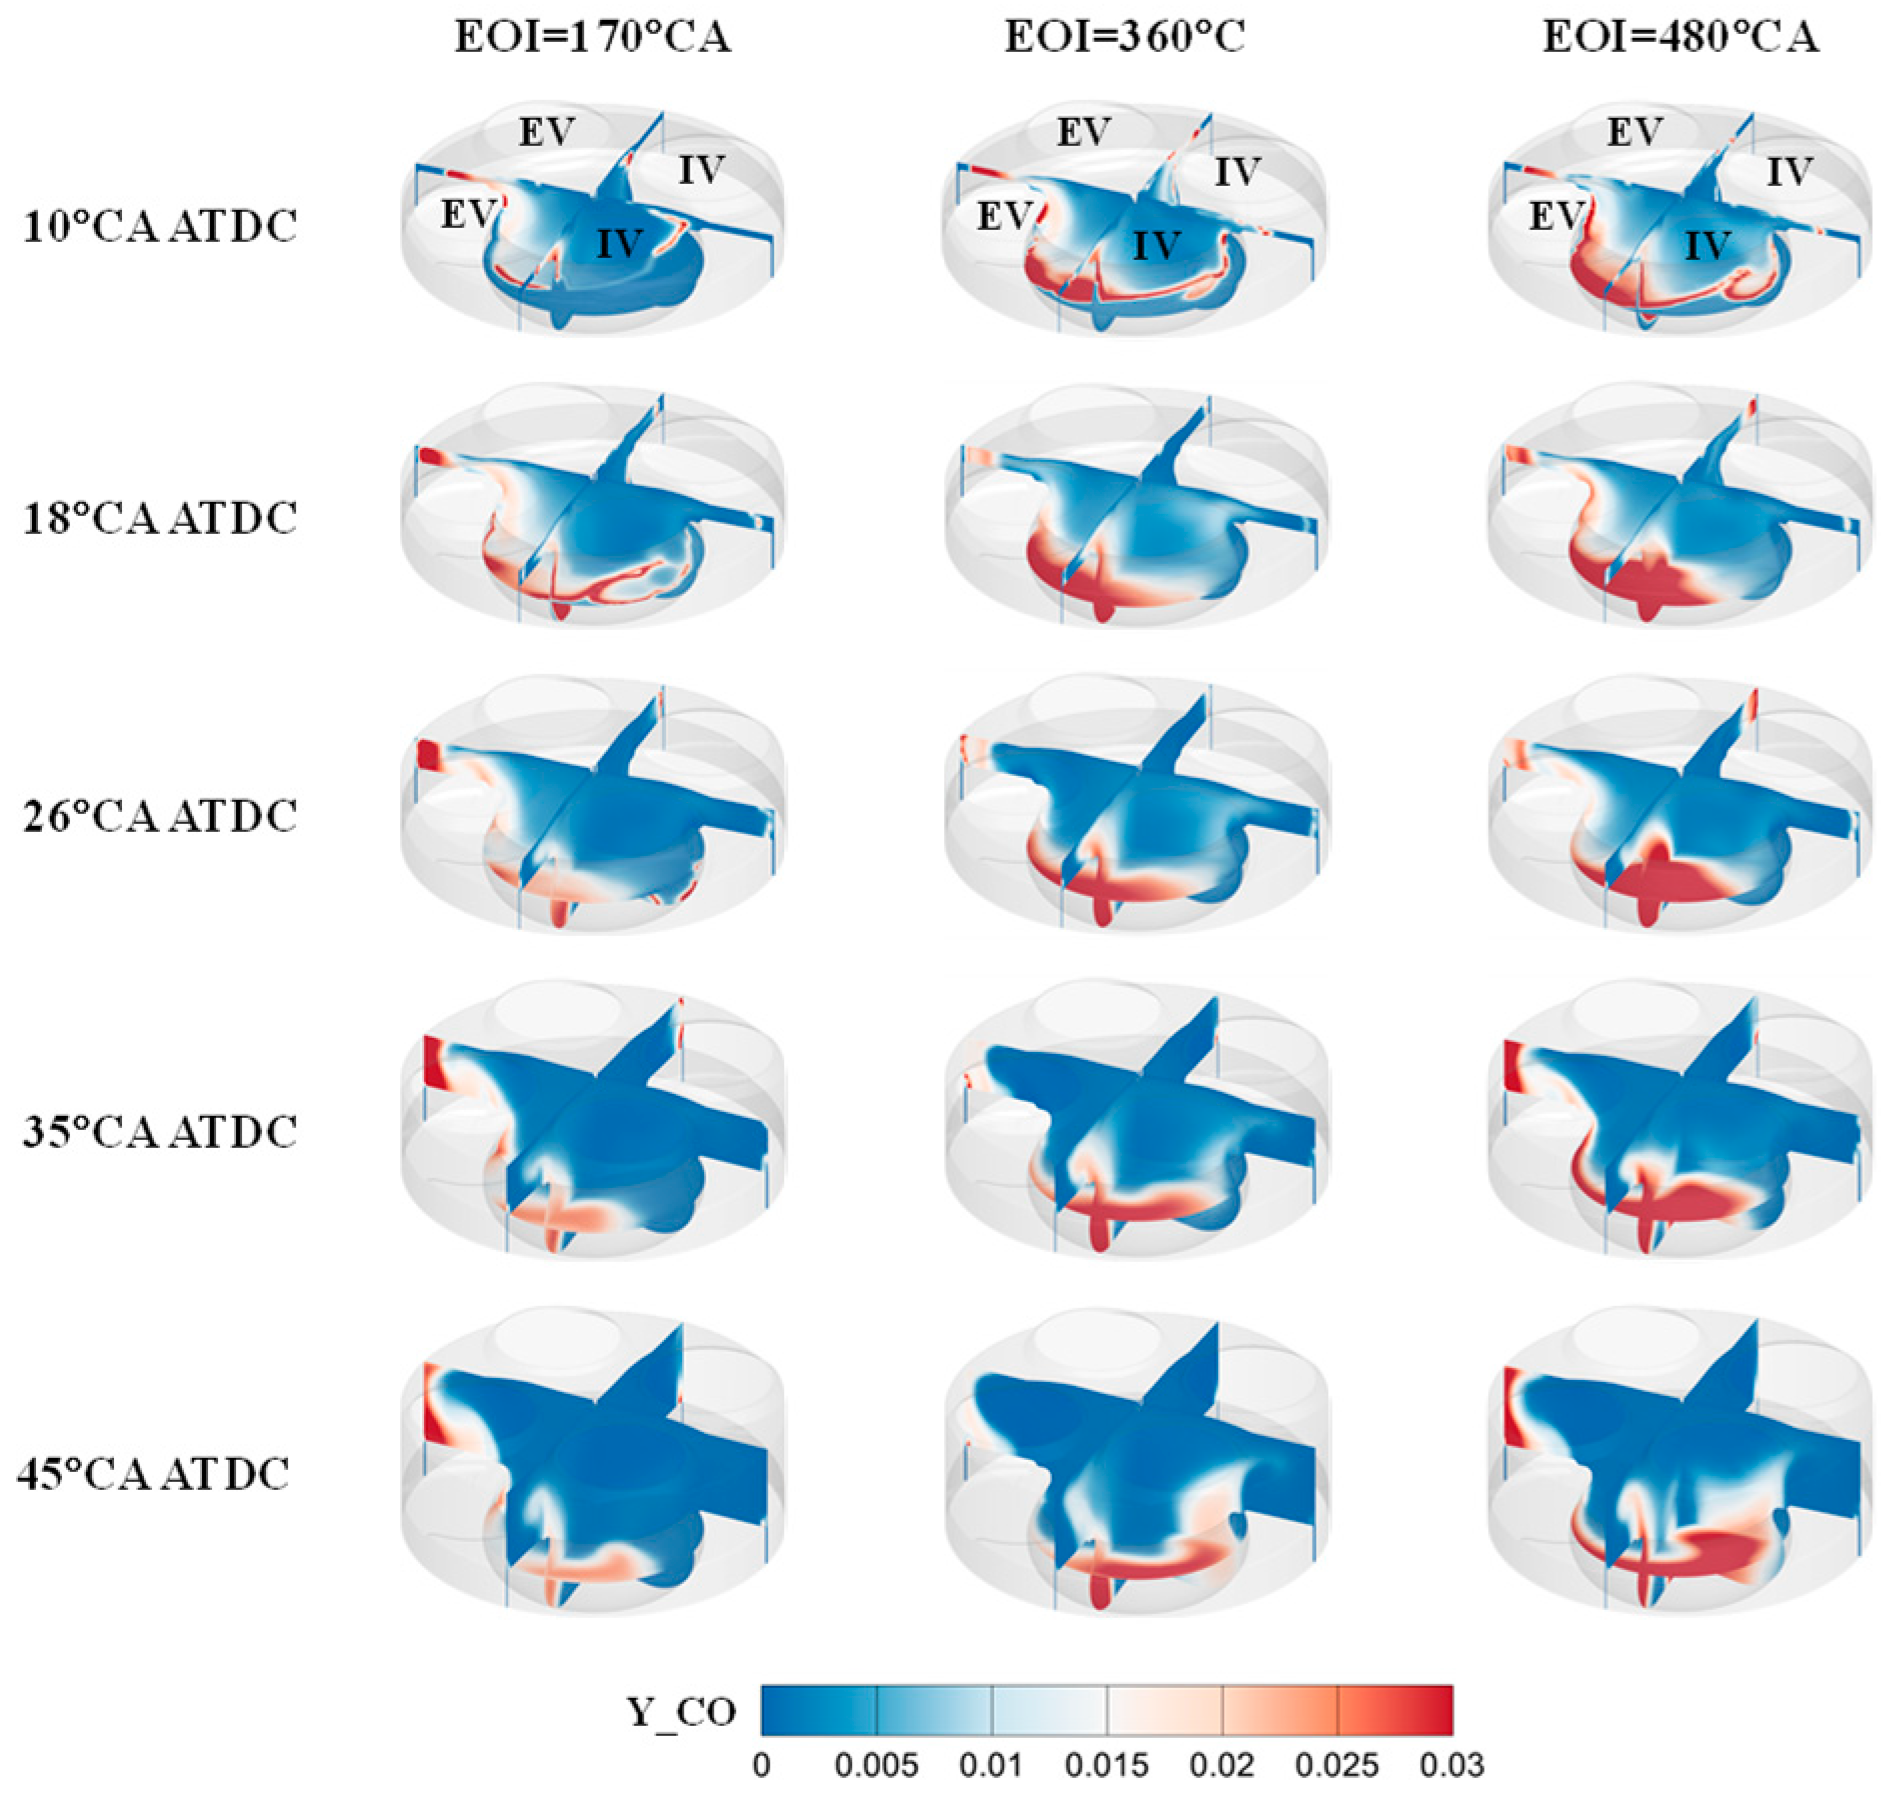
3.3.1. CO Emissions
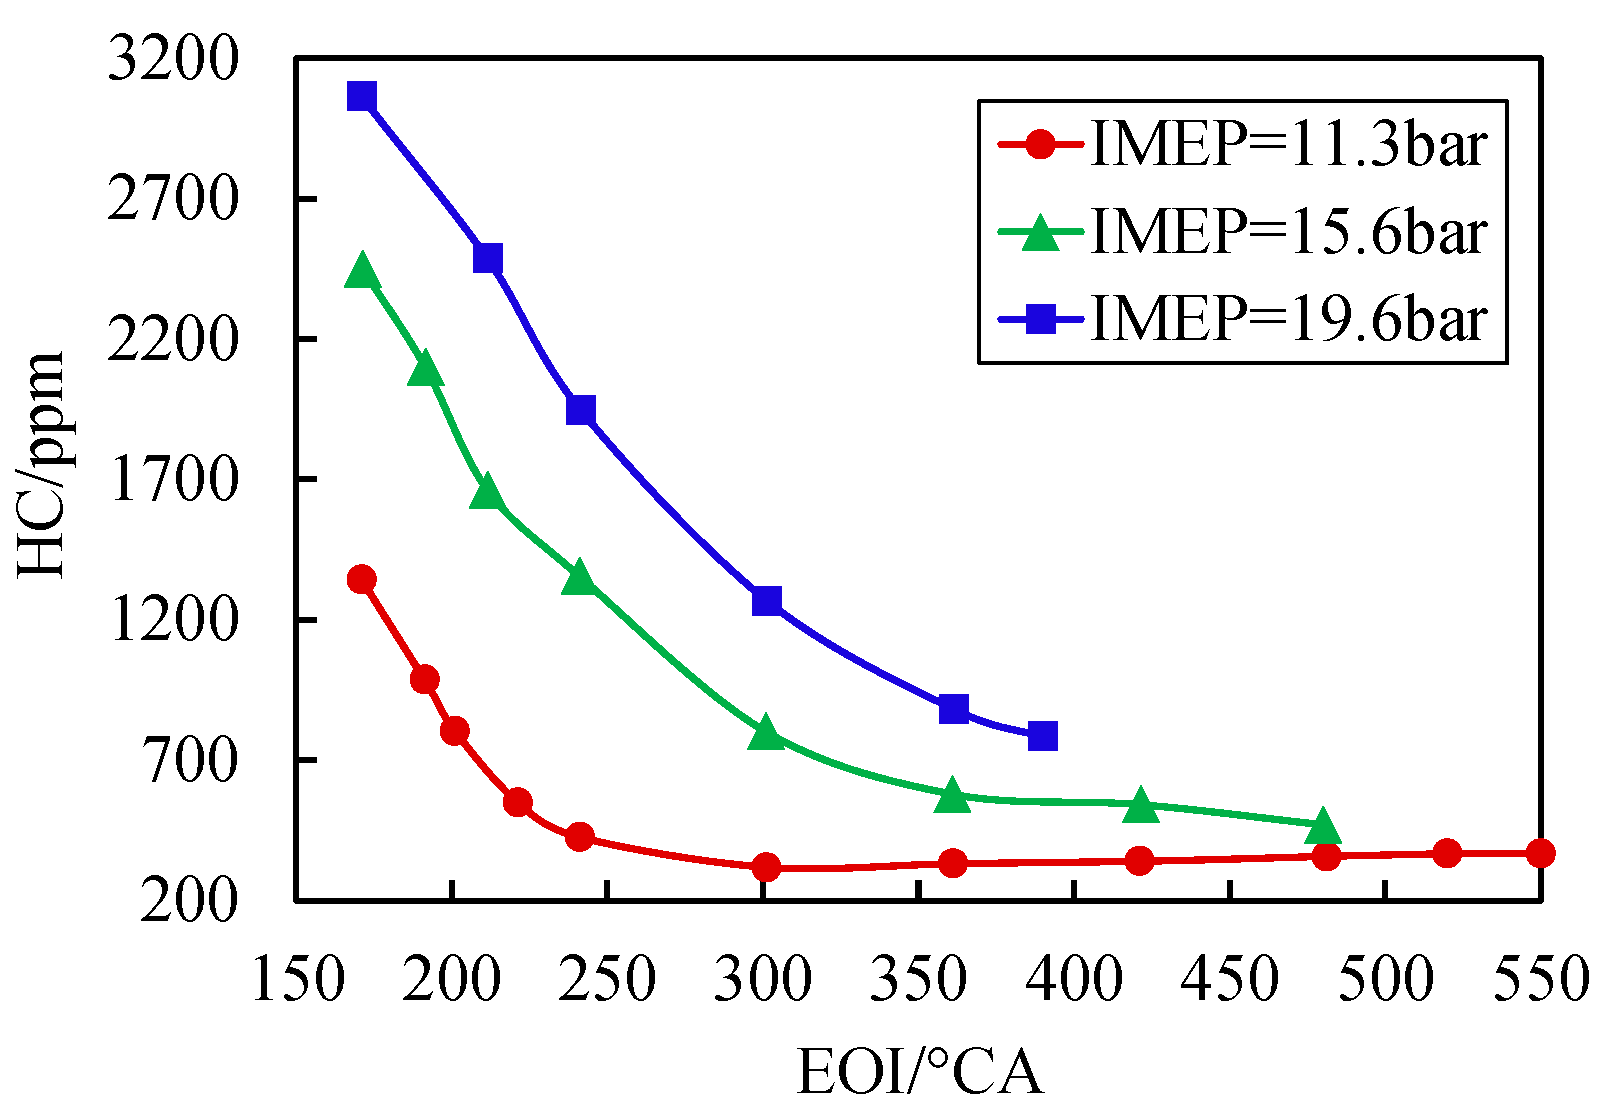
3.3.2. HC Emissions
4. Conclusions
- (1)
- The simulation results indicate that the injection timing directly influences the methanol–air mixing process and determines the in-cylinder liquid film deposition amount, mixture distribution, and temperature distribution. As the EOI increases, the evaporation rate of methanol in the intake port is enhanced, leading to reductions in the amounts of methanol droplets and liquid film in the cylinder. This weakens the cooling effect of methanol evaporation on the intake charge, resulting in a relatively high in-cylinder temperature.
- (2)
- The experimental results indicate that when the EOI is appropriately increased, the higher in-cylinder temperature and the properly stratified mixture accelerate the combustion rate in the early and middle stages, CA0–10 is shortened, CA50 is significantly advanced, and BTE is improved. When the EOI is further increased, the thinner mixture on the intake side slows down the middle and late stage combustion rates, which limits further improvement of the BTE.
- (3)
- Regarding emission performance, as the EOI increases, the amount of methanol in the piston crevices decreases. The weakening of the crevice effect leads to a reduction in HC emissions. However, the inhomogeneity of the in-cylinder mixture slightly increases, and the relatively low exhaust temperature weakens the post-oxidation process of CO, resulting in an increase in CO emissions.
- (4)
- A proper injection interval has better comprehensive performance. Controlling the EOI at approximately 360 °CA can maintain relatively low CO emissions under various load conditions. At the same time, it can significantly reduce HC emissions by 71.2–76.4% and increase the BTE by 1.3–2.4%.
Author Contributions
Funding
Data Availability Statement
Conflicts of Interest
Abbreviations
| PFI | Port fuel injection |
| SI | Spark ignition |
| SOI | Start of injection |
| EOI | End of injection |
| BTE | Brake thermal efficiency |
| CI | Compression ignition |
| TWCC | Three-way catalytic converter |
| EGR | Exhaust gas recirculation |
| DISI | Direct injection spark ignition |
| IMEP | Indicated mean effective pressure |
| ITE | Indicated thermal efficiency |
| IVO | Intake valve opening |
| BSFC | Brake-specific fuel consumption |
References
- Krishnan, M.G.; Rajkumar, S.; Thangaraja, J.; Devarajan, Y. Exploring the synergistic potential of higher alcohols and biodiesel in blended and dual fuel combustion modes in diesel engines: A comprehensive review. Sustain. Chem. Pharm. 2023, 35, 101180. [Google Scholar] [CrossRef]
- Reitz, R.D.; Ogawa, H.; Payri, R.; Fansler, T.; Kokjohn, S.; Moriyoshi, Y.; Agarwal, A.K.; Arcoumanis, D.; Assanis, D.; Bae, C.; et al. IJER editorial: The future of the internal combustion engine. Int. J. Engine Res. 2019, 21, 3–10. [Google Scholar] [CrossRef]
- Rakopoulos, C.D.; Rakopoulos, D.C.; Kosmadakis, G.M.; Papagiannakis, R.G. Experimental comparative assessment of butanol or ethanol diesel-fuel extenders impact on combustion features, cyclic irregularity, and regulated emissions balance in heavy-duty diesel engine. Energy 2019, 174, 1145–1157. [Google Scholar] [CrossRef]
- Ramsay, C.J.; Dinesh, K.K.J.R. Numerical modelling of a heavy-duty diesel-hydrogen dual-fuel engine with late high pressure hydrogen direct injection and diesel pilot. Int. J. Hydrog. Energy 2024, 49, 674–696. [Google Scholar] [CrossRef]
- Santasalo, A.A.; Nyari, J.; Wojcieszy, M. Application of Synthetic Renewable Methanol to Power the Future Propulsion. SAE Technical Paper 2020-01-2151. 2020. Available online: https://www.sae.org/publications/technical-papers/content/2020-01-2151/ (accessed on 20 December 2024).
- Pellegrini, L.A.; Soave, G.; Gamba, S.; Langè, S. Economic analysis of a combined energy–methanol production plant. Appl. Energy 2011, 88, 4891–4897. [Google Scholar] [CrossRef]
- Lonis, F.; Tola, V.; Cau, G. Assessment of integrated energy systems for the production and use of renewable methanol by water electrolysis and CO2 hydrogenation. Fuel 2021, 285, 119160. [Google Scholar] [CrossRef]
- Di Iorio, S.; Catapano, F.; Magno, A.; Sementa, P.; Vaglieco, B.M. The Potential of Ethanol/Methanol Blends as Renewable Fuels for DI SI Engines. Energies 2023, 16, 2791. [Google Scholar] [CrossRef]
- Kumar Prajapati, L.; Vachan Tirkey, J.; Raj, R.; Jena, P.; Giri, A. Performance analysis of methanol fuelled SI engine with boosted intake pressure and LIVC: A thermodynamic simulation and optimization approach. Appl. Therm. Eng. 2024, 252, 123604. [Google Scholar] [CrossRef]
- Nuthan Prasad, B.S.; Pandey, J.K.; Kumar, G.N. Impact of changing compression ratio on engine characteristics of an SI engine fueled with equi-volume blend of methanol and gasoline. Energy 2020, 191, 116605. [Google Scholar] [CrossRef]
- Ricci, F.; Mariani, F.; Papi, S.; Zembi, J.; Battistoni, M.; Grimaldi, C.N. The Synergy between Methanol M100 and Plasma-Assisted Ignition System PAI to Achieve Increasingly Leaner Mixtures in a Single-Cylinder Engine. Energies 2024, 17, 1659. [Google Scholar] [CrossRef]
- Katoch, A.; Asad, M.; Minaev, S.; Kumar, S. Measurement of laminar burning velocities of methanol–air mixtures at elevated temperatures. Fuel 2016, 182, 57–63. [Google Scholar] [CrossRef]
- Gong, C.; Yi, L.; Zhang, Z.; Sun, J.; Liu, F. Assessment of ultra-lean burn characteristics for a stratified-charge direct-injection spark-ignition methanol engine under different high compression ratios. Appl. Energy 2020, 261, 114478. [Google Scholar] [CrossRef]
- Sarıkoç, S. Environmental and enviro-economic effect analysis of hydrogen-methanol-gasoline addition into an SI engine. Fuel 2023, 344, 128124. [Google Scholar] [CrossRef]
- Zhang, B.; Chen, Y.; Jiang, Y.; Lu, W.; Liu, W. Effect of compression ratio and Miller cycle on performance of methanol engine under medium and low loads. Fuel 2023, 351, 128985. [Google Scholar] [CrossRef]
- Farooq, S.; Vinay Kumar, D. Experimental investigation of gasoline ethanol methanol iso-stoichiometric blends on SI engine. Mater. Today Proc. 2023. [Google Scholar] [CrossRef]
- Sathish Kumar, T.; Ashok, B. Development of combustion control map for flex fuel operation in methanol powered direct injection SI engine. Energy 2024, 288, 129695. [Google Scholar] [CrossRef]
- Shamun, S.; Haşimoğlu, C.; Murcak, A.; Andersson, Ö.; Tunér, M.; Tunestål, P. Experimental investigation of methanol compression ignition in a high compression ratio HD engine using a Box-Behnken design. Fuel 2017, 209, 624–633. [Google Scholar] [CrossRef]
- Wang, Z.; Jie, Z.; Liu, X. Combustion and Emission Characteristics of Methanol–Diesel Dual Fuel Engine at Different Altitudes. J. Mar. Sci. Eng. 2024, 12, 2210. [Google Scholar] [CrossRef]
- Wang, Y.; Dong, P.; Long, W.; Tian, J.; Wei, F.; Wang, Q.; Cui, Z.; Li, B. Characteristics of Evaporating Spray for Direct Injection Methanol Engine: Comparison between Methanol and Diesel Spray. Processes 2022, 10, 1132. [Google Scholar] [CrossRef]
- Feng, S.; Zhang, S.; Zhang, H.; Shi, J. Effect of nozzle geometry on combustion of a diesel-methanol dual-fuel direct injection engine. Fuel 2024, 357, 129734. [Google Scholar] [CrossRef]
- Zhen, X.; Wang, Y. An overview of methanol as an internal combustion engine fuel. Renew. Sustain. Energy Rev. 2015, 52, 477–493. [Google Scholar] [CrossRef]
- Vancoillie, J.; Sileghem, L.; Van de Ginste, M.; Demuynck, J.; Galle, J.; Verhelst, S. Experimental Evaluation of Lean-Burn and EGR as Load Control Strategies for Methanol Engines. SAE Technical Paper 2012-01-1283. 2012. Available online: https://www.sae.org/publications/technical-papers/content/2012-01-1283/ (accessed on 20 December 2024).
- Güdden, A.; Pischinger, S.; Geiger, J.; Heuser, B.; Müther, M. An experimental study on methanol as a fuel in large bore high speed engine applications—Port fuel injected spark ignited combustion. Fuel 2021, 303, 121292. [Google Scholar] [CrossRef]
- Chen, Z.; Wang, L.; Zeng, K. Comparative study of combustion process and cycle-by-cycle variations of spark-ignition engine fueled with pure methanol, ethanol, and n-butanol at various air–fuel ratios. Fuel 2019, 254, 115683. [Google Scholar] [CrossRef]
- Gong, C.; Peng, L.; Chen, Y.; Liu, J.; Liu, F.; Han, Y. Computational study of intake temperature effects on mixture formation, combustion and unregulated emissions of a DISI methanol engine during cold start. Fuel 2018, 234, 1269–1277. [Google Scholar] [CrossRef]
- Duan, Q.; Kou, H.; Li, T.; Yin, X.; Zeng, K.; Wang, L. Effects of injection and spark timings on combustion, performance and emissions (regulated and unregulated) characteristics in a direct injection methanol engine. Fuel Process. Technol. 2023, 247, 107758. [Google Scholar] [CrossRef]
- Li, Y.; Bai, X.S.; Tunér, M.; Im, H.G.; Johansson, B. Investigation on a high-stratified direct injection spark ignition (DISI) engine fueled with methanol under a high compression ratio. Appl. Therm. Eng. 2019, 148, 352–362. [Google Scholar] [CrossRef]
- Zhu, Z.; Mu, Z.; Wei, Y.; Du, R.; Liu, S. Experimental evaluation of performance of heavy-duty SI pure methanol engine with EGR. Fuel 2022, 325, 124948. [Google Scholar] [CrossRef]
- Zhu, Z.; Gu, H.; Zhu, Z.; Wei, Y.; Zeng, K.; Liu, S. Investigation on mixture formation and combustion characteristics of a heavy-duty SI methanol engine. Appl. Therm. Eng. 2021, 196, 117258. [Google Scholar] [CrossRef]
- Sathish Kumar, T.; Ashok, B. Material compatibility of SI engine components towards corrosive effects on methanol-gasoline blends for flex fuel applications. Mater. Chem. Phys. 2023, 296, 127344. [Google Scholar] [CrossRef]
- Schwahn, H.; Lutz, U.; Kramer, U. Deposit Formation of Flex Fuel Engines Operated on Ethanol and Gasoline Blends. SAE Technical Paper 2010-01-1464. 2010. Available online: https://www.sae.org/publications/technical-papers/content/2010-01-1464/ (accessed on 20 December 2024).
- Buck, W.H.; Lohuls, J.R.; Murphy, J.A. Lubrication Studies in a Methanol-Fueled Spark Ignition Engine. SAE Technical Paper 892156. 1989. Available online: https://www.sae.org/publications/technical-papers/content/892156/ (accessed on 20 December 2024).
- Yuan, B.; Wang, Z.; Cao, J.; Huang, Y.; Shen, Y.; Song, Z.; Zhao, H.; Cheng, X. Mixture formation characteristics and feasibility of methanol as an alternative fuel for gasoline in port fuel injection engines: Droplet evaporation and spray visualization. Energy Convers. Manag. 2023, 283, 116956. [Google Scholar] [CrossRef]
- Han, Z.; Reitz, R.D. Turbulence Modeling of Internal Combustion Engines Using RNG κ-ε Models. Combust. Sci. Technol. 1995, 106, 267–295. [Google Scholar] [CrossRef]
- Beale, J.C.; Reitz, R.D. Modeling spray atomization with the Kelvin-Helmholtz/Rayleigh-Taylor /hybrid model. At. Sprays 1999, 9, 623–650. [Google Scholar]
- He, X.; Xu, K.; Xu, Y.; Zhang, Z.; Wei, W. Effects of nozzle diameter on the characteristic time scales of diesel spray two-stage ignition under cold-start conditions. Fuel 2023, 335, 126700. [Google Scholar] [CrossRef]
- Schmidt, D.P.; Rutland, C.J. A New Droplet Collision Algorithm. J. Comput. Phys. 2000, 164, 62–80. [Google Scholar] [CrossRef]
- O’Rourke, P.J.; Amsden, A.A. A Spray/Wall Interaction Sub-Model for the KIVA-3 Wall Film Model. SAE Technical Paper 2000-01-0271. 2001. Available online: https://www.sae.org/publications/technical-papers/content/2000-01-0271/ (accessed on 20 December 2024).
- Xing, K.; Guan, W.; Guo, X.; Wang, Y.; Tu, Z.; Huang, H. Potential of high compression ratio combined with knock suppression strategy for improving thermal efficiency of spark ignition stoichiometric natural gas engine. Energy Convers. Manag. 2023, 276, 116544. [Google Scholar] [CrossRef]
- Chang, W.; Wang, C.; Wu, Y.; Jin, C.; Zhang, Z.; Liu, H. Study on the mechanism of influence of cetane improver on methanol ignition. Fuel 2023, 354, 129383. [Google Scholar] [CrossRef]
- Wu, H.; Dong, X.; Shi, Z.; Li, H.; Cao, W.; Zhang, L.; Bo, Y.; Li, X. Effect of injection timing on knock combustion and pollutant emission of heavy-duty diesel engines at low temperatures. Chemosphere 2022, 305, 135519. [Google Scholar] [CrossRef] [PubMed]
- Yin, X.; Yue, G.; Liu, J.; Duan, H.; Duan, Q.; Kou, H.; Wang, Y.; Yang, B.; Zeng, K. Investigation into the operating range of a dual-direct injection engine fueled with methanol and diesel. Energy 2023, 267, 126625. [Google Scholar] [CrossRef]
- Aniolek, K.; Wilk, R. Pre-flame Oxidation Characteristics of Methanol. EnergyFuels 1995, 9, 395–405. [Google Scholar]
- Zhou, D.Z.; Yang, W.M.; An, H.; Li, J.; Shu, C. A numerical study on RCCI engine fueled by biodiesel/methanol. Energy Convers. Manag. 2015, 89, 798–807. [Google Scholar] [CrossRef]
- Heywood, J.B. Internal Combustion Engine Fundamentals; McGrawHill: New York, NY, USA, 2018. [Google Scholar]
- Rakopoulos, D.C.; Rakopoulos, C.D.; Kyritsis, D.C. Butanol or DEE blends with either straight vegetable oil or biodiesel excluding fossil fuel: Comparative effects on diesel engine combustion attributes, cyclic variability and regulated emissions trade-off. Energy 2016, 115, 314–325. [Google Scholar] [CrossRef]


| Parameters | Value |
|---|---|
| Engine type | 6-cylinder, turbocharged, stoichiometric combustion |
| Bore/mm | 138 |
| Stroke/mm | 165 |
| Connecting rod/mm | 244.5 |
| Displacement/L | 14.8 |
| Compression ratio/– | 13.5 |
| Number of valves/– | 4 |
| Maximum power/(kW/rpm) | 391/1700 |
| Maximum torque/(N·m/rpm) | 2600/(1000–1400) |
| Intake valve opening timing/°CA BTDC | 10 |
| Intake valve closure timing/°CA ABDC | 59.5 |
| Exhaust valve opening timing/°CA BBDC | 50 |
| Exhaust valve closure timing/°CA ATDC | 12 |
| Measurements | Measuring Range | Accuracy |
|---|---|---|
| Engine speed | 0–4500 rpm | ±1 rpm |
| Engine torque | 0–3600 N·m | ±0.3% |
| In-cylinder pressure | 0–30 MPa | ±0.5% |
| Air flow rate | 0–2000 kg/h | ±0.1% |
| Methanol flow rate | 0–250 kg/h | ±0.12% |
| Intake pressure | 0–0.4 MPa | ±0.25% |
| Intake temperature | 0–150 °C | ±1 K |
| Exhaust pressure | 0–0.6 MPa | ±0.25% |
| Exhaust temperature | 0–1000 °C | ±1 K |
| Crank angle | 0–720 °CA | ±0.1 °CA |
| CO emission | 0–5000 ppm | ±0.5% |
| HC emission | 0–50,000 ppm | ±0.5% |
| NOx emission | 0–50,000 ppm | ±0.5% |
| Speed/ (r/min) | IMEP/ Bar | Intake Pressure After Intercooler/kPa | Intake Temperature After Intercooler/°C | EGR Rate/% | EOI/ °CA | Injection Duration/°CA | Spark Timing/°CA BTDC |
|---|---|---|---|---|---|---|---|
| 1400 | 11.3 | 165 | 35 | 14.0 | 170–550 | 170 | −16.5 |
| 1400 | 15.6 | 200 | 40 | 17.8 | 170–420 | 230 | −16.5 |
| 1400 | 19.6 | 235 | 45 | 17.5 | 170–360 | 330 | −15.5 |
| Wall Boundary Type | Temperature Value/K |
|---|---|
| Intake manifold | 330 |
| Intake port | 360 |
| Intake valve | 450 |
| Exhaust valve | 525 |
| Spark plug | 600 |
| Spark plug electrode | 800 |
| Cylinder head | 500 |
| Piston | 550 |
| Liner | 450 |
| Parameters | Value |
|---|---|
| EGR rate/– | 14.0% |
| Inlet pressure/MPa | 0.125 |
| Inlet temperatures/K | 325 |
| Methanol injection mass/(mg/cycle) | 345 |
| Number of holes/– | 16 |
| Nozzle diameter/mm | 0.3 |
| Spray cone angle/° | 20 |
| Injection pressure/bar | 6.5 |
| Injection duration/°CA | 170 |
| SOI/°CA | 340, 410, 530, 650, 720 |
| EOI/°CA | 170, 240, 360, 480, 550 |
| Spark timing/°CA ATDC | −16.5 |
Disclaimer/Publisher’s Note: The statements, opinions and data contained in all publications are solely those of the individual author(s) and contributor(s) and not of MDPI and/or the editor(s). MDPI and/or the editor(s) disclaim responsibility for any injury to people or property resulting from any ideas, methods, instructions or products referred to in the content. |
© 2025 by the authors. Licensee MDPI, Basel, Switzerland. This article is an open access article distributed under the terms and conditions of the Creative Commons Attribution (CC BY) license (https://creativecommons.org/licenses/by/4.0/).
Share and Cite
Li, Y.; Zhang, Z.; Liu, H.; Chang, W.; Shu, Z.; Wang, H.; Zheng, Z.; Zhao, H.; Wang, X.; Yao, M. Experimental and Simulation Study on Reducing the Liquid Film and Improving the Performance of a Carbon-Neutral Methanol Engine. Energies 2025, 18, 353. https://doi.org/10.3390/en18020353
Li Y, Zhang Z, Liu H, Chang W, Shu Z, Wang H, Zheng Z, Zhao H, Wang X, Yao M. Experimental and Simulation Study on Reducing the Liquid Film and Improving the Performance of a Carbon-Neutral Methanol Engine. Energies. 2025; 18(2):353. https://doi.org/10.3390/en18020353
Chicago/Turabian StyleLi, Yongzhi, Zhi Zhang, Haifeng Liu, Weide Chang, Zanqiao Shu, Hu Wang, Zunqing Zheng, Hua Zhao, Xinyan Wang, and Mingfa Yao. 2025. "Experimental and Simulation Study on Reducing the Liquid Film and Improving the Performance of a Carbon-Neutral Methanol Engine" Energies 18, no. 2: 353. https://doi.org/10.3390/en18020353
APA StyleLi, Y., Zhang, Z., Liu, H., Chang, W., Shu, Z., Wang, H., Zheng, Z., Zhao, H., Wang, X., & Yao, M. (2025). Experimental and Simulation Study on Reducing the Liquid Film and Improving the Performance of a Carbon-Neutral Methanol Engine. Energies, 18(2), 353. https://doi.org/10.3390/en18020353