
Study of Gas–Liquid Two-Phase Flow Characteristics at the Pore Scale Based on the VOF Model

Abstract
:1. Introduction
2. Two-Phase Flow Simulation Method
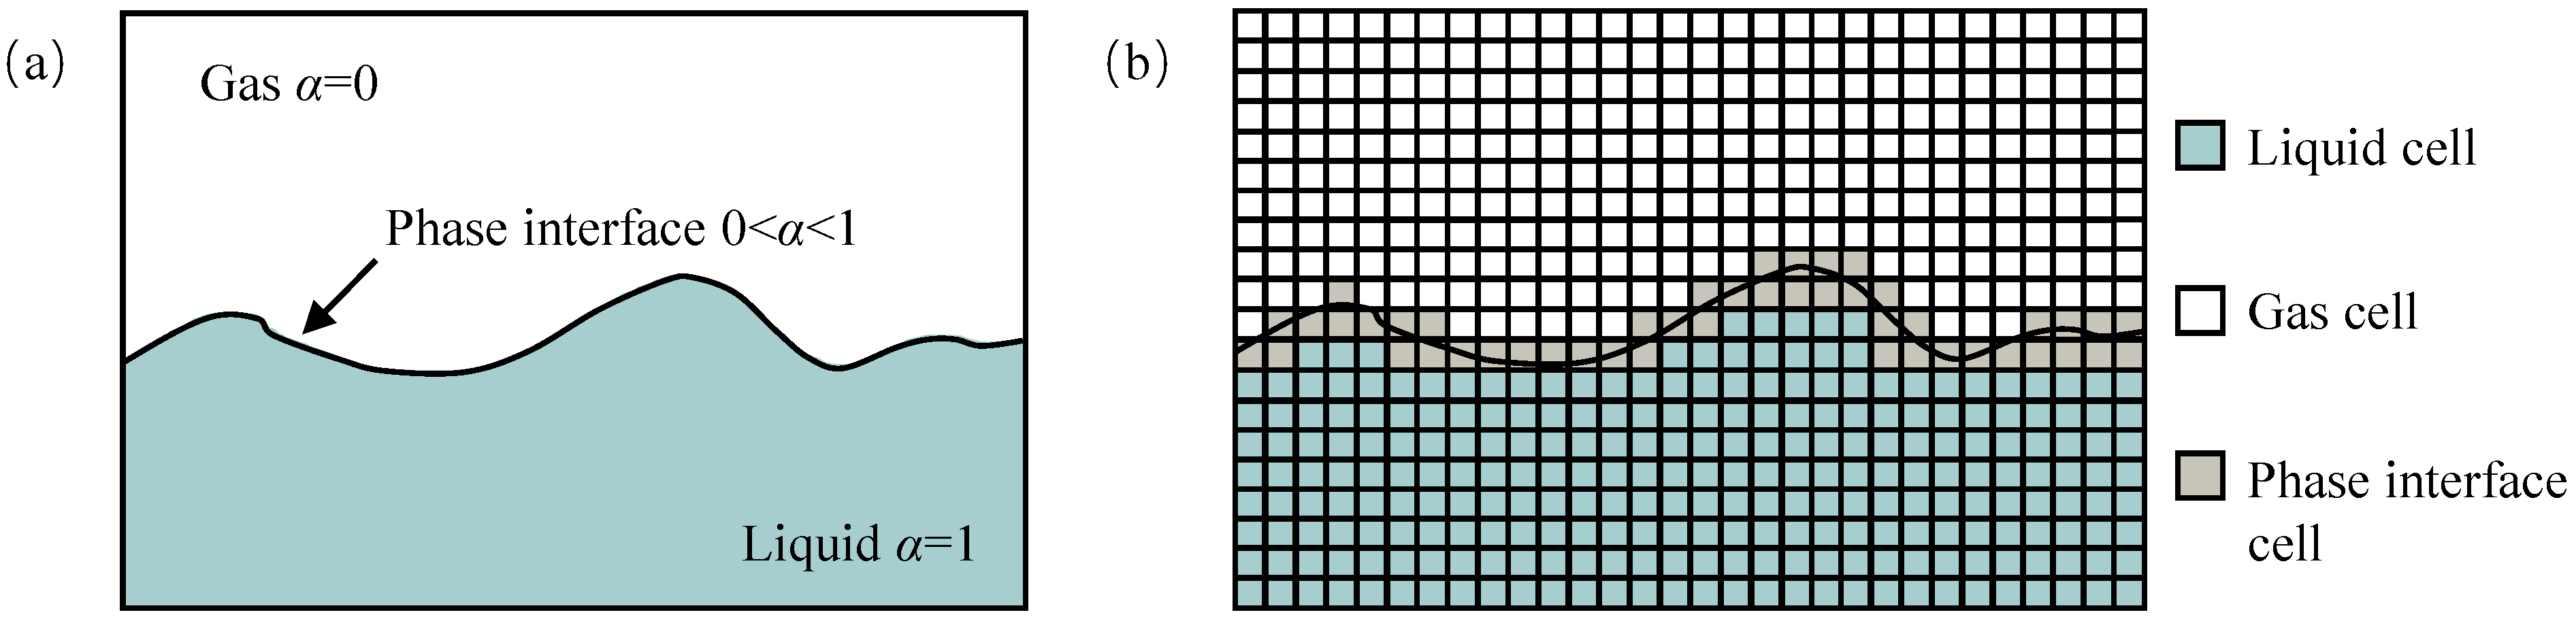
2.1. VOF Model
2.2. Numerical Method
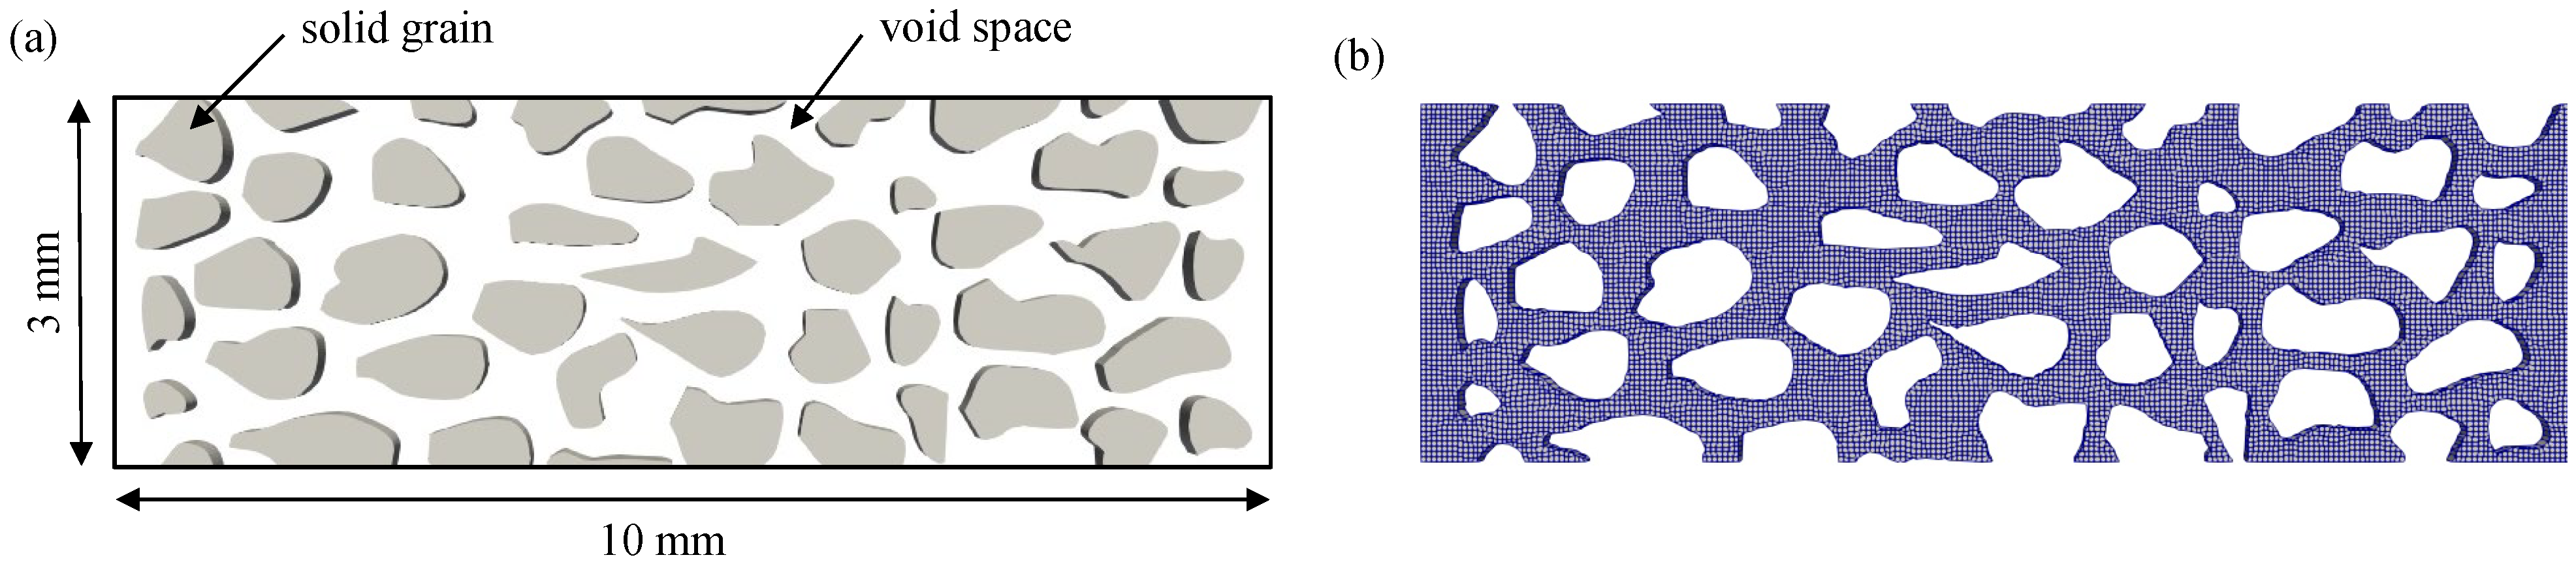
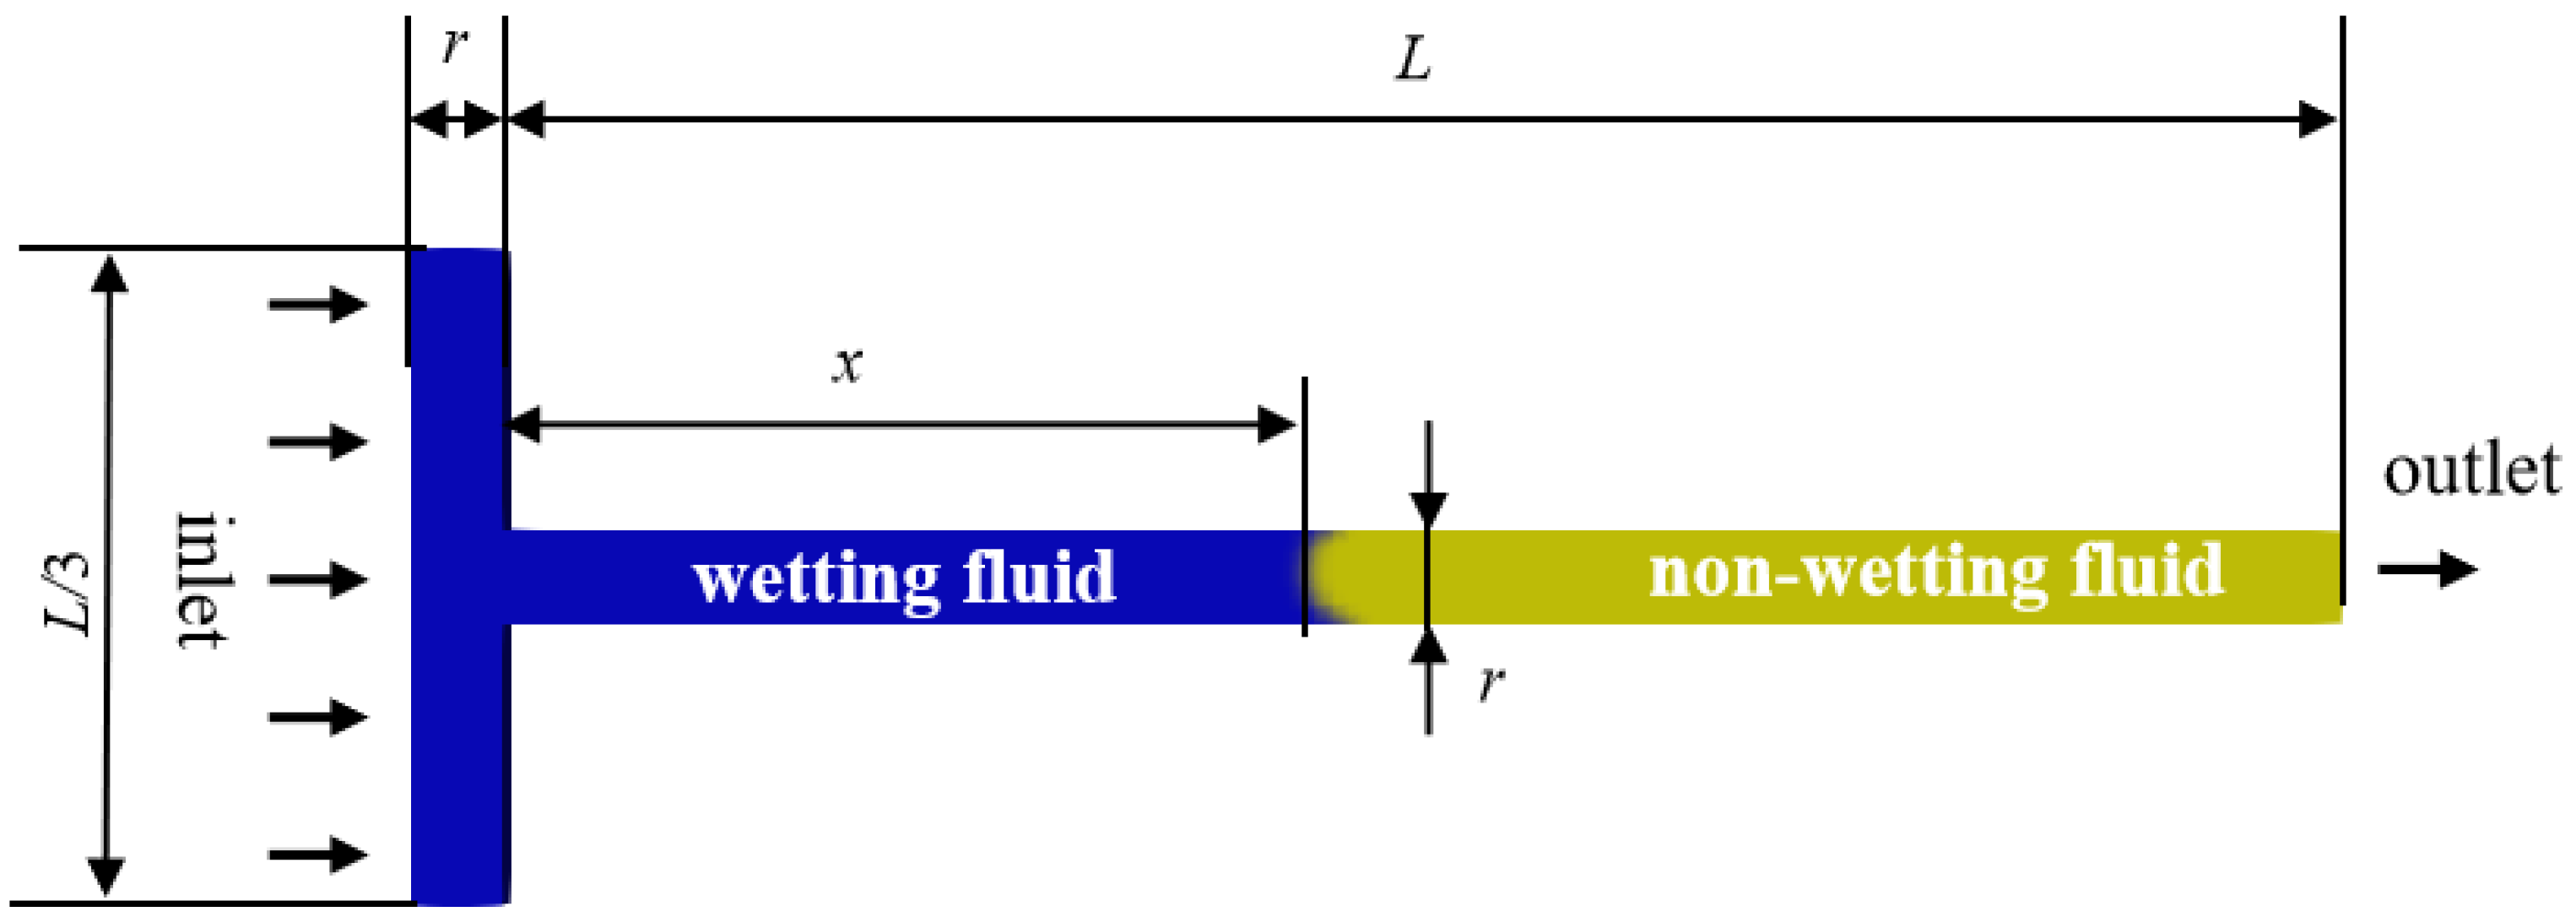
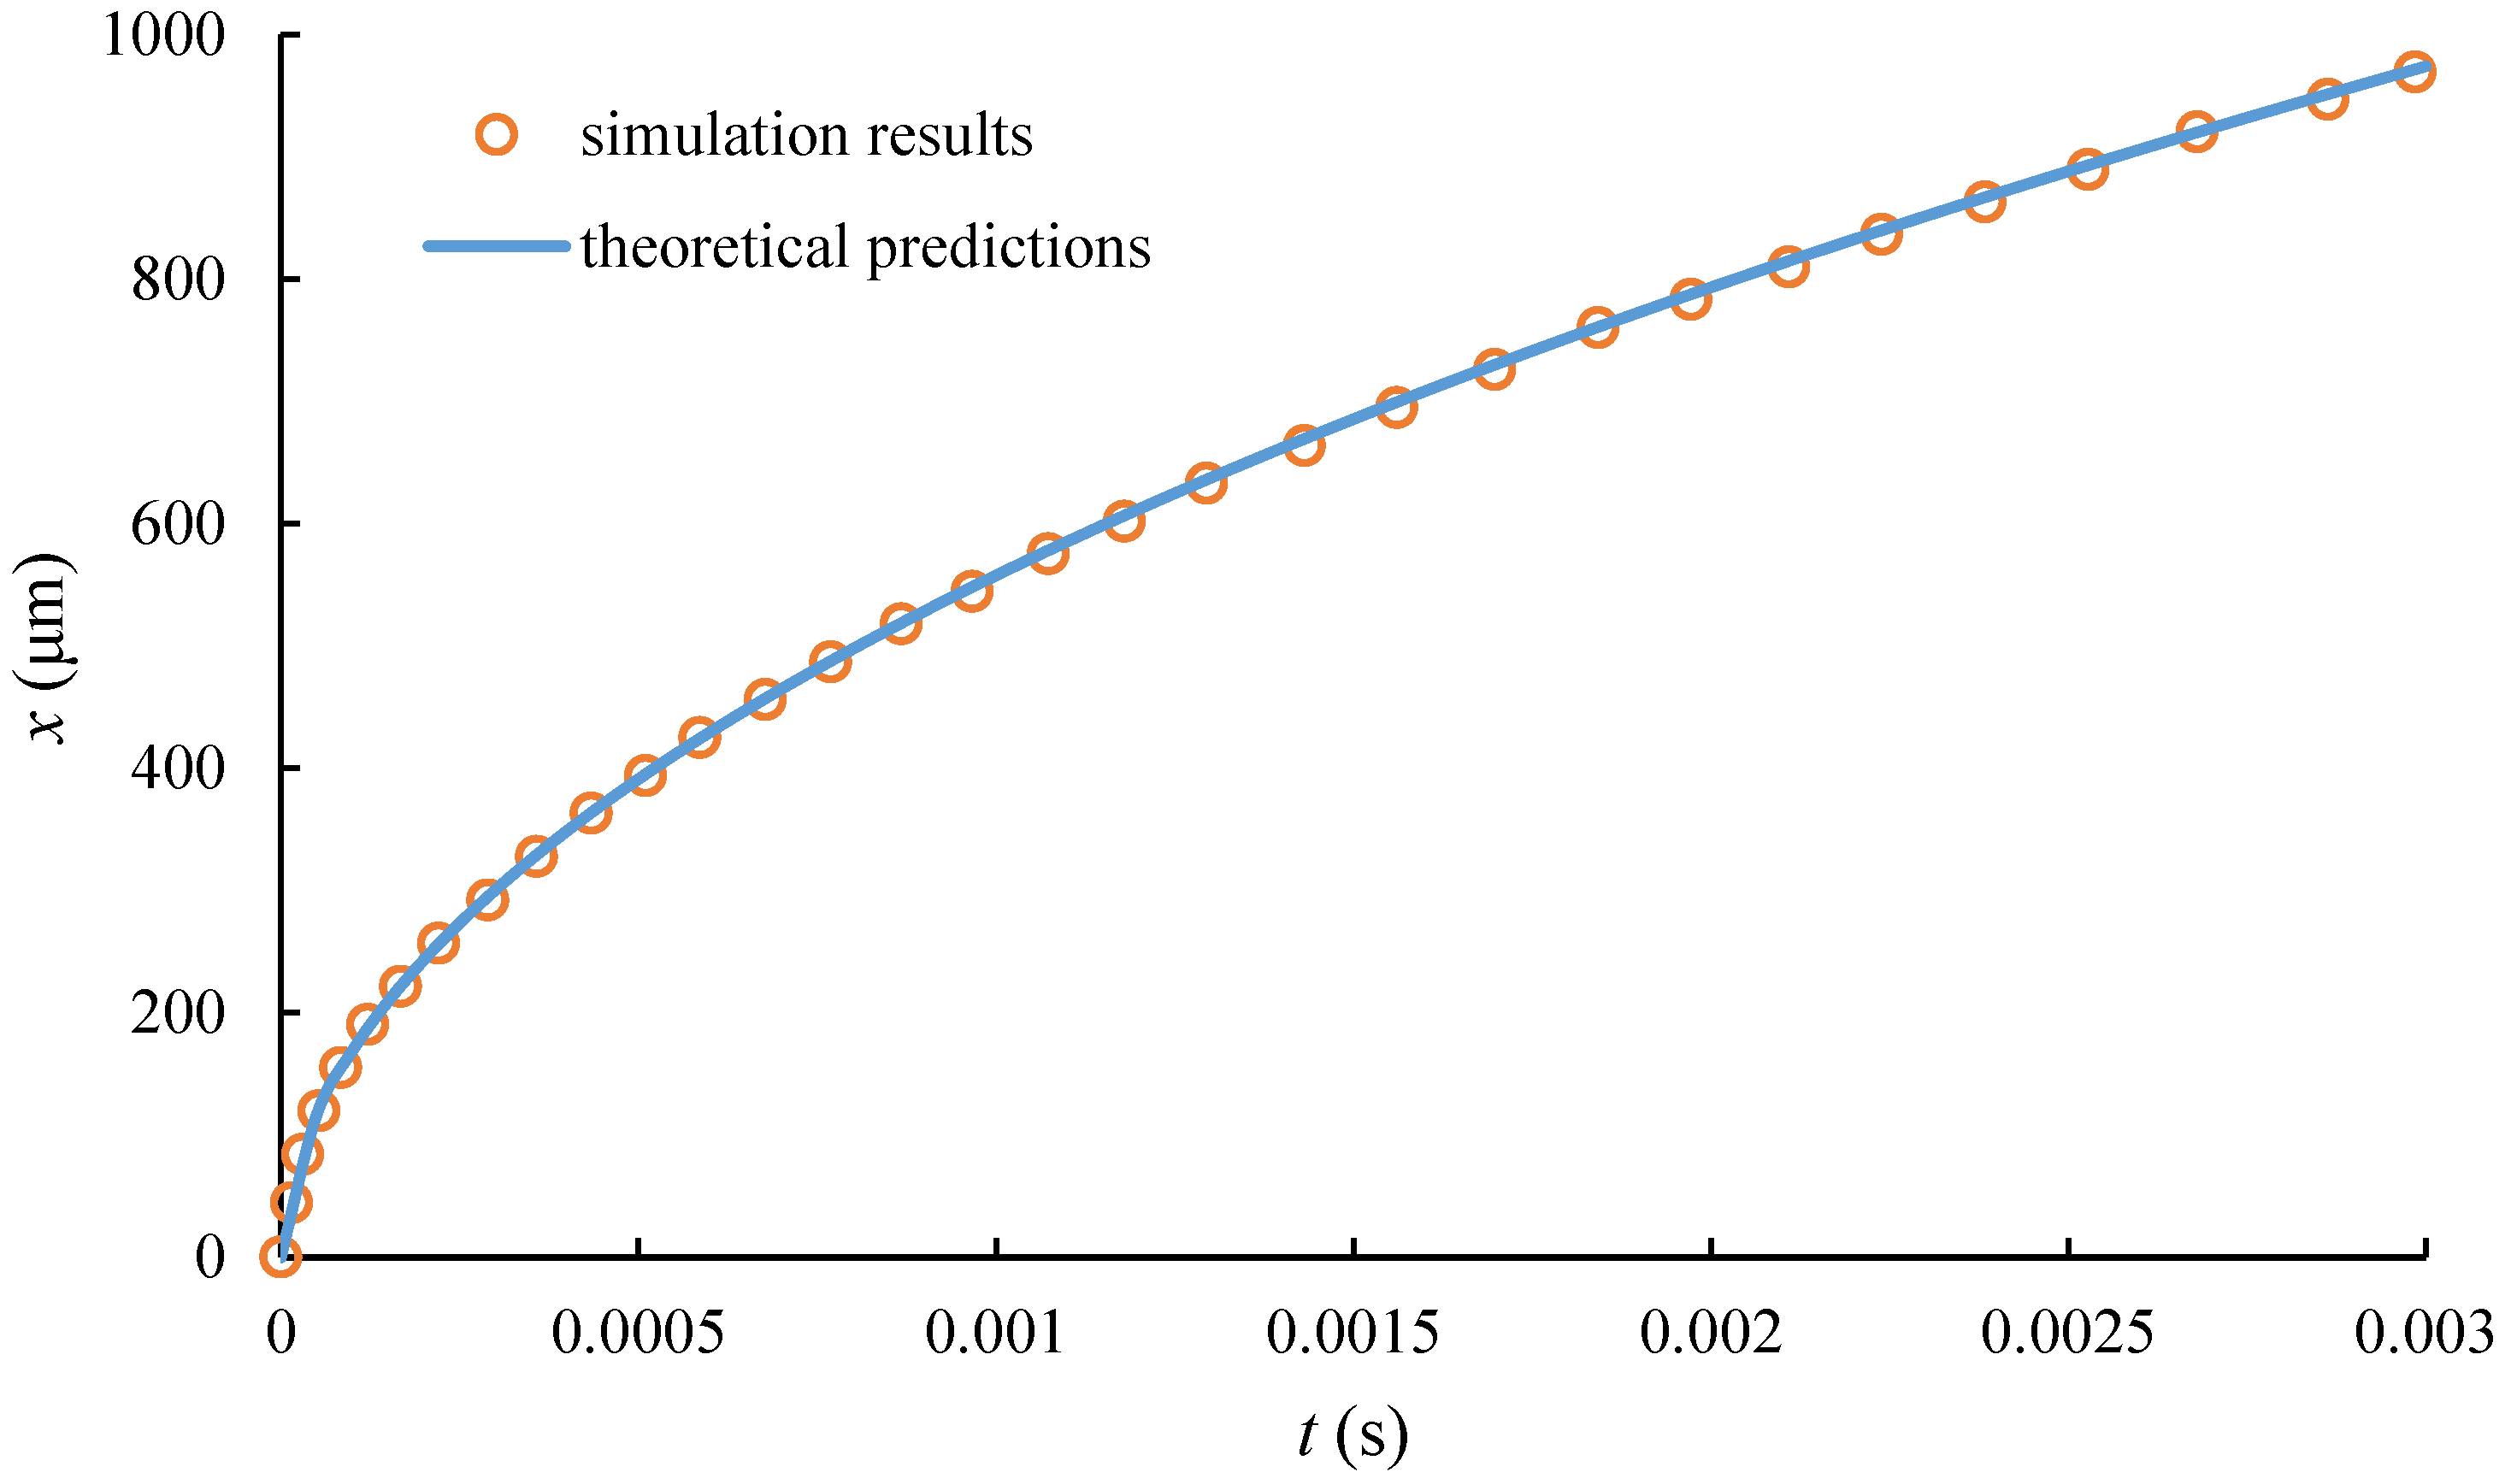
2.3. Model Validation
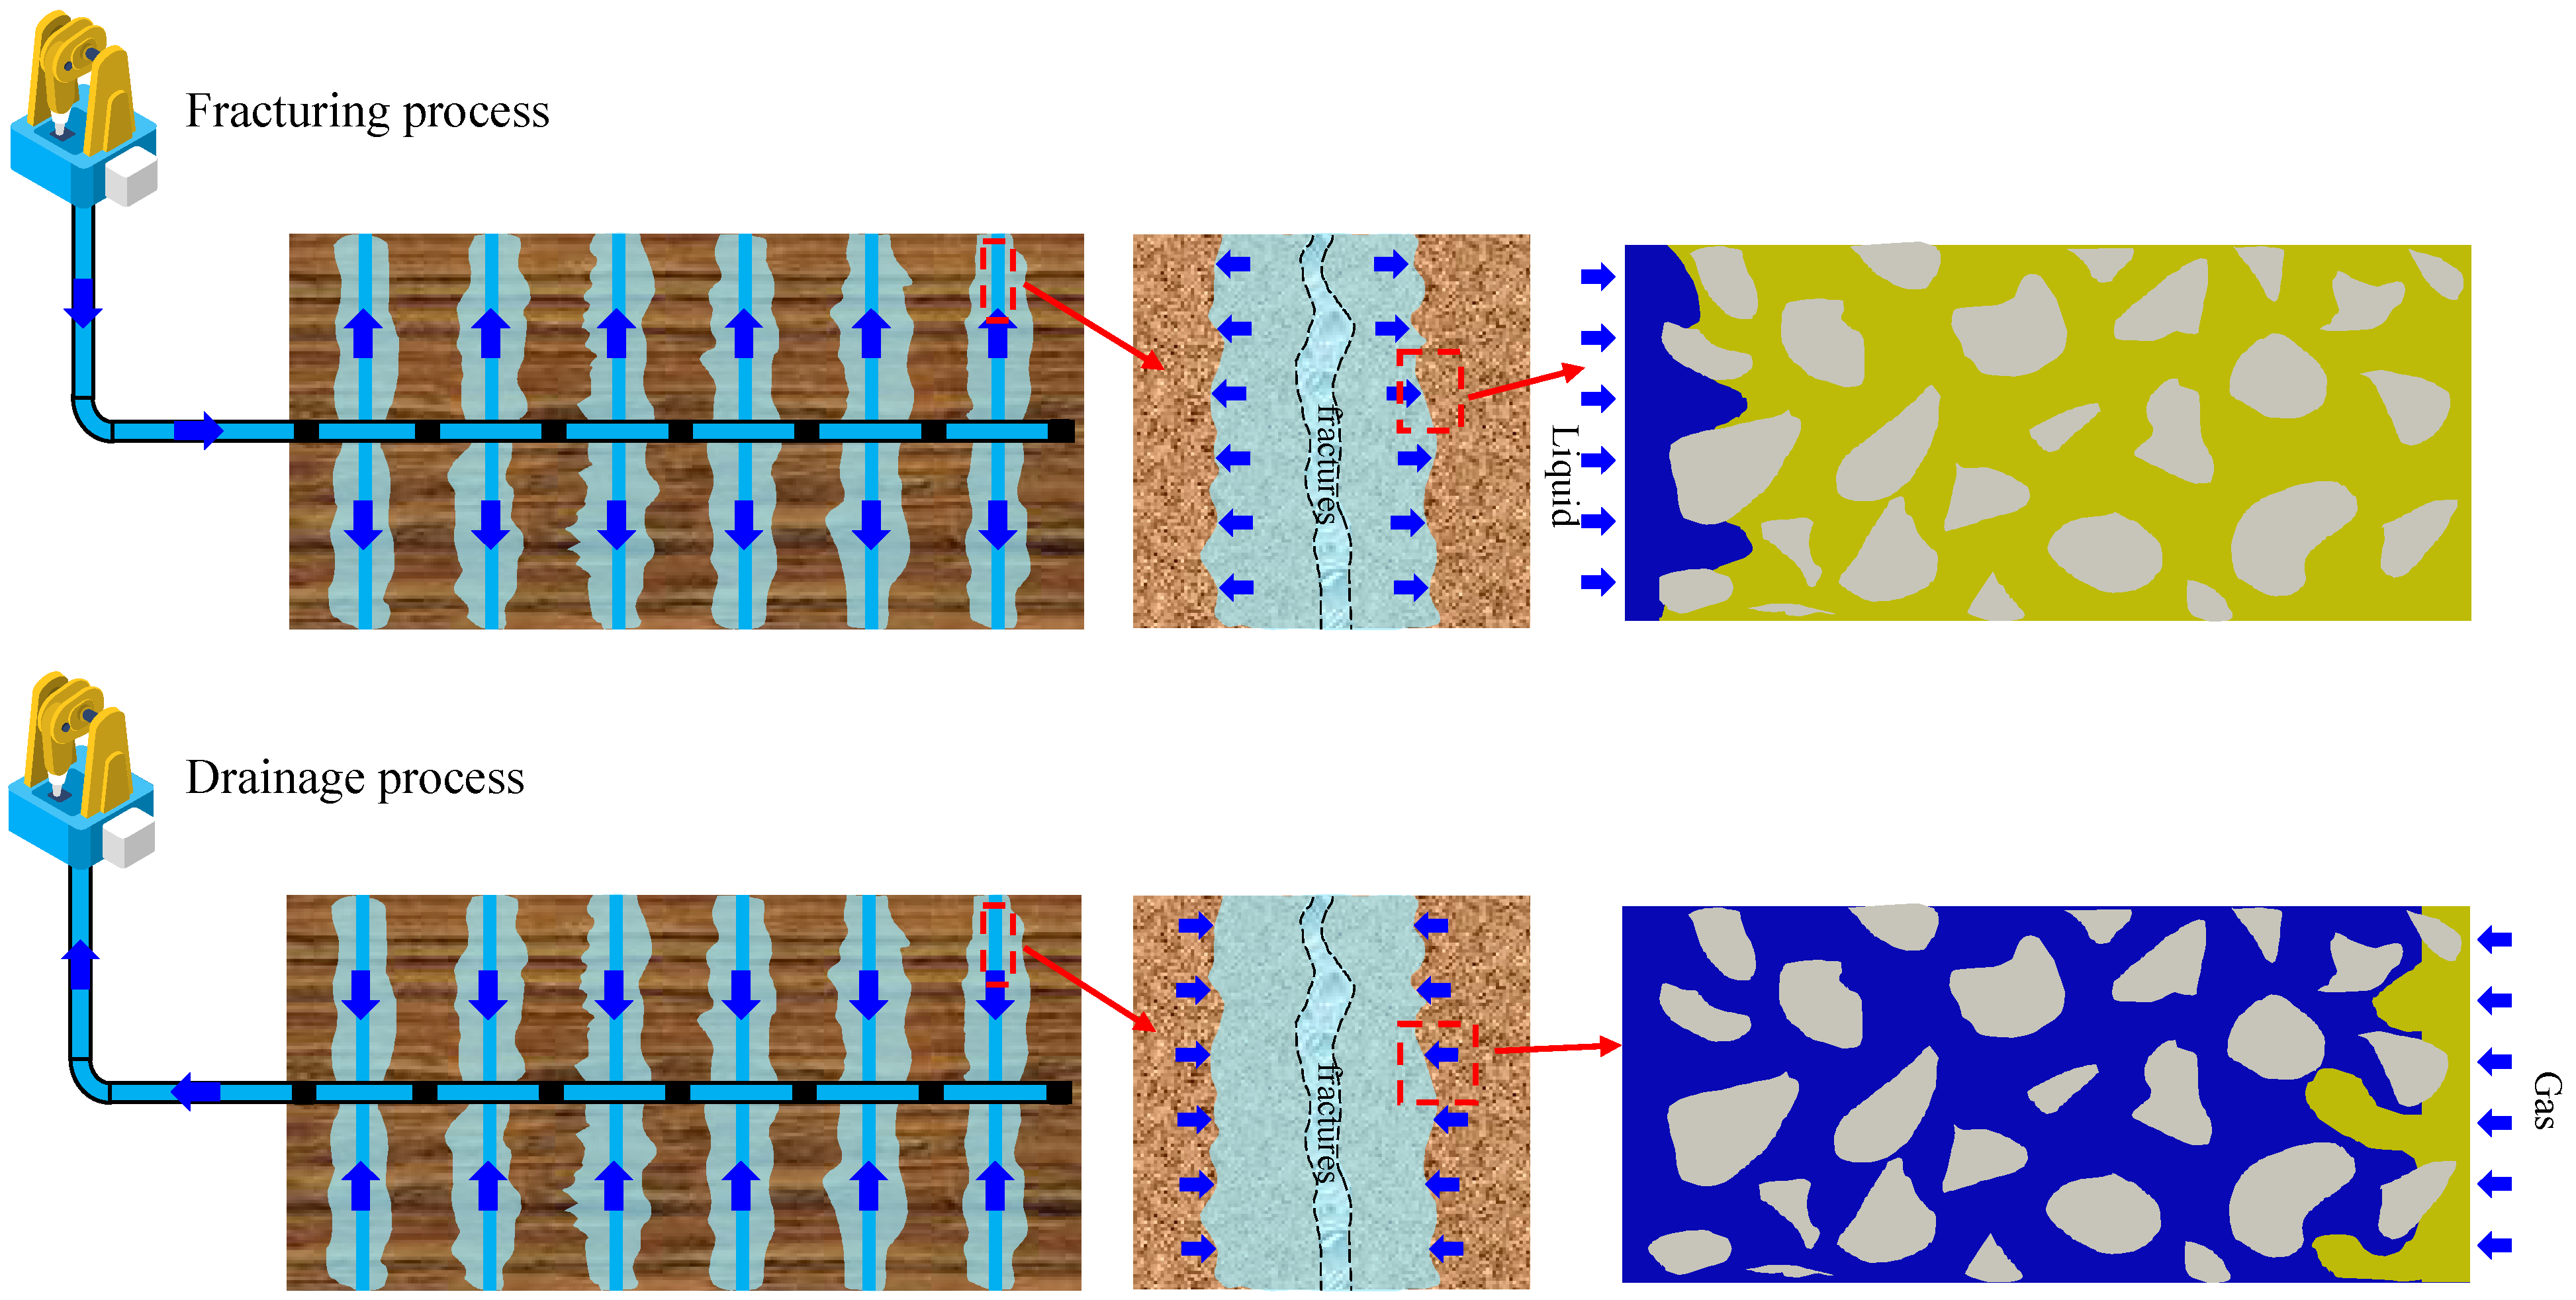
3. Fracturing and Rejection Process
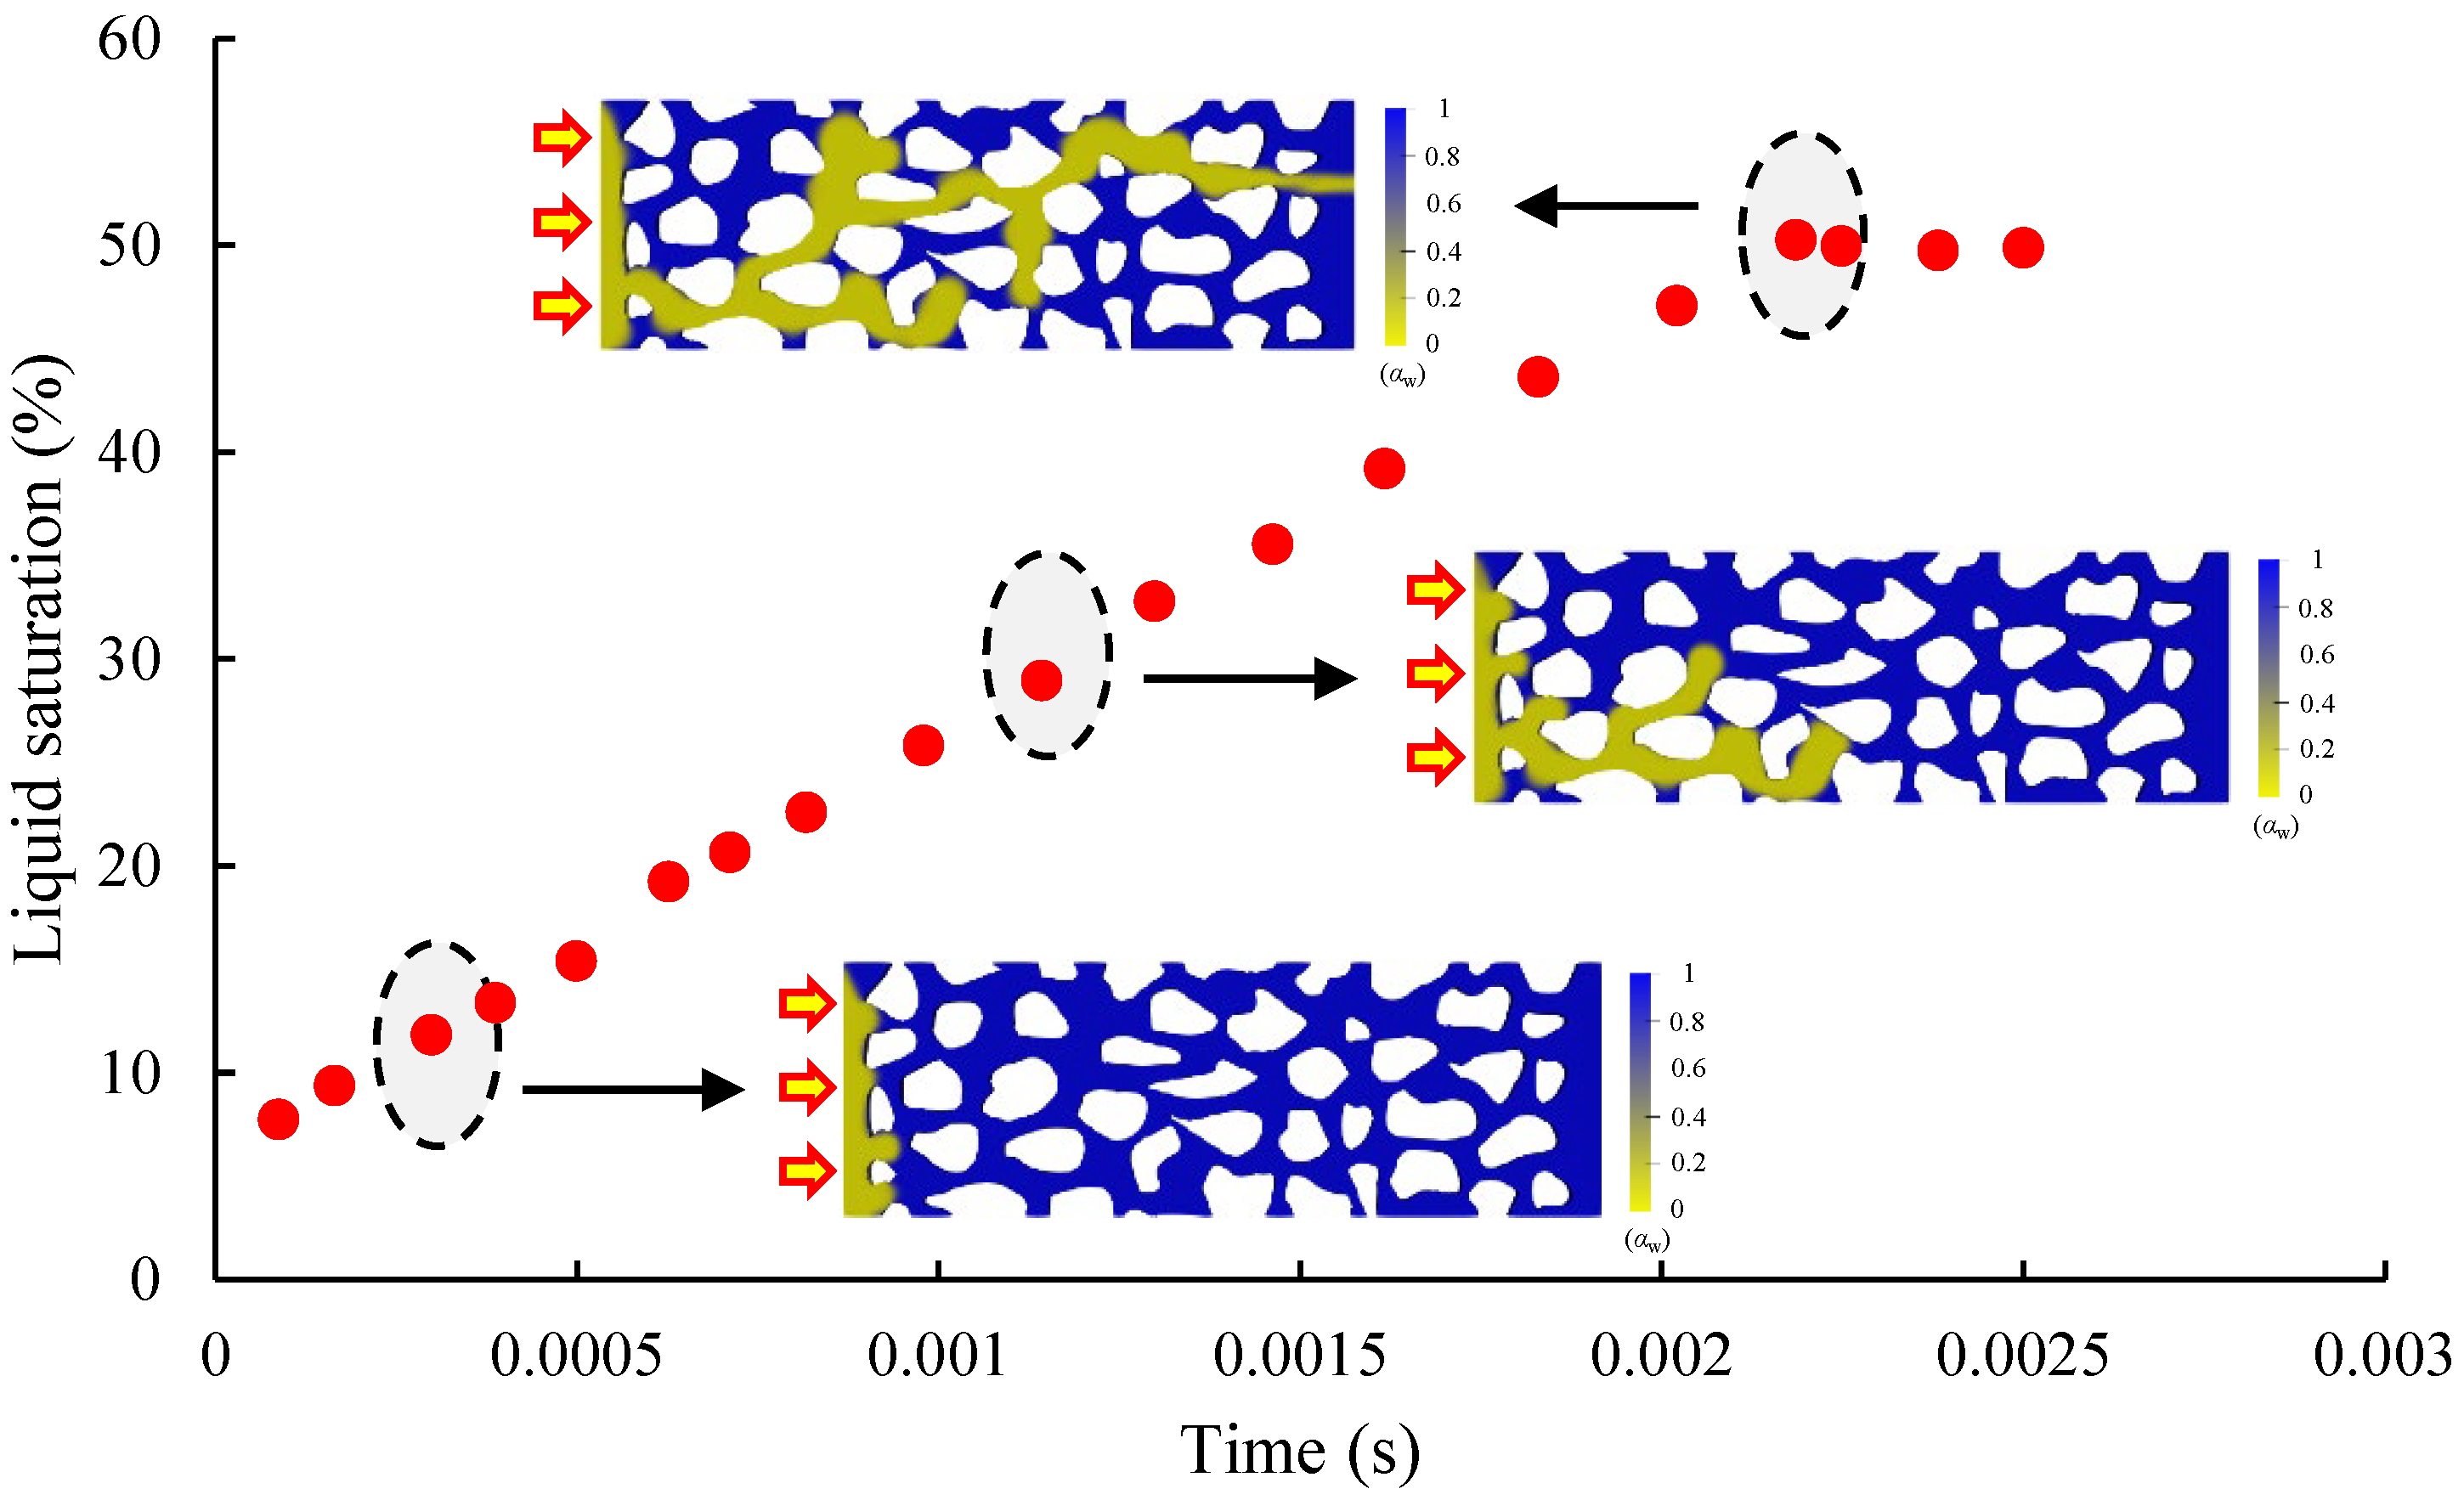
3.1. Fracturing Process Simulation
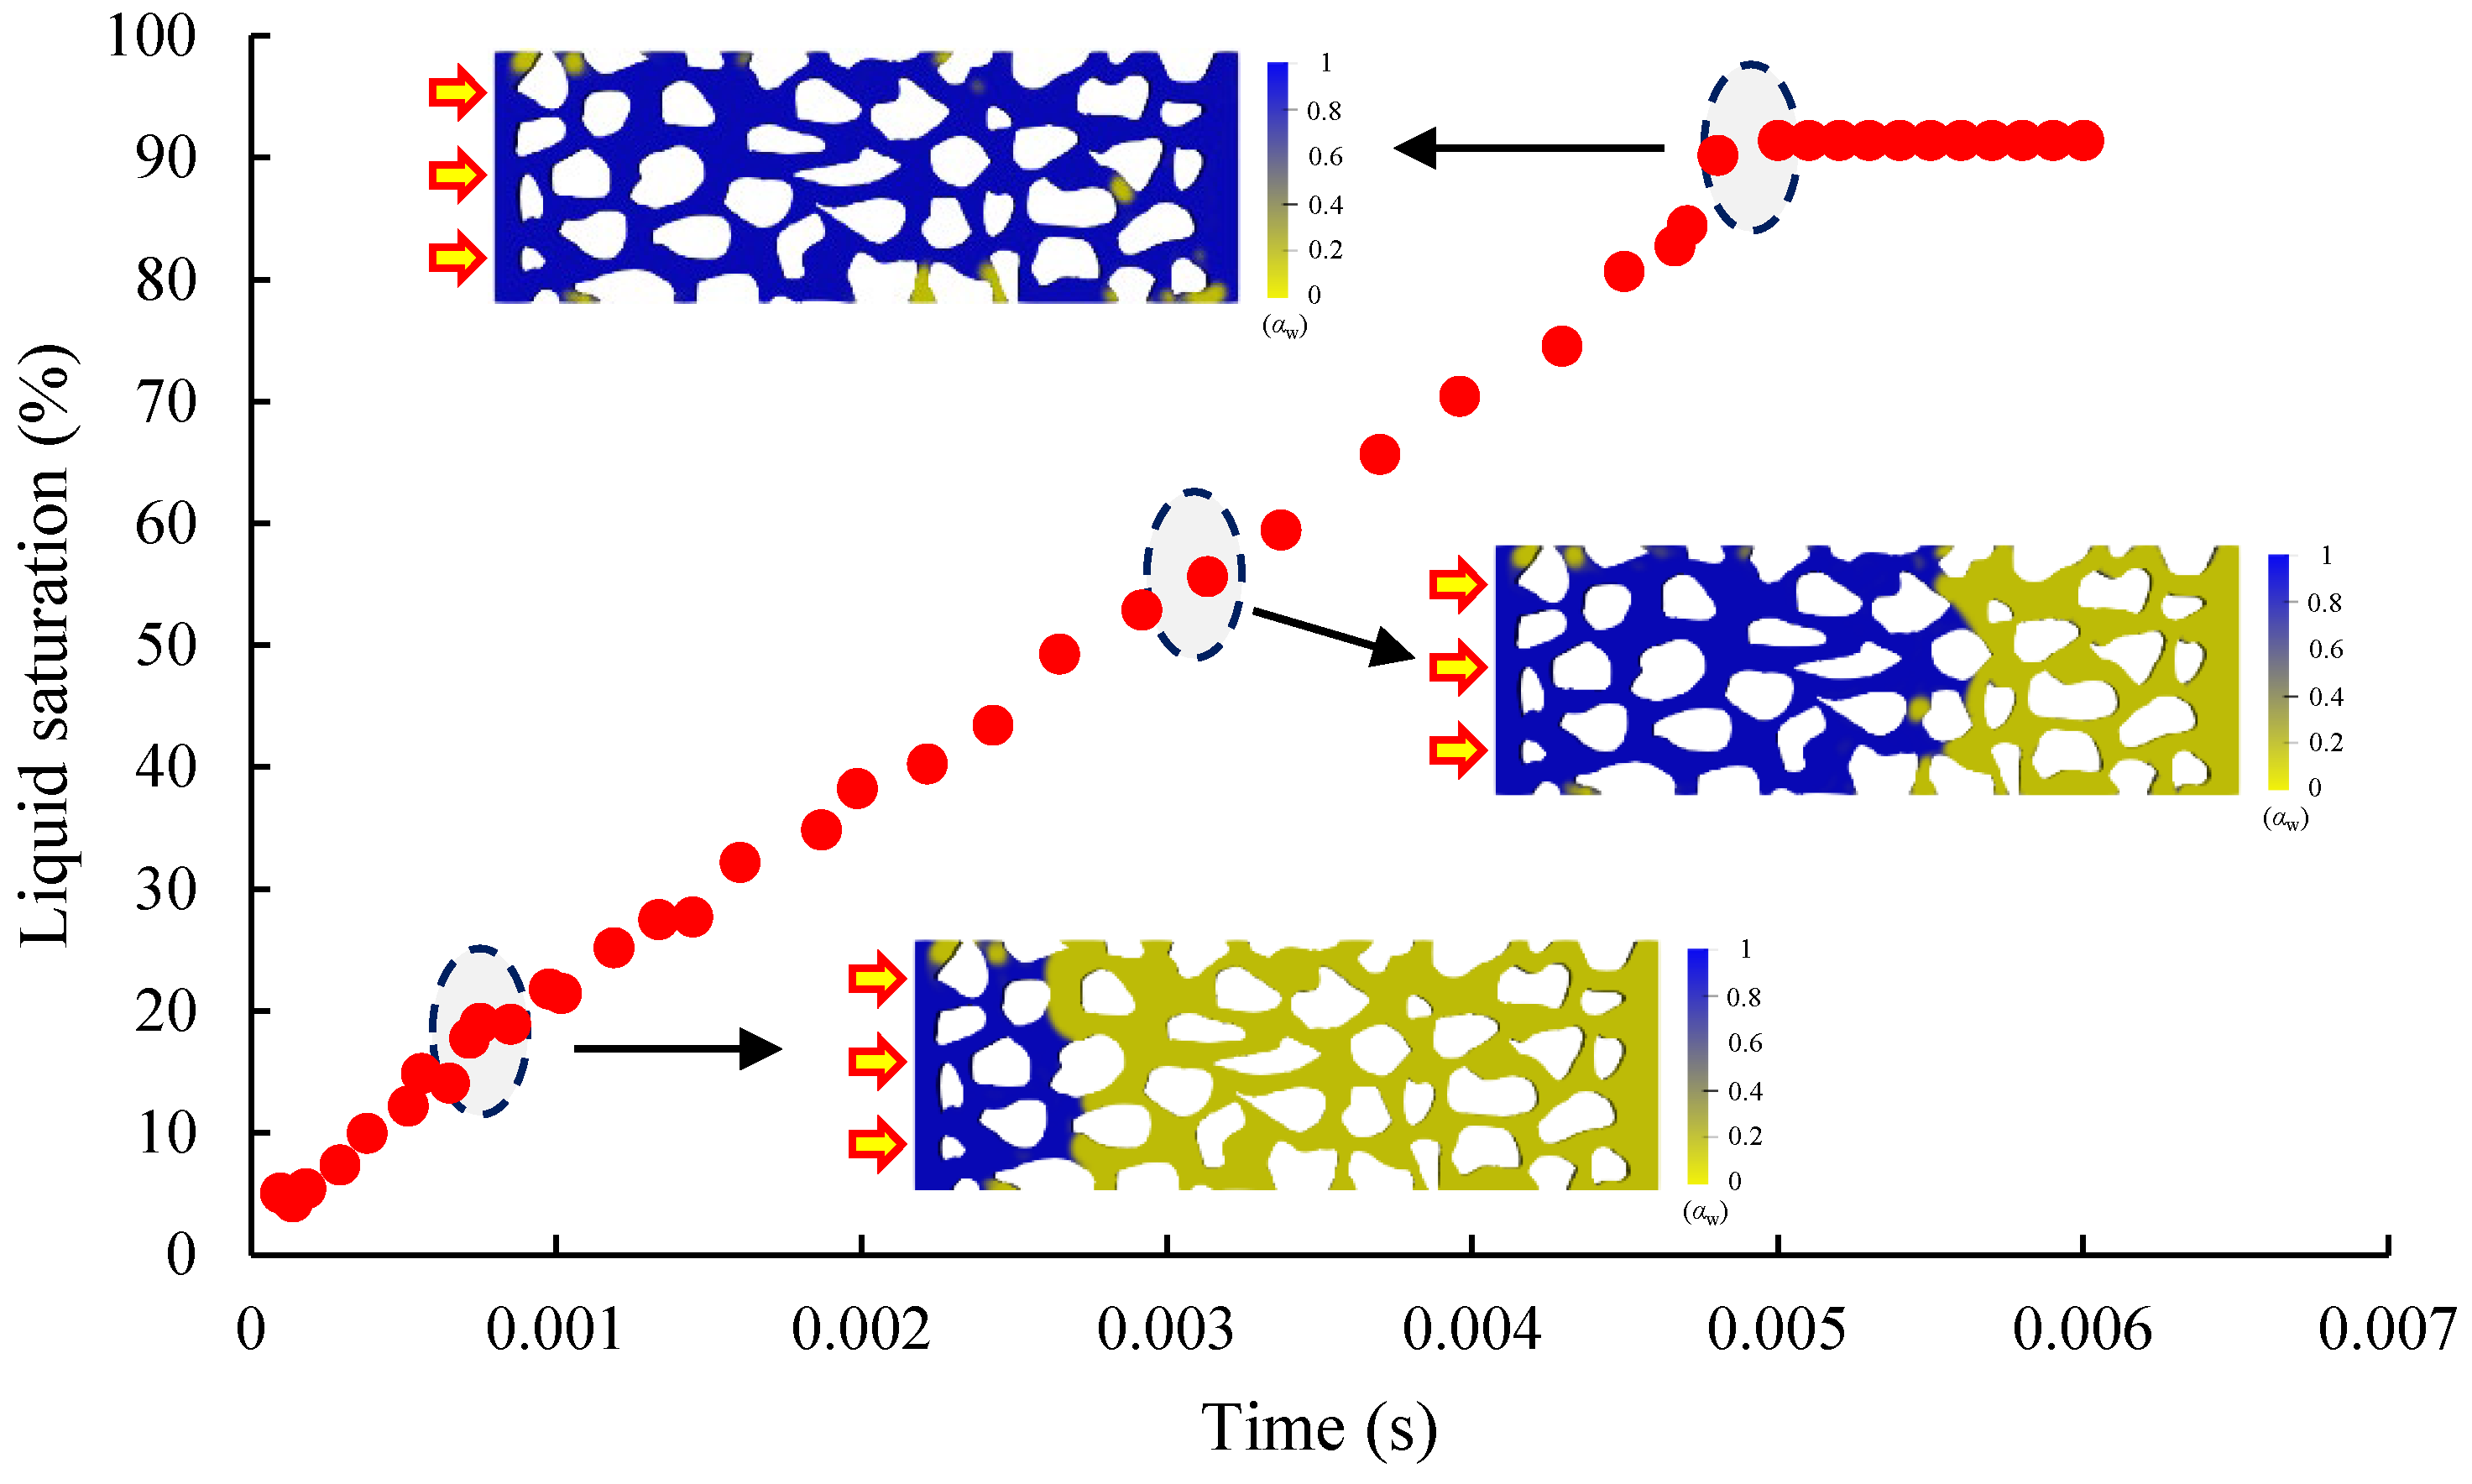
3.2. Simulation of the Return Process
4. Gas–Liquid Two-Phase Flow Characteristics
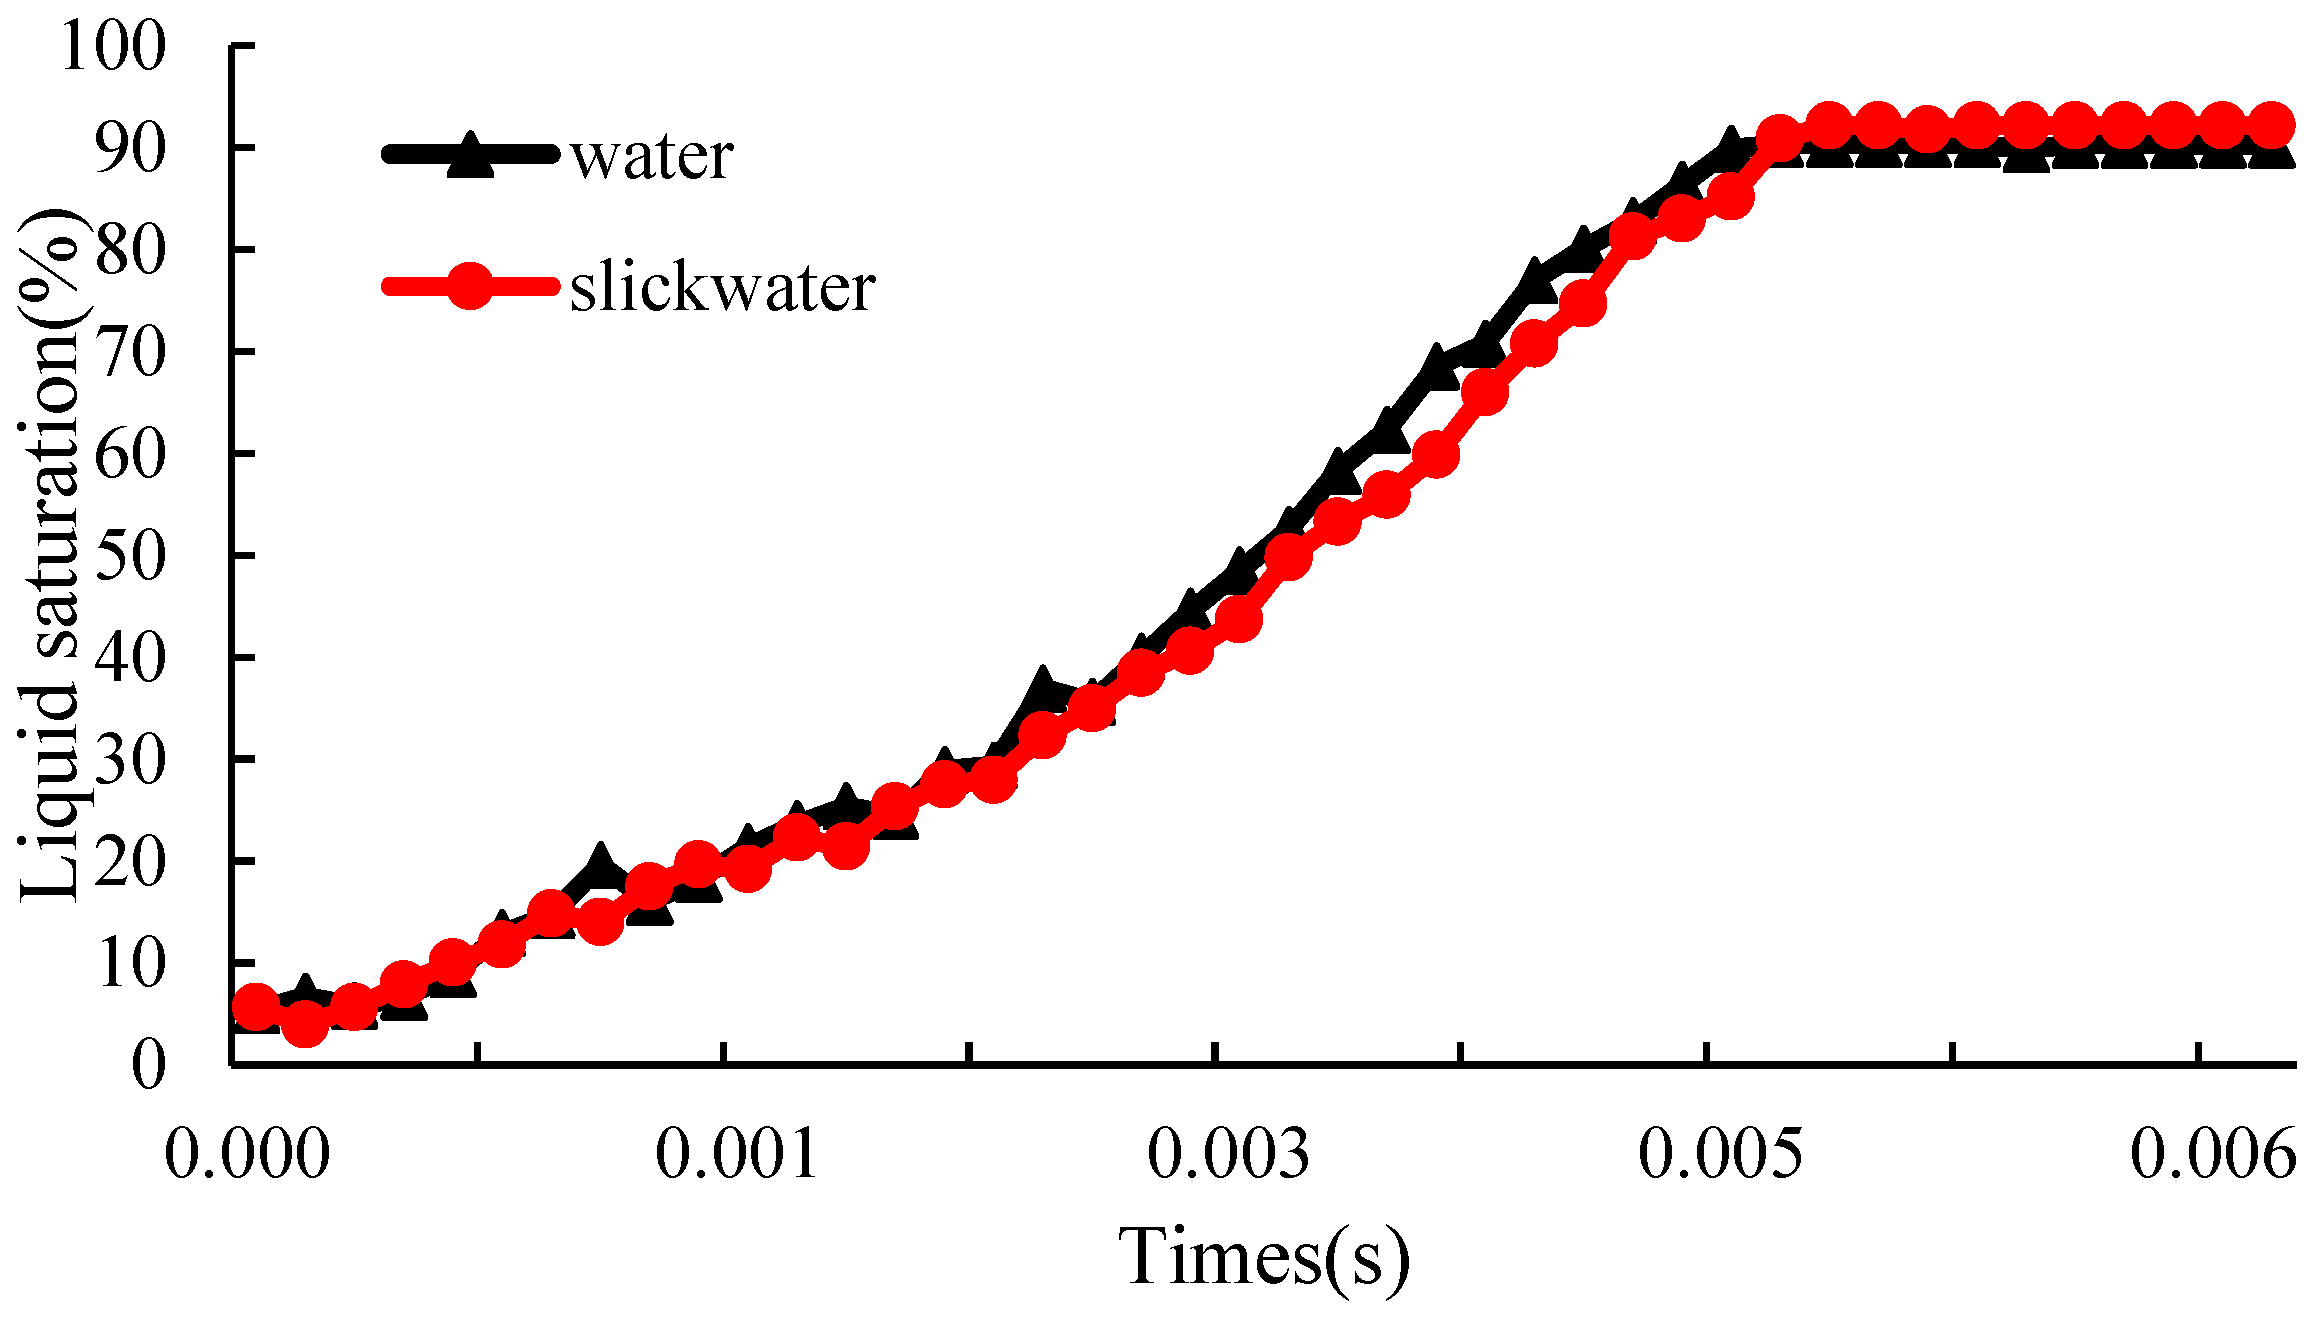
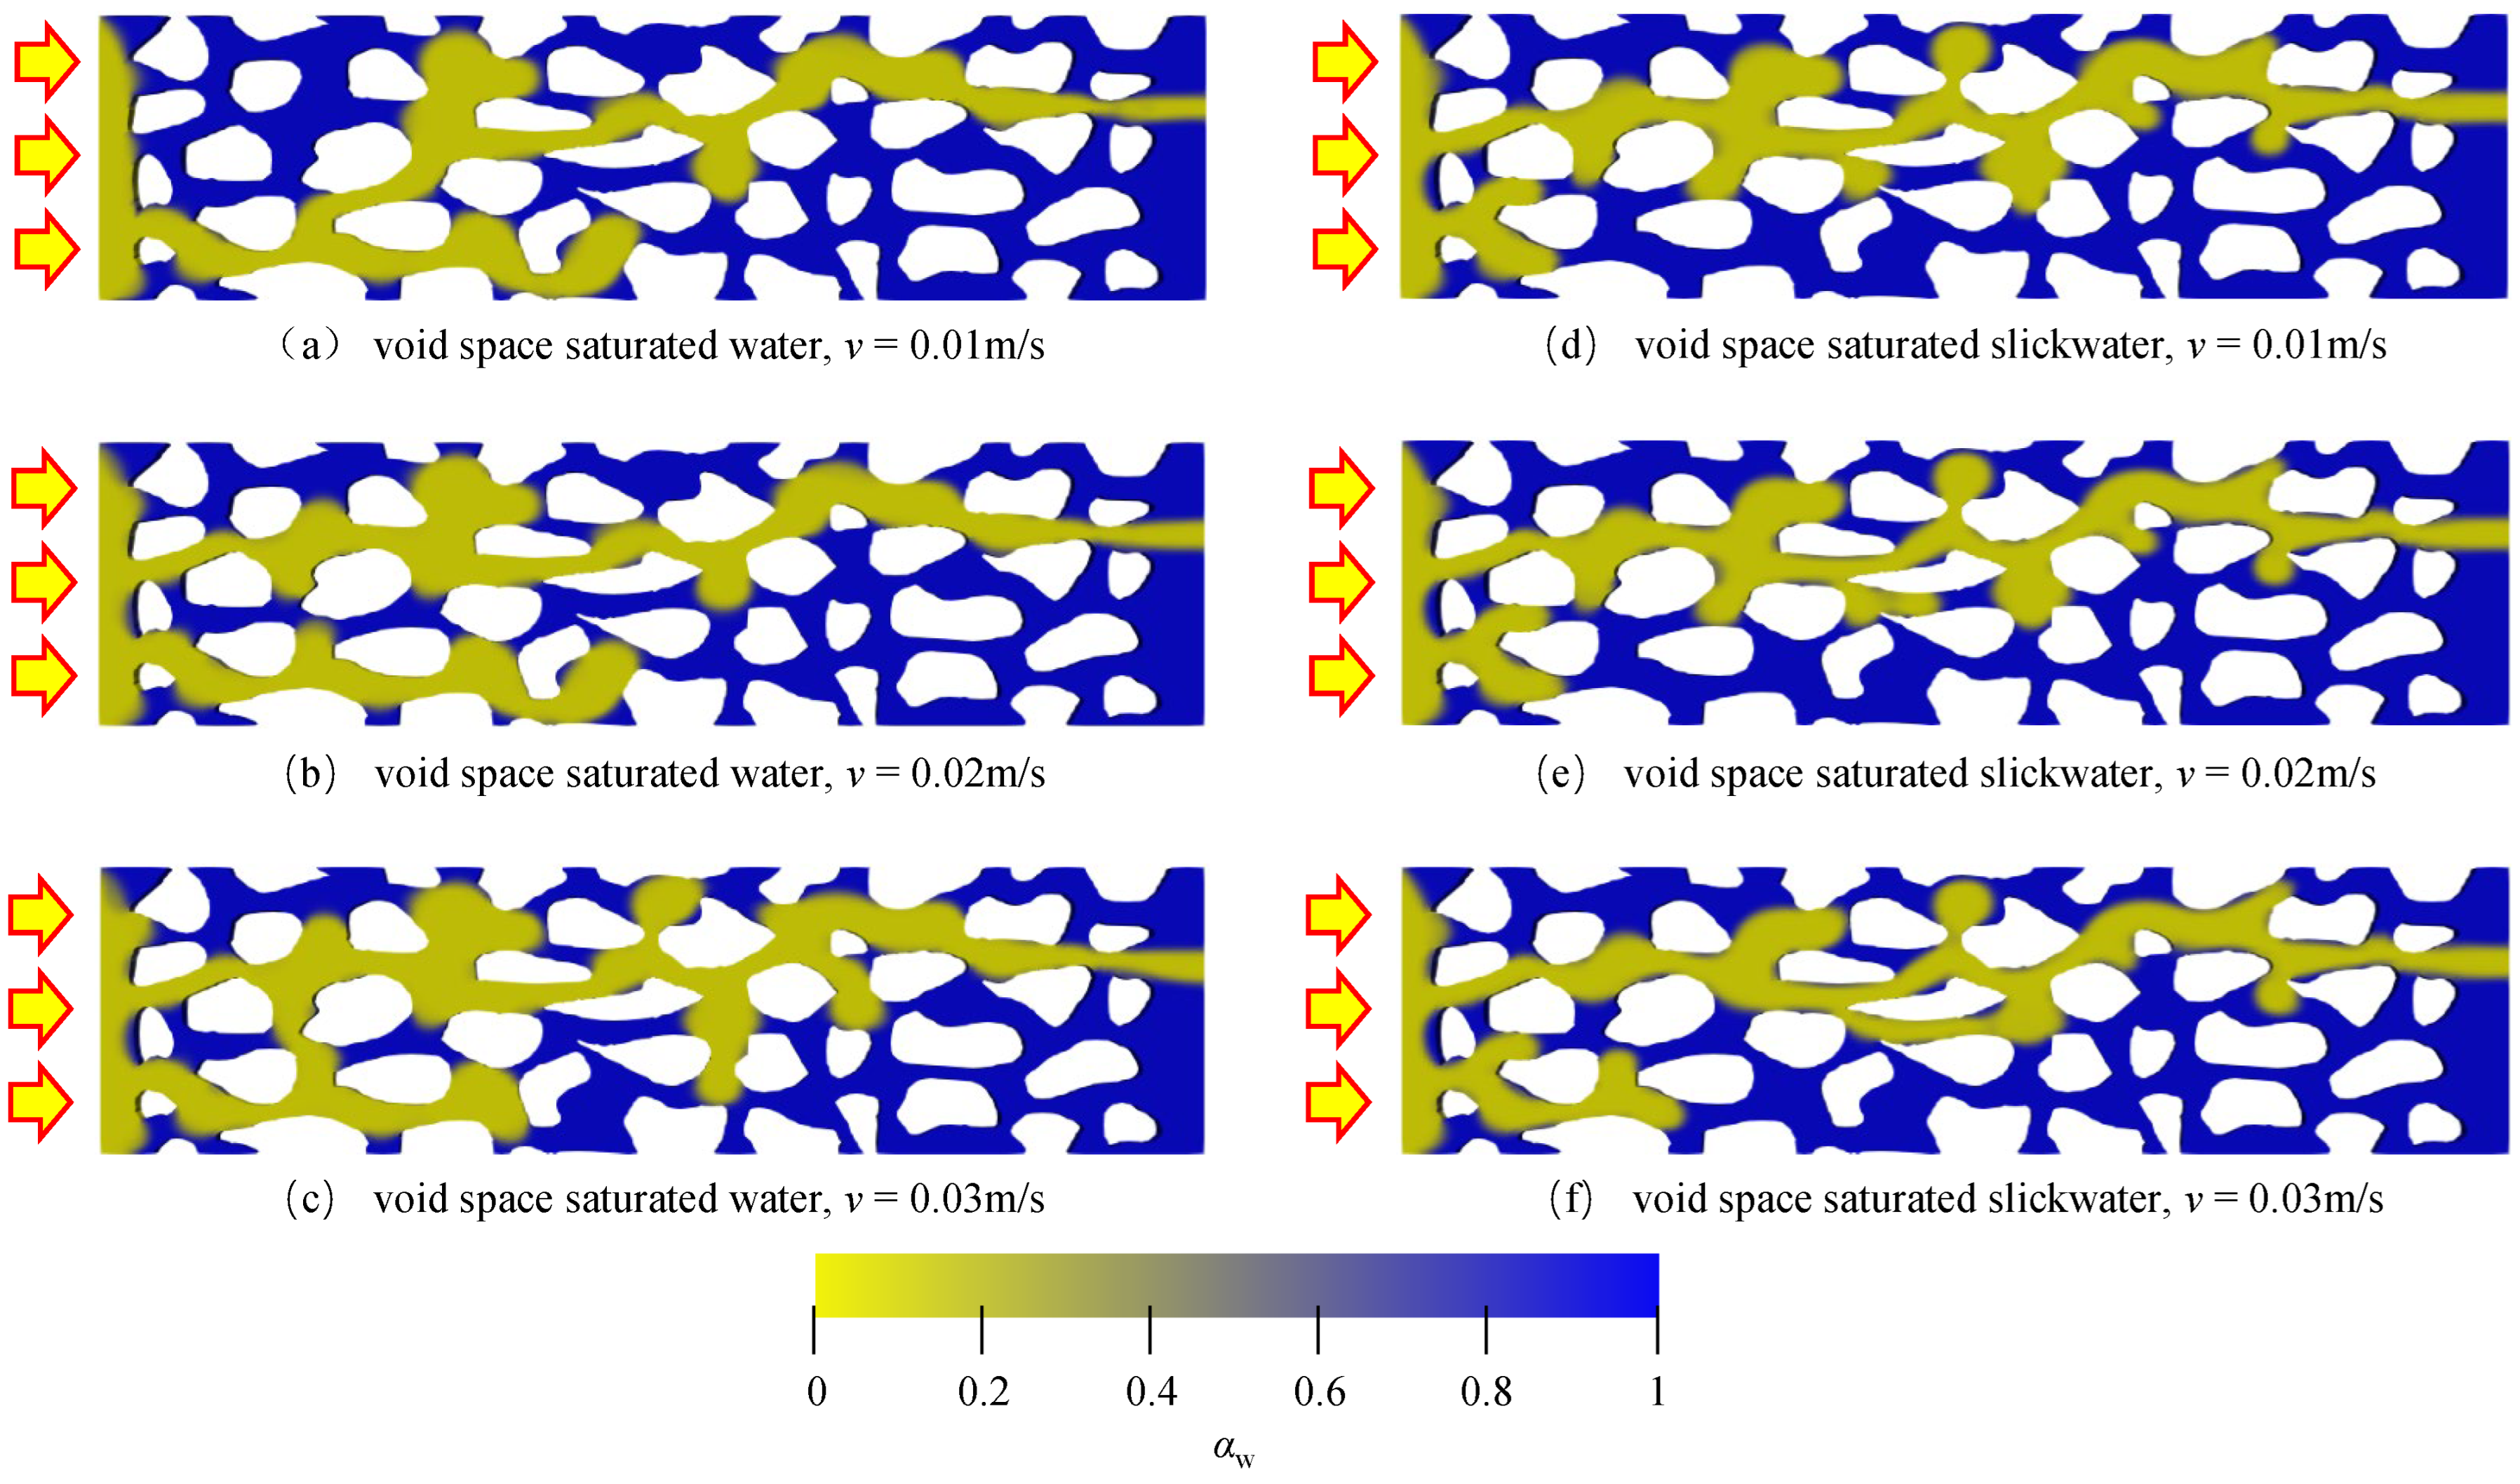
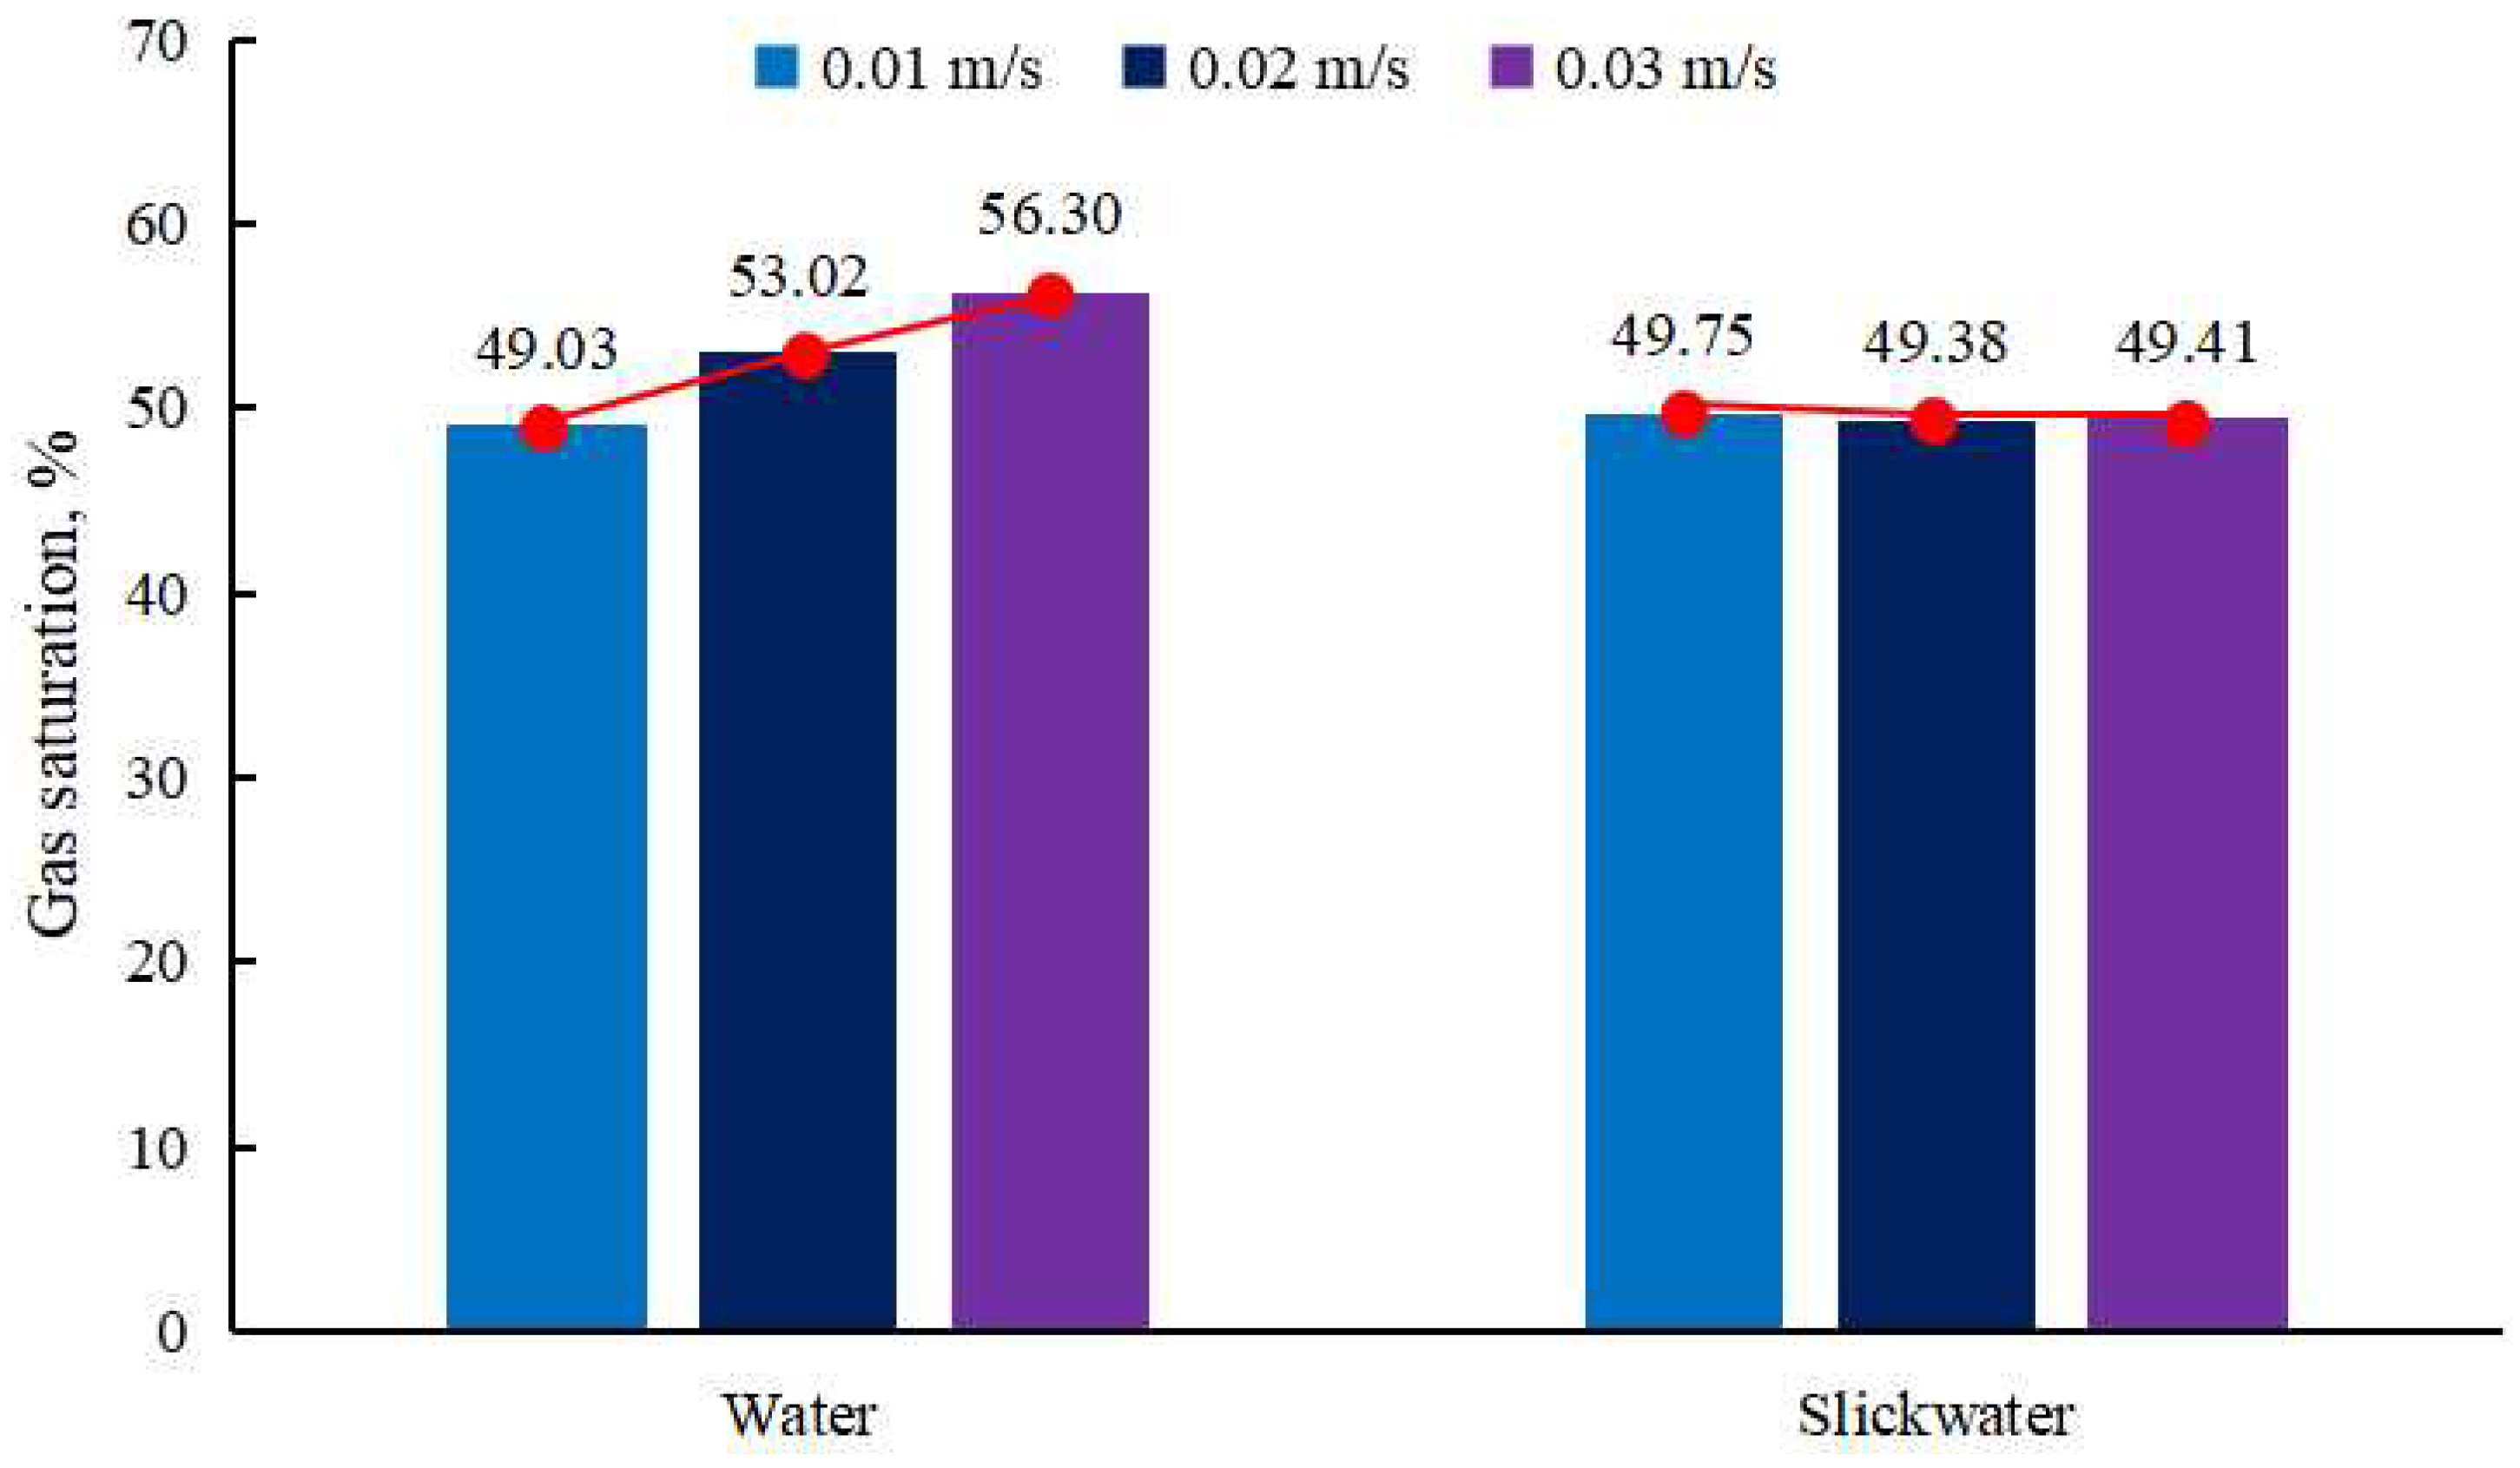
4.1. Flow Rate
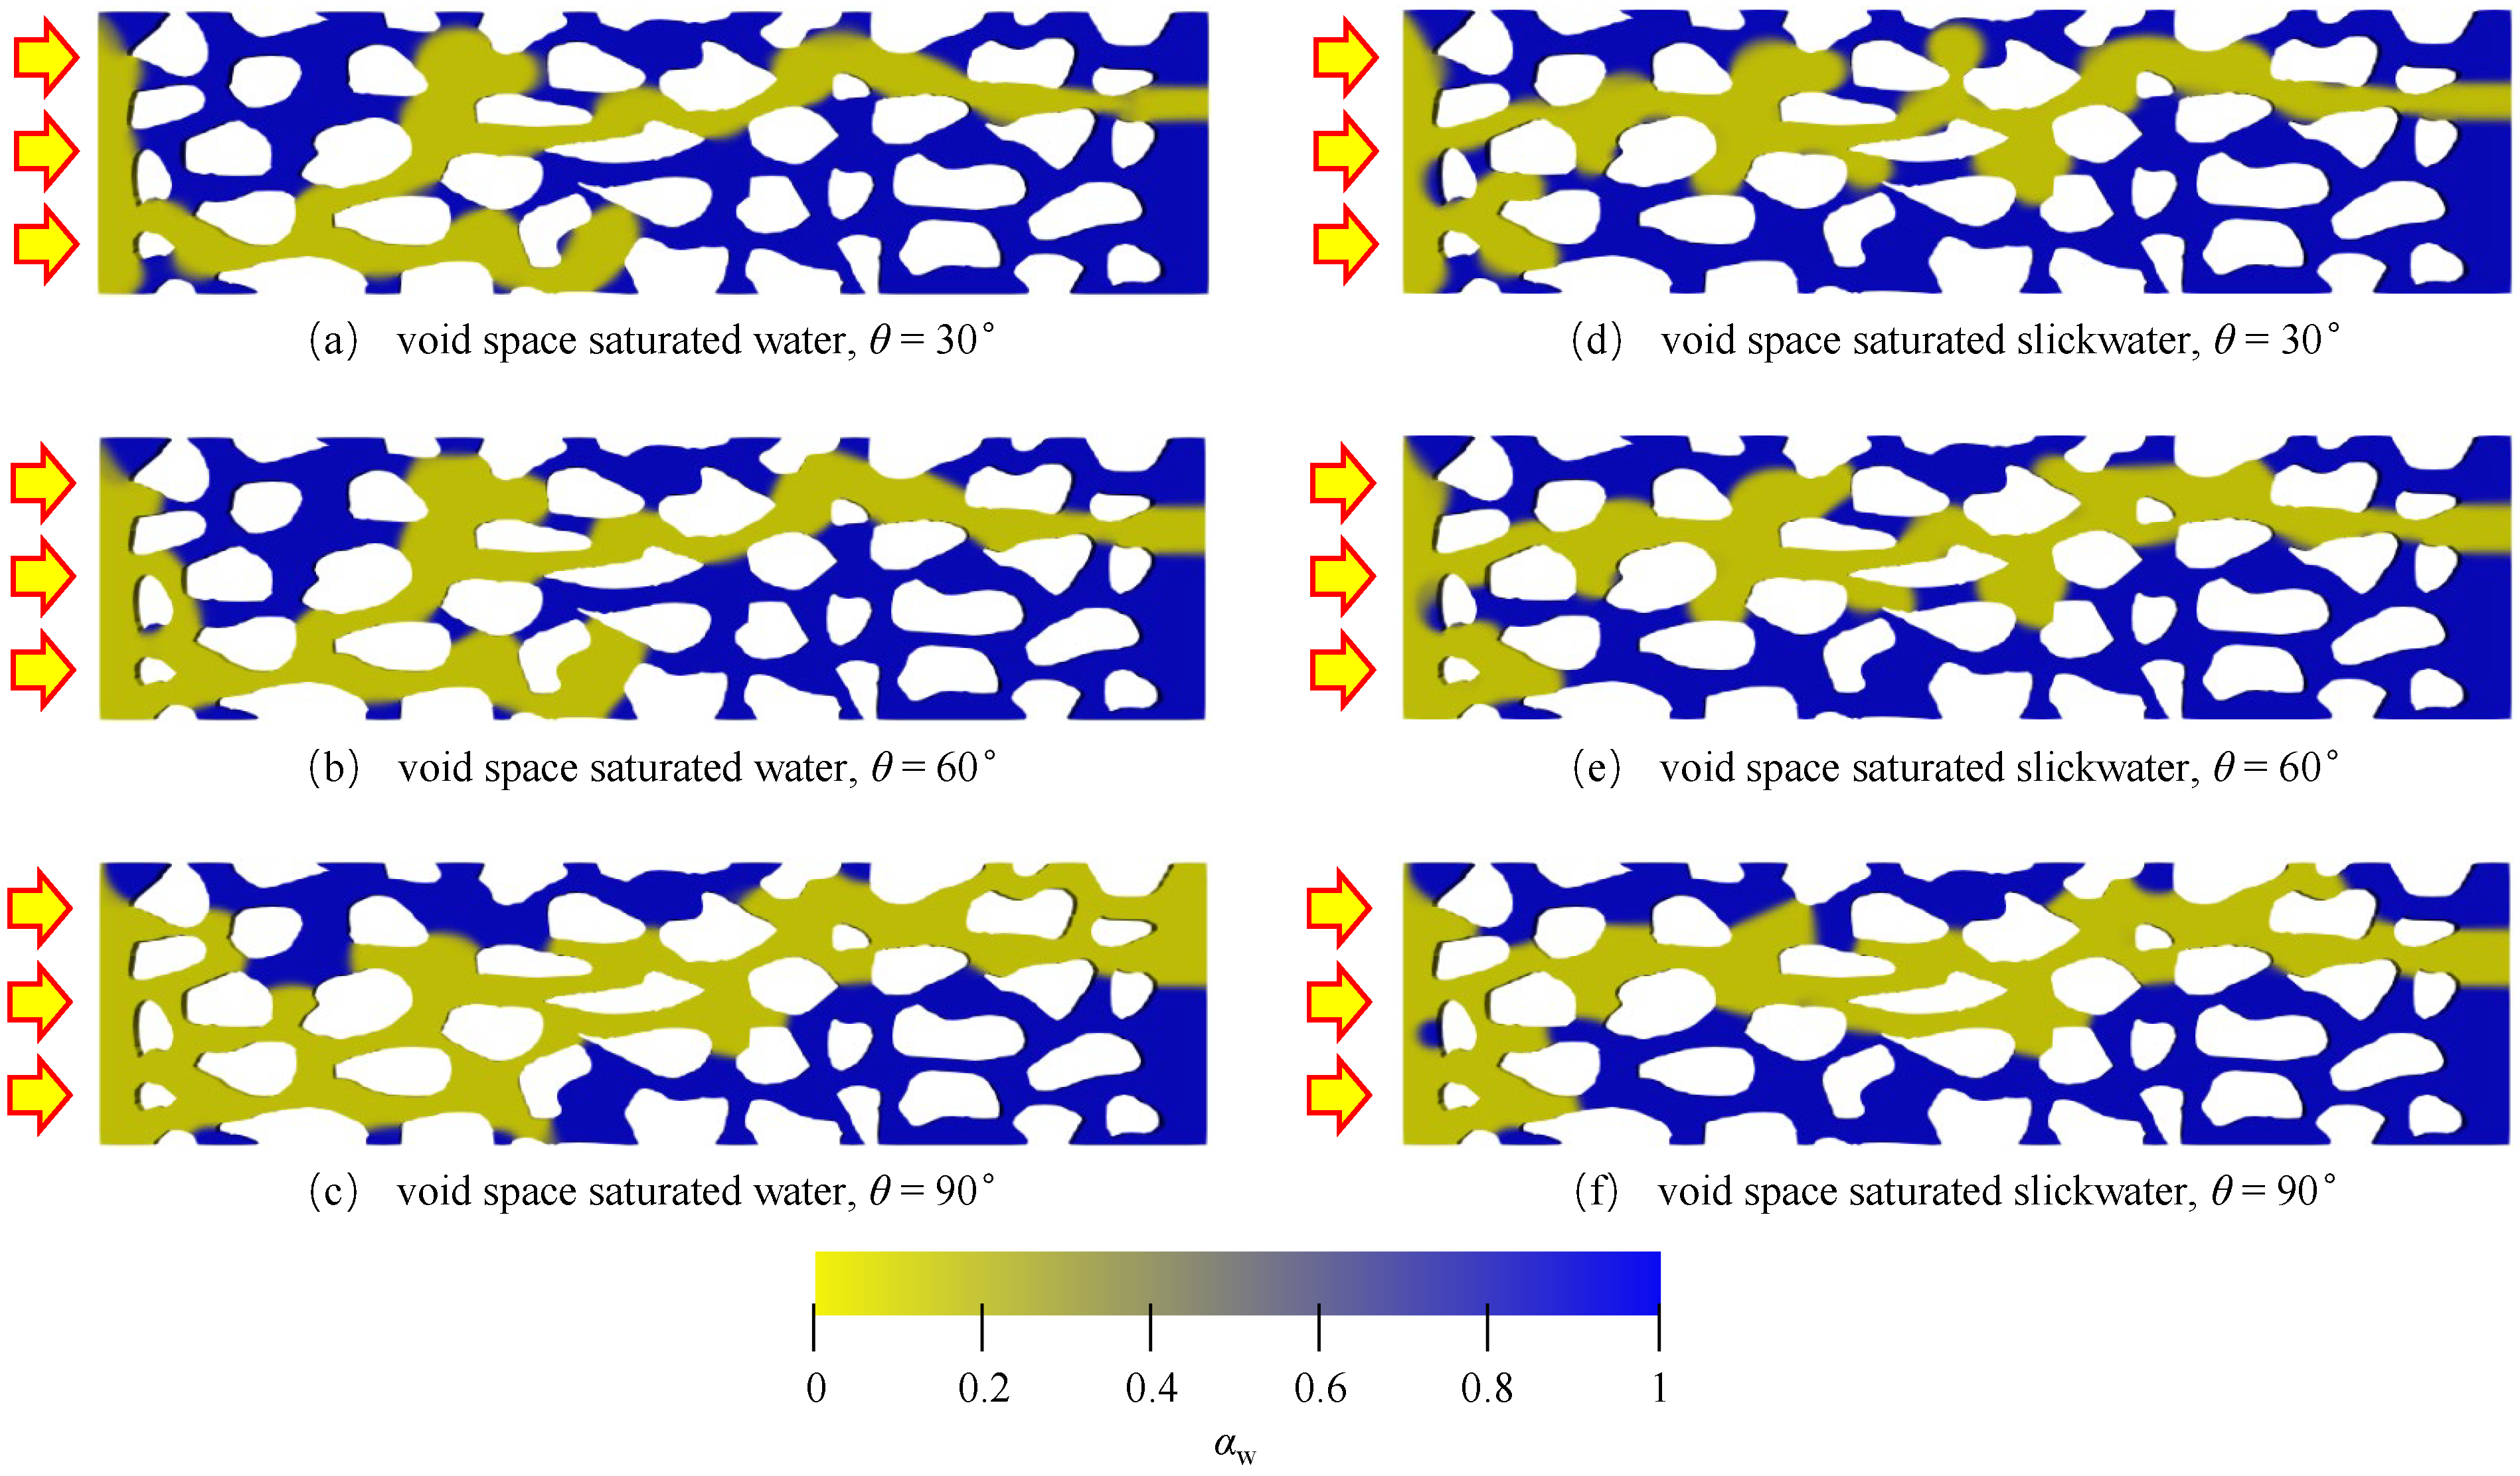
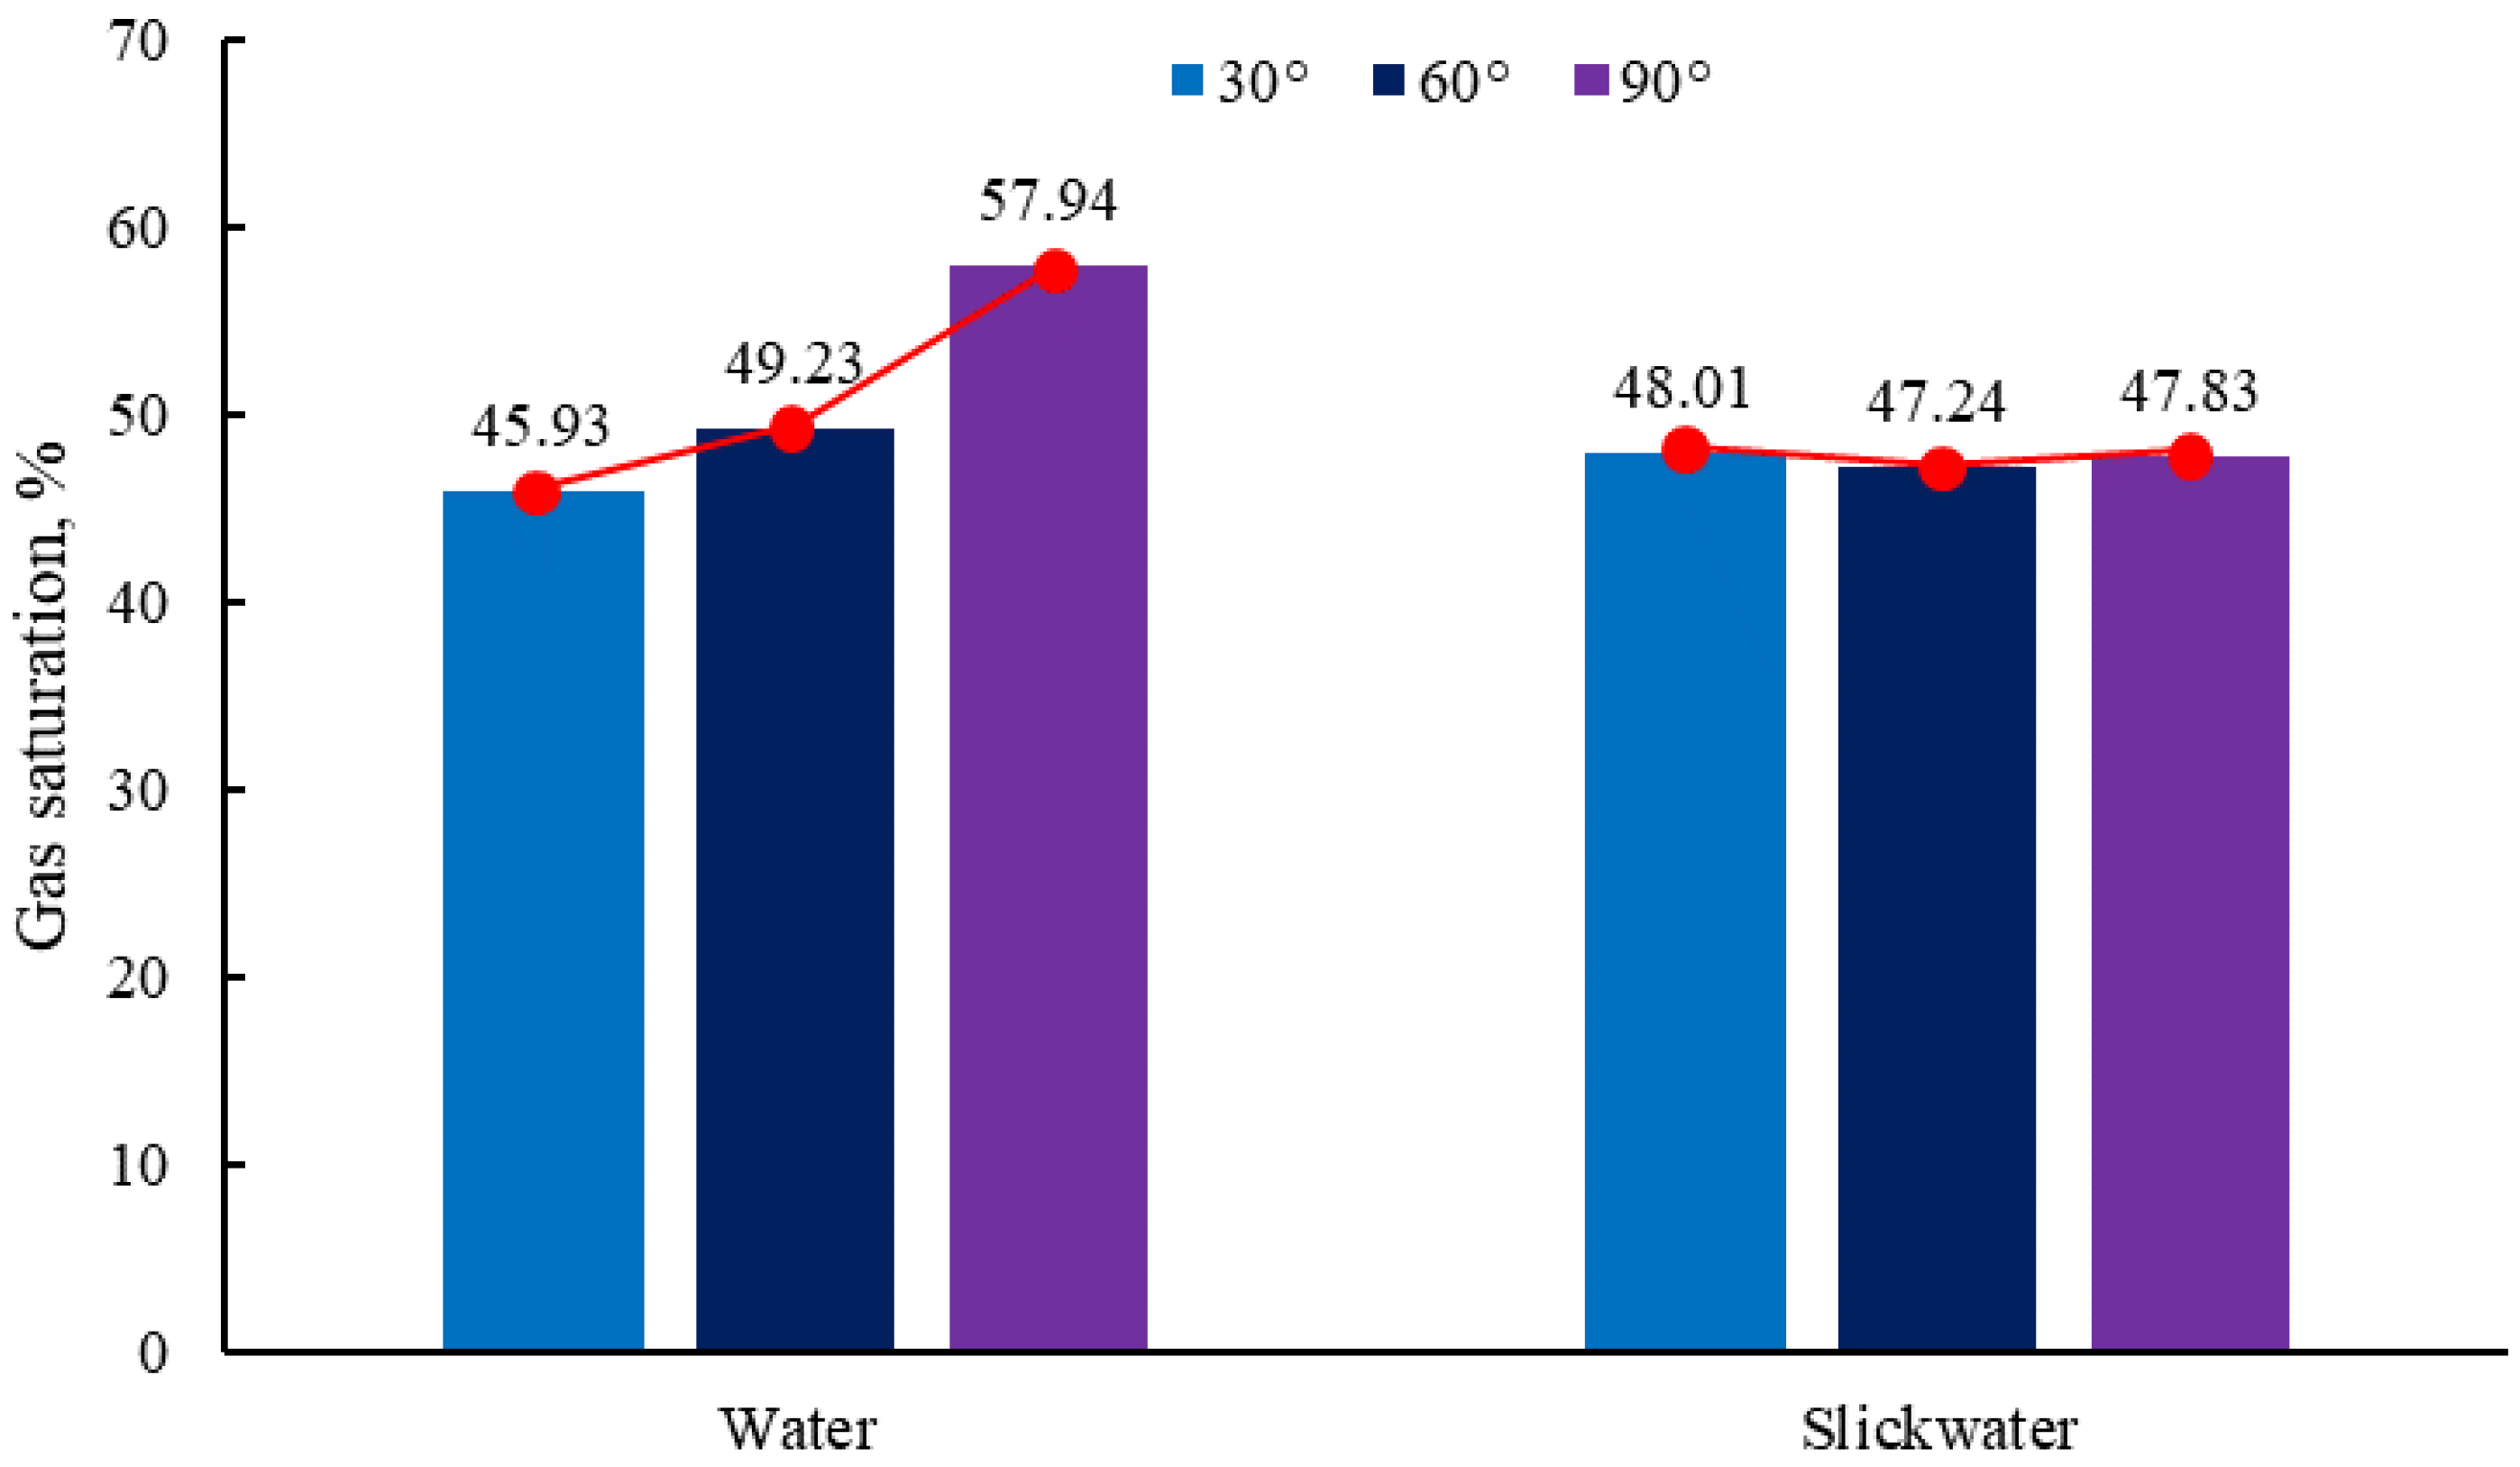
4.2. Wetting Angle
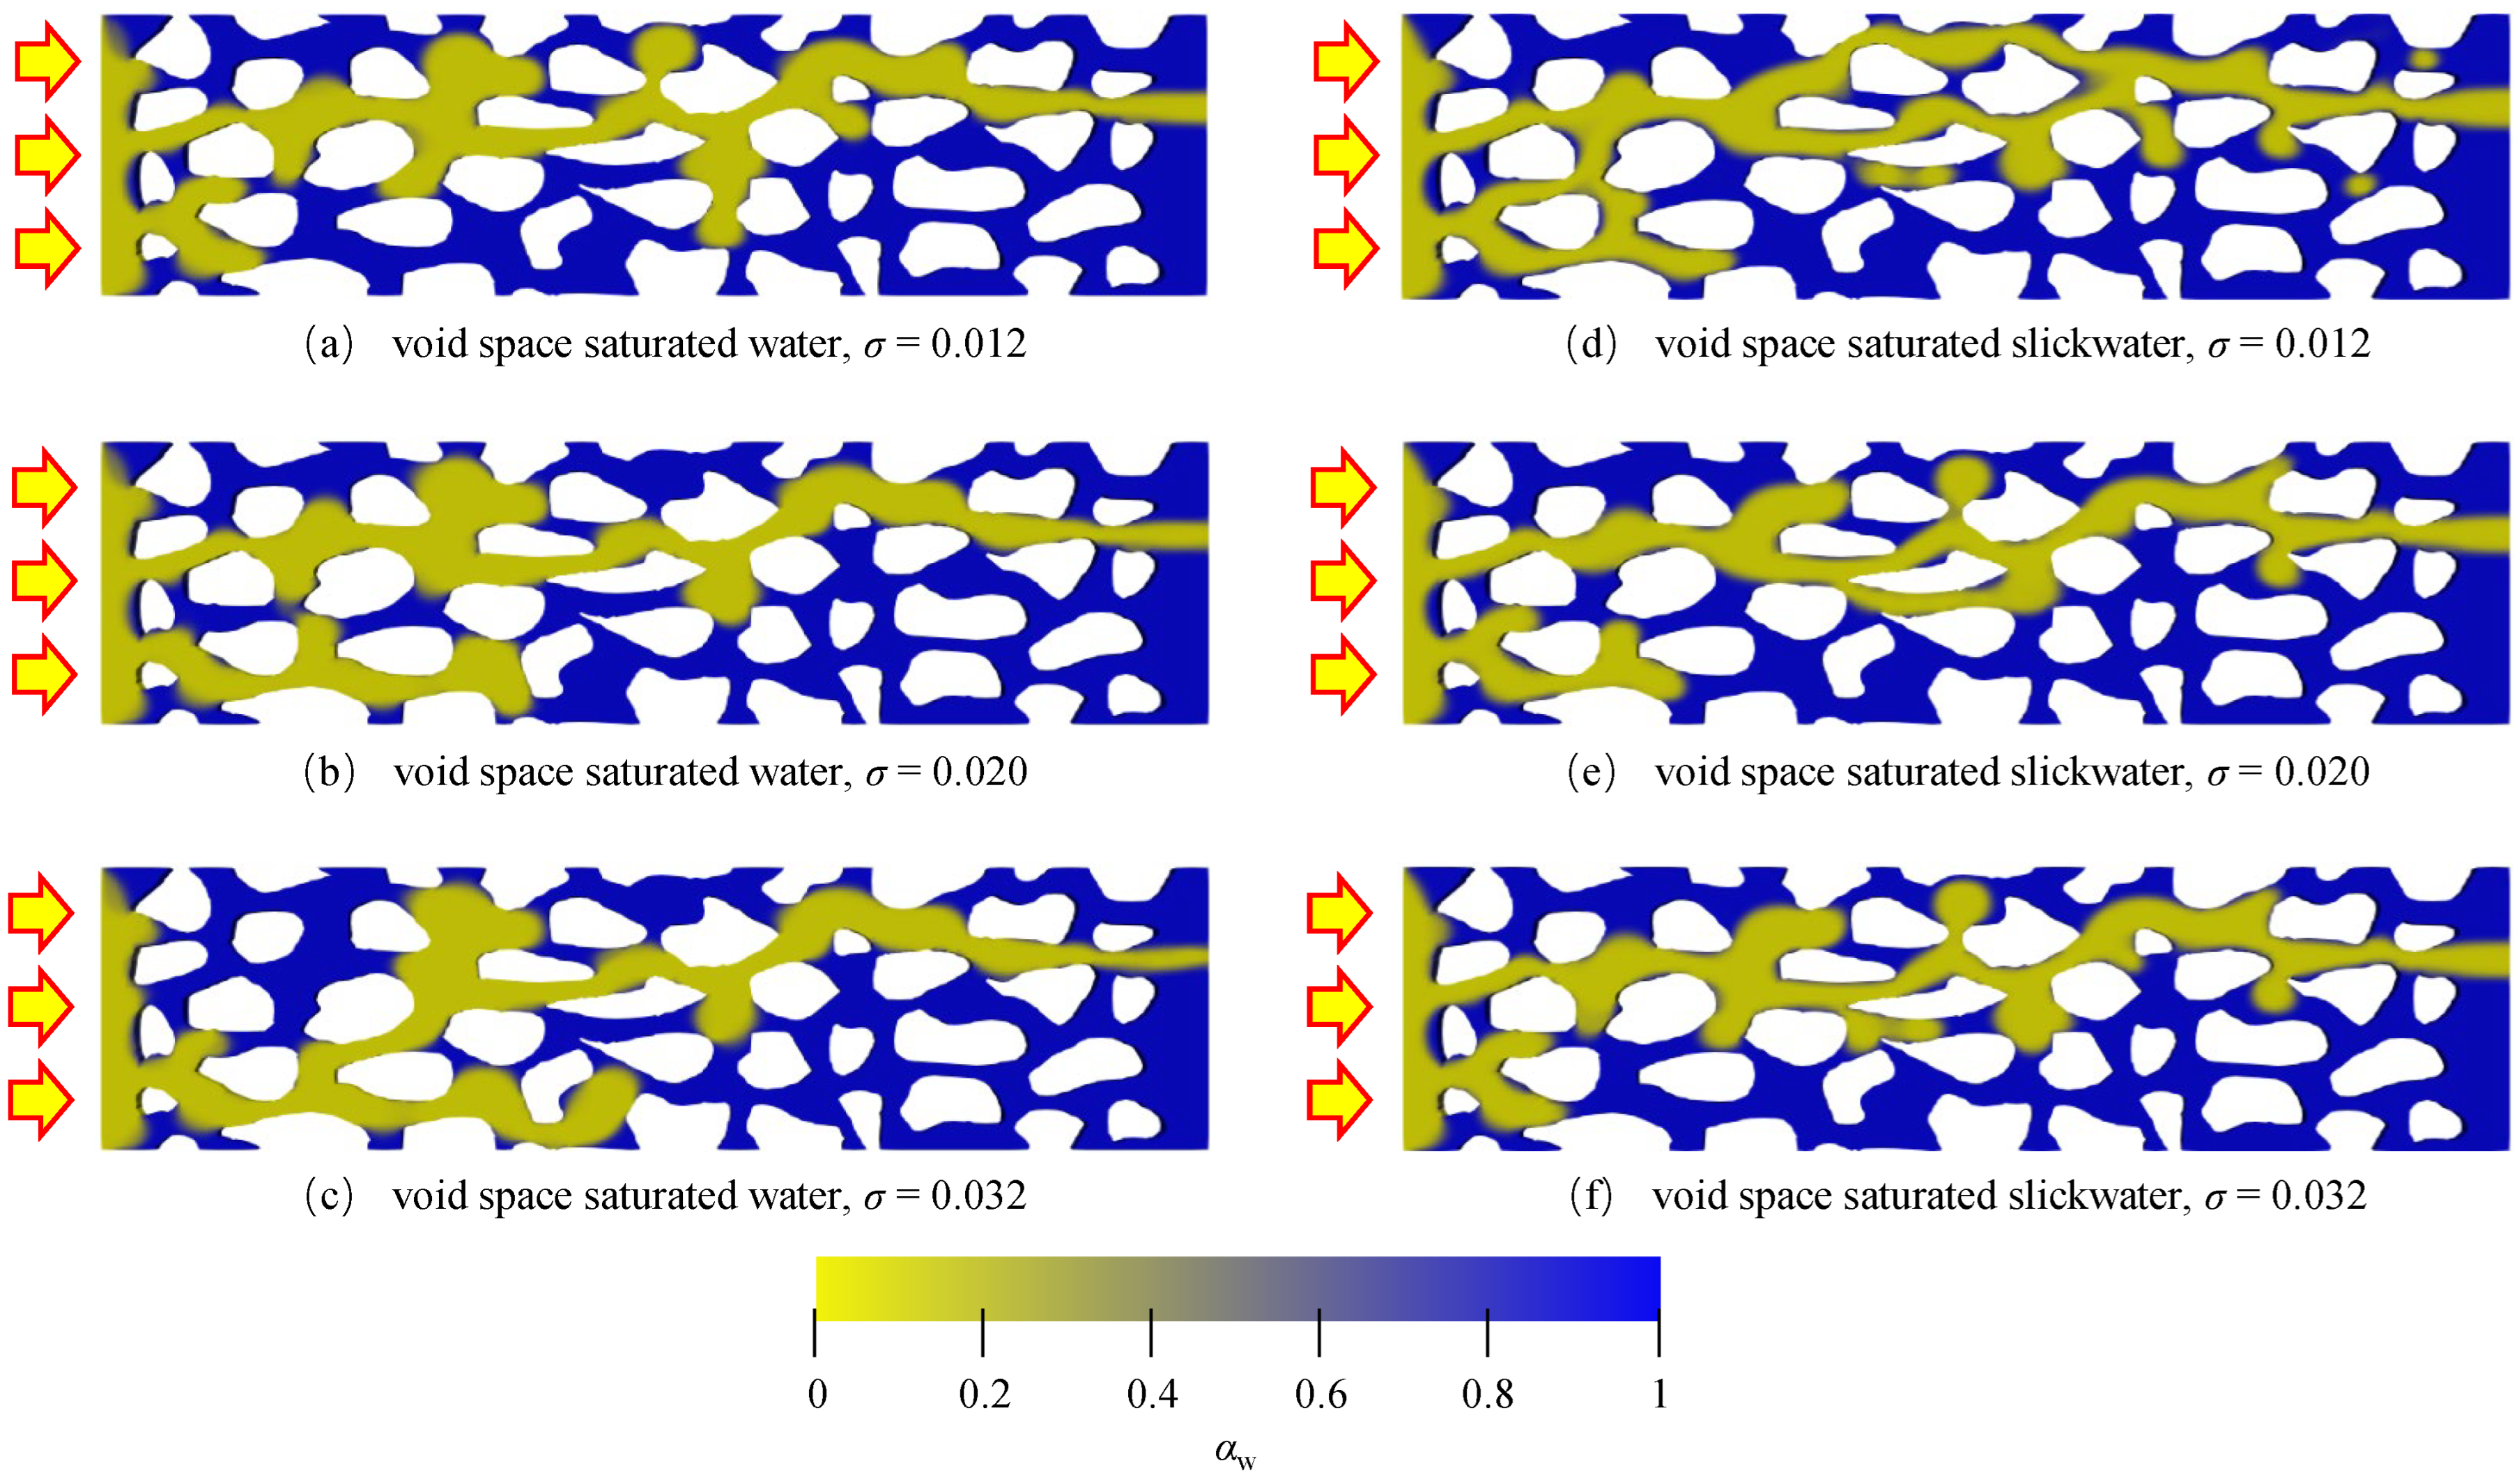
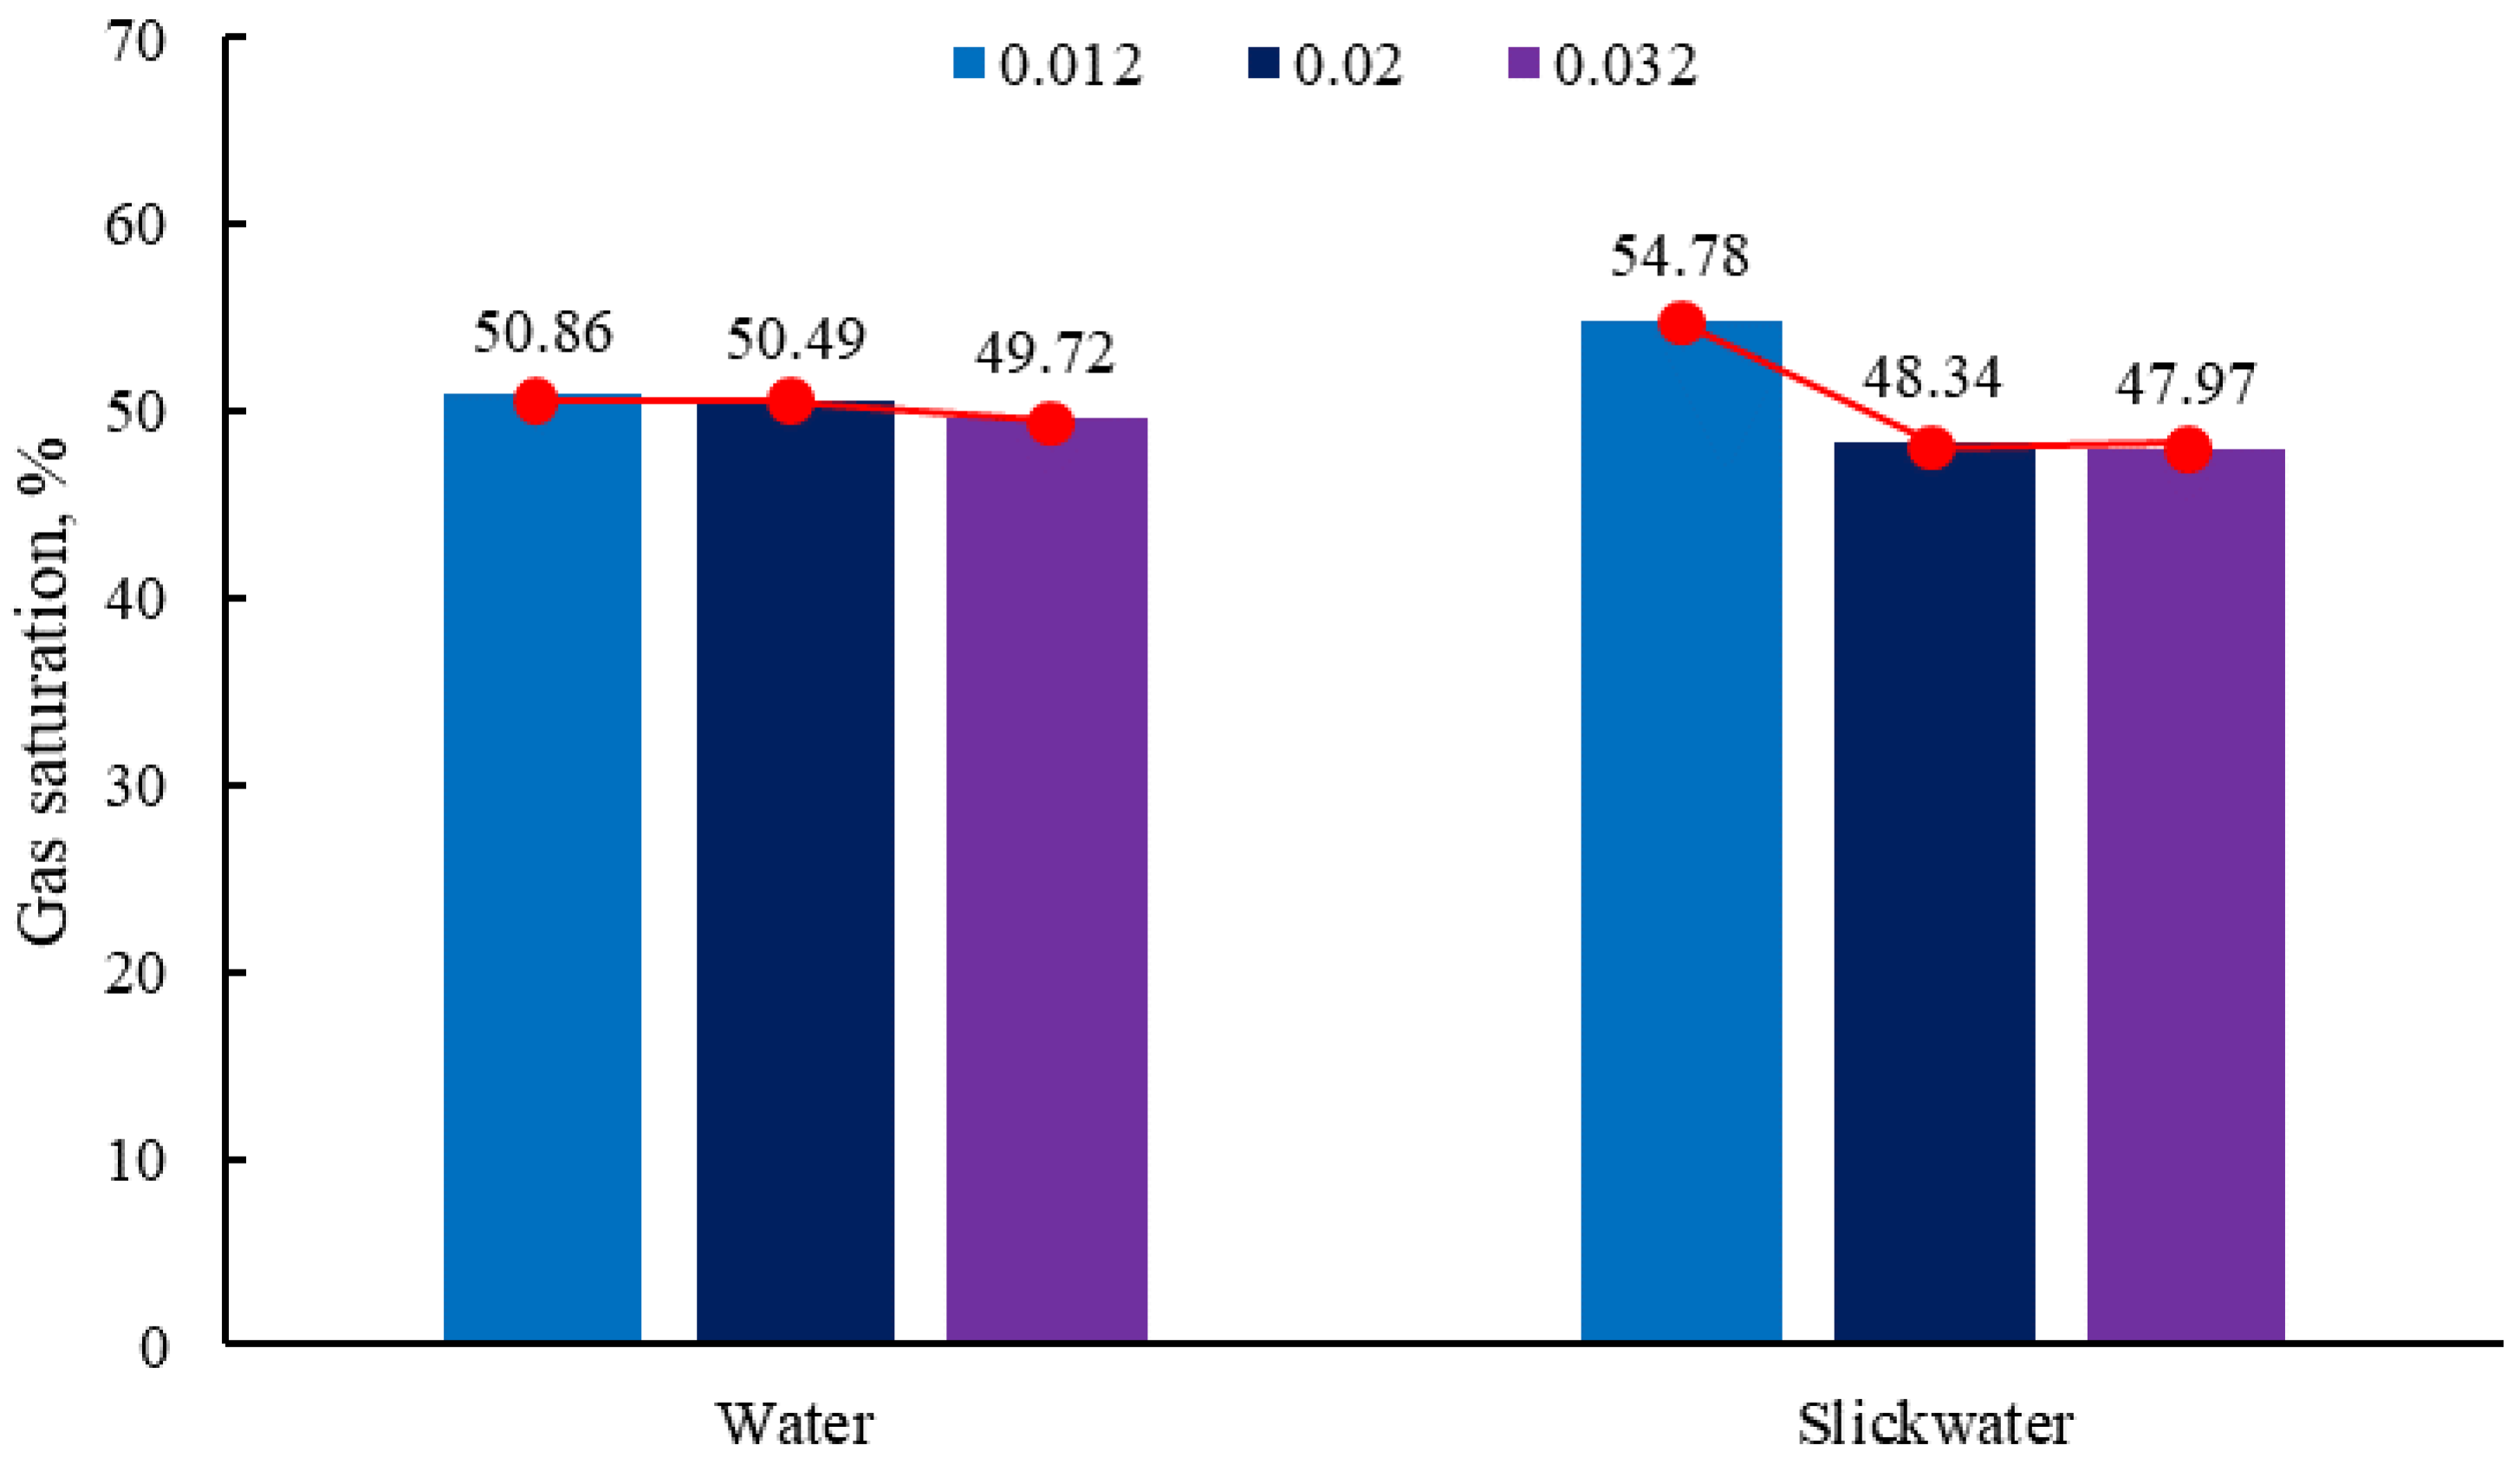
4.3. Surface Tension
5. Conclusions
- The VOF model and porous media modeling techniques can realize the dynamic simulation of gas–liquid two-phase flow at the microscale, and the accuracy of the simulation results is verified using the classical percolation model.
- Liquid-driven gas processes preferentially break through small-pore channels in porous media, occupying more than 90% of the percolation channels in the wetting phase. The gas-driven liquid process preferentially breaks through large-pore channels in porous media and occupy about 50% of the seepage channels after gas breakthrough. The effect of wettability is the main reason for the lower fracturing fluid rejection rate.
- The impact of the flow velocity and wetting angle on gas saturation is pronounced in gas-driven Newtonian fluid flow processes, while surface tension significantly affects gas saturation in gas-driven non-Newtonian fluid flow processes. Gas flow within the porous medium follows the path of least resistance, which is determined by the internal structure of the porous medium and remains unchanged regardless of variations in flow parameters and fluid properties.
Author Contributions
Funding
Data Availability Statement
Conflicts of Interest
References
- Zou, C.N.; Xiong, B.; Xue, H.Q.; Zheng, D.W.; Ge, Z.X.; Wang, Y.; Jiang, L.Y.; Pan, S.Q.; Wu, S.T. The role of new energy in carbon neutral. Pet. Explor. Dev. 2021, 48, 411–420. [Google Scholar] [CrossRef]
- Zou, C.N.; Ma, F.; Pan, S.Q.; Lin, M.J.; Zhang, G.S.; Xiong, B.; Wang, Y.; Liang, Y.B.; Yang, Z. Earth energy evolution, human development and carbon neutral strategy. Pet. Explor. Dev. 2022, 49, 411–428. [Google Scholar] [CrossRef]
- Liu, Y.W.; Gao, D.P.; Li, Q.; Wan, Y.Z.; Duan, W.J.; Zeng, X.G.; Li, M.Y.; Su, Y.W.; Fan, Y.B.; Li, S.H.; et al. Mechanical frontiers in shale-gas development. Adv. Mech. 2019, 49, 201901. [Google Scholar]
- Ghanbari, E.; Dehghanpour, H. The fate of fracturing water: A field and simulation study. Fuel 2016, 163, 282–294. [Google Scholar] [CrossRef]
- Xiao, Y.H.; Zheng, J.; He, Y.M.; Zhou, B. Experimental study on seepage law of fractional wet porous media. J. Chengdu Univ. Technol. (Sci. Technol. Ed.) 2021, 48, 9–18. [Google Scholar]
- Long, Y.Q.; Zhu, W.Y.; Huang, X.H.; Wu, J.J.; Song, F.Q. Experimental Study on Oil Displacement of Aqueous Dispersion System of Nano/Micron-sized Polymer Particles in Heterogeneous Reservoir. J. Southwest Pet. Univ. 2015, 37, 129–137. [Google Scholar]
- Zhao, Y.L.; Lu, G.; Zhang, L.H.; Yang, K.; Li, X.H.; Luo, J.X. Physical simulation of waterflooding development in large-scale fractured-vuggy reservoir considering filling characteristics. J. Pet. Sci. Eng. 2020, 191, 10732. [Google Scholar] [CrossRef]
- Guo, F.; Aryana, S.A. An Experimental Investigation of Flow Regimes in Imbibition and Drainage Using a Microfluidic Platform. Energies 2019, 12, 1390. [Google Scholar] [CrossRef]
- Yao, J.; Sun, H.; Li, A.F.; Yang, Y.F.; Huang, C.Q.; Wang, Y.Y.; Zhang, L.; Kou, J.L.; Xie, H.J.; Zhao, J.L.; et al. Modern system of multiphase flow in porous media and its development trend. Chin. Sci. Bull. 2018, 63, 425–451. (In Chinese) [Google Scholar] [CrossRef]
- Woerner, M. Numerical modeling of multiphase flows in microfluidics and micro process engineering: A review of methods and applications. Microfluid. Nanofluid. 2012, 12, 841–886. [Google Scholar] [CrossRef]
- Mora, P.; Morra, G.; Yuen, D.A.; Juanes, R. Influence of Wetting on Viscous Fingering Via 2D Lattice Boltzmann Simulations. Transp. Porous Media 2021, 138, 511–538. [Google Scholar] [CrossRef]
- Zhao, Y.L.; Liu, X.Y.; Zhang, L.H.; Shan, B.C. A basic model of unconventional gas microscale flow based on the lattice Boltzmann method. Pet. Explor. Dev. 2021, 48, 156–165. [Google Scholar] [CrossRef]
- Zhang, L.H.; Xiong, Y.; Zhao, Y.L.; Tang, H.M.; Guo, J.J.; Jia, C.S.; Lei, Q.; Wang, B.H. A reservoir drying method for enhancing recovery of tight gas. Pet. Explor. Dev. 2022, 49, 125–135. [Google Scholar] [CrossRef]
- Liu, J.H.; Ju, Y.; Zhang, Y.Q.; Gong, W.B. Preferential Paths of Air-water Two-phase Flow in Porous Structures with Special Consideration of Channel Thickness Effects. Sci. Rep. 2019, 9, 16204–16217. [Google Scholar] [CrossRef]
- Cogswell, D.A.; Szulczewski, M.L. Simulation of incompressible two-phase flow in porous media with large timesteps. J. Comput. Phys. 2017, 345, 856–865. [Google Scholar] [CrossRef]
- Osher, S.; Sethian, J.A. Fronts propagating with curvature-dependent speed: Algorithms based on Hamilton-Jacobi formulations. J. Comput. Phys. 1988, 79, 12–49. [Google Scholar] [CrossRef]
- Amiri, H.A.A.; Hamouda, A.A. Pore-scale modeling of non-isothermal two phase flow in 2D porous media: Influences of viscosity, capillarity, wettability and heterogeneity. Int. J. Multiph. Flow 2014, 61, 14–27. [Google Scholar] [CrossRef]
- Zhao, Y.L.; Zhou, H.J.; Li, H.X.; Wen, T.; Zhang, R.H. Gas-water Two-phase Flow Simulation of Low-permeability Sandstone Digital Rock: Level-set Method. Chin. J. Comput. Phys. 2021, 38, 585–594. [Google Scholar]
- Chern, I.L.; Glimm, J.; Mcbryan, O.; Plohr, B.; Yaniv, S. Front tracking for gas dynamics. J. Comput. Phys. 1986, 62, 83–110. [Google Scholar] [CrossRef]
- Hirt, C.W.; Nichols, B.D. Volume of fluid (VOF) method for the dynamics of free boundaries. J. Comput. Phys. 1981, 39, 201–225. [Google Scholar] [CrossRef]
- Minakov, A.V.; Guzei, D.V.; Pryazhnikov, M.I.; Filimonov, S.A.; Voronenkova, Y.O. 3D pore-scale modeling of nanofluids-enhanced oil recovery. Pet. Explor. Dev. 2021, 48, 825–834. [Google Scholar] [CrossRef]
- Ubbink, O. Numerical Prediction of Two Fluid Systems with Sharp Interfaces; University of London: London, UK, 1997. [Google Scholar]
- Weller, H.G.; Tabor, G.; Jasak, H.; Fureby, C. A tensorial approach to computational continuum mechanics using object-oriented techniques. Comput. Phys. 1998, 12, 620–631. [Google Scholar] [CrossRef]
- OpenFOAM. The Open Source CFD Toolbox, 2012, User Guide. Available online: https://www.openfoam.com/documentation/guides/v2012/doc/guide-fvoptions-sources.html (accessed on 25 September 2024).
- Liu, H.H.; Valocchi, A.J.; Werth, C.; Kang, Q.J.; Oostrom, M. Pore-scale simulation of liquid CO2 displacement of water using a two-phase lattice Boltzmann model. Adv. Water Resour. 2014, 73, 144–158. [Google Scholar] [CrossRef]
- Liu, H.H.; Sun, S.L.; Wu, R.; Wei, B.; Hou, J. Pore-Scale Modeling of Spontaneous Imbibition in Porous Media Using the Lattice Boltzmann Method. Water Resour. Res. 2021, 57, e2020WR029219. [Google Scholar] [CrossRef]
- Sontti, S.G.; Atta, A. CFD analysis of microfluidic droplet formation in non-Newtonian liquid. Chem. Eng. J. 2017, 330, 245–261. [Google Scholar] [CrossRef]
- Bao, K.; Lavrov, A.; Nilsen, H.M. Numerical modeling of non-Newtonian fluid flow in fractures and porous media. Comput. Geosci. 2017, 21, cp-494. [Google Scholar] [CrossRef]
- Brackbill, J.U.; Kothe, D.B.; Zemach, C. A continuum method for modeling surface tension. J. Comput. Phys. 1992, 100, 335–354. [Google Scholar] [CrossRef]
- Hu, Y.Q.; Zhao, C.N.; Zhao, J.Z.; Wang, Q.; Zhao, J.; Guo, D.; Fu, C.H. Mechanisms of fracturing fluid spontaneous imbibition behavior in shale reservoir: A review. J. Nat. Gas Sci. Eng. 2020, 82, 103498. [Google Scholar] [CrossRef]
- Yang, Y.F.; Wang, K.; Lv, Q.F.; Askari, R.; Wang, C.C. Flow simulation considering adsorption boundary layer based on digital rock and finite element method. Pet. Sci. 2021, 18, 183–194. [Google Scholar] [CrossRef]
- Suo, S.; Gan, Y.X. Tuning capillary flow in porous media with hierarchical structures. Phys. Fluids 2021, 33, 034107–034116. [Google Scholar] [CrossRef]
- Akbarifard, M.G.; Azdarpour, A.; Aboosadi, Z.A.; Honarvar, B.; Nabipour, M. Numerical simulation of water production process and spontaneous imbibition in a fractured gas reservoir—A case study on homa gas field. J. Nat. Gas Sci. Eng. 2020, 83, 103603. [Google Scholar] [CrossRef]
- Cheng, Z.L.; Ning, Z.F.; Wang, Q.; Zeng, Y.; Qi, R.R.; Huang, L.; Zhang, W.T. The effect of pore structure on non-Darcy flow in porous media using the lattice Boltzmann method. J. Pet. Sci. Eng. 2018, 172, 391–400. [Google Scholar] [CrossRef]
- Shen, Y.H.; Ge, H.K.; Meng, M.M.; Jiang, Z.X.; Yang, X.Y. Effect of water imbibition on shale permeability and its influence on gas production. Energy Fuels 2017, 31, 4973–4980. [Google Scholar] [CrossRef]
- Zhang, T.; Li, X.F.; Yang, L.F.; Li, J.; Wang, Y.H.; Feng, D.; Yang, J.; Li, P.H. Effects of shut-in timing on flowback rate and productivity of shale gas wells. Nat. Gas Ind. 2017, 37, 48–60. [Google Scholar]
- Zeng, F.H.; Zhang, Q.; Guo, J.C.; Zeng, B.; Zhang, Y.; He, S.G. Mechanisms of shale hydration and water block removal. Pet. Explor. Dev. 2021, 48, 646–653. [Google Scholar] [CrossRef]
- Bui, B.T.; Tutuncu, A.N. Interfacial tension induced-transport in shale: A pore-scale study. J. Pet. Sci. Eng. 2018, 171, 1409–1419. [Google Scholar] [CrossRef]
- Haines, W.B. Studies on the physical properties of soil. J. Agric. Sci. 1930, 20, 97–116. [Google Scholar] [CrossRef]
- Zacharoudiou, I.; Boek, E.S. Capillary filling and Haines jump dynamics using free energy lattice Boltzmann simulations. Adv. Water Resour. 2016, 92, 43–56. [Google Scholar] [CrossRef]


| Boundary Type | Velocity Boundary Condition | Pressure Boundary Condition |
|---|---|---|
| inlet | fixedValue | zeroGradient |
| outlet | zeroGradient | fixedValue |
| wall | noSlip | zeroGradient |
| Fluid Parameters | Value | Fluid Parameters | Value |
|---|---|---|---|
| Gas density ρg (kg/m3) | 0.67 | Wetting angle θ (°) | 0 |
| Water density ρl (kg/m3) | 1000 | Interfacial tension σ (N/m) | 0.032 |
| Slickwater density ρl (kg/m3) | 1020 | Calculation duration t (s) | 1 |
| Gas viscosity μg (Pa·s) | 1.11 × 10⁻⁵ | Time step Δt (s) | 1 × 10⁻⁵ |
| Water viscosity μw (Pa·s) | 1 × 10⁻³ | Iterative residual ε (-) | 1 × 10⁻⁵ |
| Flow index n (-) | 0.8 | Outlet pressure pout (Pa) | 100 |
| Consistency coefficient k (Pa·sn) | 1 × 10⁻⁵ | Inlet velocity v (m/s) | 0.01 |
Disclaimer/Publisher’s Note: The statements, opinions and data contained in all publications are solely those of the individual author(s) and contributor(s) and not of MDPI and/or the editor(s). MDPI and/or the editor(s) disclaim responsibility for any injury to people or property resulting from any ideas, methods, instructions or products referred to in the content. |
© 2025 by the authors. Licensee MDPI, Basel, Switzerland. This article is an open access article distributed under the terms and conditions of the Creative Commons Attribution (CC BY) license (https://creativecommons.org/licenses/by/4.0/).
Share and Cite
Yuan, S.; Zhang, L.; Li, T.; Qi, T.; Hui, D. Study of Gas–Liquid Two-Phase Flow Characteristics at the Pore Scale Based on the VOF Model. Energies 2025, 18, 316. https://doi.org/10.3390/en18020316
Yuan S, Zhang L, Li T, Qi T, Hui D. Study of Gas–Liquid Two-Phase Flow Characteristics at the Pore Scale Based on the VOF Model. Energies. 2025; 18(2):316. https://doi.org/10.3390/en18020316
Chicago/Turabian StyleYuan, Shan, Lianjin Zhang, Tao Li, Tao Qi, and Dong Hui. 2025. "Study of Gas–Liquid Two-Phase Flow Characteristics at the Pore Scale Based on the VOF Model" Energies 18, no. 2: 316. https://doi.org/10.3390/en18020316
APA StyleYuan, S., Zhang, L., Li, T., Qi, T., & Hui, D. (2025). Study of Gas–Liquid Two-Phase Flow Characteristics at the Pore Scale Based on the VOF Model. Energies, 18(2), 316. https://doi.org/10.3390/en18020316