Abstract
This review paper examines the critical intersection of energy consumption and environmental impacts within the global food system, emphasizing the substantial footprint (including land usage, costs, food loss and waste, and carbon and water footprints) associated with current practices. The study delineates the high energy demands and ecological burdens of food production, trade, and consumption through a comprehensive bibliographic analysis of high-impact research papers, authoritative reports, and databases. The paper systematically analyzes and synthesizes data to characterize the food industry’s current energy use patterns and environmental impacts. The results underscore a pressing need for strategic interventions to enhance food system efficiency and reduce the footprint. In light of the projected population growth and increasing food demand, the study advocates for a paradigm shift towards more sustainable and resilient food production practices, adopting energy-efficient technologies, promoting sustainable dietary habits, and strengthening global cooperation among stakeholders to achieve the Sustainable Development Goals. Investigations have revealed that the food system is highly energy-intensive, accounting for approximately 30% of total energy consumption (200 EJ per year). The sector remains heavily reliant on fossil fuels. Associated greenhouse gas (GHG) emissions, which constitute 26% of all anthropogenic emissions, have shown a linear growth trend, reaching 16.6 GtCO2eq in 2015 and projected to approach 18.6 GtCO2eq in the coming years. Notably, 6% of these emissions result from food never consumed. While the water footprint has slightly decreased recently, its demand is expected to increase by 20% to 30%, potentially reaching between 5500 and 6000 km3 annually by 2050. Energy efficiency interventions are estimated to save up to 20%, with a favorable payback period, as evidenced by several practical implementations.
1. Introduction
The food system represents one of the largest energy consumers and producers of CO2 equivalents worldwide. Despite this, food production remains intrinsically linked to demographic trends and continues to rise alongside population growth, necessitating a reconsideration of production practices across the entire supply chain, from farming to retailing, and heightened awareness of household consumption to increase global security and equity and mitigate environmental impacts. In this context, the “Farm to Fork” strategy within the European Green Deal aims to create a safe, healthy, and sustainable food system, promoting new chances for food value chain operators, generating fair economic opportunities, improving public health, and creating positive environmental effects [1]. In 2021, the European Commission (EC) proposed enhanced targets aligned with new climate objectives, with the goal of decreasing GHG emissions in the European Union (EU) by a minimum of 55% by 2030 [2]. These proposed goals include a 39% reduction in primary energy consumption and a 36% saving in final energy consumption by 2030, based on updated baseline forecasts from 2020 [3]. Collaborative efforts involving various stakeholders, including government, industry, and consumers, are crucial for promoting sustainable practices and driving meaningful change.
According to United Nations (UN) reports, approximately one-third of food is wasted annually, resulting in a staggering loss of about 750 billion USD [4,5]. This corresponds to agricultural products waste from 28% of agricultural lands, underscoring the imperative need to reduce losses and waste, moving toward sustainability principles and the circular economy. Any form of waste signifies inefficiency and economic loss, with primary issues associated with consumer and company practices.
The utilization of land for food production emerges as a critical concern. Present-day agricultural practices are highly resource-intensive, occupying approximately 43% of the global ice- and desert-free land, with around 87% allocated to food production [6]. Land plays a pivotal role in fueling economic development by generating livelihoods in agriculture, agribusiness, and the food industry. Effective land management is essential for ensuring food availability, security, and equity by maintaining a dependable supply of staple crops and is instrumental in conserving biodiversity, preserving ecosystems, and limiting malnutrition.
However, using land for sustenance comes with significant challenges. Unsustainable practices such as deforestation for crop expansion and land degradation from excessive farming have severe environmental impacts. These include biodiversity loss, water pollution, and increased greenhouse gas emissions, highlighting the dangers of mismanaging this critical resource. Additionally, climate change, closely tied to land use, presents further complications. Alterations in weather patterns, desertification, and shifts in agricultural zones disrupt established food systems and make traditional land management practices insufficient. This situation necessitates rethinking the future of food production and adopting sustainable land use practices.
Farmers face the daunting task of meeting the food needs of a population projected to approach nearly 10 billion people by 2050. With approximately 2 billion people currently employed in agriculture, this sector must remain a catalyst for inclusive economic and social development, contributing significantly to poverty and malnutrition reduction. However, the impacts of agriculture are substantial and escalating, threatening food production through land degradation, water scarcity, and the adverse effects of climate change. As the global population and incomes rise, the overall food demand is expected to surge by more than 50% by mid-century, with the demand for animal-based foods projected to increase by nearly 70%. Forecasts indicate that, without intervention, cropland and pastureland will expand by nearly 600 million hectares by 2050 [7].
A significant contributor to this complex challenge is the production of greenhouse gases (GHGs), with the food system currently accounting for approximately 17.5 gigatons of GHG emissions annually [6,8]. Recognizing the urgency of addressing food loss and waste, the Sustainable Development Goals (SDGs) include Target 12.3, which calls for halving per capita global food waste by 2030 [9]. Indeed, a staggering 26% of GHG emissions can be attributed to the food system. Water scarcity also looms, with profound implications for food loss and waste. As an example, the global water withdrawals of the food industry exceeded 4000 billion m3 in 2014 [10]. While freshwater resources seem to be sufficient to meet the agriculture demand by 2050 on a global scale, effective water management is crucial to ensure sustainability in food production and mitigate the impacts of water loss.
The energy footprint of the food system warrants careful consideration. As one of the largest energy consumers globally, the food sector accounts for approximately 30% of total energy consumption [11,12,13]. Some reports suggest that this figure reaches around 200 EJ yearly [11,12,14,15], underscoring its significant energy demands and contribution to greenhouse gas emissions, which amounts to over 10% of the total [6,8]. However, implementing efficiency measures and adopting innovative technologies can mitigate the environmental impact of the food industry [16,17]. To this end, Shah et al. [18] provided valuable insights. Their research evaluated the potential for increased energy efficiency in G20 countries through a transition to a renewable energy model by assessing productivity changes using the Super Efficiency Slack-Based Measure (SBM) model and the Malmquist–Luenberger (ML) index. This analysis is particularly relevant given the current reliance on non-renewable energy sources, which constitute 85% of the energy model.
Strategies to achieve the goal of the modern food system encompass minimizing food waste, optimizing energy usage, recycling waste materials and energy, integrating renewable energy sources, enhancing transportation and logistics efficiency, and leveraging innovation and digitalization in control and process technologies [19,20]. These multifaceted approaches reduce energy consumption and greenhouse gas emissions while improving public health, social equity, and economic prosperity.
Contribution, Scope, and Methodology
This paper aims to provide a comprehensive review of food systems from an energy-environmental perspective in the wake of escalating global challenges, including rapid population growth and increasing food demand. The primary research objectives include presenting a detailed analysis of the current energy and environmental footprints associated with food systems, highlighting key areas where efficiency improvement can mitigate negative impacts and address social implications. Investigated key topics include food trade dynamics, energy utilization patterns, and environmental implications (e.g., land usage, food loss and waste, and carbon and water footprints).
This review synthesizes extensive literature, drawing from authoritative documents, reports from official organizations, accredited databases, and highly cited scholarly papers. By amalgamating and re-elaborating these data, the paper depicts the food system’s energy and environmental aspects, significantly influenced by global dietary habits. The analysis delves into various food sectors and products through different world regions and covers all phases of the food supply chain. This extensive coverage ensures a holistic understanding of the topic.
The paper explores potential pathways for improving energy efficiency within the food system. It details practical interventions successfully implemented to achieve energy savings and reduce environmental footprints. These interventions are presented as real-world examples, demonstrating their effectiveness in practical applications.
To the best of the authors’ knowledge, while thousands of papers have been published on specific aspects of this topic, most focus narrowly on their respective domains. This paper seeks to advance the current literature by examining the global food system, providing a unique and comprehensive perspective that spans the entire supply chain. Through this approach, this paper contributes significantly to understanding how integrated, system-wide strategies can enhance sustainability and efficiency in food systems worldwide.
This paper consists of three main sections and provides an extensive overview of the global food trade, energy dynamics, and environmental impacts, presenting data segmented by food sector, geographical region, and supply chain phase. The subsequent section delves into the intricate relationship between water usage and food production, highlighting the implications for the water footprint. Finally, this study examines energy efficiency solutions, both conventional and non-conventional, which have the potential to yield benefits in terms of energy conservation, environmental sustainability, and economic viability.
This work aligns closely with the United Nations Sustainable Development Goals (SDGs) [21], specifically SDG 7 (Affordable and Clean Energy), by investigating energy production from renewable sources and SDG 13 (Climate Action) and exploring greenhouse gas (GHG) emissions reduction strategies.
2. Overview of Food Trade, Energy, and Environmental Impact
The interplay between food trade, energy consumption, and environmental impact presents multifaceted challenges and opportunities in the complex landscape of global food systems. Understanding the dynamics of these interactions is crucial for devising effective strategies to enhance sustainability and resilience in the food sector. The comprehensive overview presented here delves into key dimensions of this intricate nexus, beginning with an analysis of global food sales, import–export dynamics, and the evolving dietary patterns shaping land usage for food production, manufacturing, and distribution. Subsequently, this section directs insights into the food loss and waste problem, examining its substantial contribution to greenhouse gas emissions and environmental degradation. Furthermore, it investigates the food industry’s carbon footprint, tracing the trajectory of greenhouse gas emissions and projecting potential pathways for emission reduction by 2050. Finally, the energy landscape is addressed, highlighting opportunities for efficiency.
2.1. Global Food Sales
To gain insight into the impact of the food sector on the world economy, Figure 1 provides a detailed examination of sales and shipment values, illustrating the dynamics at both local and global levels.
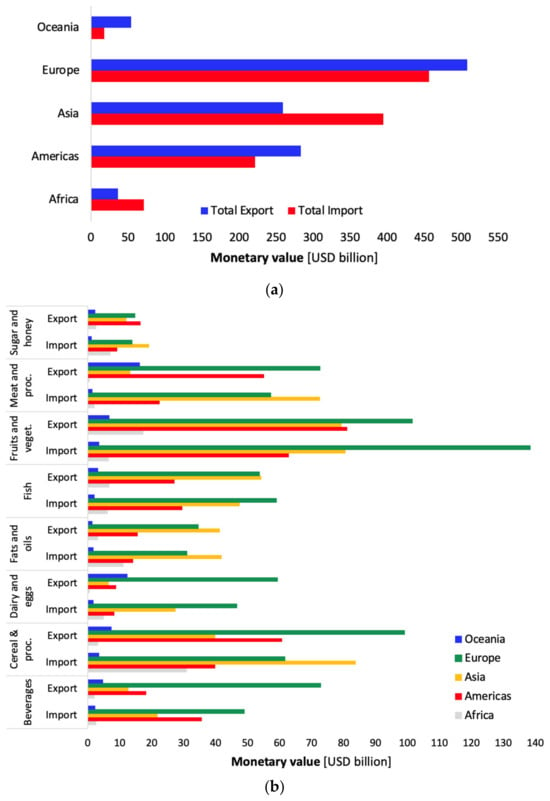
Figure 1.
Food imports and exports by main groups. Total values (a), food product share (b), including food groups (sugar and honey, meat and derivatives, fruits and vegetables, fish, fats and oils, dairy and eggs, cereals, and beverages).
Overall, the global food trade generated revenues of 1 T$ in 2021, underscoring the immense economic significance of the sector [22].
This analysis extends to global dynamics, as illustrated in Figure 1a,b, highlighting imports and exports per continent based on data from [22], reflecting acquisitions in 2020. Trade patterns vary significantly across regions and commodity groups.
In Figure 1a, Europe emerges as the first exporter and importer, with respective volumes of 450 and 520 billion USD, followed by Asia (250 and 400 billion USD) and the Americas (280 and 220 billion USD). Africa and Oceania account for a smaller share of trade, highlighting Africa’s poor economy.
Figure 1b presents a detailed breakdown, illustrating the main food sectors (sugar and honey, meat and derivatives, fruits and vegetables, fish, fats and oils, dairy and eggs, cereals, and beverages). The highest individual flows pertain to fruits and vegetables. Regarding this, Europe imported 138 billion USD and exported 101 billion USD in 2020. Asia takes the lead in importing cereals and their derivatives, fats and oils, meat and its derivatives, sugar, and honey. Meanwhile, Europe is the foremost importer of beverages, dairy products, eggs, fish, and fruits and vegetables. Asia recorded a trade deficit of 59 billion USD for meat, while Europe boasted a surplus of 37 billion USD for cereals. While the Americas and Europe are net exporters in most categories, each region exhibits significant net imports in specific categories. For instance, the Americas had a deficit of 17 billion USD for beverages, while Europe had a deficit of 37 billion USD for fruit and vegetables.
2.2. Dietary Supply and Land Usage
Dietary habits [23] play a pivotal role in shaping food production and, consequently, influencing land usage. Figure 2 illustrates the interconnectedness of these two factors. Specifically, Figure 2a highlights the distribution of dietary energy supply by continent and food category aggregates. The global average dietary energy supply, measured in calories per capita per day, exhibited a steady increase, reaching approximately 2960 kcal per person per day between 2019 and 2021, marking a 9% rise compared to the period from 2000 to 2002 [22]. Notably, Northern America and Europe boast the highest dietary energy supply collectively at around 3540 kcal per person per day, with a substantial disparity compared to Africa (approximately 2600 kcal per person per day) [24].

Figure 2.
Share of dietary energy supply by continent and food aggregate (a); land use of foods (b).
The composition of the dietary energy supply, as delineated in food balance sheets, demonstrates significant variation across regions (Figure 2a). Of particular note is the remarkably high proportion of cereals and root-derived food consumption in Africa, accounting for approximately 67% of the total, a figure considerably higher than that of any other continent. European and American habits are quite similar. Asians are great consumers of cereals (about 50%) at the expense of meat, dairy, and eggs-based food. Oceania also reveals high meat consumption.
The dietary habits of a population significantly influence the production process, starting from the very first step involving the cultivation of raw materials. Consequently, these practices also affect land usage decisions. Given the rapid growth of the global population, the impact on land utilization is a critical aspect to consider. Figure 2b delineates the land utilization associated with food production facilities [6]. The present-day agricultural system is notably resource-intensive, encompassing approximately 43% of the world’s ice- and desert-free land. Within this expanse, approximately 87% is allocated to food production, while the remaining 13% is designated for nonfood uses such as biofuels and textile crops like wool and leather [6].
Figure 2b reveals that the meat sector alone accounts for approximately 70% of the land utilization data. Notably, lamb and mutton meat exhibit a substantial land footprint, requiring about 375 square meters per kilogram of product, followed closely by beef, with an approximate requirement of 320 square meters per kilogram. When excluding the meat sector, cheese and other dairy products also emerge as land-intensive commodities, with a footprint of approximately 170 square meters per kilogram.
The Food and Agriculture Organization (FAO) in the State of Food and Agriculture 2024 report highlights that the annual hidden costs of unhealthy diets are over 8000 billion USD, corresponding to about 70% of the hidden expenses of the global food system [25]. The analysis adopts true cost accounting (TCA), considering economic, health, social, and environmental effects, and shows different risks depending on specific food systems. Inadequate fruit and vegetable consumption represents a concern in traditional and “protracted crisis” food systems, and excessive red and processed meat consumption is a significant issue in industrialized scenarios. The report indicates that a collective effort of governments, policymakers, businesses, and consumers is crucial to shift the global food system toward sustainable and equity practices, aligning health, agricultural, and environmental policies, removing socioeconomic disparities, and providing equal access to healthy food.
2.3. Food Loss and Waste
Food loss and waste (FLW) pose significant economic, social, and environmental challenges contributing to significant negative impacts, including increased food insecurity, carbon footprint, water footprint, and additional land usage, with direct consequences on human health [26]. FLW involves inefficiency in the production chain, with consequent economic loss for the stakeholders involved. In this regard, FAO makes available the Food Loss and Waste database [27], which is the largest online collection of data.
When food is lost or wasted along the supply chain, it not only represents a waste of valuable resources but also results in the unnecessary release of GHGs during production, processing, transportation, and disposal stages. These emissions contribute to global warming and climate change. Additionally, food waste exacerbates water scarcity issues. The FLW energy implication is substantial, as the energy invested in growing, harvesting, processing, and transporting the wasted food is essentially wasted as well. Therefore, addressing food loss and waste is crucial for reducing environmental, social, and economic impacts while conserving resources and mitigating climate change.
As per [28], FLW accounts for approximately 14% and 17% of global food production. Specifically, Europe grapples with around 88 million tons of wasted food annually, with a breakdown revealing roughly 9 million tons lost during the agricultural stage, 17 million tons during industrial processing, 4 million tons during distribution, and over 55 million tons at the final consumption stage [29]. The annual economic ramifications of this waste are staggering, surpassing 143 billion euros. Kummu et al. [30] estimated that 23–24% of the total use of water, cropland, and fertilizers are employed to produce losses (freshwater: 27 m3/capita/year, global cropland area: 31 × 10−3 ha/capita/year, total global fertilizer use: 4.3 kg/capita/year). The study by Hoehn et al. estimated that approximately 38% of the energy embedded in total food production is lost [31,32]. Furthermore, the supply chain necessitates 10–15 kJ of fossil fuel to produce just 1 kJ of food. Consequently, the environmental toll is significant, translating to more than 3 GtCO2eq [6,33].
Figure 3 provides a comprehensive overview of food waste, including the food loss index (FLI) and associated GHG emissions. The food loss index measures the percentage of food lost from the farm level up until retail, compared to 2015. Values greater than 100 show increased waste since 2015, while lower values indicate a decrease. Figure 3a shows food loss per nation, revealing significant waste levels, particularly in developed countries, where values range from 90 to 145 kg per capita. The highest value is in Nigeria, with about 240 kg per capita, and household losses present the maximum impact. Conversely, the breakdown into retail, out-of-home consumption, and household phases highlights the substantial waste occurring in the United States and China during “out-of-home” consumption. For instance, approximately 64 kg and 46 kg of food are wasted out-of-home per person in the US and China, respectively. Other regions show values below 30 kg per person. Remarkably, Australia exhibits significant waste at the household stage, with around 102 kg of food lost per person. The retail phase exhibits similar levels of waste across all the countries investigated. Figure 3b illustrates the FLI over recent years, showing a general increasing trend up to 2020, followed by a decrease in 2021 due to the pandemic. In this instance, it is noteworthy that the FLI parameter globally exceeds a value of 100. Generally, all regions report values greater than 100, except Asian areas. North America consistently records the highest FLI, exceeding 100 in 2020.
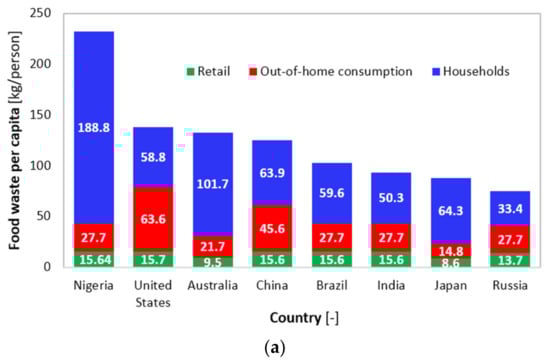
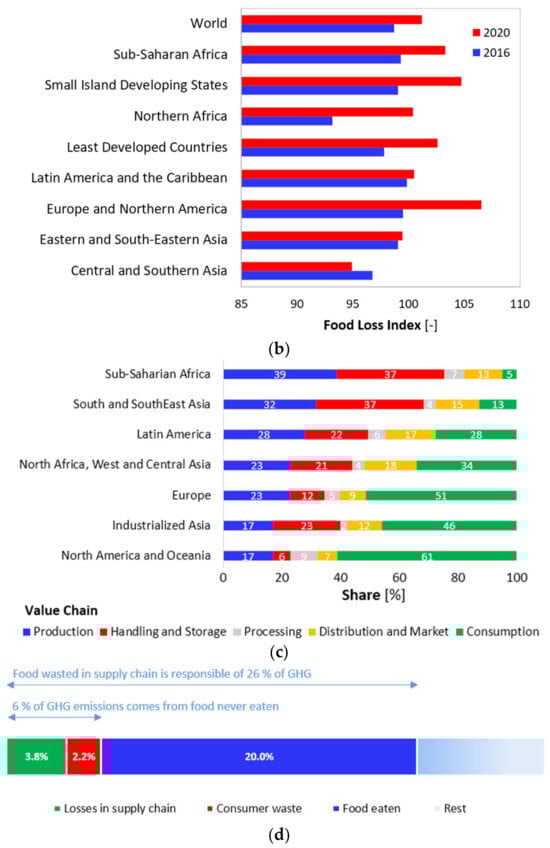
Figure 3.
Food waste: waste per major contributors (a); food loss index (b); share of food loss by continent (c); GHG emissions linked to food waste (d).
Figure 3c displays the share of food loss by continent, considering the value chain “production, handling and storage, processing distribution and market, and consumption”. North America and Oceania stand out as the regions with the highest food waste during consumption, reaching 61%. Another significant contributor to concerns during the consumption stage is Europe, accounting for 51%, closely followed by industrialized Asia at 46%. Conversely, Sub-Saharan Africa presents the lowest quota with only 5%. The other phases of the value chain are aligned around similar values, except for Sub-Saharan Africa, showing 39% during the production phase and 37% in handling and storage (with South and South-East Asia). Instead, North America and Oceania are “more virtuous” during the other phases.
Lastly, Figure 3d presents a more detailed depiction of GHG emissions directly associated with the food system. The food supply chain generates 13.7 billion metric tons of carbon dioxide equivalents, representing 26% of total anthropogenic greenhouse gas emissions [32], with 6% corresponding to never-consumed food. A previous study [30] suggested that around half of the losses could be prevented with a more efficient supply chain. Mitigating FLW is a critical strategy to reduce energy consumption and climate change, and transforming residues into valuable new byproducts or bioenergy represents a viable option [34,35].
2.4. Carbon Footprint
Food production (i.e., from cultivation to consumption) is intricately linked to GHG emissions, contributing significantly to the carbon footprint. The path begins with crop production, where emissions arise from land use change, fertilizer application, and fuel use in machinery. As crops progress through the supply chain, emissions continue during the manufacturing and processing stages, driven by energy-intensive operations and transportation. Retailing further adds to the footprint through refrigeration and packaging processes. Even at the end of its life cycle, food waste decomposes, emitting methane, a potent GHG and global warming potential (GWP) agent. The implications of these emissions are profound, exacerbating climate change, disrupting ecosystems, and threatening food security. Major contributors to food-related greenhouse gas emissions include livestock farming, particularly beef and dairy production, which generates methane and nitrous oxide. Additionally, rice cultivation and deforestation for agricultural expansion significantly contribute to carbon emissions. Addressing these emissions requires holistic approaches, including sustainable agricultural practices, efficient supply chain management, and reducing food waste at all stages of production and consumption.
Figure 4 presents data on food system GHG emissions [6,8,36]. Figure 4a illustrates the trend of GHG emissions over time, spanning from 1990 to 2021. The data reveal a linear growth trend, with GHG emissions approaching 16.6 GtCO2eq in 2015. If this trend continues, GHG emissions could reach approximately 18.6 GtCO2eq in the coming years. The study by Crippa et al. [8] presents more alarming figures: according to their research, annual global emissions from the food system amounted to 18 gigatons of CO2 equivalent in 2015, accounting for 34% of total greenhouse gas emissions [8].
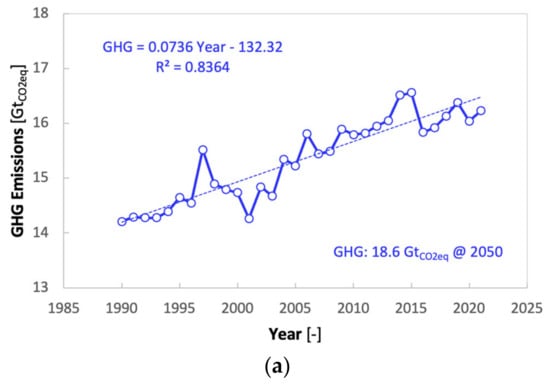
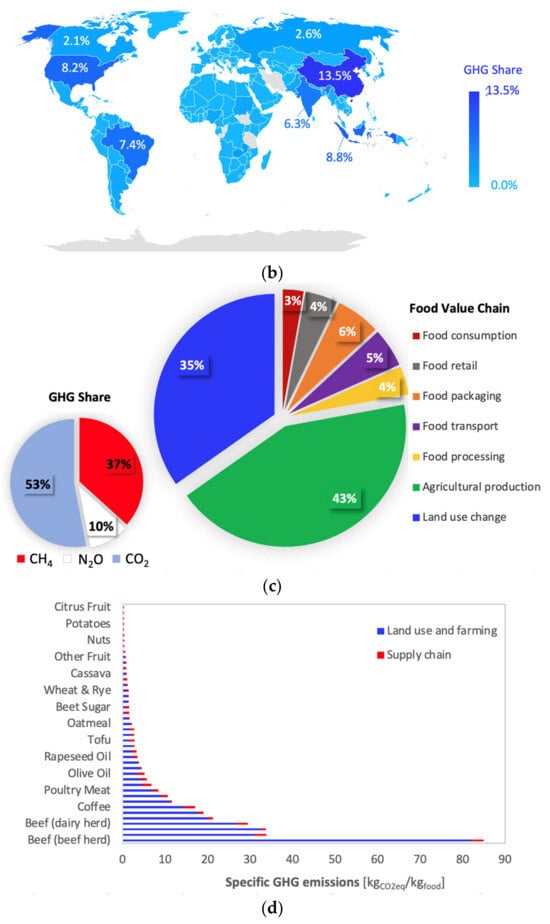
Figure 4.
GHG food system emissions: year perspective (a); share of GHG per nation (b); GHC per sector and per gas source for USA (c); GHG production per food product (d).
Figure 4b provides a geographical breakdown of major GHG emitters. China emerges as the largest producer, accounting for 13.5% of emissions, followed by Indonesia (8.8%), the USA (8.2%), Brazil (7.4%), and the Russian Federation (2.6%). Canada is also a notable producer of GHG, contributing 2.1% of emissions. This value significantly increases when calculated per capita. For a more detailed analysis, Figure 4c goes deeper into the GHG emissions within the USA food system, examining emissions per sector and gas source. Agriculture and land use change (strictly interconnected) collectively contribute to 78% of emissions, while food manufacturing, processing, packaging, transporting, and retailing contribute 19%. Phases closely linked to the food industry, such as processing and packaging, cover 10% of GHG emissions. The result underscores that a potential 10–19% reduction in GHG emissions in the food industry is achievable with best practices and improvements in process efficiency. Further investigation reveals that 53% of GHG emissions stem from direct CO2 emissions, 37% from CH4, and 10% from N2O. Lastly, Figure 4d illustrates GHG production per food product, measured in kilograms of CO2 equivalent per kilogram, considering the land use and supply chain. Foods directly and indirectly derived from meat exhibit a significant impact, with beef-derived products contributing approximately 120 kgCO2eq per kg of food product. As observed, the effect of non-meat foods on GHG emissions is quite negligible. The results indicate that adopting good dietary practices could significantly mitigate GHG emissions within the food system.
Path for CO2 Emissions Reduction by 2050
Under the 2050 business-as-usual baseline with projected yields from the FAO, total agricultural emissions from land use change and production will rise to 15 Gt per year by 2050. Urgent changes are necessary in global food production and consumption practices. In the coming decades, the agricultural system must address pressing and sometimes conflicting needs. A previous study [7] proposed comprehensive solutions to achieve a sustainable food future while meeting growing food demands. The report introduced a 22-item “menu for a sustainable food future”, categorized into five “courses” to (1) curb the rising demand for agricultural and food products, (2) boost food production by preserving land use, (3) take advantage of the reduced need for agricultural land to protect forests, (4) increase fish availability by optimizing the management of aquaculture and wild fisheries practices, and (5) lower GHG from agricultural practices.
A pathway for reducing CO2 emissions by 2050 is defined using the GlobAgri-WRR model introduced in reference [7]. Figure 5 illustrates how implementing the five courses of action could help mitigate the rise in global temperature by reducing and limiting GHG production associated with agriculture. The analysis considers three scenarios: Coordinated Effort, Highly Ambitious, and Breakthrough Technologies. In the figure, the “Restore forests and peatlands” component involves the restoration of a minimum of 80 million hectares of reclaimed agricultural land through reforestation efforts to achieve the target of 4 GtCO2eq per year by 2050 and limit global temperature rise to 2 °C. Alternatively, for an even more ambitious approach to limit warming to 1.5 °C, restoring a minimum of 585 million hectares of reclaimed agricultural land through reforestation could significantly mitigate global emissions from agricultural production for an extended period.
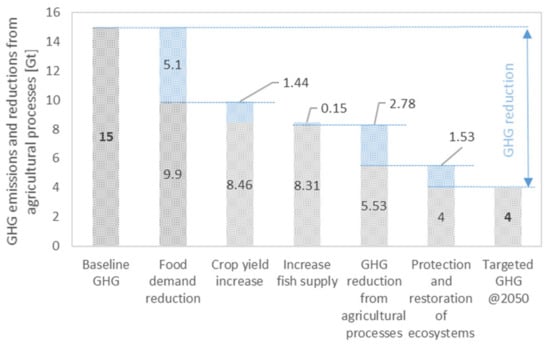
Figure 5.
Potential path for food-related GHG reduction.
The urgency to mitigate greenhouse gas (GHG) emissions resonates deeply within the research community, prompting focused efforts to explore strategies aimed at tackling the root causes. Recent scholarly work delves into specific aspects that could contribute significantly to this objective. The study by Read et al. [37] revealed that about 16–18% of the total environmental impact of the US food system is related to food loss and waste, spanning groups such as energy consumption, eutrophication and GHG warming potential, and land and water use. Reducing food loss and waste by half at all supply chain stages could diminish the food system’s overall environmental footprint by 8–10%. Agbelusi et al. [38] explored strategies to minimize the carbon footprint within the agricultural supply chain, emphasizing sustainable practices and innovative technologies, including organic farming, agroforestry, and soil management. The study highlights the advantages of renewable energy sources like solar and wind power in agricultural operations, which decrease reliance on fossil fuels. Additionally, biogas and biomass production from organic waste represents a sustainable energy alternative that reduces waste and curtails carbon emissions traditionally associated with waste disposal. Precision agriculture technologies such as GPS, IoT sensors, and data analytics enhance resource efficiency and lower emissions by optimizing inputs and reducing waste. The case studies analyzed in the paper demonstrate significant improvements in productivity and reductions in environmental impact. Moreover, the study outlines that measures to boost supply chain efficiency, including green transportation options, sustainable packaging, and optimized logistics, contribute to emission reductions and cost savings. Another study [39] aimed to pinpoint crucial factors that alleviate inefficiencies throughout the entire food supply chain. It offered comprehensive and actionable insights for stakeholders to enhance their operations by categorizing enablers into “givens” (regulations and governance), “means” (technology, financial implications, perishability, logistics, and traceability), and “ends” (inventory management, storage, collaboration, trust, hygiene, packaging, and information sharing). Li et al. [40] delved into the emissions associated with dietary habits, revealing disparities in dietary emissions within countries based on detailed expenditure data. They drew attention to the lower emissions attributed to individuals in less affluent conditions. Their analysis covered 139 countries and 140 food products, noting that higher expenditure groups typically generate more dietary emissions due to increased dairy and red meat consumption. The study concluded that global annual dietary emissions could decrease by 17% if the EAT-Lancet planetary health diet were adopted globally, mainly due to shifts from red meat to legumes and nuts. This dietary change would allow 56.9% of the global population, currently over-consuming, to reduce global emissions by 32.4%, offsetting a 15.4% rise from under-consuming populations transitioning to healthier diets.
2.5. Energy Share in the Food System
Energy plays a crucial role in various food processes, encompassing heating, cooling, drying, refrigeration, processing, packaging, and transportation [41,42]. Some reports suggest that around 200 EJ per year are consumed [11,12,14,15], with approximately 45% attributed to food processing and distribution activities in developed countries, 30% to cooking, preparation, and retail, and 25% to production stages [13]. To delve into the energy distribution across the food supply chain, Figure 6 presents insight data [43].

Figure 6.
Energy implications in food industry: energy employment in various food sectors categorized per source in the European Union (a); energy end use (EEU) share for different unit processes in Sweden (b) [43].
Figure 6a illustrates the contribution of the food supply chain (FSC) to European per capita energy consumption, estimated at around 11 GJ per capita for the Joint Research Centre (JRC) basket [44]. The chart depicts the energy sources used, ranging from fossil fuels to nuclear energy and renewables such as wind, solar, hydro, and biomass. It is immediately evident that the food system continues to rely heavily on fossil fuels, particularly in the agricultural phase, where usage is approximately 9–10 times greater than other energy sources. This ratio decreases to about 2–3 times in the industrial phase. In detail, the analysis shows that agriculture and industrial processing are the most energy-intensive steps, with 3662 MJ per capita and 2754 MJ per capita, respectively. Agricultural activities primarily encompass crop cultivation, animal breeding, and waste management, while industrial activities include ingredient processing, slaughtering, chilled and frozen storage, and waste management. Logistics, packaging, and use range from 1057 MJ per capita to 1520 MJ per capita. Specifically, food use encompasses cooking, cold storage, and transportation from the retailer to the home, while other transportation stages fall within the logistics phase. The end-of-life stage, involving final waste disposal and wastewater treatment, presents the lowest share, corresponding to 630 MJ per capita.
The energy end use (EEU) for a Swedish case study in the food industry is illustrated in Figure 6b, highlighting both production and support processes across related departments. The analysis systematically examines and identifies the energy distribution in each section, facilitating the identification of critical nodes. The production area accounts for 70% of primary energy consumption, with heating and cooling constituting approximately 63%. The support section comprises 30% of energy requests, distributed relatively evenly among departments.
3. Water–Energy–Food Nexus
The nexus approach typically refers to the interconnectedness between water, energy, and food systems [45]. Regarded by numerous scholars as a vital area for shaping policy and governance in a world grappling with climate change, population increases, and disparities in resource access, the water–energy–food (WEF) nexus offers a strategic framework for integrated resource management. The study outlined in reference [46] delves into the evolution of the WEF nexus, presenting diverse interpretations of this concept. Essentially, the WEF nexus examines the relationships among these three crucial sectors, focusing on the potential synergies, conflicts, and compromises that result from their collective management. According to the literature [46], consensus on the precise definition of the WEF nexus remains elusive, with multiple similar yet distinct interpretations coexisting [47,48]. The World Economic Forum initially prioritized water security within this framework, hence its occasional reference as the WEF security nexus. According to a previous study [49], the emphasis was predominantly on resource security for the initial four years following the Bonn 2011 Conference [50], but the scope has since widened to encompass the interdependencies and integration essential for sustainable resource use. The ongoing discussion about the nexus’ exact nature and practical applications suggests its status as a dynamic and maturing concept. Several authors have pointed out the inherent complexity in managing even a single resource, which is compounded when orchestrating the integrated management of interconnected resources [51]. Benson et al. [46] even questioned whether the WEF nexus effectively ensures resource security for all. The scholarly papers under review express concerns that sustainability is being treated as a security issue, focusing unduly on one aspect of sustainable development at the expense of others. To counter this, the Sustainable Development Goals provide a foundation for advancing the WEF nexus with a steadfast commitment to “leaving no one behind” [52]. Furthermore, managing WEF nexus-related trade-offs requires accounting for their potential to mitigate international tensions. Incorporating a multi-centric approach introduces complexity, especially when assessing the myriad interconnections, compromises, and catalysts involved.
Despite the complexity of these interconnections, this section aims to contextualize the overall discussion within the realm of “water–food” relationships, presenting data and correlations from recent and reputable reports and scholarly articles.
The water footprint (WF) metric permits us to measure and quantify water usage across different processes [41,53,54,55,56]. The WF serves as an indicator of both direct and indirect water consumption. It refers to the overall amount of freshwater consumed producing goods and services. This concept has been integrated into water management science to highlight the significance of consumption patterns and the global implications for effective water governance. Two-thirds of freshwater withdrawals are for irrigation. However, irrigation returns less water to rivers and groundwater than industrial and municipal uses and predominates in water-scarce areas and times of the year, driving 90 to 95% of global scarcity-weighted water use [57,58,59]. Figure 7 showcases the path and the cycle of water, focusing on the food supply chain [57,59]. The plot represents the interconnections between water resources and food security, incorporating various elements such as the water cycle, safety aspects, and connections to energy usage [59].
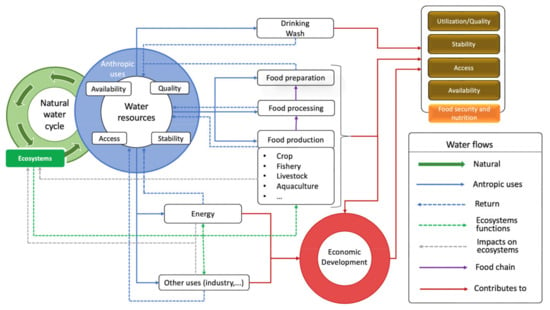
Figure 7.
Water cycle focused on food supply chain.
Furthermore, irrigated agricultural production consumes about 85% of withdrawn resources. Utilizing these resources, irrigated agricultural lands account for 40 percent of global food output while occupying 20 percent of the cropland [58]. The energy sector accounts for almost 10 percent of global water withdrawals [58].
The food industry requires large amounts of water for various purposes, such as washing, processing, and cleaning. In 2014, global water withdrawal was quantified at over 4000 billion m3 [10], scoring a slight decrease to reach about 3900 billion m3 in 2020 [60]. The availability of freshwater resources is projected to be adequate for agriculture to fulfill its demand needs by 2050 on a global scale, provided that there is appropriate investment and technology. However, there is considerable disparity in the water availability between and within countries, and severe water scarcity is forecasted in areas such as the Near East, North Africa, South Asia, and other regions [61,62].
Figure 8 reports the analysis of water withdrawal worldwide by continents and sectors, drawing on and reprocessing resource data [63,64]. Figure 8a illustrates the correlation between population growth and global water usage. Water consumption paralleled the upward trajectory of population expansion until the year 2000. Subsequently, due to the implementation of awareness-driven policies, a change in this trend occurred, culminating in a recorded figure of 3900 billion m3 in 2020, as mentioned above. The chart also illustrates the range of potential scenarios, highlighted by the “scissor edges”. The water demand is projected to increase significantly over the next two decades [65]. By 2050, the global water demand for all uses is expected to grow by 20% to 30%, reaching between 5500 and 6000 km3 per year.


Figure 8.
Water withdrawal worldwide: annual global value and population (a); continent distribution (b); sector share (c); continent and sector distribution (d).
A continent-specific breakdown (Figure 8b) reveals that Asia is the foremost consumer and contributor to water wastage, accounting for 65%, trailed by the entire American continent at 21%. Europe and Africa collectively account for 13%. A sectoral analysis further underscores that agriculture ranks as the primary water consumer, constituting 70%, while the industrial sector follows at 19% (Figure 8c). Interestingly, when examining the allocation of water consumption by continent and sector (Figure 8d), Europe’s industrial sector emerges as an exception, consuming more water than its agricultural counterpart (57% vs. 21%). In contrast, water withdrawals in agriculture are notably predominant in Asia and Africa, accounting for 82% and 81%, respectively. These proportions decrease to 60% in Oceania and 51% in the Americas, though they still represent the highest shares. Industrial water withdrawals vary significantly, ranging from 5% in Africa to 34% in the Americas.
Notably, the food sector straddles agriculture and the domain closely associated with food processing, which forms a segment of the industrial sector. Consequently, in any endeavor to enhance water utilization efficiency, the agricultural sector naturally emerges as the first focal point, with the food industry following closely in second place.
Water use in the food industry varies greatly depending on the specific sector, with some industries being much more water-intensive than others [66]. For example, the meat-processing industry requires significantly more water than grain or vegetable production.
Figure 9 presents further investigations in the context of water withdrawals. Figure 9a reports the WF per kg of product. Cheese is now in first position with a value of over 5600 L per kg, followed by nuts with 4130 L/kg and fish with 3690 L/kg. Beef-derived food is in fifth place, showing about 2710 L per kg, while lamb and mutton exhibit a WF of about 1800 L per kg [6].
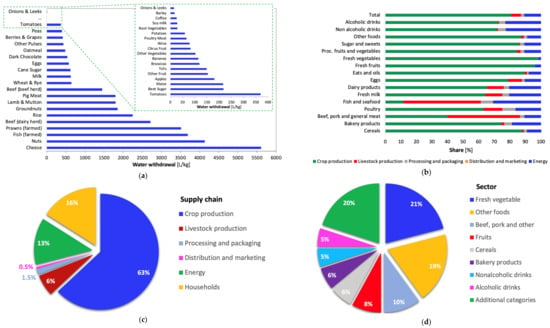
Figure 9.
Water footprint in the food system: freshwater withdrawals per product (a); share of water usage per sector (b); water usage per component of the supply chain (c); water usage per food sector (d).
Figure 9b reports the share-out per food sector (e.g., sugar and sweet, meat sector, dairy products) and per phase (i.e., crop production, livestock production, energy, and processing and packaging). As observed, energy involvement is more pronounced in the fishery and beverage sectors, while it remains relatively negligible in fruit and vegetable production. Conversely, water withdrawals are substantial during the livestock phase, particularly for meat production and fisheries.
Figure 9c,d refer to the US food system, according to the US Department of Agriculture (USDA) [67]. Figure 9c reports water usage per component of the supply chain and shows that crop production has the highest impact (63%), and fundamental contributions derive from energy and households, with 13% and 16%, respectively. Figure 9d delves deeper into the water usage per food sector, reporting the meat and fresh vegetable segments as the most water-intensive.
As known, water classification typically adopts colors such as blue, green, and grey [68]. Blue water measures the volume of surface and groundwater adopted for production processes. Green water refers to rainwater consumption, and grey water defines the amount required to dilute pollutants. The scientific community is very sensitive to the topic of the water footprint and there are many papers published on this topic, with many focused on agri-food and food manufacturing [69,70,71,72,73]. In China, the water footprint (WF) of residents’ food consumption amounted to 605.12 billion m3 per year, showing a general upward trend over time [74]. The highest contribution came from the green WF, accounting for 69.4%, while the grey WF corresponds to 18.7% and the blue WF to 11.9%. Specifically, grains contributed 37.5% to the total water footprint, while pig, beef, and mutton consumption accounted for 22.6%. A comprehensive review [71] focused on various water uses, finding green water the most consumed, whereas Gerbens-Leenes et al. [75] examined the water footprint of poultry, pork, and beef across different countries and production systems.
In addition, there is also concern about the quality of the water discharged from food-processing plants. Indeed, it is crucial to implement water management strategies that conserve water resources and reduce the environmental impact. Such approaches include using water-efficient technologies, optimizing water use in production processes, and treating and recycling wastewater. The research community increasingly emphasizes the critical role that the recycling and recovery of wastewater can play. The body of literature in this field is rapidly expanding. For instance, a previous study [76] pointed out that wastewater treatment can effectively contribute to achieving 11 out of the 17 Sustainable Development Goals (SDGs). Bailone et al. [77] noted that while many industries have invested significantly in this area, legal barriers and public health and safety concerns hinder wastewater reuse in several countries. Another paper [78] detailed the experiences and challenges encountered during the implementation and successful three-year operation of a full-scale water reuse station at one of the largest poultry slaughterhouses in Europe. The authors reported that the water reuse system has provided a stable supply of 4000 m3 per day of high-quality water, contributing to the site’s substantial demand of 10,000 m3 per day, and has reclaimed over 4 million m3 of water since 2020. The significant reduction in water consumption, approaching 20–50%, according to the recycling and reuse of wastewater principle, is also estimated and confirmed in the study [79].
Dietary changes address the reduction in water withdrawal. For instance, shifting toward dietary patterns aligned with recommended guidelines will potentially decrease China’s water footprint by 15% by the year 2050 [80]. Hoekstra, Mekonnen et al. [66,81] highlighted that the adoption of plant-based diets as a substitute for meat-centered options could decrease the total water footprint by 36–40%. Additionally, the literature [82] indicated that vegetarian diets with modest quantities of low-trophic-level animals (e.g., forage fish and insects) exhibit a lower WF than strictly vegan solutions. Water loss noticeably contributes to food loss and waste and significantly impacts global food security. Kummu et al. [30] calculated that the annual water footprint associated with food loss and waste amounts to 215 km3, representing 12–15% of the total WF, and vegetables, cereals, and fruits account for about three-quarters of the FLW water footprint. Mekonnen and Fulton [83] reported the benefits of addressing food loss and waste within the US food system, showing higher benefits than merely moving toward vegan or vegetarian diets. Climate and land use change are expected to further stress water availability [84].
According to the literature [81], establishing maximum limits on WFs for each river basin, defining benchmarks for the WF by product, and ensuring equitable WF distribution among communities can significantly reduce the water footprint. Proper soil and water management practices and initiatives to reduce food loss are fundamental [85]. Moreover, a strict interaction between economic and pure technical assessments is crucial to ensure efficient global water allocation [86].
4. Energy Efficiency Solutions
After water usage and footprints in the food supply chain from farming to home-consuming, this study turns to sustainable solutions for saving energy, first, and secondly, for optimizing the resources’ usage, water included.
Energy expenditure imposes a substantial financial burden on the food industry. Integrating energy-conserving strategies can curtail costs and diminish the ecological and hydrological footprint [87]. An effective approach involves the fine-tuning of production processes and machinery. Employing energy-efficient technologies can bring about reductions in energy consumption and expenditures. Numerous strategies can be embraced, including high-efficiency electric motors and variable-speed motors [88,89,90]. Novel food preservation methods with minimal ecological impacts and waste generation are paramount, presenting a pivotal avenue for curtailing the energy imprint [91,92]. The reclamation of waste materials and surplus energy resources, whenever feasible, yields substantial energy economies [79,93,94,95,96,97]. Harnessing external air and incorporating desiccants or absorbent materials into the circulation can optimize the energy-intensive drying processes [98].
Effective equipment maintenance and periodic energy assessments can pinpoint opportunities to reduce energy usage. The deployment of energy management systems and intelligent meters facilitates the monitoring and regulation of energy consumption, affording opportunities for enhancement. Emerging methodologies, grounded in unconventional technologies or built upon the Internet of Things (IoT) and sensor electronics, are increasingly coming to the forefront, signifying the vanguard of technological advancement.
Management initiatives hold the potential to unlock over 46% of the total potential savings, as outlined by Compton [98]. These initiatives are typically categorized into three main groups: plant energy management measures, energy project management, and integrated plant energy management programs. This study’s objective is to delve into areas ripe for energy-related interventions. Table 1 provides an overview of the selected papers used for this investigation, jointly summarizing the deriving energy gain.

Table 1.
Paper selections for investigating areas susceptible to energy interventions.
4.1. Conventional Technologies
Boiler and steam distribution—Boilers constitute a significant portion of energy consumption within food industries and necessitate substantial fuel quantities. Al Momani et al. [99] identified and quantified potential causes of efficiency losses and presented strategies for mitigation and enhancement. Significant heat losses emerge during the exhaust of flue gases (approximately 10% to 30%) at typical temperatures of 150–250 °C. There is a significant possibility to save heat by minimizing losses [88]. Deterioration in fuel and water quality, among other factors, can result in suboptimal boiler performance [99,100]. For smaller 10 MW boilers, unbalanced and radiation losses may account for 1% to 2% of the total fuel calorific value, while for larger 500 MW boilers, typical values range from 0.2% to 1%. Every 15% reduction in excess air can produce a mere 1% increase in boiler efficiency. Addressing steam leaks can yield efficiency gains of 3–5%. Significantly reducing heat losses from uninsulated pipes translates to substantial fuel savings. Furthermore, maintaining and inspecting steam traps can result in fuel savings of approximately 10%, with an additional 5% potential savings with automated monitoring system installation.
In a case study discussed in this paper focused on a boiler producing approximately 2440 kg/h of steam, energy-saving measures led to an estimated average monthly reduction in diesel consumption of up to 16.63%, corresponding to an anticipated monthly cost savings of approximately 14,205.85 Jordanian Dinars per month [99]. Another example presented an energy-saving intervention centered around the heat generator [98]. The action reduced natural gas consumption by 7.5%, leading to an annual saving of 279,000 USD, with a payback period of 14 months.
Condensing economizers—Installing a condensing economizer can improve waste heat recovery and steam system efficiency by up to 10%, as reported by the US Department of Energy (DOE) [101]. Recent research indicates enhancements in the efficiency of condensing boilers, with gains ranging from 10% to 25% when compared to non-condensing counterparts [102,103]. Integrating economizers within the boiler system has demonstrated the capability to improve efficiency by approximately 1% for every 5 °C reduction in exhaust gas temperature. Consequently, this suggests the potential for achieving fuel consumption reductions in the range of 5% to 10% across the system [104,105]. It is important to note that there is a limit to the exploitation of waste heat, as corrosion is more likely to occur when the flue gas temperature reaches the dew point of approximately 57 °C for natural gas combustion products. The payback periods for condensing economizers are often less than two years [104,105].
Waste heat recovery—Enhancing energy efficiency in the food industry through waste heat recovery is a complex endeavor [104,106,107,108]. Depending on the specific process, energy wastage in the food industry can range from 10% to 45%. Primary waste heat sources include heating and refrigeration systems, hot water or air streams used in production, and heat generated during various processing operations. A comprehensive review of waste heat recovery technologies is presented in a previous study [107]. These technologies primarily take the form of heat exchangers. Air preheaters are employed for gas-to-gas recovery within low to intermediate temperature ranges, especially in scenarios devoid of contaminants. Economizers are typically deployed in low- to medium-temperature applications, primarily for heating liquids. In contrast, waste heat boilers find their utility in medium- to high-temperature settings, where they raise steam for power generation. The organic Rankine cycle (ORC) has demonstrated its efficacy in harnessing low-grade temperature waste heat among various thermodynamic cycles [154,155]. For example, in the United Kingdom, a substantial 72% of industrial demand is attributed to industrial thermal processes, with 31% classified as low-temperature process heat [109]. Notably, nearly 20% of this (equivalent to 40 TWh/yr) is estimated to hold the potential for industrial waste heat recovery [104]. The waste heat recovery for utilization in lower-temperature operations offers significant economic benefits, including reduced fuel consumption and decreased capital expenditures by selecting equipment with lower capacity. These studies [98,156] provide an overview of usual inlet temperatures for various food-processing operations that can take advantage of waste heat sources at higher temperatures. The temperature ranges can differ substantially depending on the processed products. Certain processes like cleaning necessitate a temperature of 60 °C, cooking needs 110–115 °C, pasteurization requires 65–110 °C, whitening needs 85 °C, drying demands 30–120 °C, washing needs 40–85 °C, sterilization requires 80–150 °C, boiling demands 95–105 °C, heat treatment needs 40–60 °C, and drainage calls for 38–104 °C. Heat extraction from a refrigerant condenser can be effectively carried out using a de-superheater, which can be installed between the compressor and condenser to capture heat within the temperature range of 60–90 °C [104]. Conversely, heat recovery from cooking oven exhausts is feasible at temperatures of 150 °C [104]. A previous study demonstrated that air preheater implementation can yield a 4% reduction in oven fuel consumption [157]. In an experimental setup, recuperating heat from the exhaust flow of an industrial baking oven produced the primary air supply to the burner elevated to 105 °C.
Heat pumps—Heat pumps can be employed, especially in waste heat recovery, to extract heat from the exhaust of dryers. Studies have reported payback periods ranging from 2 to 5 years [110]. Adopting a heat pump within the food industry is considered advantageous when its coefficient of performance exceeds 3. The food industry frequently involves evaporation and distillation processes. The study conducted by Cooper et al. [111] reported energy savings in the range of 20% to 45%.
Refrigeration—On a global scale, the cold chain sector is experiencing rapid growth, with a value exceeding USD 160 billion in 2018 and an estimated compound annual growth rate of approximately 16% until 2026 [113]. Space cooling and refrigeration systems contribute significantly to greenhouse gas (GHG) emissions, accounting for around 4400 million metric tons of CO2 equivalent in 2020, corresponding to over 10% of global GHG emissions [113]. Enhancing the energy efficiency of space cooling and refrigeration systems has the potential to reduce energy consumption and associated emissions. The recommendations primarily focus on optimizing controls. By implementing a head pressure control system to maintain correct pressure levels, potential annual savings of over 25% can be realized [113]. Regular performance maintenance is also emphasized, with the potential for savings ranging from 10% to 20% [113]. In an optimization study of a refrigeration system, minimizing the total compressor shaft work through the optimization of pressure and temperature levels resulted in a 7.17% reduction in total shaft work compared to the original system [114]. Another study [115] demonstrated significant cost reductions, ranging from 36.64% to 42.58%, between the extreme design points of the Pareto front for NH3/CO2 and C3H8/CO2 refrigerant pairs. The paper [116] introduced a data-driven methodology to enhance refrigeration system efficiency through load-side interventions. This approach consists of two main components: the first focuses on resolving individual energy monitoring challenges through a disaggregation strategy, while the second block manages cooling loads to minimize compressor simultaneity. The overarching goal of this strategy is to improve overall energy efficiency, specifically in terms of electricity consumption, by reducing the unnecessary operation of a second compressor. Experimental results of the methodology reveal a 17% reduction in compressor electrical consumption and a remarkable 77% reduction in operation time. Six key steps to achieve energy efficiency for existing cooling systems were introduced in [112]: (i) analysis of the required cooling capacity, (ii) the assessment of thermal insulation needs, (iii) an evaluation of refrigerant distribution in the system, (iv) the assessment of control system equipment and heat rejection processes, (v) the optimization of maintenance, and (vi) the re-evaluation of the system performance. For new installations, the process involves (i) integrated system design, (ii) appropriate selection of the compressor, (iii) the selection of suitable evaporators and condensers, (iv) the identification of the optimal heat transfer fluids and refrigerant, and (v) reuse of waste heat.
When waste heat is present, an absorption chiller can be a viable alternative to meet the cooling requirements [107,117,118]. An absorption chiller uses an absorption fluid, typically a mixture of lithium bromide and water or ammonia and water, to produce chilled water at a temperature of approximately 7 °C when operated with a low-grade heat source like low-pressure steam. CO2 is a promising natural refrigerant due to its non-toxic, non-flammable, and cost-effective properties [119,120].
Heat and power technology—The viability of supporting combined heat and power (CHP) solutions depends on the readiness of individual industries. The literature extensively covers papers addressing diverse CHP systems deployed within the food industry sector. For instance, to provide the benefits deriving from a CHP system, a previous study [123] focused on a facility specialized in confectionery products, served by a combustion engine-based cogeneration unit, by comparing CHP based on a gas turbine and a steam power plant as alternatives, concluding that a 1.69 MW gas turbine would be the best alternative. Another study [124] was centered around the optimal design of a CHP unit for a frozen food processing factory, emphasizing the savings obtained compared to the standard method design. Other research [158] confirmed the potential of CHPs to noticeably decrease the environmental impact and energy costs in the citrus juice industry. The proposed syngas gasifier–ICE system exploiting citrus residues satisfies 88% of the electric request of the investigated juice plant, reducing the specific non-renewable energy consumptions and CO2 emissions by about 45%. Furthermore, it is essential to consider the potential for transforming waste mass flows into biofuels or synfuels as a means of energy recovery [125,126,127,128]. Through the gasification process, both cold (biogas, biomethane, and biohydrogen [129,159,160]) and hot (syngas [127,161]) forms of fuel can be produced from waste materials, offering great potential for energy generation within the circular economy and the waste-to-energy chain. Moreover, biofuels can be converted back into electricity and heat, restoring the valuable chemical energy contained within the waste.
Variable-speed drives—Variable-speed drives have great potential with energy savings of 30–70% [132,133,134]. Variable-speed drives have gained technical acceptance and economic viability in applications such as air blowers, fans, and pumps. In a specific case study explored in [135], variable-speed drives resulted in a remarkable 67% reduction in energy consumption and greenhouse gas (GHG) emissions. The investment in this project yielded a payback period of less than one year, demonstrating its rapid economic returns. Conversely, reciprocating compressors exhibited a significantly higher payback period, estimated at 6.2 years.
Regular maintenance operations reduce unnecessary energy and fuel consumption. Suggested measures involve the inspection of heat exchangers to prevent fouling, burner efficiency assessment, insulation improvement, the evaluation of leaks and pressure drops, checking filters, and addressing belt slippage.
4.2. Non-Thermal Technologies
Non-thermal technologies have also received significant attention in the reference literature [115,136,137,138,139]. They include high-pressure processing and microwave and ultrasound assistance [162]. High-pressure processing uses pressure levels up to 1000 MPa for sterilization and pasteurization without an external heat source. This technique retains more of the food’s original taste, texture, and nutrition than thermal treatment. Microwave assistance [163] can reduce drying time by 25–90%, increase the drying rate by 400–800%, and reduce energy consumption by 32–71%, among other benefits. Ultrasound assistance has also shown potential for reducing processing times, with reported reductions of up to 11.5%. Pulsed and high electric fields involve short-duration electric pulses. Although the specific electricity consumption is higher than other techniques, the total energy consumption decreases due to shorter processing times, less water usage, and lower raw material needs [164].
Another comprehensive review [140] explored the recent applications and mechanisms of non-thermal technologies in the food industry, shedding light on the potential prospects of combining these treatments in food processing.
Ultraviolet (UV) radiation—UV technology is increasingly recognized as a significant tool in food processing, primarily due to its efficacy in disinfection and preservation [165]. This technology operates on the scientific principle of using UV light, specifically UV-C radiation, to destroy microbial DNA, effectively inactivating bacteria, viruses, and other pathogens without chemical use. UV radiation treatment is particularly valued in the food industry because it can extend shelf life, enhance food safety, and maintain food products’ nutritional and sensory qualities. Commonly employed in water and surface purification, UV technology is also used for treating juices, meat products, dairy products, milk, other liquids, and fresh produce, ensuring they are free of harmful microorganisms. The benefits of UV radiation in food processing are manifold, including reduced reliance on chemical preservatives, lowered risk of foodborne illnesses, and compliance with stringent hygiene regulations. The food industry can achieve higher cleanliness and safety standards by integrating UV technology, improving consumer confidence and market competitiveness. UV light treatment is recognized as an environmentally friendly and cost-effective technology, offering low maintenance, installation, and operational costs.
Pulsed UV-light—This is a method for deactivating surface microorganisms using short bursts of intense broad-spectrum light in the 200 to 280 nm spectral range. Although each light pulse lasts only a fraction of a second, its intensity is 20,000 times greater than that of sunlight at sea level and contains ultraviolet light. Currently, the United States permits pulsed UV light technology adoption in food processing and packaging to eliminate microorganisms in various food types [141]. Many references in the literature highlight its efficacy in reducing bacterial agents such as penicillium roqueforti, listeria monocytogenes, salmonella, and other microorganisms [142,166].
Ultrasound systems—Ultrasound technology, particularly ultrasonic processing, is gaining prominence in the food industry due to its innovative application and efficacy in enhancing food quality and safety [167]. It induces mechanical vibrations in food materials. Ultrasound is particularly effective for its non-thermal processing capabilities, which means it can preserve the heat-sensitive nutrients and flavors in foods better than conventional methods. Ultrasound consists of mechanical waves with a frequency exceeding the threshold of human hearing, typically around 20 kHz. It can be categorized into three types: power ultrasound (16–100 kHz), high-frequency ultrasound (0.1–1 MHz), and diagnostic ultrasound (1–10 MHz). The cavitation induced by ultrasound can lead to a rapid increase in temperature, reaching up to 5500 °C, and a rise in pressure to approximately 50 MPa [168]. With their various conditions and frequencies, ultrasound systems offer a wide array of applications in the food industry. These include degassing, enhanced drying rates, defoaming, filtration, emulsification, food preservation through the inactivation of microorganisms and enzymes, and the extraction of active ingredients from food products. It is extensively used in beverages, dairy products, and fruit and vegetable extract processing, where it helps in the emulsification, homogenization, and acceleration of marination and brining processes. The benefits of ultrasonic technology in food processing include reduced processing times, lower energy consumption, minimal use of additives, and a reduction in the overall environmental footprint of food production. This technology meets the industry’s demand for resource-efficient and sustainable practices and caters to consumer preferences for natural and minimally processed foods.
Irradiation—Three types of ionizing radiation are authorized: high-energy gamma rays, X-rays, and accelerated electrons. Among these, the decontamination of spices, herbs, and condiments is the most significant application [143]. While irradiation technology is also effective for sterilization, its adoption in the food industry has been somewhat limited, primarily due to consumer concerns associating it with nuclear technology.
Cold plasma—Often referred to as the fourth state of matter, it is generated at or near room temperature and does not rely on thermal effects to eliminate pathogens. As a result, it does not compromise the quality of food products during treatment [169]. The primary objective of cold plasma application is the inactivation of microorganisms.
Pulsed Electric Field—This technology entails the application of high-voltage electrical pulses, typically with a field strength ranging from 20 to 80 kV·cm−1, to food products placed between two electrodes. This process occurs over a short duration, from several nanoseconds to several milliseconds, to prevent significant heating effects. PEF’s primary objective is the inactivation of microorganisms.
High hydrostatic pressure processing treatment—This technique relies on water as a medium for transmitting pressure to the food product. It effectively inactivates a wide spectrum of pathogens and spoilage organisms, including yeasts, molds, Gram-positive, and Gram-negative bacteria [144]. Typically, pressures from 300 to 900 MPa are applied for tens of seconds in food processing [145]. The primary mechanism responsible for the sterilization effect is the irreversible destruction of cellular structures. These non-thermal technologies can sometimes be combined for enhanced results [146].
4.3. Emerging Technologies
Currently, the agricultural and food sector stands at the threshold of harnessing cutting-edge machinery, tools, and emerging Information and Communication Technologies (ICTs), which encompass facets of the Internet of Things (IoT) [147,148,149,150,151]. In a comprehensive study conducted by Miranda et al. [151], the authors introduced and expounded upon the S3 framework in the context of the agri-food industry. This framework revolves around three fundamental components: “sensing”, “smart”, and “sustainable”. “Sensing” refers to the inherent capacity of a system to detect events, capture data, and gauge alterations within a physical environment. “Smart” embodies a system’s ability to encompass actuation and control functions, enabling it to characterize, analyze, and render decisions based on available data in both predictive and adaptive modes. Furthermore, it denotes the intelligence embedded within products and their potential for seamless connectivity with other devices. “Sustainability” is a pivotal consideration in optimizing product performance, all while upholding socio-economic and environmental imperatives. Measuring the energy performance of a facility is imperative for identifying interventions that promote sustainability [170].
Intelligent control can effectively manage numerous sub-systems and variables within the agricultural environment, adeptly regulating aeration, lighting, moisture, ventilation, and temperature. Smart decision system implementation optimizes the production process, achieving desired product quality and reducing energy and water consumption, among other advantages. In the same study, the authors propose an intelligent hydroponic greenhouse (IHG) that aligns with the principles of S3, with a particular focus on tomato cultivation.
The primary challenge in designing this system lies in determining the optimal physical infrastructure and control mechanisms for regulating the greenhouse’s climatic conditions. The IHG can monitor several environmental factors, including rainfall, wind direction, wind speed, humidity, CO2 levels, sun intensity, solar luminosity, and temperature. Consequently, it can uphold and maintain optimal conditions within the greenhouse to ensure the integrity of the crops.
Table 2 summarizes the applicability of the S3 concept to a hydroponic greenhouse, which can be extended to different agri-food contexts, emphasizing the associated benefits.
Table 2.
Applicability of the S3 concept to a hydroponic greenhouse (elaborated from [170]).
Unfortunately, the significant costs associated with implementing these emerging technologies pose a challenge, particularly for small and medium-sized enterprises. Recent literature has explored the integration of the Internet of Things (IoT) with energy efficiency through equipment upgrades. For instance, in a study highlighted in [152], a beverage factory adopted an IoT-integrated sensing solution that relied on the embodied product energy (EPE) model, categorizing energy into direct and indirect groups. This technology played a pivotal role in reducing energy consumption.
The data related to direct and indirect energy collected by these smart meters, which follow the EPE model, are wirelessly transmitted to a central database for storage. The resultant energy information, which is insightful and actionable, is presented to all employees with energy-related responsibilities through user-friendly dashboards. Armed with real-time data, the management could undertake energy-saving initiatives to prevent energy overuse. Among various outcomes, the monitoring revealed the need to replace old components with more efficient ones. Actions included replacing outdated boilers, upgrading lighting to LED systems, installing variable frequency drives (VFDs) in beverage filling pumps, replacing old electric motors with VFD-based ones, and converting the chiller plant into a humidification system. These interventions resulted in annual energy savings of 172,281 USD and a reduction of 807,081 kWh in electricity consumption.
Choi et al. proposed a systematic and practical framework to identify sustainable manufacturing practices focused on resource efficiency [153]. The aim was to assist small and medium-sized enterprises, and the study included an analysis of energy-saving case studies. According to data from the US Environmental Protection Agency (EPA), a centrifuge-type decanter adoption could reduce the water content of sludge by approximately 33%. By implementing this technology, the annual cost of sludge disposal in a manufacturing plant was projected to decrease by 28,565 USD, considering the disposal of 694 tons of sludge.
Another strategy for reducing both energy and water consumption involved implementing a counter-flow concept in the rinsing process. This modification can reduce annual rinse water consumption by about 3389 ccf (cubic feet) per year. At an estimated cost of 4 USD per ccf, this change resulted in annual savings of 13,555 USD, equivalent to roughly 15% of the plant’s annual water expenses.
The authors also presented a case study to exploit surplus wood generated during manufacturing, pelletizing the wood, producing energy for the company’s needs, and reducing the purchase of a significant amount of natural gas. With a payback period of 29 months, this initiative yielded an estimated annual savings of 12,729 USD. This approach involved reutilizing and reprocessing 12 tons of medium-density fiber waste per month.
4.4. Energy Efficiency Interventions in Italian Food Industries
In this section, the interventions of energy efficiency measures for some Italian food facilities are showcased and discussed.
The RSE report [171] provides a comprehensive analysis of energy efficiency measures implemented in Italian food sector production plants from 2005 to 2014. The study examines a range of case studies, highlighting various interventions to improve energy performance. Notably, approximately 22% of the interventions focused on heat recovery from thermal fluid systems, while 17.5% involved the installation of cogeneration systems. Another 5.8% focused on replacing traditional boilers with more efficient alternatives, and 5.1% focused on inverter adoption to regulate the electric power of motors and pumps. Additionally, energy management systems accounted for 5.1%, while 4.4% involved the replacement of conventional rotary compressors with more efficient models. Other actions included the replacement of ovens, chillers, and electric motors, each contributing between 2.2% and 4.4% of the total interventions.
When implementing additional interventions related to the thermal power plant, such as replacing traditional boilers with more efficient alternatives (accounting for 5.8% of achievements), supplying the thermal plant with biogas from anaerobic digestion (2.2%), and substituting fossil fuel boilers with biomass boilers (0.7%), the combined impact with cogeneration amounts to 26.2%. When coupled with the 26.3% contribution from heat recovery, these measures concentrate around the focal point of the factories’ thermal power stations, reaching 52.5% of implemented interventions. It is worth noting that despite the maturity of mechanical vapor recompression technology, its implementation is relatively limited, representing only 2.2% of cases.
The emerging observations about the adoption of innovative technologies in food manufacturing emphasize that these advancements are often perceived as costly and accessible primarily to large-scale production facilities. Many companies lacked the necessary expertise and infrastructure to conduct pre-competitive research and develop prototypes. Consequently, initiatives to support industrial innovation have predominantly targeted medium to large-sized enterprises.
As anticipated, two types of interventions, heat recovery and cogeneration, stand out. Cogeneration systems resulted in savings of approximately 30,000 tons of oil equivalent (toe) across 17 interventions, while heat recovery interventions from technical fluid yielded savings of 27,500 toe from 23 actions. All other actions achieved savings below 7 ktoe. Furthermore, a notable aspect is the average toe savings per intervention. Heat recovery activities demonstrate their effectiveness with savings of around 1700 toe and 1100 toe, respectively. Energy management systems have proven highly effective, delivering savings exceeding 4000 toe, and the installation of vapor compression concentration plants achieves approximately 3300 toe. The highest savings correspond to the implementation of new production lines, with approximately 5000 tons of oil equivalent per action. It is worth mentioning the noteworthy energy savings achieved through the construction of anaerobic digestion plants, which average around 1300 toe.
The RSE report [171] calculated the return on investment for efficiency measures, assuming an average cost of 600 € per toe saved. Based on the energy audits of large and energy-intensive companies, 8871 companies were eligible for energy efficiency measures. The manufacturing sector represented the majority among the previous macro-categories, with 644 food industries accounting for 12.6% and 97 beverage industries accounting for 1.8%. Table 3 provides an overview of the performed analyses. Approximately 2800 energy efficiency actions have a payback period of up to 30 years, while those with a payback period of less than 10 years, considered economically viable according to economic theory, amount to around 5275. These plans collectively result in energy savings of approximately 420,000 toe.
Table 3.
Energy efficiency measures for food industries in Italy.
Table 3 also shows data on the mean energy savings, quantified in tons of oil equivalent per intervention, and the mean investment outlay, measured in thousands of euros per action. These savings range from 87.68 to 166.55 k€ per intervention, underscoring that the beverage sector reaps higher benefits from energy efficiency measures.
Conversely, this sector requires a more substantial financial commitment to attain its objectives.
5. Food Towards Industry 5.0
The European Commission Information Society indicated the Internet of Things (IoT) in the food supply chain as a promising application [172]. IoT is a key technology that enables many beneficial applications for sustainability. It can inform consumers about the history [173,174] and can help managers make immediate decisions [4,91].
In 2011, the German government introduced the term “Industry 4.0”. The project aimed to boost the interactions among people, machines, and resources [175]. The main principle of Industry 4.0 was eliminating the separation between the physical and the virtual worlds. Industry 4.0 connects the machines, functions, and systems using intelligent networks created along the entire value chain that can control themselves and each other autonomously.
Technologies introduced by the concept of Industry 4.0, such as blockchain, big data analytics, and sensors, are indispensable partners of IoT [176]. These systems can play a role in the production, processing, transportation, storage, and distribution of the food supply chain and provide solutions to ensure food safety from farm to table.
The IoT is a dynamic global network infrastructure consisting of physical elements (e.g., sensors, actuators, controllers, data processors, and personal electronic devices) that are connected and can autonomously communicate with each other. This technology enables the real-time monitoring and control of many smart applications in various environments such as transportation, cities and buildings, grids for energy management, and medical and healthcare systems. IoT-based traceability systems can monitor all stages of production, distribution, and consumption processes and store all the relevant data.
Technological development and growing expectations, in terms of efficiency, safety, product traceability, reduction in passive costs, etc. are now and inevitably stretched out toward “Industry 5.0”, a new concept still evolving. Industry 5.0 aims to integrate human intelligence with the accuracy and efficiency of machines. The implementation of artificial intelligence in industrial production is designed to address the challenges encountered in Industry 4.0 by emphasizing a human-centric approach and meeting societal needs. It can help eliminate the mismatch between manufacturing and the needs of society [177,178].
Figure 10 summarizes the main sections intersecting and approximates the Food Industry 5.0: (1) data collection receiving signals; (2) data integration and storage (cloud-based platform); (3) data analysis and machine learning, with algorithms analyzing the data for patterns, anomalies, and insights, while predictive modeling and anomaly detection techniques are applied; (4) process optimization and automation, with systems driven by artificial intelligence and machine learning; (5) quality assurance and traceability, where sensors and IoT devices monitor product quality and safety parameters in real-time, machine learning algorithms identify quality issues and potential risks, and blockchain technology ensures traceability and authenticity; (6) supply chain management, where IoT devices monitor, track, and optimize inventory, storage conditions, and logistics in real-time; and (7) customer engagement and personalization, where data analysis enables personalized experiences and targeted marketing. Feedback loops and data-driven insights drive continuous improvement and innovation, opening collaborations between humans and machines.
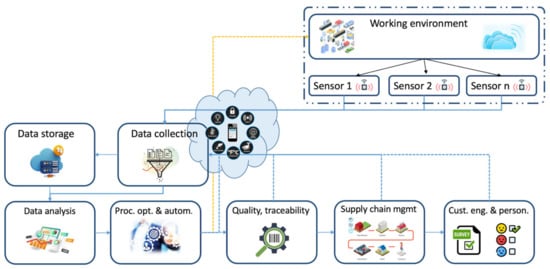
Figure 10.
Simplified block scheme of Food Industry 5.0.
6. Conclusions
This paper analyzed the food industry and the energy, social, and environmental dimensions, evaluating food trade, dietary habits, land usage, energy dynamics, food loss and waste, water withdrawal, and greenhouse gas emissions. The study also investigated strategies to reduce the food footprint in alignment with the United Nations Sustainable Development Goals.
The overview provided significant insights to assess the current state of play of the food industry, a pillar in the world economy. The global food trade generated revenues of 1 T$ in 2021. The global food sales see Europe as the first exporter and importer, with a volume of 450 and 520 USD billion, respectively, followed by Asia (250 and 400 USD billion) and the Americas (280 and 220 USD billion). The global daily average dietary energy supply has risen in recent years, reaching roughly 2960 kilocalories per person. North America and Europe report the highest levels of dietary energy, averaging about 3540 kilocalories per person per day, while Africa’s average is approximately 2600 kilocalories per person per day. The meat sector is a fundamental element in the food economy chain and is the largest industry group in the US food system. The dietary habits orchestrate food production and address land usage. The composition of the dietary energy supply varies significantly between the regions, but, on average, cereal-based food is the primary component, followed by oils and meat. Unhealthy diets produce more than 8000 USD billion of annual hidden costs, corresponding to about 70% of the total hidden costs of the global food system, considering visible and non-visible economic, health, social, and environmental expenses.
Today’s agricultural system is also incredibly resource intensive, covering about 43% of the world’s ice- and desert-free land. Of this land, approximately 87% is for food. The sole meat sector covers about 70% of land usage, where lamb and mutton meat involve about 375 m2 per kg of product, followed by beef with about 320 m2 per kg. Moreover, food loss and waste are of primary importance, posing significant challenges and contributing to various negative impacts such as food insecurity, particularly for vulnerable populations, an increased carbon footprint and water footprint, and additional land usage. Food loss corresponds to about 14–17% of global food production. Specifically, Europe experiences food waste of approximately 88 million tons each year.
GHG emissions from the food system have displayed a linear growth trend, reaching 16.6 GtCO2eq in 2015. If this trend persists, greenhouse gas emissions are estimated to reach 18.6 GtCO2eq in the upcoming years. The sector contributes 26% of all anthropogenic GHG emissions, with 6% attributable to never-consumed food. This investigation demonstrated that the most developed continents are the principal contributors, with China emerging as the largest producer, accounting for 13.5% of emissions, followed by Indonesia (8.8%), the USA (8.2%), and Brazil (7.4%). In this framework, agriculture and land use change contribute to 78% of emissions, while food manufacturing, processing, packaging, transporting, and retailing correspond to 19%. The phases strictly linked to food processing cover 10% of GHG. To address the challenge of climate change, a path for minimizing GHG to 4 Gt by 2050 is explored. This path is rather challenging and would require interconnected efforts to reach a reduction of at least 9 GtCO2eq. Reducing food loss and waste by half across the supply chain stages could reduce the overall environmental footprint by 8–10%. Numerous studies even highlight the significance of adopting healthier dietary habits. A shift in diet could enable 56.9% of the global population, currently over-consuming, to reduce global emissions by 32.4%.
The water footprint was investigated contextually, analyzing ramifications per food phases, sectors, and regions. In 2014, global water withdrawal was at over 4000 billion cubic meters. However, this figure has experienced a slight decline in subsequent years, mainly due to awareness initiatives and the implementation of efficient technologies. By 2020, water withdrawal decreased to 3900 billion cubic meters. Agriculture is the primary water consumer, constituting 70%, and the industrial sector follows at 19% (the energy phase absorbs 13% of the total water). The more water-intensive food sectors are meat and fresh vegetables, with 20% and 21%, respectively. Critical analyses forecast that the global water demand for all uses is expected to increase by 20% to 30%, reaching between 5500 and 6000 km3 annually by 2050. Specifically, water demand in agriculture is projected to surge by 60%.
The investigation demonstrated that the food system is one of the largest energy consumers worldwide, accounting for approximately 30% of the total energy consumption (200 EJ per year, with 10–15 kJ of fossil fuel required to produce 1 kJ of food). Agriculture and industrial processing represent the most energy-intensive steps, with 3662 MJ/capita and 2754 MJ/capita, respectively. The food system remains heavily dependent on fossil fuels, especially during the agricultural phase, with use approximately 9 to 10 times greater than other energy sources. In the industrial phase, this difference reduces, and fossil fuel requests are about 2 to 3 times that of alternative energy sources. Energy costs represent a significant financial burden for the food industry. By implementing energy-conserving strategies, the industry can reduce expenses and lessen its ecological and hydrological footprints. This insight opens up the urgent need to optimize process and machine efficiency and shift to renewable sources. For this purpose, this paper reviewed several energy efficiency solutions, including conventional and innovative technologies, in which the non-thermal solutions are gaining interest.
This proposal highlights the potential of conventional solutions, like boiler and steam distribution optimization, condensing economizers adoption, waste heat recovery, heat pump use, and refrigeration system improvements, to significantly decrease energy consumption by up to 20% with attractive payback periods. Developing innovative food preservation methods that minimize ecological impacts and waste generation is crucial and offers a key strategy for reducing the energy footprint. The reclamation of waste materials and surplus energy resources, where feasible, can lead to significant energy savings. Moreover, optimizing energy-intensive drying processes by utilizing external air and integrating desiccants or absorbent materials into the system can enhance efficiency. Some research suggests that management initiatives have the potential to unlock more than 46% of total potential savings. Referring to energy interventions carried out on various food facilities distributed in Italy, despite an expense of 84–161 k€ per intervention, it was possible to obtain savings of 61–166 toe per intervention, with payback times of 3–30 years.
The food industry is also embracing a new period of innovation, with non-conventional solutions like pulsed UV-light, ultrasound, ionizing radiation, cold plasma, pulsed electric field, and high hydrostatic pressure gaining prominence. IoT integration and the advent of Industry 5.0 promise to improve food processing and preservation.
Conclusive Remarks and Policy Recommendations
A robust collaboration between governments, policymakers, businesses, scientists, technicians, and consumers is essential to drive the global food system toward sustainable, resilient, and equitable solutions to remove social and economic disparities, promote fair labor, and provide secure access to healthy food, especially for vulnerable populations.
Comprehensive policy recommendations must be implemented to effectively enhance food security and improve the efficiency of the entire supply chain while simultaneously reducing environmental footprints and associated greenhouse gas (GHG) emissions. Firstly, policies should prioritize sustainable agricultural practices, promoting techniques such as precision agriculture to optimize resource use and minimize waste. Additionally, governments should incentivize the adoption of renewable energy sources within the agricultural sector to decrease reliance on fossil fuels and reduce GHG emissions. Strengthening regulations on water usage and implementing advanced water management systems can drastically reduce water wastage and address the water footprint issue. Furthermore, policies to reduce food loss and waste should be enforced throughout the supply chain—from production to consumption—through educational campaigns, improved food storage and transportation infrastructures, and stricter standards for sell-by dates and food labeling. Healthier dietary habits promote personal well-being and food efficiency, significantly mitigating GHG emissions. Research indicates that diets rich in plant-based foods and lower in processed foods and red meats can lead to more sustainable food systems. Such dietary shifts reduce the strain on environmental resources by decreasing the demand for water-intensive and high-emission food production. Finally, fostering collaboration among stakeholders in the food system through public–private partnerships can facilitate best-practices sharing and innovations in sustainable food production and distribution.
Author Contributions
conceptualization, O.C. and A.A.; methodology, O.C. and A.A.; software, O.C. and A.A.; validation, O.C. and A.A.; formal analysis, O.C. and A.A.; investigation, O.C. and A.A.; resources, A.A.; data curation, O.C., P.M., and A.A.; writing—original draft preparation, O.C., P.M. and A.A.; writing—review and editing, O.C., P.M. and A.A.; visualization, O.C. and A.A.; supervision, A.A.; project administration, A.A.; funding acquisition, A.A. All authors have read and agreed to the published version of the manuscript.
Funding
This research was funded by the Next Generation EU - Italian National Recovery and Resilience Plan (NRRP), Mission 4, Component 2, Investment 1.5, call for the creation and strengthening of “Innovation Ecosystems”, building “Territorial R&D Leaders” (Directorial Decree n. 2021/3277) - project “Tech4You—Technologies for climate change adaptation and quality of life improvement” n. ECS0000009 (CUP H23C22000370006).
Data Availability Statement
The original contributions presented in this study are included in the article. Further inquiries can be directed to the corresponding author(s).
Conflicts of Interest
The authors declare no conflicts of interest.
References
- European Commission Farm to Fork Strategy. For a Fair, Healthy and Environmentally-Friendly Food System; European Commission: Brussels, Belgium, 2020. [Google Scholar]
- Council of the European. Union European Council, Fit to 55, 2021. Available online: https://www.consilium.europa.eu/en/policies/fit-for-55/ (accessed on 7 November 2024).
- European Commission. Proposal for a Directive of the European Parliament and of the Council on Energy Efficiency; European Commission: Brussels, Belgium, 2021; COM/2021/558. [Google Scholar]
- Misra, N.N.; Dixit, Y.; Al-Mallahi, A.; Bhullar, M.S.; Upadhyay, R.; Martynenko, A. IoT, Big Data, and Artificial Intelligence in Agriculture and Food Industry. IEEE Internet Things J. 2022, 9, 6305–6324. [Google Scholar] [CrossRef]
- Eičaitė, O.; Baležentis, T.; Ribašauskienė, E.; Morkūnas, M.; Melnikienė, R.; Štreimikienė, D. Exploring Food Loss in the Food Industry: A Survey-Based Approach for Lithuania. J. Clean. Prod. 2023, 399, 136668. [Google Scholar] [CrossRef]
- Poore, J.; Nemecek, T. Reducing Food’s Environmental Impacts through Producers and Consumers. Science 2018, 360, 987–992. [Google Scholar] [CrossRef]
- Searchinger, T.; Waite, R.; Hanson, C.; Ranganathan, J. Creating a Sustainable Food Future: A Menu of Solutions to Feed Nearly 10 Billion People by 2050; World Resources Institute: Washington, DC, USA, 2018. [Google Scholar]
- Crippa, M.; Solazzo, E.; Guizzardi, D.; Monforti-Ferrario, F.; Tubiello, F.N.; Leip, A. Food Systems Are Responsible for a Third of Global Anthropogenic GHG Emissions. Nat. Food 2021, 2, 198–209. [Google Scholar] [CrossRef] [PubMed]
- One Planet Network Report on SDG 12. Available online: https://www.oneplanetnetwork.org/sdg-12-hub/report-on-sdg-12 (accessed on 15 February 2024).
- Ercin, A.E.; Hoekstra, A.Y. Water Footprint Scenarios for 2050: A Global Analysis. Environ. Int. 2014, 64, 71–82. [Google Scholar] [CrossRef] [PubMed]
- Szymańska, E.J.; Mroczek, R. Energy Intensity of Food Industry Production in Poland in the Process of Energy Transformation. Energies 2023, 16, 1843. [Google Scholar] [CrossRef]
- Sovacool, B.K.; Bazilian, M.; Griffiths, S.; Kim, J.; Foley, A.; Rooney, D. Decarbonizing the Food and Beverages Industry: A Critical and Systematic Review of Developments, Sociotechnical Systems and Policy Options. Renew. Sustain. Energy Rev. 2021, 143, 110856. [Google Scholar] [CrossRef]
- Renewable Energy and Agri-Food Systems: Advancing Energy and Food Security towards Sustainable Development Goals; IRENA: Abu Dhabi, United Arab Emirates; FAO: Rome, Italy, 2021; ISBN 978-92-5-135235-9.
- Ladha-Sabur, A.; Bakalis, S.; Fryer, P.J.; Lopez-Quiroga, E. Mapping Energy Consumption in Food Manufacturing. Trends Food Sci. Technol. 2019, 86, 270–280. [Google Scholar] [CrossRef]
- U. S. Energy Information Administration International. Energy Outlook Executive Summary; U.S. Department of Energy: Washington, DC, USA, 2017. [Google Scholar]
- Panigrahi, S.S.; Luthra, K.; Singh, C.B.; Atungulu, G.; Corscadden, K. On-Farm Grain Drying System Sustainability: Current Energy and Carbon Footprint Assessment with Potential Reform Measures. Sustain. Energy Technol. Assess. 2023, 60, 103430. [Google Scholar] [CrossRef]
- Christiansen, K.L.; Lund, J.F. Seeing the Limits of Voluntary Corporate Climate Action in Food and Technology Sustainability Reports. Energy Res. Soc. Sci. 2024, 118, 103798. [Google Scholar] [CrossRef]
- Shah, W.U.H.; Hao, G.; Yan, H.; Zhu, N.; Yasmeen, R.; Dincă, G. Role of Renewable, Non-Renewable Energy Consumption and Carbon Emission in Energy Efficiency and Productivity Change: Evidence from G20 Economies. Geosci. Front. 2024, 15, 101631. [Google Scholar] [CrossRef]
- Favi, S.G.; Adamou, R.; Godjo, T.; Giri, N.C.; Kuleape, R.; Trommsdorff, M. Agrivoltaic Systems Offer Symbiotic Benefits across the Water-Energy-Food-Environment Nexus in West Africa: A Systematic Review. Energy Res. Soc. Sci. 2024, 117, 103737. [Google Scholar] [CrossRef]
- Dawkins, E.; Strambo, C.; Xylia, M.; Grah, R.; Gong, J.; Axelsson, K.; Maltais, A. Who Is Most at Risk of Losing out from Low-Carbon Transition in the Food and Transport Sectors in Sweden? Equity Considerations from a Consumption Perspective. Energy Res. Soc. Sci. 2023, 95, 102881. [Google Scholar] [CrossRef]
- Department of Economic and Social Affairs. Sustainable Development THE 17 GOALS. Available online: https://sdgs.un.org/goals (accessed on 5 September 2024).
- World Food and Agriculture. Statistical Yearbook 2022; FAO: Rome, Italy, 2022; ISBN 978-92-5-136930-2. [Google Scholar]
- Floress, K.; Shwom, R.; Caggiano, H.; Slattery, J.; Cuite, C.; Schelly, C.; Halvorsen, K.E.; Lytle, W. Habitual Food, Energy, and Water Consumption Behaviors among Adults in the United States: Comparing Models of Values, Norms, and Identity. Energy Res. Soc. Sci. 2022, 85, 102396. [Google Scholar] [CrossRef]
- World Food and Agriculture. Statistical Yearbook 2023; FAO: Rome, Italy, 2023; ISBN 978-92-5-138262-2. [Google Scholar]
- The State of Food and Agriculture 2024; FAO: Rome, Italy, 2024; ISBN 978-92-5-139140-2.
- Hoolohan, C.; McLachlan, C.; Mander, S. Food Related Routines and Energy Policy: A Focus Group Study Examining Potential for Change in the United Kingdom. Energy Res. Soc. Sci. 2018, 39, 93–102. [Google Scholar] [CrossRef]
- Food and Agriculture. Organization of the United Nations Food Loss and Waste Database. Available online: https://www.fao.org/platform-food-loss-waste/flw-data/en/ (accessed on 2 January 2025).
- Enabling a Legal Environment for the Prevention and Reduction of Food Loss and Waste; FAO: Rome, Italy, 2022. ISBN 978-92-5-136955-5.
- Mc Carthy, U.; Uysal, I.; Badia-Melis, R.; Mercier, S.; O’Donnell, C.; Ktenioudaki, A. Global Food Security—Issues, Challenges and Technological Solutions. Trends Food Sci. Technol. 2018, 77, 11–20. [Google Scholar] [CrossRef]
- Kummu, M.; de Moel, H.; Porkka, M.; Siebert, S.; Varis, O.; Ward, P.J. Lost Food, Wasted Resources: Global Food Supply Chain Losses and Their Impacts on Freshwater, Cropland, and Fertiliser Use. Sci. Total Environ. 2012, 438, 477–489. [Google Scholar] [CrossRef] [PubMed]
- Hoehn, D.; Margallo, M.; Laso, J.; Fernández-Ríos, A.; Ruiz-Salmón, I.; Aldaco, R. Energy Systems in the Food Supply Chain and in the Food Loss and Waste Valorization Processes: A Systematic Review. Energies 2022, 15, 2234. [Google Scholar] [CrossRef]
- Shabir, I.; Dash, K.K.; Dar, A.H.; Pandey, V.K.; Fayaz, U.; Srivastava, S.; R, N. Carbon Footprints Evaluation for Sustainable Food Processing System Development: A Comprehensive Review. Future Foods 2023, 7, 100215. [Google Scholar] [CrossRef]
- Beretta, C.; Hellweg, S. Potential Environmental Benefits from Food Waste Prevention in the Food Service Sector. Resour. Conserv. Recycl. 2019, 147, 169–178. [Google Scholar] [CrossRef]
- Qin, Z.-H.; Fridrihsone, A.; Dong, L.; Mou, J.-H.; Miao, Y.; Zhang, L.; Xu, C.; Kirpluks, M.; Lin, C.S.K. Environmental Benefits of Valorising Food Waste into Bio-Based Polyols for the Production of Polyurethane Rigid Foams. Sustain. Prod. Consum. 2024, 51, 572–583. [Google Scholar] [CrossRef]
- Melikoglu, M. Appraising Food Waste Generation and Forecasting Food Waste to Energy Potentials of Hospitals in Turkey: A Global to Local Analysis. Sustain. Prod. Consum. 2020, 24, 292–297. [Google Scholar] [CrossRef]
- FAO. Greenhouse Gas Emissions from Agrifood Systems. Available online: https://www.fao.org/faostat/en/#data/GT/visualize (accessed on 23 September 2024).
- Read, Q.D.; Brown, S.; Cuéllar, A.D.; Finn, S.M.; Gephart, J.A.; Marston, L.T.; Meyer, E.; Weitz, K.A.; Muth, M.K. Assessing the Environmental Impacts of Halving Food Loss and Waste along the Food Supply Chain. Sci. Total Environ. 2020, 712, 136255. [Google Scholar] [CrossRef] [PubMed]
- Agbelusi, J.; Arowosegbe, O.B.; Alomaja, O.A.; Odunfa, O.A.; Ballali, C. Strategies for Minimizing Carbon Footprint in the Agricultural Supply Chain: Leveraging Sustainable Practices and Emerging Technologies. World J. Adv. Res. Rev. 2024, 23, 2625–2646. [Google Scholar] [CrossRef]
- Parashar, S.; Sood, G.; Agrawal, N. Modelling the Enablers of Food Supply Chain for Reduction in Carbon Footprint. J. Clean. Prod. 2020, 275, 122932. [Google Scholar] [CrossRef]
- Li, Y.; He, P.; Shan, Y.; Li, Y.; Hang, Y.; Shao, S.; Ruzzenenti, F.; Hubacek, K. Reducing Climate Change Impacts from the Global Food System through Diet Shifts. Nat. Clim. Change 2024, 14, 943–953. [Google Scholar] [CrossRef]
- Islam, K.M.N.; Kenway, S.J.; Renouf, M.A.; Lam, K.L.; Wiedmann, T. A Review of the Water-Related Energy Consumption of the Food System in Nexus Studies. J. Clean. Prod. 2021, 279, 123414. [Google Scholar] [CrossRef]
- Muller, D.C.A.; Marechal, F.M.A.; Wolewinski, T.; Roux, P.J. An Energy Management Method for the Food Industry. Appl. Therm. Eng. 2007, 27, 2677–2686. [Google Scholar] [CrossRef]
- Corigliano, O.; Algieri, A. A Comprehensive Investigation on Energy Consumptions, Impacts, and Challenges of the Food Industry. Energy Convers. Manag. X 2024, 23, 100661. [Google Scholar] [CrossRef]
- Monforti-Ferrario, F.; Dallemand, J.; Pinedo Pascua, I.; Motola, V.; Banja, M.; Scarlat, N.; Medarac, H.; Castellazzi, L.; Labanca, N.; Bertoldi, P.; et al. Energy Use in the EU Food Sector—State of Play and Opportunities for Improvement; Publications Office: Luxembourg, 2015. [Google Scholar]
- Granit, I. Microgrids through the Energy-Water-Food Security Nexus in La Guajira, Colombia: Increasing Water and Food Security or Jeopardizing Groundwater Levels? Energy Res. Soc. Sci. 2022, 93, 102814. [Google Scholar] [CrossRef]
- Simpson, G.B.; Jewitt, G.P.W. The Development of the Water-Energy-Food Nexus as a Framework for Achieving Resource Security: A Review. Front. Environ. Sci. 2019, 7, 8. [Google Scholar] [CrossRef]
- Benson, D.; Gain, A.K.; Rouillard, J.J. Water Governance in a Comparative Perspective: From IWRM to a “Nexus” Approach? Water Altern. 2015, 8, 753–773. [Google Scholar]
- Al-Saidi, M.; Elagib, N.A. Towards Understanding the Integrative Approach of the Water, Energy and Food Nexus. Sci. Total Environ. 2017, 574, 1131–1139. [Google Scholar] [CrossRef]
- Pahl-Wostl, C. Governance of the Water-Energy-Food Security Nexus: A Multi-Level Coordination Challenge. Environ. Sci. Policy 2019, 92, 356–367. [Google Scholar] [CrossRef]
- Bonn 2011 Conference: The Water Energy and Food Security Nexus—Solutions for the Green Economy. Available online: https://sdg.iisd.org/events/bonn-2011-conference/ (accessed on 2 January 2025).
- Wichelns, D. The Water-Energy-Food Nexus: Is the Increasing Attention Warranted, from Either a Research or Policy Perspective? Environ. Sci. Policy 2017, 69, 113–123. [Google Scholar] [CrossRef]
- Gallagher, L.; Dalton, J.; Bréthaut, C.; Allan, T.; Bellfield, H.; Crilly, D.; Cross, K.; Gyawali, D.; Klein, D.; Laine, S.; et al. The Critical Role of Risk in Setting Directions for Water, Food and Energy Policy and Research. Curr. Opin. Environ. Sustain. 2016, 23, 12–16. [Google Scholar] [CrossRef]
- Peña-Torres, D.; Boix, M.; Montastruc, L. Optimization Approaches to Design Water-Energy-Food Nexus: A Litterature Review. Comput. Chem. Eng. 2022, 167, 108025. [Google Scholar] [CrossRef]
- Finley, J.W.; Seiber, J.N. The Nexus of Food, Energy, and Water. J. Agric. Food Chem. 2014, 62, 6255–6262. [Google Scholar] [CrossRef]
- Sušnik, J. Data-Driven Quantification of the Global Water-Energy-Food System. Resour. Conserv. Recycl. 2018, 133, 179–190. [Google Scholar] [CrossRef]
- Hoekstra, A.Y.; Hung, P.Q. Virtual Water Trade: A Quantification of Virtual Water Flows between Nations in Relation to International Crop Trade. In Value of Water Research Report No. 11; IHE: Delft, The Netherlands, 2002. [Google Scholar]
- Ringler, C.; Agbonlahor, M.; Barron, J.; Baye, K.; Meenakshi, J.V.; Mekonnen, D.K.; Uhlenbrook, S. The Role of Water in Transforming Food Systems. Glob. Food Sec. 2022, 33, 100639. [Google Scholar] [CrossRef]
- The State of Food and Agriculture 2020. FAO: Rome, Italy, 2020; ISBN 978-92-5-133441-6.
- HLPE Report 9 Water for Food Security and Nutrition. A Report by the High Level Panel of Experts on Food Security and Nutrition of the Committee on World Food Security; FAO: Rome, Italy, 2015. [Google Scholar]
- World Development Indicators. World Development Indicators. Available online: https://datacatalog.worldbank.org/search/dataset/0037712/World-Development-Indicators (accessed on 24 September 2024).
- FAO & WWC. Towards a Water and Food Secure Future. Critical Perspectives for Policy-Makers; FAO: Rome, Italy; WWC: Marseille, France, 2015. [Google Scholar]
- Mancosu, N.; Snyder, R.; Kyriakakis, G.; Spano, D. Water Scarcity and Future Challenges for Food Production. Water 2015, 7, 975–992. [Google Scholar] [CrossRef]
- Food and Agriculture Organization of the United Nations. AQUASTAT—FAO’s Global Information System on Water and Agriculture. Available online: https://www.fao.org/aquastat/en/overview/methodology/water-use (accessed on 16 November 2023).
- Statista Total Water Withdrawals Worldwide in 2020, by Region. Available online: https://www.statista.com/statistics/688173/global-water-withdrawals-by-region/#:~:text=Total%20water%20withdrawals%20worldwide%202020%2C%20by%20region&text=Asia%20records%20by%20far%20the,billion%20cubic%20meters%20in%202020 (accessed on 16 November 2023).
- Boretti, A.; Rosa, L. Reassessing the Projections of the World Water Development Report. NPJ Clean Water 2019, 2, 15. [Google Scholar] [CrossRef]
- Mekonnen, M.M.; Hoekstra, A.Y. National Water Footprint Accounts: The Green, Blue and Gray Water Footprint of Production and Consumption. In Value of Water Research Report Series No. 50; IHE: Delft, The Netherlands, 2011. [Google Scholar]
- Rehkamp, S.; Canning, P.; Birney, C. Tracking the U.S. Domestic Food Supply Chain’s Freshwater Use Over Time; USDA ERS: Washington DC, USA, 2021. [Google Scholar]
- Mubako, S.T. Blue, Green, and Grey Water Quantification Approaches: A Bibliometric and Literature Review. J. Contemp. Water Res. Educ. 2018, 165, 4–19. [Google Scholar] [CrossRef]
- Ridoutt, B.; Sanguansri, P.; Bonney, L.; Crimp, S.; Lewis, G.; Lim-Camacho, L. Climate Change Adaptation Strategy in the Food Industry—Insights from Product Carbon and Water Footprints. Climate 2016, 4, 26. [Google Scholar] [CrossRef]
- Souissi, A.; Mtimet, N.; Thabet, C.; Stambouli, T.; Chebil, A. Impact of Food Consumption on Water Footprint and Food Security in Tunisia. Food Secur. 2019, 11, 989–1008. [Google Scholar] [CrossRef]
- Vanham, D. Does the Water Footprint Concept Provide Relevant Information to Address the Water–Food–Energy–Ecosystem Nexus? Ecosyst. Serv. 2016, 17, 298–307. [Google Scholar] [CrossRef]
- Vanham, D.; Bidoglio, G. A Review on the Indicator Water Footprint for the EU28. Ecol. Indic. 2013, 26, 61–75. [Google Scholar] [CrossRef]
- Fresán, U.; Marrin, D.; Mejia, M.; Sabaté, J. Water Footprint of Meat Analogs: Selected Indicators According to Life Cycle Assessment. Water 2019, 11, 728. [Google Scholar] [CrossRef]
- Zhang, Y.; Tian, Q.; Hu, H.; Yu, M. Water Footprint of Food Consumption by Chinese Residents. Int. J. Environ. Res. Public Health 2019, 16, 3979. [Google Scholar] [CrossRef] [PubMed]
- Gerbens-Leenes, P.W.; Mekonnen, M.M.; Hoekstra, A.Y. The Water Footprint of Poultry, Pork and Beef: A Comparative Study in Different Countries and Production Systems. Water Resour. Ind. 2013, 1–2, 25–36. [Google Scholar] [CrossRef]
- Obaideen, K.; Shehata, N.; Sayed, E.T.; Abdelkareem, M.A.; Mahmoud, M.S.; Olabi, A.G. The Role of Wastewater Treatment in Achieving Sustainable Development Goals (SDGs) and Sustainability Guideline. Energy Nexus 2022, 7, 100112. [Google Scholar] [CrossRef]
- Shrivastava, V.; Ali, I.; Marjub, M.M.; Rene, E.R.; Soto, A.M.F. Wastewater in the Food Industry: Treatment Technologies and Reuse Potential. Chemosphere 2022, 293, 133553. [Google Scholar] [CrossRef]
- Stachurski, A.; Delgorge, F.; Muszyński, A. Water Reuse from Wastewater: Experiences and Challenges of Implementing a Full-Scale Water Reuse System in a Food Industry Plant. J. Water Process Eng. 2024, 59, 104994. [Google Scholar] [CrossRef]
- Bailone, R.L.; Borra, R.C.; Fukushima, H.C.S.; Aguiar, L.K. Water Reuse in the Food Industry. Discov. Food 2022, 2, 5. [Google Scholar] [CrossRef]
- Song, G.; Han, Y.; Li, J.; Lv, D. The Potential Water-Food-Health Nexus in Urban China: A Comparative Study on Dietary Changes at Home and Away from Home. Sci. Total Environ. 2019, 657, 1173–1182. [Google Scholar] [CrossRef]
- Hoekstra, A.Y. The Water Footprint of Modern Consumer Society; Routledge: London, UK, 2019.
- Kim, B.F.; Santo, R.E.; Scatterday, A.P.; Fry, J.P.; Synk, C.M.; Cebron, S.R.; Mekonnen, M.M.; Hoekstra, A.Y.; de Pee, S.; Bloem, M.W.; et al. Country-Specific Dietary Shifts to Mitigate Climate and Water Crises. Glob. Environ. Change 2020, 62, 101926. [Google Scholar] [CrossRef]
- Mekonnen, M.M.; Fulton, J. The Effect of Diet Changes and Food Loss Reduction in Reducing the Water Footprint of an Average American. Water Int. 2018, 43, 860–870. [Google Scholar] [CrossRef]
- Huang, Z.; Hejazi, M.; Tang, Q.; Vernon, C.R.; Liu, Y.; Chen, M.; Calvin, K. Global Agricultural Green and Blue Water Consumption under Future Climate and Land Use Changes. J. Hydrol. 2019, 574, 242–256. [Google Scholar] [CrossRef]
- Mekonnen, M.M.; Gerbens-Leenes, W. The Water Footprint of Global Food Production. Water 2020, 12, 2696. [Google Scholar] [CrossRef]
- Lowe, B.; Oglethorpe, D.; Choudhary, S. Marrying Unmarried Literatures: The Water Footprint and Environmental (Economic) Valuation. Water 2018, 10, 1815. [Google Scholar] [CrossRef]
- Kim, J.; Sovacool, B.K.; Bazilian, M.; Griffiths, S.; Yang, M. Energy, Material, and Resource Efficiency for Industrial Decarbonization: A Systematic Review of Sociotechnical Systems, Technological Innovations, and Policy Options. Energy Res. Soc. Sci. 2024, 112, 103521. [Google Scholar] [CrossRef]
- Ullah, K.R.; Thirugnanasambandam, M.; Saidur, R.; Rahman, K.A.; Kayser, M.R. Analysis of Energy Use and Energy Savings: A Case Study of a Condiment Industry in India. Energies 2021, 14, 4798. [Google Scholar] [CrossRef]
- Commission, E.; Centre, J.R.; Giner Santonja, G.; Brinkmann, T.; Raunkjær Stubdrup, K.; Karlis, P.; Roudier, S. Best Available Techniques (BAT) Reference Document for the Food, Drink and Milk Industries—Industrial Emissions Directive 2010/75/EU (Integrated Pollution Prevention and Control); Publications Office: Luxembourg, 2019. [Google Scholar]
- Clairand, J.-M.; Briceno-Leon, M.; Escriva-Escriva, G.; Pantaleo, A.M. Review of Energy Efficiency Technologies in the Food Industry: Trends, Barriers, and Opportunities. IEEE Access 2020, 8, 48015–48029. [Google Scholar] [CrossRef]
- Roy, P.; Mohanty, A.K.; Dick, P.; Misra, M. A Review on the Challenges and Choices for Food Waste Valorization: Environmental and Economic Impacts. ACS Environ. Au 2023, 3, 58–75. [Google Scholar] [CrossRef]
- Sridhar, A.; Ponnuchamy, M.; Kumar, P.S.; Kapoor, A. Food Preservation Techniques and Nanotechnology for Increased Shelf Life of Fruits, Vegetables, Beverages and Spices: A Review. Environ. Chem. Lett. 2021, 19, 1715–1735. [Google Scholar] [CrossRef]
- Papaioannou, E.H.; Mazzei, R.; Bazzarelli, F.; Piacentini, E.; Giannakopoulos, V.; Roberts, M.R.; Giorno, L. Agri-Food Industry Waste as Resource of Chemicals: The Role of Membrane Technology in Their Sustainable Recycling. Sustainability 2022, 14, 1483. [Google Scholar] [CrossRef]
- Khedkar, R.; Singh, K. Food Industry Waste: A Panacea or Pollution Hazard? In Paradigms in Pollution Prevention; Jindal, T., Ed.; Springer: Cham, Switzerland, 2018; pp. 35–47. [Google Scholar]
- Ware, A.; Power, N. Biogas from Cattle Slaughterhouse Waste: Energy Recovery towards an Energy Self-Sufficient Industry in Ireland. Renew. Energy 2016, 97, 541–549. [Google Scholar] [CrossRef]
- Caton, P.A.; Carr, M.A.; Kim, S.S.; Beautyman, M.J. Energy Recovery from Waste Food by Combustion or Gasification with the Potential for Regenerative Dehydration: A Case Study. Energy Convers. Manag. 2010, 51, 1157–1169. [Google Scholar] [CrossRef]
- Pleissner, D. Recycling and Reuse of Food Waste. Curr. Opin. Green. Sustain. Chem. 2018, 13, 39–43. [Google Scholar] [CrossRef]
- Compton, M.; Willis, S.; Rezaie, B.; Humes, K. Food Processing Industry Energy and Water Consumption in the Pacific Northwest. Innov. Food Sci. Emerg. Technol. 2018, 47, 371–383. [Google Scholar] [CrossRef]
- Al Momani, D.; Al Turk, Y.; Abuashour, M.I.; Khalid, H.M.; Muyeen, S.M.; Sweidan, T.O.; Said, Z.; Hasanuzzaman, M. Energy Saving Potential Analysis Applying Factory Scale Energy Audit—A Case Study of Food Production. Heliyon 2023, 9, e14216. [Google Scholar] [CrossRef] [PubMed]
- Joshi, P.M.; Shinde, S.T.; Chaudhary, K. A Case Study on Assessment Performance and Energy Efficient Recommendations for Industrial Boiler. Int. J. Res. Rev. 2021, 8, 61–69. [Google Scholar] [CrossRef]
- Advanced Manufacturing Office. Consider Installing a Condensing Economizer; NREL: Washington, DC, USA, 2012. [Google Scholar]
- Celep, G.K.; Rusen, S.E. Application Of Economizer For Waste Heat Recovery From Exhaust Flue Gas In Steam Boiler: A Case Study In A Biscuit Factory; In Proceedings of the 4th International Symposium on Innovative Technologies in Engineering and Science (ISITES2016), 3–5 November 2016, Alanya/Antalya, Turkey.
- Christodoulides, P.; Agathokleous, R.; Aresti, L.; Kalogirou, S.A.; Tassou, S.A.; Florides, G.A. Waste Heat Recovery Technologies Revisited with Emphasis on New Solutions, Including Heat Pipes, and Case Studies. Energies 2022, 15, 384. [Google Scholar] [CrossRef]
- Jouhara, H.; Khordehgah, N.; Almahmoud, S.; Delpech, B.; Chauhan, A.; Tassou, S.A. Waste Heat Recovery Technologies and Applications. Therm. Sci. Eng. Prog. 2018, 6, 268–289. [Google Scholar] [CrossRef]
- Woolley, E.; Luo, Y.; Simeone, A. Industrial Waste Heat Recovery: A Systematic Approach. Sustain. Energy Technol. Assess. 2018, 29, 50–59. [Google Scholar] [CrossRef]
- Luo, Y.; Jagtap, S.; Trollman, H.; Garcia-Garcia, G. A Framework for Recovering Waste Heat Energy from Food Processing Effluent. Water 2022, 15, 12. [Google Scholar] [CrossRef]
- Ononogbo, C.; Nwosu, E.C.; Nwakuba, N.R.; Nwaji, G.N.; Nwufo, O.C.; Chukwuezie, O.C.; Chukwu, M.M.; Anyanwu, E.E. Opportunities of Waste Heat Recovery from Various Sources: Review of Technologies and Implementation. Heliyon 2023, 9, e13590. [Google Scholar] [CrossRef] [PubMed]
- Taingaoson, Y.; Khongkrapan, P.; Tippayawong, N. Energy Efficiency Enhancement of a Hot Air Food Dryer with Recovered Waste Heat System. AIP Conf. Proc. 2022, 2681, 020019. [Google Scholar]
- Simeone, A.; Luo, Y.; Woolley, E.; Rahimifard, S.; Boër, C. A Decision Support System for Waste Heat Recovery in Manufacturing. CIRP Ann. 2016, 65, 21–24. [Google Scholar] [CrossRef]
- Law, R.; Harvey, A.; Reay, D. Opportunities for Low-Grade Heat Recovery in the UK Food Processing Industry. Appl. Therm. Eng. 2013, 53, 188–196. [Google Scholar] [CrossRef]
- Cooper, S.J.; Hammond, G.P.; Hewitt, N.; Norman, J.B.; Tassou, S.A.; Youssef, W. Energy Saving Potential of High Temperature Heat Pumps in the UK Food and Drink Sector. Energy Procedia 2019, 161, 142–149. [Google Scholar] [CrossRef]
- Energy Efficiency Best Practice Guide Industrial Refrigeration; Sustainability Victoria: Melbourne, Australia, 2009.
- Dong, Y.; Coleman, M.; Miller, S.A. Greenhouse Gas Emissions from Air Conditioning and Refrigeration Service Expansion in Developing Countries. Annu. Rev. Environ. Resour. 2021, 46, 59–83. [Google Scholar] [CrossRef]
- Chen, D.; Luo, Y.; Yuan, X. Refrigeration System Synthesis by Continuous Temperature Level Optimization Considering the Sub-Cooler Configuration. Comput. Chem. Eng. 2020, 141, 107031. [Google Scholar] [CrossRef]
- Patel, V.; Panchal, D.; Prajapati, A.; Mudgal, A.; Davies, P. An Efficient Optimization and Comparative Analysis of Cascade Refrigeration System Using NH3/CO2 and C3H8/CO2 Refrigerant Pairs. Int. J. Refrig. 2019, 102, 62–76. [Google Scholar] [CrossRef]
- Cirera, J.; Carino, J.A.; Zurita, D.; Ortega, J.A. Improving the Energy Efficiency of Industrial Refrigeration Systems by Means of Data-Driven Load Management. Processes 2020, 8, 1106. [Google Scholar] [CrossRef]
- Liu, C.; Jiang, Y.; Han, W.; Kang, Q. A High-Temperature Hybrid Absorption-Compression Heat Pump for Waste Heat Recovery. Energy Convers. Manag. 2018, 172, 391–401. [Google Scholar] [CrossRef]
- Xu, Z.Y.; Gao, J.T.; Hu, B.; Wang, R.Z. Multi-Criterion Comparison of Compression and Absorption Heat Pumps for Ultra-Low Grade Waste Heat Recovery. Energy 2022, 238, 121804. [Google Scholar] [CrossRef]
- Yu, B.; Yang, J.; Wang, D.; Shi, J.; Chen, J. An Updated Review of Recent Advances on Modified Technologies in Transcritical CO2 Refrigeration Cycle. Energy 2019, 189, 116147. [Google Scholar] [CrossRef]
- Bruno, F.; Belusko, M.; Halawa, E. CO2 Refrigeration and Heat Pump Systems—A Comprehensive Review. Energies 2019, 12, 2959. [Google Scholar] [CrossRef]
- U. S. DOE. Combined Heat and Power (CHP) Technical Potential in the United States; U.S. DOE: Washington, DC, USA, 2016. [Google Scholar]
- United States Environmental Protection Agency. CHP Applications. Available online: https://www.epa.gov/chp/what-chp#two (accessed on 10 November 2023).
- Vellini, M.; Gambini, M.; Stilo, T. High-Efficiency Cogeneration Systems for the Food Industry. J. Clean. Prod. 2020, 260, 121133. [Google Scholar] [CrossRef]
- Catalano, F.; Perone, C.; Iannacci, V.; Leone, A.; Tamborrino, A.; Bianchi, B. Energetic Analysis and Optimal Design of a CHP Plant in a Frozen Food Processing Factory through a Dynamical Simulation Model. Energy Convers. Manag. 2020, 225, 113444. [Google Scholar] [CrossRef]
- Zhang, Z.; O’Hara, I.M.; Mundree, S.; Gao, B.; Ball, A.S.; Zhu, N.; Bai, Z.; Jin, B. Biofuels from Food Processing Wastes. Curr. Opin. Biotechnol. 2016, 38, 97–105. [Google Scholar] [CrossRef]
- Walker, K.; Vadlani, P.; Madl, R.; Ugorowski, P.; Hohn, K.L. Ethanol Fermentation from Food Processing Waste. Environ. Prog. Sustain. Energy 2013, 32, 1280–1283. [Google Scholar] [CrossRef]
- Wainaina, S.; Horváth, I.S.; Taherzadeh, M.J. Biochemicals from Food Waste and Recalcitrant Biomass via Syngas Fermentation: A Review. Bioresour. Technol. 2018, 248, 113–121. [Google Scholar] [CrossRef]
- Ghesti, G.F.; Silveira, E.A.; Guimarães, M.G.; Evaristo, R.B.W.; Costa, M. Towards a Sustainable Waste-to-Energy Pathway to Pequi Biomass Residues: Biochar, Syngas, and Biodiesel Analysis. Waste Manag. 2022, 143, 144–156. [Google Scholar] [CrossRef]
- Sharma, P.; Bano, A.; Singh, S.P.; Atkinson, J.D.; Lam, S.S.; Iqbal, H.M.N.; Tong, Y.W. Biotransformation of Food Waste into Biogas and Hydrogen Fuel—A Review. Int. J. Hydrogen Energy 2022, 52, 46–60. [Google Scholar] [CrossRef]
- Ferdeș, M.; Zăbavă, B.Ș.; Paraschiv, G.; Ionescu, M.; Dincă, M.N.; Moiceanu, G. Food Waste Management for Biogas Production in the Context of Sustainable Development. Energies 2022, 15, 6268. [Google Scholar] [CrossRef]
- Puigjaner, L. Syngas from Waste: Emerging Technologies; Springer: London, UK, 2011; ISBN 978-0-85729-539-2. [Google Scholar]
- Gómez, J.R.; Sousa, V.; Cabello Eras, J.J.; Sagastume Gutiérrez, A.; Viego, P.R.; Quispe, E.C.; de León, G. Assessment Criteria of the Feasibility of Replacement Standard Efficiency Electric Motors with High-Efficiency Motors. Energy 2022, 239, 121877. [Google Scholar] [CrossRef]
- Abdel-Hadi, A.; Salem, A.R.; Abbas, A.I.; Qandil, M.; Amano, R.S. Study of Energy Saving Analysis for Different Industries. J. Energy Resour. Technol. 2021, 143, 052101. [Google Scholar] [CrossRef]
- Postnikov, A.; Albayati, I.M.; Pearson, S.; Bingham, C.; Bickerton, R.; Zolotas, A. Facilitating Static Firm Frequency Response with Aggregated Networks of Commercial Food Refrigeration Systems. Appl. Energy 2019, 251, 113357. [Google Scholar] [CrossRef]
- Sadek, M.; El-Maghraby, R.; Fathy, M. Evaluation of Variable Speed Drives to Improve Energy Efficiency and Reduce Gas Emissions: Case Study. Chem. Ind. Chem. Eng. Q. 2023, 29, 111–118. [Google Scholar] [CrossRef]
- Menon, A.; Stojceska, V.; Tassou, S.A. A Systematic Review on the Recent Advances of the Energy Efficiency Improvements in Non-Conventional Food Drying Technologies. Trends Food Sci. Technol. 2020, 100, 67–76. [Google Scholar] [CrossRef]
- Aboud, S.A.; Altemimi, A.B.; Al-HiIphy, A.R.S.; Yi-Chen, L.; Cacciola, F. A Comprehensive Review on Infrared Heating Applications in Food Processing. Molecules 2019, 24, 4125. [Google Scholar] [CrossRef] [PubMed]
- Arya, S.S.; Sawant, O.; Sonawane, S.K.; Show, P.L.; Waghamare, A.; Hilares, R.; Santos, J.C. Dos Novel, Nonthermal, Energy Efficient, Industrially Scalable Hydrodynamic Cavitation—Applications in Food Processing. Food Rev. Int. 2020, 36, 668–691. [Google Scholar] [CrossRef]
- Picart-Palmade, L.; Cunault, C.; Chevalier-Lucia, D.; Belleville, M.-P.; Marchesseau, S. Potentialities and Limits of Some Non-Thermal Technologies to Improve Sustainability of Food Processing. Front. Nutr. 2019, 5, 130. [Google Scholar] [CrossRef]
- Zhang, Z.; Wang, L.; Zeng, X.; Han, Z.; Brennan, C.S. Non-thermal Technologies and Its Current and Future Application in the Food Industry: A Review. Int. J. Food Sci. Technol. 2019, 54, 1–13. [Google Scholar] [CrossRef]
- Heinrich, V.; Zunabovic, M.; Varzakas, T.; Bergmair, J.; Kneifel, W. Pulsed Light Treatment of Different Food Types with a Special Focus on Meat: A Critical Review. Crit. Rev. Food Sci. Nutr. 2016, 56, 591–613. [Google Scholar] [CrossRef]
- Can, F.O.; Demirci, A.; Puri, V.M.; Gourama, H. Decontamination of Hard Cheeses by Pulsed UV Light. J. Food Prot. 2014, 77, 1723–1731. [Google Scholar] [CrossRef] [PubMed]
- Jung, K.; Song, B.-S.; Kim, M.J.; Moon, B.-G.; Go, S.-M.; Kim, J.-K.; Lee, Y.-J.; Park, J.-H. Effect of X-Ray, Gamma Ray, and Electron Beam Irradiation on the Hygienic and Physicochemical Qualities of Red Pepper Powder. LWT—Food Sci. Technol. 2015, 63, 846–851. [Google Scholar] [CrossRef]
- Grundy, M.M.; Lapsley, K.; Ellis, P.R. A Review of the Impact of Processing on Nutrient Bioaccessibility and Digestion of Almonds. Int. J. Food Sci. Technol. 2016, 51, 1937–1946. [Google Scholar] [CrossRef] [PubMed]
- Hokmollahi, F.; Ehsani, M.R. High Pressure Processing and Its Application in Cheese Manufacturing: A Review. J. Food Biosci. Technol. 2017, 7, 57–66. [Google Scholar]
- Pyatkovskyy, T.I.; Shynkaryk, M.V.; Mohamed, H.M.; Yousef, A.E.; Sastry, S.K. Effects of Combined High Pressure (HPP), Pulsed Electric Field (PEF) and Sonication Treatments on Inactivation of Listeria Innocua. J. Food Eng. 2018, 233, 49–56. [Google Scholar] [CrossRef]
- Kakani, V.; Nguyen, V.H.; Kumar, B.P.; Kim, H.; Pasupuleti, V.R. A Critical Review on Computer Vision and Artificial Intelligence in Food Industry. J. Agric. Food Res. 2020, 2, 100033. [Google Scholar] [CrossRef]
- Wetzel, J.; Damsgard, C. Smart Manufacturing in the Food Industry. In Smart Manufacturing; Elsevier: Amsterdam, The Netherlands, 2020; pp. 1–19. [Google Scholar]
- Hassoun, A.; Aït-Kaddour, A.; Abu-Mahfouz, A.M.; Rathod, N.B.; Bader, F.; Barba, F.J.; Biancolillo, A.; Cropotova, J.; Galanakis, C.M.; Jambrak, A.R.; et al. The Fourth Industrial Revolution in the Food Industry—Part I: Industry 4.0 Technologies. Crit. Rev. Food Sci. Nutr. 2023, 63, 6547–6563. [Google Scholar] [CrossRef] [PubMed]
- Mahbub, M. A Smart Farming Concept Based on Smart Embedded Electronics, Internet of Things and Wireless Sensor Network. Internet Things 2020, 9, 100161. [Google Scholar] [CrossRef]
- Miranda, J.; Ponce, P.; Molina, A.; Wright, P. Sensing, Smart and Sustainable Technologies for Agri-Food 4.0. Comput. Ind. 2019, 108, 21–36. [Google Scholar] [CrossRef]
- Jagtap, S.; Rahimifard, S.; Duong, L.N.K. Real-time Data Collection to Improve Energy Efficiency: A Case Study of Food Manufacturer. J. Food Process Preserv. 2022, 46, e14338. [Google Scholar] [CrossRef]
- Choi, J.-K.; Thangamani, D.; Kissock, K. A Systematic Methodology for Improving Resource Efficiency in Small and Medium-Sized Enterprises. Resour. Conserv. Recycl. 2019, 147, 19–27. [Google Scholar] [CrossRef]
- Falbo, L.; Perrone, D.; Morrone, P.; Algieri, A. Integration of Biodiesel Internal Combustion Engines and Transcritical Organic Rankine Cycles for waste-heat Recovery in small-scale Applications. Int. J. Energy Res. 2022, 46, 5235–5249. [Google Scholar] [CrossRef]
- Corigliano, O.; Algieri, A.; Fragiacomo, P. Turning Data Center Waste Heat into Energy: A Guide to Organic Rankine Cycle System Design and Performance Evaluation. Appl. Sci. 2024, 14, 6046. [Google Scholar] [CrossRef]
- Brückner, S.; Liu, S.; Miró, L.; Radspieler, M.; Cabeza, L.F.; Lävemann, E. Industrial Waste Heat Recovery Technologies: An Economic Analysis of Heat Transformation Technologies. Appl. Energy 2015, 151, 157–167. [Google Scholar] [CrossRef]
- Mukherjee, S.; Asthana, A.; Howarth, M.; Mcniell, R. Waste Heat Recovery from Industrial Baking Ovens. Energy Procedia 2017, 123, 321–328. [Google Scholar] [CrossRef]
- Galvagno, A.; Prestipino, M.; Maisano, S.; Urbani, F.; Chiodo, V. Integration into a Citrus Juice Factory of Air-Steam Gasification and CHP System: Energy Sustainability Assessment. Energy Convers. Manag. 2019, 193, 74–85. [Google Scholar] [CrossRef]
- Roati, C.; Fiore, S.; Ruffino, B.; Marchese, F.; Novarino, D.; Zanetti, C. Preliminary Evaluation of the Potential Biogas Production of Food-Processing Industrial Wastes. Am. J. Environ. Sci. 2012, 8, 291–296. [Google Scholar] [CrossRef]
- Pradeshwaran, V.; Saravanakumar, A. Harnessing Food Waste Potential: Biochar Driven Waste to Energy Conversion for Methane Generation. Sustain. Energy Technol. Assess. 2024, 69, 103901. [Google Scholar] [CrossRef]
- Manara, P.; Zabaniotou, A. Indicator-Based Economic, Environmental, and Social Sustainability Assessment of a Small Gasification Bioenergy System Fuelled with Food Processing Residues from the Mediterranean Agro-Industrial Sector. Sustain. Energy Technol. Assess. 2014, 8, 159–171. [Google Scholar] [CrossRef]
- Balakrishna, A.K.; Wazed, M.A.; Farid, M. A Review on the Effect of High Pressure Processing (HPP) on Gelatinization and Infusion of Nutrients. Molecules 2020, 25, 2369. [Google Scholar] [CrossRef] [PubMed]
- Chandrasekaran, S.; Ramanathan, S.; Basak, T. Microwave Food Processing—A Review. Food Res. Int. 2013, 52, 243–261. [Google Scholar] [CrossRef]
- Arshad, R.N.; Abdul-Malek, Z.; Roobab, U.; Munir, M.A.; Naderipour, A.; Qureshi, M.I.; El-Din Bekhit, A.; Liu, Z.-W.; Aadil, R.M. Pulsed Electric Field: A Potential Alternative towards a Sustainable Food Processing. Trends Food Sci. Technol. 2021, 111, 43–54. [Google Scholar] [CrossRef]
- Singh, H.; Bhardwaj, S.K.; Khatri, M.; Kim, K.-H.; Bhardwaj, N. UVC Radiation for Food Safety: An Emerging Technology for the Microbial Disinfection of Food Products. Chem. Eng. J. 2021, 417, 128084. [Google Scholar] [CrossRef]
- Keklik, N.M.; Demirci, A.; Puri, V.M. Decontamination of Unpackaged and Vacuum-Packaged Boneless Chicken Breast with Pulsed Ultraviolet Light. Poult. Sci. 2010, 89, 570–581. [Google Scholar] [CrossRef] [PubMed]
- Bhargava, N.; Mor, R.S.; Kumar, K.; Sharanagat, V.S. Advances in Application of Ultrasound in Food Processing: A Review. Ultrason. Sonochem 2021, 70, 105293. [Google Scholar] [CrossRef] [PubMed]
- Patist, A.; Bates, D. Ultrasonic Innovations in the Food Industry: From the Laboratory to Commercial Production. Innov. Food Sci. Emerg. Technol. 2008, 9, 147–154. [Google Scholar] [CrossRef]
- Fernández, A.; Noriega, E.; Thompson, A. Inactivation of Salmonella Enterica Serovar Typhimurium on Fresh Produce by Cold Atmospheric Gas Plasma Technology. Food Microbiol. 2013, 33, 24–29. [Google Scholar] [CrossRef] [PubMed]
- Wang, L.; Iddio, E. Energy Performance Evaluation and Modeling for an Indoor Farming Facility. Sustain. Energy Technol. Assess. 2022, 52, 102240. [Google Scholar] [CrossRef]
- Realini, A.; Nsangwe Businge, C.; Zagano, C.; Borgarello, M.; Gobbi, M.; Marghella, F.; Di Santo, D.; Caragliu, A. L’efficienza Energetica Nell’industria: Potenzialità Di Risparmio Energetico e Impatto Sulle Performance e Sulla Competitività Delle Imprese; FIRE: Roma, Italy, 2016. [Google Scholar]
- Pang, Z.; Chen, Q.; Han, W.; Zheng, L. Value-Centric Design of the Internet-of-Things Solution for Food Supply Chain: Value Creation, Sensor Portfolio and Information Fusion. Inf. Syst. Front. 2015, 17, 289–319. [Google Scholar] [CrossRef]
- Annosi, M.C.; Brunetta, F.; Bimbo, F.; Kostoula, M. Digitalization within Food Supply Chains to Prevent Food Waste. Drivers, Barriers and Collaboration Practices. Ind. Mark. Manag. 2021, 93, 208–220. [Google Scholar] [CrossRef]
- Rizou, M.; Galanakis, I.M.; Aldawoud, T.M.S.; Galanakis, C.M. Safety of Foods, Food Supply Chain and Environment within the COVID-19 Pandemic. Trends Food Sci. Technol. 2020, 102, 293–299. [Google Scholar] [CrossRef] [PubMed]
- Nuttah, M.M.; Roma, P.; Lo Nigro, G.; Perrone, G. Understanding Blockchain Applications in Industry 4.0: From Information Technology to Manufacturing and Operations Management. J. Ind. Inf. Integr. 2023, 33, 100456. [Google Scholar] [CrossRef]
- Qiu, J.; Wu, Q.; Ding, G.; Xu, Y.; Feng, S. A Survey of Machine Learning for Big Data Processing. EURASIP J. Adv. Signal Process 2016, 2016, 67. [Google Scholar] [CrossRef]
- Khan, M.; Haleem, A.; Javaid, M. Changes and Improvements in Industry 5.0: A Strategic Approach to Overcome the Challenges of Industry 4.0. Green Technol. Sustain. 2023, 1, 100020. [Google Scholar] [CrossRef]
- Dwivedi, A.; Agrawal, D.; Jha, A.; Mathiyazhagan, K. Studying the Interactions among Industry 5.0 and Circular Supply Chain: Towards Attaining Sustainable Development. Comput. Ind. Eng. 2023, 176, 108927. [Google Scholar] [CrossRef]

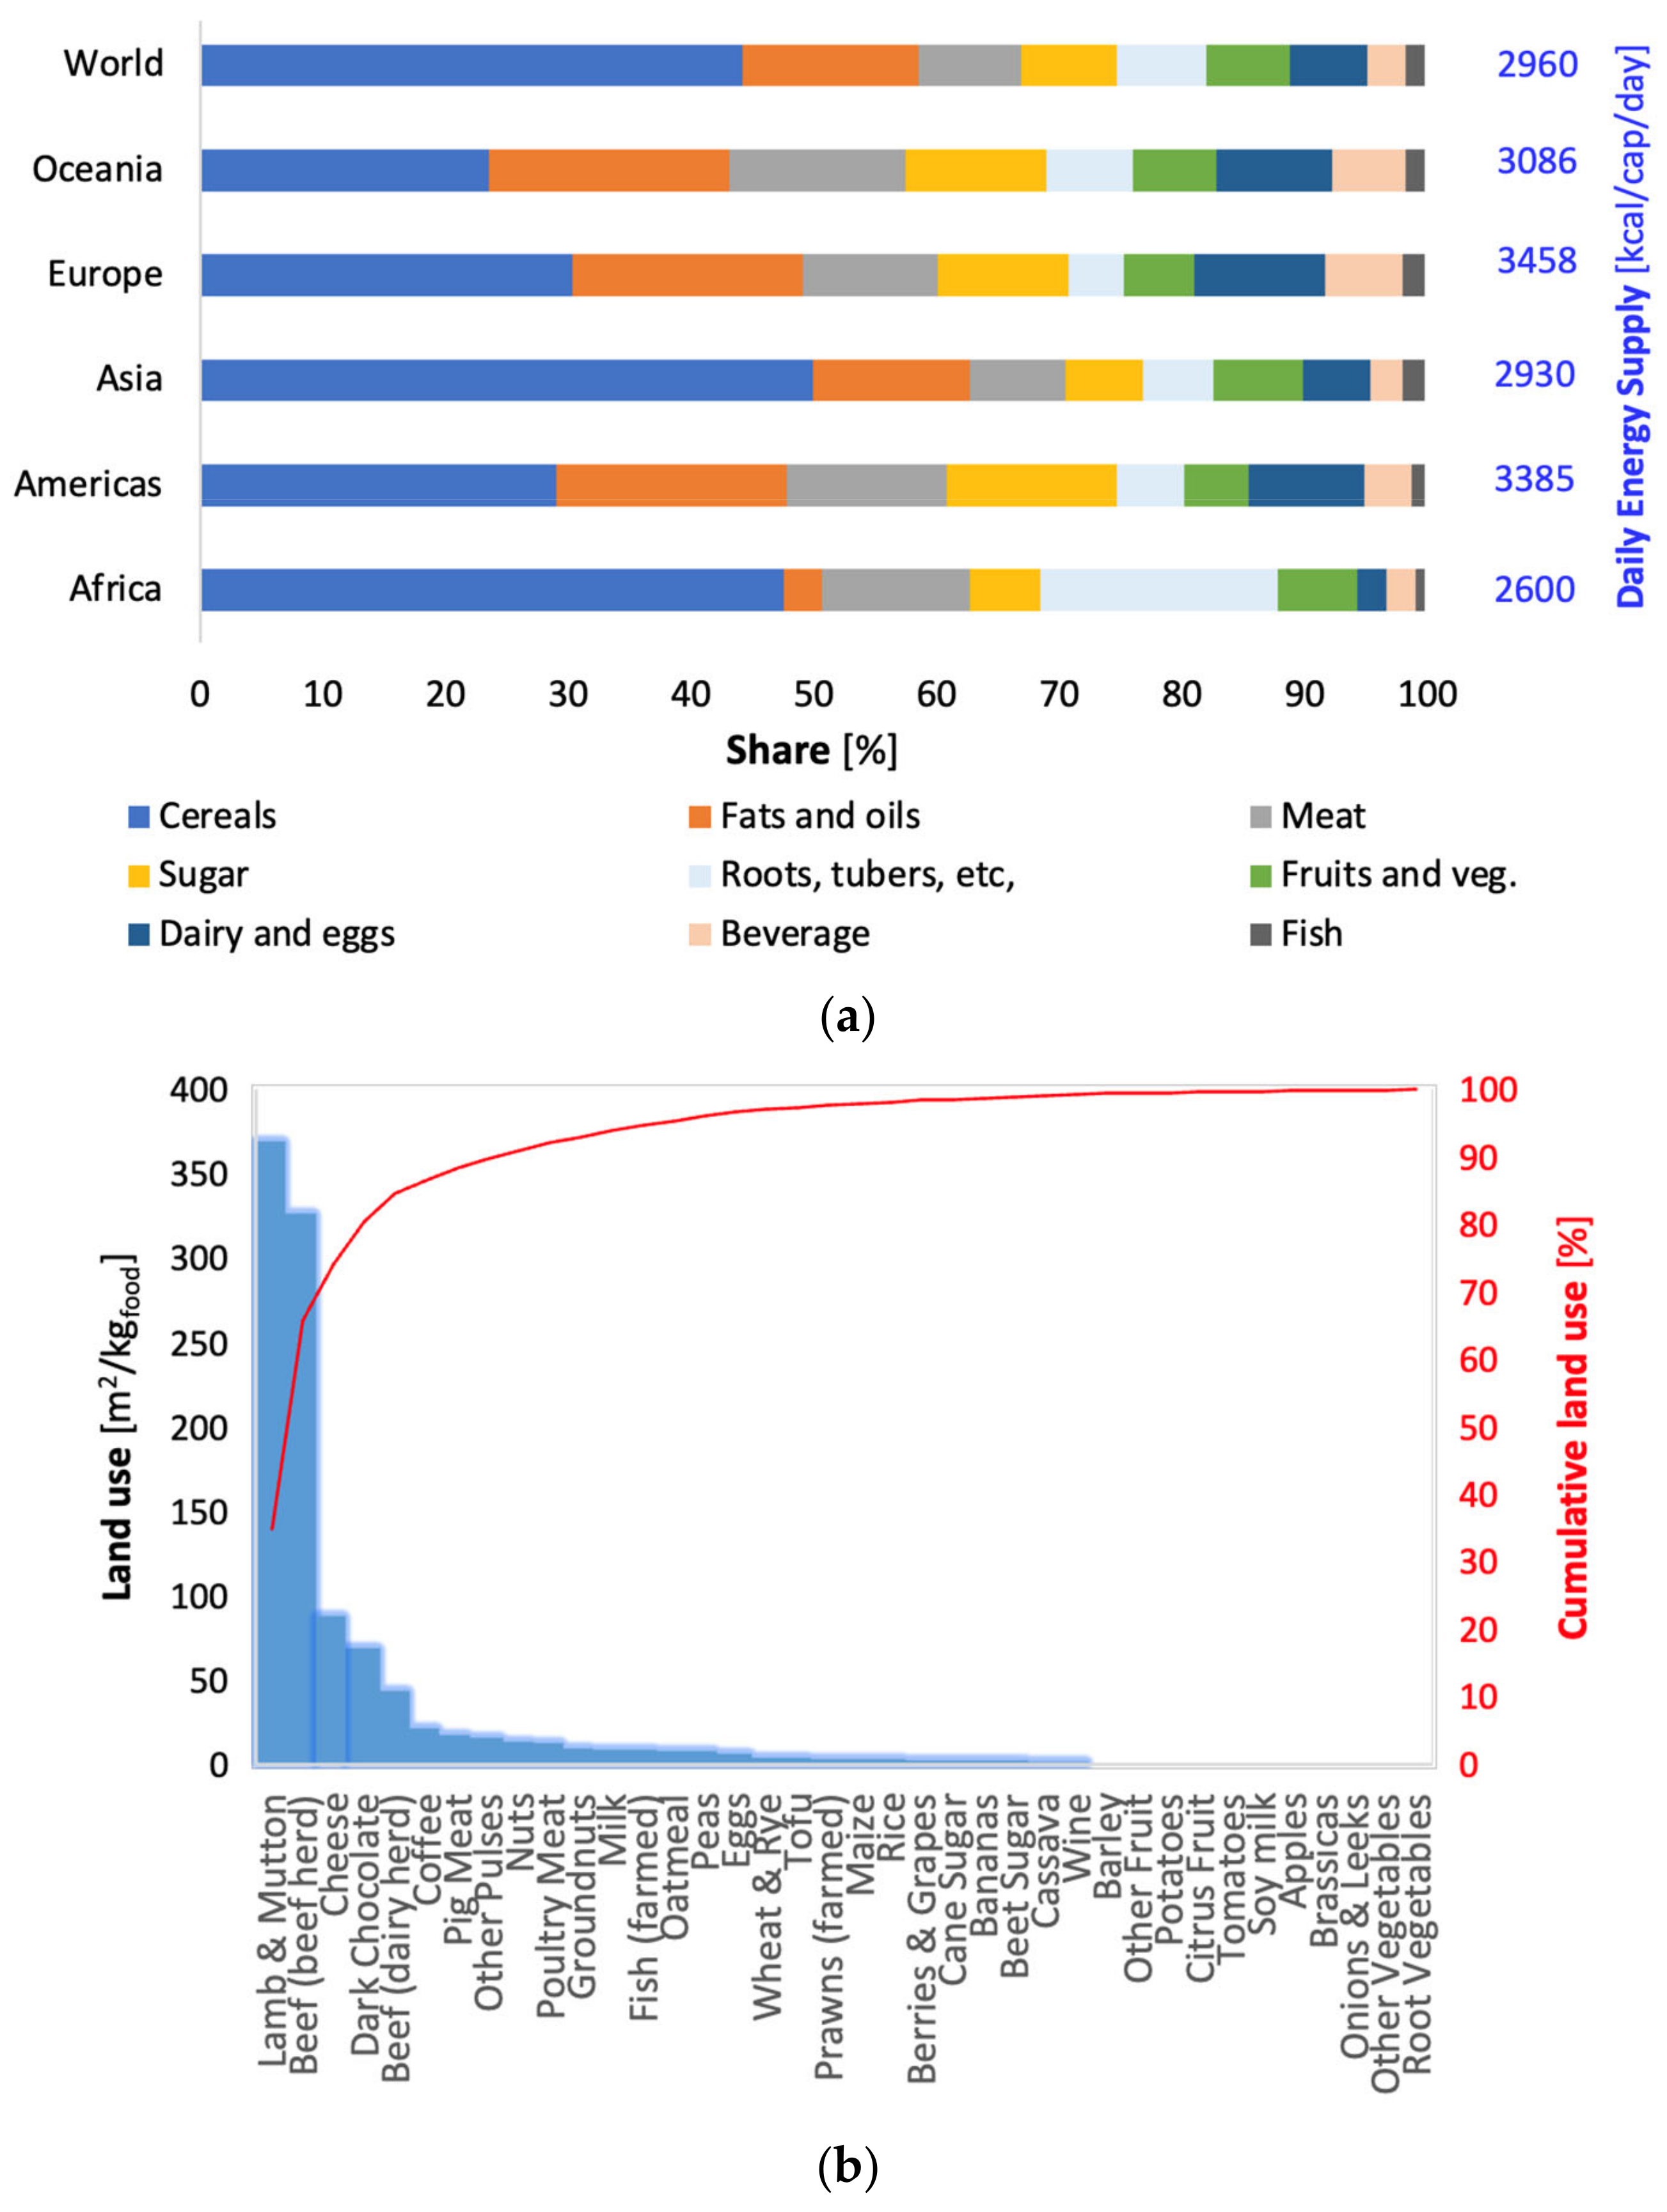

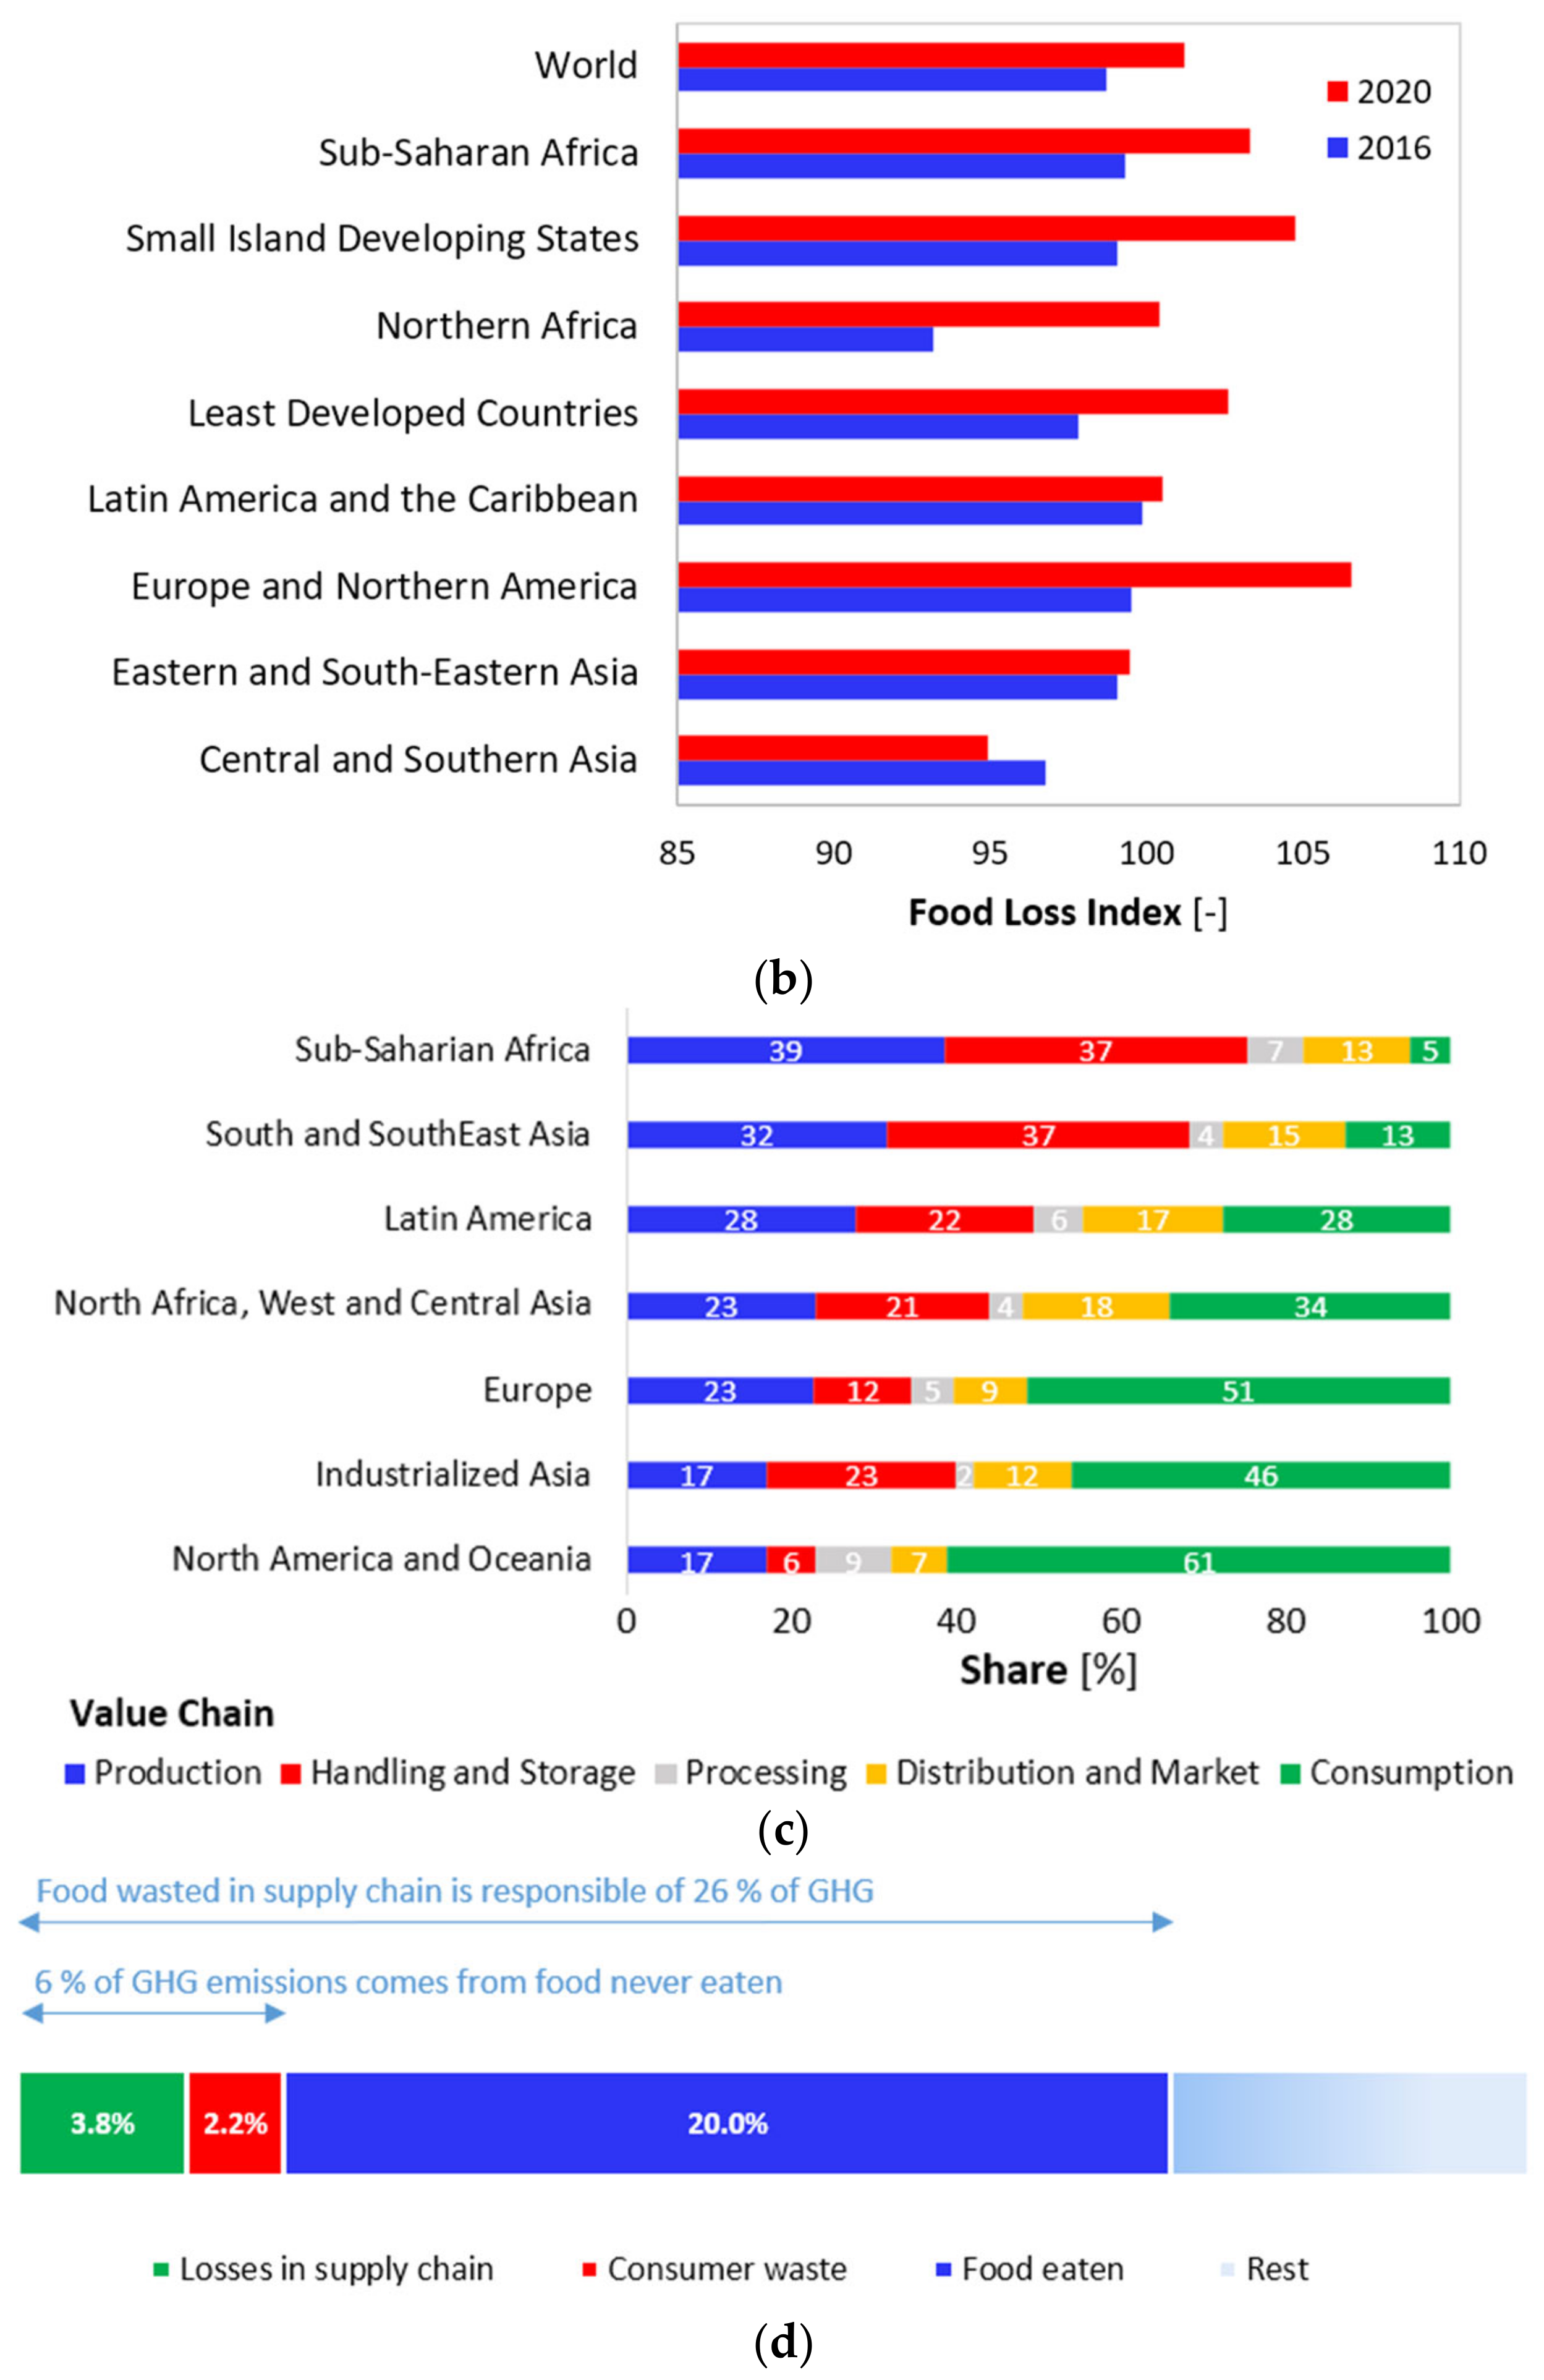
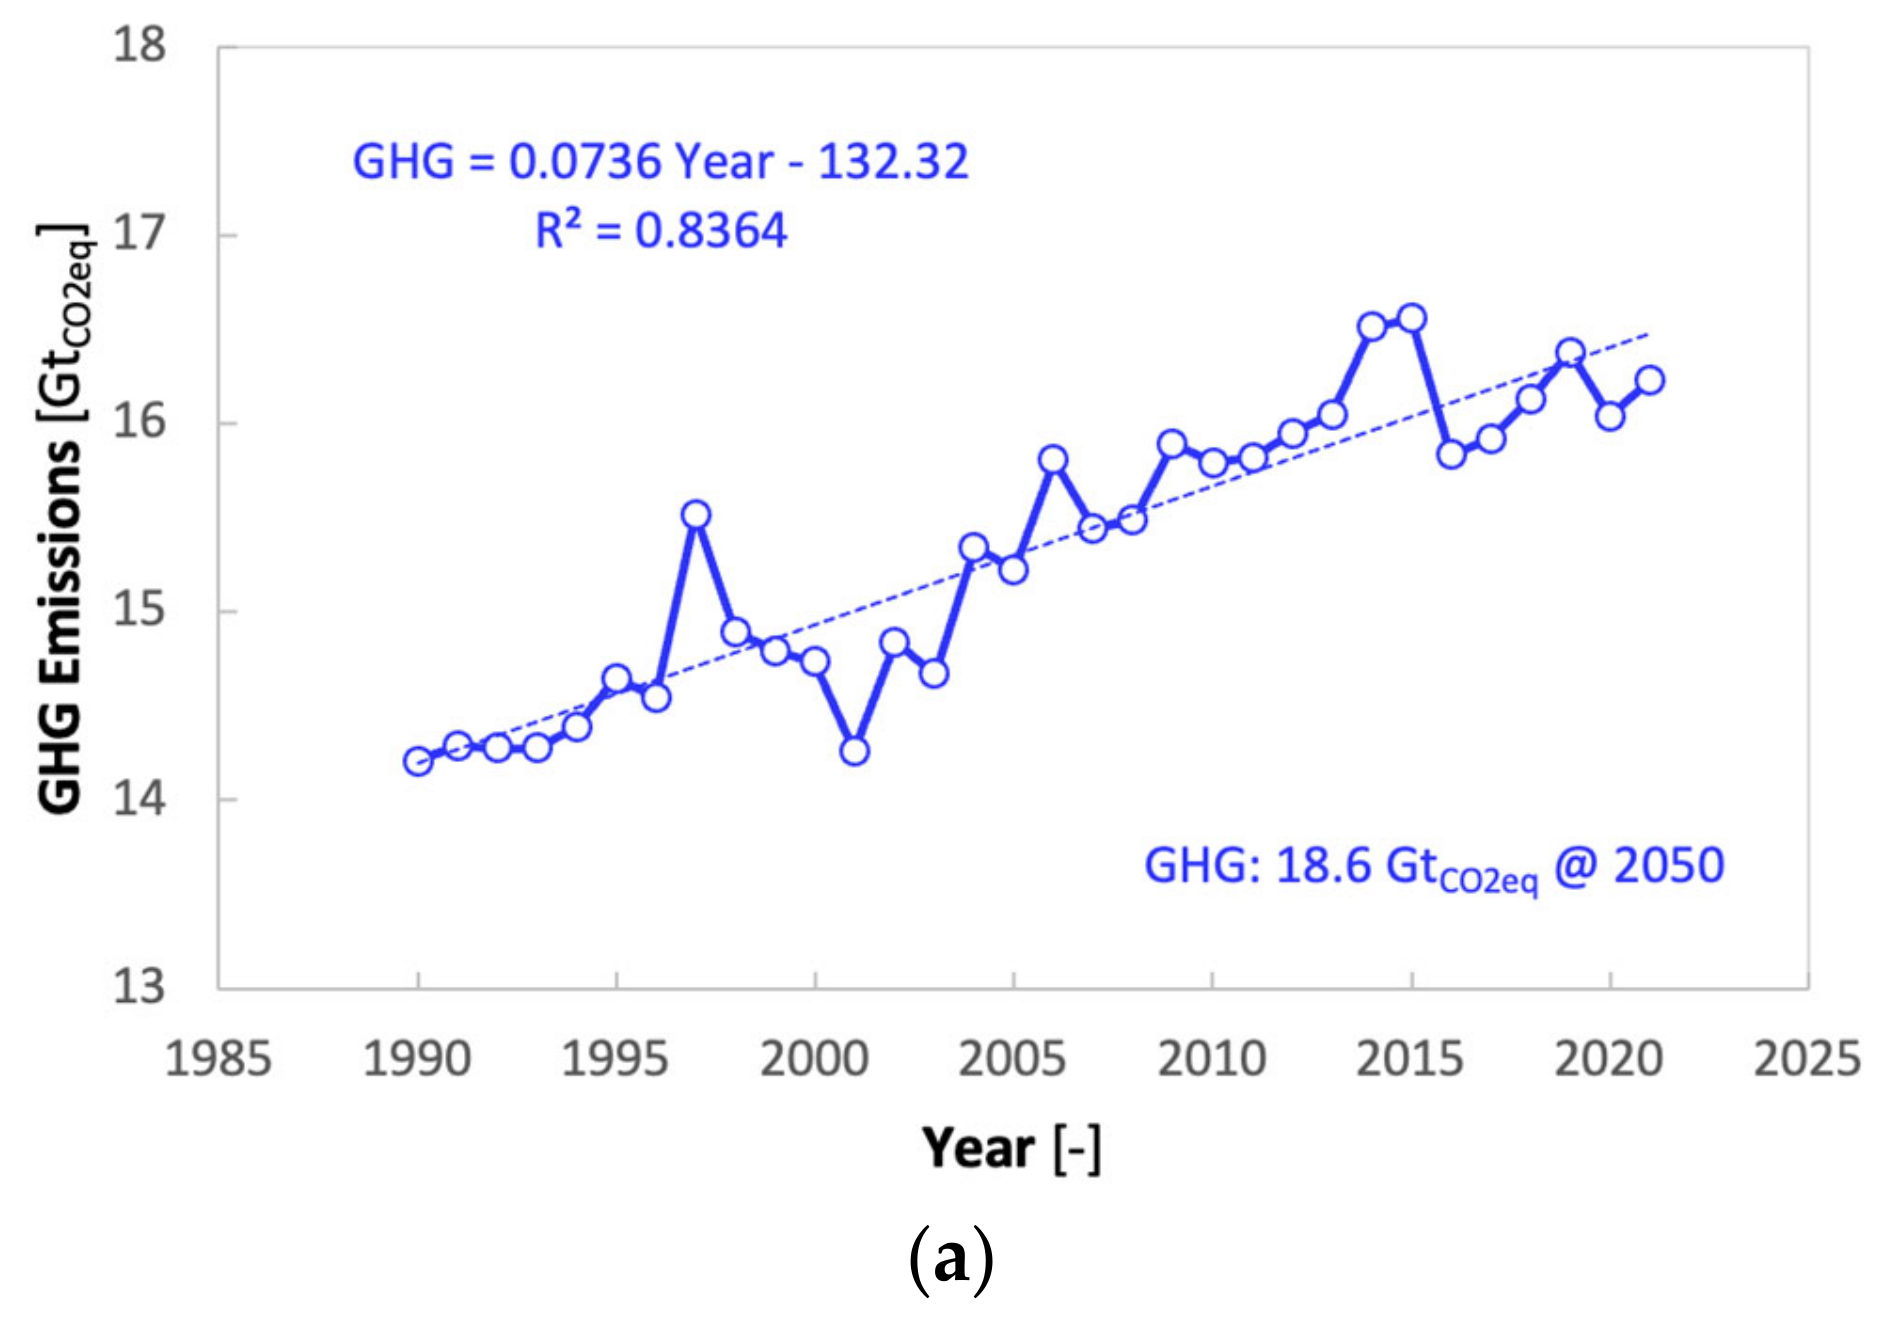

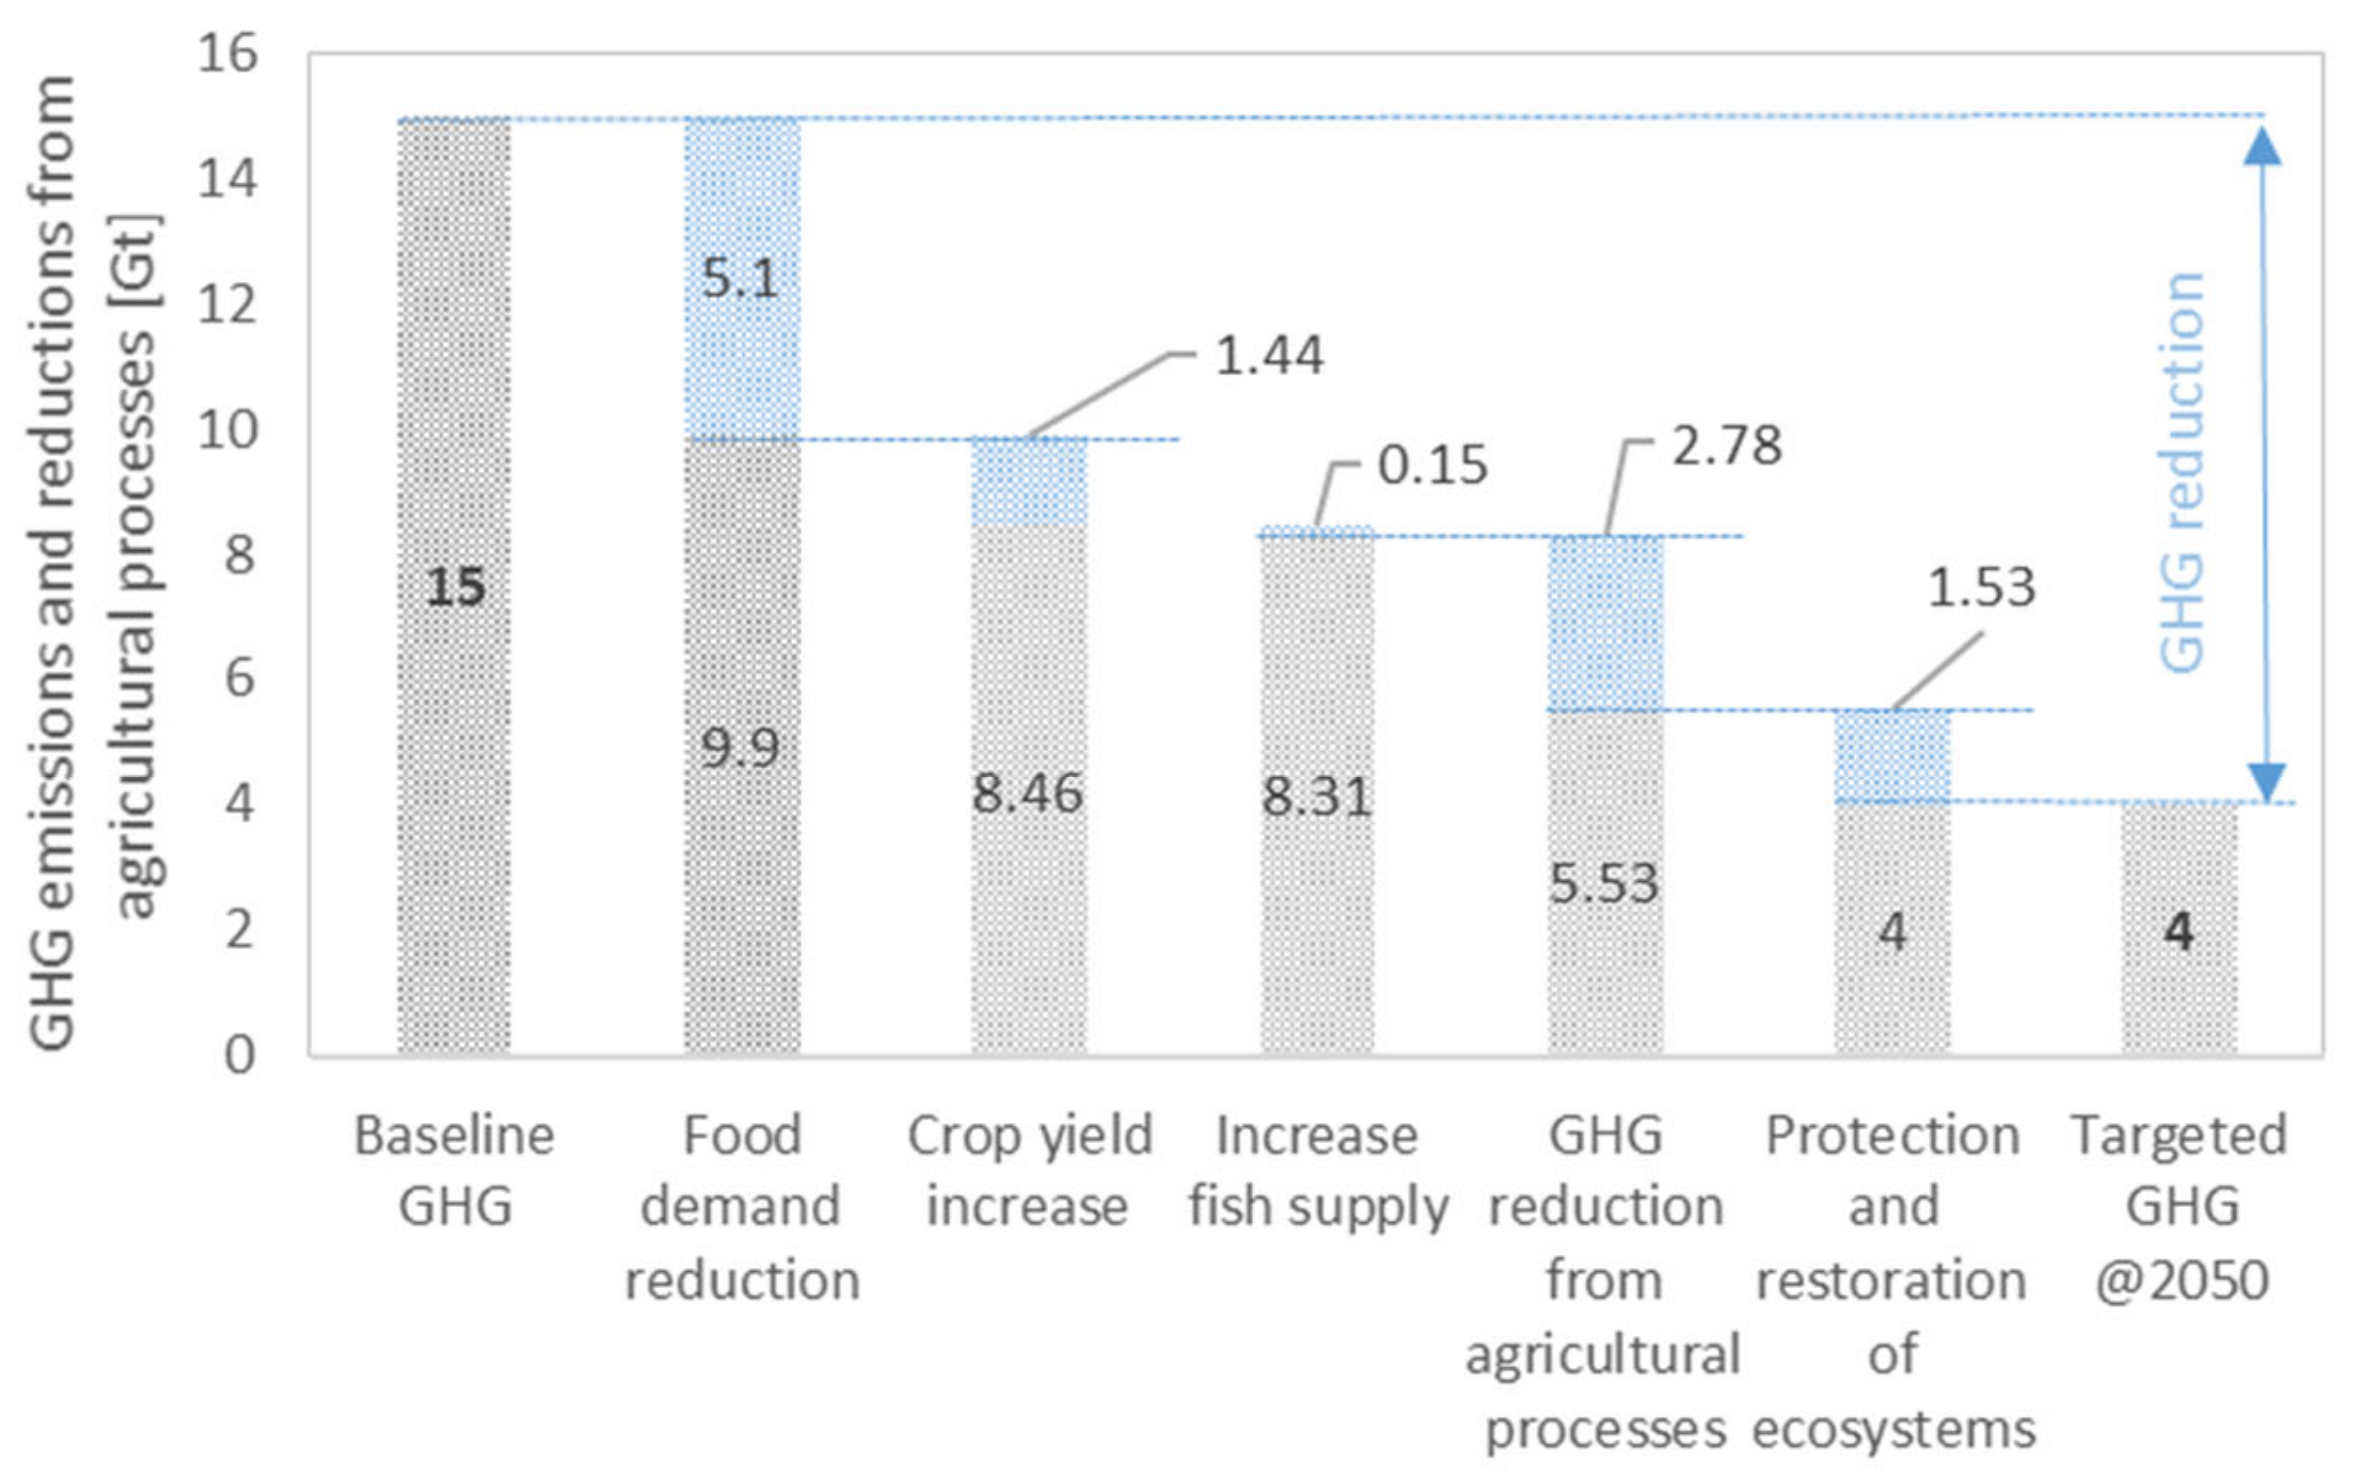
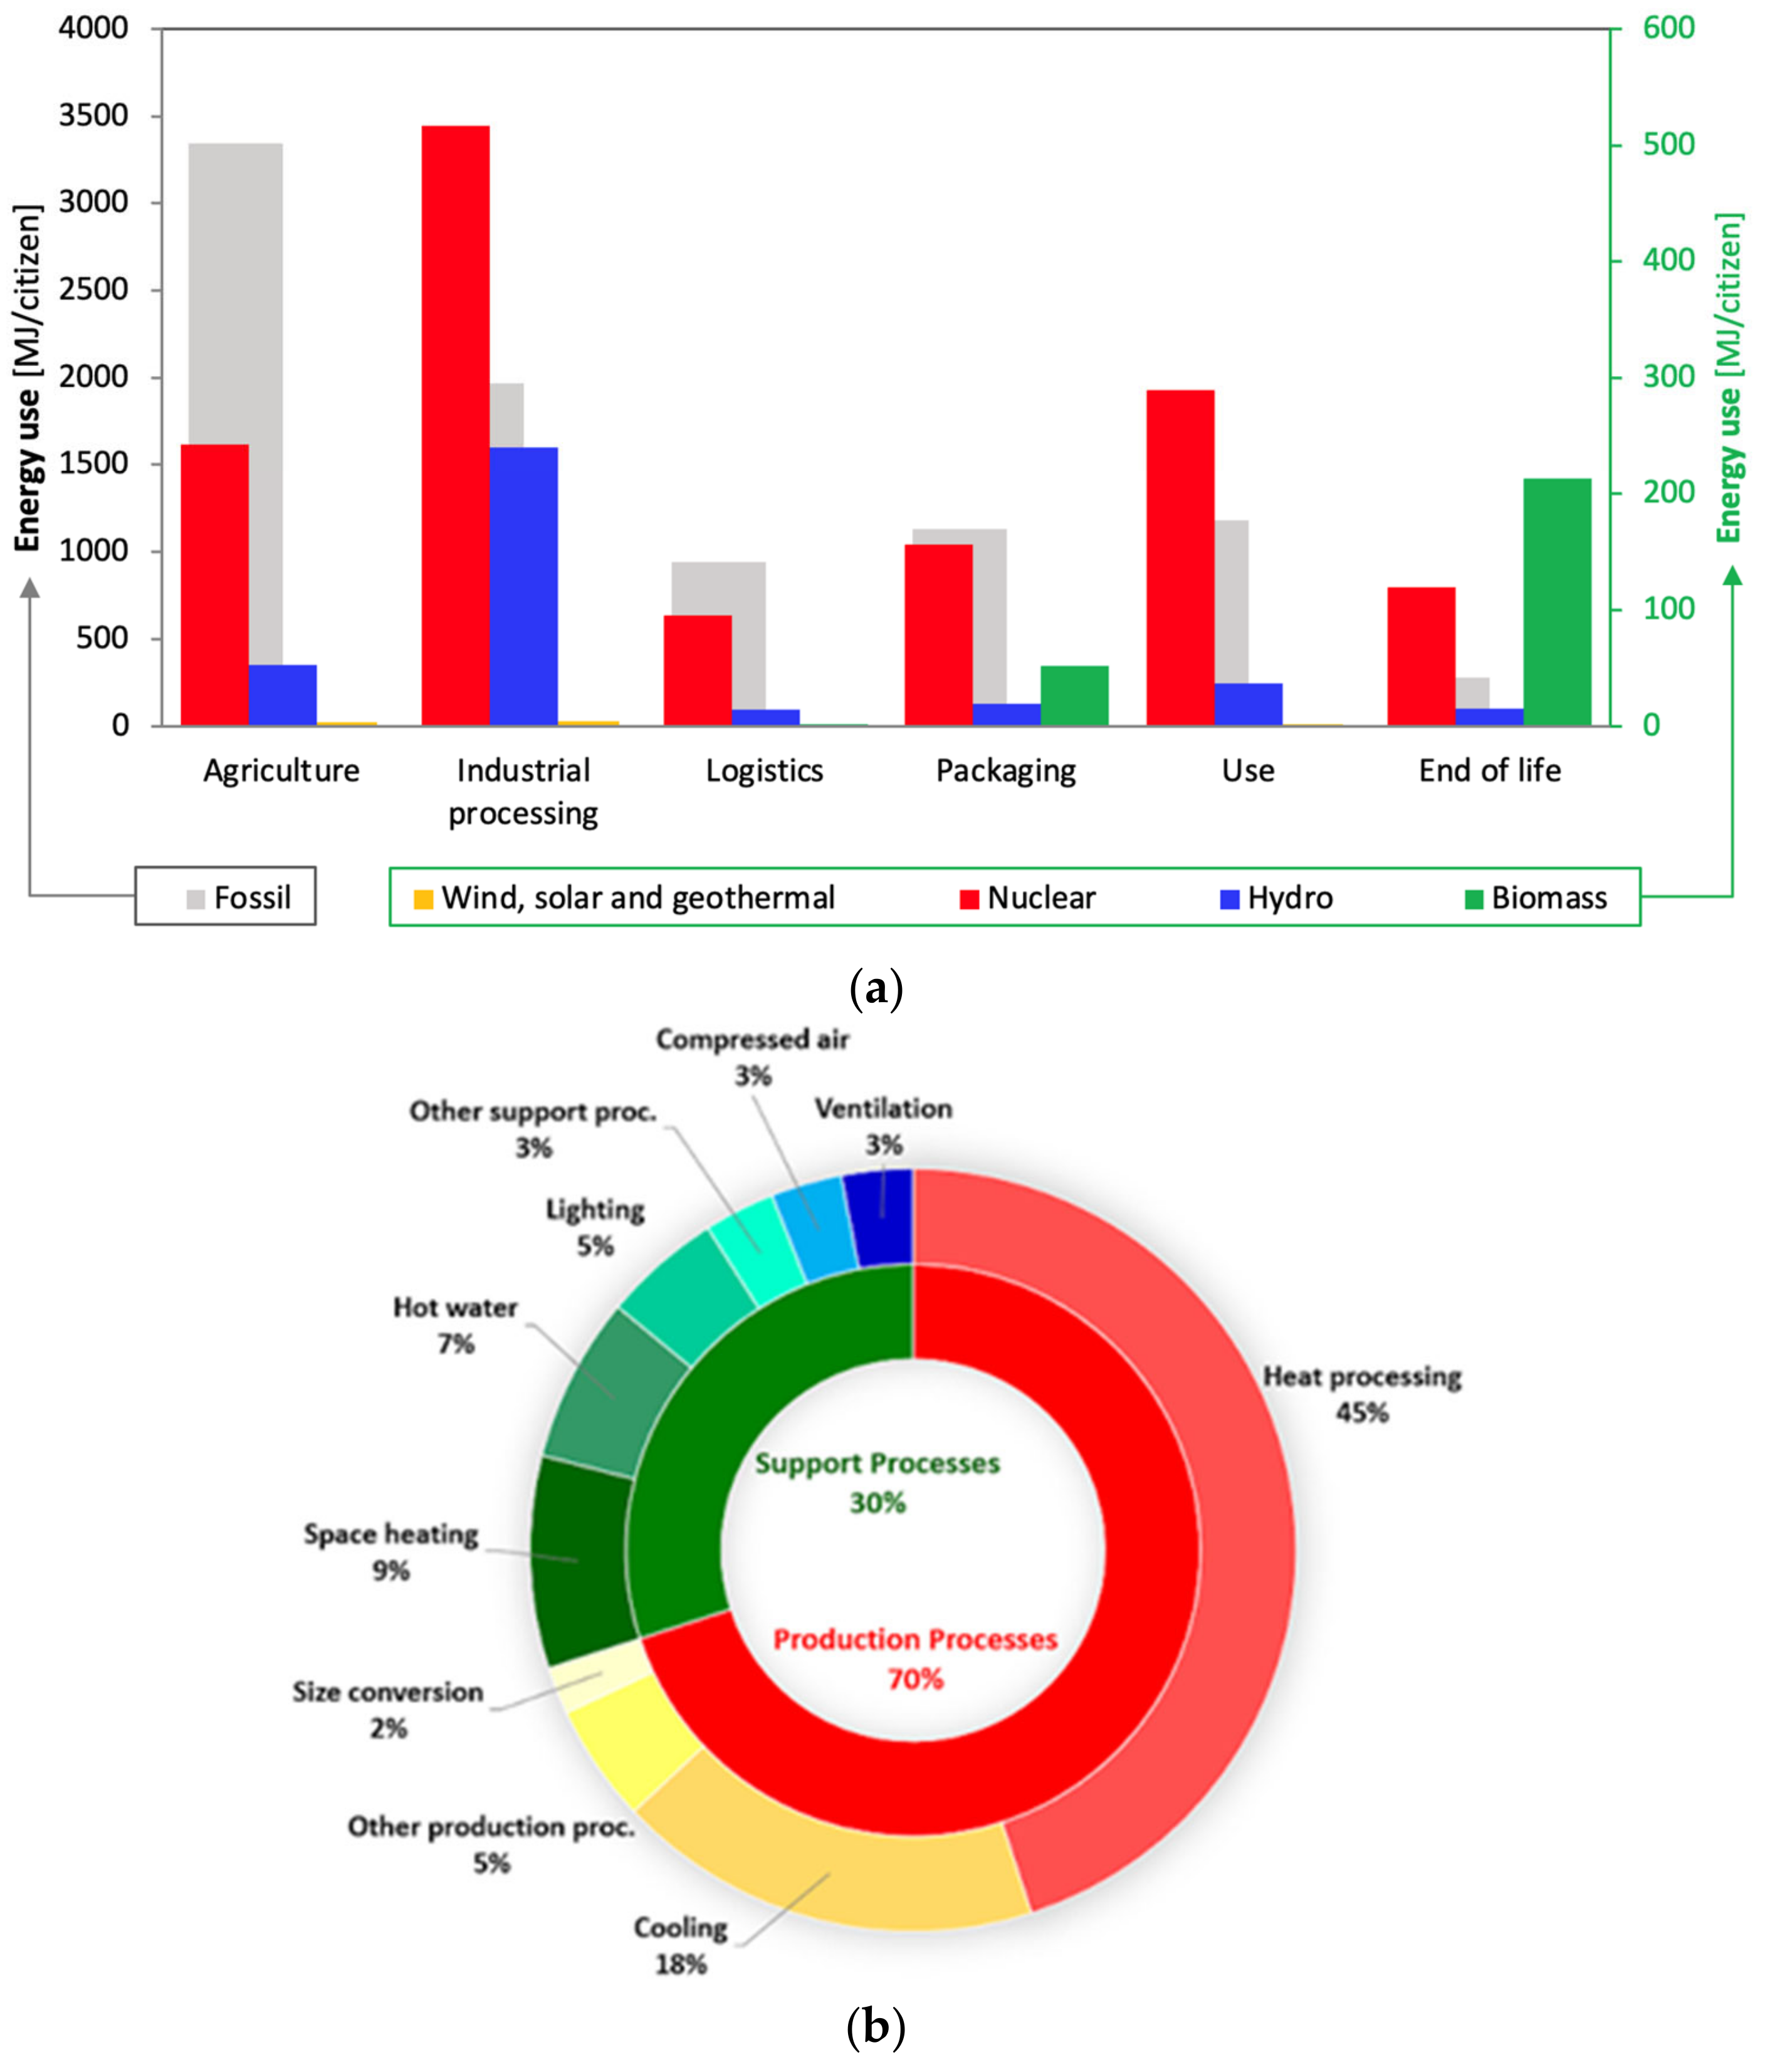
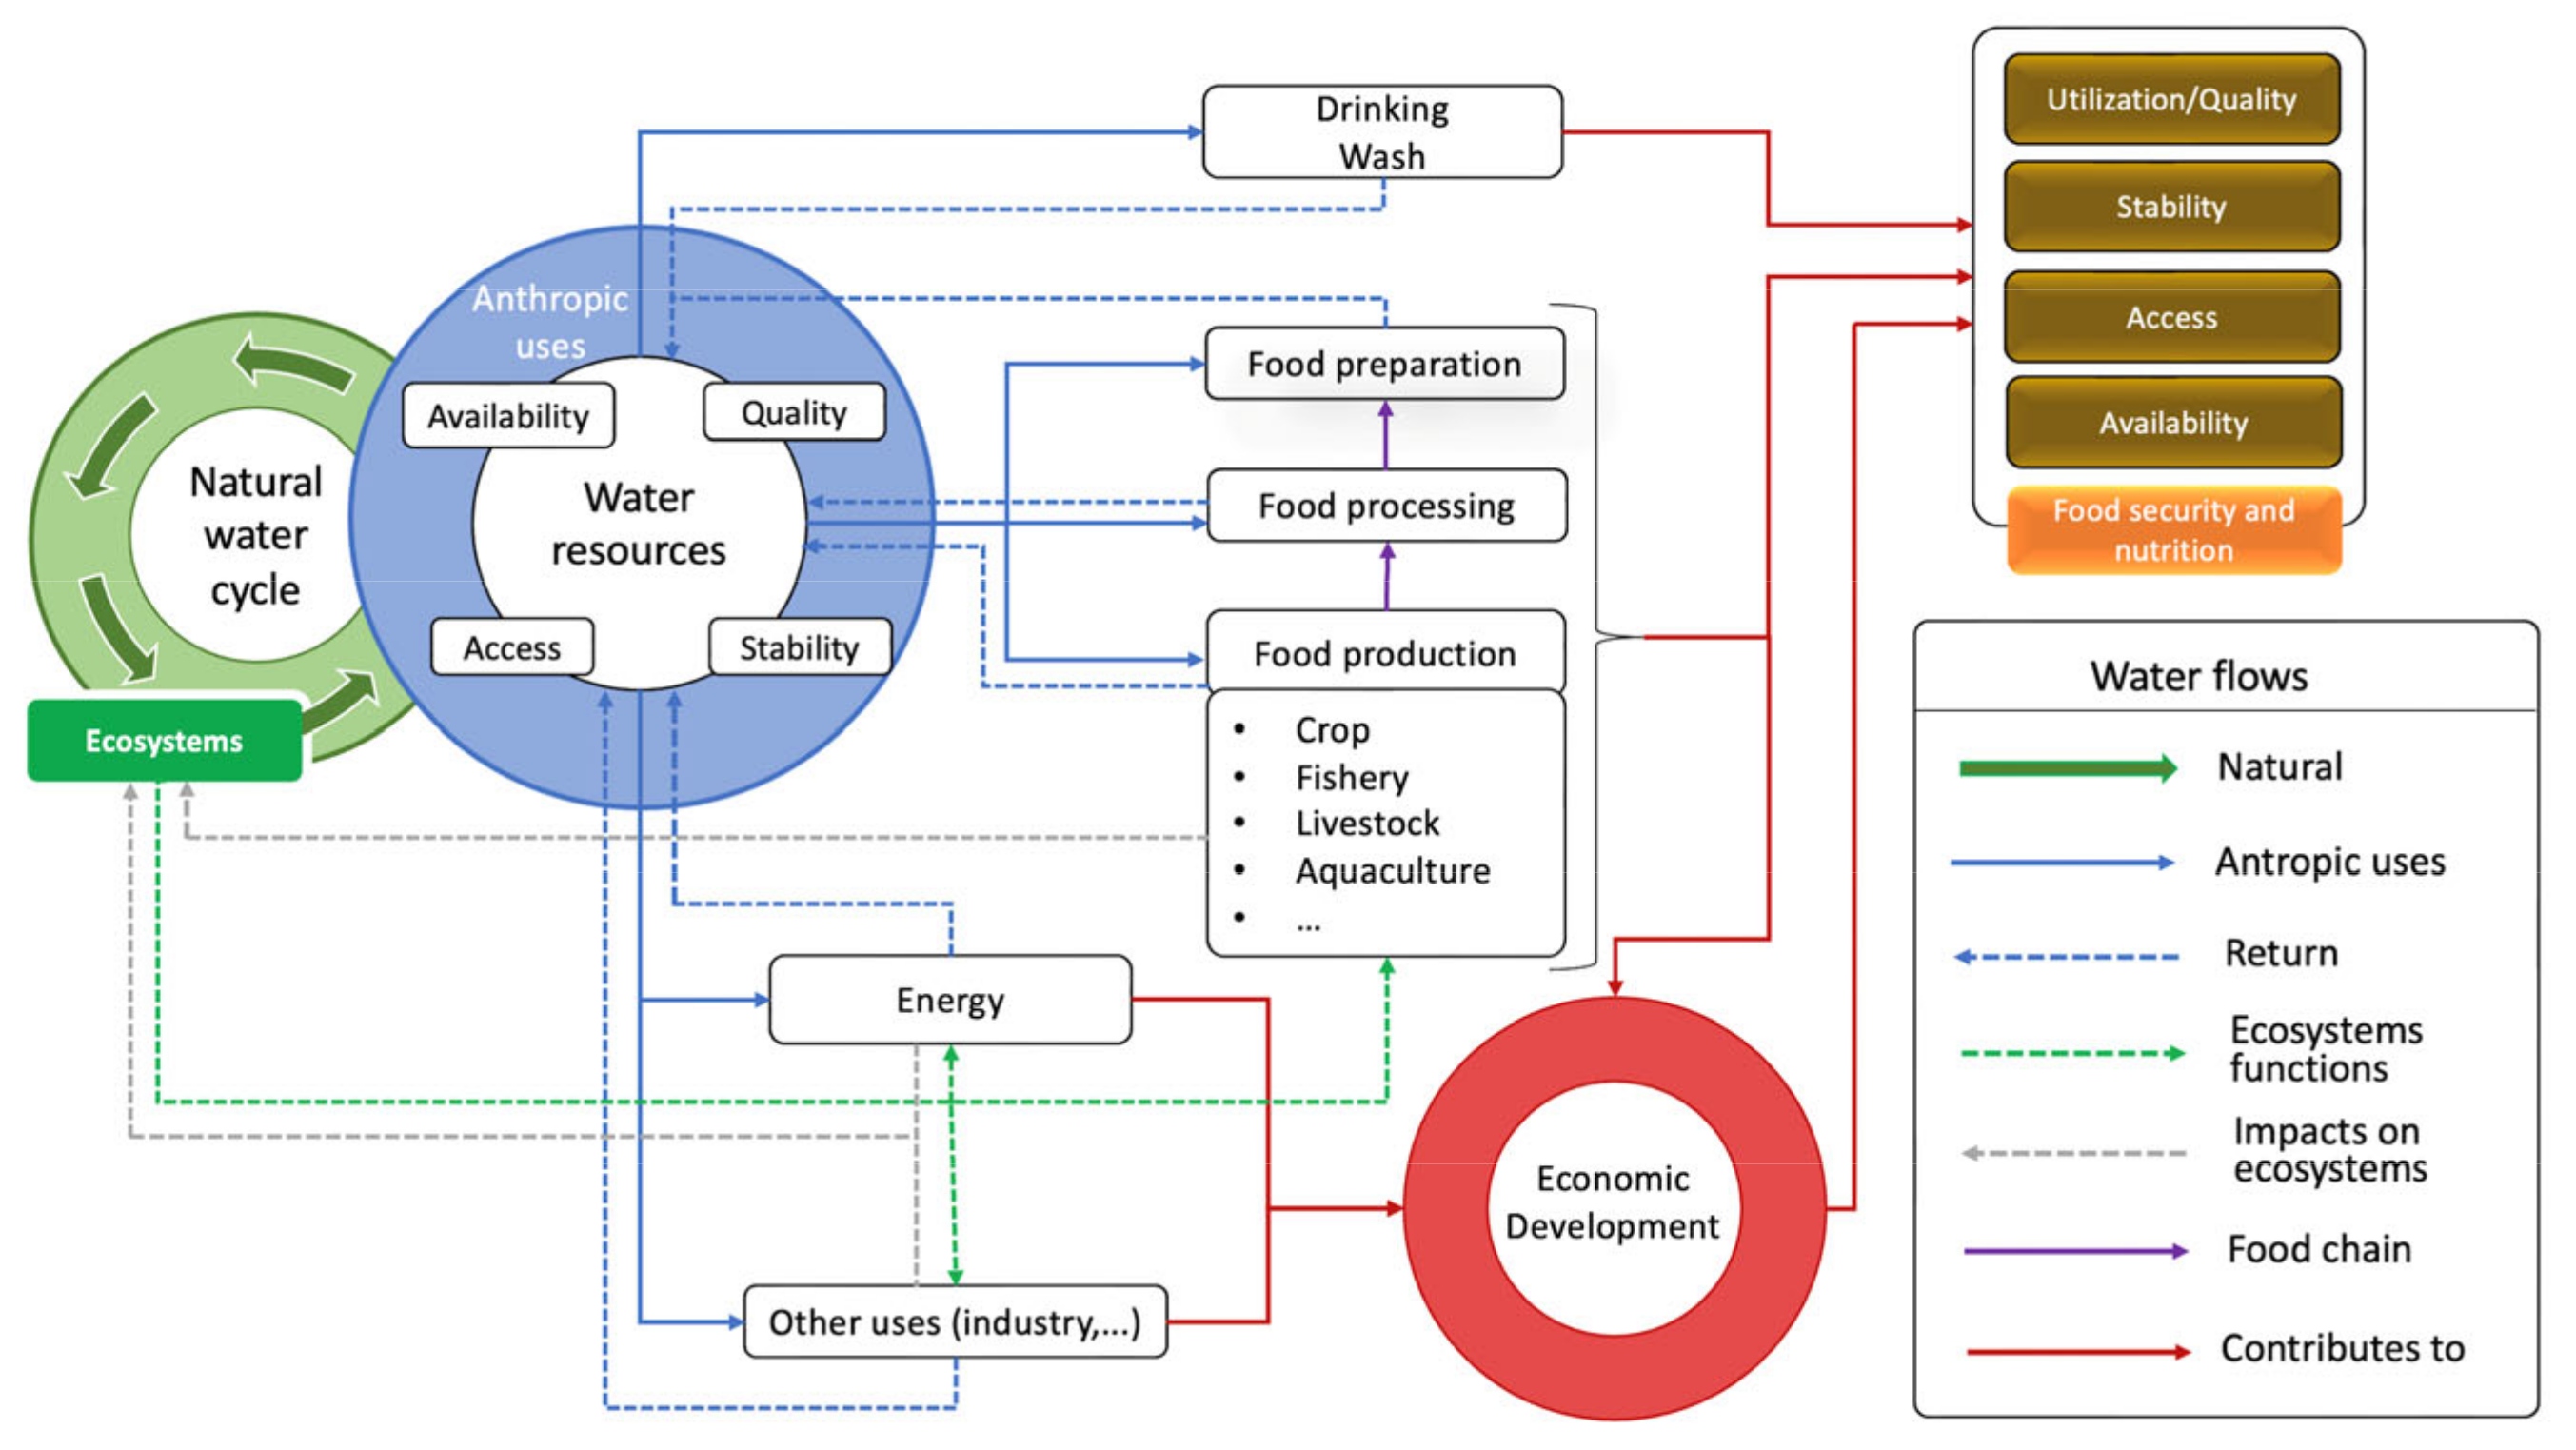
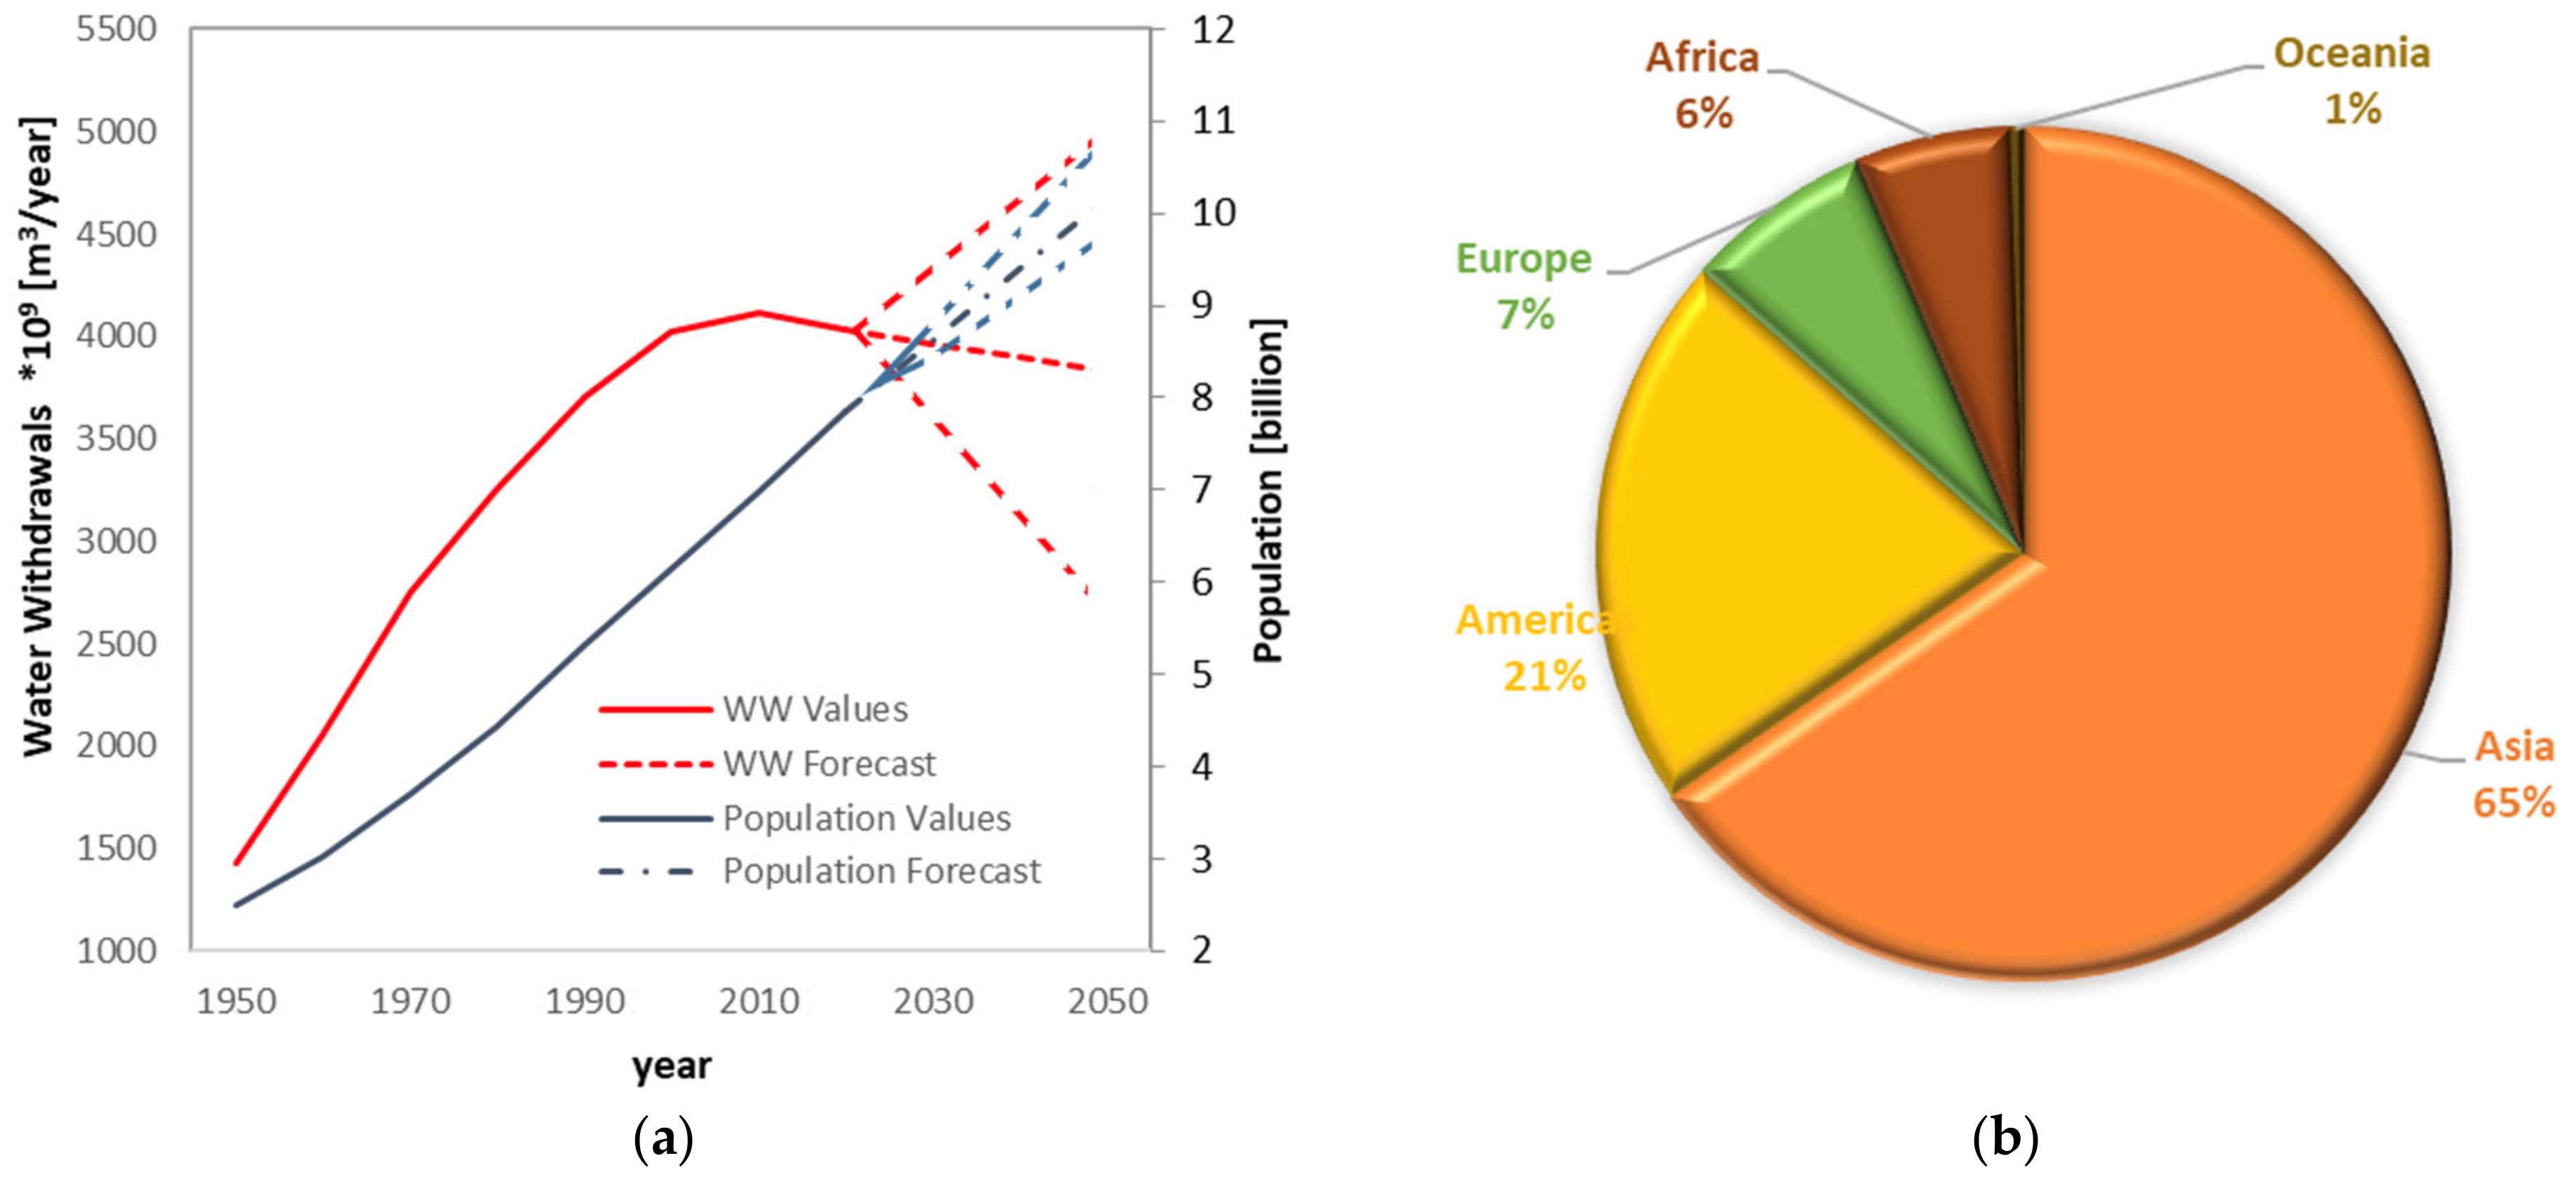
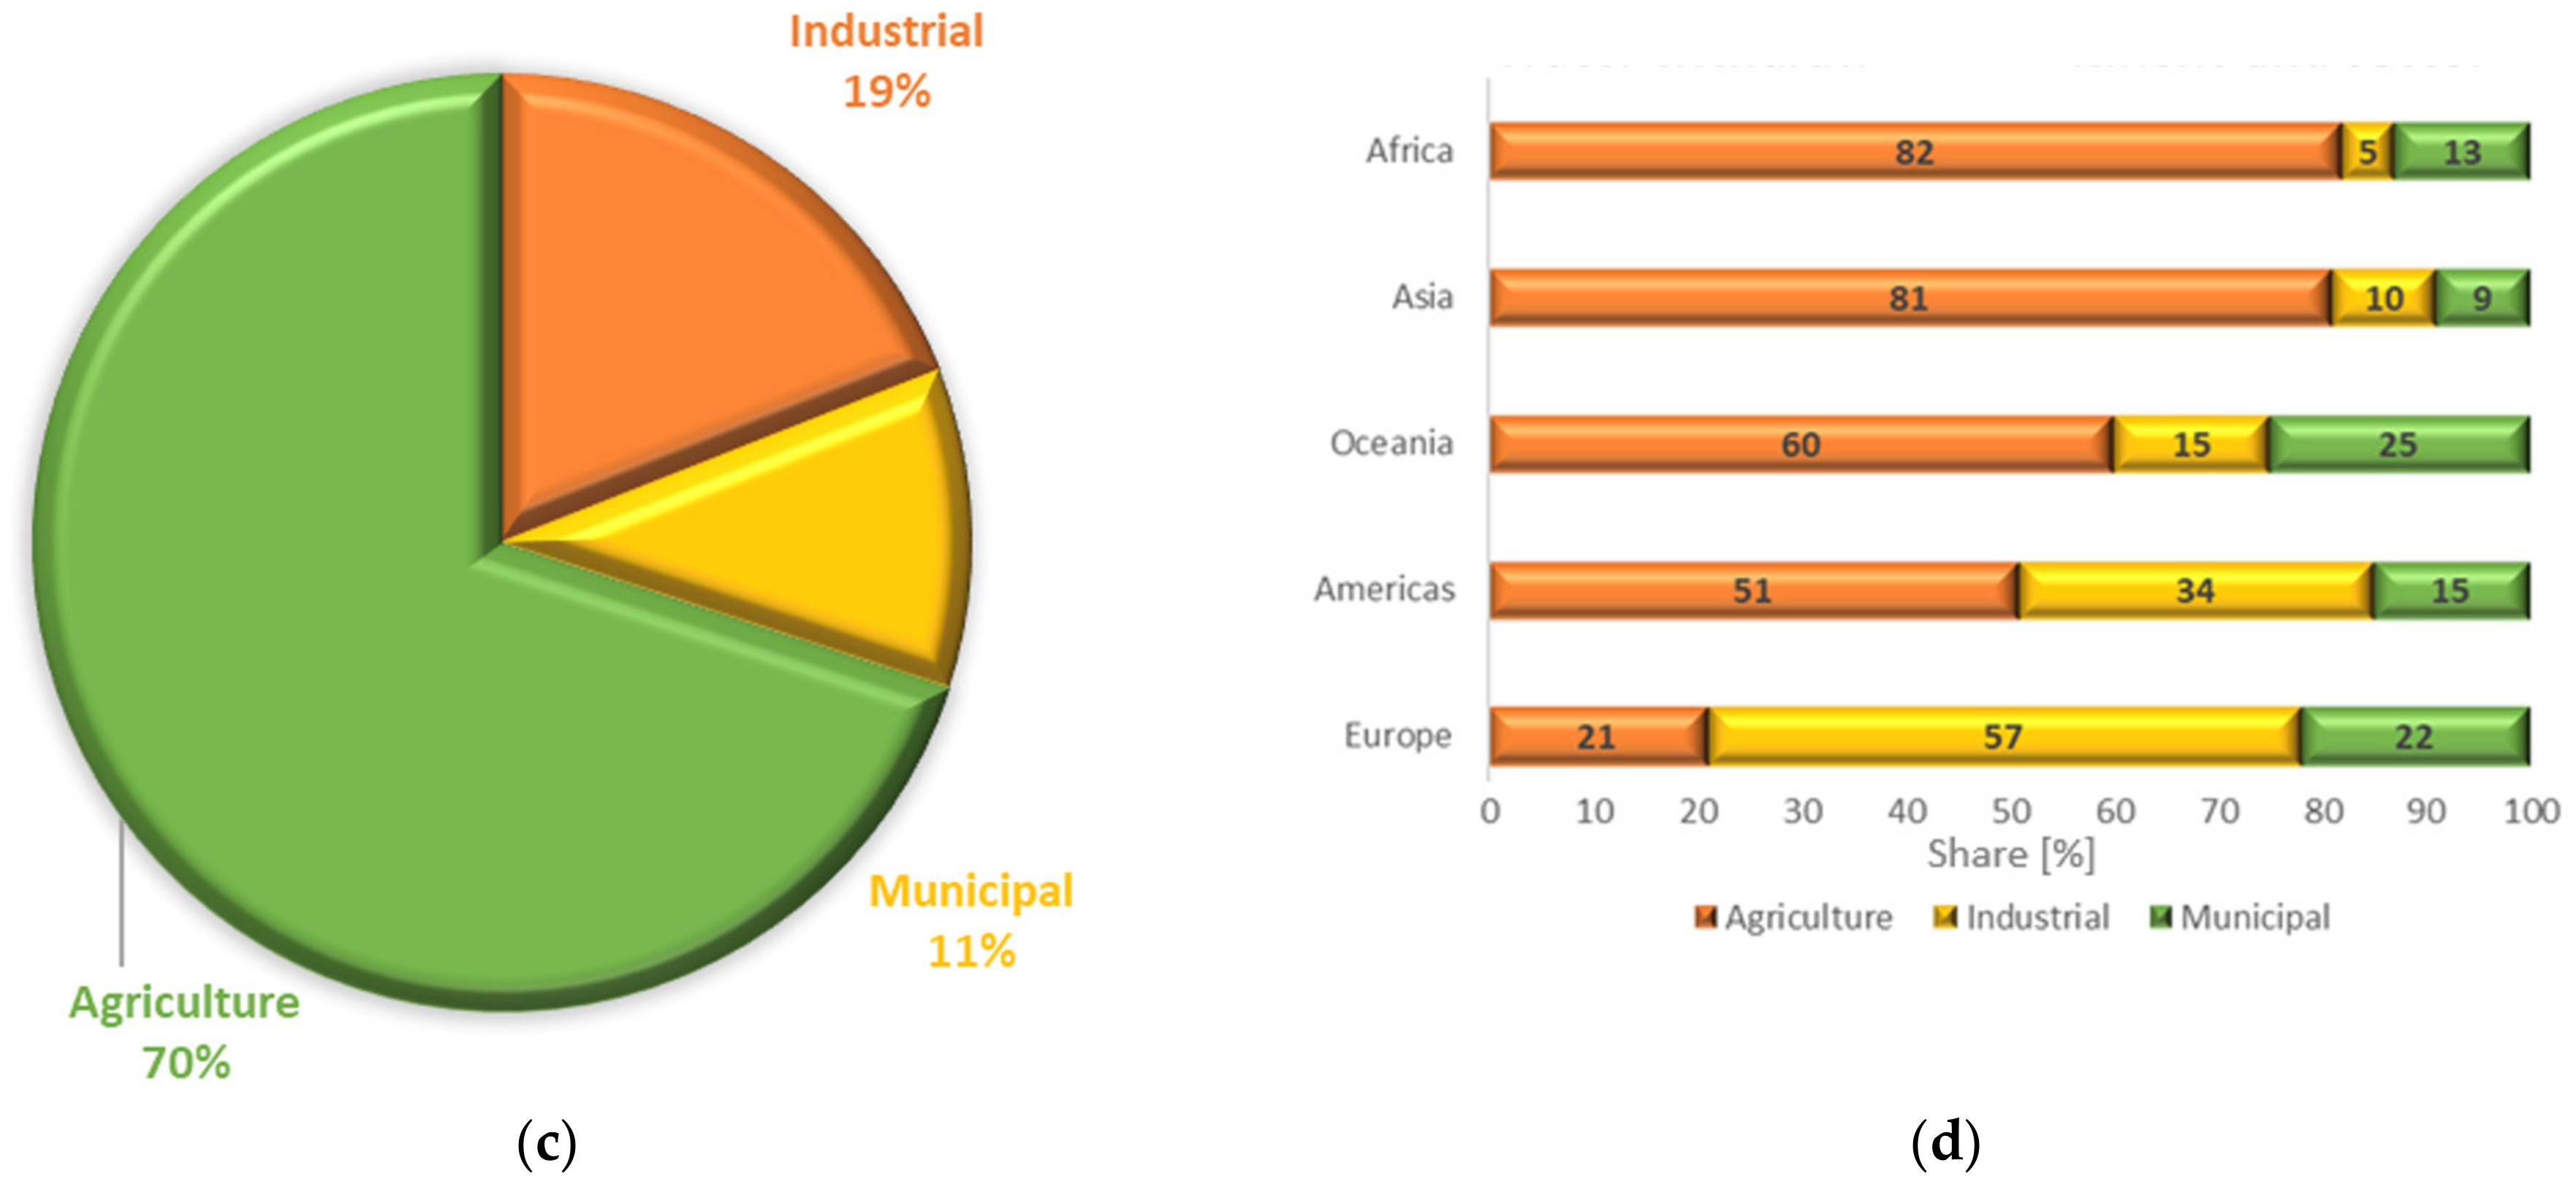
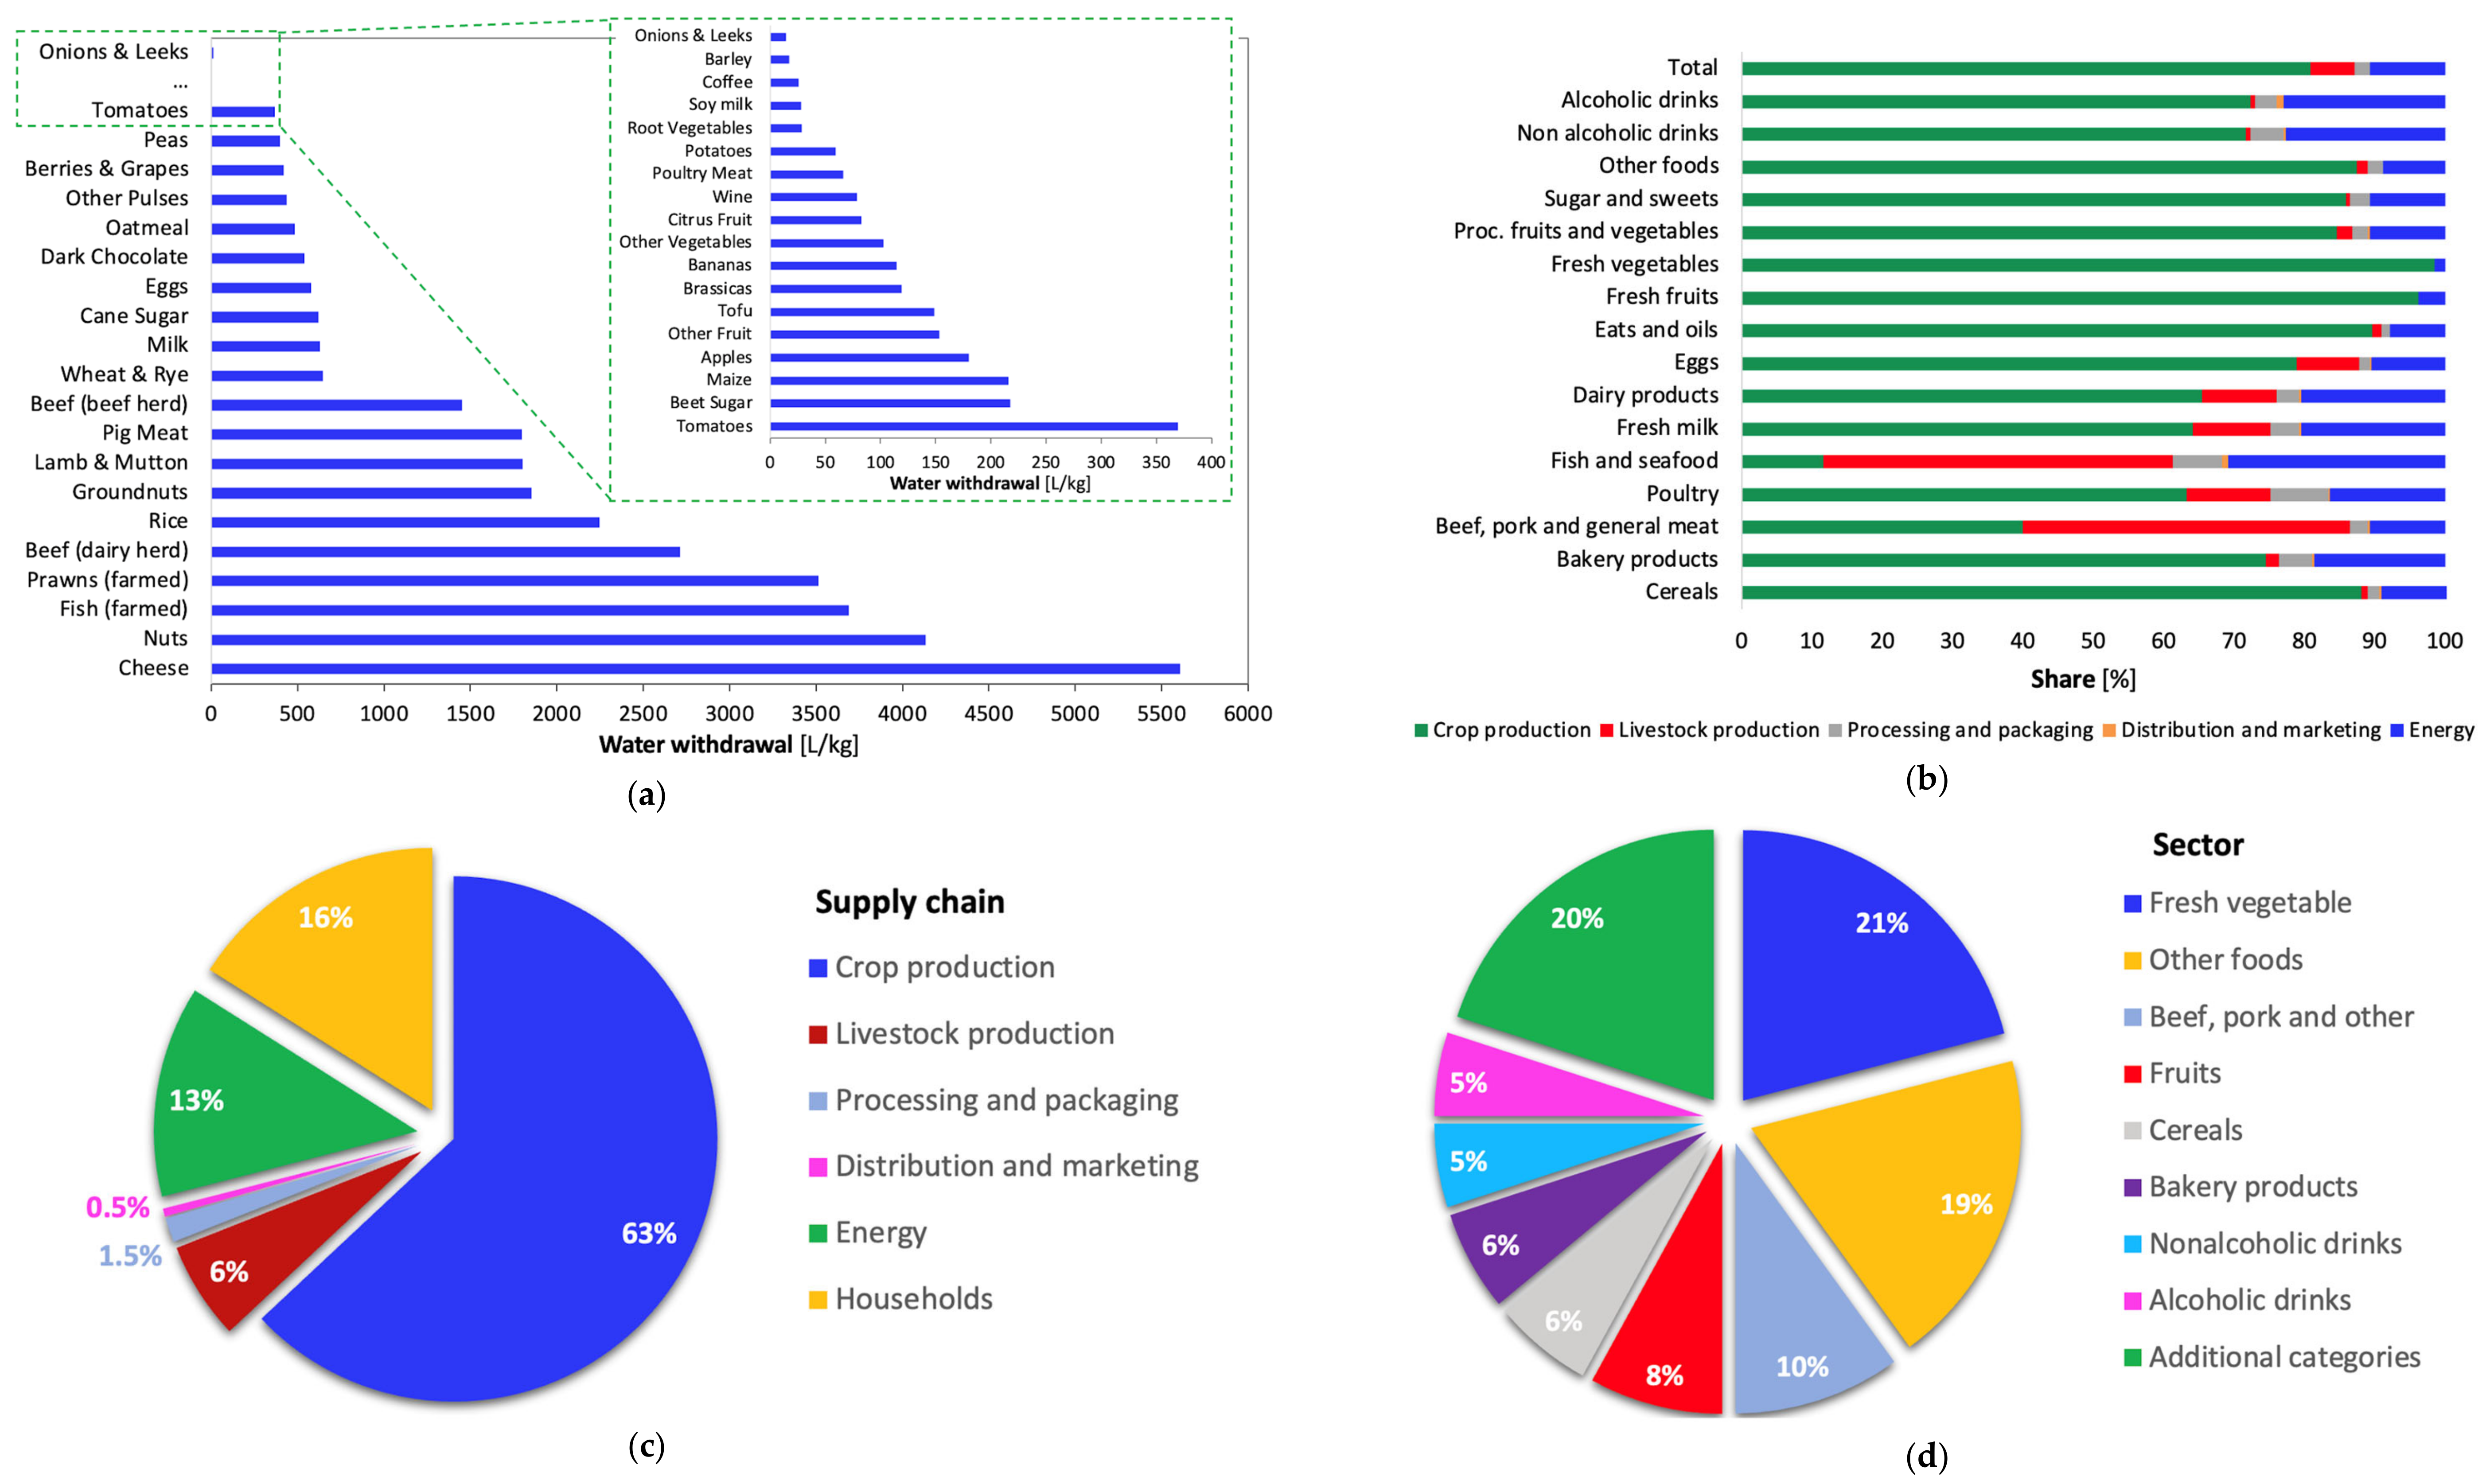
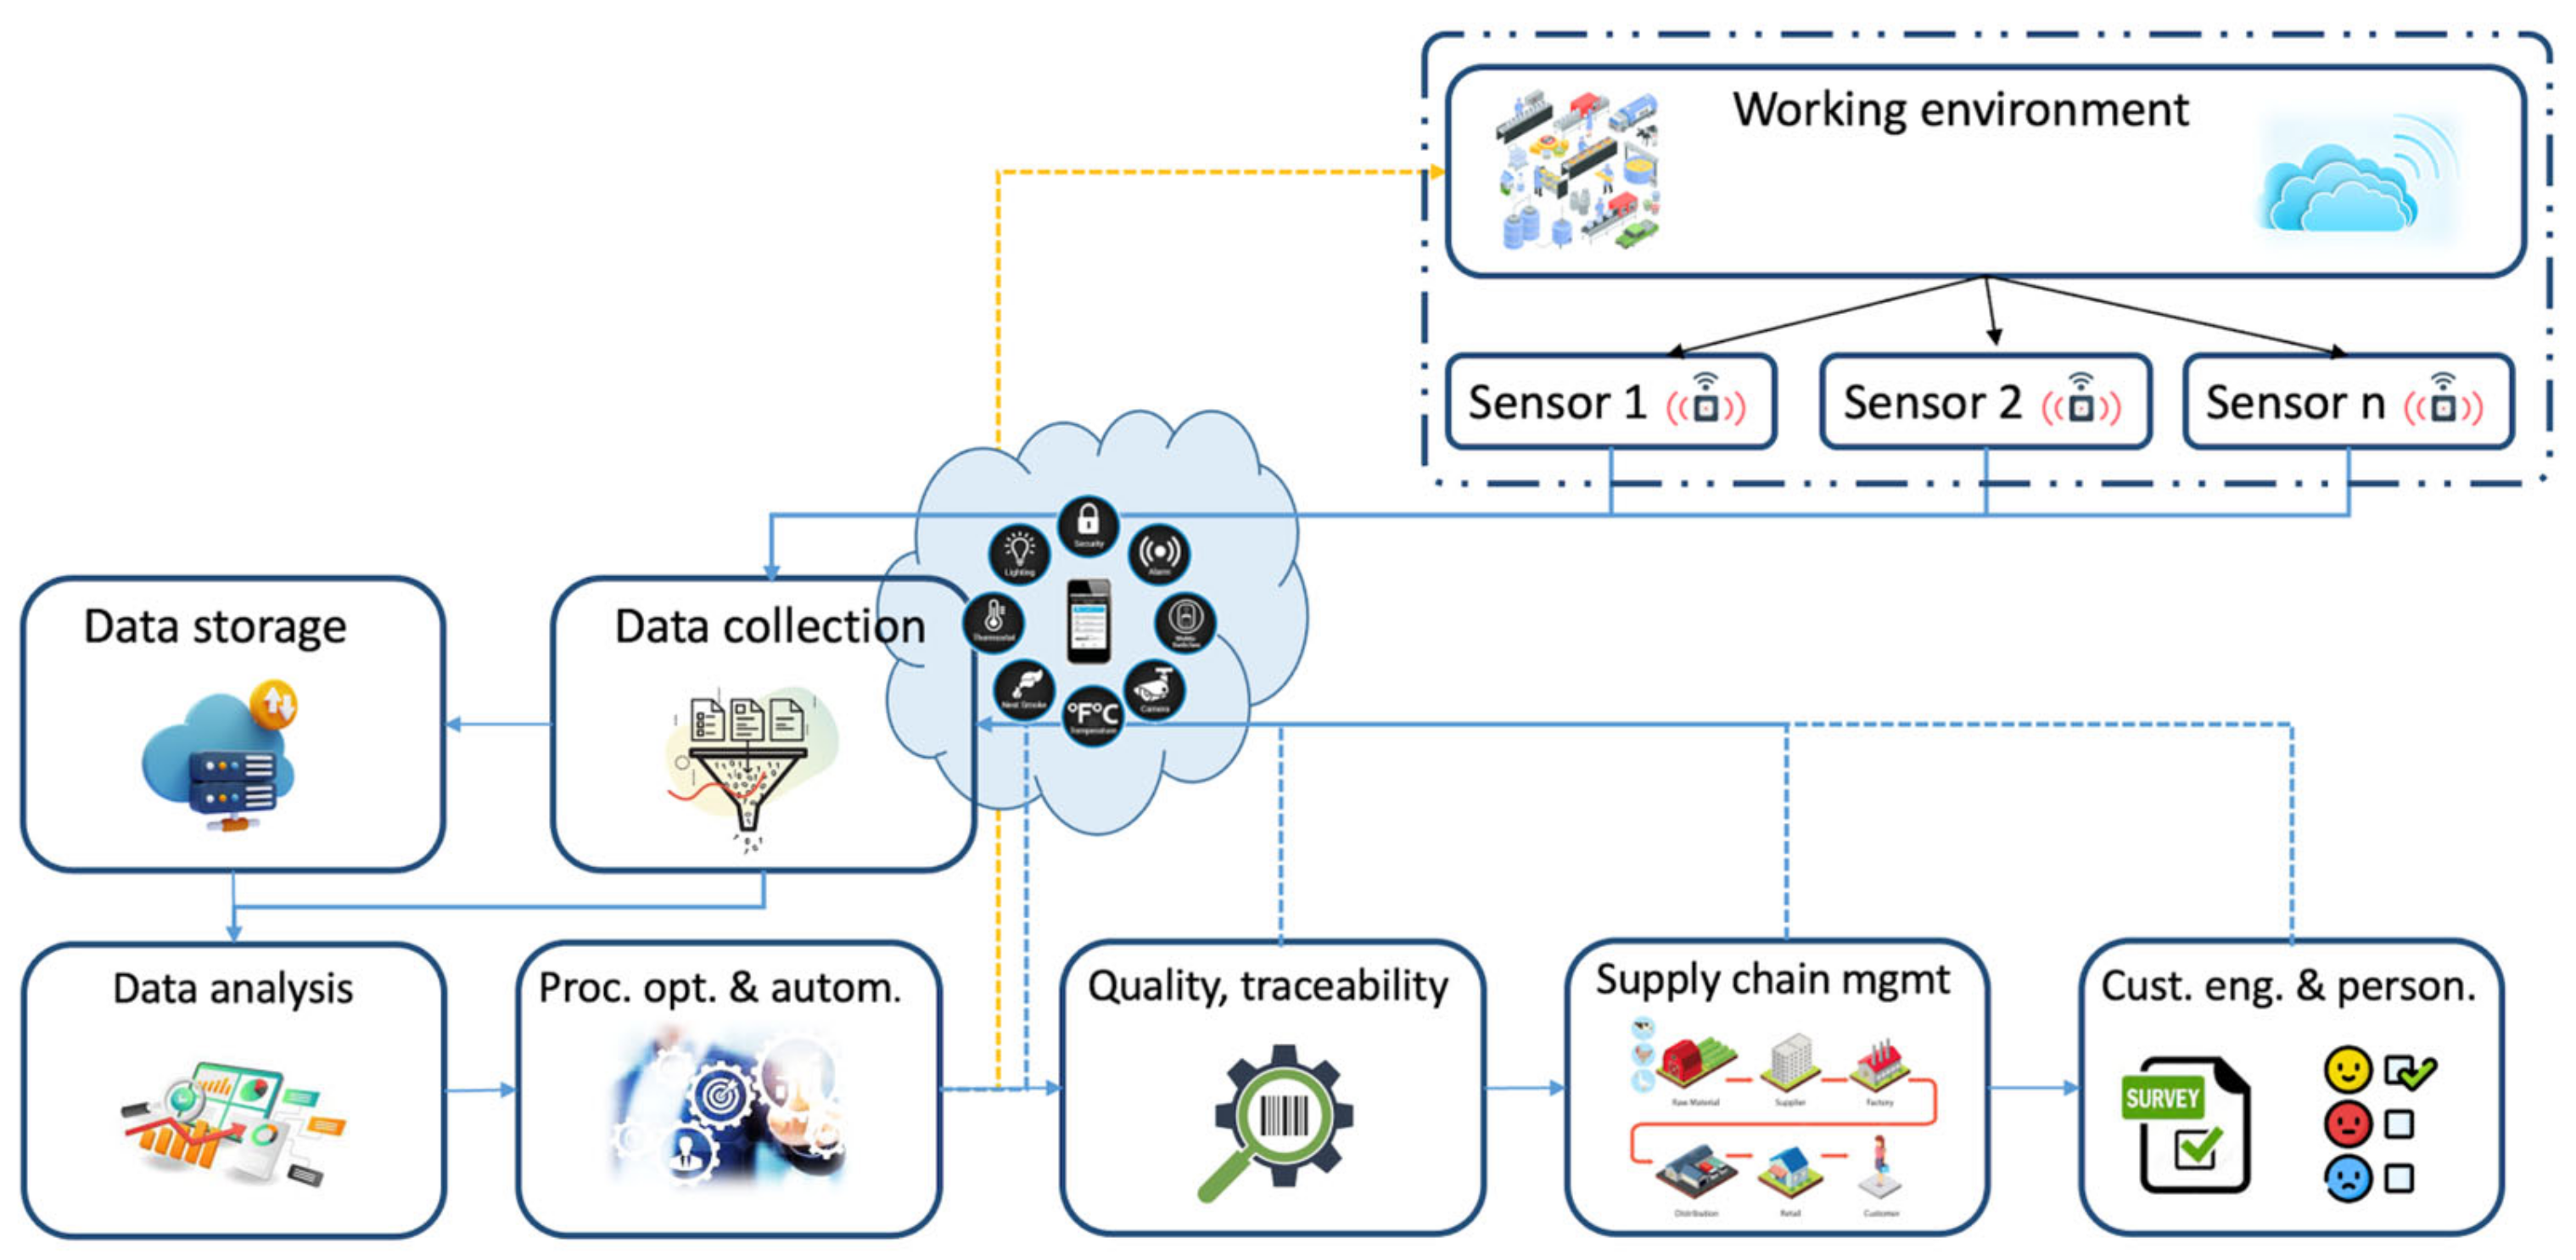
Disclaimer/Publisher’s Note: The statements, opinions and data contained in all publications are solely those of the individual author(s) and contributor(s) and not of MDPI and/or the editor(s). MDPI and/or the editor(s) disclaim responsibility for any injury to people or property resulting from any ideas, methods, instructions or products referred to in the content. |
© 2025 by the authors. Licensee MDPI, Basel, Switzerland. This article is an open access article distributed under the terms and conditions of the Creative Commons Attribution (CC BY) license (https://creativecommons.org/licenses/by/4.0/).