1. Introduction
Lower viscosity oils are being introduced to diesel engines to reduce engine-dominant hydrodynamic friction losses, but this comes with the risk of increasing the boundary friction [
1,
2]. Lubricant friction-modifier additives used on spark ignition (SI) engines—for example, MoDTC—are not used in diesel engines due to issues of metal and ash poisoning caused by the post-treatment diesel particulate filter (DPF). Graphene-based materials have great potential for tribological applications as part of attempts to reduce friction and fuel consumption [
3,
4,
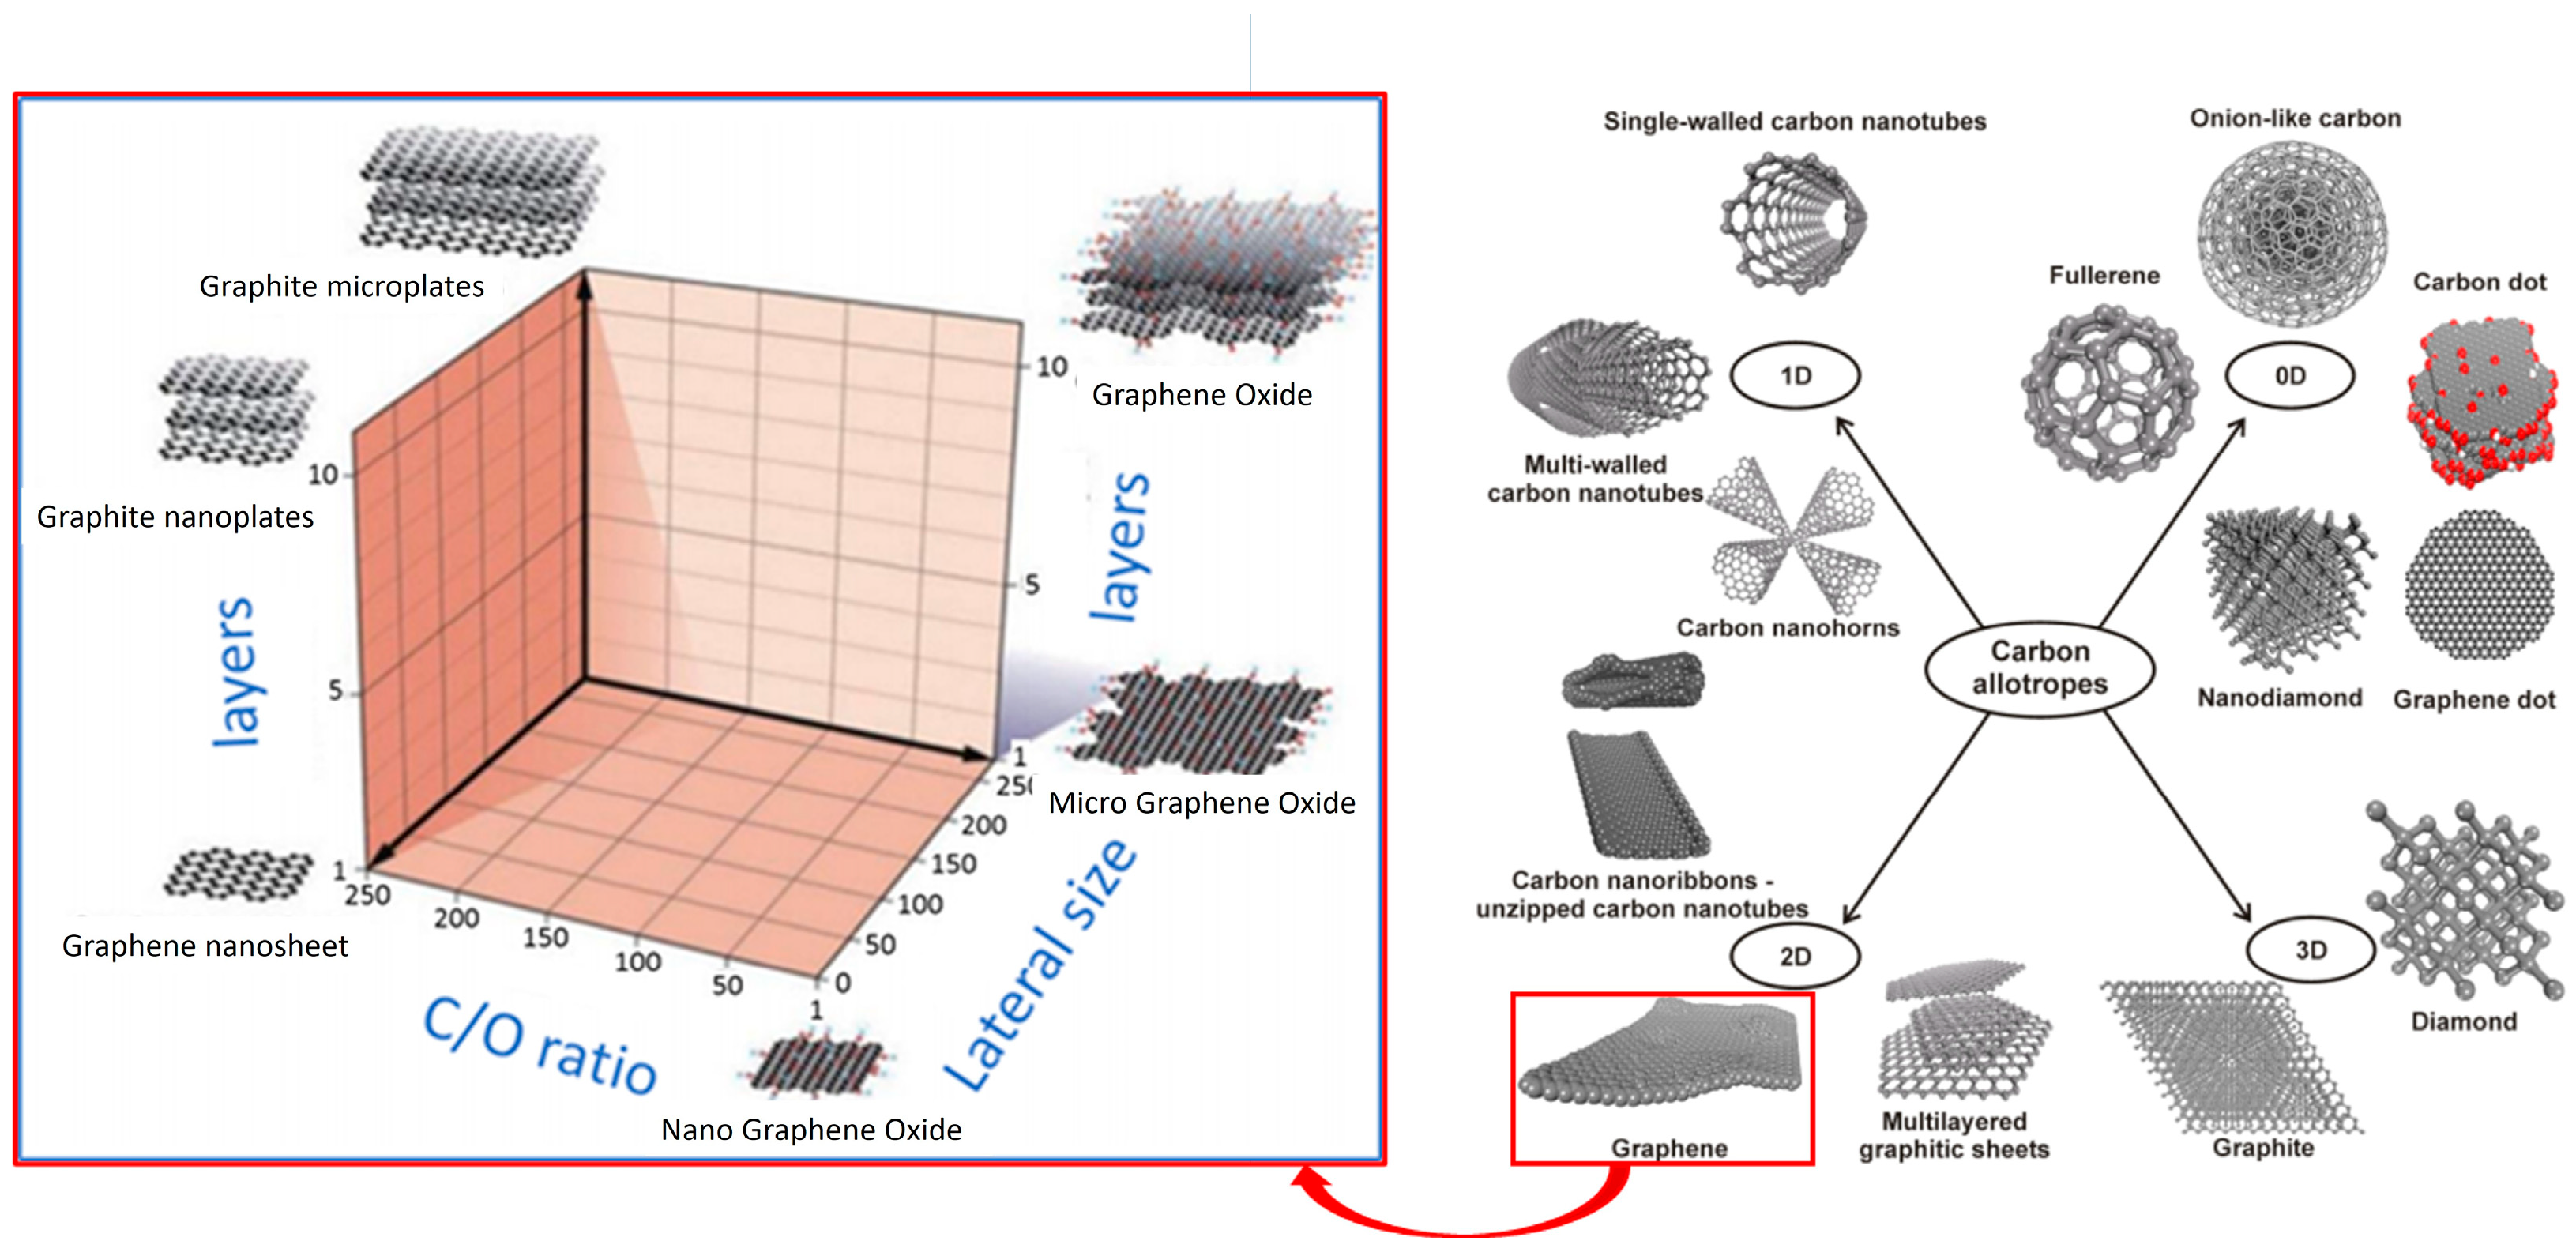
5]. Graphene is part of a broad family of carbon nanoallotropes; graphene itself is part of a family primarily comprising sp
2 carbon atoms arranged in a hexagonal network, as represented in
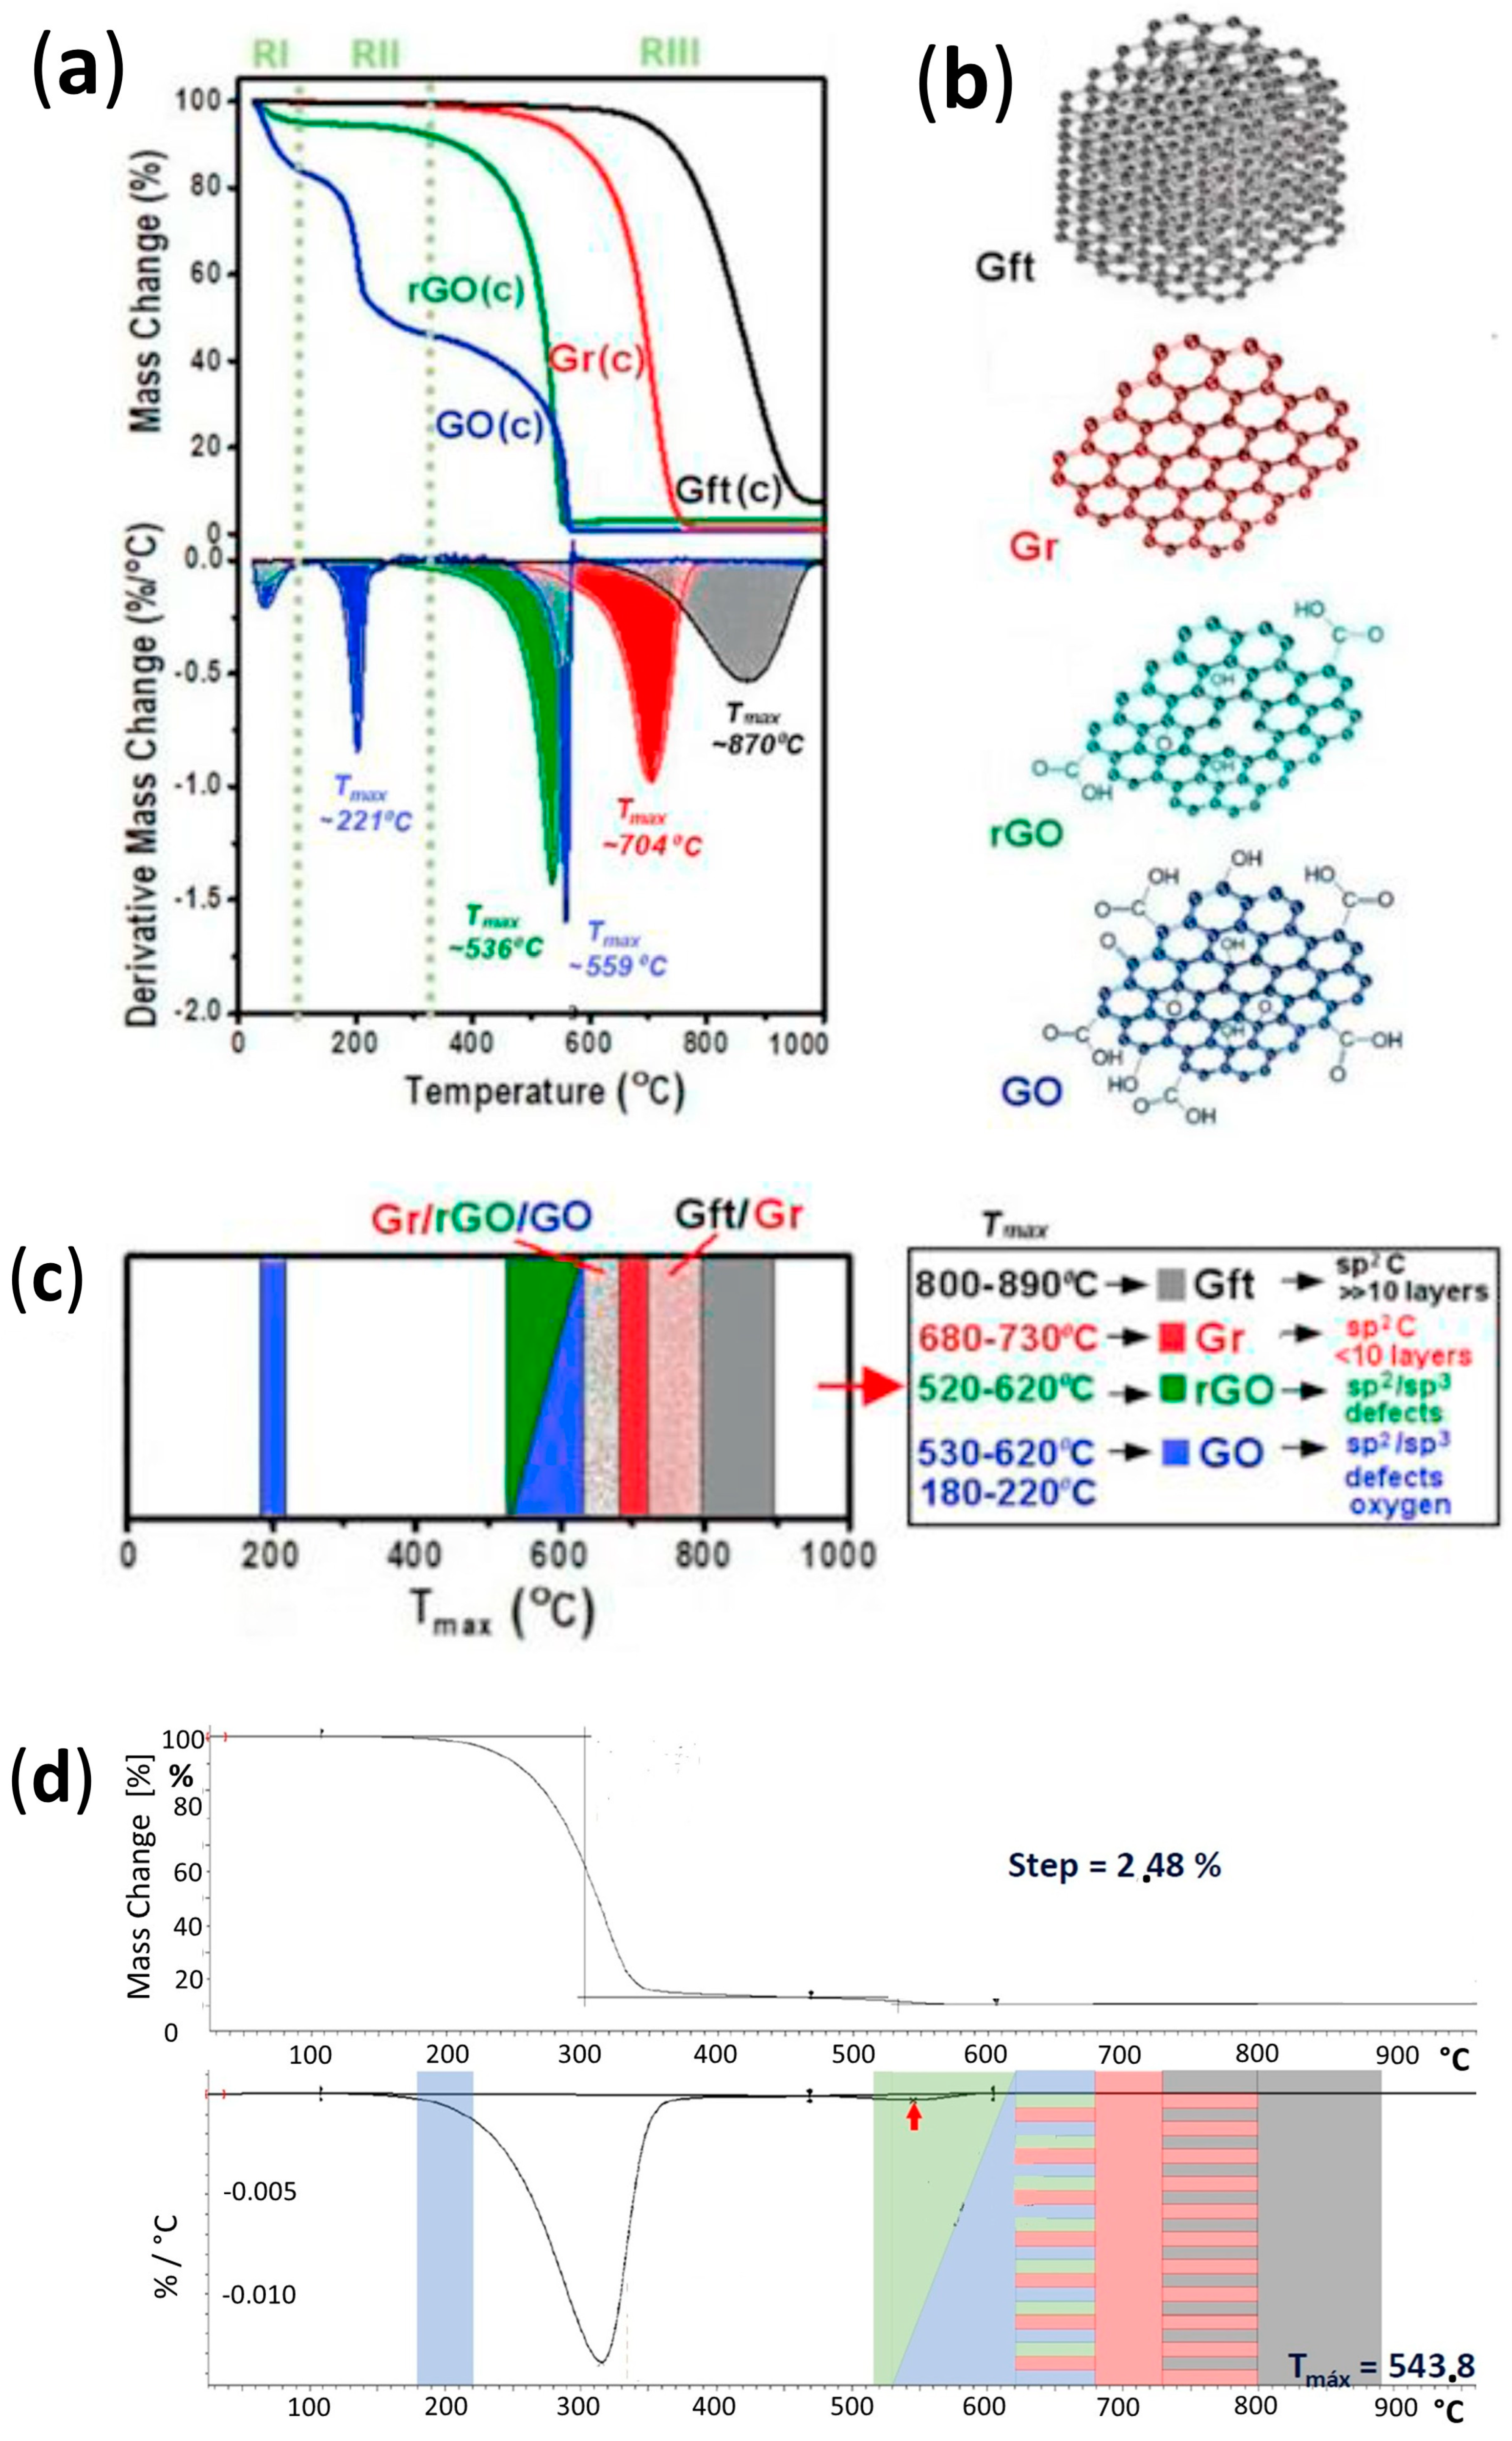
Figure 1. In particular, graphene nanoplatelets (GNPs) consist of more than six graphene layers, with a combined thickness between 1 and 3 nm and lateral dimensions ranging from approximately 100 nm to 100 µm. Graphene oxides (GOs) are chemically modified graphene that is prepared by oxidizing and exfoliating graphite. Graphene oxide is a single-layer material with a high oxygen content, typically characterized by C/O atomic ratios of approximately two. Reducing the oxygen content of graphene oxide creates reduced graphene oxide (rGO). Different reducing agents will lead to reduced graphene oxide having different carbon-to-oxygen ratios and different chemical compositions. It can take the form of several morphological variations, such as platelets and worm-like structures. Another carbon nano-variant is the carbon nanotube (CNT), which is a carbon with a diameter in nanometers and a length in micrometers (where the length-to-diameter ratio exceeds 1000).
Graphene exhibits many important advantages over traditional lubricating materials [
6]:
- -
Very high strength and both mechanical and chemical stability;
- -
A low coefficient of friction;
- -
Self-lubricating properties;
- -
High thermal conductivity, which helps to dissipate the heat generated by friction;
- -
Susceptibility to chemical modification, which helps with adapting its properties to different applications.
The effects of 2D materials, in particular graphene, on tribological or other phenomena that are responsible for reducing friction and other losses remain unclear (see further discussion in [
6]). The more probable effects are (a) the creation of a protective, low-friction tribofilm; (b) the filling and mending of surface roughness; (c) hydrodynamic effects; and (d) thermal effects. However, there is some speculation that graphene can also serve as a combustion improver, even when a small quantity of lubricant is burned (see Section 7 in [
6]).
Graphene’s unique properties, such as low shear resistance, high stiffness, and thermal conductivity, make it an attractive material for improving the properties of lubricants in a wide range of industrial applications, including vehicles, domestic refrigerators, and industrial machinery such as gearboxes, large compressors, etc. [
6,
7,
8,
9,
10,
11]. There is much research literature on the tribological, anti-wear, and other physical and chemical properties of graphene when it is used as an additive to engine oil. However, relatively few papers present the results of tests on working engines [
7,
8,
11,
12,
13]. Some of the reported fuel savings from using graphene-based additives are much larger than their potential friction reduction (
Table 1). Therefore, while it is necessary to investigate the effect of graphene additives on engine efficiency, it is also important to consider other significant parameters, such as emissions or the service life of both the oil itself and the engine it lubricates.
This study investigated the effect of two graphene-based lubricant additives on the fuel consumption of diesel engines. One additive with graphene oxide was commercially available, while the other with graphene nanoplatelets was an in-house development. The tests were carried out on an engine dynamometer.
3. Engine Tests of GO Additive
For the engine test, the GO additive was added in a concentration of 3% v/v to a fully synthetic, ACEA C2, Low SAPS, SAE 5W-30 engine oil. The dynamometer tests were carried out first using the baseline oil without the additive and then with the additive.
3.1. HSD Engine
The engine used for the tests was an automotive four-cylinder, turbocharged direct fuel injection diesel engine with intake air cooling and exhaust gas recirculation. The engine had four valves per cylinder and a common rail injection system. The engine had a cast iron block and aluminum pistons with typical ring sets. The technical specifications of the test engine are presented in
Table 3.
3.2. Test Stand
The tests were carried out on a dynamometer test stand equipped with a Schenck W130 eddy current brake (Darmstadt, Germany), which allowed for precise rotational speed control and the measurement of engine speed and torque. The AVL 733S Dynamic Fuel Balance, Graz, Austria, was used to measure fuel consumption. The test stand was equipped with a precise system for maintaining the set temperature of the engine coolant. To precisely maintain the temperature of the engine oil, an additional external oil cooling system was used. The most important parameters of the dynamometer test stand are presented in
Table 4.
3.3. Procedure
The dynamometer test was conducted at two accelerator pedal positions—100% and 30%—and five engine rotational speeds—2000, 2500, 3000, 3500, and 4000 rpm. Each test was repeated three times for both the baseline oil and the oil with the graphene-based additive. It is important to note that the tests were repeated on different days after the engine had completely cooled down to maintain accuracy and consistency. First, tests were performed on the baseline oil (BL). Then, the tests were performed on oil containing 3% of the graphene-based additive (GO). Before pouring the additive, the same oil volume was removed from the crankcase to maintain a constant engine oil volume. After pouring the additive, the engine was operated for approx. 20 h in various conditions for the oil to mix and the additive to work. Then, the tests were conducted on the oil containing the additive.
In addition to the above-described tests under load, fuel consumption measurements were taken for the engine operating without load. In such conditions, the influence of mechanical resistance on fuel consumption, and therefore the effect of the additive, should be greater. When operating at increased rotational speeds without load, the engine control unit (ECU) sometimes started the regeneration of the particulate filter (DPF), even if its filling level was small. To prevent this, the exhaust gas temperature sensor behind the DPF was disconnected during measurements without load. The lack of a signal from this sensor caused the failure of the ECU to start the DPF regeneration procedure. Another problem was the difficulty in precisely setting the rotational speed. Under load, the dynamometer controller maintained the set speed very accurately —the speed remained practically unchanged. However, without load, even the smallest change in the accelerator pedal settings could cause a change in speed by even a dozen or more rpms. Furthermore, sometimes the ECU itself (the accelerator settings were not changed) changed this speed and these changes were sometimes very large, even greater than 50 rpm. Therefore, in conditions without load, it was not possible to carry out measurements at the predetermined rotational speeds during particular repetitions of the test. The measurements were taken at speeds at which the engine was running at a constant speed (changes no greater than 10 rpm) for long enough to perform the measurements. During this interval, which spanned several minutes, the temperature stabilization period and the time of operation in steady-state conditions were accounted for. It was within this timeframe that the measurements for fuel consumption were taken. The fuel consumption at a given measurement point, during tests both with and without load, were determined by taking the average of four subsequent readings from the meter. Each measurement took 20 seconds, as specified in the meter settings. Additionally, the no-load test was repeated three times for each oil to ensure accuracy and consistency of the results.
3.4. Results of Dynamometer Tests
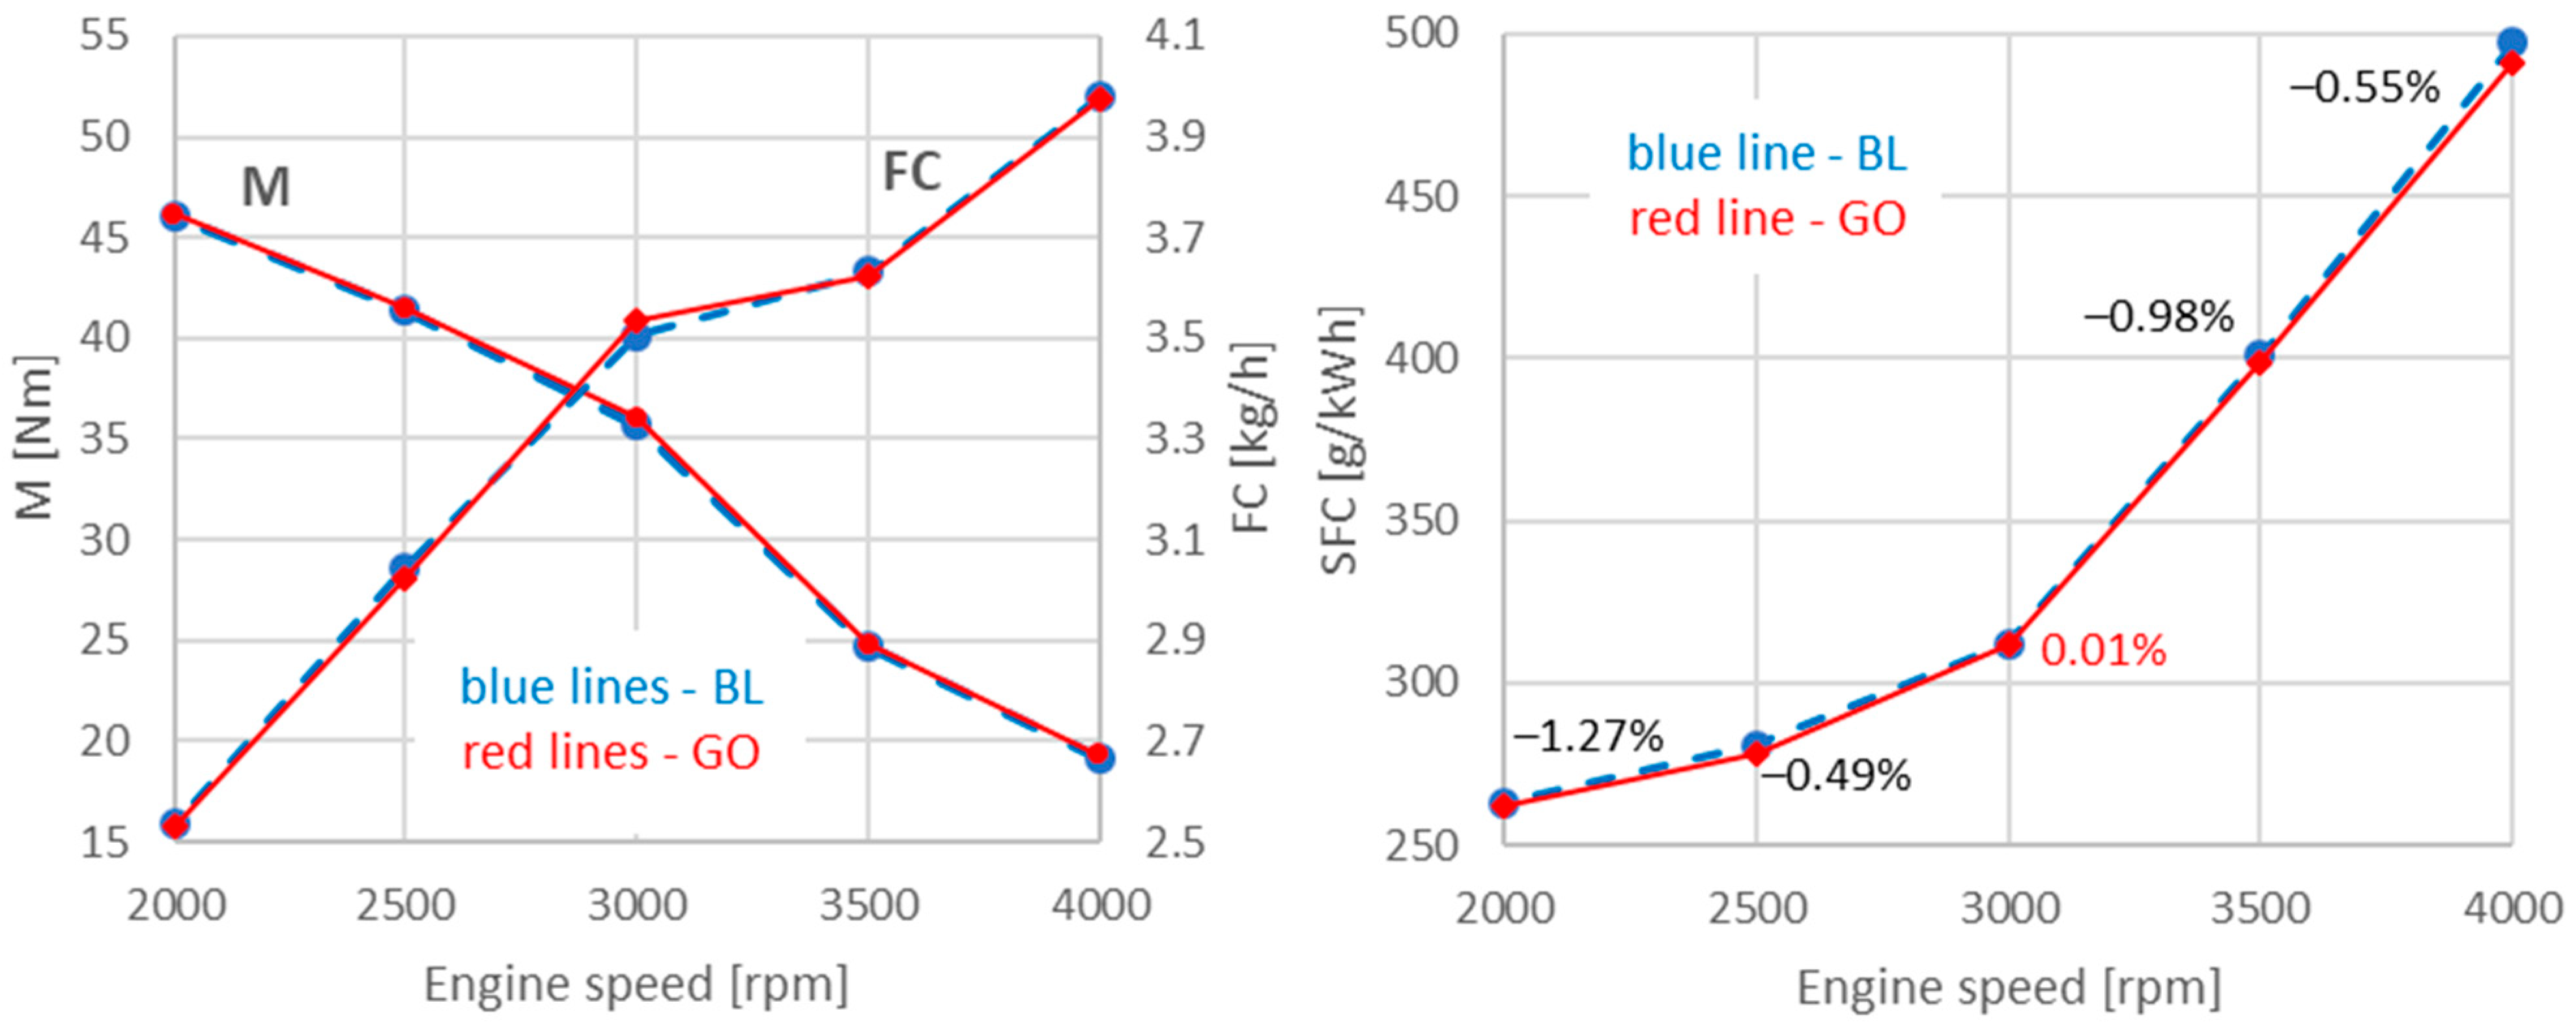
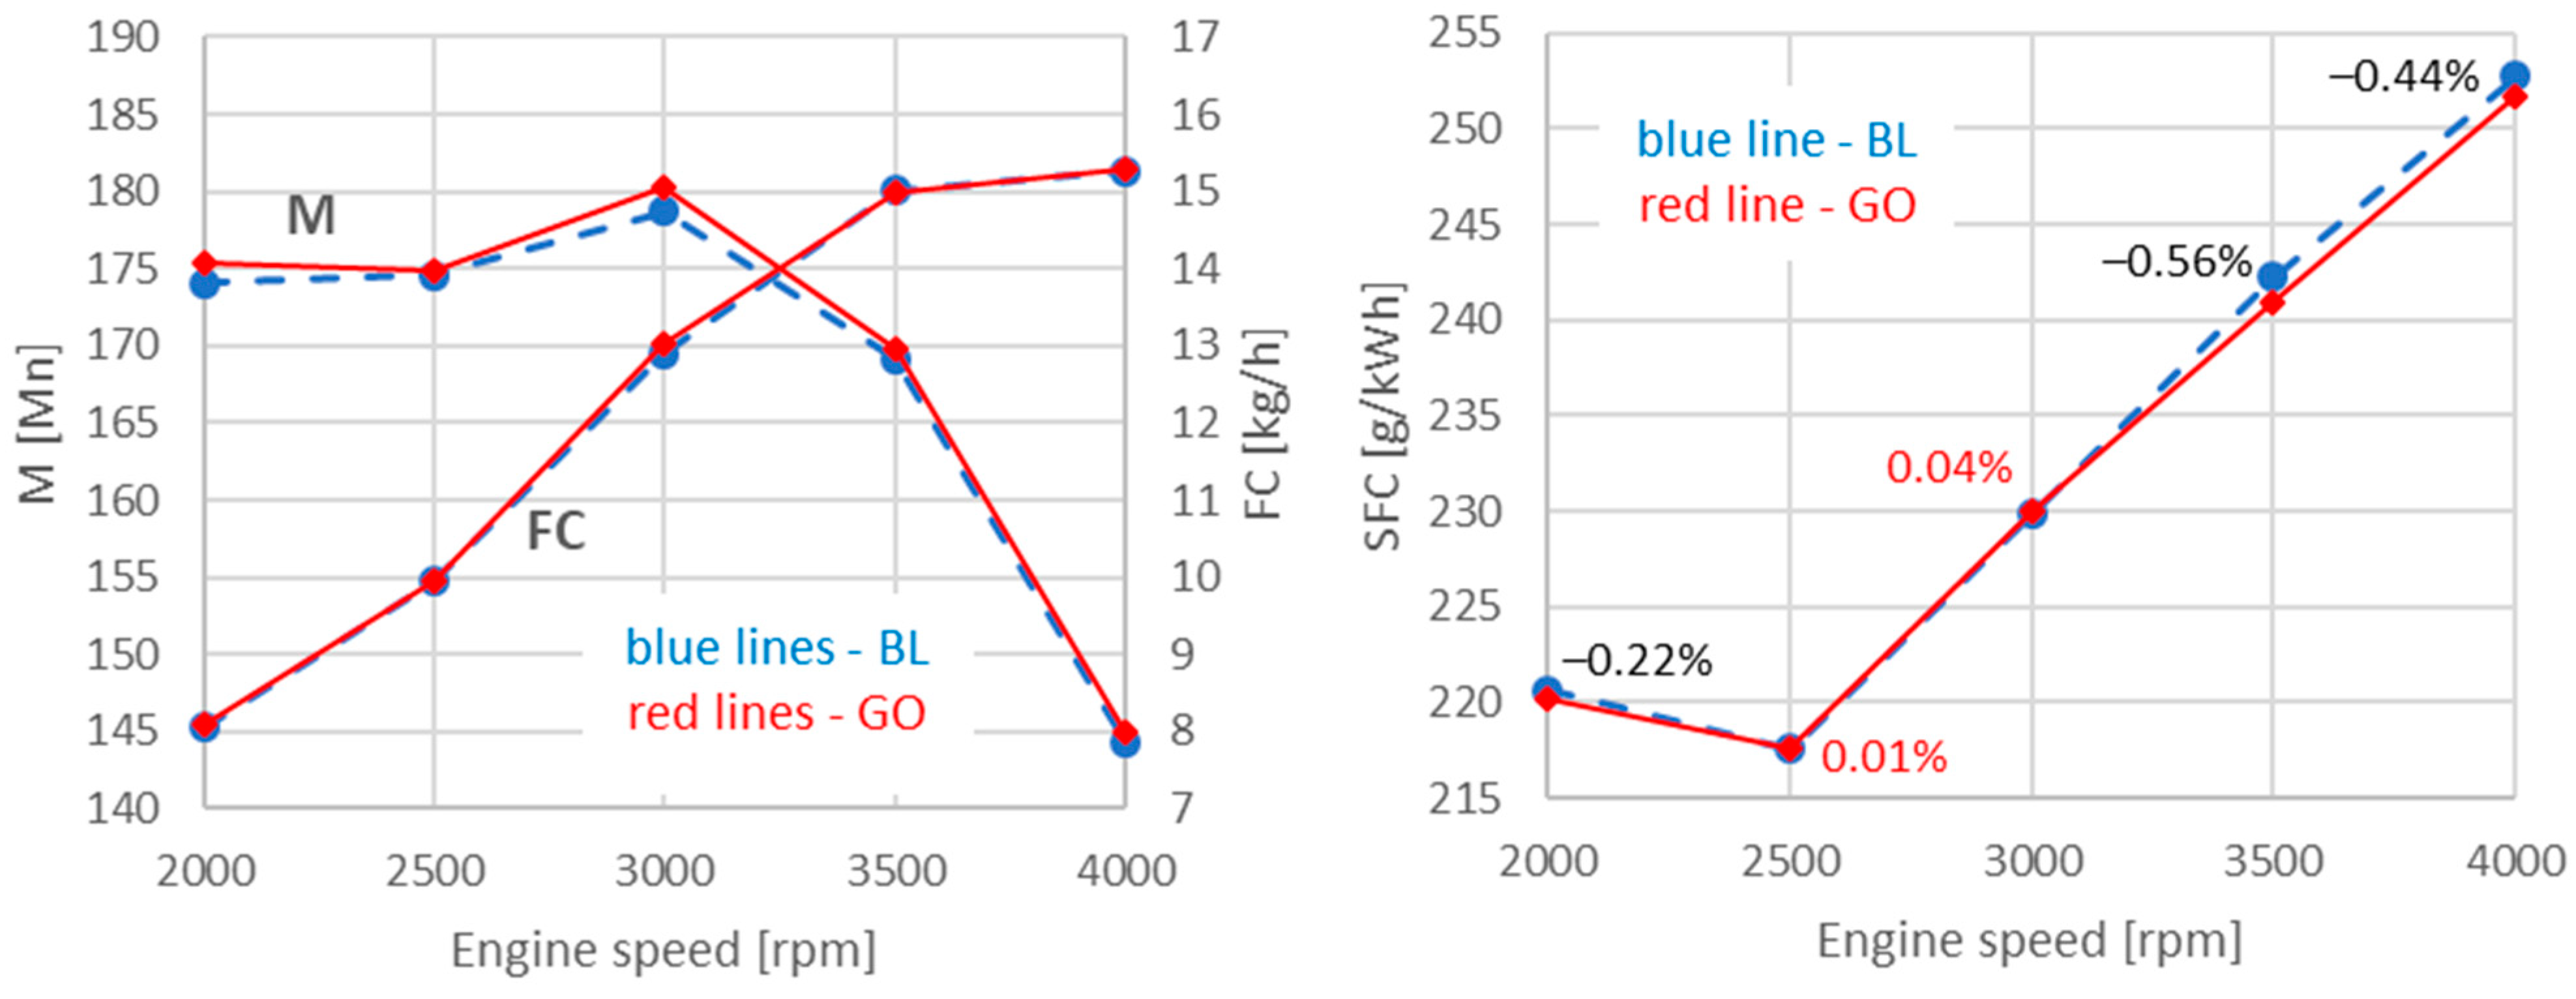
The mean values obtained from the results of the three repeated tests for baseline oil (BL) and for oil with the additive (GO) are presented in
Figure 7 and
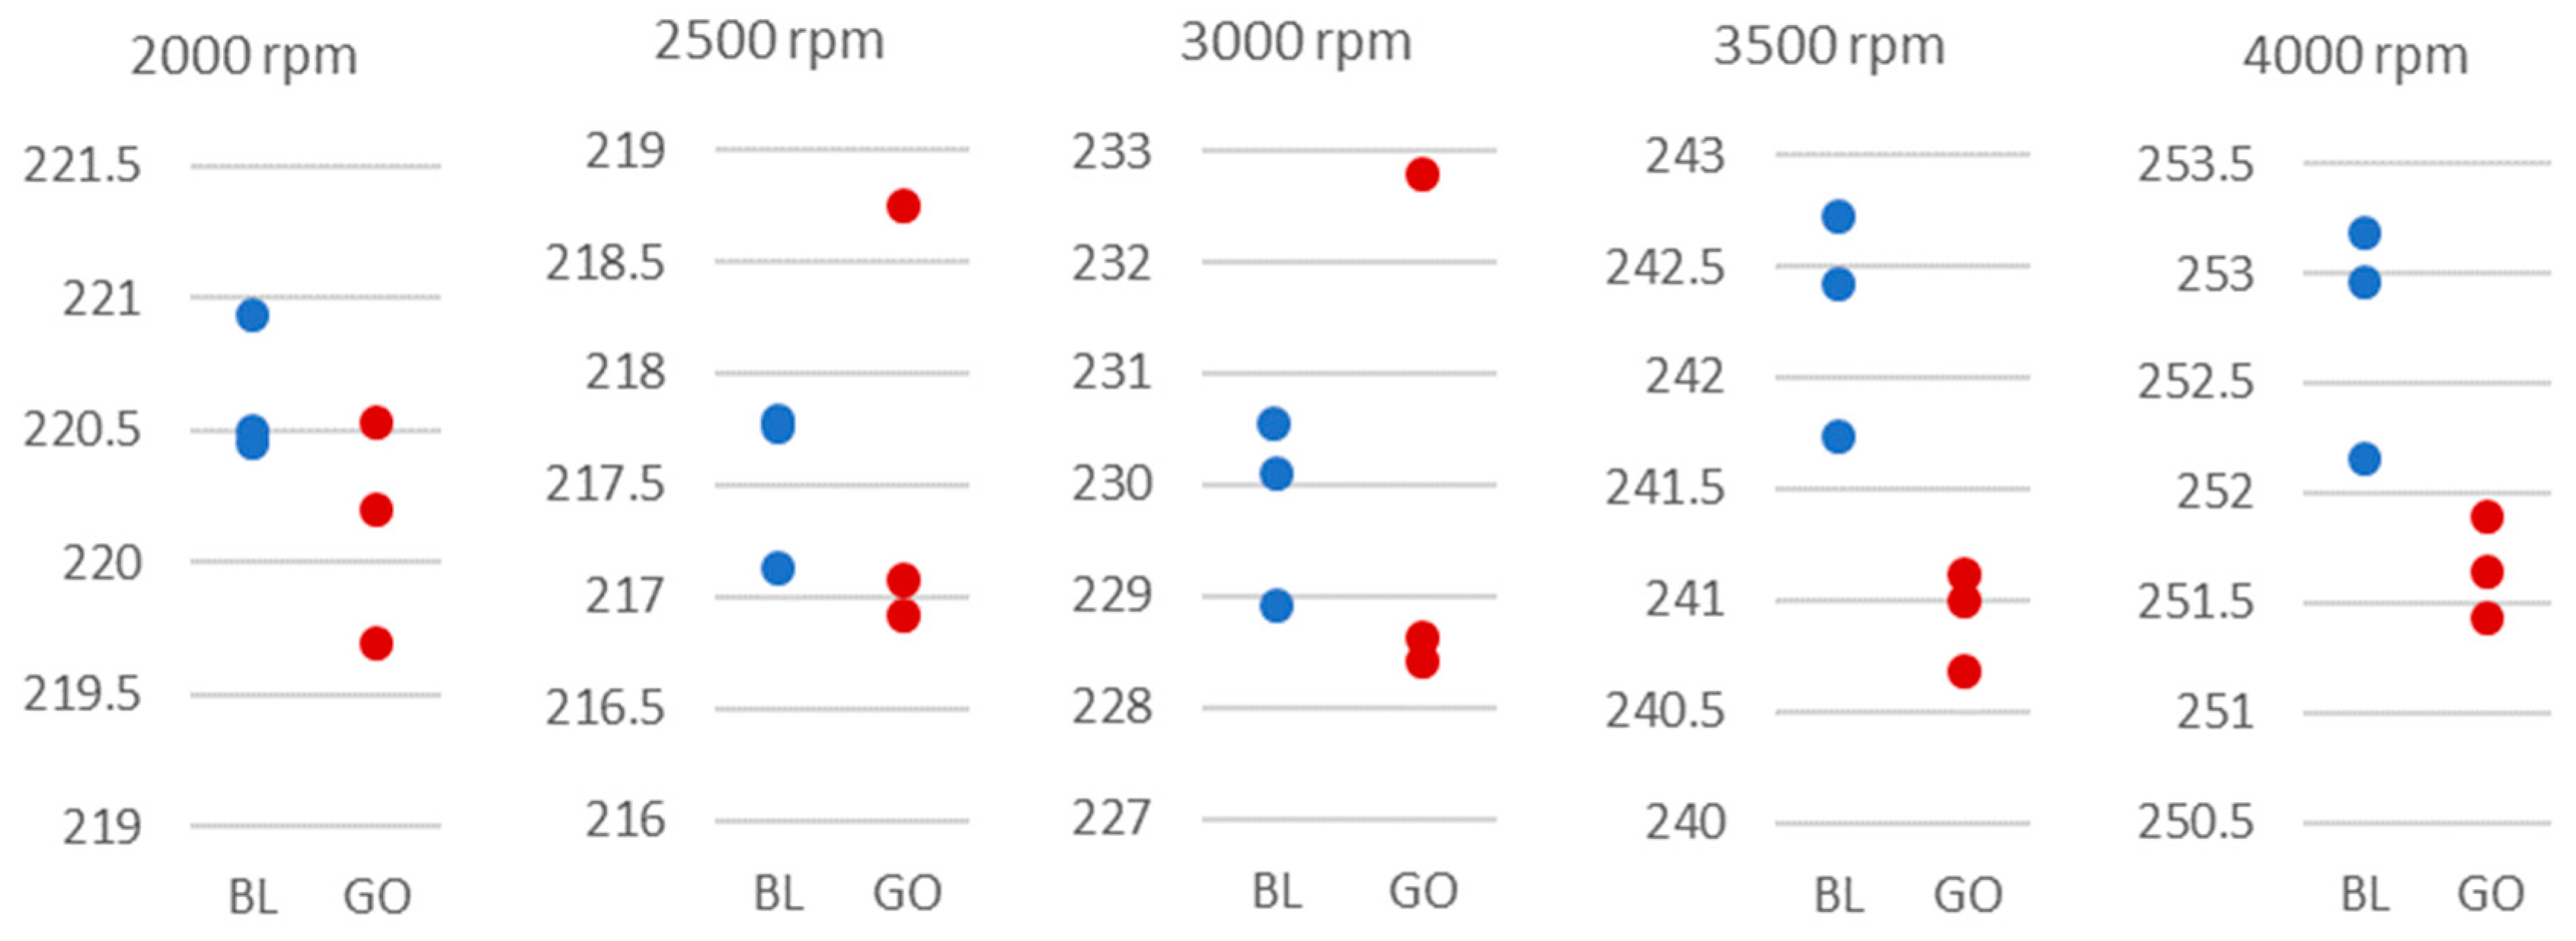
Figure 8. On average, the torque at the part load of the engine increased by 0.57% after the additive was added. Fuel consumption remained nearly the same when using the oil without and with the additive (exactly, on average, FC was 0.09% lower for the oil with the additive). The specific fuel consumption (SFC) also decreased by 0.66% when using the additive.
Under full-load conditions, the torque for the engine working on oil with the additive increased by an average of 0.51%. However, as fuel consumption also showed a small increase of 0.27%, SFC for oil with the additive decreased on average by only 0.23%.
Since the differences in SFC for oil with and without the additive are relatively small, statistical tests of their significance were performed using Student’s
t-test. This analysis used SFC values calculated based on all M and FC readings taken during the measurements (sample size 12). The test results indicate that for a confidence level of 0.95, the differences between the averages in SFC are statistically insignificant in three cases: at partial load and 3000 rpm, and full load and 3000 and 3500 rpm (marked in red in
Figure 7 and
Figure 8). In the remaining cases, the differences in SFC between oil without and with the additive are significant at the assumed confidence level of 0.95.
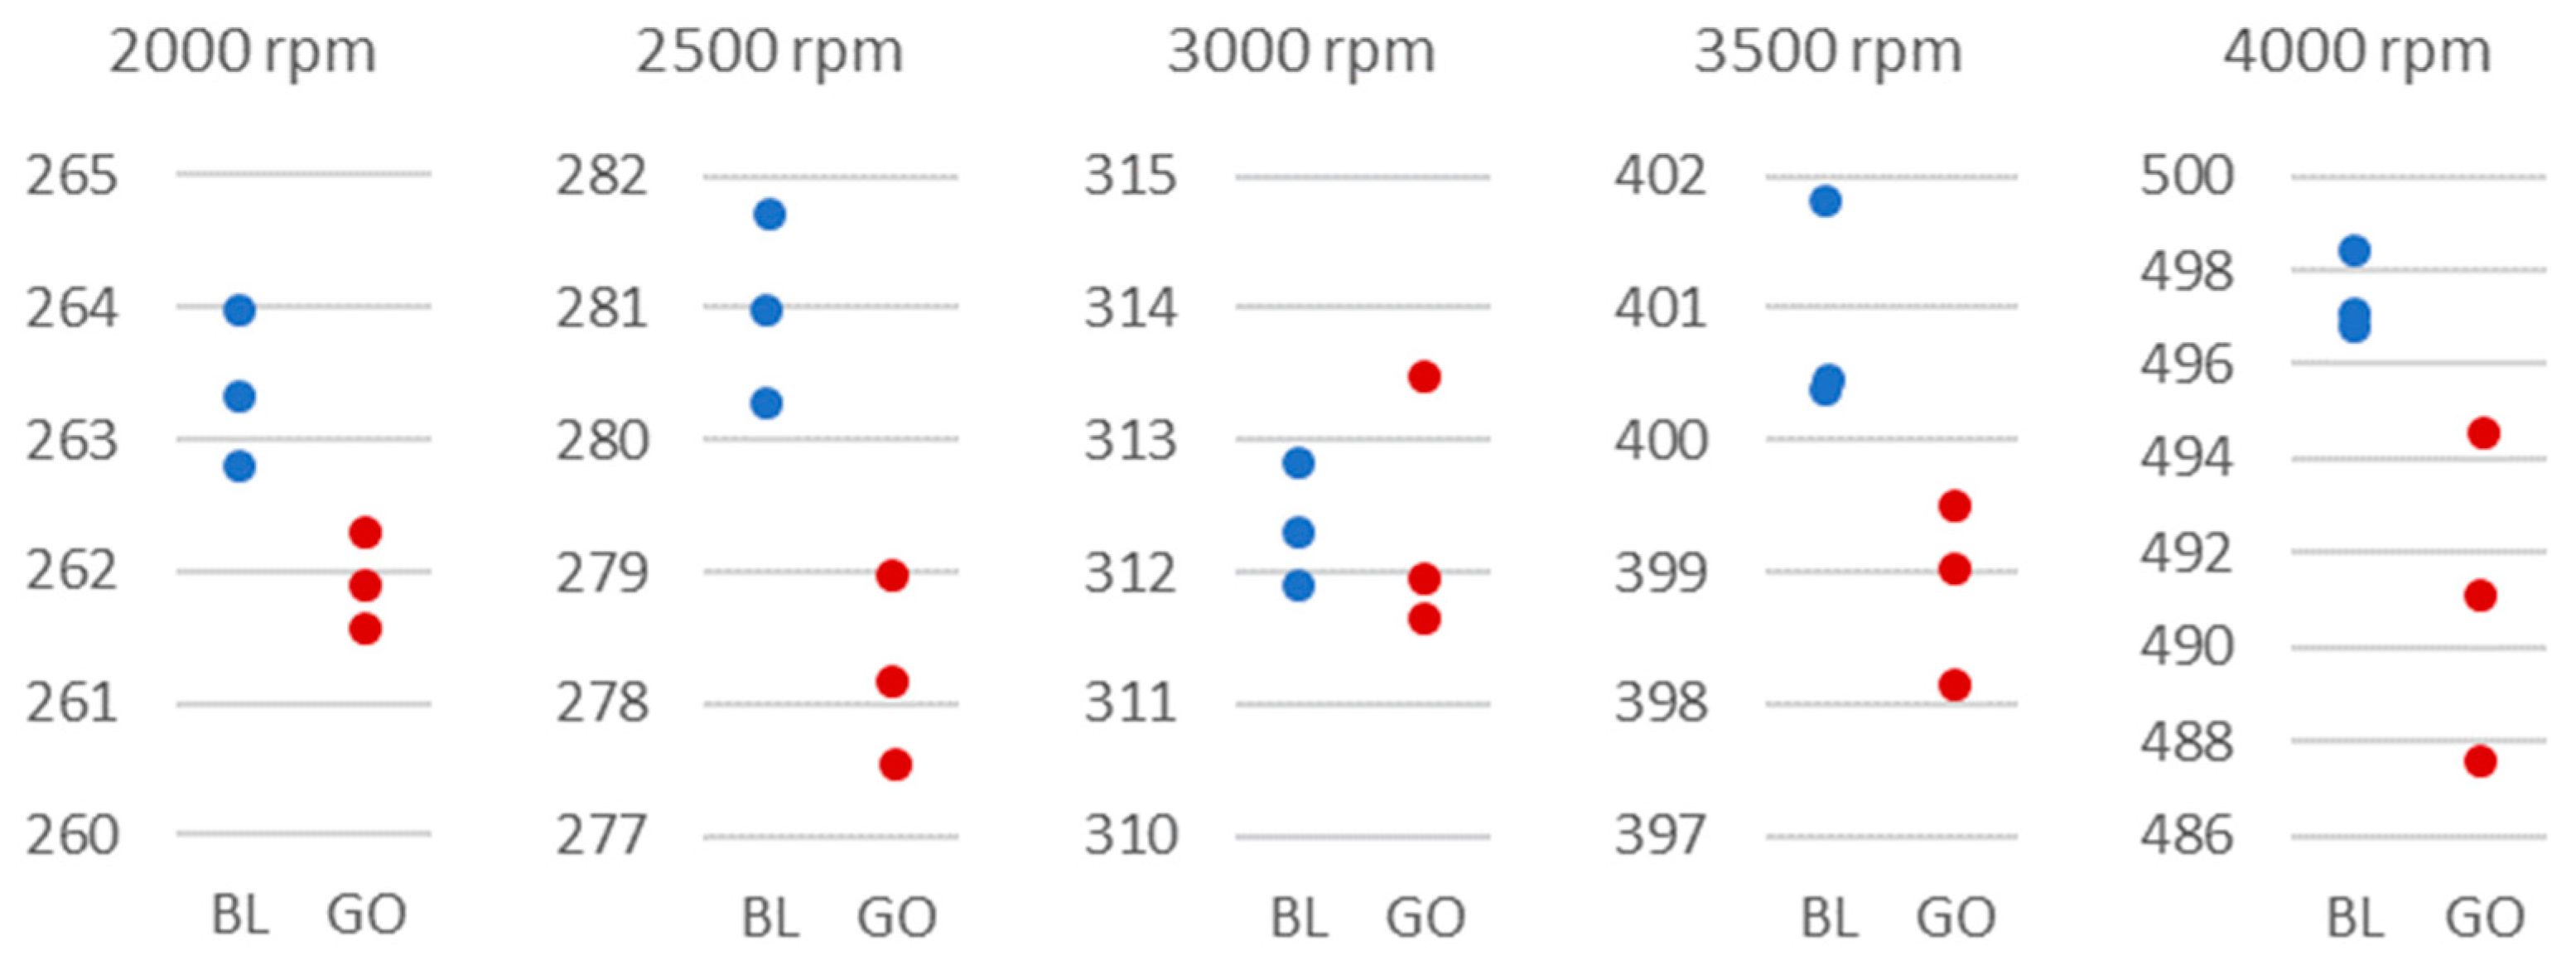
Figure 9 and
Figure 10 show the SFC values obtained during the three tests performed on oil without additive and with the 3% GO-based additive.
Maximum engine torque and power increased by 0.8% and 0.4% with the oil additive. These differences are statistically significant at the 0.95 confidence level.
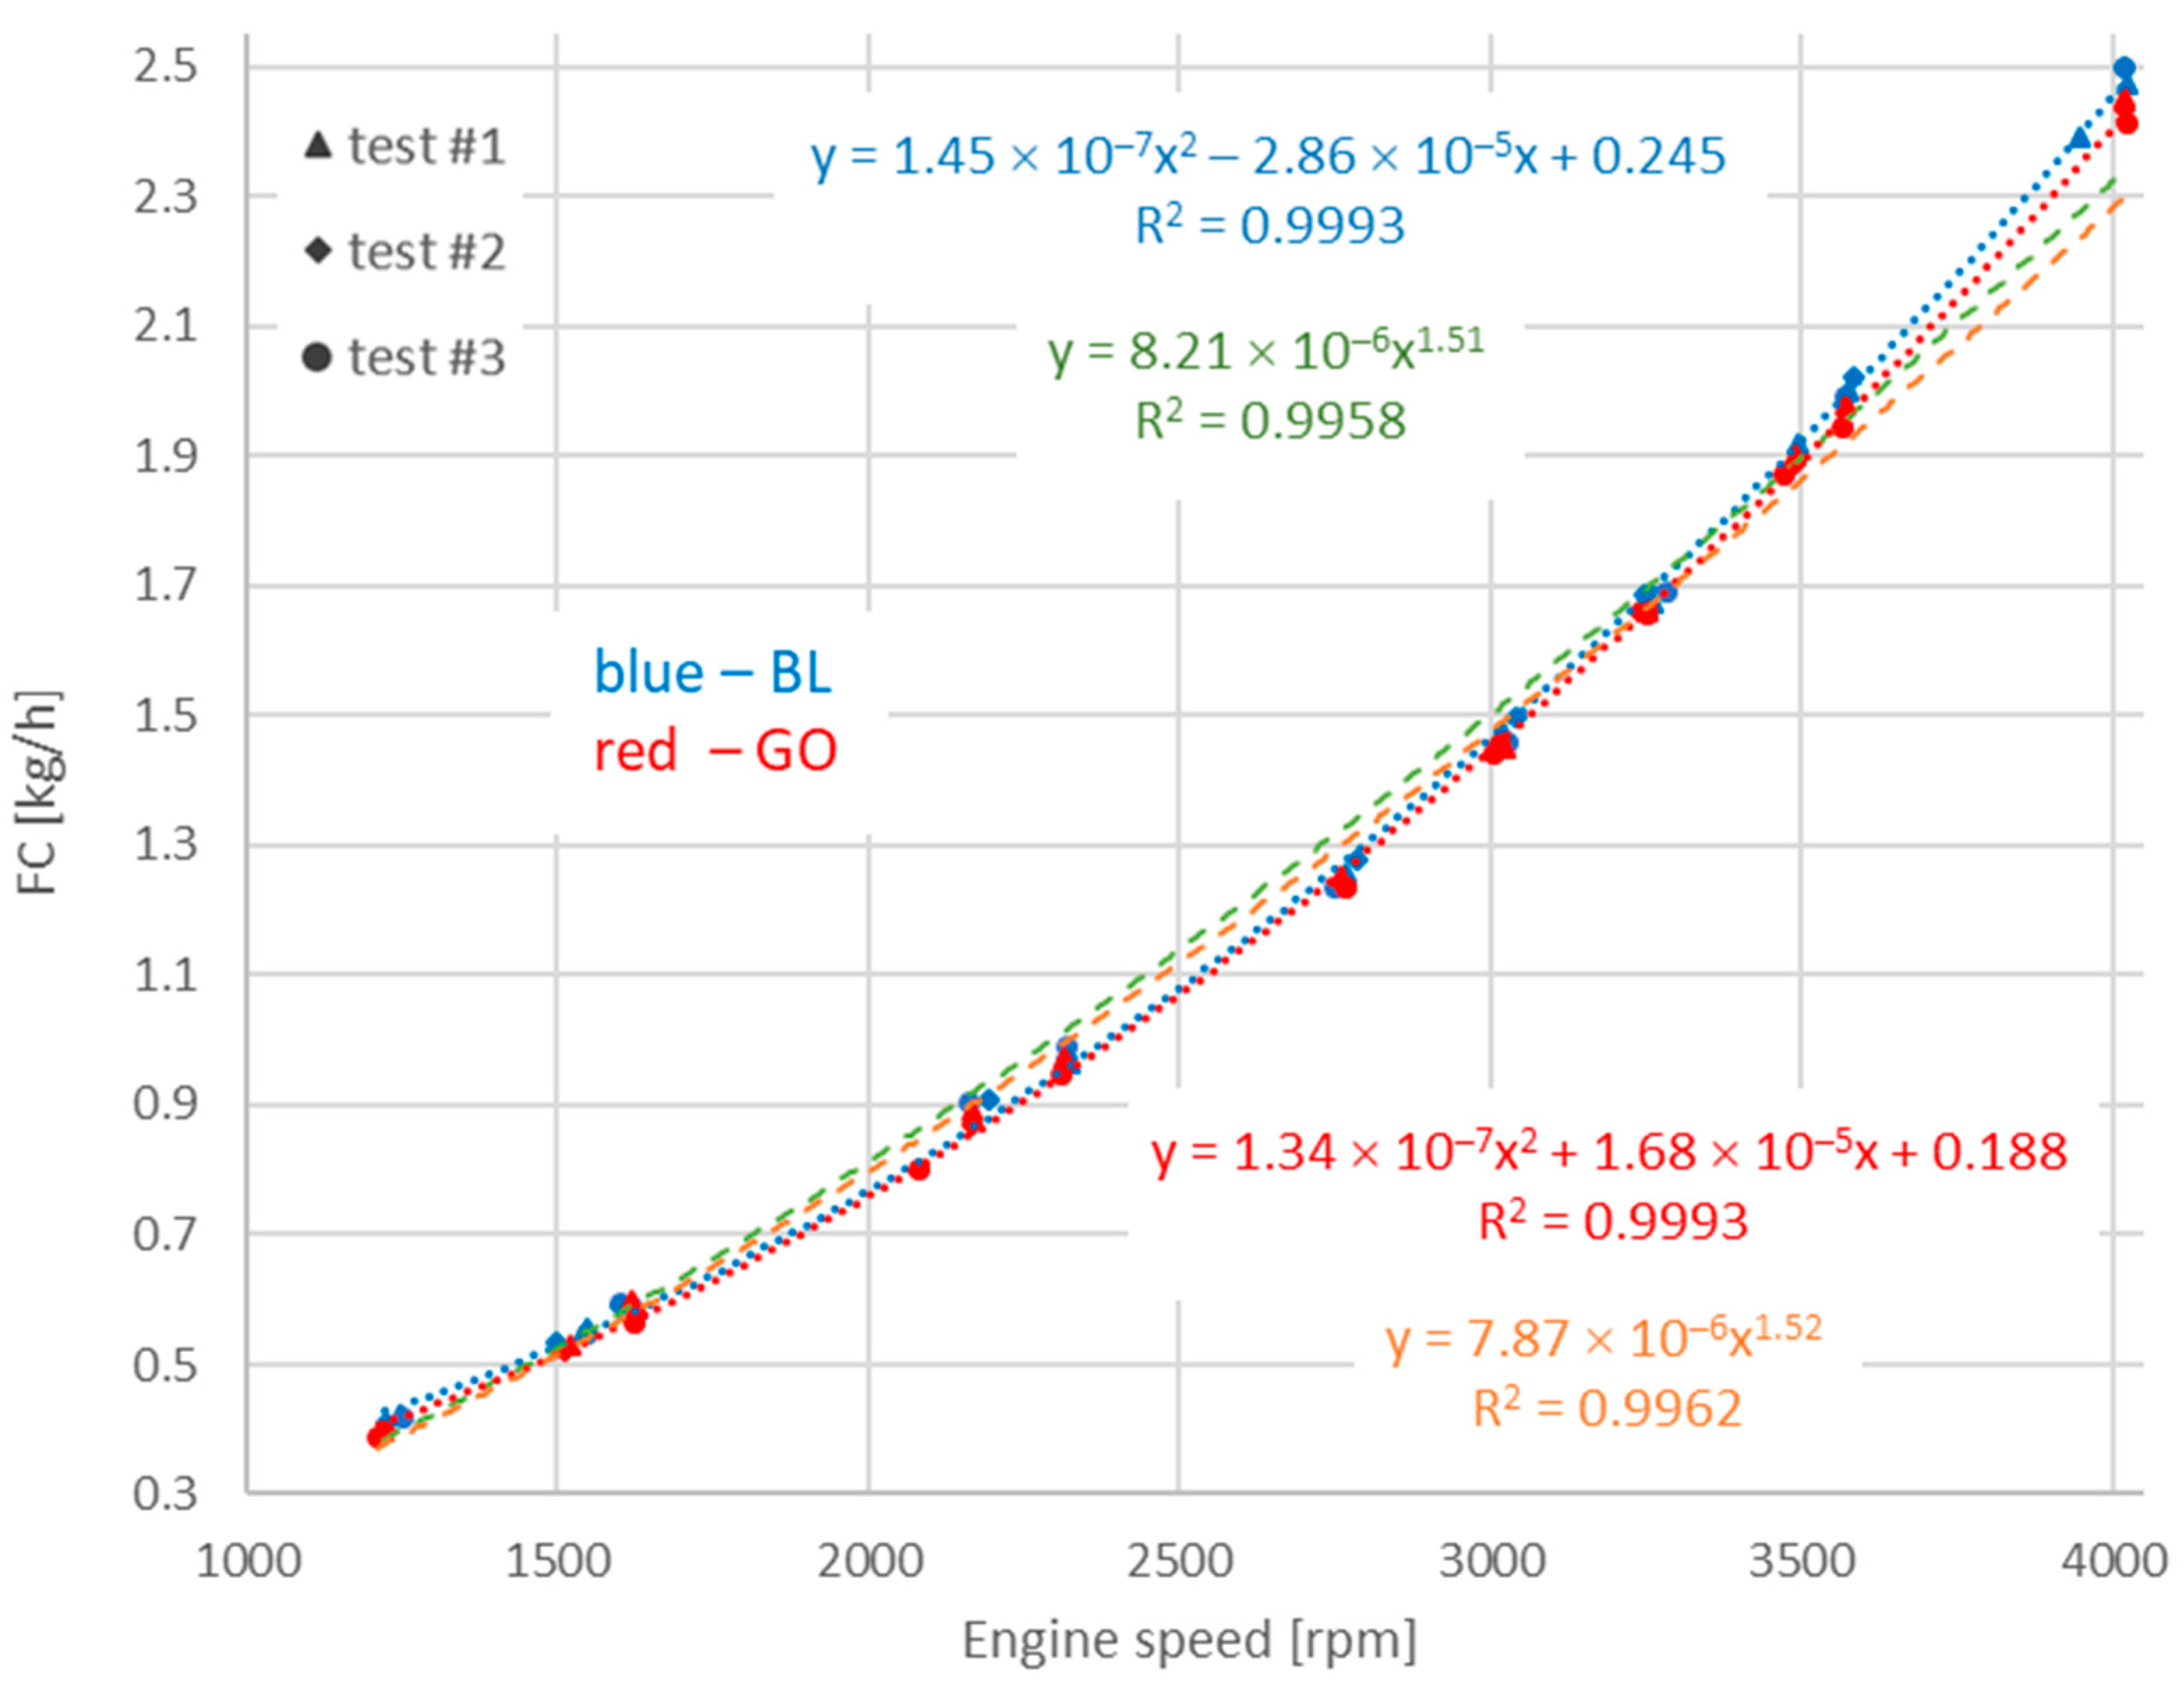
The fuel consumption of the engine running without load is shown in
Figure 11. As mentioned earlier, unlike the characteristics measured under load, it was not possible to repeat the measurements at exactly the same rotational speeds. Therefore, the results obtained cannot be directly compared as was the case for the load conditions where repetitions were made at exactly the same speed. To reduce the effect of speed, the fuel consumption per revolution of the crankshaft was calculated (
Figure 12). The effect of small differences in rotational speed on the consumption per revolution is much smaller than on the fuel consumption expressed in kg/h. For similar rotational speeds, the fuel consumption per revolution of the engine operating on oil both without and with the graphene additive was compared. The relative changes are shown in
Figure 12. On average, the fuel consumption per revolution decreased by 1.8%.
The Student’s
t-test results showed that all percentage differences shown in
Figure 12 are statistically significant at the 0.95 confidence level. Additionally, in order to assess the effect of the additive on fuel consumption, regression lines were also determined. For both FC and FC/rev, the best fit was obtained for the polynomial order 2 function. Good fit and very high values of the determination coefficient (R
2) were also obtained for the power function in the case of FC and the exponential function in the case of FC/rev (see
Figure 11 and
Figure 12).
The relative changes in fuel consumption and fuel consumption per revolution calculated from the regression lines shown in
Figure 11 and
Figure 12 are presented in
Table 5 and
Table 6. The average reduction in fuel consumption determined from both regression lines was 1.9%, while fuel consumption per revolution decreased by 2.2% for the polynomial function and by 1.8% for the exponential function.
4. Engine Tests of GNP Additive
The in-house GNP-based additive was tested on a different engine and in different conditions. The dynamometer tests with this additive were carried out in the following sequence: (a) baseline oil, (b) addition of the equivalent of 0.1% graphene, and (c) another 0.1%, reaching a total of 0.2% of graphene.
4.1. MDD Engine
The engine was a Euro V 4-cylinder inline, turbocharged, aftercooled Medium-Duty Diesel (MDD) engine. The technical specifications of the engine are presented in
Table 7. ACEA E6, SAE 15W-40 engine oil was used as the baseline oil. The exhaust gas after-treatment system was disconnected from the engine, taking into account that the purpose of the tests was fuel consumption.
4.2. Test Stand and Procedure
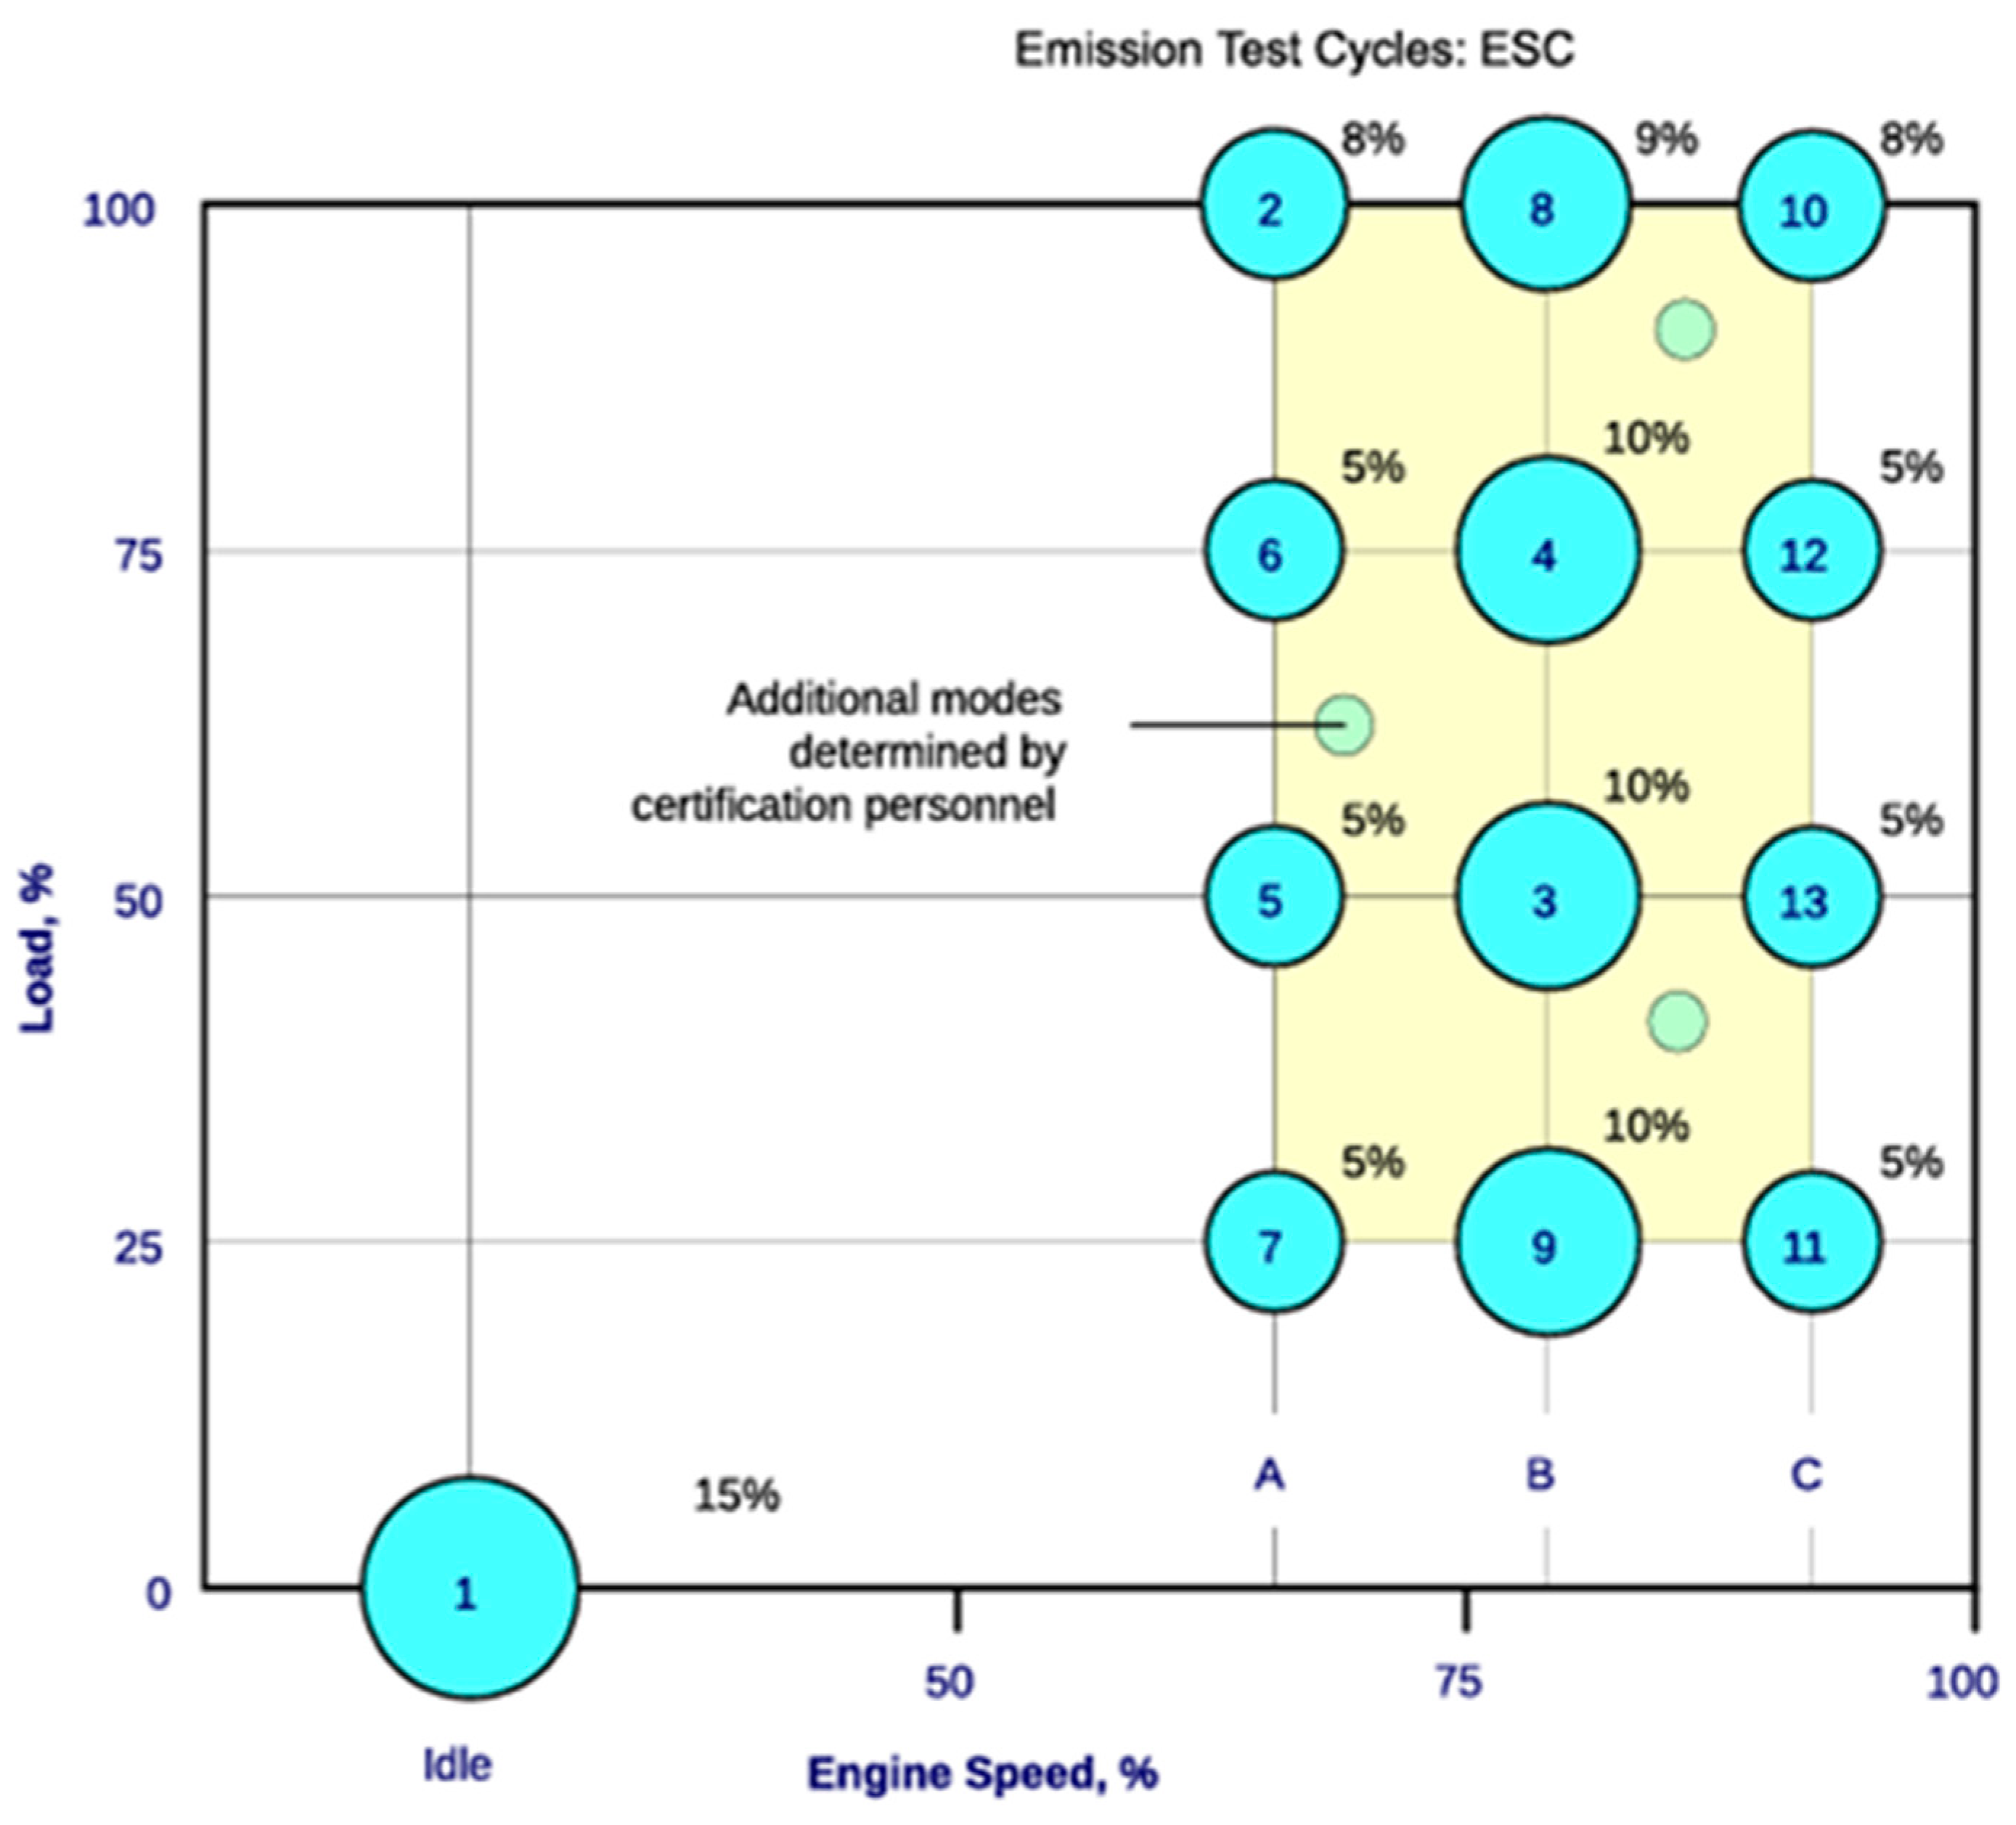
Based on the tested engine’s emissions level, the research utilized the European Stationary Cycle (ESC) as the selected test procedure. This procedure is a steady-state process comprising 13 predefined modes (see
Figure 13). Three engine speeds for the ESC (referred to as A, B, and C) were calculated based on the declared maximum net power and engine speed in accordance with the ESC procedure. Fuel consumption was measured during these 13 modes. The combined value for the test was calculated as a weighted average. The weights for the individual modes are presented in
Figure 13.
The test bench utilized in the research was suitable for both Euro V medium and heavy-duty diesel engines, with test system automation supported by fuel mass flow and temperature control systems, etc. The stand was equipped with a Schenck W400 eddy current brake and AVL 733S Dynamic Fuel Balance with fuel temperature control, in compliance with all strict Euro V legislation requirements.
The ESC procedure was carried out using test system automation, ensuring accurate measurements and repeatability. Tests were repeated nine, eight, and six times for BL oil and oil with 0.1% and 0.2% additive, respectively.
4.3. Results of ESC Tests
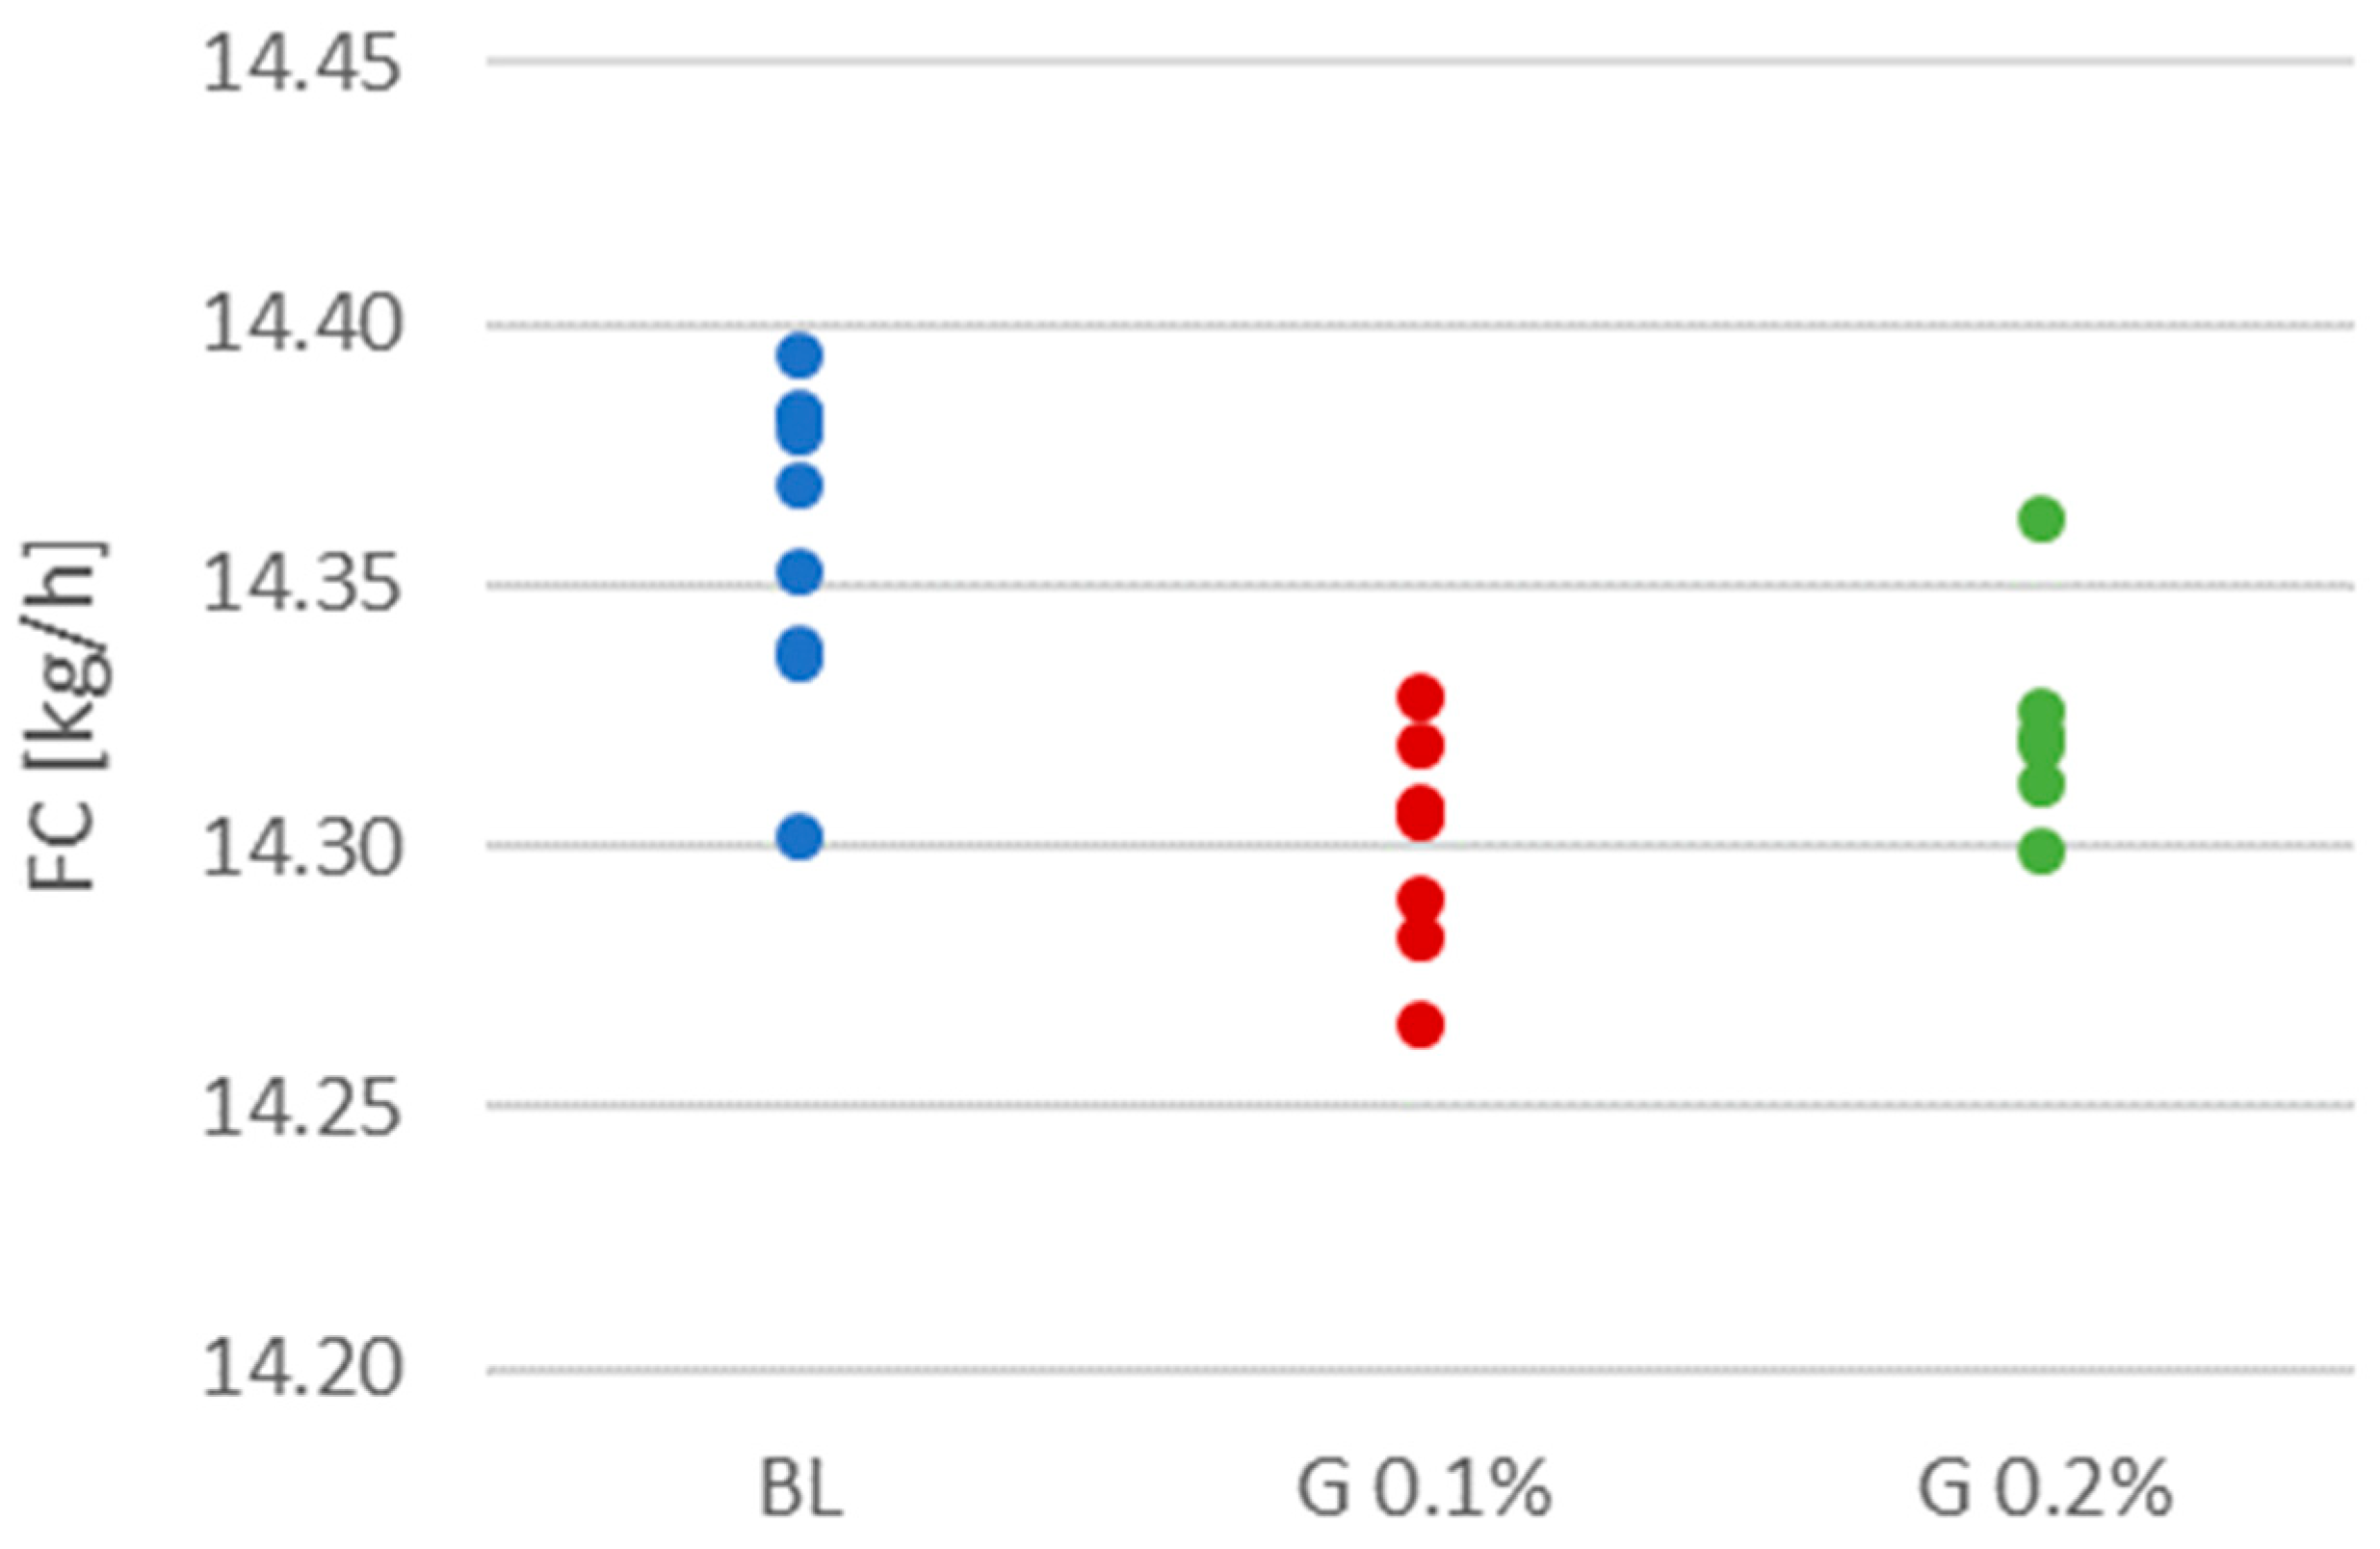
The combined fuel consumption obtained in the individual ESC tests on engine oil without additive and with 0.1% and 0.2% graphene additive are presented in
Figure 14.
Student’s t-test was used to assess the statistical significance of the differences in fuel consumption between oil without additives and oils with 0.1% and 0.2% additives. The results indicate that, at a confidence level of 0.95, there is a statistically significant difference between the average values. The application of the 0.1% GNP additive resulted in a 0.4% reduction in fuel consumption compared to the oil without additive (BL), while the application of the 0.2% additive led to a 0.3% reduction in fuel consumption compared to the BL. The difference in fuel consumption between the oils with 0.1% and 0.2% additive is statistically insignificant.
5. Discussion
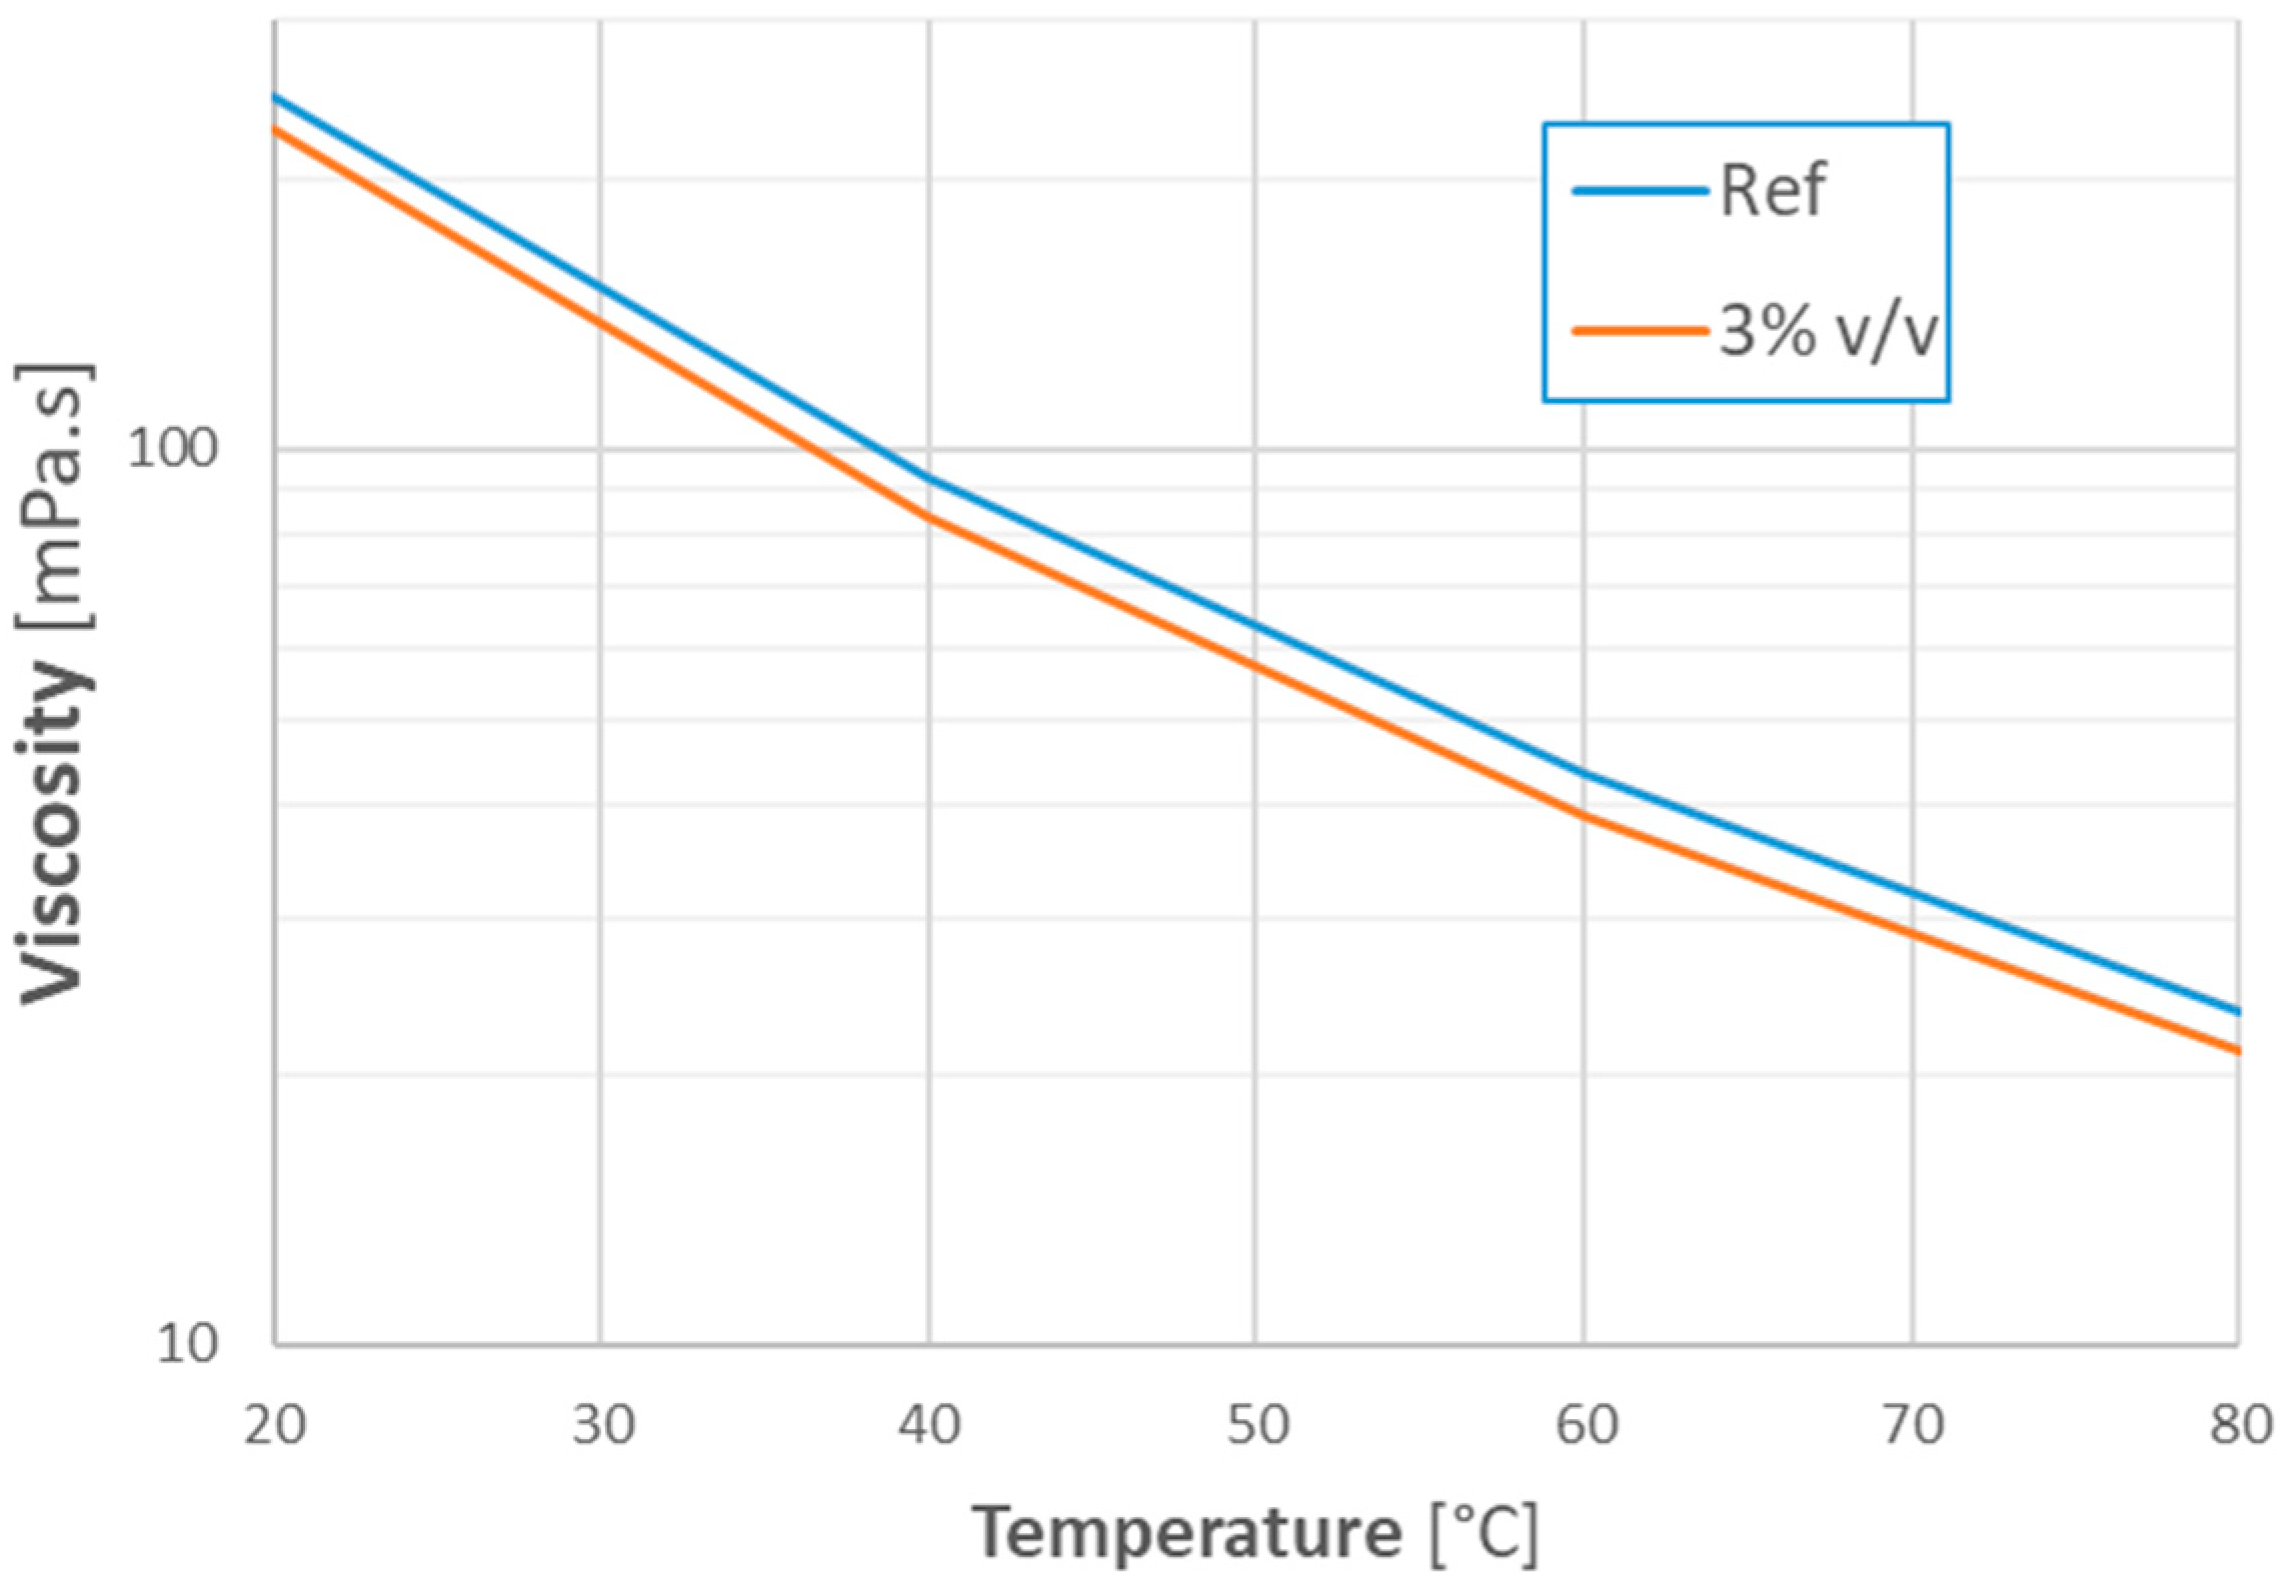
This study of using GO and GNP additives in high-speed automotive diesel (HSD) and medium-duty diesel (MDD) engines revealed some promising results. The use of the GO additive increased the maximum power of the HSD engine by 0.4% and the maximum torque by 0.8%. It reduced the brake-specific fuel consumption (BSFC) by 0.2% at high engine load and by 0.7% at medium load. The greatest relative benefits of using the GO additive were observed when the engine was running without load; fuel consumption in such conditions was 2% lower. In turn, the use of the GNP additive caused an average reduction in fuel consumption of the MDD in the ESC by 0.4%. The increase in torque and engine efficiency for both additives and on both engines tested was probably caused by the reduction in oil viscosity after adding the additives, which reduces resistance to motion under fluid friction conditions and increases the mechanical efficiency of the engine.
It is important to note that the benefits revealed in the tests conducted on both the HSD and MDD engine are smaller than those reported in the literature—see
Table 1. In the research presented in [
12], an average improvement of 2.6% in the BSFC of a diesel engine was achieved after using the GO additive in engine oil. The GO additive used in [
12] caused a similar decrease in oil viscosity as in the present study. In [
8], it was reported that the use of the additive increased the engine efficiency from 0.23% to 6.61%, depending on the engine operating conditions. Here, too, the decrease in oil viscosity due to the additive was similar to the decrease in the present study. However, in contrast with the results obtained in this study, the effect of the additive in [
8] is greater the higher the engine load. In [
7], it was reported that the use of the graphene additive caused around a 3% increase in power over a wide range of speeds, including maximum engine power. It should be noted, however, that in this case, the engine performance increased despite the increase in oil viscosity caused by the additive.
The results presented in [
11] showed that the use of graphene additive increased engine power and torque by 7–10% and decreased BSFC at full engine load by 4.43–5.61%, depending on the engine speed. Furthermore, the use of the graphene additive allowed for a 17% reduction in fuel consumed during the New European Driving Cycle (NEDC). It should be noted that such large increases in engine performance and efficiency were achieved despite the increase in engine oil viscosity caused by the use of the additive.
The study in [
13] showcased even more significant advantages of utilizing a nanographite-based nanolubricant, with an average 18% reduction in BSFC. The most substantial BSFC reductions exceeding 20% were observed at medium loads, while substantial reductions of nearly 15% were also achieved at full and low loads. It is noteworthy that the additive employed in these tests did not impact the viscosity of the engine oil. These findings underscore the potential of nanographite-based nanolubricants in significantly improving engine efficiency across various load conditions. The literature has reported significant benefits from the use of graphene additives in engine oil, particularly under full engine load conditions. These benefits were observed despite the fact that, in some cases, the viscosity of the oil with the additive was even higher than without it. At medium and high engine speeds, hydrodynamic friction dominates; in such conditions, oil viscosity mainly affects mechanical losses [
2]. This means that there must have been other phenomena, like graphene acting as a combustion improver, that affected not only the mechanical efficiency but also the thermal efficiency (see the discussion in [
6]).
However, the fuel consumption reductions obtained in this study are also noteworthy from a practical standpoint. Considering that passenger car engines operate at low and medium loads most of the time, this would mean a 0.5–1% reduction in fuel consumption. The results obtained on the MDD engine indicate only slightly smaller benefits in the case of commercial vehicles. Due to the larger benefit on part load, the graphene additives used in the current work should provide higher fuel savings on SI passenger cars. An improved version of the GNP additive was investigated with a vehicle emission test [
17].
The use of a non-metal, sulfur-free material such as graphene and its derivatives can be of special interest for use in diesel engines with future lower-viscosity oil. However, graphene is a new nanomaterial and there are many unknowns about its properties, as indicated by the significant differences in the results obtained in the studies discussed above. Therefore, its use as a lubricant additive still requires further in-depth study.
