Article

Research on Arc Extinguishing Characteristics of Single-Phase Grounding Fault in Distribution Network

1
School of Electrical Engineering, Shenyang University of Technology, Shenyang 110870, China
2
State Grid Liaoning Electric Power Co., Ltd., Shenyang 110004, China
3
State Grid Liaoning Electric Power Co., Ltd., Electric Power Science Research Institute, Shenyang 110055, China
*
Author to whom correspondence should be addressed.
Energies 2025, 18(2), 256; https://doi.org/10.3390/en18020256
Submission received: 4 December 2024 / Revised: 4 January 2025 / Accepted: 7 January 2025 / Published: 9 January 2025
(This article belongs to the Section F: Electrical Engineering)

Abstract

:
The development of a single-phase grounding fault arc is influenced by various environmental factors, which can result in the rapid extinction and reignition of the arc. This phenomenon can lead to accidents, such as resonant overvoltage. Current grounding arc models inadequately account for the effects of grounding current, arc length, environmental wind speed, and other variables on the characteristics of the arc. In response to this issue, this article establishes a three-dimensional single-phase grounding arc mathematical model grounded in magnetohydrodynamics. It simulates and analyzes the effects of arc length and environmental wind speed on both arc ignition and extinguishing. Furthermore, an artificial single-phase grounding test platform is constructed within the actual distribution network to validate the accuracy of the simulation model. Research has demonstrated that, under identical operating conditions for both simulation and experimentation, the error range between the simulated arc voltage and the measured data is within 8%. The three-dimensional single-phase grounding arc mathematical model effectively describes the dynamic development process of the grounding arc. At a gap of 12 cm, under windless conditions and with a grounding current of 40.0 A, the temperature of the arc column at the peak of the current reaches 2600 K, while the conductivity decreases to 2.1 × 10⁻⁴ S/m, resulting in the inability of the arc to sustain a burning state. At a gap of 2 cm and a wind speed of 7 m/s, the temperature of the arc column at the peak of the current reaches 2900 K, the conductivity drops to 4.3 × 10⁻³ S/m, leading to the extinction of the arc.

1. Introduction

The distribution network is characterized by wide distribution, numerous feeders, and a complex transmission corridor environment. Arc grounding faults frequently occur, and resonant grounding systems exhibit a small current grounding state under the compensation of arc suppression coils during these faults, making them difficult to recognize and locate using relay protection devices. Notably, arc faults may extinguish and reignite multiple times, leading to energy redistribution among the three phases and resulting in high-frequency oscillation overvoltage issues [1,2,3,4,5,6,7,8]. The overvoltage amplitude in non-fault phases can reach up to 3.5 times the phase voltage. In comparison to 10 kV and 35 kV distribution networks, 66 kV distribution networks operate at higher voltage levels, possess greater energy, and experience faster voltage rise rates, which can lead to more severe consequences. If arc faults are not promptly interrupted, overvoltage may infiltrate the system. In areas with weak insulation, this can result in catastrophic failures, including explosions of voltage transformers and lightning arresters, ultimately causing fires, power outages, and posing threats to personal safety. Therefore, whether it pertains to identifying the causes of system failures, setting appropriate operating parameters for equipment such as arc suppression coils and damping resistors in distribution network systems, or providing early warnings, identification, and positioning of arc grounding faults, accurate simulation of arc grounding faults within the power system is essential [9,10,11,12,13,14,15,16].
The core of accurately simulating arc grounding faults lies in the establishment of mathematical models for arcs. Given the randomness and nonlinear characteristics of electric arcs, scholars both domestically and internationally have conducted extensive research based on the thermal equilibrium equation of electric arcs. Various arc mathematical models, including the Cassie model, Mayr model, control theory model, and modified Mayr model, have been proposed successively [17,18,19,20,21,22,23]. All these arc models require the simulation of arc ground faults by adjusting various parameters. For instance, the Cassie arc model necessitates the setting of two parameters: the arc time constant and the arc voltage constant. Similarly, the Mayr arc model requires two parameters: the arc time constant and the arc dissipation power. The precise determination of these variable parameters poses a significant challenge, typically addressed through empirical formulas or trial-and-error methods. Moreover, both the Cassie and Mayr arc models assume a fixed arc length. However, in natural environments, arc ground faults are influenced by factors such as electromagnetic forces, thermal buoyancy, and wind load, which can cause the arc length to increase over time. These changes in length subsequently impact arc-related properties. Consequently, the accuracy of arc grounding simulations using models like Cassie and Mayr is limited. Reference [24] proposed a nonlinear resistance model based on the theory of solid dielectric breakdown. This arc model is relatively straightforward to solve; however, it necessitates precise parameter settings that depend on accurate fault resistance data. Reference [25] introduced an arc model utilizing series dual variable resistors, capable of accurately simulating the arc variation process. Nonetheless, this model imposes stringent measurement requirements, necessitating precise measurements of arc voltage and fault point current, which can be challenging to achieve in real-world distribution networks. References [26,27] proposed a two-dimensional arc mathematical model based on the magnetohydrodynamic theory for treeline grounding arc discharge faults. This model considers the influence of wind speed and other factors on the arc development process, specifically addressing arc faults that occur in natural environments. The processes of arc conduction, convection, and radiation develop throughout the entire three-dimensional space. However, the energy dissipation process of the two-dimensional model is confined to the x and y planes, which results in the arc energy dissipation being smaller than what occurs in reality.
In summary, the grounding arc model established in references [17,18,19,20,21,22,23,24,25] is a black box model that describes the external characteristics of the arc. While the calculations involved are relatively straightforward, deriving the specific parameters presents challenges. Moreover, this model does not adequately account for the fact that the arc is an equilibrium entity influenced by multiple physical fields throughout its development. References [26,27] propose a two-dimensional grounded arc model from the plasma perspective, which offers a more realistic simulation of the arc’s dynamic changes during its development. However, relying solely on a two-dimensional framework fails to capture the arc’s development across various directions, leading to significant errors in the simulation outcomes. Such inaccuracies may hinder the timely identification and localization of grounding faults, potentially resulting in severe consequences, including power outages and fires. Therefore, developing a mathematical model for single-phase grounding arcs in distribution networks that accurately reflects the actual development process is crucial. This model should comprehensively consider factors such as grounding current, arc length, and environmental wind speed, which significantly influence arc characteristics. Such an approach is vital for enhancing the accuracy of grounding fault identification and localization in distribution networks.
In response to the aforementioned issues, this article begins by examining the mechanism of arc formation, analyzing the influence of relevant factors on arc characteristics. Additionally, it establishes a three-dimensional single-phase grounding arc mathematical model that aligns with real-world conditions based on magnetohydrodynamics. Furthermore, it constructs an artificial single-phase grounding test platform within a practical 66 kV distribution network to obtain measured waveforms of arc voltage and current under various single-phase arc grounding conditions. The effectiveness of the three-dimensional grounding arc mathematical model is validated by comparing the arc voltage and frequency distribution obtained under identical operating conditions in both simulation and experimental settings. Further simulation calculations of arc grounding are conducted to elucidate the arc motion process from a fluid mechanics perspective, analyze the voltage and temperature changes during the arc development, and investigate the influence of arc length and environmental wind speed on the ignition and extinguishing characteristics. The theoretical research findings contribute to a more realistic mathematical model for simulating single-phase grounded arc faults and provide a foundational basis for the operation of arc suppression coils, damping resistors, and other related equipment.
This article is structured as follows: 1. Establishment of a mathematical model for three-dimensional grounding arcs. 2. Experimental verification of the mathematical model through single-phase arc grounding in a real distribution network. 3. Analysis of the influence of arc length and wind speed on arc characteristics.

2. Establishment of Three-Dimensional Single-Phase Grounding Arc Mathematical Model

2.1. Arc Model Description

Figure 1 illustrates the transient equivalent circuit of single-phase arc grounding within a resonant grounding system. In this circuit, L represents the equivalent inductance of the arc suppression coil, the value of L can be determined by examining the relationship between the system’s neutral point voltage and the compensation current specified on the arc suppression coil nameplate; R denotes the grounding arc resistance, the value of R changes dynamically over time and is calculated and solved through an arc mathematical model simulation; and C indicates the equivalent capacitance of the system to ground, the value of C is influenced by factors such as the length and height of the overhead line. In this article, the simulation calculation of the equivalent capacitance to ground is based on actual measurement results from the substation. Uf is the phase voltage during normal system operation, If is the current at the fault point, and IL is the compensating current for the arc suppression coil. When an arc grounding fault occurs in a resonant grounding system, the arc suppression coil generates an inductive current to compensate for the grounding capacitive current of the system.
The grounding arc is situated in free space, where factors such as wind speed and arc distance influence the flow field of the arc, resulting in variations in arc voltage that subsequently affect arc resistance. Arc resistance is crucial in the processes of arc combustion and extinguishing. Consequently, when developing the arc simulation model, it is essential to thoroughly consider the impact of environmental factors.

2.2. Arc Magnetohydrodynamic Model

The essence of an arc lies in the breakdown of a medium, which forms a discharge channel containing a diverse array of particles. During this process, various physical and chemical interactions, including ionization, recombination, and collisions, occur among the particles, leading to exchanges of mass, momentum, and energy. In the case of a grounding arc in air, the current flowing through its interior generates Joule heat and electromagnetic forces. The Joule heat elevates the temperature of the arc, and variations in temperature subsequently influence several physical parameters of the medium, such as density, dynamic viscosity coefficient, specific heat capacity at constant pressure, thermal conductivity, electrical conductivity, and radiation coefficient. Meanwhile, the electromagnetic forces facilitate the movement of the arc, resulting in changes to its shape. During this interaction, the exchange of mass, momentum, and energy within the arc further impacts parameters like temperature and pressure. Consequently, alterations in these arc parameters influence the distribution of arc morphology. Thus, the arc can be regarded as an equilibrium system, interlinked by the strengths of the electromagnetic field, temperature field, and airflow field. Figure 2 illustrates the schematic diagram of the coupling relationships among the various physical quantities that affect arc characteristics.
Based on the preceding discussion, the arc model presented in this article employs magnetohydrodynamic theory, which encompasses the continuity equation, momentum conservation equation, energy conservation equation, and current continuity equation. The simulation calculations are based on the following assumptions:
  • The arc is in a state of local thermodynamic equilibrium.
  • The plasma flow is laminar. In fluid mechanics, the Reynolds number serves as a criterion to characterize fluid flow, with its expression being the following:
R e = ρ v d μ
In the equation, ρ is the density, v is the flow velocity, d is the characteristic length of the flow system, and μ refers to the dynamic viscosity coefficient. A flow is classified as laminar when the Reynolds number is less than 2300, as transitional when it falls between 2300 and 4000, and as turbulent when it exceeds 4000. The single-phase grounded arc is situated in an open space characterized by a low flow velocity and a Reynolds number significantly below 2300.
3.
Ignore the arc initiation process.
The governing equation is as follows:
(a)
Continuity equation
The physical interpretation of the continuity equation is that the reduction in mass within an infinitesimal fluid microelement is equivalent to the net mass flow rate exiting that microelement. The mass flow rate of a moving fluid passing through any surface is defined as the product of the fluid density, the surface area, and the component of velocity that is perpendicular to the surface. Figure 3 below illustrates the mass flow rates through each interface of an infinitesimal fluid microelement.
From Figure 3, it can be observed that the net mass flow rate exiting the infinitesimal fluid microelement is ρ u x + ρ v y + ρ w z d x d y d z . The total mass within the infinitesimal fluid microelement is ρ d x d y d z , resulting in a time rate of change for the increase in mass within the microelement of ρ t d x d y d z , while the decrease in mass within the microelement is ρ t d x d y d z .
Finally, we can obtain the following:
ρ t + ρ v = 0
In the equation, ρ is the density; t is time; v is the flow velocity.
(b)
Momentum conservation equation
The momentum conservation equation is derived from Newton’s second law. In the context of fluid movement, it is expressed as the sum of the forces acting on an infinitesimal fluid microelement, which is equal to the mass of that microelement multiplied by its acceleration. To simplify the derivation process, we will analyze it from the x-direction component. The derivation process for the y- and z-direction components follows the same principles as that for the x-direction. The expression derived from the x-direction component is as follows: F x = m a x . The sources of force F x include surface forces and volume forces. Surface forces consist of pressure and viscous forces. The direction of pressure acts perpendicular to the fluid element, while viscous forces are categorized into normal stress and shear stress. Normal stress acts perpendicular to the control surface, whereas shear stress is tangent to the control surface. As illustrated in Figure 4, infinitesimal microelements are influenced by these surface forces. In this context, τ x x represents normal stress, while τ y x and τ z x denote shear stress. The volume forces considered in the model established in this article include electromagnetic forces and gravity. The component of volume force acting on the unit mass microelement in the x-direction is expressed as f x . Consequently, it can be concluded that the volume force acting on the infinitesimal microelement in the x-direction is represented as ρ f x d x d y d z .
By adding surface force and volume force together, we can obtain the following:
F x = p x + τ x x x + τ y x y + τ z x z d x d y d z + ρ f x d x d y d z
The mass of the infinitesimal microelement is defined as m = ρ d x d y d z . The acceleration of a microelement is characterized as the rate of change in velocity with respect to time, expressed as a x = D u D t . Utilizing the definition of the material derivative, we can derive the following:
ρ D u D t = ρ u t + ρ v u
There are also the following:
ρ u t = ρ u t + u ρ t
By using the divergence expression of scalar and vector product, we can obtain the following:
ρ v u = ρ u v u ρ v
By substituting Equations (5) and (6), we can obtain the following:
ρ D u D t = ρ u t u ρ t + ρ v + ρ u v
By substituting the continuity Equation (2) into Equation (7), we can obtain the following:
ρ D u D t = ρ u t + ρ u v
By substituting Equation (8) into Equation (3), we can obtain the following:
ρ u t + ρ u v = p x + τ x x x + τ y x y + τ z x z + ρ f x
In the equation, the variables τ x x , τ y x , and τ z x are associated with the viscosity coefficient μ . The specific expression is as follows:
τ x x = λ v + 2 μ u x , τ y x = μ v x + u y , τ z x = μ u z + w x , where λ = 2 3 μ .
Similarly, the momentum conservation equations in the y- and z-directions can be derived. The expressions in all three directions are combined using vectors, and the unit matrix is introduced. In the arc model, the volume force ρ f x is represented as a combination of electromagnetic force and gravity. The final expression is as follows:
( ρ v ) t + ρ v v = p I + μ v + v T + J × B + ρ g
In the equation, I is the identity matrix; μ is the dynamic viscosity coefficient; J is the current density; B is the magnetic induction intensity; g is the acceleration due to gravity.
(c)
Energy conservation equation
The energy conservation equation is illustrated in the dynamics of fluid movement, where the rate of change in internal energy within an infinitesimal fluid microelement is equal to the net heat flow entering the microelement, in addition to the work carried out by surface forces and volume forces acting on that microelement.
Considering the rate of change in internal energy within the fluid microelement, there are two sources of energy: the internal energy generated by the random motion of molecules and the kinetic energy associated with the movement of the fluid microelement. Internal energy is denoted as e , while kinetic energy is denoted as v 2 2 . Consequently, the rate of change in internal energy for the fluid element can be expressed as ρ D D t e + v 2 2 d x d y d z .
The net heat flow into the microelement arises from volumetric heating and heat transport due to temperature gradients. By defining q as the volumetric heating rate per unit mass, we determine that the volumetric heating of infinitesimal microelements is ρ q d x d y d z . To simplify the analysis, we focus on the heat transport in the x-direction, noting that the derivation process for the y- and z-direction components is analogous to that of the x-direction. As illustrated in Figure 5, the energy flux during the movement of infinitesimal fluid elements indicates that the amount of heat transported by these elements out of the microelement in the x-direction is q x x d x d y d z . Considering the heat components transported in the x-, y-, and z-directions, the net heat flow into the microelement is quantified as q x x + q y y + q z z d x d y d z . Consequently, the net heat flow into the microelement can be expressed as ρ q q x x + q y y + q z z d x d y d z .
According to the Fourier heat conduction formula, the heat flow generated by conduction is directly proportional to the temperature gradient. The following is available: q x = k T x , q y = k T y , q z = k T z .
The power exerted by surface forces and volume forces on a microelement is equivalent to the product of these forces and the velocity component in the direction of their action. Focusing on the x-direction component, the power associated with the surface force performing work in the x-direction is illustrated in Figure 5. It is assumed that work conducted in the positive direction is considered positive, while work conducted in the negative direction is regarded as negative; the volume force can be represented as ρ f x u d x d y d z .
Figure 5 illustrates that the sum of the power exerted by the surface force and the volume force, in the direction of motion of the infinitesimal element, is equal to u p x + u τ x x x + u τ y x y + u τ z x z + ρ f x d x d y d z .
Considering the net heat flow in the three directions of x, y, and z and the power of surface force and volume force, the energy conservation equation can be expressed as follows:
ρ D D t e + v 2 2 = ρ q + k T u p x v p y w p z + u τ x x x + u τ y x y + u τ z x z + v τ x y x + v τ y y y + v τ z y z + w τ x z x + w τ y z y + w τ z z z + ρ f v
There are also the following:
ρ D D t v 2 2 = u p x v p y w p z + u τ x x x + τ y x y + τ z x z + v τ x y x + τ y y y + τ x y z + w τ x z x + τ y z y + τ z z z + ρ ( u f x + v f y + w f z )
Subtracting Equation (12) from Equation (11), we can obtain the following:
ρ D e D t = ρ q + k T p u x + v y + w z + τ x x u x + τ y x u y + τ z x u z + τ x y v x + τ y y v y + τ z y v z + τ x z w x + τ y z w y + τ z z w z
Utilizing the definition of the material derivative, we can derive the following:
ρ D e D t = ρ e t + ρ v · e
There are also the following:
( ρ e ) t = ρ e t + e ρ t
By using the divergence expression of scalar and vector product, we can obtain the following:
ρ v e = · ( ρ e v ) e ( ρ v )
Substituting Equations (15) and (16) into Equation (14), we can obtain the following:
ρ D e D t = ( ρ e ) t e ρ t + ( ρ v ) + ( ρ e v )
By substituting the continuity Equation (2) into Equation (17), we can obtain the following:
ρ D e D t = ( ρ e ) t + ( ρ e v )
Substituting (18) into (13), we can obtain the following:
( ρ e ) t + ( ρ e v ) = ρ q + k T p u x + v y + w z + τ x x u x + τ y x u y + τ z x u z + τ x y v x + τ y y v y + τ z y v z + τ x z w x + τ y z w y + τ z z w z
Considering incompressible Newtonian fluids, there are the following:
e = C p T
By substituting Equation (20) into Equation (19) and simplifying the description of the work carried out by pressure and viscous forces, we can finally obtain the following:
ρ C p T t + v T k T = Q
Q = V + E J + Q p + Q rad
In the equation, C p is the specific heat capacity at constant pressure; T is temperature; k is the thermal conductivity of air; V is power exerted by the surface force; E J is Joule heating; Q p is the thermal convection; Q rad is the total volume radiation coefficient.
(d)
Current continuity equation
σ φ = 0
In the formula, σ is the conductivity; φ is the electric potential.
According to the KVL and KCL laws, the circuit shown in Figure 1 satisfies the basic circuit equation:
U f + L k d i f d t + R i f + L d i L d t = 0
i C = C d U C d t
i L = 1 L U C d t
i f = i C + i L
In this article, we present a three-dimensional simulation of a single-phase grounding arc, where multiple physical fields of the arc and external transient circuits are coupled. The continuity equation, momentum conservation equation, energy conservation equation, current continuity equation, and single-phase grounding current equation are interrelated, forming a comprehensive three-dimensional mathematical model of the resonant grounding system’s single-phase grounding arc.
Through the derivation of the aforementioned equation, we can clearly observe that we discretize the space into an infinite number of fluid microelements and iteratively calculate using the finite element method. As the wind speed acts on the arc, the fluid velocity changes, which in turn affects the density of the medium via the continuity equation. Additionally, variations in fluid velocity influence the density, dynamic viscosity coefficient, and current density of the medium through the momentum conservation equation. Furthermore, changes in fluid velocity impact the medium’s density, specific heat capacity at constant pressure, fluid temperature, thermal conductivity, and radiation coefficient according to the energy conservation equation. Lastly, alterations in conductivity affect the change in electric potential through the current continuity equation. The medium density, dynamic viscosity coefficient, specific heat capacity at constant pressure, thermal conductivity, electrical conductivity, and radiation coefficient are all temperature-dependent functions. Variations in current density result in changes in Joule heating, which subsequently influences the temperature of the arc (temperature field). Additionally, Joule heating impacts conductivity, leading to alterations in spatial potential and affecting the spatial electromagnetic field (electromagnetic field). This spatial electromagnetic field generates electromagnetic forces that, along with wind load and gravity, influence the shape and development of the arc (airflow field). Furthermore, uneven spatial temperature distribution induces arc heat conduction, while the effects of wind load impact arc heat convection and its own thermal radiation. Collectively, these energy dissipation processes further influence the arc temperature (temperature field). Consequently, the calculation of the arc involves the coupling of the electromagnetic field, airflow field, and temperature field.

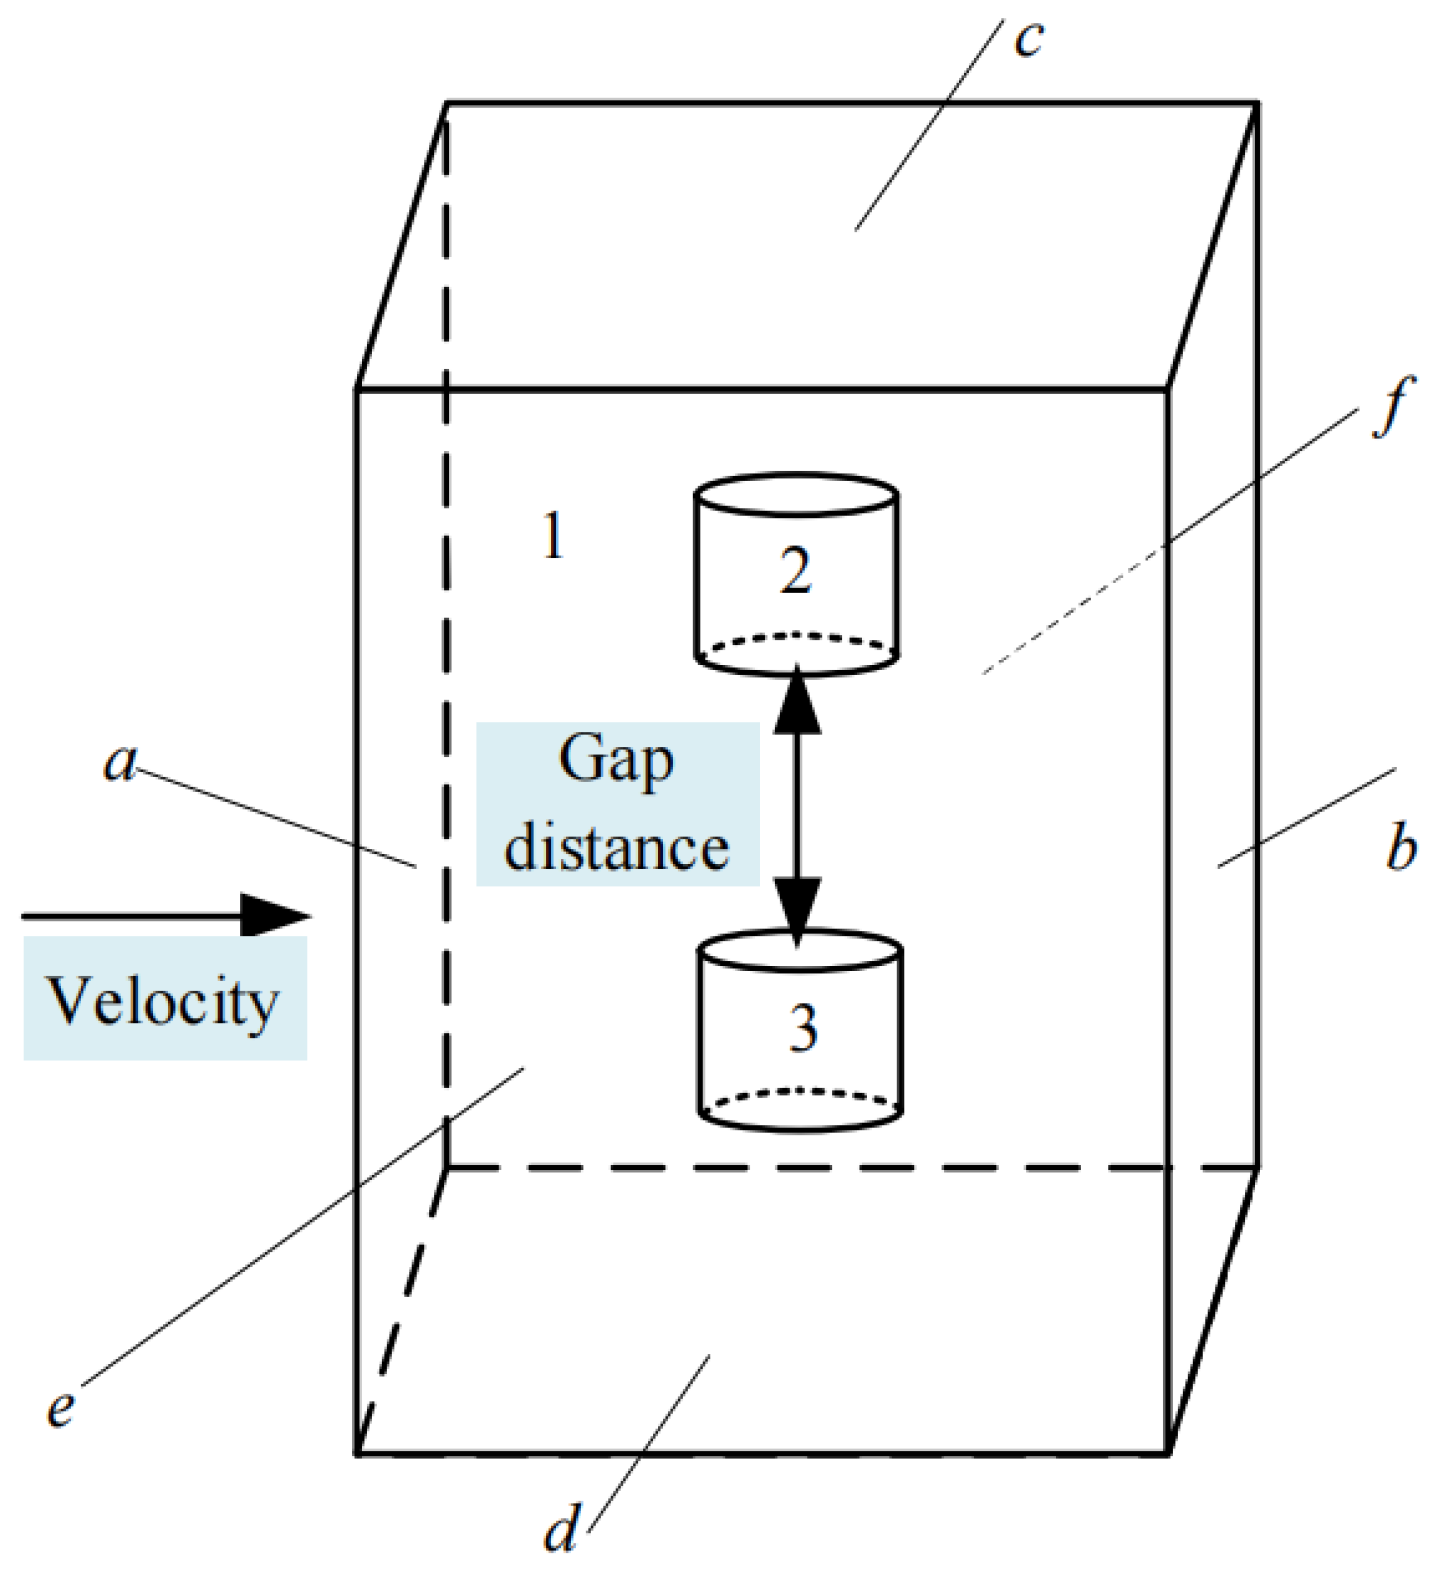
2.3. Arc Geometry Model and Boundary Setting

This article establishes a three-dimensional grounding arc simulation model, as illustrated in Figure 6. Domain 1 in the figure represents the air domain. To investigate the influence of wind speed on arc characteristics and to facilitate the establishment of wind speed boundaries, the air domain is modeled as a cube, while domains 2 and 3 correspond to the electrodes. The dimensions of the air domain exceed twenty times those of the electrodes, allowing for a realistic simulation of the arc burning state under actual conditions.
In response to the occurrence of single-phase grounding arc faults in natural environments, domain 1 in Figure 6 is designated as an open boundary to accurately simulate real-world conditions. Domain 2 is assigned as the anode, while domain 3 is designated as the ground. The boundaries a, b, c, d, e, and f can be configured as wind speed inlets based on specific requirements. In this article, boundary a is designated as the wind speed inlet. The distance between the two electrodes, as illustrated in the figure, represents the gap distance, which can be adjusted according to the needs of the experiment. The ambient temperature is maintained at 300 K, and the air pressure is set to one standard atmosphere. The gap distance is set to 2 cm, and the grounding current is characterized as inductive, with peak values of 20 A, 40 A, and 80 A, respectively, for the simulation calculations.

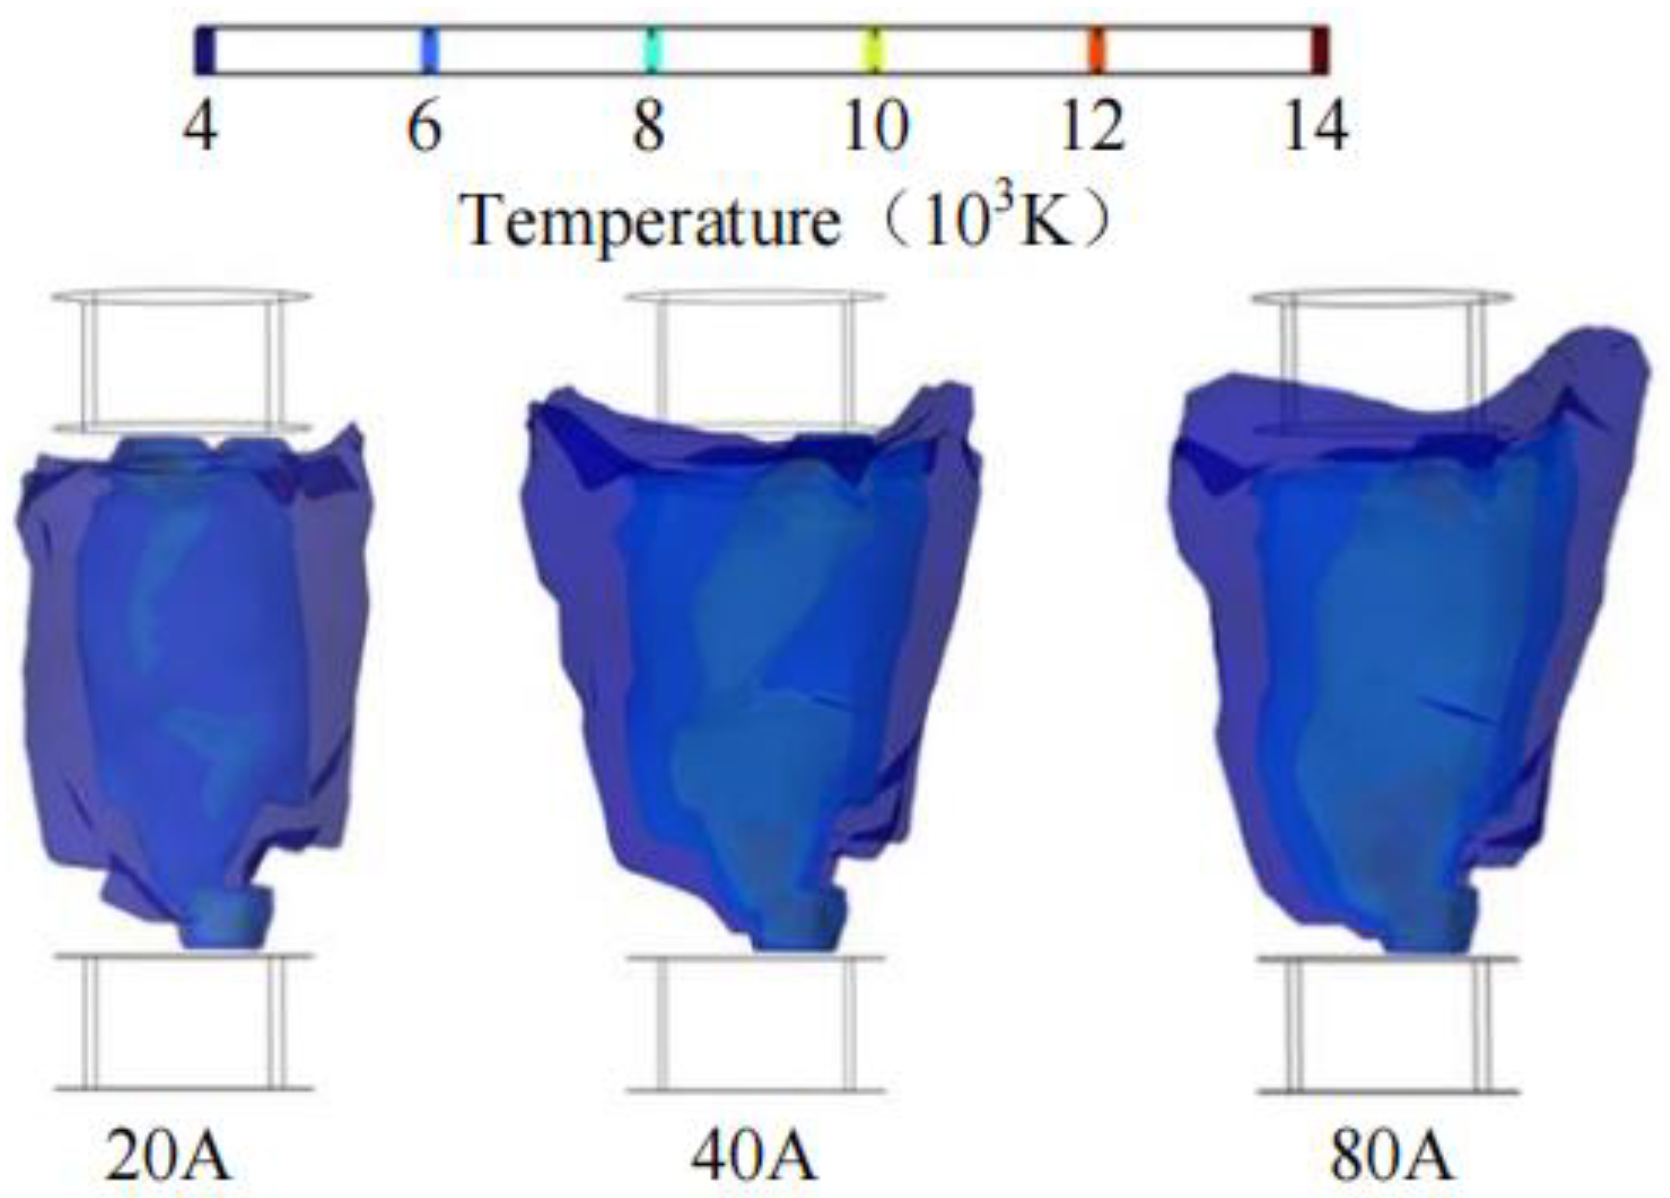
2.4. Three Dimensional Arc Simulation Calculation

Simulate and calculate the arc-related characteristics of the structure illustrated in Figure 6. Figure 7 presents the arc shape and temperature distribution at the peak current moment, with a gap distance of 2 cm and an inductive grounding current, exhibiting peak values of 20 A, 40 A, and 80 A, respectively.
From Figure 7, it is evident that at the peak current moment, the maximum arc temperature occurs at the arc root for grounding currents of 20 A, 40 A, and 80 A, all exceeding 14,000 K. The closer to the arc root, the higher the arc temperature. Specifically, the arc column temperature for a grounding current of 20 A is 6000 K, while for 40 A and 80 A, it reaches 8000 K. Additionally, the arc state exhibits an upward trend due to the influence of thermal buoyancy.
Figure 8 illustrates the waveform of arc voltage under grounding currents of 20 A, 40 A, and 80 A. It is evident from the figure that higher grounding currents correspond to lower arc voltages. As the current increases from zero to 10 A across the three operating conditions, the arc voltages reach peaks of 313 V, 110 V, and 72 V, respectively. Following this peak, the arc voltage begins to decline. Once the current reaches 20 A, the arc voltage stabilizes, and the waveforms for the three operating conditions converge.

3. Experimental Work

To validate the accuracy of the three-dimensional single-phase grounding arc simulation established in this article, an artificial single-phase grounding test platform was constructed within a real distribution network system. This test platform features an adequately long real line, enabling the execution of relevant experimental research.

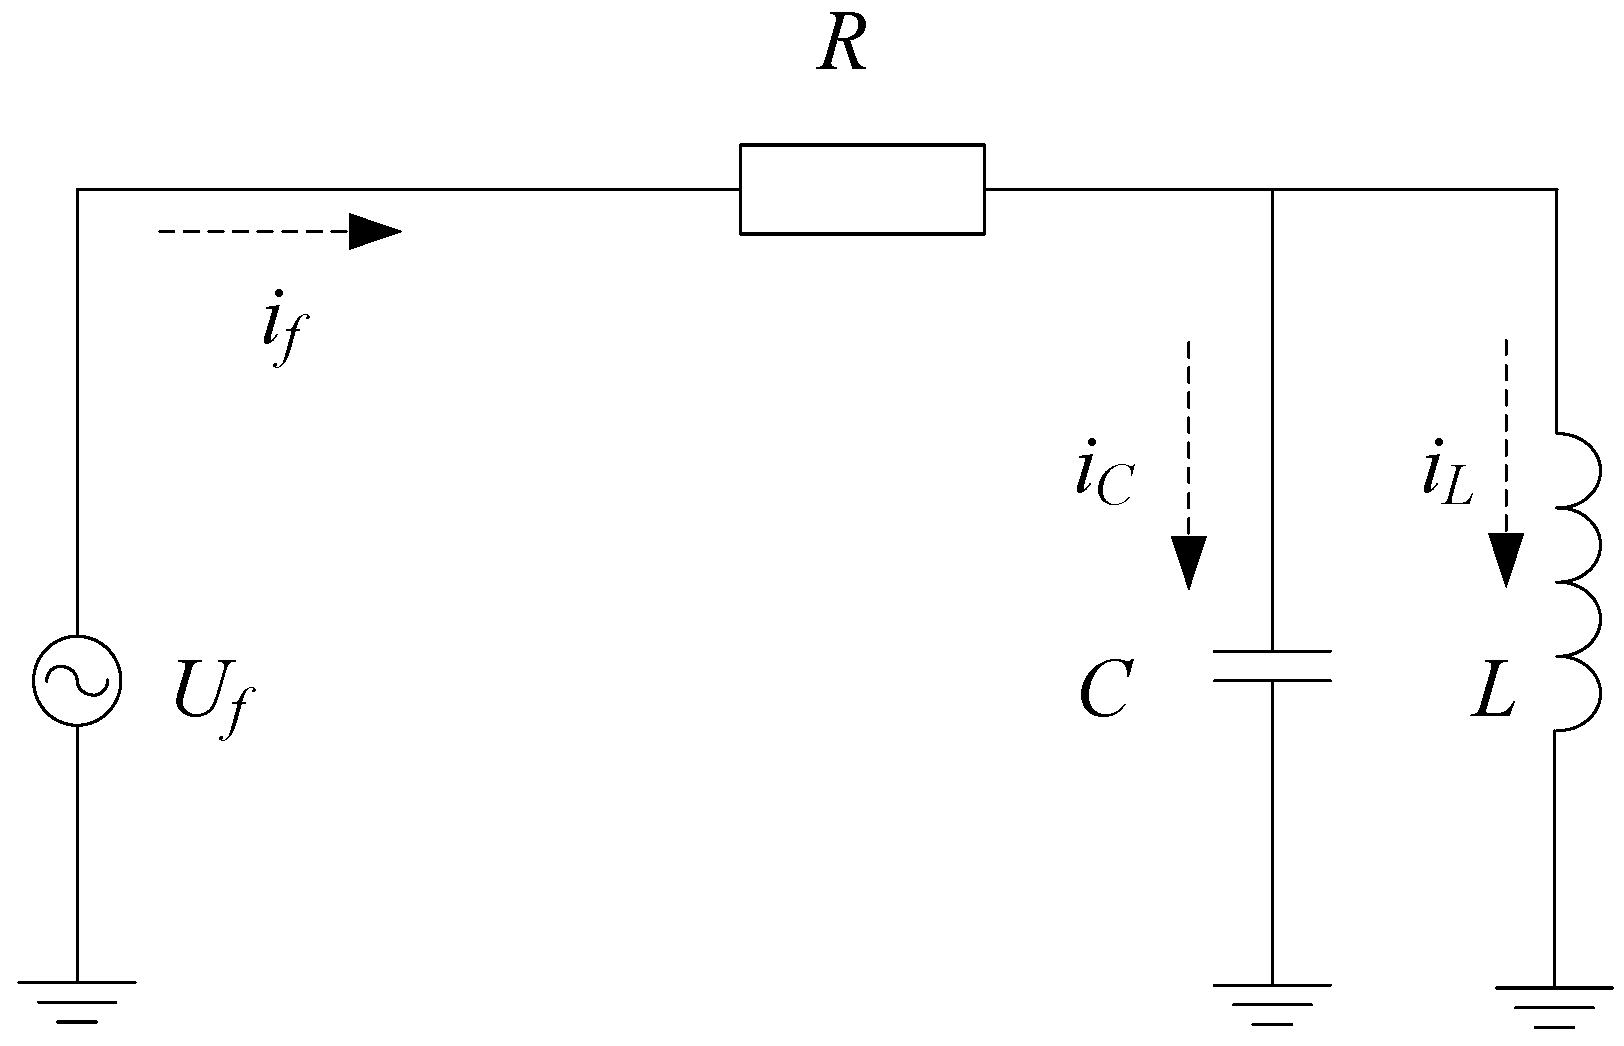
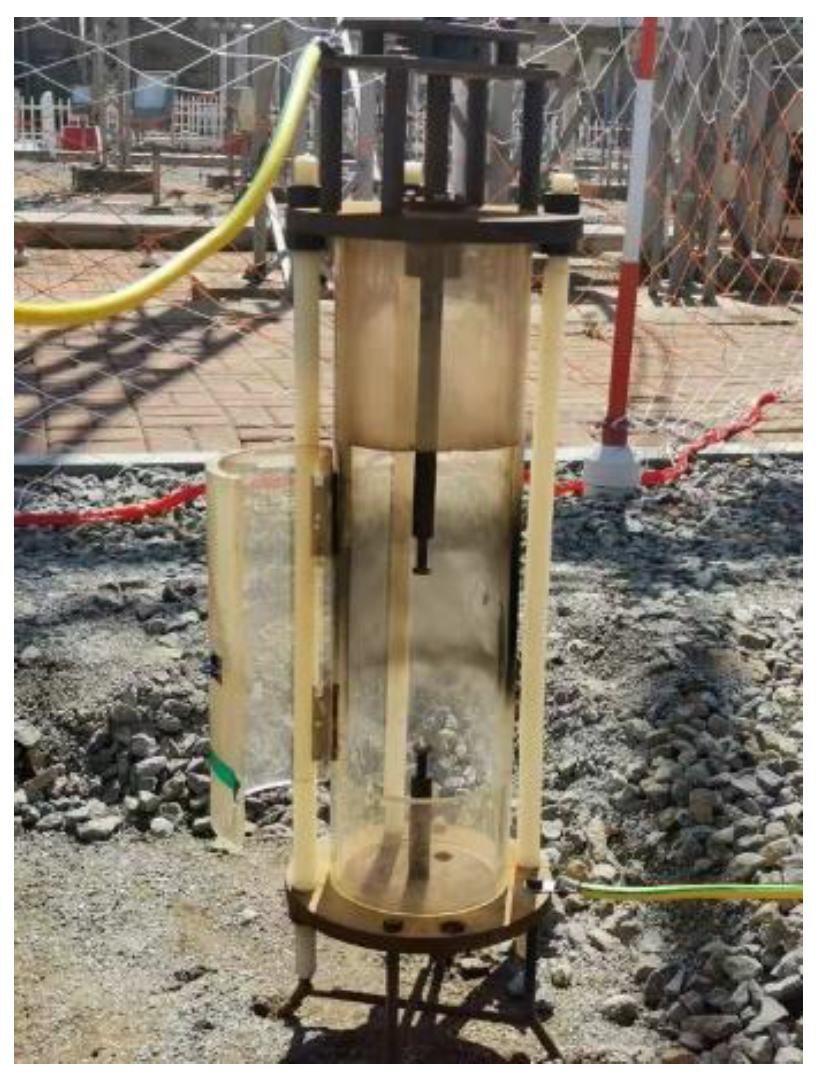
3.1. Establishment of Experimental Circuit

An artificial single-phase grounding test circuit is to be constructed on the 66 kV busbar side of a 220 kV substation. The fault phase voltage data will be obtained from the potential transformer (PT) configured in an open triangle arrangement, while the current at the grounding point will be measured using a current sensor(PEM.CWT Mini50HF, PEM Company, Birmingham, UK). Both the voltage and current data will be recorded using an oscilloscope (TEKTRONIX. MDO34, Tektronix Corporation, Beaverton, OR, USA).
Figure 9 presents the circuit diagram of a 220 kV substation. The first main transformer of the substation is operational, with a test circuit comprising five 66 kV outgoing lines, all of which are overhead lines. These outgoing lines consist of two load lines and three no-load lines, totaling a length of 64.065 km. The objective of the test is to investigate the arc characteristics of various grounding currents while maintaining the same system capacitance current. To ensure the system’s detuning degree, adjustments to the system capacitance current are necessary. A parallel capacitor group is installed on the 66 kV busbar to enhance the total capacitance current of the system. An arc suppression coil is positioned at the neutral point of the transformer for both outgoing line 1 and outgoing line 2. During the test, the configuration of the capacitor group and the position of the arc suppression coil can be modified to simulate the arc fault characteristics under different grounding currents. The manual single-phase grounding position is located at the beginning of the line in phase 5C of the outgoing line. The 66 kV line is connected to the upper electrode of the air arc ignition device, as depicted in Figure 10, via a wire, while the lower electrode is linked to the substation grounding grid. Prior to each test, the upper and lower electrodes are connected with nickel wire to initiate the arc.

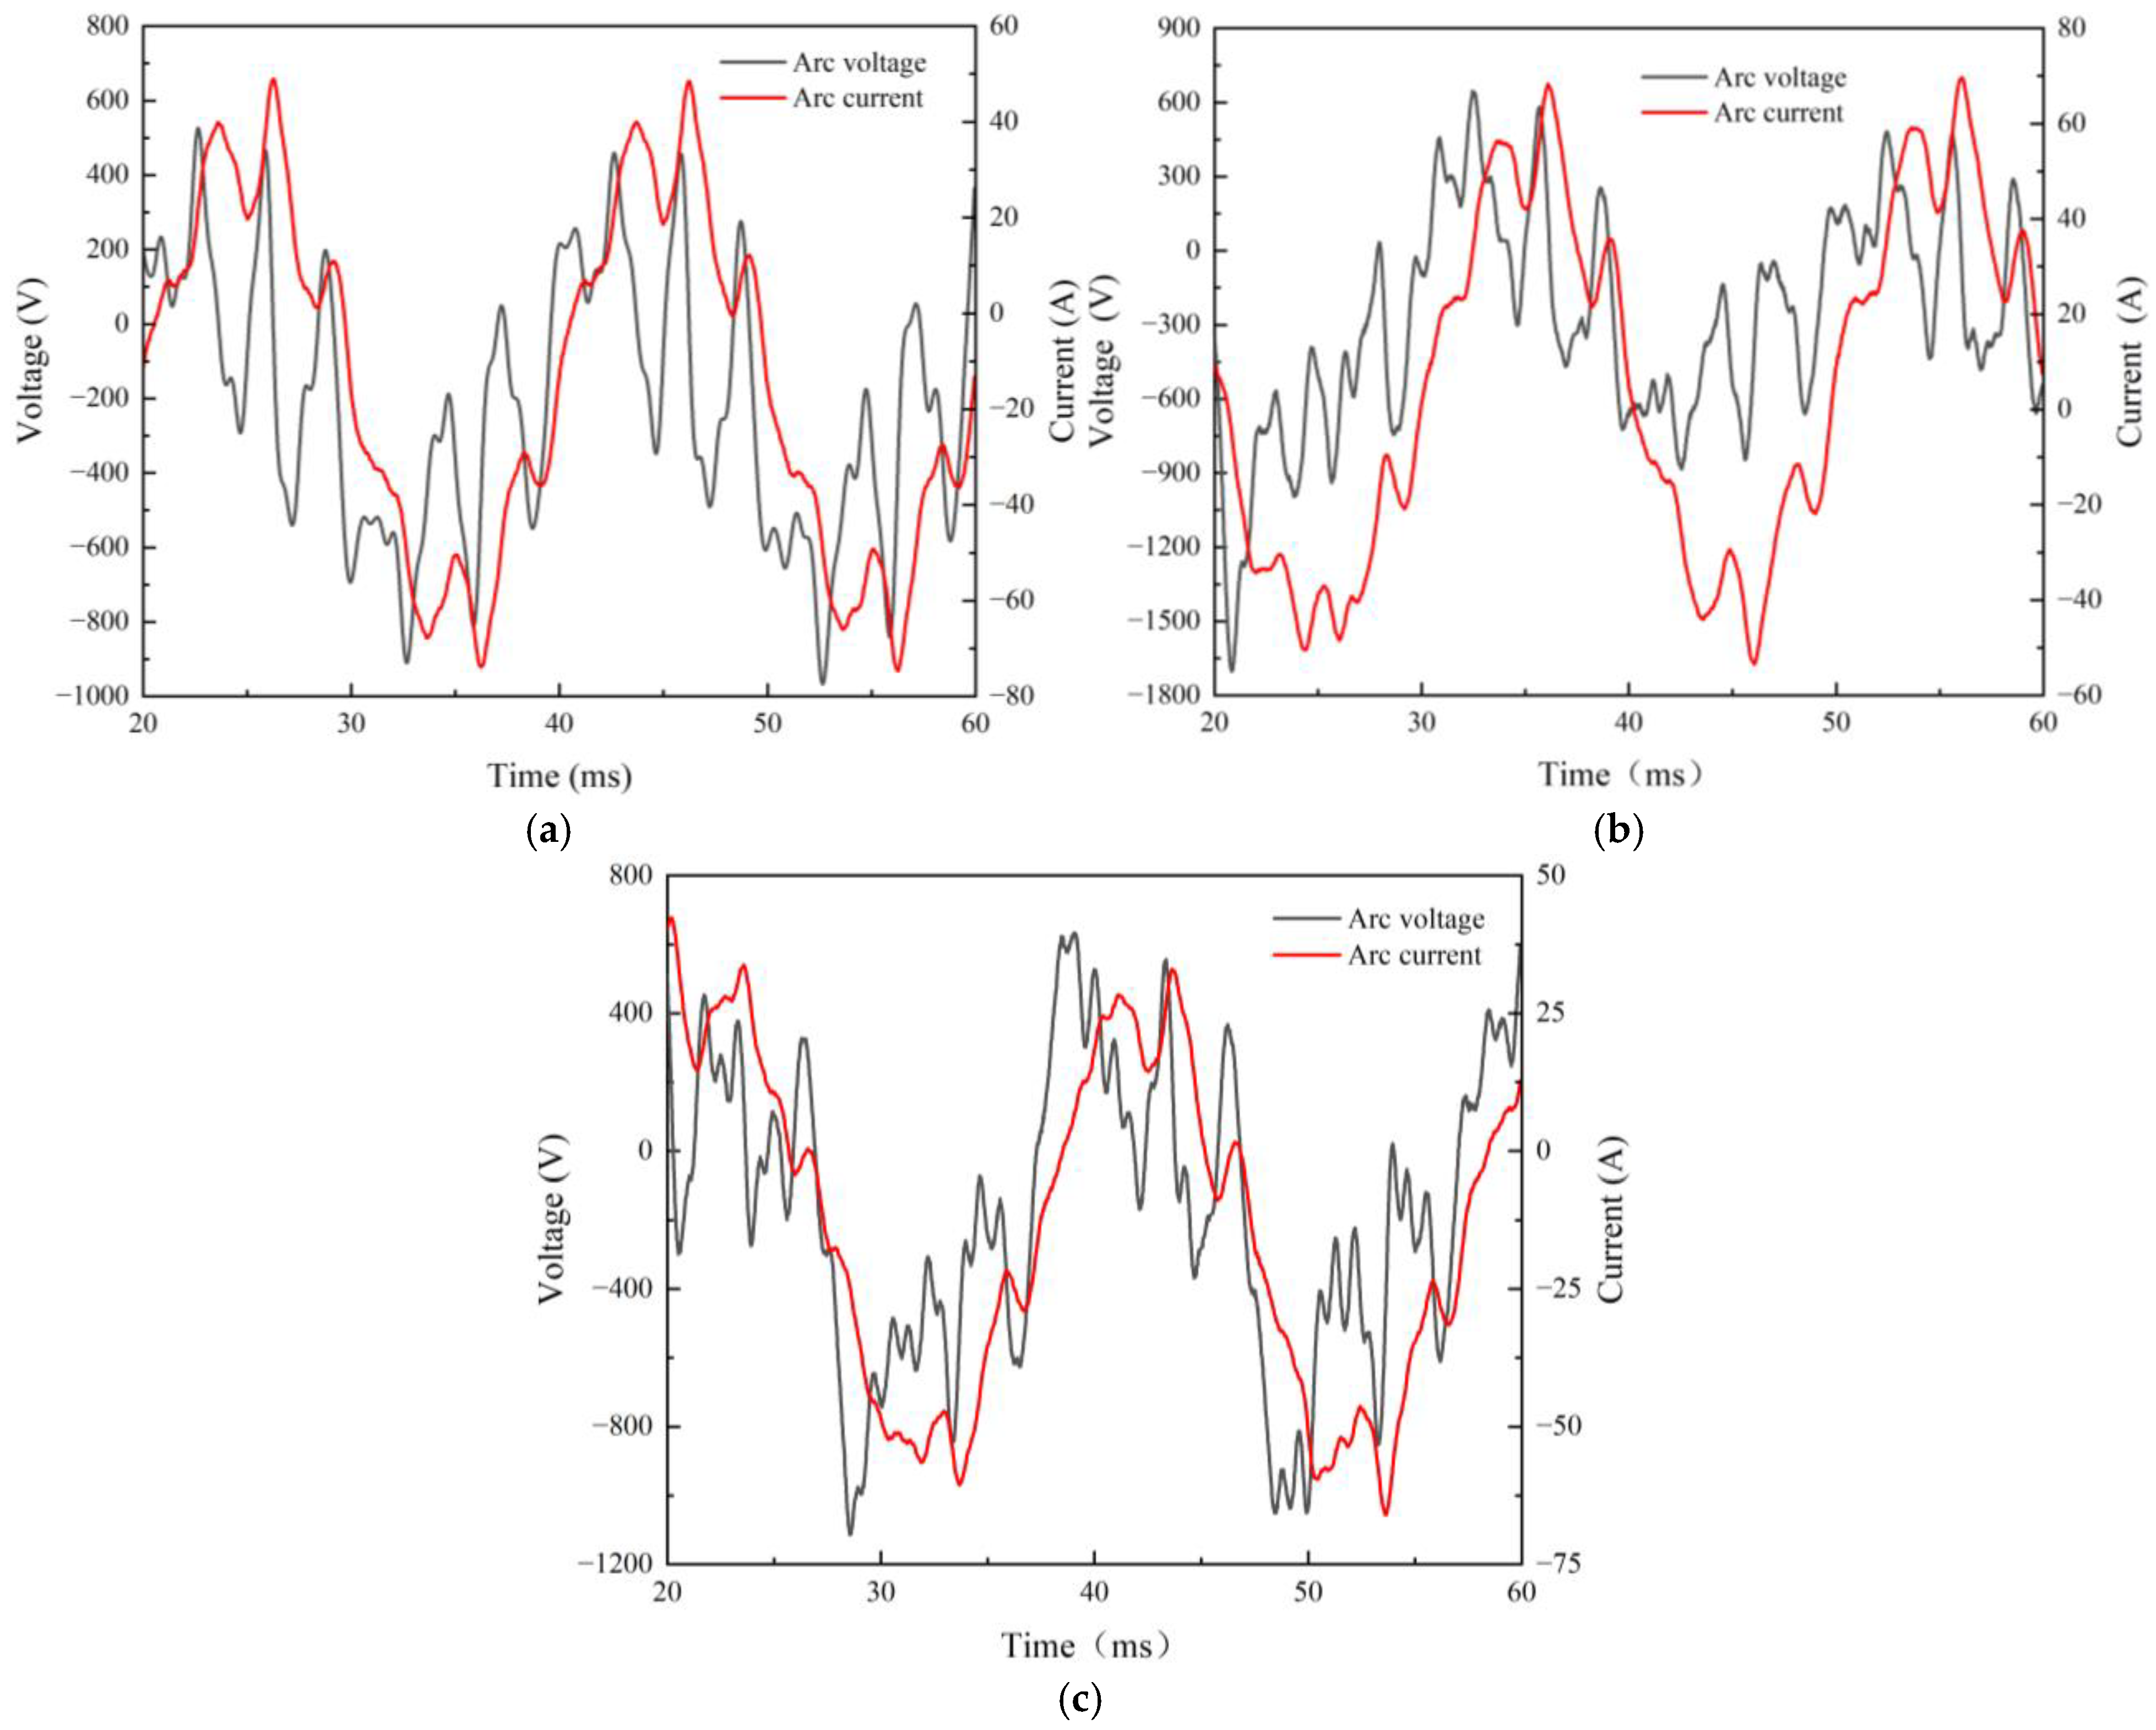
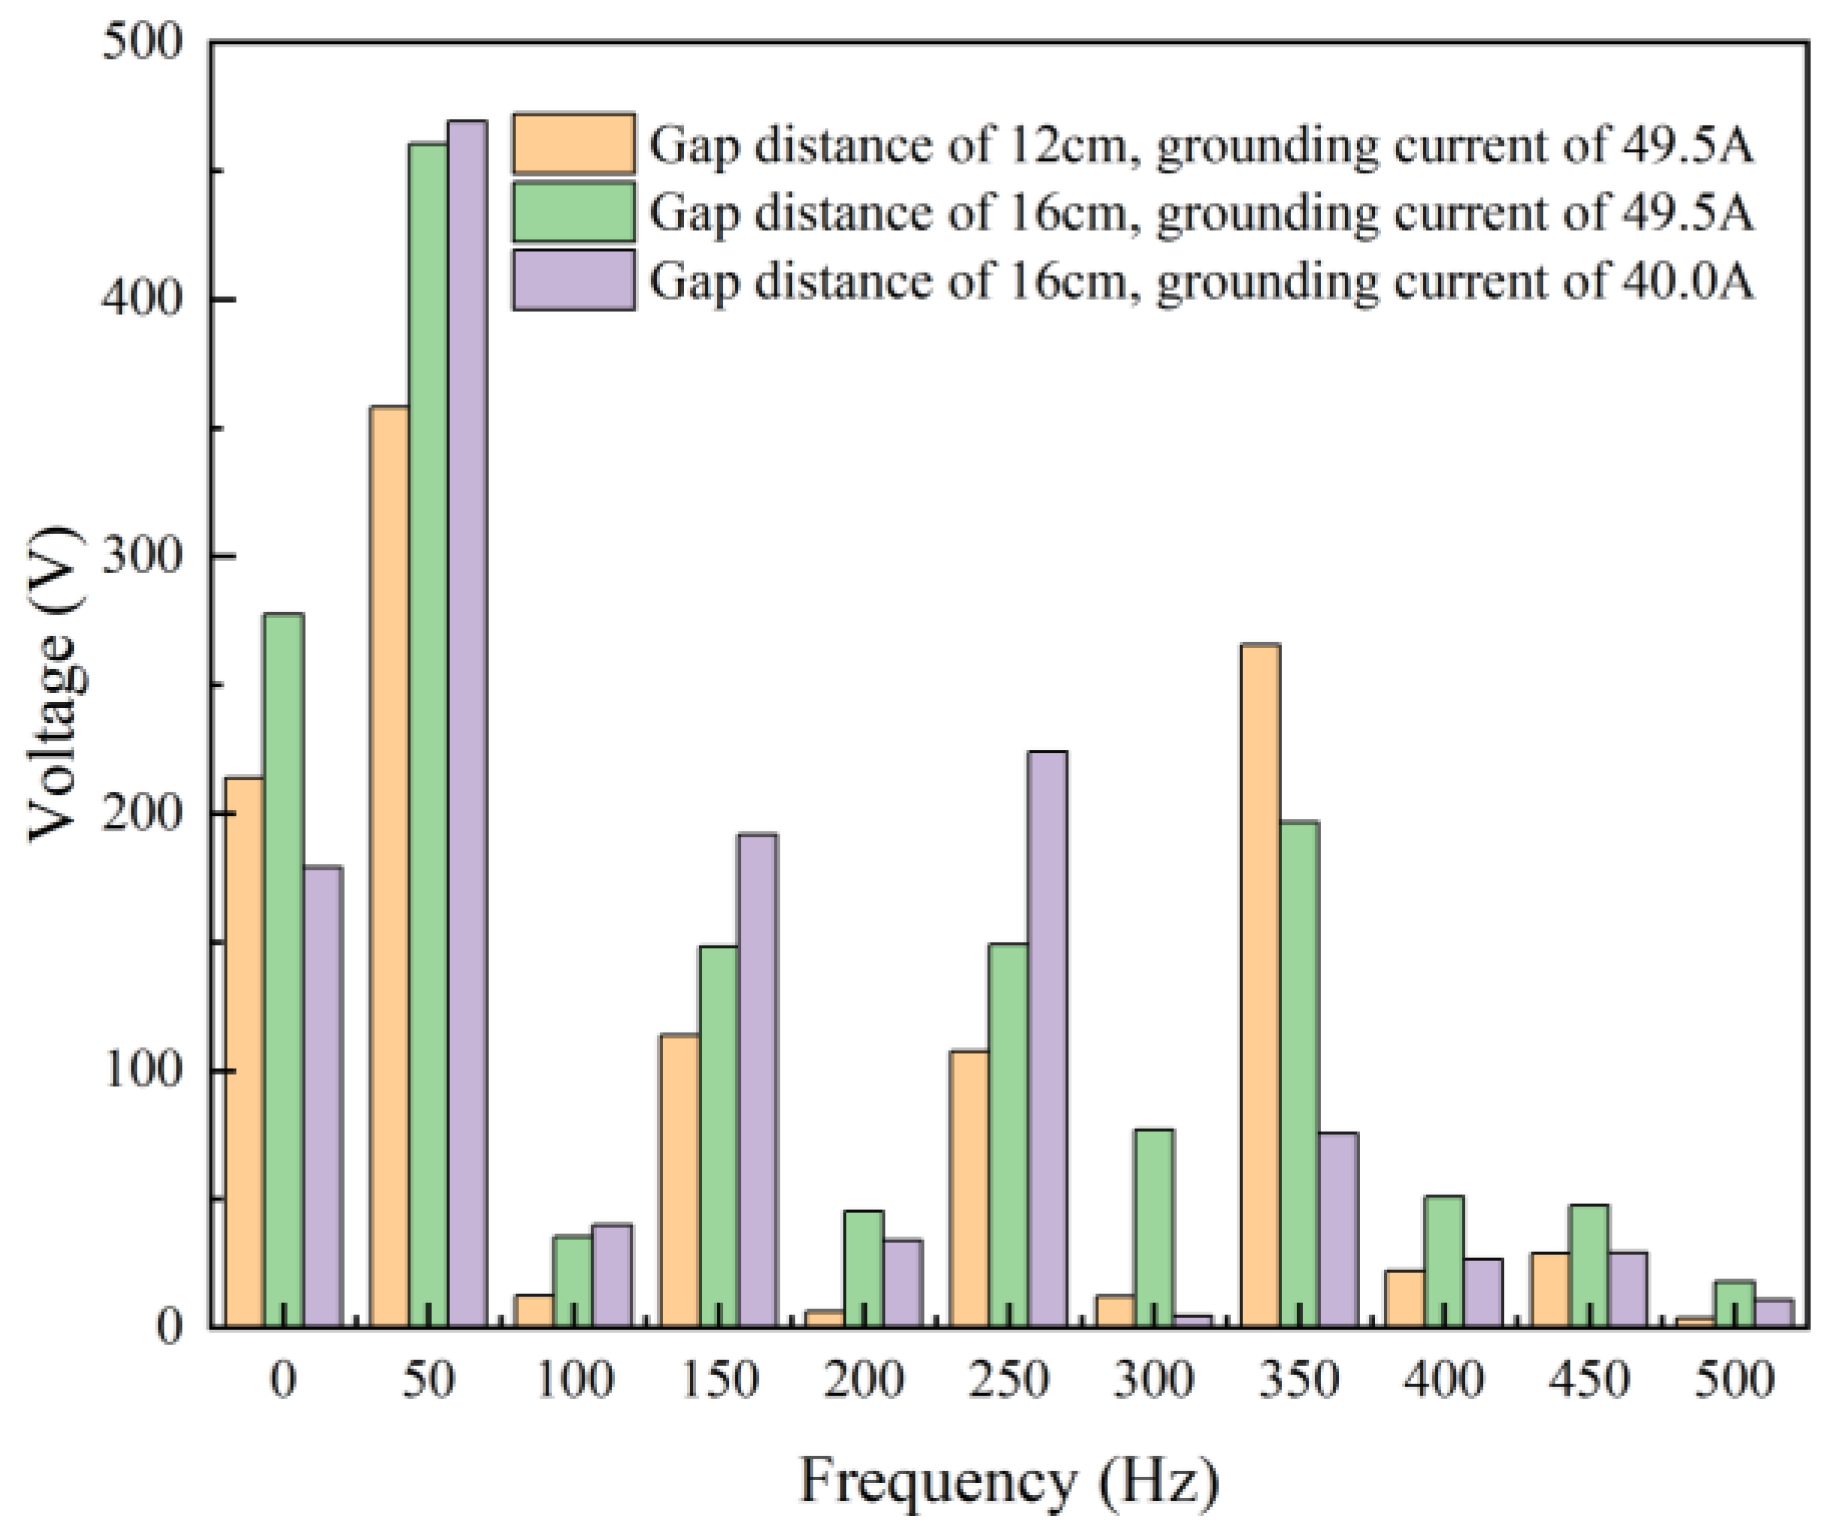
3.2. Experimental Results

The lower electrode of the arc generating device is connected to the ground grid via a wire. The ground resistance of the grid is measured to be 2 ohms. The ground point is situated close to the power source, and the impedance of the overhead line is considered negligible. The arc voltage is defined as the difference between the fault phase voltage and the ground grid voltage. To investigate the arc burning characteristics under consistent ground current with varying gaps, as well as the characteristics under a fixed gap distance with different ground currents, the electrode gap was adjusted to 12 cm and 16 cm. Additionally, a set of parallel capacitors was introduced to enhance the system’s capacitance current to 120.25 A. The gears of the two arc suppression coils were manually adjusted to enable the system to generate a peak inductive ground current of 49.5 A following single-phase grounding. Figure 11a,b illustrate the voltage and current waveform variations during the stable arc burning process at gap distances of 12 cm and 16 cm, respectively, with a ground current of 49.5 A. When the gap distance is set to 16 cm and the position of the arc suppression coil is adjusted, the system can achieve a peak inductive ground current of 40.0 A during single-phase grounding. Figure 11c depicts the voltage and current waveform changes during the stable arc burning process at a gap distance of 16 cm with a ground current of 40.0 A.
The Fourier decomposition of the arc voltage waveforms under the three specified working conditions has been conducted, resulting in the spectrum diagram presented in Figure 12. The figure illustrates that the test arc voltage comprises DC components, power frequency components, harmonic components, and high-frequency components. The amplitudes of the arc voltage power frequency components are measured at 358.1 V, 460.5 V, and 469.4 V, respectively, for the three working conditions. It is observed that as the gap distance increases, the arc burning voltage rises under a constant ground current; conversely, as the ground current increases, the arc burning voltage decreases at a constant gap.

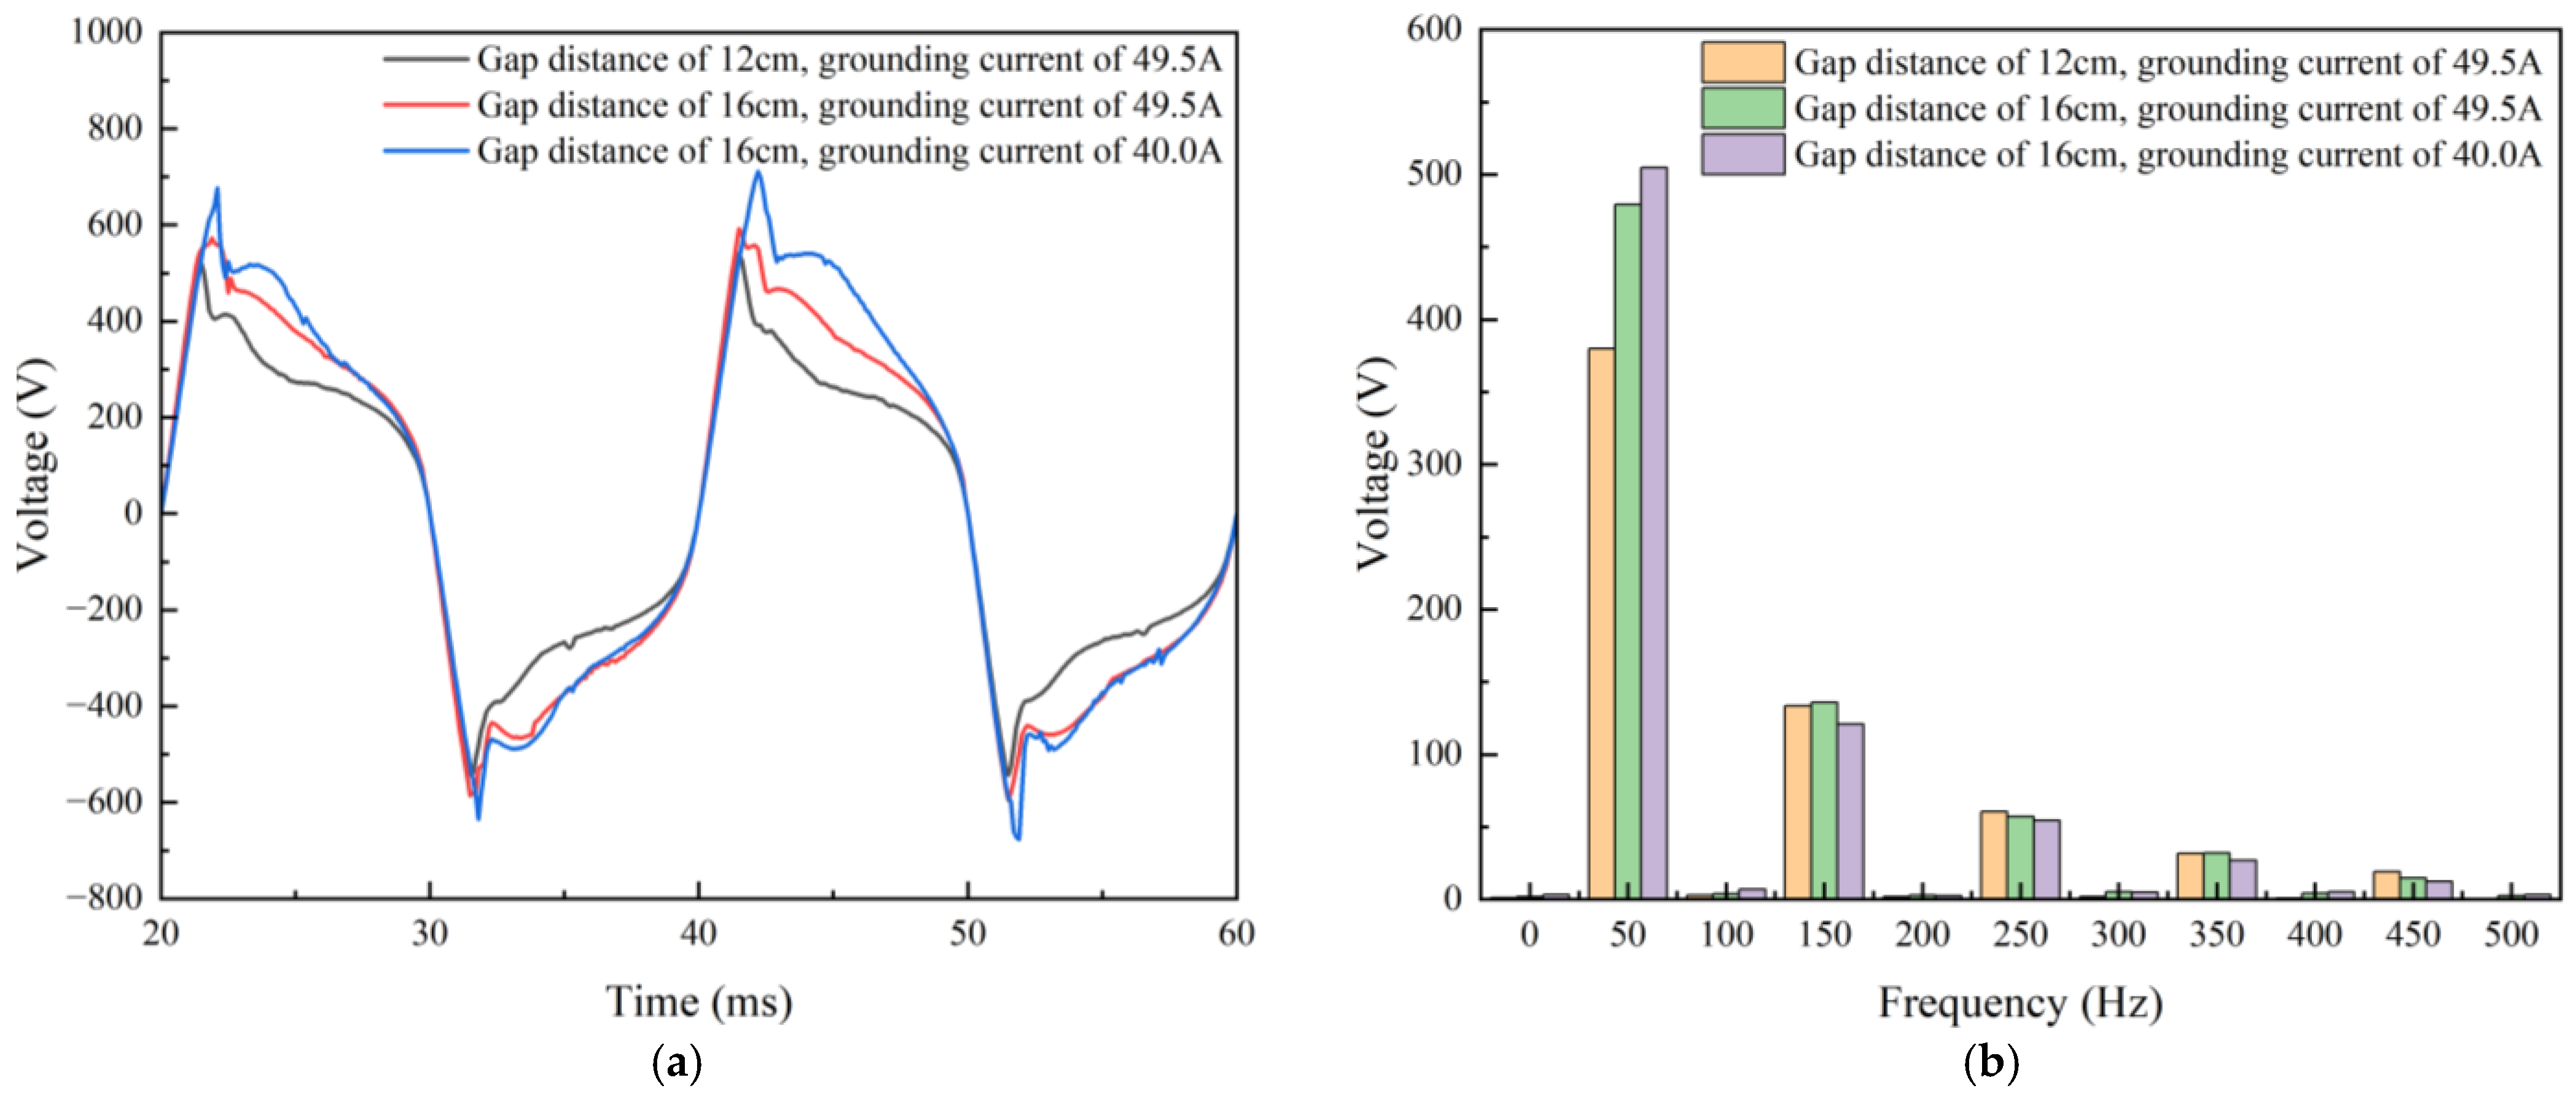
3.3. Comparative Analysis of Simulation and Experiment

To verify the effectiveness of the three-dimensional single-phase grounding arc mathematical model established in this article, the simulation settings were aligned with the experimental conditions detailed in Section 3.2. The arc voltages were calculated under three conditions: a gap distance of 12 cm with a grounding current of 49.5 A; a gap distance of 16 cm with a grounding current of 49.5 A; and a gap distance of 16 cm with a grounding current of 40.0 A. The initial temperature at the electrode gap in the simulation was established at 8000 K, corresponding to the nickel wire arc initiation observed in the experiment. The arc voltage and current under stable arc conditions were calculated and are presented in Figure 13a. Furthermore, Fourier decomposition was performed on the arc voltage to derive the spectrum displayed in Figure 13b.
The simulated arc voltage spectrum presented in Figure 13b indicates that the arc voltage across the three operating conditions primarily consists of power frequency components, with amplitudes of 379.9 V, 479.4 V, and 504.6 V, respectively. A comparison of the measured amplitudes of the power frequency components of the arc voltage in Figure 12 reveals values of 358.1 V, 460.5 V, and 469.4 V. Notably, the simulated power frequency voltages are higher than the measured values by 21.8 V, 18.9 V, and 35.2 V, corresponding to errors of 6.1%, 4.1%, and 7.5%, respectively. The main sources of errors are as follows: In real environments, various factors such as air humidity, air quality (including fine particulate matter), and the complex electromagnetic conditions present in substations can all significantly influence the arc burning voltage. Consequently, this finding partially validates the effectiveness of the three-dimensional single-phase grounding arc mathematical model based on magnetohydrodynamics developed in this study.

4. The Influence of Different Boundary Conditions on Arc Extinguishing

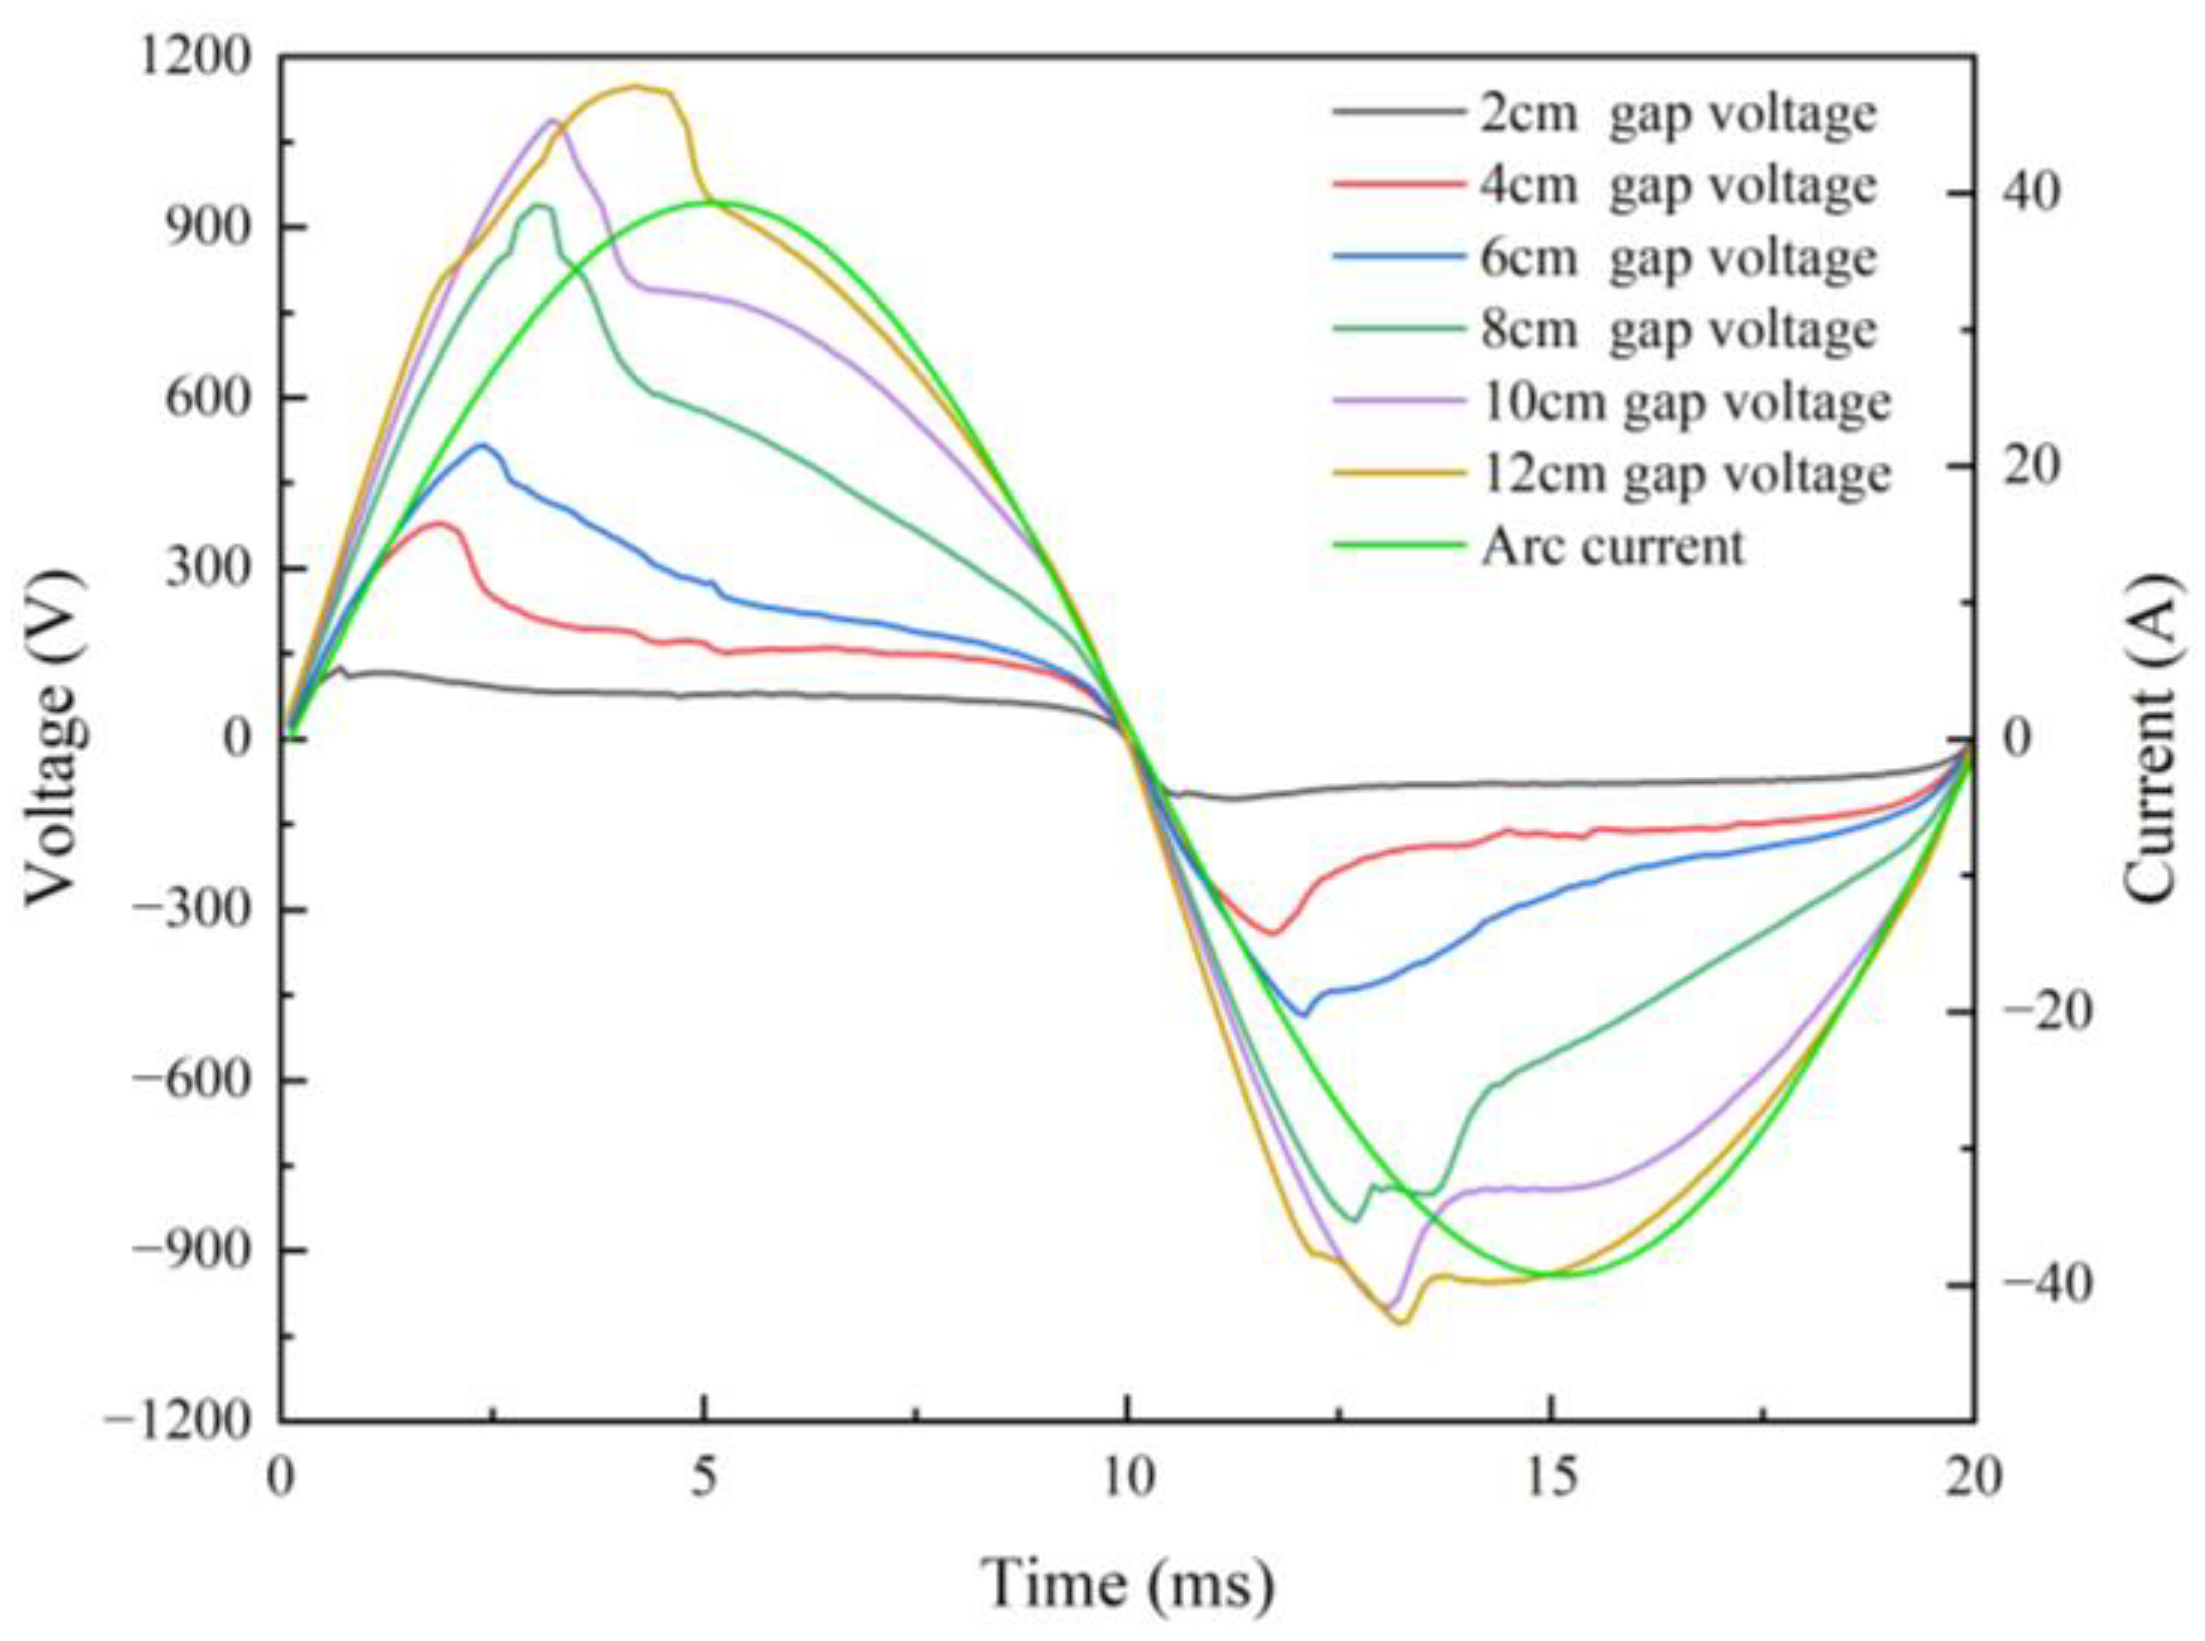
4.1. The Influence of Gap on Arc Extinguishing Under Windless Conditions

To investigate the effect of gap distance on arc characteristics, simulation calculations were conducted under windless conditions for gap distances of 2, 4, 6, 8, 10, and 12 cm. The system grounding current was set to an inductive current of 40.0 A during the simulation. Figure 14 illustrates the variations in arc voltage and current within one cycle for the different gap distances. As the current increases from zero, the plasma gains energy due to the current’s influence, resulting in a rapid rise in the air temperature within the gap and a corresponding increase in air conductivity. This phenomenon leads to a swift decline in arc resistance. Consequently, the gap voltage begins to decrease, leading to the occurrence of voltage spikes. The peak values for gap distances of 2, 4, 6, 8, 10, and 12 cm are 117 V, 378 V, 517 V, 938 V, 1088 V, and 1149 V, respectively. As the gap distance increases, the energy required to sustain the plasma arc also increases, resulting in higher peak values and later peak times. The peak times recorded are 1.2 ms, 1.9 ms, 2.4 ms, 3 ms, 3.2 ms, and 4.2 ms, respectively.
To analyze the temperature changes within the arc, a three-dimensional arc was divided along a longitudinal plane. Figure 15 illustrates the arc shape and temperature distribution at various gap current peaks and zero-crossing moments. The arc shape exhibits an irregular and upward trend due to the influences of the Lorentz force and thermal buoyancy force. At the peak current moment, the highest temperature at the arc root for gap distances of 2, 4, 6, 8, 10, and 12 cm exceeds 8000 K, with the center temperatures of the arc column recorded at 8100 K, 7500 K, 6800 K, 5800 K, 3800 K, and 2600 K, respectively. Conversely, at the zero-crossing moment of the current, the highest temperature at the arc root is above 7000 K, with center temperatures of the arc column at 7600 K, 7000 K, 6400 K, 5400 K, 3600 K, and 2400 K. As the gap distance increases, the temperature of the arc column decreases significantly. When the gap distance reaches 12 cm, regardless of whether the current is at its peak or at zero crossing, the center temperature of the arc column falls below 2600 K. From the perspective of air medium conductivity, at a temperature of 2600 K, the air conductivity reduces to 2.1 × 10⁻⁴ S/m, which impedes the ionization of the air medium and the formation of a conductive channel.
In summary, the grounding current is 40.0 A, the gap distance exceeds 12 cm, the temperature of the arc center column is below 2600 K, and the air conductivity decreases to 2.1 × 10⁻⁴ S/m. Under these conditions, it can be concluded that the arc cannot be maintained in a burning state. Relevant literature and experimental studies [28] also indicate that the arc can be considered extinguished when the temperature of the arc column falls below 3000 K.

4.2. The Influence of Wind Speed on Arc Extinguishing Under a Fixed Gap

The proportion of single-phase arc grounding faults occurring in open natural environments is significant, and wind can influence the shape and development of the arc. To investigate the effect of wind speed on the characteristics of single-phase grounded air arcs, this paper selected wind speeds of 1 m/s, 3 m/s, 5 m/s, and 7 m/s, an inductive grounding current of 40.0 A, and a gap of 2 cm for simulation calculations.
Figure 16 illustrates the arc shape and temperature distribution with a grounding current of 40.0 A, a 2 cm gap, four different wind speeds, and peak current moments. The figure indicates that the arc progresses in the direction of the wind due to the combined effects of the Lorentz force, thermal buoyancy force, and wind load, exhibiting an upward trend. While the grounding current remains constant, it is observed that as wind speed increases, the temperature of the arc column at its center becomes lower and thinner. At peak current moments, the center temperatures of the arc column at wind speeds of 1 m/s, 3 m/s, 5 m/s, and 7 m/s are measured at 7000 K, 6200 K, 5200 K, and 2900 K, respectively. When the wind speed exceeds 7 m/s, the center temperature of the arc column falls below 2900 K, leading to a decrease in air conductivity to 4.3 × 10⁻³ S/m, making it challenging for the air gap to penetrate and sustain an arc.
Due to the air medium’s conductivity of 9.5 × 10⁻³ S/m at a temperature of 3000 K, ionizing and forming a conductive channel is challenging. Using 3000 K as the baseline for arc extinction, Figure 17 illustrates the distribution of arc shapes at temperatures exceeding 3000 K under simulation conditions of a grounding current of 40.0 A, a gap of 2 cm, and a wind speed of 5 m/s. From 5 ms to 10 ms, the grounding current gradually decreases to zero, causing the arc to develop in the wind’s direction. The arc temperature declines until extinction occurs due to reduced input energy and the dual influence of wind force. In the interval from 10 ms to 15 ms, the grounding current gradually increases, leading to a rise in arc temperature until an arc column forms and the arc reignites.
In summary, the state of a single-phase grounded air arc is influenced by wind speed; specifically, higher wind speeds result in a more pronounced cooling effect on the arc. At a gap of 2 cm and a grounding current of 40.0 A, when the wind speed is 5 m/s, the temperature at the center of the arc column drops below 3000 K at the zero-crossing point of the current. Under these conditions, the arc extinguishes at the zero-crossing point and subsequently reignites. Conversely, at a wind speed of 7 m/s, during the peak moment of the current, the center temperature of the arc column reaches 2900 K, preventing the arc from sustaining a burning state.

5. Conclusions

This article proposes a three-dimensional single-phase grounding arc mathematical model grounded in magnetohydrodynamic theory. It conducts relevant experimental research to verify the accuracy of the mathematical model and simulates and analyzes the influence of various factors on the extinguishing characteristics of the grounding arc. The following conclusions can be drawn:
(1) An artificial single-phase grounding test platform was constructed within the actual distribution network to obtain arc voltage under different working conditions. A simulation model mirroring the test conditions was established, demonstrating an error margin within 8%, thus validating the proposed three-dimensional arc model.
(2) Under windless conditions, with an inductive grounding current of 40.0 A and a gap distance exceeding 12 cm, the arc column temperature remains below 2600 K, resulting in an air conductivity of 2.1 × 10⁻⁴ S/m; consequently, the arc cannot ignite.
(3) When the gap distance is 2 cm, the inductive grounding current measures 40.0 A, and the wind speed exceeds 7 m/s. At the peak moment of the current, the arc column temperature reaches 2900 K, while the air conductivity decreases to 4.3 × 10⁻³ S/m, resulting in the inability of the arc to maintain a stable burning state.

Author Contributions

Conceptualization, Y.L. and J.X.; methodology, Y.L. and J.X.; software, Y.L.; validation, Y.L. and P.W.; formal analysis, Y.L. and J.X.; investigation, Y.L.; resources, Y.L. and G.L.; data curation, Y.L.; writing—original draft preparation, Y.L.; writing—review and editing, Y.L.; visualization, J.X.; supervision, J.X.; project administration, J.X.; funding acquisition, J.X. All authors have read and agreed to the published version of the manuscript.

Funding

This research was funded by the National Natural Science Foundation of China (51637006; 51777130).

Data Availability Statement

The original contributions presented in this study are included in the article. Further inquiries can be directed to the corresponding author.

Acknowledgments

This paper has received support from the Institute of High Voltage and Power Systems at Shenyang University of Technology. The author extends gratitude to Jianyuan Xu. Additionally, support was provided by the State Grid Liaoning Electric Power Co., Ltd. High Voltage Research Institute of Electric Power Science Research Institute, for which the author wishes to thank Guanhua Li, of the High Voltage Research Institute.

Conflicts of Interest

Author Peng Wang was employed by the company State Grid Liaoning Electric Power Co., Ltd. Author Guanhua Li was employed by the company State Grid Liaoning Electric Power Co., Ltd., Electric Power Science Research Institute. The remaining authors declare that the research was conducted in the absence of any commercial or financial relationships that could be construed as a potential conflict of interest.

References

  1. Xu, L.; Li, Y.; Yuan, W.; Li, T.; Chen, X. An Adaptive Faulty Phase Detection Method Based on Wavelet Packet Reconstruction Energy of Three-phase Voltage Signals in Resonant Grounded Distribution Systems. Electr. Power Syst. Res. 2023, 225, 109774. [Google Scholar] [CrossRef]
  2. Qin, J.; Ning, X.; Fan, S.; Jia, Z. Discharge Ignition Mechanism of Tree-contacting Single-phase-to-ground Faults of Overhead Lines. Power Syst. Technol. 2023, 47, 1289–1298. [Google Scholar]
  3. Yuan, W.; Li, Y.; Xu, L.; Li, T.; Chen, X. A Fast Faulty Phase Selection Method Considering Fault Tolerance for Single phase to Ground Fault in Distribution Networks. IEEE Trans. Instrum. Meas. 2023, 72, 1–12. [Google Scholar] [CrossRef]
  4. Zhang, F.; Xue, Y.; Li, G.; Xu, B. A Method for Measuring and Adjusting the Detuning of Resonant Grounding Systems with Transient Information after Arc Extinction. IEEE Trans. Power Deliv. 2023, 38, 496–504. [Google Scholar] [CrossRef]
  5. Kachesov, V.; Lebedev, A.; Kitova, E. Monitoring in 6–35 kV Power Networks, Location of Single-phase Ground Fault and Detection of Fault Feeder. Int. J. Electr. Power Energy Syst. 2023, 152, 109271. [Google Scholar] [CrossRef]
  6. Shaalan, E.M.; Ghania, S.M.; Ward, S.A. Analysis of Electric Field inside HV Substations using Charge Simulation Method in Three Dimensional. In Proceedings of the 2010 Annual Report Conference on Electrical Insulation and Dielectic Phenomena CEIDP, 17–20 October 2010; p. 5724041. [Google Scholar]
  7. Ahmed, K.M.; Allam, T.M.; El-sayed, H.A.; Soliman, H.M.; Ward, S.A.; Saied, E.M. Design, Construction and Characterization of AC Atmospheric Pressure Air Non-thermal Plasma Jet. J. Fusion Energy 2014, 33, 627–633. [Google Scholar] [CrossRef]
  8. Mansour, D.-E.A.; Shaalan, E.A.; Ward, S.A.; Dein, A.Z.E.; Karaman, H.S. Multiple Nanoparticles for Enhancing Breakdown Strength and Heat Transfer Coefficient of Oil Nanofluids. In Proceedings of the 2017 Nineteenth International Middle East Power Systems Conference (MEPCON), Cairo, Egypt, 19–21 December 2017. [Google Scholar]
  9. Hong, C.; Qiu, H.-Y.; Gao, J.-H.; Lin, S.; Guo, M.-F. Semantic Segmentation-Based Intelligent Threshold-Free Feeder Detection Method for Single-phase Ground Fault in Distribution Networks. IEEE Trans. Instrum. Meas. 2024, 73, 1–9. [Google Scholar] [CrossRef]
  10. Liang, H.; Li, H.; Wang, G. A Single-Phase-to-Ground Fault Detection Method Based on the Ratio Fluctuation Coefficient of the Zero-sequence Current and Voltage Differential in a Distribution Network. IEEE Access 2023, 11, 7297–7308. [Google Scholar] [CrossRef]
  11. Zhang, Z.; Liu, J.; Shao, W.; Wang, Y. Fault Line Selection Using Multiple Disturbance Characteristics of Fault phase Active Grounding in Resonant Grounded Distribution Networks. Int. J. Electr. Power Energy Syst. 2022, 138, 107931. [Google Scholar] [CrossRef]
  12. Wang, Y.; Liu, J.; Zhang, Z.; Zheng, T.; Ren, S.; Chen, J. A Faulty Line Detection Method for Single Phase-to-ground Fault in Resonant Grounding System with CTs Reversely Connected. Int. J. Electr. Power Energy Syst. 2023, 147, 108873. [Google Scholar] [CrossRef]
  13. Chen, H.; Lin, X.; Li, G.; Xu, J.; Li, H.; Wang, S. Experimental Research and Numerical Simulation of Single Soil-arc-grounding-fault in Distribution Networks. Wirel. Commun. Mob. Comput. 2021, 2021, 1875068. [Google Scholar] [CrossRef]
  14. Achitaev, A.A.; Suslov, K.V.; Volkova, I.O.; Kozhemyakin, V.E.; Dvoryansky, Y.V. Development of an Algorithm for Identifying Single-phase Ground Fault Conditions in Cable and Overhead Lines in The Networks with Isolated Neutral. Energy Rep. 2023, 9, 1079–1086. [Google Scholar] [CrossRef]
  15. Wan, G.; Xu, X. Research on Single-phase Grounding Detection Method in Small-current Grounding Systems Based on Image Recognition. Front. Energy Res. 2024, 12, 1473472. [Google Scholar] [CrossRef]
  16. Tang, T.; Huang, C.; Li, Z.; Yuan, X. Identifying Faulty Feeder for Single-phase High Impedance Fault in Resonant Grounding Distribution System. Energies 2019, 12, 598. [Google Scholar] [CrossRef]
  17. Mayr, O. Beiträge zur Theorie des statischen und des dynamischen Lichtbogens. Arch. Für Elektrotechnik 1943, 37, 588–608. [Google Scholar] [CrossRef]
  18. Cassie, A.M. Arc Rupture and Circuit Severity: A New Theory; CIGRE Report; Internationale des Grands Reseaux Electriques’a Haute Tension (CIGRE): Paris, France, 1939. [Google Scholar]
  19. Schavemaker, P.H.; van der Sluis, L. An improved Mayr-type Arc Model Based on Current-zero Measurements. IEEE Trans. Power Deliv. 2000, 15, 580–584. [Google Scholar] [CrossRef]
  20. Khakpour, A.; Franke, S.; Gortschakow, S.; Uhrlandt, D.; Methling, R.; Weltmann, K.-D. An Improved Arc Model Based on the Arc Diameter. IEEE Trans. Power Deliv. 2016, 31, 1335–1341. [Google Scholar] [CrossRef]
  21. Gouda, O.E.; Ibrahim, D.K.; Soliman, A. Parameters Affecting the Arcing Time of HVDC Circuit Breakers Using Black Box Arc Model. IET Gener. Transm. Distrib. 2019, 13, 461–467. [Google Scholar] [CrossRef]
  22. Ferraz, R.G.; Iurinic, L.U.; Filomena, A.D.; Gazzana, D.S.; Bretas, A.S. Arc Fault Location: A Nonlinear Time Varying Fault Model and Frequency Domain Parameter Estimation Approach. Int. J. Electr. Power Energy Syst. 2016, 80, 347–355. [Google Scholar] [CrossRef]
  23. Wang, B.; Cui, X. Nonlinear Modeling and Analytical Analysis of Arc High Resistance Grounding Fault in Distribution Network with Neutral Grounding via Arc Suppression Coil. Proc. CSEE 2021, 41, 3864–3872. [Google Scholar]
  24. Wang, B.; Geng, J.; Dong, X. High-impedance Fault Modeling Based on Solid Dielectric Electrical Breakdown Theory. Autom. Electr. Power Syst. 2014, 38, 62–66. [Google Scholar]
  25. Nam, S.R.; Park, J.K.; Kang, Y.C.; Kim, T.H. A Modeling Method of a High Impedance Fault in a Distribution System Using Two Series Time-varying Resistances in EMTP. Proc. IEEE Power Eng. Soc. Trans. Distrib. Conf. 2001, 2, 1175–1180. [Google Scholar]
  26. Jiang, C.; Bi, M.; Zhang, S.; Li, K.; Lei, S.; Jiang, T. Study on Arc Characteristics and Combustion Feature of Tree-wire Discharge Fault in Distribution Line. Electr. Power Syst. Res. 2024, 230, 110210. [Google Scholar] [CrossRef]
  27. Li, G.; Huang, K.; He, J.; Sun, S.; Liu, Q. Simulation Study on Arc Characteristics of Single Phase Grounding Overhead Line Tree in Distribution Network. In Proceedings of the 2023 5th International Academic Exchange Conference on Science and Technology Innovation (IAECST), Guangzhou, China, 8–10 December 2023; pp. 1302–1306. [Google Scholar]
  28. Yan, X.; Chen, W.; He, Z.; Wang, C.; Wu, J.; Wang, J. Temperature Measurement of Air Arc in Long Gap by Spectrum Diagnosis. Proc. CSEE 2011, 31, 146–152. [Google Scholar]
Figure 1. Equivalent circuit of single-phase earth fault in a neutral grounded system by suppression coil.
Energies 18 00256 g001
Figure 2. Multi-physical field coupling relationship of grounding arc.
Energies 18 00256 g002
Figure 3. Mass flow rate through various interfaces of infinitesimal fluid microelements.
Energies 18 00256 g003
Figure 4. Infinitesimal fluid microelements subjected to surface forces.
Energies 18 00256 g004
Figure 5. Energy flux during the motion of infinitesimal microelements.
Energies 18 00256 g005
Figure 6. Schematic diagram of grounding arc simulation model.
Energies 18 00256 g006
Figure 7. Peak current moment, grounding current 20 A, 40 A, 80 A arc shape and temperature distribution.
Energies 18 00256 g007
Figure 8. Arc shape and temperature distribution under ground current of 20 A, 40 A, and 80 A at peak current.
Energies 18 00256 g008
Figure 9. A 220 kV substation circuit diagram.
Energies 18 00256 g009
Figure 10. Air arc ignition device.
Energies 18 00256 g010
Figure 11. (a) Gap distance of 12 cm, grounding current of 49.5 A, arc voltage and current test waveform; (b) gap distance of 16 cm, grounding current of 49.5 A, arc voltage and current test waveform; (c) gap distance of 16 cm, grounding current of 40.0 A, arc voltage and current test waveform.
Energies 18 00256 g011
Figure 12. Spectrum of arc voltage test waveform under different operating conditions.
Energies 18 00256 g012
Figure 13. (a) Simulation waveforms of arc voltage under different operating conditions; (b) spectral analysis of arc voltage simulation waveforms under different operating conditions.
Energies 18 00256 g013
Figure 14. Arc voltage and current waveform under different gap distances.
Energies 18 00256 g014
Figure 15. Arc shape and temperature distribution at different times and gap distances.
Energies 18 00256 g015
Figure 16. Arc shape and temperature distribution at different wind speeds during the peak current moment in a 2 cm gap.
Energies 18 00256 g016
Figure 17. Arc shape and temperature distribution at different times of 2 cm gap and 5 m/s.
Energies 18 00256 g017
Disclaimer/Publisher’s Note: The statements, opinions and data contained in all publications are solely those of the individual author(s) and contributor(s) and not of MDPI and/or the editor(s). MDPI and/or the editor(s) disclaim responsibility for any injury to people or property resulting from any ideas, methods, instructions or products referred to in the content.

