Article

Higher-Order Dynamic Mode Decomposition to Identify Harmonics in Power Systems

1
Department of Electrical and Computer Engineering, University Laval, Quebec, QC G1V 0A6, Canada
2
Hydro Quebec Research Institute, Varennes, QC J3X 1S1, Canada
*
Author to whom correspondence should be addressed.
Energies 2025, 18(19), 5327; https://doi.org/10.3390/en18195327 (registering DOI)
Submission received: 11 August 2025 / Revised: 12 September 2025 / Accepted: 4 October 2025 / Published: 9 October 2025
(This article belongs to the Special Issue Energy, Electrical and Power Engineering: 4th Edition)

Abstract

The proliferation of renewable energy sources and distributed generation systems interfaced to the grid by power electronics systems is forcing us to better understand the issues arising due to the quality of electrical signals generated through these devices. Understanding and monitoring these harmonics is crucial to ensure the smooth and seamless operation of these networks, as well as to protect and manage the renewable energy sources-based power system. In this paper, we propose an advanced method of dynamic modal decomposition, called Higher-Order Dynamic Mode Decomposition (HODMD), one of the recently proposed data-driven methods used to estimate the frequency/amplitude and phase with high resolution, to identify the harmonic spectrum in power systems dominated by renewable energy generation. In the proposed method, several time-shifted copies of the measured signals are integrated to create the initial data matrices. A hard thresholding technique based on singular value decomposition is applied to eliminate ambiguities in the measured signal. The proposed method is validated and compared to Synchrosqueezing Transform based on Short-Time Fourier Transform (SST-STFT) and the Concentration of Frequency and Time via Short-Time Fourier Transform (ConceFT-STFT) using synthetic signals and real measurements, demonstrating its practical effectiveness in identifying harmonics in emerging power networks. Finally, the effectiveness of the proposed methodology is analyzed on the energy storage-based laboratory-scale microgrid setup using an Opal-RT-based real-time simulator.

1. Introduction

The growing integration of renewable energy production systems into power grids presents major challenges, not only due to the intermittent nature of renewable sources but also because of the power electronic interfaces that connect them to the grid [1]. Understanding the interactions between these converters and the grid is crucial for assessing signal quality, ensuring system stability, and preventing adverse phenomena in converter-dominated networks.
With the increasing penetration of power electronic converters, electromagnetic transient (EMT) studies have become indispensable. These studies capture fast, short-duration phenomena and require high-resolution time–frequency analysis tools for accurate characterization. EMT simulations are widely recommended by international standards such as NERC Project 2022-04 to represent system behavior across a wide frequency range. However, their interpretation is often limited by the resolution constraints of conventional spectral analysis techniques [2].
Several methods have been proposed for power system signal analysis, including Fourier techniques [3,4], optimization-based methods, adaptive filters, zero-crossing techniques [5], and neural network approaches [6]. Despite their usefulness, these methods exhibit limitations such as poor robustness to noise, dependency on prior frequency knowledge, and difficulty in detecting interharmonics or subsynchronous components. They also struggle to accurately estimate weakly damped and time-varying components. Importantly, phase estimation remains a critical challenge: Unreliable phase tracking can lead to erroneous signal reconstructions and misinterpretation of system dynamics.
To address these issues, Prony’s method and its variants have been used to estimate modal frequency, damping, amplitude, and phase from PMU ringdown data. Although effective, Prony analysis remains sensitive to noise, requires sufficiently excited modes, and incurs significant computational cost when exploring multiple model orders [7]. These limitations have motivated the exploration of data-driven approaches such as Dynamic Mode Decomposition (DMD), which derives models directly from time-series snapshots [8]. Originally developed in fluid dynamics, DMD has since been applied in oscillation analysis [9,10], inertia estimation [11], and state estimation frameworks using Kalman filtering [12].
Recent studies have demonstrated DMD’s effectiveness in estimating frequency and amplitude in electrical systems [13,14]. For instance, ref. [15] combined Variational Mode Decomposition (VMD) with DMD to enhance robustness under noisy conditions, using VMD for decomposition and DMD for sparse feature extraction. However, the method is computationally intensive, sensitive to the number of modes, and cannot directly isolate DC components, while VMD may fail under highly non-stationary conditions with abrupt onsets [16].
Due to their computational simplicity, Fourier-based methods are frequently employed [17]; however, spectrum leakage and boundary effects can reduce accuracy, especially in non-stationary or transient environments. Higher-Order Dynamic Mode Decomposition (HODMD) addresses these shortcomings by augmenting the snapshot matrix with multiple time shifts, increasing the effective state dimension and improving spectral resolution. HODMD has been shown to outperform standard DMD by detecting weak or closely spaced modes and filtering out low-energy dynamics [18], making it well suited for the analysis of quasi-periodic and transient signals in converter-dominated systems [19].
In this paper, we apply HODMD to analyze a wide range of signals from both conventional and converter-dominated power systems. We compare its performance against two advanced time–frequency analysis techniques: Synchrosqueezing Transform-based Short-Time Fourier Transform (SST-STFT) [20,21] and the Concentration of Frequency and Time via SST (ConceFT-STFT) [22]. Both stationary and non-stationary synthetic signals are used to benchmark accuracy. Experimental validation is performed using a detailed battery energy storage system model with switching effects and a real-time OPAL-RT OP4510/HYPERSIM platform. Finally, we demonstrate the method’s capability on real-world PMU data from the Hydro-Québec grid.
The main contributions of this paper are summarized as follows:
  • Introduction of a robust harmonic spectrum analysis framework based on HODMD, maintaining accuracy under stressed operating conditions such as transients, microgrids, and distorted waveforms;
  • Extension of harmonic analysis to non-stationary signals, enabling accurate extraction of frequency, amplitude, and phase for both fundamental and harmonic components;
  • Development of a sliding window HODMD implementation for high resolution time–frequency tracking with amplitude;
  • Validation of the proposed method through simulation and real-time experiments, demonstrating robustness to switching harmonics and noise in both simulated and real-world grid operation and monitoring environments.

2. Dynamic Mode Decomposition (DMD)

DMD is a powerful data-driven technique for analyzing both stationary and non-stationary signals arising from complex dynamical systems. In the context of power systems, such signals often consist of multiple components, harmonic distortions, interharmonic oscillations, and DC offsets, each contributing to the overall system behavior in a distinct way. These composite signals can be mathematically expressed as follows:
v k = j = 1 N ϕ j a j e λ j k ,
where v k is a time-dependent vector of size J, ϕ j are normalized spatial modes, and a j are mode amplitudes. The term λ j represents the damping ratio or growth rate. This formulation elegantly captures a wide spectrum of signal features typically seen in power systems, such as the following:
  • Harmonics: integer multiples of a fundamental frequency due to nonlinear loads;
  • Interharmonics: frequencies that lie between integer harmonics, often resulting from variable speed drives or power electronic switching;
  • DC Components: steady-state offsets that may arise from asymmetrical faults or rectified signals.
By decomposing these signals into mode-specific temporal and spatial dynamics, DMD provides a framework that not only enhances interpretability but also enables targeted diagnostics, filtering, and system identification, particularly under transient or non-periodic conditions.
The general waveform of interest for this study is a single-phase sinusoidal signal (expressed in per unit), with superimposed DC, interharmonic, and fundamental harmonic components
x ( k ) = x D C + x p cos 2 π f c k T + θ p ( k ) + x ih cos 2 π f ih k T + θ ih ( k ) + m = 2 M x m cos 2 π m f c k T + θ m ( k )
where
  • x D C : DC value with/without decaying;
  • x m , θ m : magnitude and phase of the m th harmonic;
  • x p , f c , θ p : magnitude, frequency, and angle of the fundamental frequency in Hz;
  • x ih , f ih , θ ih : magnitude, frequency, and angle of the inter-harmonic component.
For simplicity, but without loss of generality, we assume the signal contains a single interharmonic. This formalism can be easily extended to multiple interharmonics both above and below the fundamental frequency.

2.1. Standard DMD Assumption

The classical DMD approach operates under the premise that a linear operator R governs the progression of flow snapshots v k (state vectors) to their successive snapshots v k + 1 , a concept commonly referred to as the Koopman assumption, which can be expressed as follows:
V k + 1 = R V k
V k = [ V 1 , V 2 , V 3 , , V k ]
V k + 1 = [ V 2 , V 3 , V 4 , , V k + 1 ]
where R is the Koopman matrix, considered independent of k. The general solution is approximated by
v k j = 1 M ϕ j b j λ j k ,
where ϕ j and λ j are eigenvectors and eigenvalues of R, respectively.
DMD is capable of isolating static features from dynamic behaviors; however, its formulation is inherently first order, limiting its ability to capture higher-order temporal correlations and resolve closely spaced spectral components. To address this limitation, Higher-Order Dynamic Mode Decomposition (HODMD) was developed by augmenting the snapshot matrix with multiple time shifts, thereby increasing the effective state dimension. This enhancement improves spectral resolution, enables the detection of weak and closely spaced modes, and enhances robustness to noise, making HODMD particularly well suited for the analysis of non-stationary signals and systems with multiple time scales [23].

2.2. Koopman Operator and Singular Value Decomposition (SVD)

The Koopman Operator underlies DMD and was first introduced in 1931 by Koopman [24]. Its defining characteristic is the focus on how functions of the states, called observables, evolve over discrete time:
g ( x k + 1 ) = K g ( x k ) ,
where K is the Koopman Operator. SVD is a crucial matrix decomposition technique employed in HODMD for data reduction. Given a snapshot matrix X, SVD expresses it as
X = U S V T ,
where U and V are the left and right singular vectors, respectively, and S contains the singular values.

3. Higher-Order Dynamic Mode Decomposition (HODMD)

HODMD extends DMD to cases where the spatial complexity M is smaller than the spectral complexity N. This technique merges the standard DMD with Takens’ delayed embedding theorem. Each snapshot is assumed to depend linearly on the most recent snapshot and on d 1 additional past snapshots.
We consider the following snapshot expression:
v ( t ) n = 1 N a n u n e ( δ n + i ω n ) ( t t 1 ) , t 1 t t 1 + T
where a n is the magnitude of the eigenvector u n , and e ( δ n + i ω n ) ( t t 1 ) is the eigenvalue of the matrix A.
The HODMD method, also referred to as DMD-d, is based on the high-order Koopman assumption, where the flow snapshot v k + d can be expressed as a function of the preceding “d” flow snapshots, as follows:
v k + d R 1 v k + R 2 v k + 1 + + R d v k + d 1 , for k = 1 , , K d .
where d is a tunable constant and R k represents the Koopman operators, which are linear and encapsulate the system dynamics. This formulation constitutes the core of the HODMD approach, known for delivering highly accurate results even when applied to complex datasets. When d = 1 , the high-order Koopman assumption simplifies to the standard DMD algorithm. Further methodological details can be found in [23,25].

Algorithm of HODMD

HODMD computes the frequencies, growth rates, and DMD modes in four main steps, as illustrated in Figure 1. To facilitate reproducibility and parameter tuning, Table 1 summarizes practical guidelines for selecting the key parameters.
The parameter d has the most significant impact on the accuracy of the identified modes and the quality of the reconstruction. This parameter is tuned using a trial-and-error approach. For this work, we developed an automated routine that iteratively tests several candidate values of d, performs the HODMD decomposition, and selects the value that minimizes the root mean square error between the reconstructed and original signals. This procedure ensures that the chosen d leads to an optimal trade-off between reconstruction accuracy and numerical stability.
For ε 1 and ε SVD , their effect is more related to noise rejection than to frequency accuracy. A too-loose tolerance ( ε 1 too high) may discard physically relevant modes, while a too-strict tolerance can keep spurious noise components and increase computational cost. Similarly, ε SVD controls the selection of dynamically significant modes: it should be set to remove noise like modes but retain weaker harmonics of interest. Sensitivity analyses showed that once these parameters are within reasonable ranges, their effect on frequency estimates is minor compared to d.
Step 1: First Dimension reduction
We apply to the snapshot matrix defined in Equation (4) the SVD to the matrix V K based on a tolerance ε 1 given by the user as follows:
V K = U V ˜ 1 K where V ˜ 1 K = S V T ,
where the number of retained modes N is defined as σ N + 1 / σ 1 ε SVD , where σ 1 , , σ N are the singular values and the threshold ε SVD is selected according to the level of noise in the data.
V ˜ 1 K is called the reduced snapshot matrix.
Step 2: Second Dimension reduction
In the second step, we apply the higher-order Koopman assumption defined in Equation (9) to the reduced snapshot matrix as follows:
V ˜ 2 K R ˜ 1 V ˜ 1 K d + R ˜ 2 V ˜ 2 K d + 1 + + R ˜ d V ˜ d K ,
where R ˜ i = U T R i U .
This equation can be represented using the reduced snapshot matrix and the modified Koopman matrix R ˜ as follows:
V ˜ 1 K d + 1 = R ˜ V ˜ 2 K d ,
where
V ˜ 1 K d = V ˜ 1 K d V ˜ 2 K d + 1 V ˜ d K , V ˜ 2 K d + 1 = V ˜ d + 1 K + 1 , R ˜ = 0 I 0 0 0 0 I 0 0 0 0 I R ˜ 1 R ˜ 2 R ˜ d 1 R ˜ d
A second dimensionality reduction is carried out on the matrix containing the reduced snapshots using SVD and the tolerance ε SVD = σ N + 1 / σ 1 ε SVD , where N is the number of retained SVD modes and σ i are the singular values. This truncation yields
V ˜ 1 K d + 1 U ˜ S ˜ V ˜ 1 T , with V ˜ 1 K d + 1 = S ˜ V ˜ T .
This step is completed through pre-multiplying Equation (12) by U ˜ T , and invoking Equation (13), it gives
V ˜ 2 K d + 1 = R ˜ * V ˜ 1 K d ,
such that R ˜ * R N × N is the new Koopman matrix defined as R ˜ * = U ˜ T R ˜ U ˜ .
Step 3: computing the DMD modes, frequencies, and growth rates.
This is performed by applying SVD on the matrix V ˜ 1 K d :
V ˜ 1 K d = U A V T .
Then, we substitute Equation (16) in Equation (14) and multiply the result by V A 1 U T to obtain
R ˜ * = V ˜ 2 V A 1 U T ,
Once the matrix R ˜ * has been calculated, the reduced DMD expansion for the reduced snapshots Equation (10) can be computed as follows:
v ˜ k = m = 1 M a ^ m u ˜ m e ( δ m + i ω m ) t k , for k = 1 , , K .
The reduced DMD modes u ˜ m were calculated by keeping the first M elements of the vector q ^ m = U ˜ q m , where q m represents the eigenvectors of R ˜ and the associated eigenvalues μ m provides the frequencies ω m and growth rates δ m by the following expression:
δ m + i ω m = log ( μ m ) / Δ t .
The identification of the dominant modes in HODMD relies on two complementary mechanisms:
  • SVD-Based Truncation: During the first step of HODMD, singular value decomposition (SVD) is applied to the snapshot matrix. This step retains only the most energetic modes, effectively filtering out low-energy noise components.
  • Reconstruction Error Check: After mode selection, the reconstructed signal is compared to the original data, and the root mean square error (RMSE) is computed. A high RMSE indicates that a relevant mode may have been discarded or misclassified. In such cases, the parameter d or the tolerance ε SVD is adjusted until the reconstruction error is minimized, ensuring recovery of the missing dominant mode.

4. Results

4.1. Performance Evaluation on Synthetic Signal

4.1.1. Case Study 1: Stationary Signal

In this case study, the performance of HODMD, SST-STFT, and ConceFT-STFT was evaluated on a synthetic stationary signal. We consider a multi modal voltage signal with a DC offset and interharmonic components, expressed as
V ( t ) = 0.5 + 0.1 sin 2 π t · 30 + π 2 + sin 2 π t · 60 π 3 + 0.05 sin 2 π t · 90 + 0.22 + 0.05 sin 2 π t · 120 + π 4 + 0.01 sin 2 π t · 180 + π + 0.01 sin 2 π t · 240 0.52
The complex analytic form of this signal can be written as
V ˜ ( t ) = 0.5 + 0.1 e j 2 π · 30 t + π 2 + 1.0 e j 2 π · 60 t π 3 + 0.05 e j 2 π · 90 t + 0.22
+ 0.05 e j 2 π · 120 t + π 4 + 0.01 e j 2 π · 180 t + π + 0.01 e j 2 π · 240 t 0.52
V ( t ) = V ˜ ( t )
The identified frequency components and their corresponding amplitudes using the three methods are presented in Table 2.
The percentage error between the predicted and the actual values is computed as follows:
error ( % ) = y y ref y ref × 100
This metric quantifies the relative deviation of the identified value y from the reference value y ref in percentage form.
The normalized root mean square error (RMSE%) can be expressed as
RMSE ( % ) = 1 N i = 1 N y i y ref , i 2 y ref norm × 100
where y ref norm is a chosen normalization value, typically the maximum value, RMS value, or mean of the reference signal y ref . This normalization allows expressing the RMSE as a percentage of the signal magnitude.
From Table 2, it can be observed that for the measured signal, HODMD provides the highest accuracy in estimating frequencies, amplitudes, and phases. ConceFT-STFT provides better frequency resolution than SST-STFT but less reliable amplitude and phase information. This can be a supplemental diagnostic tool for spectrum characterization. Overall, considering the phase results in particular, HODMD clearly outperforms the other methods.
The reconstruction error of HODMD, quantified using the root mean square error, is RMSE = 2.71 × 10 13 , indicating an almost perfect match between the reconstructed and original signals. It is important to note that RMSE cannot be computed for the SST-STFT and ConceFT-STFT, as these techniques do not reconstruct the time-domain signal directly but instead provide an energy distribution in the time–frequency plane.

4.1.2. Case Study 2: Hauer’s Signal

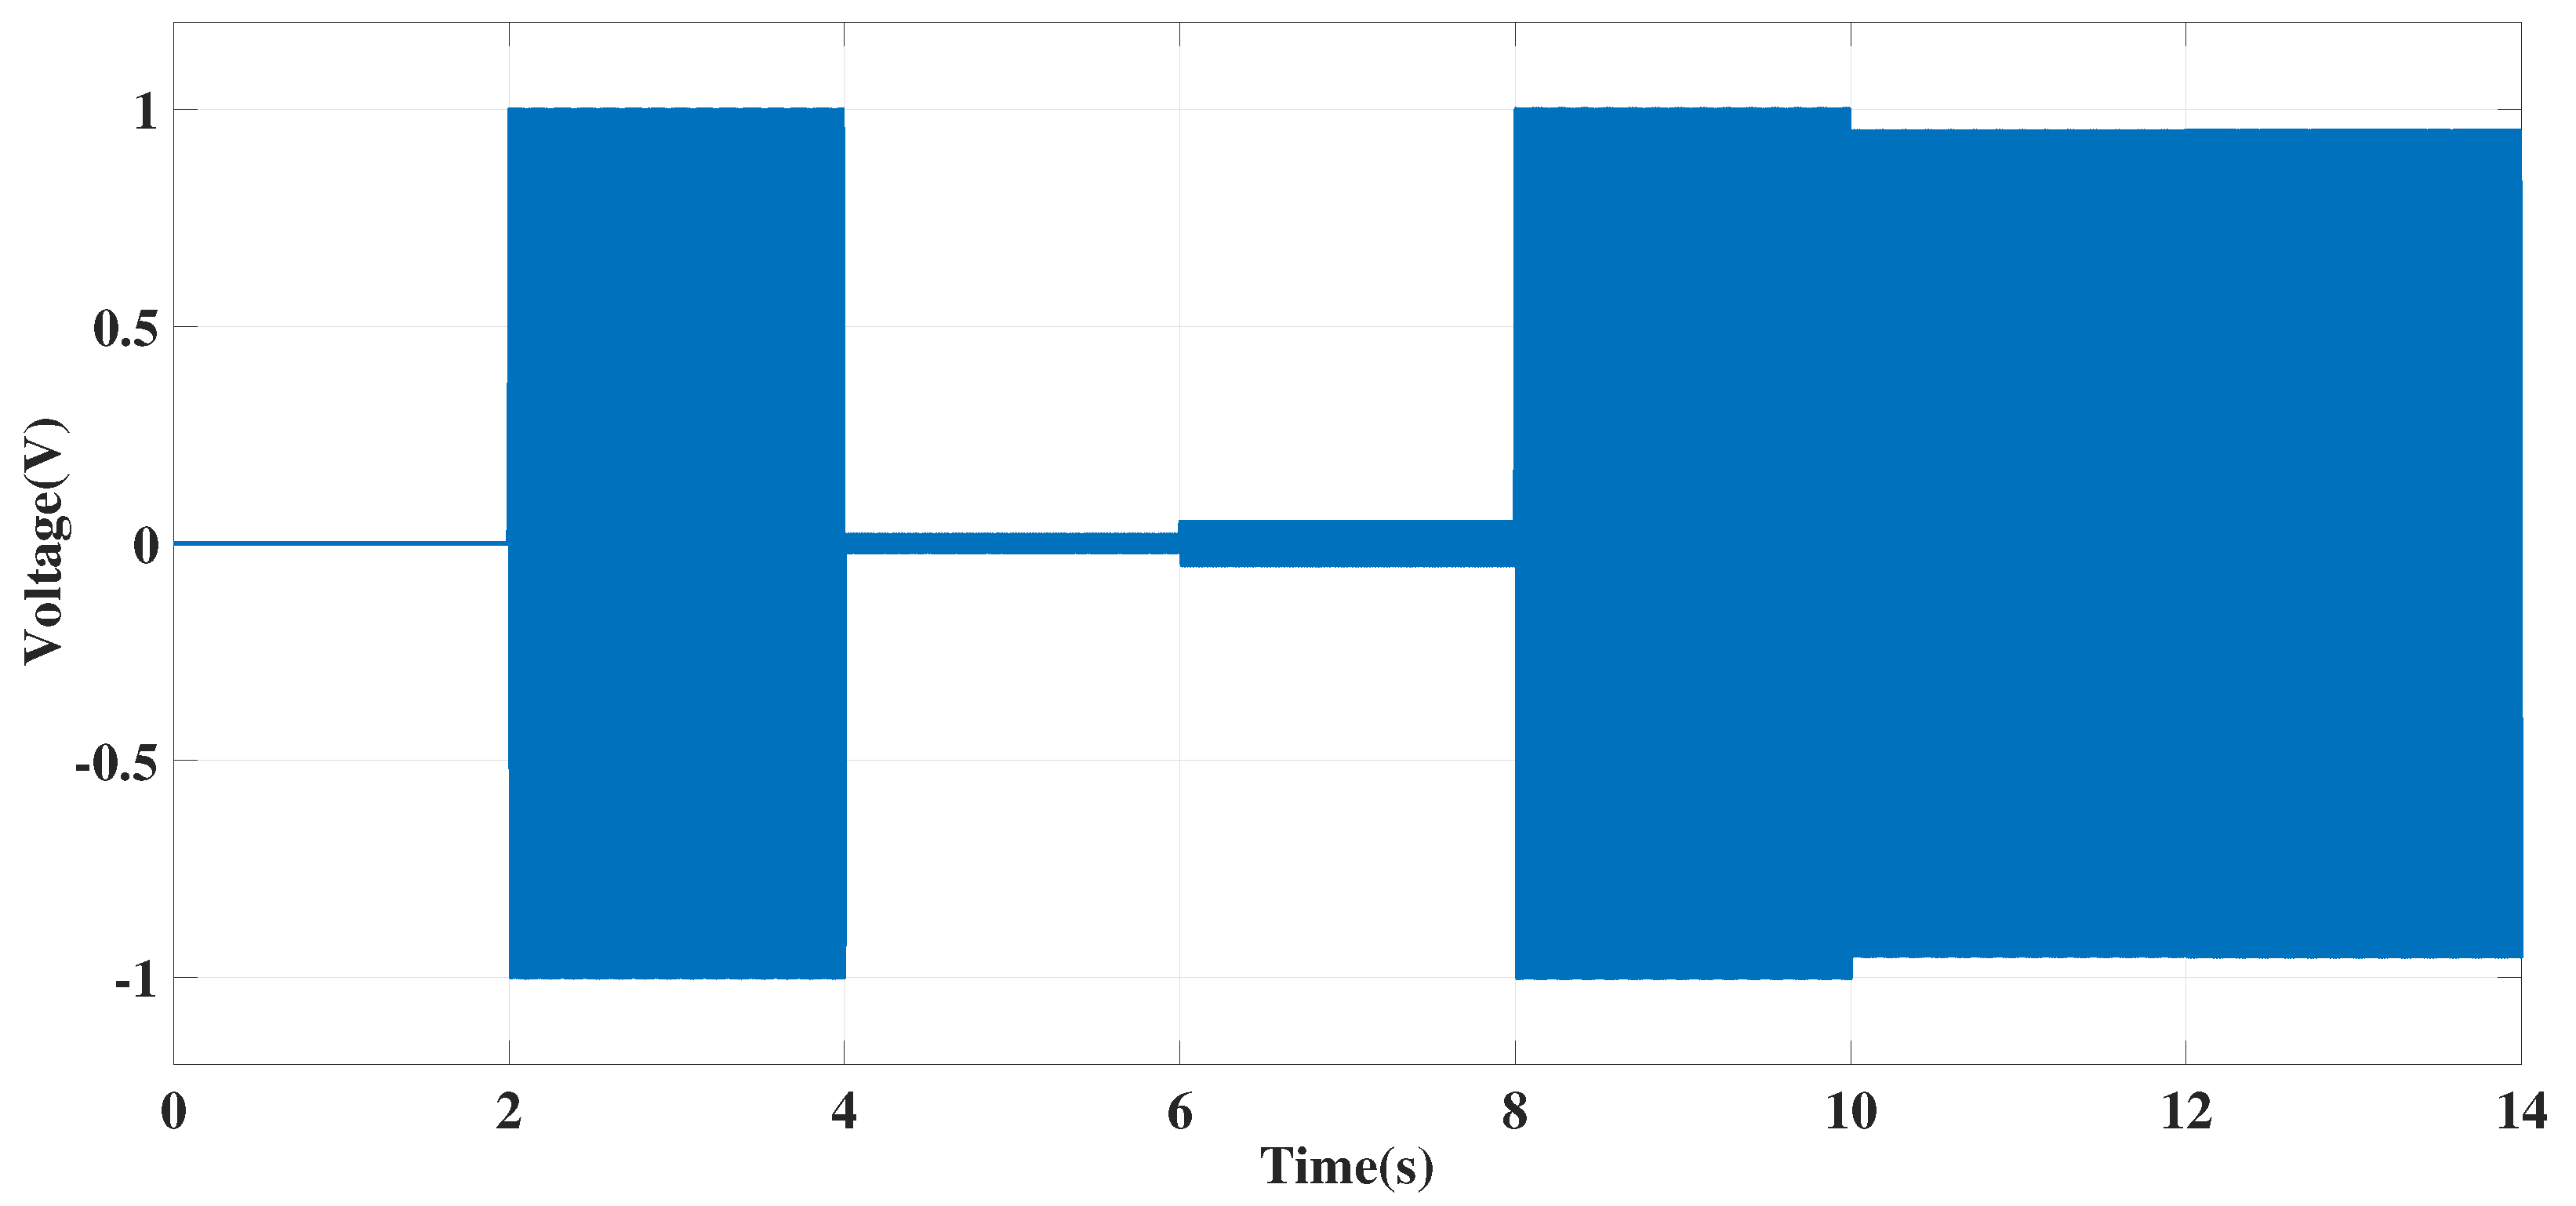
In this case study, HODMD is applied to the well-known Hauer signal, shown in Figure 2, which serves as a benchmark test case for non-stationary and multi-harmonic time-series analysis in power systems. The Hauer signal consists of three primary sinusoidal components: the fundamental (H1) at 58.92   Hz and two off-nominal harmonics, H2 and H3, with nominal frequencies of 117.84   Hz and 176.76   Hz , respectively. The magnitudes of H2 and H3 are set to 2 % and 5 % of the fundamental amplitude, respectively. The signal is segmented into seven intervals of 2   s each, with each interval exhibiting a distinct harmonic composition, as described in [26]. This design introduces abrupt spectral transitions, making the Hauer signal an ideal candidate for evaluating advanced time–frequency analysis techniques.
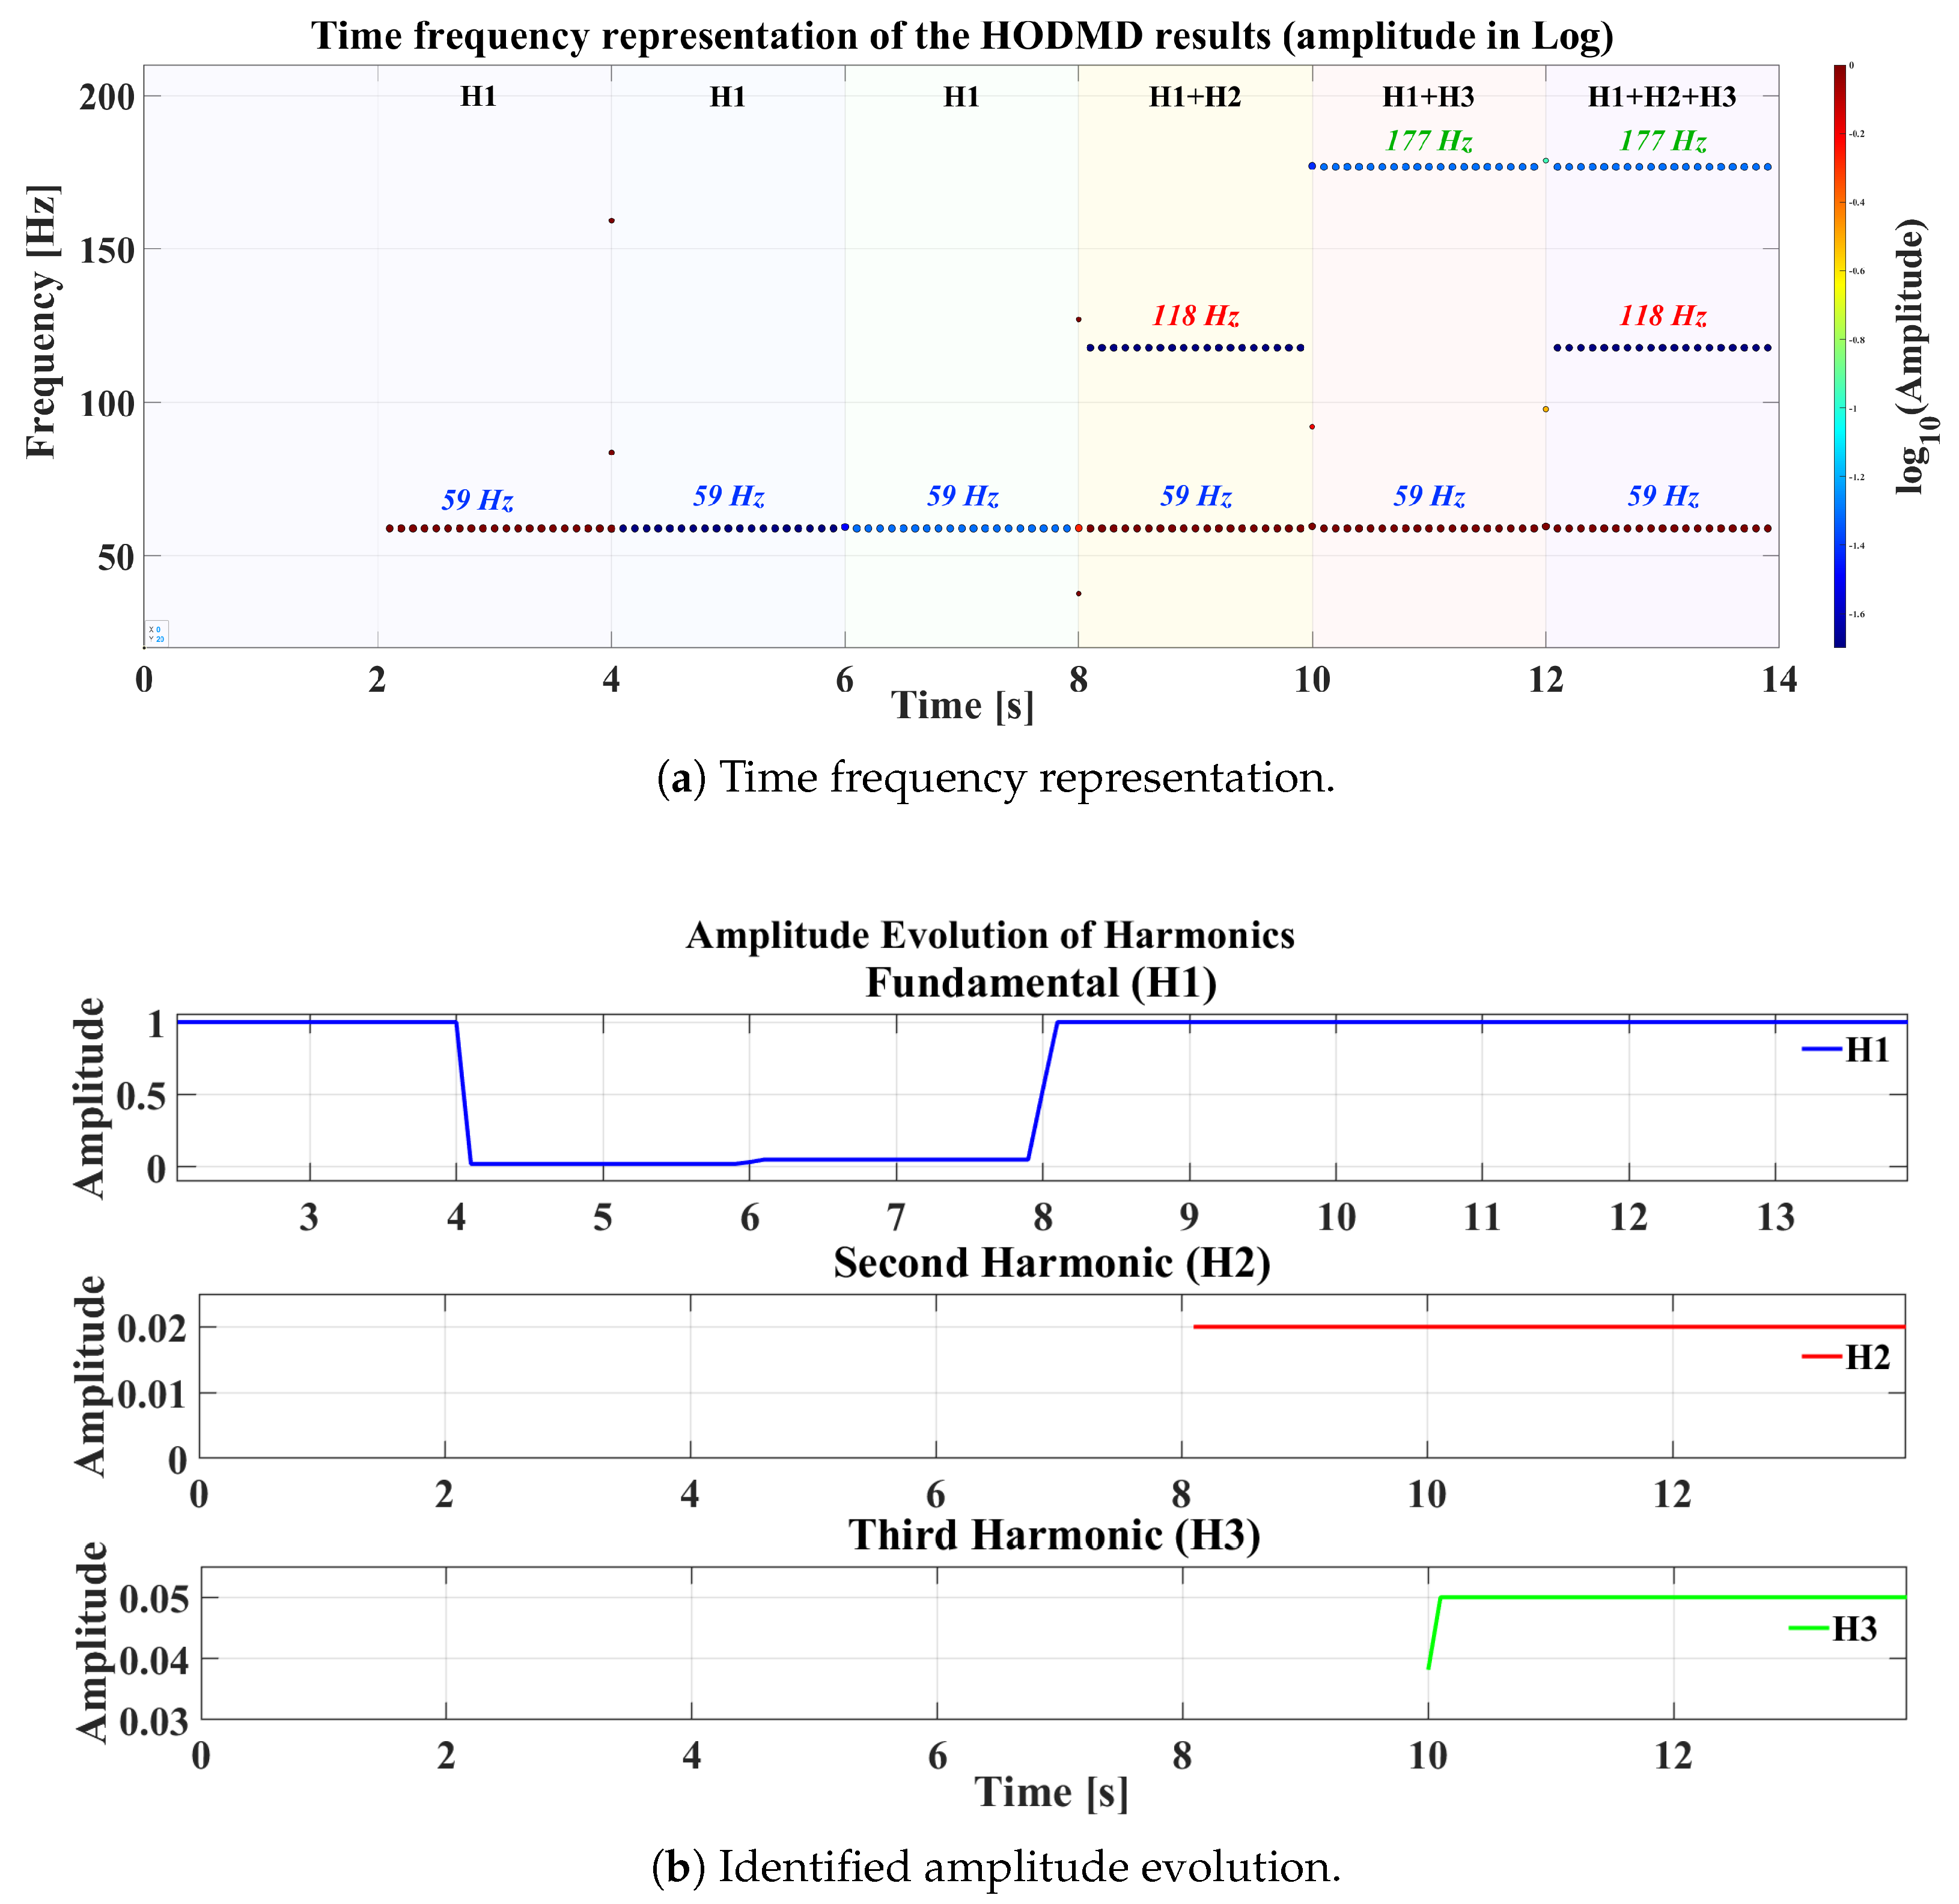
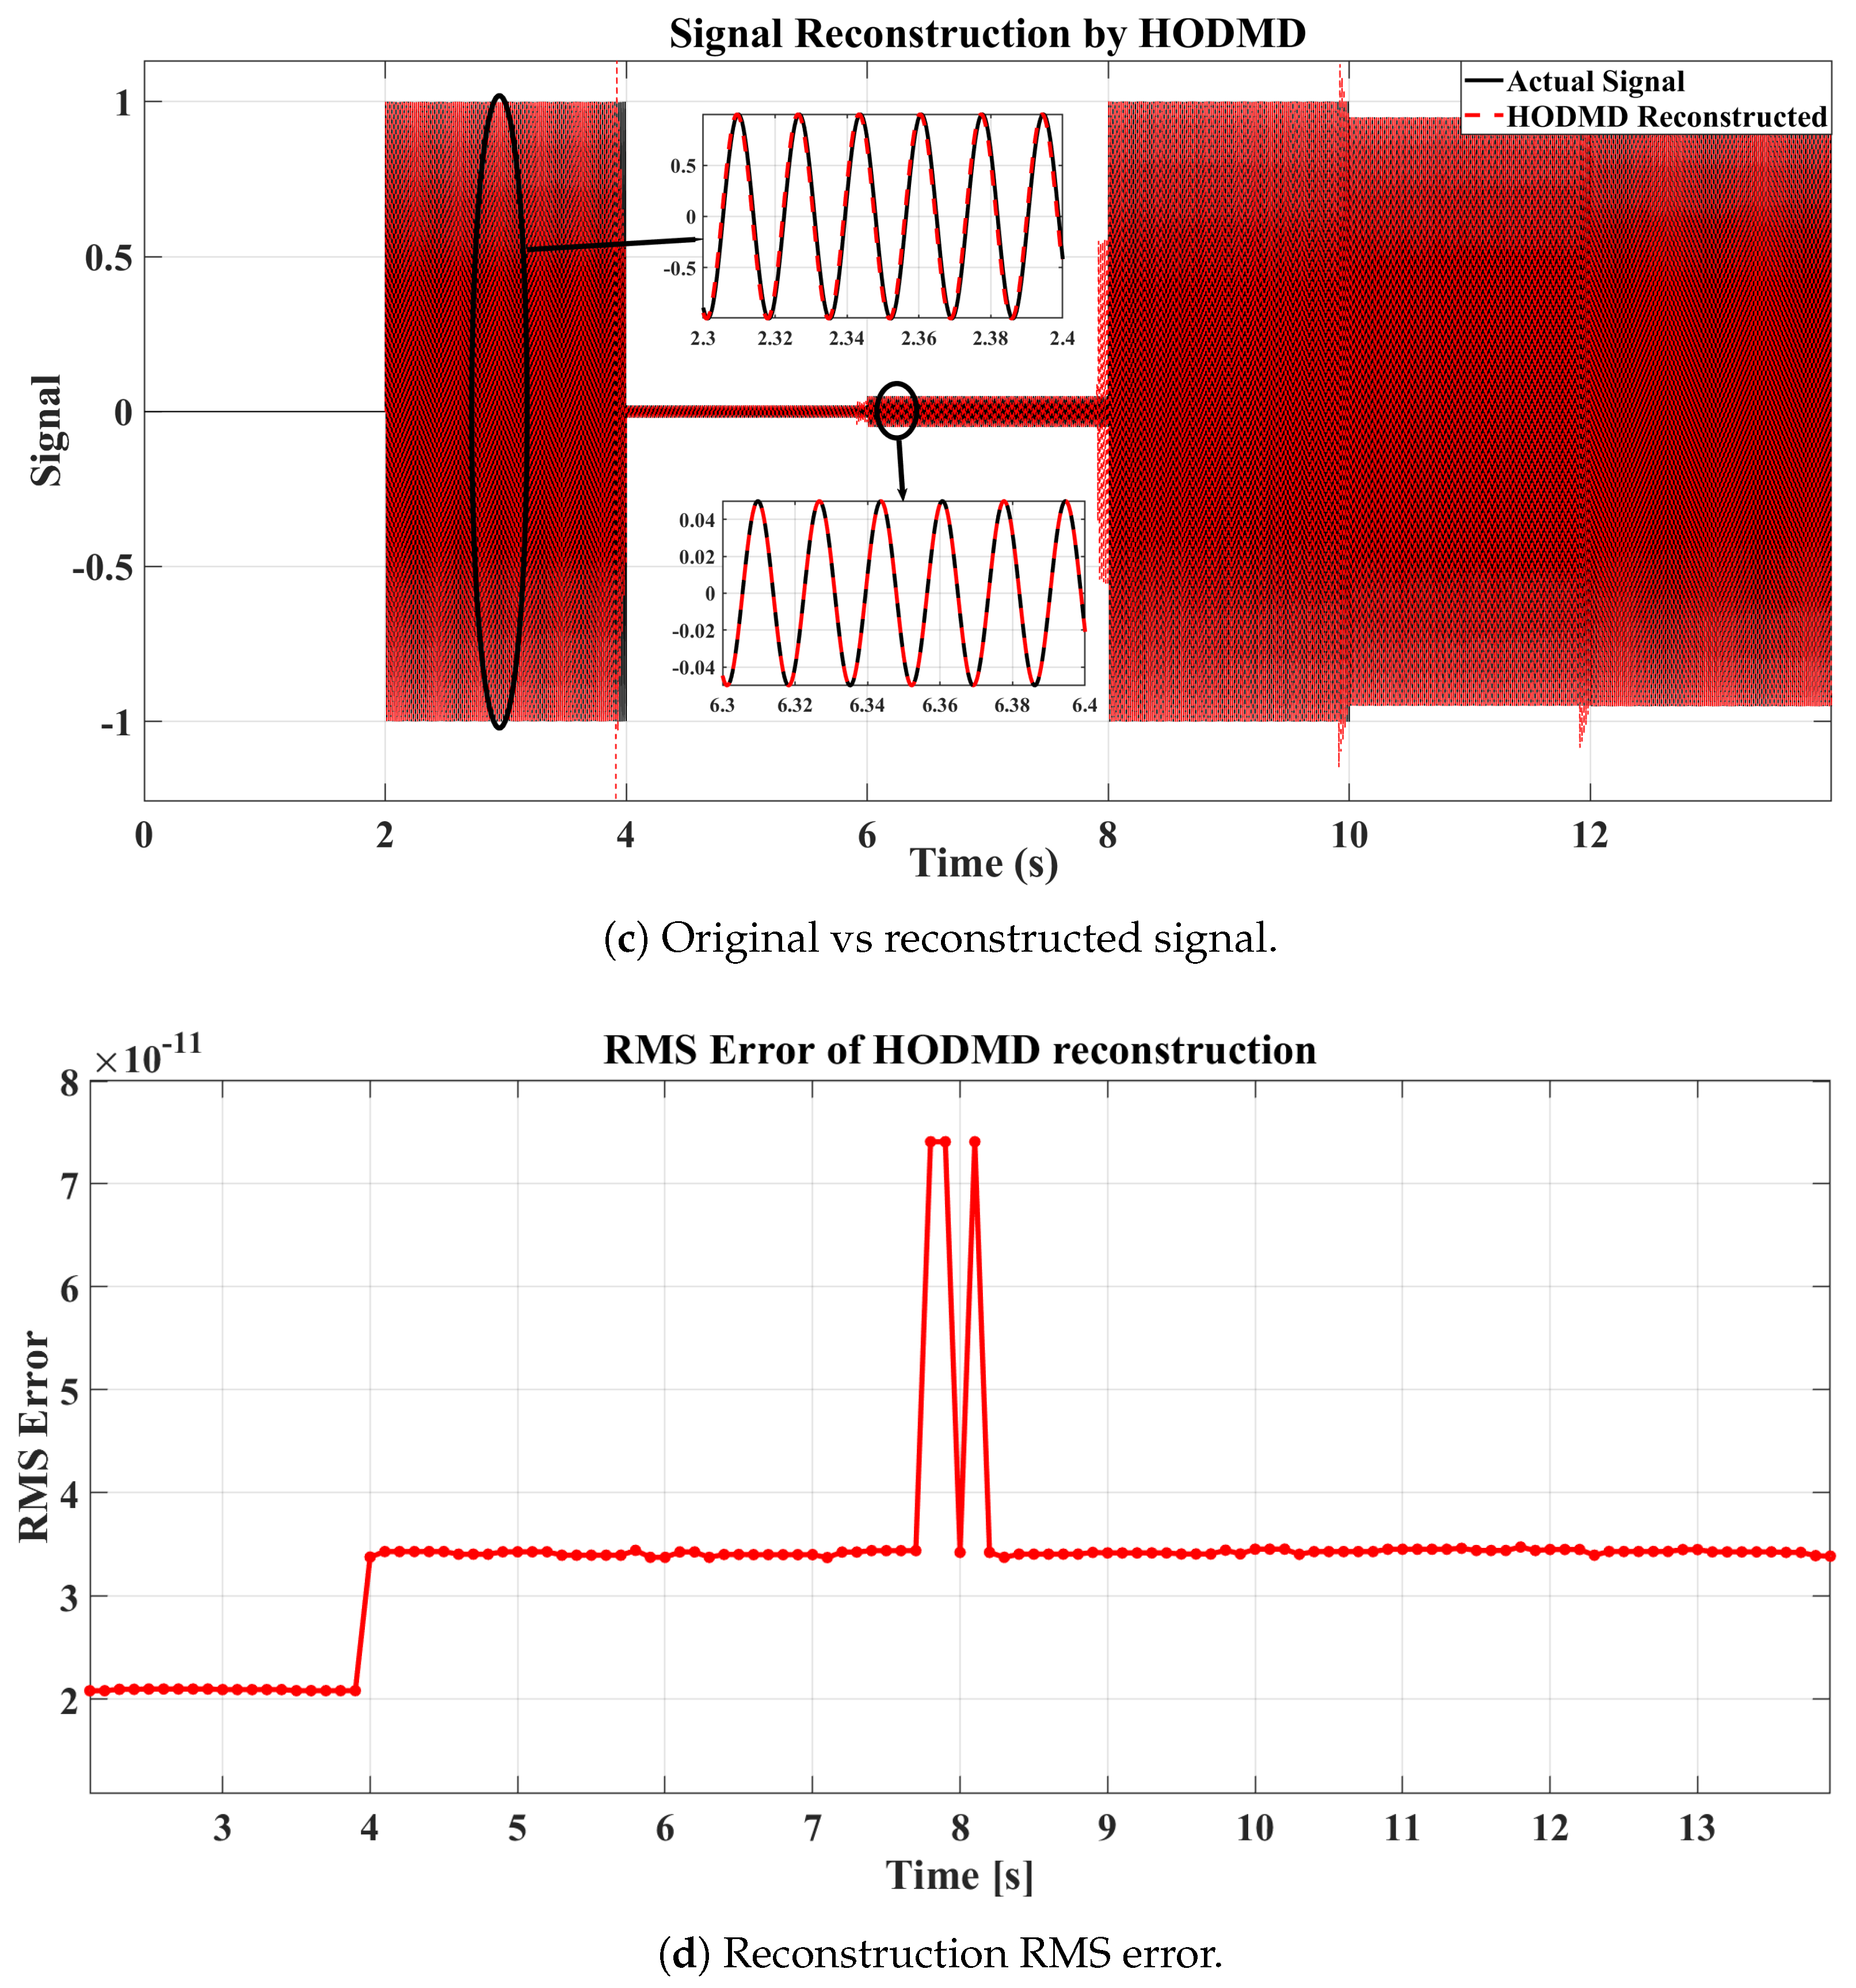
The HODMD results (see Figure 3) demonstrate precise tracking of the fundamental and harmonic components across the various time intervals. For each analysis window, the frequency, amplitude, and phase evolution of H1, H2, and H3 are individually extracted and analyzed. During intervals where only the fundamental is present (0–8 s), the algorithm consistently identifies a dominant mode at 58.92   Hz with a stable amplitude close to unity. In subsequent intervals, the appearance or disappearance of harmonics (H2 or H3) is correctly detected, and the corresponding frequency and amplitude estimates closely match the expected theoretical values.
Notably, the phase analysis of each harmonic reveals a quasi-sinusoidal evolution corresponding to the initialization and phase transitions described in the initial test case. The ability of HODMD to clearly separate and track the dynamics of each harmonic, in both the amplitude and phase, even in the presence of abrupt spectral changes, highlights its robustness and effectiveness relative to conventional time frequency analysis techniques.
Overall, the results obtained from the Hauer signal confirm the capability of HODMD to resolve complex time-varying spectral structures with high precision. Leveraging Hauer’s signal, which is widely recommended for benchmarking phasor harmonic estimation under adverse conditions that typically challenge Fourier-based approaches, the proposed algorithm demonstrates strong competitiveness with the benchmark method presented in [26]. Importantly, HODMD offers advantages in terms of implementation simplicity and interpretability, making it a compelling alternative for robust harmonic analysis.

4.1.3. Case Study 3: Non-Stationary Signal

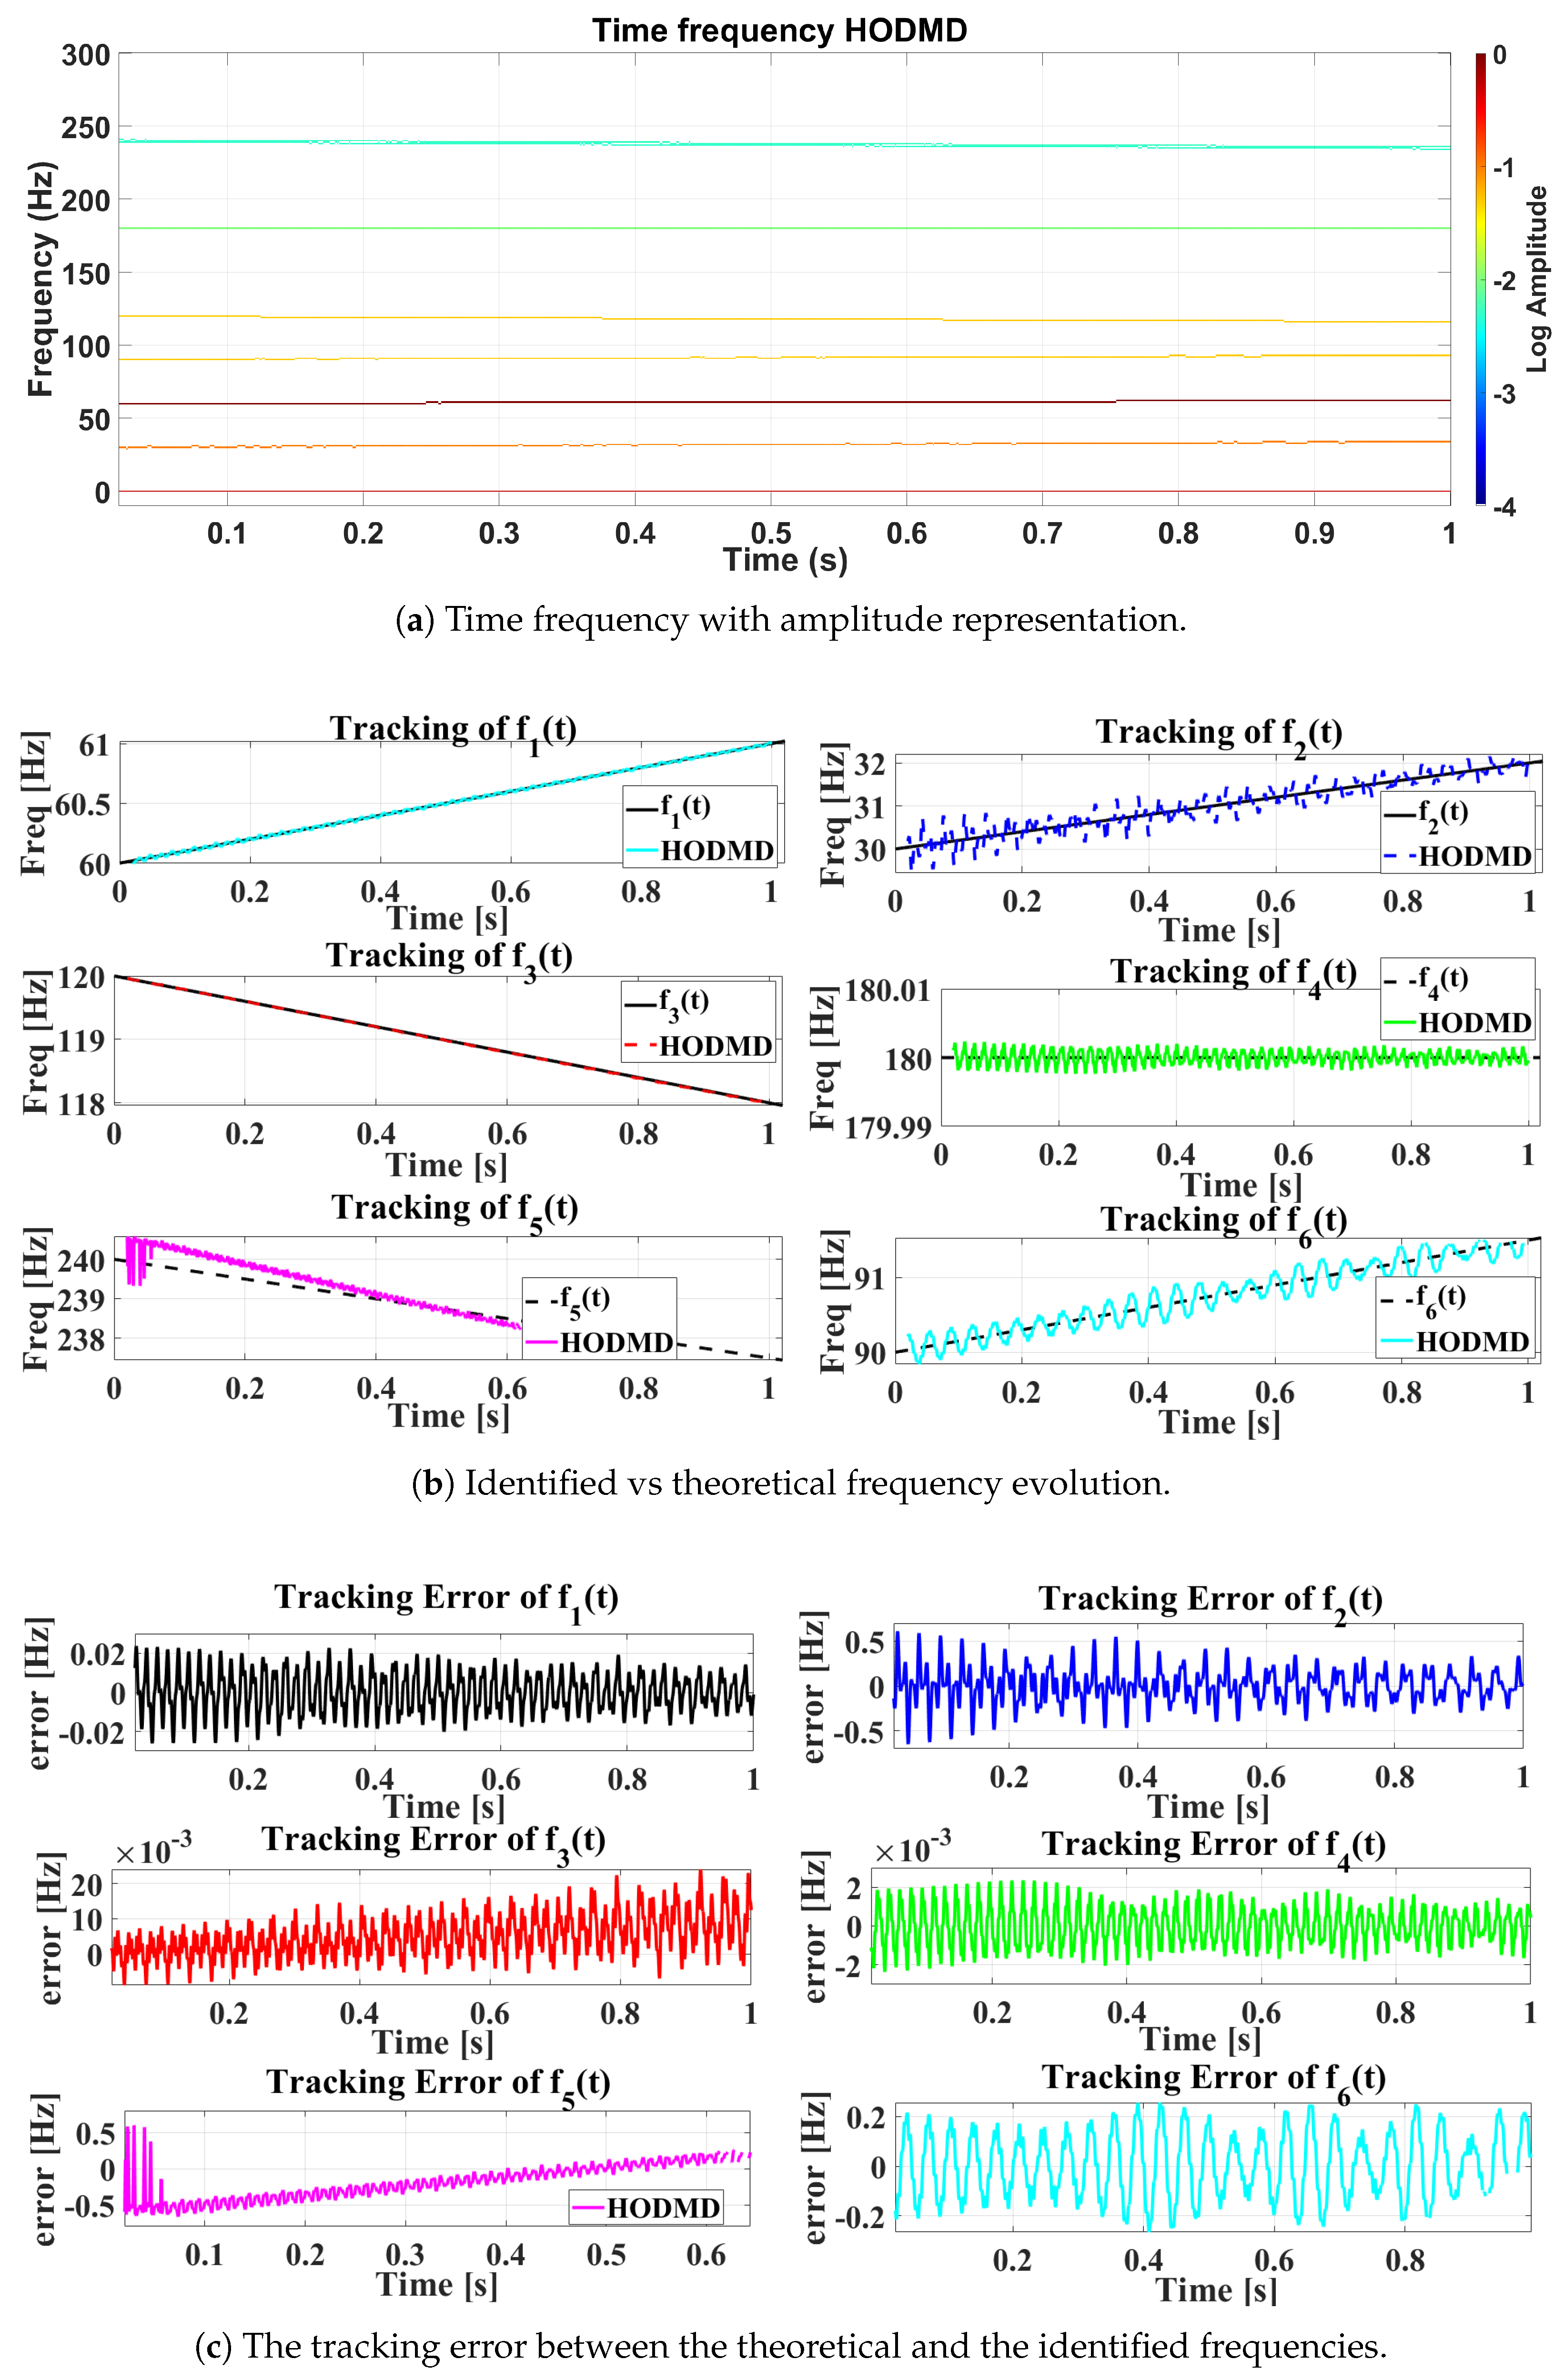
In this case study, we modulated a non-stationary synthetic signal containing the same components as in Case Study 1. However, in this scenario, the frequency components vary with time, as summarized in Table 3. The simulation was run for 1   s with a sampling frequency of 1024   Hz .
The results of the HODMD analysis are presented in Figure 4 and Figure 5.
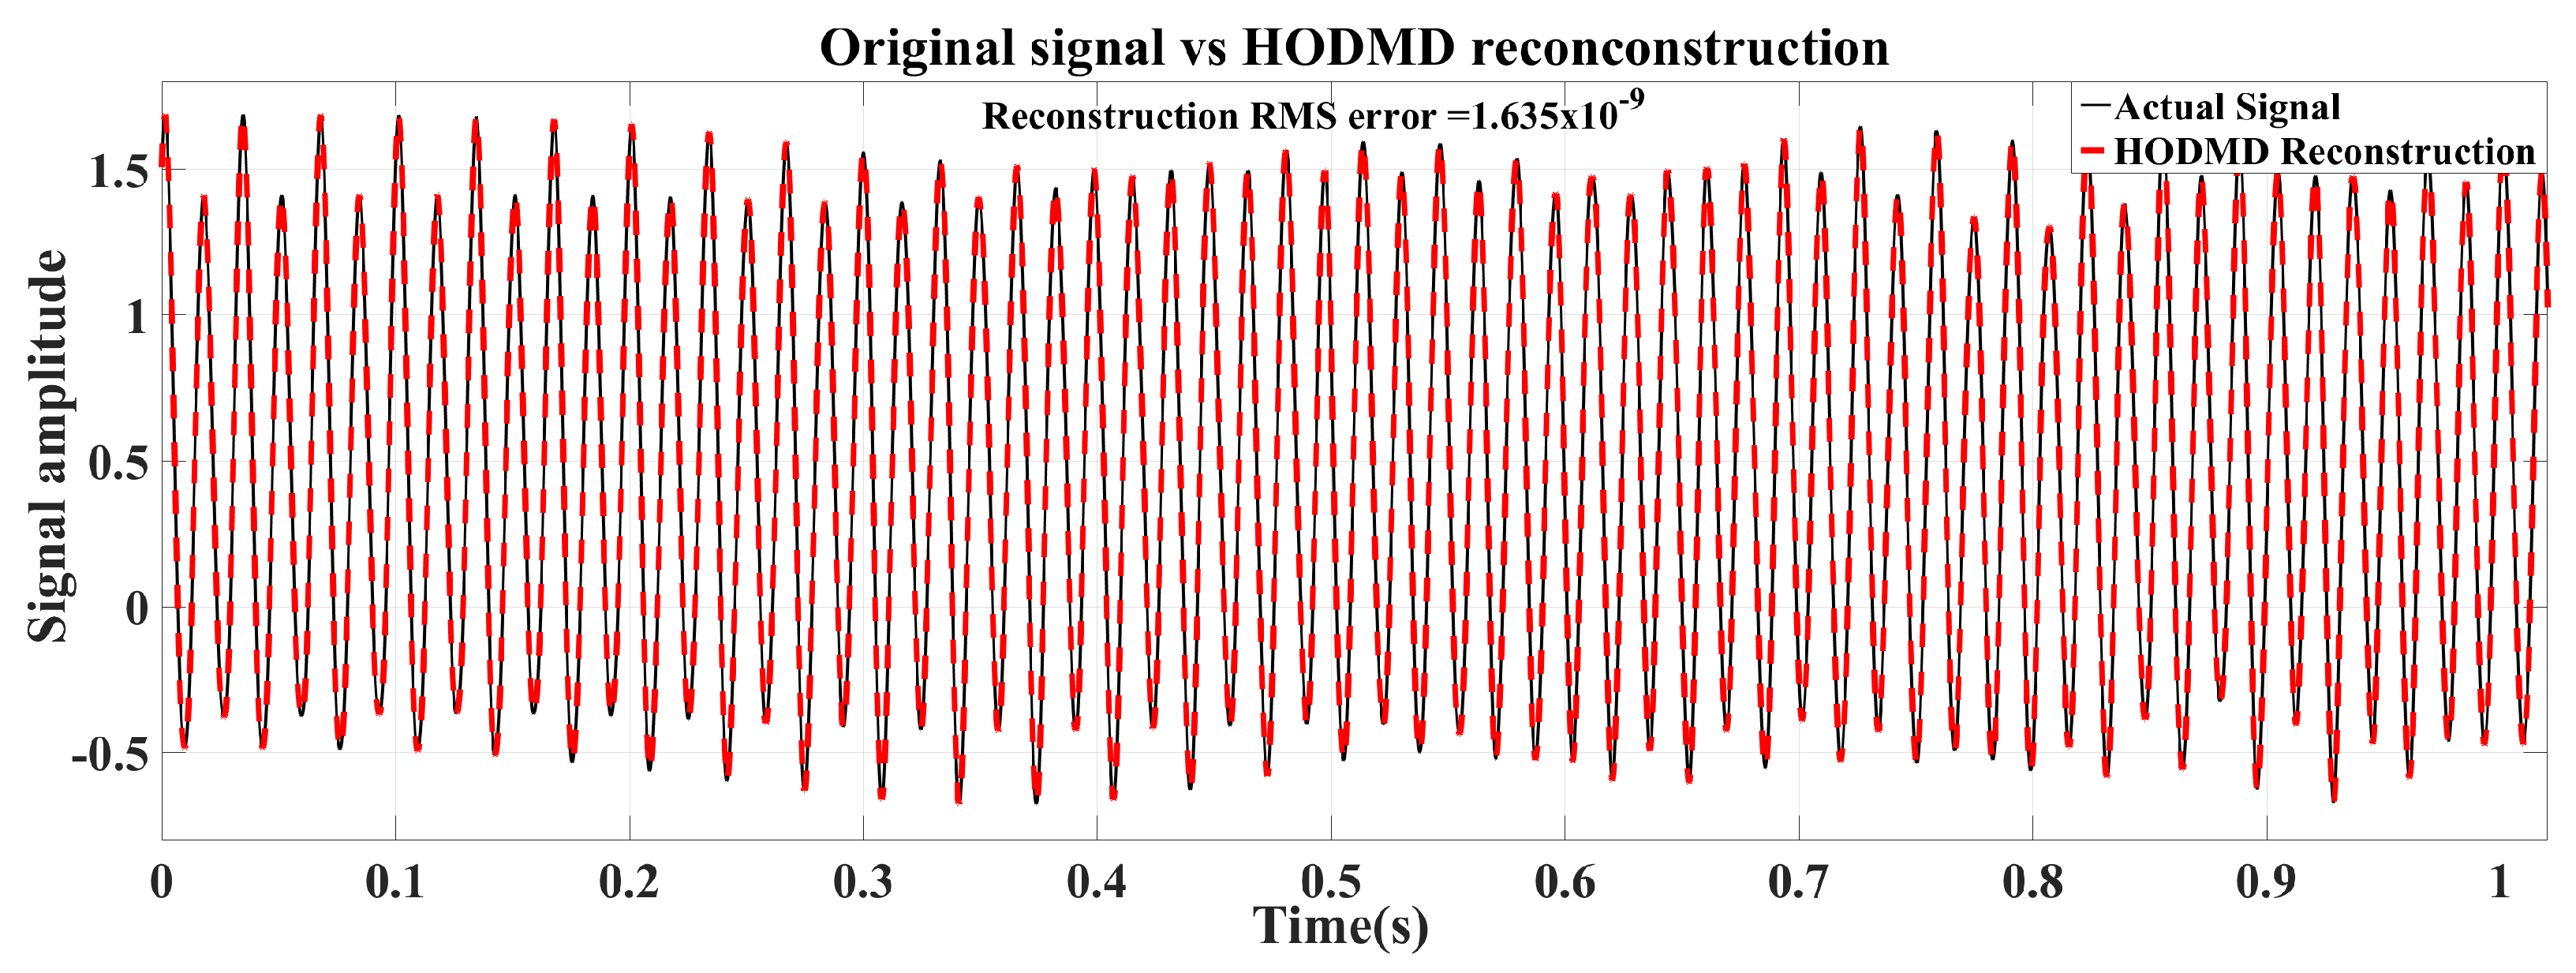
The reconstructed signal in Figure 4 closely matches the original waveform, confirming the accuracy of the amplitude and phase extraction used in the synthesis. This non-stationary test case is challenging because it contains six distinct frequency components, spanning subsynchronous, fundamental, hypersynchronous, and harmonic ranges, that vary simultaneously, with a rate of change of frequency (RoCoF) between 1   Hz and 2.5   Hz . Despite these dynamic conditions and the presence of a 50 % DC component, the HODMD spectrum analyzer accurately tracks all evolving phasors f 1 through f 6 .
Table 4 shows that HODMD consistently delivers the lowest RMSE, confirming its superior capability to accurately track frequency trajectories even under significant ROCOF conditions (±2–2.5 Hz/s). In comparison, SST-STFT partially mitigates the bias from time–frequency resolution limits and ranks second in accuracy. ConceFT-SST, although robust to noise thanks to multi-taper averaging, produces broader spectral peaks that increase frequency bias, leading to the largest RMSE values.
Figure 6a,b illustrate the time frequency representations obtained using the ConceFT-STFT and SST-STFT methods.
The ConceFT-STFT result (Figure 6a) exhibits sharp frequency localization and effectively highlights the dominant components with a smooth spectral energy distribution. However, a closer inspection shows that some interference patterns remain, particularly near the signal onset. These residual smears can hinder the isolation of weaker components in the presence of strong harmonics.
In contrast, the SST-STFT map (Figure 6b) provides a sparser representation, as expected from synchrosqueezing techniques. This enhances the visual clarity of the main components but also introduces high-frequency noise and vertical artifacts, particularly near the onset of the signal. These distortions, along with the method’s sensitivity to parameter selection, may explain the inconsistencies in spectral concentration.
The time–frequency map generated by HODMD (Figure 5) exhibits the most concentrated and well-structured representation among the three approaches. Each harmonic is sharply resolved as a distinct horizontal line with minimal spectral leakage, and the logarithmic amplitude scale confirms a consistent energy distribution across all six components, including those of lower amplitude.
Overall, SST-STFT improves sensitivity to time-varying signal components and offers clearer localization than standard STFT. However, for stationary or slowly varying signals, HODMD achieves superior accuracy in estimating frequencies, amplitudes, and phases, while avoiding the noise sensitivity and parameter dependence observed with SST-STFT.

4.2. Performance Evaluation on Laboratory-Scale Experimental Setup

4.2.1. Case Study 4: Measured Signal from a Battery Energy Storage System

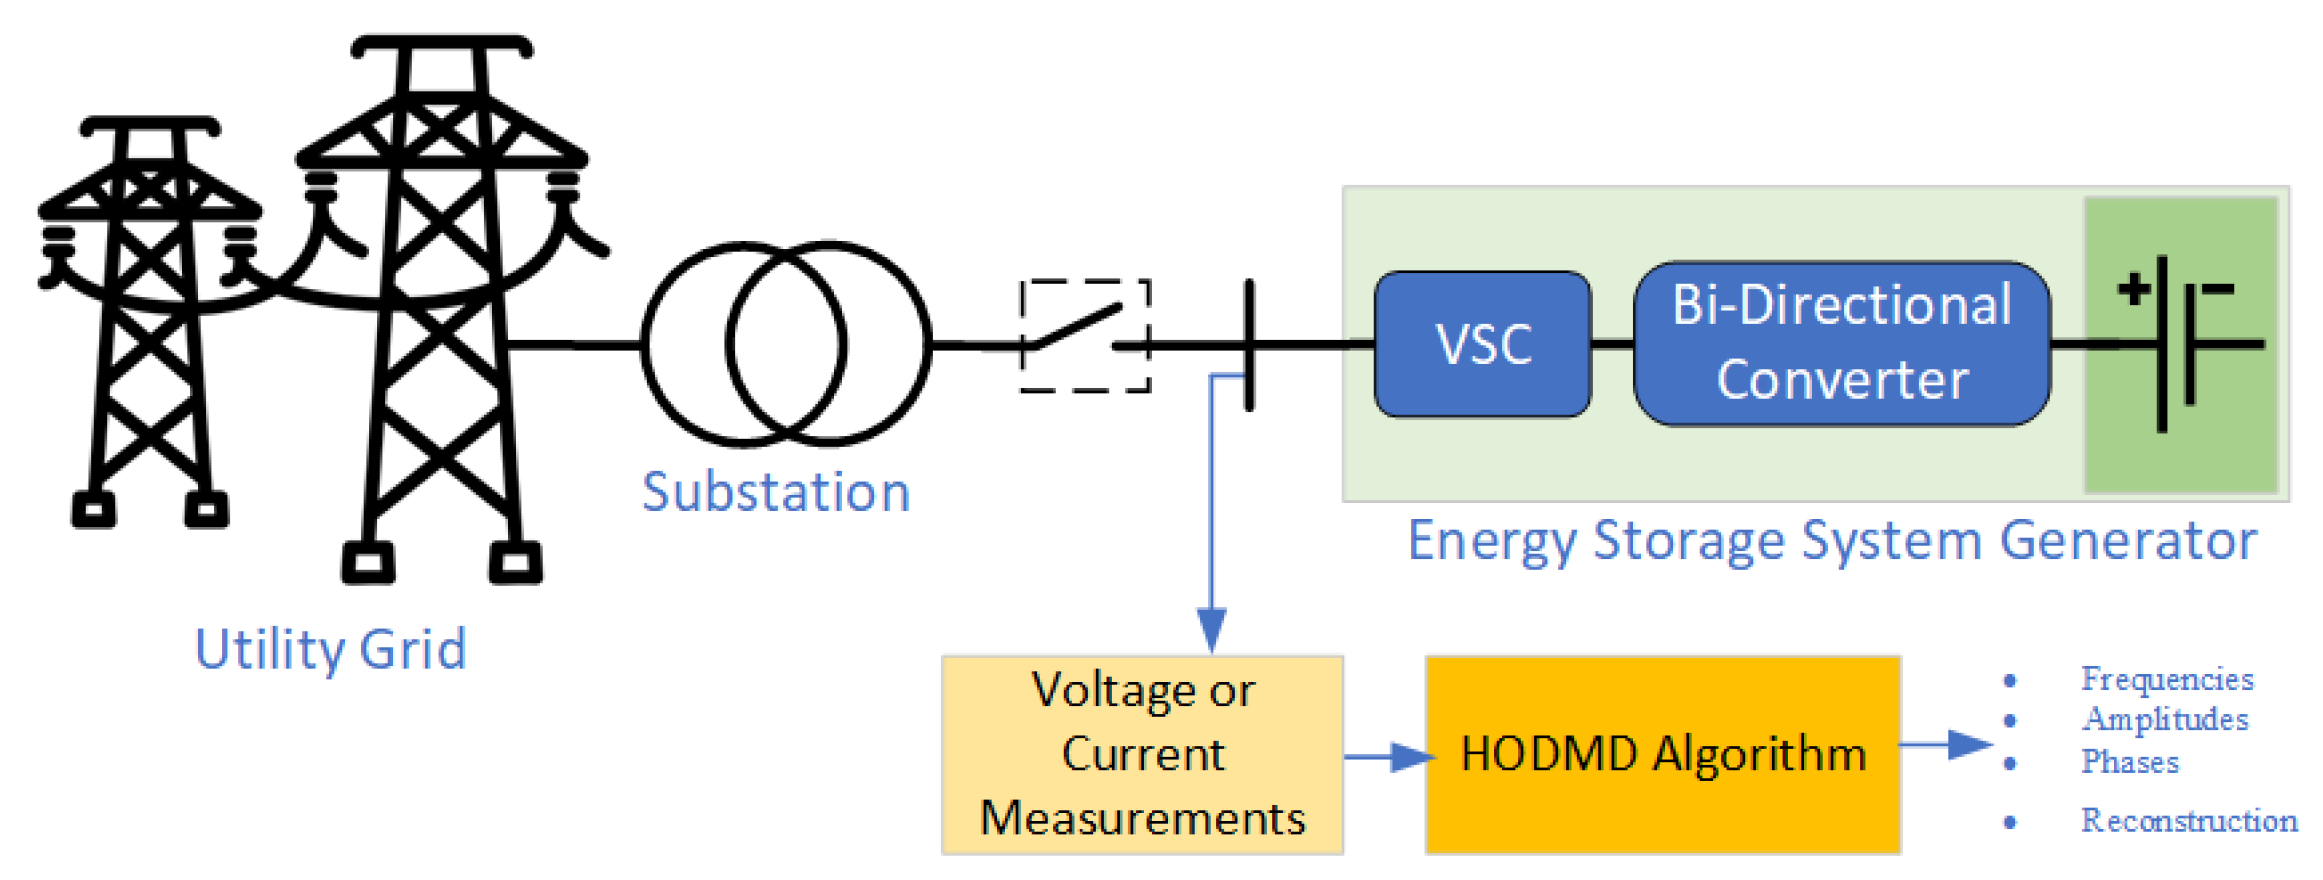
In this case study, we evaluated the performance of HODMD, SST-STFT, and ConceFT-STFT on a current-measured signal obtained from a simulated battery system connected to a voltage source converter (VSC). The VSC converts the DC output of the bi-directional converter to AC, and the battery system output is connected to the grid through a substation. Voltage and current measurements at the point of common coupling (PCC) are monitored and provided to the proposed algorithm for harmonic identification. A schematic of the proposed system is shown in Figure 7.
Simulation Validation
The system was modeled in MATLAB with a detailed representation of the static converters, using a simulation time step of 10 μ s at a fundamental frequency of 60   Hz . The sampling frequency was 25   kHz , with switching frequencies of 5   kHz for the DC–DC converter and 2.7   kHz for the DC–AC converter.
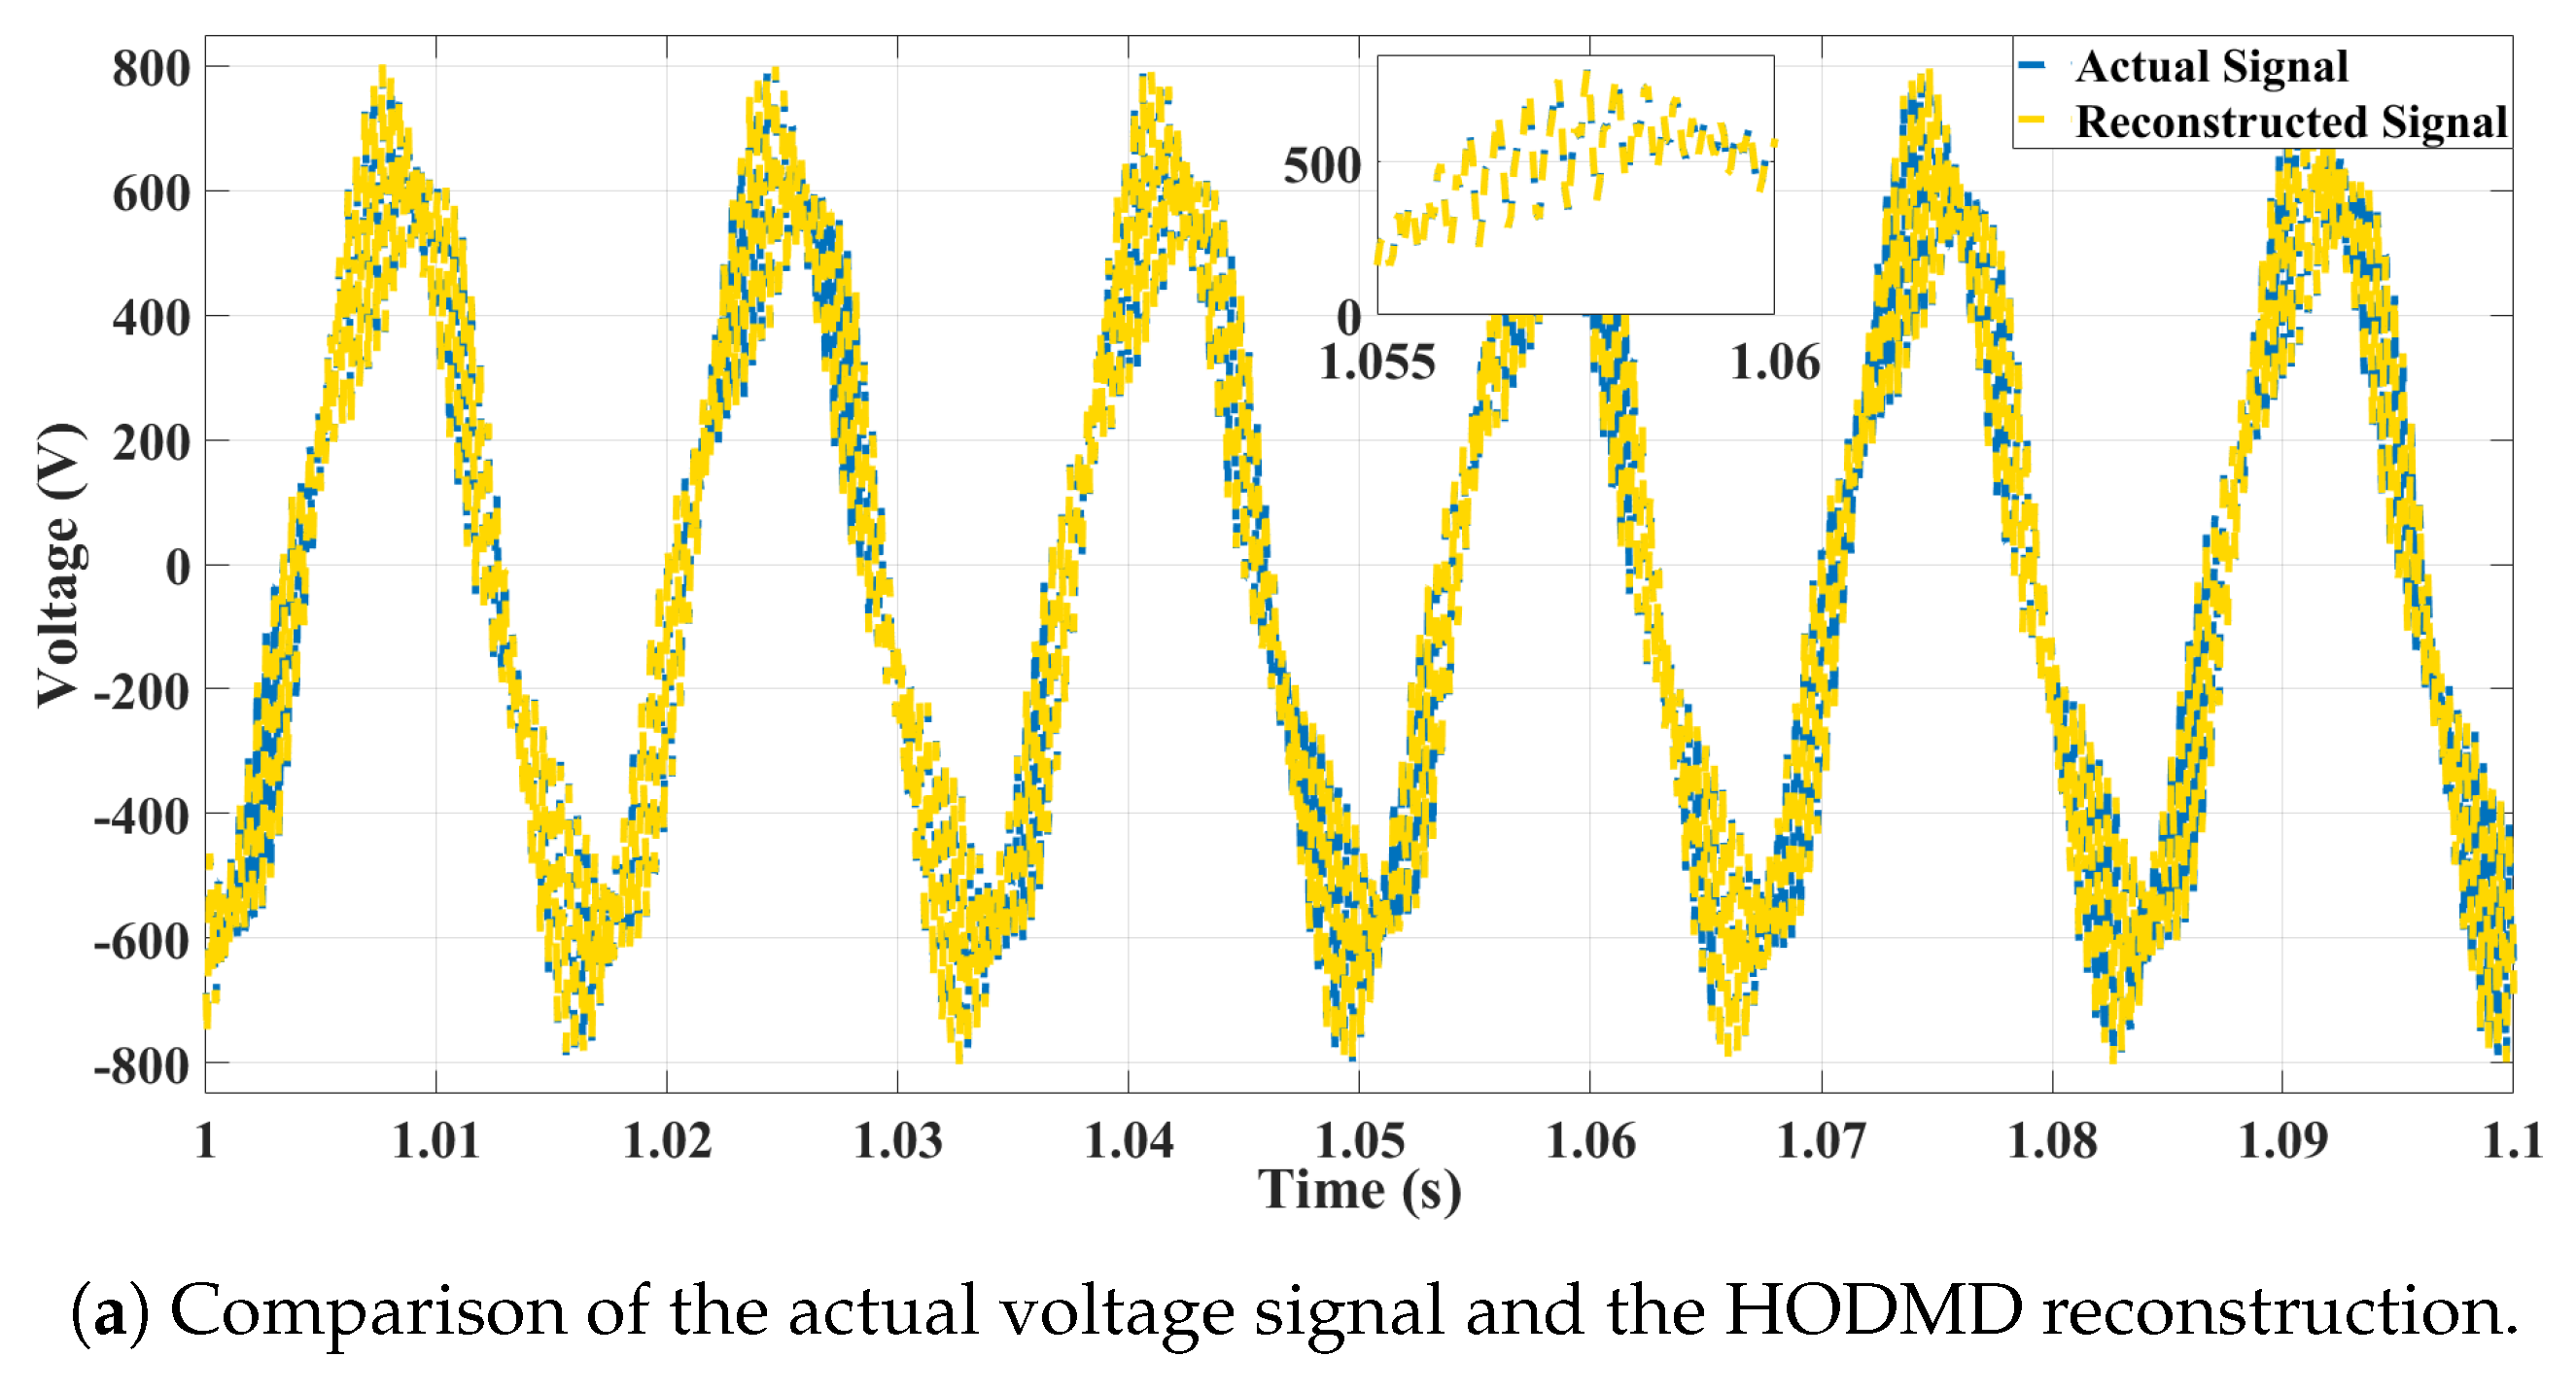
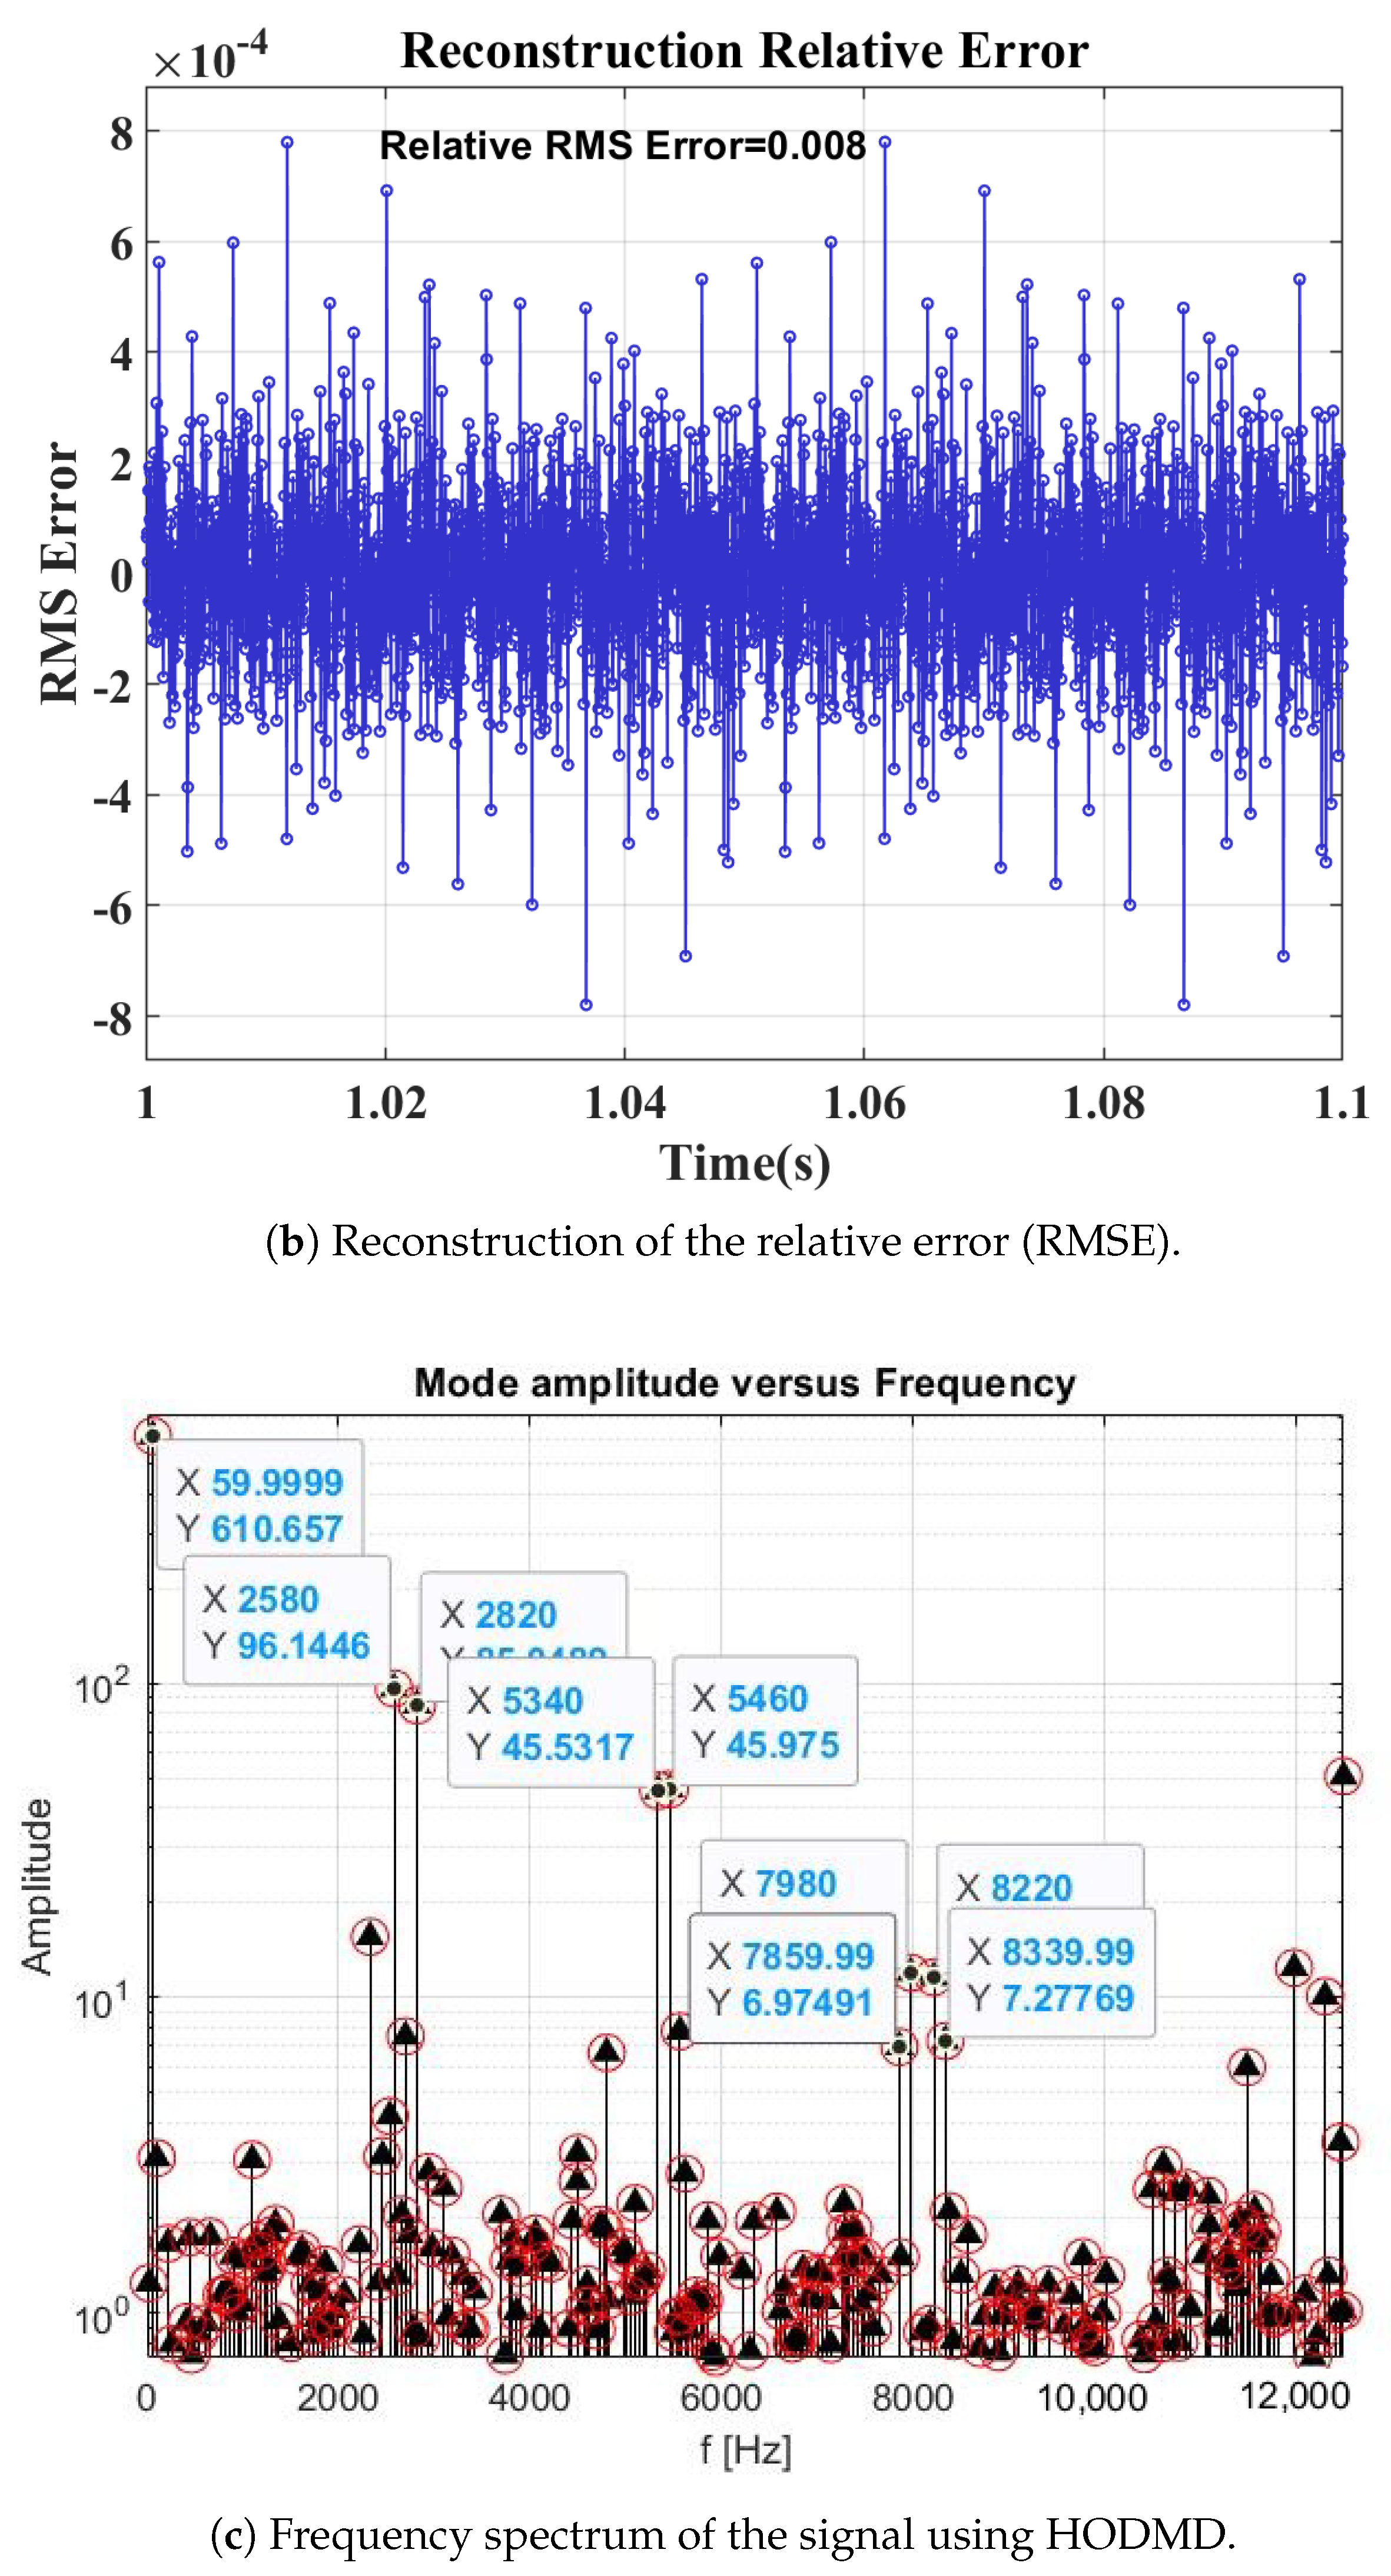
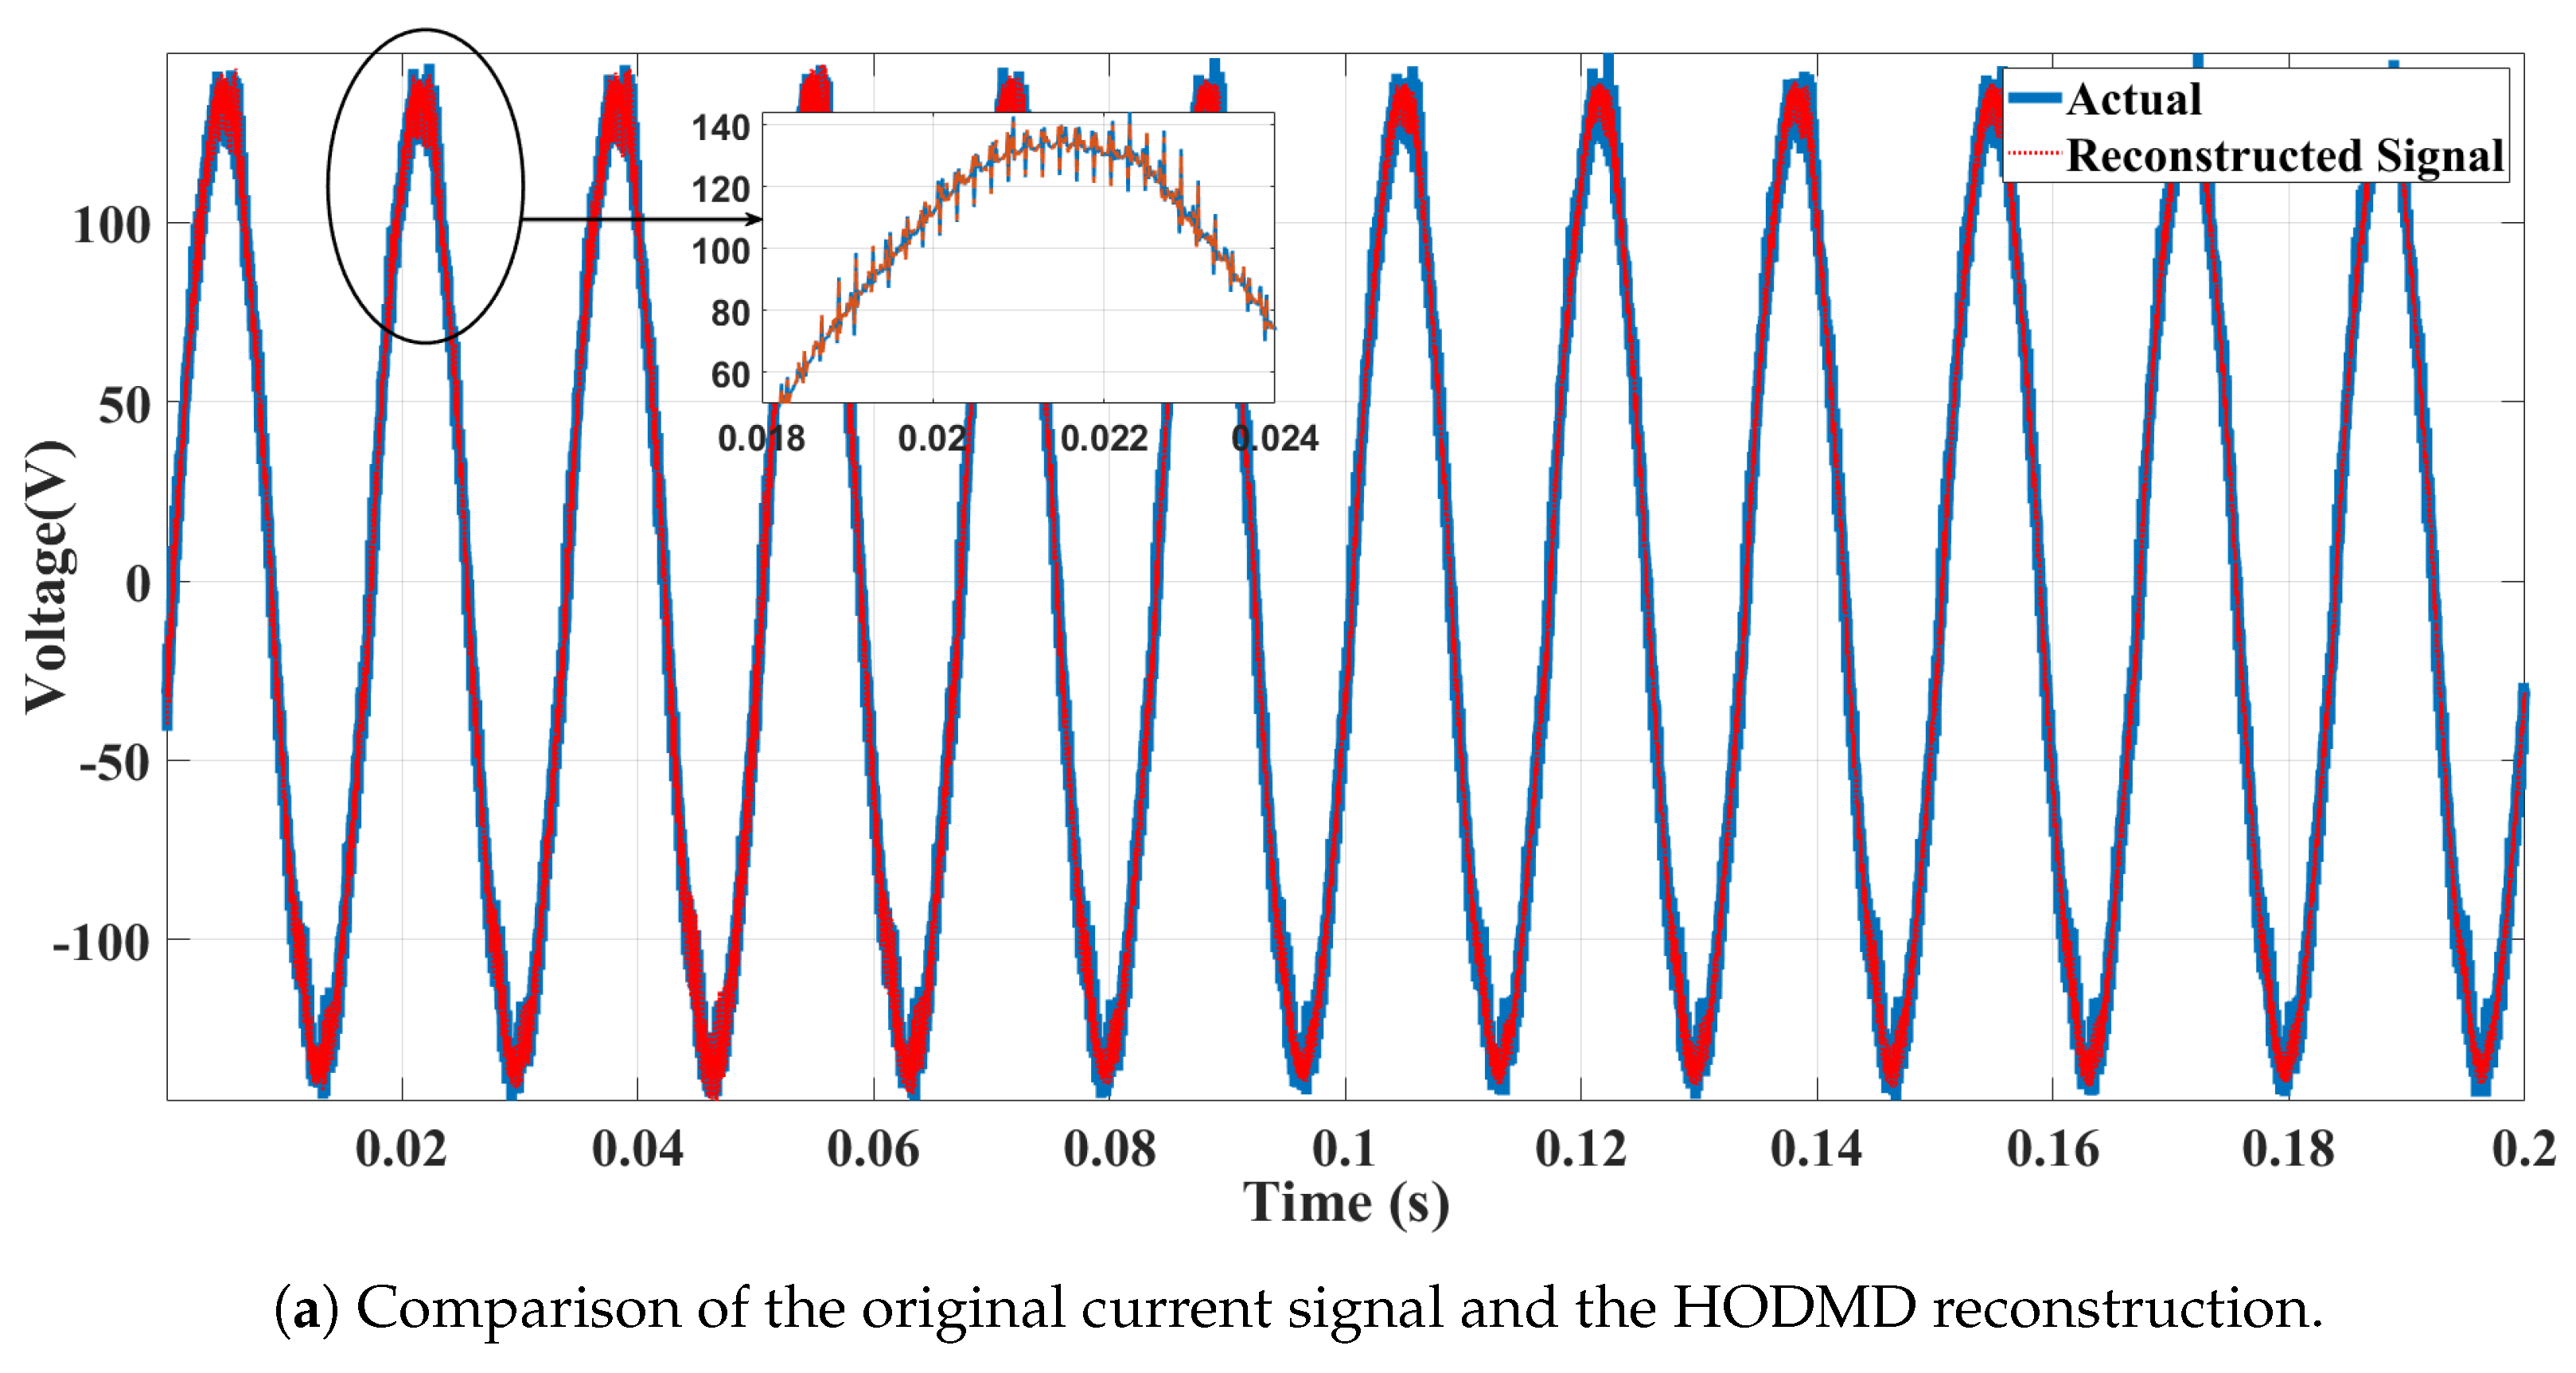
Figure 8 shows the original and reconstructed signals the corresponding frequency spectrum over a short time window. The two curves overlap almost perfectly. Even when zoomed in on a small segment, the reconstructed waveform closely follows the measured signal, demonstrating the ability of HODMD to capture the underlying dynamics with high fidelity. The residual error remains very small and does not distort the waveform shape, confirming the robustness of the method for accurate signal tracking.
For a DC–AC converter modulated with sinusoidal pulse-width modulation (PWM), the frequency spectrum of the output voltage or current consists of the fundamental component at f 1 = 60   Hz , permissible low-order harmonics (integer multiples of f 1 ), and high-frequency components clustered around the switching frequency f sw = 2700   Hz and its odd multiples. The dominant high-frequency components can be expressed by the general relationship
f h = ( 2 k + 1 ) f sw ± m f 1 ,
where k = 0 , 1 , 2 , indexes the carrier harmonic groups and m = 1 , 2 , 3 , denotes the sideband order within each group. Based on the converter parameters, the theoretically expected harmonic frequencies are 60 , 120 , 540 , 1380 , 2280 , 5940 , Hz . As shown in the results, the HODMD algorithm successfully detects all these components. Therefore, HODMD is considered as the reference method for subsequent comparisons.
The results reported in Table 2 are consistent with those obtained for the simulated signal in Table 5. HODMD remains the most accurate method for stationary signal analysis. By contrast, the relatively large errors observed for SST-STFT and ConceFT-STFT indicate that these methods are less suitable for this class of signals.
Experimental Validation
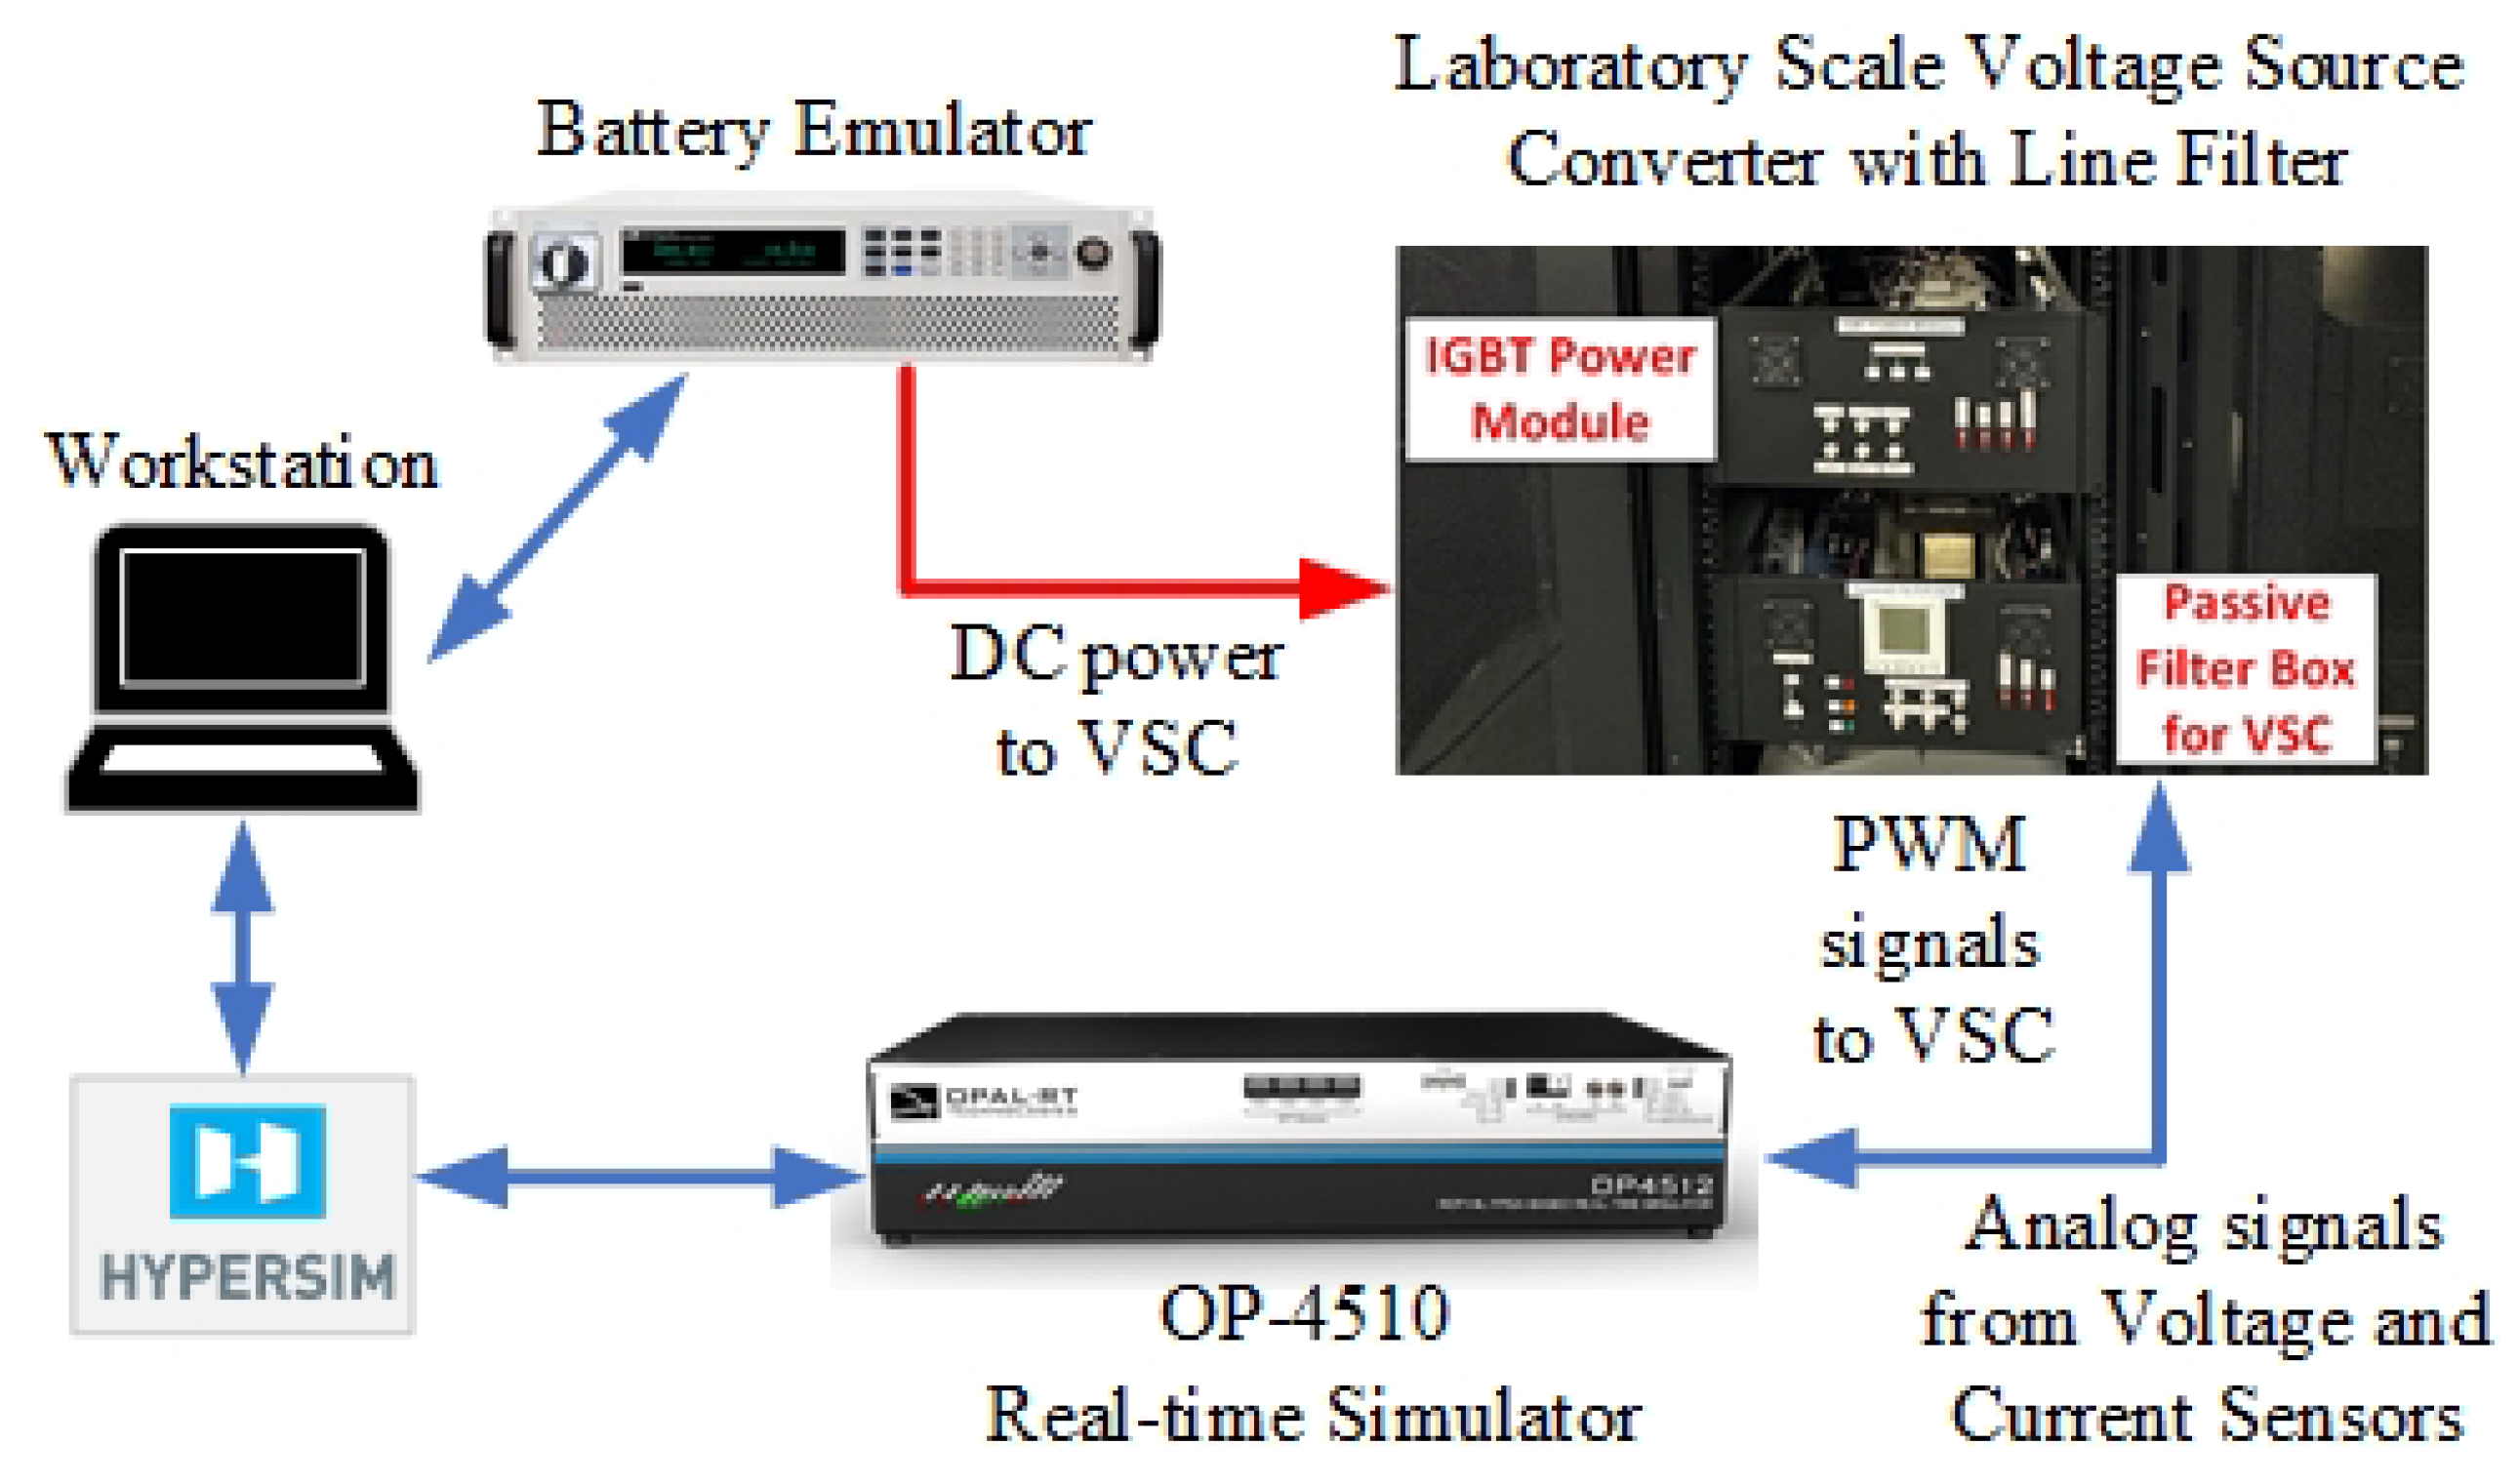
The experimental validation was based on a laboratory-scale microgrid setup designed to replicate the realistic operating conditions of converter-dominated power systems. The OPAL-RT OP4510 real-time simulator served as the computational backbone of the experiments, providing the processing power needed for electromagnetic transient (EMT) simulations with high-level resolution. Converter control, data acquisition, and system monitoring were implemented through the HYPERSIM software interface, which ensures deterministic real-time execution and precise synchronization between the simulated power stage and the control algorithms.
This configuration enabled a full hardware-in-the-loop (HIL) implementation, offering a highly realistic testing environment that faithfully reproduces field conditions while avoiding the operational risks and costs of experiments on a live grid. The microgrid setup included a DC source emulating a battery energy storage system (BESS), a bi-directional DC–DC converter, and a grid-connected voltage source converter (VSC) with its filter. The laboratory-scale microgrid setup used for real-time validation of the proposed HODMD-based method is shown in Figure 9.
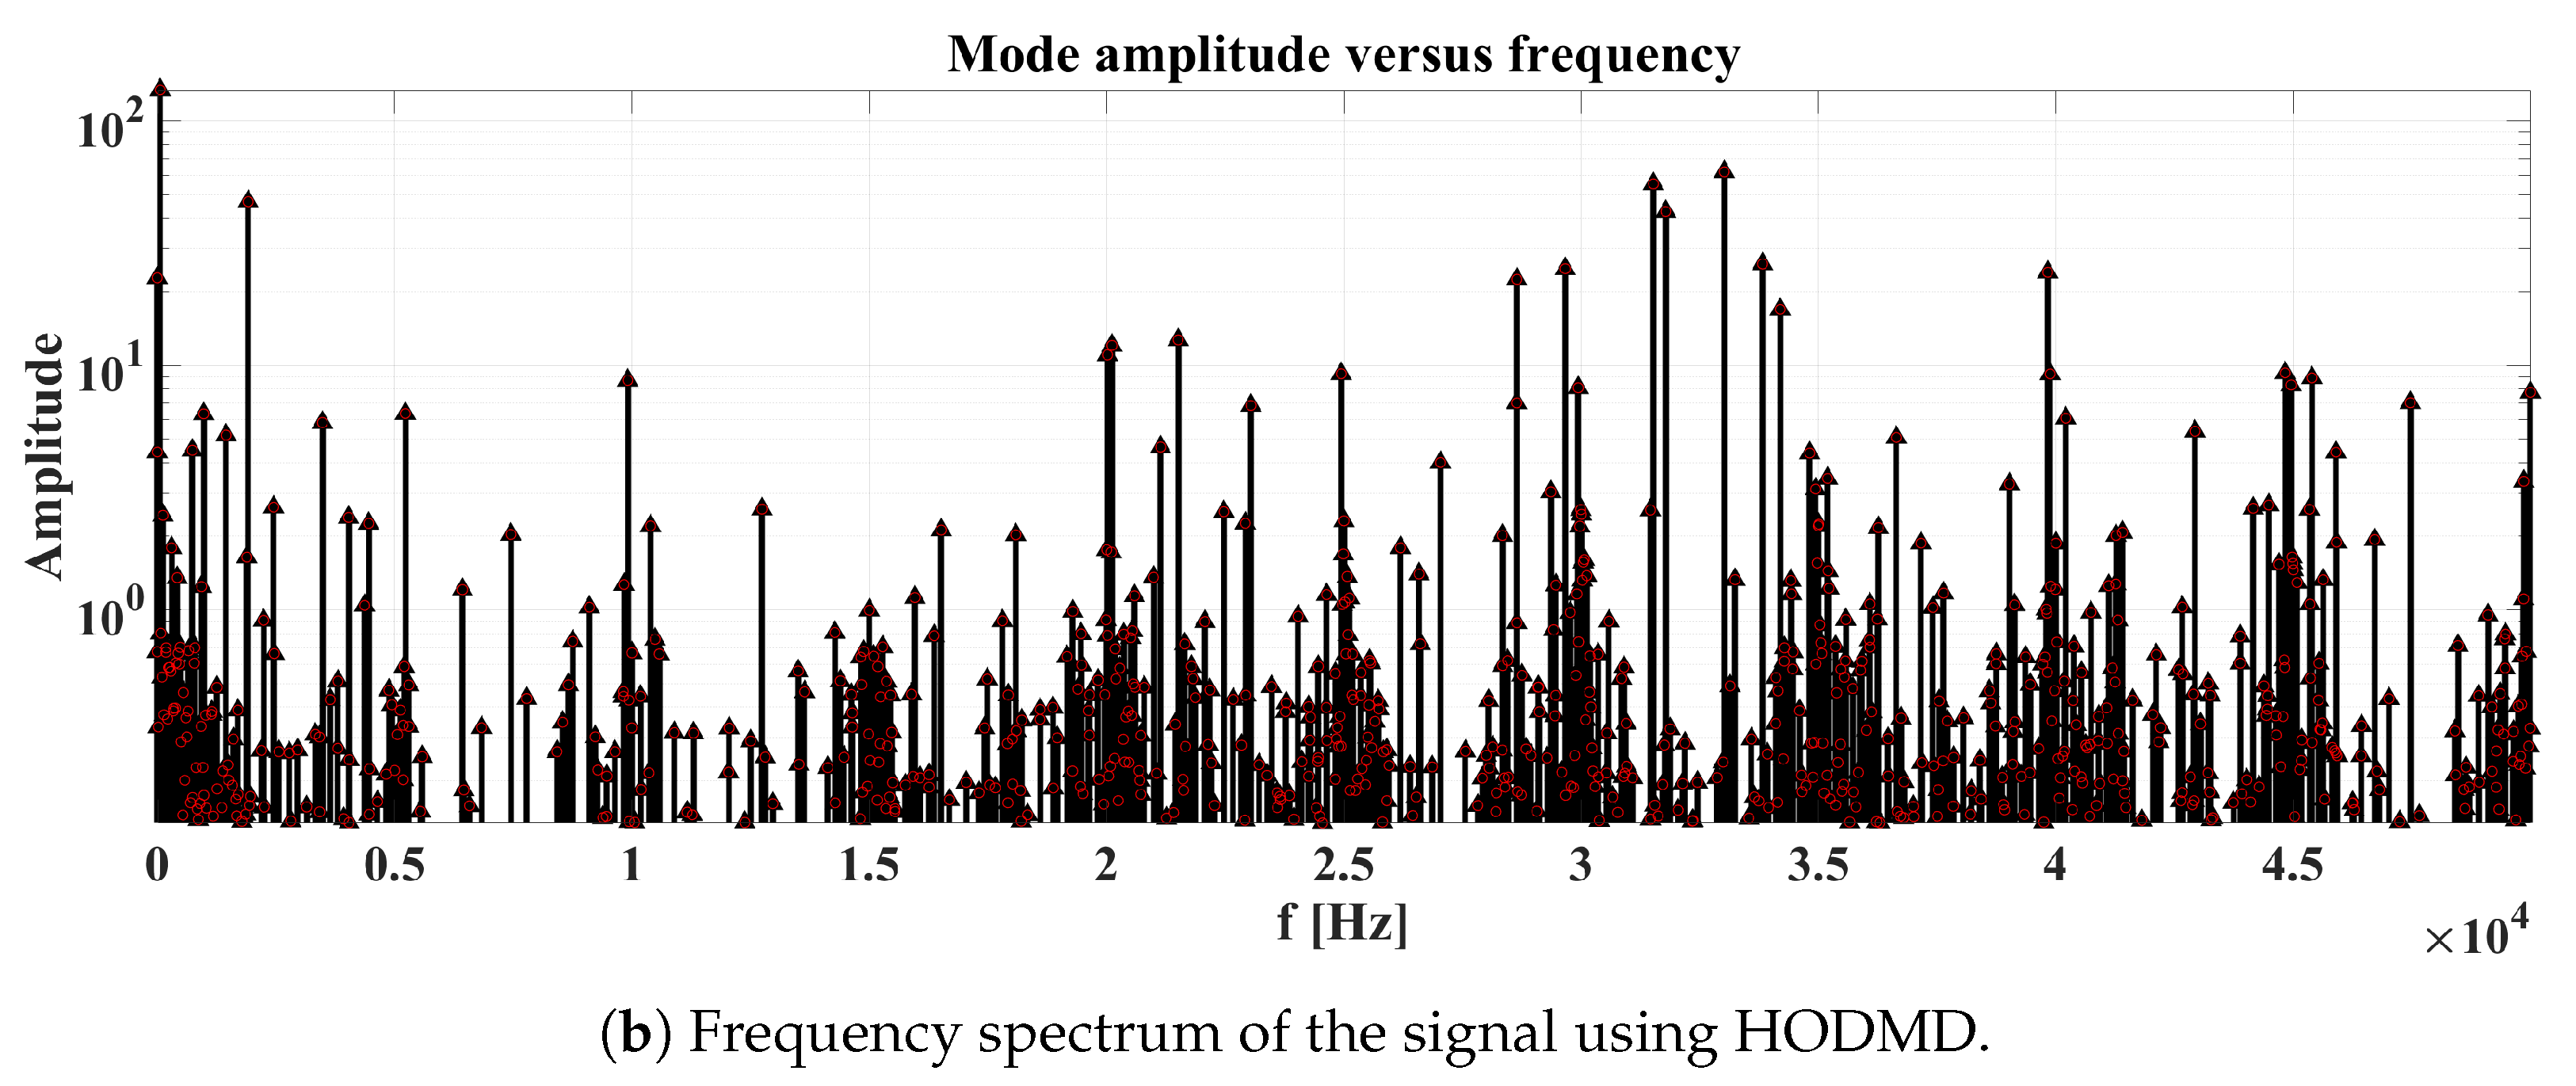
The HODMD algorithm was applied to the measured voltage and current signals acquired at the point of common coupling (PCC) of the experimental setup. The resulting frequency–amplitude spectrum (Figure 10) clearly shows not only the fundamental component and low-order harmonics but also switching-related frequency components extending well beyond 40 kHz . This highlights the capability of HODMD to capture both slow electromechanical oscillations and fast switching phenomena simultaneously, a key requirement for diagnosing converter-driven power systems.
These results confirm that HODMD can serve as a reliable tool for advanced harmonic analysis, event detection, and power quality monitoring in microgrids and large-scale networks. Its ability to operate on real-time measurement data makes it directly integrable into supervisory control and data acquisition (SCADA) systems or PMU-based wide-area monitoring frameworks, thus offering significant potential for practical deployment in grid operation centers.

4.2.2. Case Study 5: Frequency-Varying System Analysis

In this section, voltage and current measurement data were used to evaluate the performance of the three methods during a real event that occurred on the Hydro-Québec power grid in January 2001. This event was characterized by a significant frequency deviation, which was analyzed using a COMTRADE file recorded at a rate of 64 samples per cycle with a Phasor Measurement Unit (PMU) based on an Extended Kalman Filter (EKF) [27]. The fundamental frequency variation observed during this event, as measured by the PMU, is shown in Figure 11.
The results shown in Figure 11b indicate that although all three methods capture and track the frequency changes, their performance differs considerably in terms of smoothness and time resolution. HODMD demonstrates superior accuracy, providing a precise, smooth, and noise-robust estimation of the fundamental frequency trajectory with minimal fluctuation, making it well suited for modeling and control applications. In contrast, ConceFT-STFT offers higher time–frequency resolution but shows significant sensitivity to noise, manifested as high-frequency fluctuations and transient spikes, particularly in the early time segments. SST-STFT provides an intermediate behavior, achieving improved resolution compared to HODMD while exhibiting lower noise sensitivity than ConceFT-STFT.
Unlike SST-STFT or ConceFT-STFT, which are designed to visualize the distribution of signal energy and amplitude in the time–frequency plane, HODMD extracts physically meaningful modal information such as frequency, damping, and phase. This makes the problem considerably more complex, since continuity must be ensured not only for frequency but also for damping and phase when using a sliding window. In our analyses of signals with sudden variations, such as the Hauer test signal with step changes and the Hydro-Québec signal exhibiting fundamental frequency excursions, we were able to maintain continuity of the fundamental mode’s frequency, damping factor, and phase across windows, despite edge effects. However, when many closely spaced modes are present simultaneously, mode switching (jumps) between consecutive windows may still occur, which is an inherent challenge of any parametric modal tracking method and requires careful post-processing.

5. Conclusions

In this paper, we investigated and benchmarked the performance of Higher-Order Dynamic Mode Decomposition (HODMD) against several advanced signal processing techniques across a range of applications. Through both synthetic and experimental analyses, HODMD demonstrated superior capability in accurately estimating the frequencies, amplitudes, and phases of multi-component signals. Nevertheless, it should be emphasized that HODMD is fundamentally a modal decomposition algorithm rather than a time–frequency analysis tool, which limits its effectiveness in scenarios requiring fine temporal localization of spectral features. In such cases, methods such as the Synchrosqueezing Transform-based Short-Time Fourier Transform (SST-STFT) provide enhanced sensitivity to time-varying components, while the Concentration of Frequency and Time (ConceFT-SST) approach offers improved frequency resolution compared with SST-STFT but shows limitations in reliably retrieving amplitude and phase information. Consequently, ConceFT-SST may be considered a complementary diagnostic tool for spectral characterization, whereas HODMD remains the preferred method for complete signal reconstruction and modal analysis. Also, as illustrated by the Hauer signal, HODMD can detect and track harmonic components with high fidelity during extreme events such as geomagnetic disturbances (GMDs), providing operators with valuable insight into harmonic propagation and interactions within the network and enabling preventive measures to reduce risks such as transformer saturation or protection misoperation. Together, these examples highlight how HODMD can be seamlessly integrated into existing PMU-based monitoring frameworks and Wide-Area Measurement Systems (WAMS), where its outputs can enhance control center analytics, improve dynamic model validation, and support decision-making tools such as oscillation source localization and wide-area damping control. Being fully data-driven, HODMD can be deployed without requiring intrusive interventions in the network, offering a practical, scalable, and robust solution to enhance situational awareness and grid resilience.

Author Contributions

Conceptualization, A.A.D. and I.K.; methodology, A.A.D. and I.K.; software, A.A.D.; validation, A.A.D., I.K. and H.G.; formal analysis, A.A.D.; investigation, A.A.D. and H.G.; resources, H.G.; data curation, A.A.D.; writing—original draft preparation, A.A.D.; writing—review and editing, I.K., H.G., A.N. and A.M.; visualization, A.A.D. and H.G.; supervision, I.K.; project administration, I.K. All authors have read and agreed to the published version of the manuscript.

Funding

This research was supported by Canada National Sciences and Engineering Research Council through the Laval University under Grants ALLRP567550-21 and RGPIN-2021-02574.

Data Availability Statement

The original contributions presented in this study are included in the article. Further inquiries can be directed to the corresponding author.

Conflicts of Interest

The authors declare no conflicts of interest.

References

  1. Grover, H.; Verma, A.; Bhatti, T.S. A Fast and Robust DOBC-Based Frequency and Voltage Regulation Scheme for Future Power Systems with High Renewable Penetration. Energy Convers. Econ. 2023, 4, 287–302. [Google Scholar] [CrossRef]
  2. North American Electric Reliability Corporation (NERC). Project 2022-04: Electromagnetic Transient (EMT) Modeling Standard. Available online: https://www.nerc.com/pa/Stand/Pages/Project2022-04EMTModeling.aspx (accessed on 20 August 2025).
  3. Chen, C.-I.; Chen, Y.-C. Comparative Study of Harmonic and Interharmonic Estimation Methods for Stationary and Time-Varying Signals. IEEE Trans. Ind. Electron. 2014, 61, 397–404. [Google Scholar] [CrossRef]
  4. Nam, S.-R.; Kang, S.-H.; Kang, S.-H. Real-Time Estimation of Power System Frequency Using a Three-Level Discrete Fourier Transform Method. Energies 2015, 8, 79–93. [Google Scholar] [CrossRef]
  5. Duric, M.B.; Djurisic, Z. Frequency Measurement in Power Networks in the Presence of Harmonics Using Fourier and Zero Crossing Technique. In Proceedings of the 2005 IEEE Russia Power Tech (PowerTech), St. Petersburg, Russia, 27–30 June 2005; pp. 1–6. [Google Scholar] [CrossRef]
  6. Xiao, X.; Jiang, X.; Xie, S.; Lu, X.; Zhang, Y. A Neural Network Model for Power System Inter-Harmonics Estimation. In Proceedings of the 2010 IEEE Fifth International Conference on Bio-Inspired Computing: Theories and Applications (BIC-TA), Changsha, China, 23–26 September 2010; pp. 756–760. [Google Scholar] [CrossRef]
  7. Føyen, S.; Kvammen, M.-E.; Fosso, O.B. Prony’s Method as a Tool for Power System Identification in Smart Grids. In Proceedings of the 2018 International Symposium on Power Electronics, Electrical Drives, Automation and Motion (SPEEDAM), Amalfi, Italy, 20–22 June 2018; pp. 562–569. [Google Scholar] [CrossRef]
  8. Priyanga, V.T.; Chandni, M.; Mohan, N.; Soman, K.P. Data-Driven Analysis for Low Frequency Oscillation Identification in Smart Grid Using FB-DMD and T-DMD Methods. In Proceedings of the 2019 9th International Conference on Advances in Computing and Communication (ICACC), Kochi, India, 6–8 November 2019; pp. 51–57. [Google Scholar] [CrossRef]
  9. Barocio, E.; Pal, B.C.; Thornhill, N.F.; Messina, A.R. A Dynamic Mode Decomposition Framework for Global Power System Oscillation Analysis. IEEE Trans. Power Syst. 2015, 30, 2902–2912. [Google Scholar] [CrossRef]
  10. Zuhaib, M.; Rihan, M. Identification of Low-Frequency Oscillation Modes Using PMU Based Data-Driven Dynamic Mode Decomposition Algorithm. IEEE Access 2021, 9, 49434–49447. [Google Scholar] [CrossRef]
  11. Yang, D.; Wang, B.; Cai, G.; Chen, Z.; Ma, J.; Sun, Z.; Wang, L. Data-Driven Estimation of Inertia for Multiarea Interconnected Power Systems Using Dynamic Mode Decomposition. IEEE Trans. Ind. Inform. 2021, 17, 2686–2695. [Google Scholar] [CrossRef]
  12. Nonomura, T.; Shibata, H.; Takaki, R. Extended-Kalman-Filter-Based Dynamic Mode Decomposition for Simultaneous System Identification and Denoising. PLoS ONE 2019, 14, e0209836. [Google Scholar] [CrossRef]
  13. Mohan, N.; Soman, K.P. A Data-Driven Technique for Harmonics Monitoring in Emerging Power Grids Using Noise-Aware Dynamic Mode Decomposition. Meas. Sci. Technol. 2020, 31, 015016. [Google Scholar] [CrossRef]
  14. Indhu, I.S.; Kumar, K.S.; Krishna, U.V.; Mohan, N.; Sowmya, V.; Soman, K.P. Investigating the Significance of Dynamic Mode Decomposition for Fast and Accurate Parameter Estimation in Power Grids. In Proceedings of the 2020 11th International Conference on Computing, Communication and Networking Technologies (ICCCNT), Kharagpur, India, 1–5 July 2020; pp. 1–5. [Google Scholar] [CrossRef]
  15. Sikha, O.K.; Soman, K.P.; Kumar, S.S. VMD–DMD Coupled Data-Driven Approach for Visual Saliency in Noisy Images. Multimed. Tools Appl. 2020, 79, 1951–1970. [Google Scholar] [CrossRef]
  16. Rehman, N.U.; Aftab, H. Multivariate Variational Mode Decomposition. IEEE Trans. Signal Process. 2019, 67, 6039–6052. [Google Scholar] [CrossRef]
  17. Aadhithya, A.; Mohan, N.; Kumar, S.S.; Soman, K.P.; Poornachandran, P. Prospects of NFMD for Power System Frequency and Amplitude Estimation. In Proceedings of the 2022 7th International Conference on Recent Advances and Innovations in Engineering (ICRAIE), Jaipur, India, 2–4 December 2022; pp. 1–6. [Google Scholar] [CrossRef]
  18. Le Clainche, S.; Vega, J.M. Higher Order Dynamic Mode Decomposition to Identify and Extrapolate Flow Patterns. Phys. Fluids 2017, 29, 084102. [Google Scholar] [CrossRef]
  19. Kou, J.; Le Clainche, S.; Zhang, W. A Reduced-Order Model for Compressible Flows with Buffeting Condition Using Higher Order Dynamic Mode Decomposition with a Mode Selection Criterion. Phys. Fluids 2018, 30, 016103. [Google Scholar] [CrossRef]
  20. Yu, J.; Hao, G.; Guo, J.; Li, X. Synchrosqueezing Superlet Transform: Algorithm and Applications. IEEE Trans. Ind. Electron. 2025, 1–13. [Google Scholar] [CrossRef]
  21. Oberlin, T.; Meignen, S.; Perrier, V. The Fourier-Based Synchrosqueezing Transform. In Proceedings of the 2014 IEEE International Conference on Acoustics, Speech and Signal Processing (ICASSP), Florence, Italy, 4–9 May 2014; pp. 315–319. [Google Scholar] [CrossRef]
  22. Daubechies, I.; Wang, Y.G.; Wu, H. ConceFT: Concentration of Frequency and Time via a Multitapered Synchrosqueezed Transform. Philos. Trans. R. Soc. A Math. Phys. Eng. Sci. 2016, 374, 20150193. [Google Scholar] [CrossRef] [PubMed]
  23. Le Clainche, S.; Vega, J.M. Higher Order Dynamic Mode Decomposition. SIAM J. Appl. Dyn. Syst. 2017, 16, 882–925. [Google Scholar] [CrossRef]
  24. Koopman, B.O. Hamiltonian Systems and Transformation in Hilbert Space. Proc. Natl. Acad. Sci. USA 1931, 17, 315–318. [Google Scholar] [CrossRef] [PubMed]
  25. Vega, J.M.; Le Clainche, S. Higher Order Dynamic Mode Decomposition. In Higher Order Dynamic Mode Decomposition and Its Applications; Elsevier: Amsterdam, The Netherlands, 2021; pp. 29–83. [Google Scholar] [CrossRef]
  26. Chakir, M.; Kamwa, I.; Le-Huy, H. Extended C37.118.1 PMU Algorithms for Joint Tracking of Fundamental and Harmonic Phasors in Stressed Power Systems and Microgrids. IEEE Trans. Power Deliv. 2014, 29, 1465–1480. [Google Scholar] [CrossRef]
  27. Kamwa, I.; Samantaray, S.R.; Joos, G. Wide Frequency Range Adaptive Phasor and Frequency PMU Algorithms. IEEE Trans. Smart Grid 2014, 5, 569–579. [Google Scholar] [CrossRef]
Figure 1. Flow diagram of HODMD algorithm.
Energies 18 05327 g001
Figure 2. Phase a of Hauer signal [26].
Energies 18 05327 g002
Figure 3. Result of HODMD on Hauer signal (part 1).
Energies 18 05327 g003aEnergies 18 05327 g003b
Figure 4. Reconstruction of the signal after HODMD applied with the RMSE error.
Energies 18 05327 g004
Figure 5. HODMD results for the non-stationary signal (part 1).
Energies 18 05327 g005
Figure 6. Time frequency representation results for the non-stationary signal using (a) ConceFT-STFT and (b) SST-STFT.
Energies 18 05327 g006
Figure 7. Overview of the studied system.
Energies 18 05327 g007
Figure 8. HODMD results for the simulated system signal.
Energies 18 05327 g008aEnergies 18 05327 g008b
Figure 9. Laboratory-scale microgrid setup used for real-time validation of the proposed HODMD-based method.
Energies 18 05327 g009
Figure 10. HODMD results for the experimental setup signal.
Energies 18 05327 g010aEnergies 18 05327 g010b
Figure 11. Frequency analysis during a grid event. (a) Frequency deviation represented by the PMU during the 2001 event [27]. (b) Comparison of grid frequency deviation estimation methods using HODMD, ConceFT-STFT, and SST-STFT.
Energies 18 05327 g011
Table 1. Practical guidelines for tuning HODMD parameters.
ParameterPractical RangeGuideline for Selection
d (Delay Embedding Dimension)Depends on signal complexity and noise level; trial-and-error tuningStart with d twice the expected number of dominant modes. Increase d until the reconstruction error converges. Stop increasing if the SVD becomes ill conditioned.
ε 1 (SVD Tolerance) 10 6 10 12 Choose ε 1 to retain at least 95 % of the system energy. If runtime becomes excessive without improving accuracy, increase ε 1 .
ε SVD (Mode Selection Threshold) 10 4 10 2 Select a threshold that filters out noise like modes while retaining physically meaningful weak modes.
Table 2. Comparison of the three spectral analysis methods.
Methodfreq (Hz)Amp (pu) θ (°)RMSE freq (%)RMSE Amp (%)RMSE θ (%)
HODMD00.5N/A 1.71 × 10 13 1.266 × 10 11 N/A
300.190 1.42 × 10 13 5.953 × 10 11 1.258 × 10 11
60160 2.842 × 10 13 3.135 × 10 11 5.001 × 10 11
900.0512.6 1.579 × 10 13 2.266 × 10 11 2.163 × 10 10
1200.0545 1.539 × 10 13 6.4 × 10 11 5.649 × 10 11
1800.01180 1.578 × 10 14 7.265 × 10 11 1.173 × 10 12
2400.01−29.79 2.013 × 10 13 6.7637 × 10 11 3.074 × 10 10
SST-STFT0.09140.5026N/A 9.1 × 10 2 6.3 × 10 1 N/A
30.08490.091189.99 2.7 × 10 1 78 1.938 × 10 5
60.0718160 1.145 × 10 2 3.16 × 10 6 6.866 × 10 7
90.07180.045812.609 1.788 × 10 1 7.6 5.44 × 10 5
120.15680.048944.99 1.425 × 10 13 4.232 × 10 1 2.531 × 10 8
180.14370.0101180 8.038 × 10 2 1.131 2.517 × 10 10
240.13060.0101−29.79 5.566 × 10 2 1.114 2.23 × 10 4
ConceFT-STFTN/AN/AN/AN/AN/AN/A
30.00270.0844−0.638 9.0433 × 10 3 15.6 100.708
60.005319.166 8.883 × 10 3 5.17 × 10 6 115.276
90.0080.0427−5.248 8.0377 × 10 3 14.586 141.69
120.01070.050085.135 9.225 × 10 3 1.601 × 10 1 88.59
180.016070.0106−0.036 6.444 × 10 3 5.879 99.97
240.02140.0107−1.115 8.917 × 10 3 6.773 94
Table 3. Parameter variation.
FrequencyParameter VariationROCOFInitial ValueFinal Value
f1 60 + t +16061
f2 30 + 2 t +23032
f3 120 2 t −2120118
f4 180 o n e s ( s i z e ( t ) ) 0180180
f5 240 2.5 t −2.5240237.5
f6 90 + 1.5 t +1.59091.5
Table 4. Comparison of RMSE(%) error of frequencies.
FrequencyHODMDConceFT-STFTSST-STFT
30 0.0195 0.02 0.02614
60 0.0179 0.1959 0.2549
90 2.301 × 10 2 0.97 0.0142
120 4.639 × 10 3 0.8165 0.01264
180 0.0222 1.4696 0.0824
240 0.028 0.3066 0.0425
Table 5. Frequency and amplitude identification for the measured system signal.
Methodfreq (Hz)Amp (pu)Err freq (%)Err Amp (%)
HODMD200.001260
6010
1000.004990
5400.001180
13800.001420
22800.001310As Reference
59400.00240
83400.01170
94200.001990
11,7600.001890
STFT27.20.01835.671334
67.45112.4130
107.50.1457.52797
537.080.0010.549
1378.80.00120.08315
22790.00090.04433
59410.0010.01756
83400.00330.06172
9,4200.00040.05418
11,7600.00160.06313
ConceFT-STFT18.60.17127inf
62.0513.420
101.30.5251.3inf
540.60.0080.12584
13810.00470.08231
22800.0014010.3
5941.40.0010.0258.3
8340.40.00760.0135.14
94220.001890.0238.35
11,757.80.00180.026.17
Disclaimer/Publisher’s Note: The statements, opinions and data contained in all publications are solely those of the individual author(s) and contributor(s) and not of MDPI and/or the editor(s). MDPI and/or the editor(s) disclaim responsibility for any injury to people or property resulting from any ideas, methods, instructions or products referred to in the content.