Article

Thermal Modernization for Sustainable Cities: Environmental and Economic Impacts in Central Urban Areas

by
Piotr Sobierajewicz
1 and
Piotr Dzikowski
2,*
1
Institute of Architecture and Urban Planning, Faculty of Civil Engineering, Architecture and Environmental Engineering, University of Zielona Góra, ul. Licealna 9, 65-417 Zielona Góra, Poland
2
Institute of Economics and Finance, Faculty of Economics and Management, University of Zielona Góra, ul. Licealna 9, 65-417 Zielona Góra, Poland
*
Author to whom correspondence should be addressed.
Energies 2025, 18(19), 5324; https://doi.org/10.3390/en18195324
Submission received: 4 September 2025 / Revised: 2 October 2025 / Accepted: 7 October 2025 / Published: 9 October 2025

Abstract

Maintaining a high-quality urban environment remains a critical yet challenging issue in modern cities, particularly in densely built and historically significant central areas. In response, the European Green Deal initiative aims to promote sustainable urban development. This study presents a multi-criteria assessment methodology for evaluating urban environments, with a focus on prioritizing thermal renovations of buildings to achieve substantial environmental improvements. The research adopts a centrifugal strategy, targeting buildings with the poorest energy performance for phased renovation efforts. Using the model city of Gubin, Poland, as a case study, the assessment proceeds through five stages: evaluating technical wear (Stages I–II), estimating replacement values and renovation costs (Stages III–IV), and finally, quantifying environmental benefits from energy efficiency upgrades (Stage V). Findings reveal that buildings in the lowest energy class (Class G) require investments of 111–193% of their replacement value but can deliver CO2 emissions reduced to 1/6.2 of the original level (an approximate 84% reduction). The primary contribution of this paper is the development and application of a novel multi-criteria assessment methodology for evaluating urban environments, specifically designed to prioritize thermal renovations in central urban areas to achieve significant environmental and economic benefits. The study provides valuable economic and environmental indicators that can guide the formulation of pro-environmental urban policies and support strategic decision-making in cities with dense populations and aging infrastructure.

1. Introduction

1.1. Buildings, Energy Demand, and the Climate Challenge

Across the European Union (EU), buildings represent the most significant energy end-use sector, accounting for almost 40% of final energy demand and approximately 36% of energy-related CO2 emissions [1]. Consequently, this sector occupies a pivotal position within the European Green Deal and the Fit-for-55 policy framework. Nevertheless, despite the pivotal role of the building stock in achieving climate neutrality, progress in renovation remains significantly below the requisite levels. Recent surveys conducted by the Buildings Performance Institute Europe (BPIE) indicate that the average annual rate of energy-related renovations in the EU is less than 1% of the total floor area, while the rate of deep renovations—those that deliver transformative energy savings—hovers around just 0.2% [2]. This stagnation signifies a pivotal structural dilemma, particularly given that the duration of building lifespans spans numerous decades. A considerable body of research has indicated that between 75 and 85 percent of the dwellings currently in use will be in continuous occupation until the year 2050 [3]. In the absence of accelerated upgrading, Europe’s “legacy fabric” is likely to constitute a significant impediment to the achievement of net-zero emissions targets [4]. Concurrently, the failure to curtail the operational energy demand of the built environment has been demonstrated to exacerbate household energy expenditures, to engender deteriorated air quality, and to contribute to health inequalities [5,6].

1.2. Regional Context: Central and Eastern Europe

The retrofit deficit is particularly acute in Central and Eastern Europe (CEE), where post-socialist urban housing estates are characterized by uniform prefabricated concrete-block architecture, thin insulation layers, and outdated heating systems [7]. The issue of inadequate investment, a phenomenon that has persisted since the 1990s political transitions, has led to numerous edifices characterized by high heat-loss indices and mounting maintenance backlogs [8]. Moreover, the transition from state-owned housing to fragmented private ownership has introduced governance complexities that complicate collective renovation decisions [9]. Empirical studies demonstrate that multi-family dwellings in the CEE region consume up to four times more heating energy than comparable units in Western Europe [10]. This inefficiency is concomitant with socio-economic vulnerabilities, giving rise to energy poverty hotspots where households face a dual burden of high energy bills and deteriorating indoor comfort [11]. The fiscal context further exacerbates the challenge, with national differences in property taxation, housing subsidies, and corporate tax regimes creating divergent climates for ESCO financing. While low-tax jurisdictions such as Ireland or Luxembourg experience capital flows, higher-tax CEE countries encounter difficulties in mobilizing comparable private investments [12,13]. Consequently, scholars have emphasized the importance of targeted incentives, including reduced value-added tax (VAT) rates for renovation materials, tax credits, and on-bill financing schemes, to support equitable access to retrofit benefits [5,14].

1.3. Policy Framework: EU and National Strategies

The EU has progressively strengthened its policy architecture with a view to accelerating the process of building renovation. The Energy Performance of Buildings Directive (EPBD) [2], revised in 2024, obliges Member States to guarantee that the least energy-efficient non-residential buildings attain a minimum energy rating of F by 2030, and that 26% of such buildings achieve a minimum rating of E by 2033 [15]. For residential properties, analogous minimum energy performance standards (MEPS) will be implemented, with the objective of propelling the least efficient homes towards efficiency classes F and E by the years 2030 and 2033. These measures have been designed to address the “policy gap” that was left by earlier instruments, such as Energy Performance Certificates (EPCs), which delivered only modest market signals [16,17]. Complementary strategies have been developed to reinforce this directive. The EU’s Renovation Wave initiative, established in 2020, aims to double the annual renovation rate over the forthcoming decade [18]. National long-term renovation strategies (LTRSs), such as Poland’s 2022 plan, commit to multi-million-scale thermal upgrades, including both shallow interventions (replacement of coal-fired boilers) and deep retrofits that comprehensively address insulation, windows, and systems. In Poland, for instance, the DSRB strategy anticipates 7.5 million renovations by 2050, of which 4.7 million are projected to be comprehensive [4]. Financial support mechanisms are offered by both the EU and national funds. At the EU level, cohesion funds and the Just Transition Mechanism allocate resources to regions with a long-standing reliance on coal [19]. At the national level, Poland’s Clean Air and Stop Smog funds deliver targeted subsidies for households, while the Thermal Modernisation and Renovation Fund leverages banking instruments for broader projects [20,21]. Despite these efforts, access for low-income owners remains limited without the implementation of tailored instruments, such as tax reductions, targeted grants, and inclusive pathways through public–private partnerships (PPPs) [12,13].

1.4. Social Dimensions: Energy Poverty and Health

The notion of buildings as mere technical or economic domains is a simplistic one; they are also a social determinant of health and well-being. The inhabitants of substandard housing frequently encounter suboptimal indoor thermal conditions, exposure to pollutants, and deficient ventilation, which exert a direct impact on respiratory and cardiovascular health [5,6]. Furthermore, energy poverty has been demonstrated to exacerbate social inequality by forcing households to expend a disproportionate share of their income on energy, often at the expense of food, healthcare, or education [6].
The correlation between substandard housing, stress, and mental health outcomes is a recognised phenomenon [22]. Research suggests that existential insecurity about energy bills and displacement due to urban redevelopment (also termed “renoviction”) contributes to heightened psychosocial stress among vulnerable groups [23,24,25].

1.5. The Economics of Renovation and Methodological Gaps

Conventional investment appraisals for renovation projects rely on net present value (NPV) calculations based primarily on fuel savings and maintenance cost reductions [26]. Nevertheless, this approach systematically underestimates broader non-market benefits. These include health cost savings from reduced air pollution [27], productivity improvements associated with better indoor environments [28], and societal benefits of carbon abatement [29]. In order to surmount these limitations, multi-criteria decision-making tools have been developed that incorporate economic, environmental, and technical (EET) indicators [30]. These frameworks account for life-cycle carbon, resilience against technical obsolescence, and welfare gains, offering a more holistic valuation of retrofit projects. Case studies demonstrate that projects classified as marginal or unattractive under conventional NPV appraisals become economically viable once externalities such as avoided healthcare expenditures and monetised carbon reductions are taken into account [31]. Nevertheless, methodological challenges persist, including the necessity for harmonized life-cycle assessment databases and standardised carbon pricing assumptions [32].

1.6. Governance and Participation

A growing body of literature emphasises the role of community participation in enhancing retrofit acceptance and equity. Participatory pilot projects in Poland, Hungary, and Romania demonstrate that residents involved in shaping the technical scope and financing options reported greater satisfaction and lower fears of displacement [33]. In a similar vein, governance structures that are co-created—such as neighbourhood energy forums and participatory budgeting—enable the customization of retrofit packages to local conditions [34,35,36,37]. These approaches have been shown to increase adoption rates among vulnerable households while concomitantly reducing the risk of gentrification-driven displacement [23,38]. The integration of participatory methods with EET evaluation ensures that equity metrics, such as the share of energy savings captured by low-income households, are explicitly considered [39,40]. This approach is consistent with the EU’s overarching Just Transition agenda, which aims to ensure that the transition to a climate-neutral economy does not intensify existing inequalities but rather generates societal co-benefits [20,21].

1.7. Challenges for Urban Policy and Regeneration

Urban areas with dense, older building stock present particular challenges. High-rise estates from the mid-20th century often coincide with fragile socio-economic conditions. Integrated urban regeneration strategies are required in such cases, combining physical retrofits with social and cultural investments [41]. In the absence of such comprehensive strategies, local authorities may find themselves perpetuating urban decline, outmigration from city centres, and the adoption of unsustainable suburbanization patterns. Spatial policy, heritage conservation, and public–private partnerships (PPPs) all interact with renovation goals [42]. The coordination of these domains requires both technical capacity and political will, particularly at the municipal level [43]. However, as highlighted by comparative studies, many local authorities face capacity deficits that hinder large-scale programmatic interventions. Furthermore, educational initiatives are being deployed to enhance environmental awareness of the benefits of modernization, complemented by technological assistance such as energy management systems and strategic investments designed to promote efficient energy use while simultaneously delivering social and environmental benefits [44].

1.8. Integrating Advances in Sustainable Urban Design

Recent research on sustainable urban design emphasizes the role of urban morphology in guiding energy efficiency, equity, and resilience. A typo-morphological framework links scales from building materials to city-wide street networks, showing how sustainable urban form depends on six parameters: efficiency, integrity, responsibility, acceptability, liveliness, and equity [45]. Efficiency is especially sensitive to material choice: high-performance insulation or low-carbon alternatives substantially reduce lifetime energy use and embodied emissions [45]. This approach suggests that sustainable renovation policies should integrate not only technical upgrades but also design strategies that reinforce social cohesion, accessibility, and urban vibrancy. At the same time, advances in sustainable construction materials—such as bio-based composites, recycled aggregates, and low-carbon concretes—are being applied to renovation and new builds [46]. These materials reduce embodied energy while improving thermal performance, directly supporting the EU’s Renovation Wave goals. When aligned with urban design frameworks, their use can amplify both micro-scale efficiency (at the building level) and macro-scale resilience (at the city level) [46].

1.9. Toward Integrated Assessment Tools

In view of the challenges identified, there is an urgent requirement for integrated assessment frameworks that can address the technical, economic, and environmental dimensions in a simultaneous and coordinated manner. The EET-based methodology presented in this study contributes to filling this gap. The objective of the present study is to quantify both costs and environmental co-benefits, thereby generating actionable evidence for policymakers and investors.
The case study of Gubin, Poland, provides a testbed for the application of this methodology to a medium-sized urban context characterized by a substantial presence of low-performance buildings. The analysis explores the potential for energy efficiency gains, the economic implications of deep renovation, and the associated environmental benefits. The primary contribution of this paper is the development and application of a novel multi-criteria assessment methodology for evaluating urban environments, specifically designed to prioritize thermal renovations in central urban areas to achieve significant environmental and economic benefits. The remainder of this paper is structured as follows: Section 2 presents the research purpose, methodology, and assumptions, including the ASEET multi-criteria assessment framework. Section 3 reports the results of the empirical case study of Gubin, Poland, with detailed technical, economic, and environmental evaluations across different building zones. Section 4 provides a discussion of the findings, highlighting the environmental and socio-economic benefits of thermal modernization and comparing alternative renovation scenarios. In Section 5, the focus is on the cumulative economic and environmental indicators for a selected group of buildings that have undergone thermal modernization, with limitations and future research.

2. Research Methodology and Assumptions

2.1. Research Objective

The primary objective of the research is to determine cumulative economic, energy, and technical (EET) indicators that reflect the technical and environmental performance of buildings within the study area. This economic assessment utilizes the EET indicators to identify the potential for energy improvement, focusing initially on buildings in the lowest energy efficiency classes (G-F) [2]. The ultimate goal is to quantify the investment costs associated with the energy modernization of individual buildings and complexes, thereby justifying environmental benefits such as reduction in CO2 and other greenhouse gas (GHG) emissions.
An intermediate objective is to support the strategic management and control of expenditure and economic subsidies at national and European levels [47,48,49]. The study employs socio-economic indicators, benchmarked against carbon emissions in the analysed zones [30], to manage energy efficiency improvements in urban areas.
Effective management of urban energy efficiency yields multiple benefits:
  • Reducing energy poverty: addressing the vulnerability of residents who cannot maintain adequate home temperatures [50,51];
  • Mitigating financial burdens: reducing high heating and electricity costs, which disproportionately affect low-income residents, property owners, and local authorities [52];
  • Improving public health outcomes: reducing excessive GHC emissions, PM10, and PM2.5 particulate matter; these emissions often stem from poor building technical conditions and outdated heating/ventilation systems, thus mitigating respiratory disease risks, especially for children and the elderly [53,54,55].

2.2. Research Methodology

The study employs a multi-criteria economic and environmental analysis focused on enhancing the energy efficiency of existing downtown built-up areas. This research represents a continuation of prior environmental work, specifically extending the climate assessment of CO2 emissions by integrating the conceptual framework of the ASEET methodology [35], as shown in Figure 1. This approach identifies environmental data necessary for analysis and calculations, organized according to the following criteria: A—Architectural (design and construction); S—Social (impact on users and society); E—Economic (financial implications for owners and users); E—Energy (building energy efficiency); and T—Technical (technical condition). To enhance study transparency, we only operationalized the EET dimensions. The Architectural dimension serves solely as a checklist for typology/geometry and heat sources in Stage I and was not developed as an indicator or weighting factor for calculations. Conversely, the social dimension was entirely omitted. The current investigation concentrates on assessing the economic efficacy of improving the energy efficiency of buildings characterized by the lowest technical status. This approach is intended to provide a practical tool for conducting sustainable urban policy and serves as a participatory offer for residents by clearly outlining the investment costs associated with the thermal modernization of their properties.
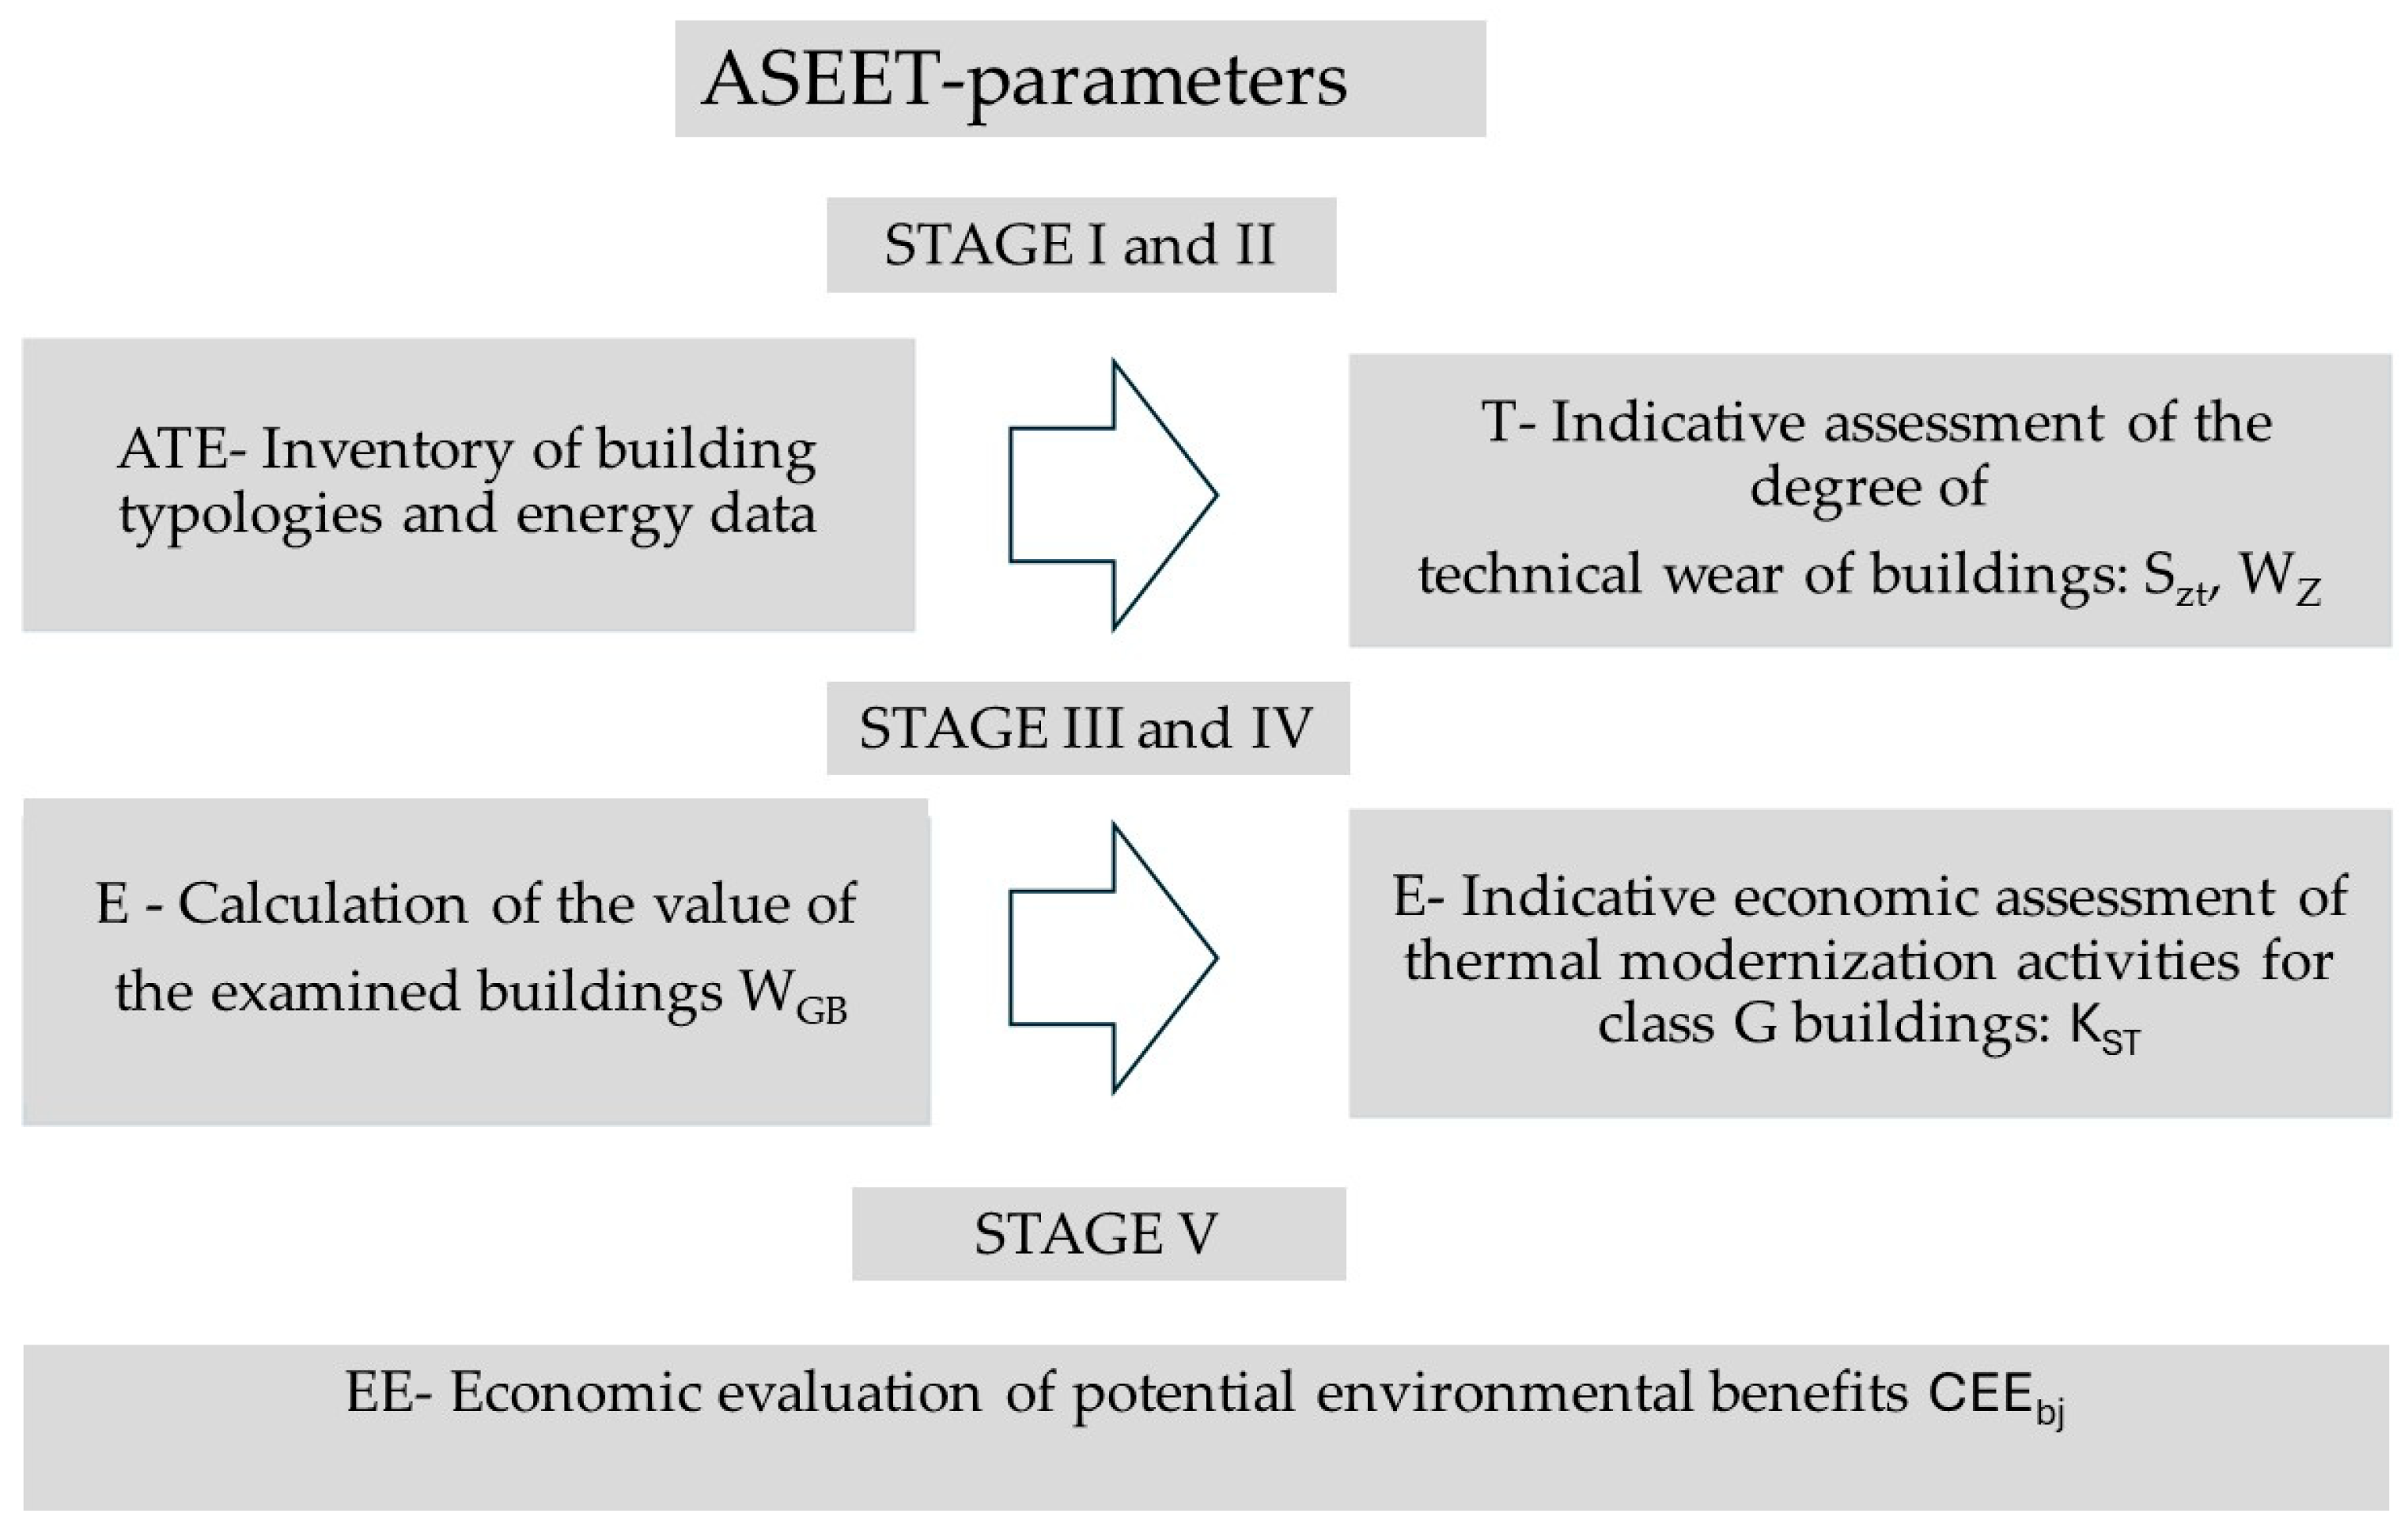
The operational procedure, detailed in Figure 2, comprises five stages (I–V) designed to establish a direct link between building renovation costs and measurable environmental effects at the urban scale.
The methodological diagram (Figure 2) involves the following five stages:
  • Stage I: architectural and technological inventory, including technical infrastructure and the building’s energy supply source;
  • Stage II: determination of the technical wear degree (Szt) of buildings within the selected city zone;
  • Stage III: estimation of the existing building’s value based on architectural and technical data;
  • Stage IV: determination of the costs associated with potential thermal modernization measures, according to the applicable energy standards for buildings in the analysed city zones;
  • Stage V: discussion of the results, with an indication of derived environmental benefits.
Subsequently, the methodological procedures will be detailed, illustrating the study’s results based on the adopted calculation assumptions for both individual buildings and urban areas.

2.3. Methodological and Calculation Assumptions

For the purpose of this research, urban buildings in poor technical condition were defined as properties that are neglected, fail to meet modern standards, and exhibit existing technical infrastructure problems. These characteristics consistently translate into several negative outcomes:
  • High Operating Costs: These buildings frequently utilize outdated heating and cooling systems, which substantially increases maintenance and operational costs.
  • Low Energy Efficiency: A lack of adequate thermal insulation results in significant heat loss and a corresponding increase in overall energy consumption.
  • Environmental Pollution: The prevalent use of outdated, high-emission energy sources, such as coal, contributes to increasing CO2 emissions and local air pollution.

2.3.1. Research Area

The study is regionally focused on Poland, a European country facing significant energy and climate transformation requirements for its existing building stock. Poland plans 7.4 million thermal renovations by 2050, with approximately 30% of buildings currently classified as being in poor technical condition (Class G) [56].

2.3.2. Policy and Building Classification

Following the European Parliament and Council Directive on the Energy Performance of Buildings (EPBD), a classification system for buildings has been established, ranging from Class G (highest energy intensity and environmental impact) to Class A. Class G buildings are designated as those generating an annual energy performance (EP) greater than 150 kWH/m2.
This research specifically targeted Class G buildings that rely on coal as the primary energy source. Consequently, the environmental analysis was primarily limited to carbon dioxide (CO2), as it is the principal emission product of coal combustion. The use of the colour red for Zone I is consistent with the EPBD classification convention for Class G designation.

2.3.3. Model City and Economic Indicators

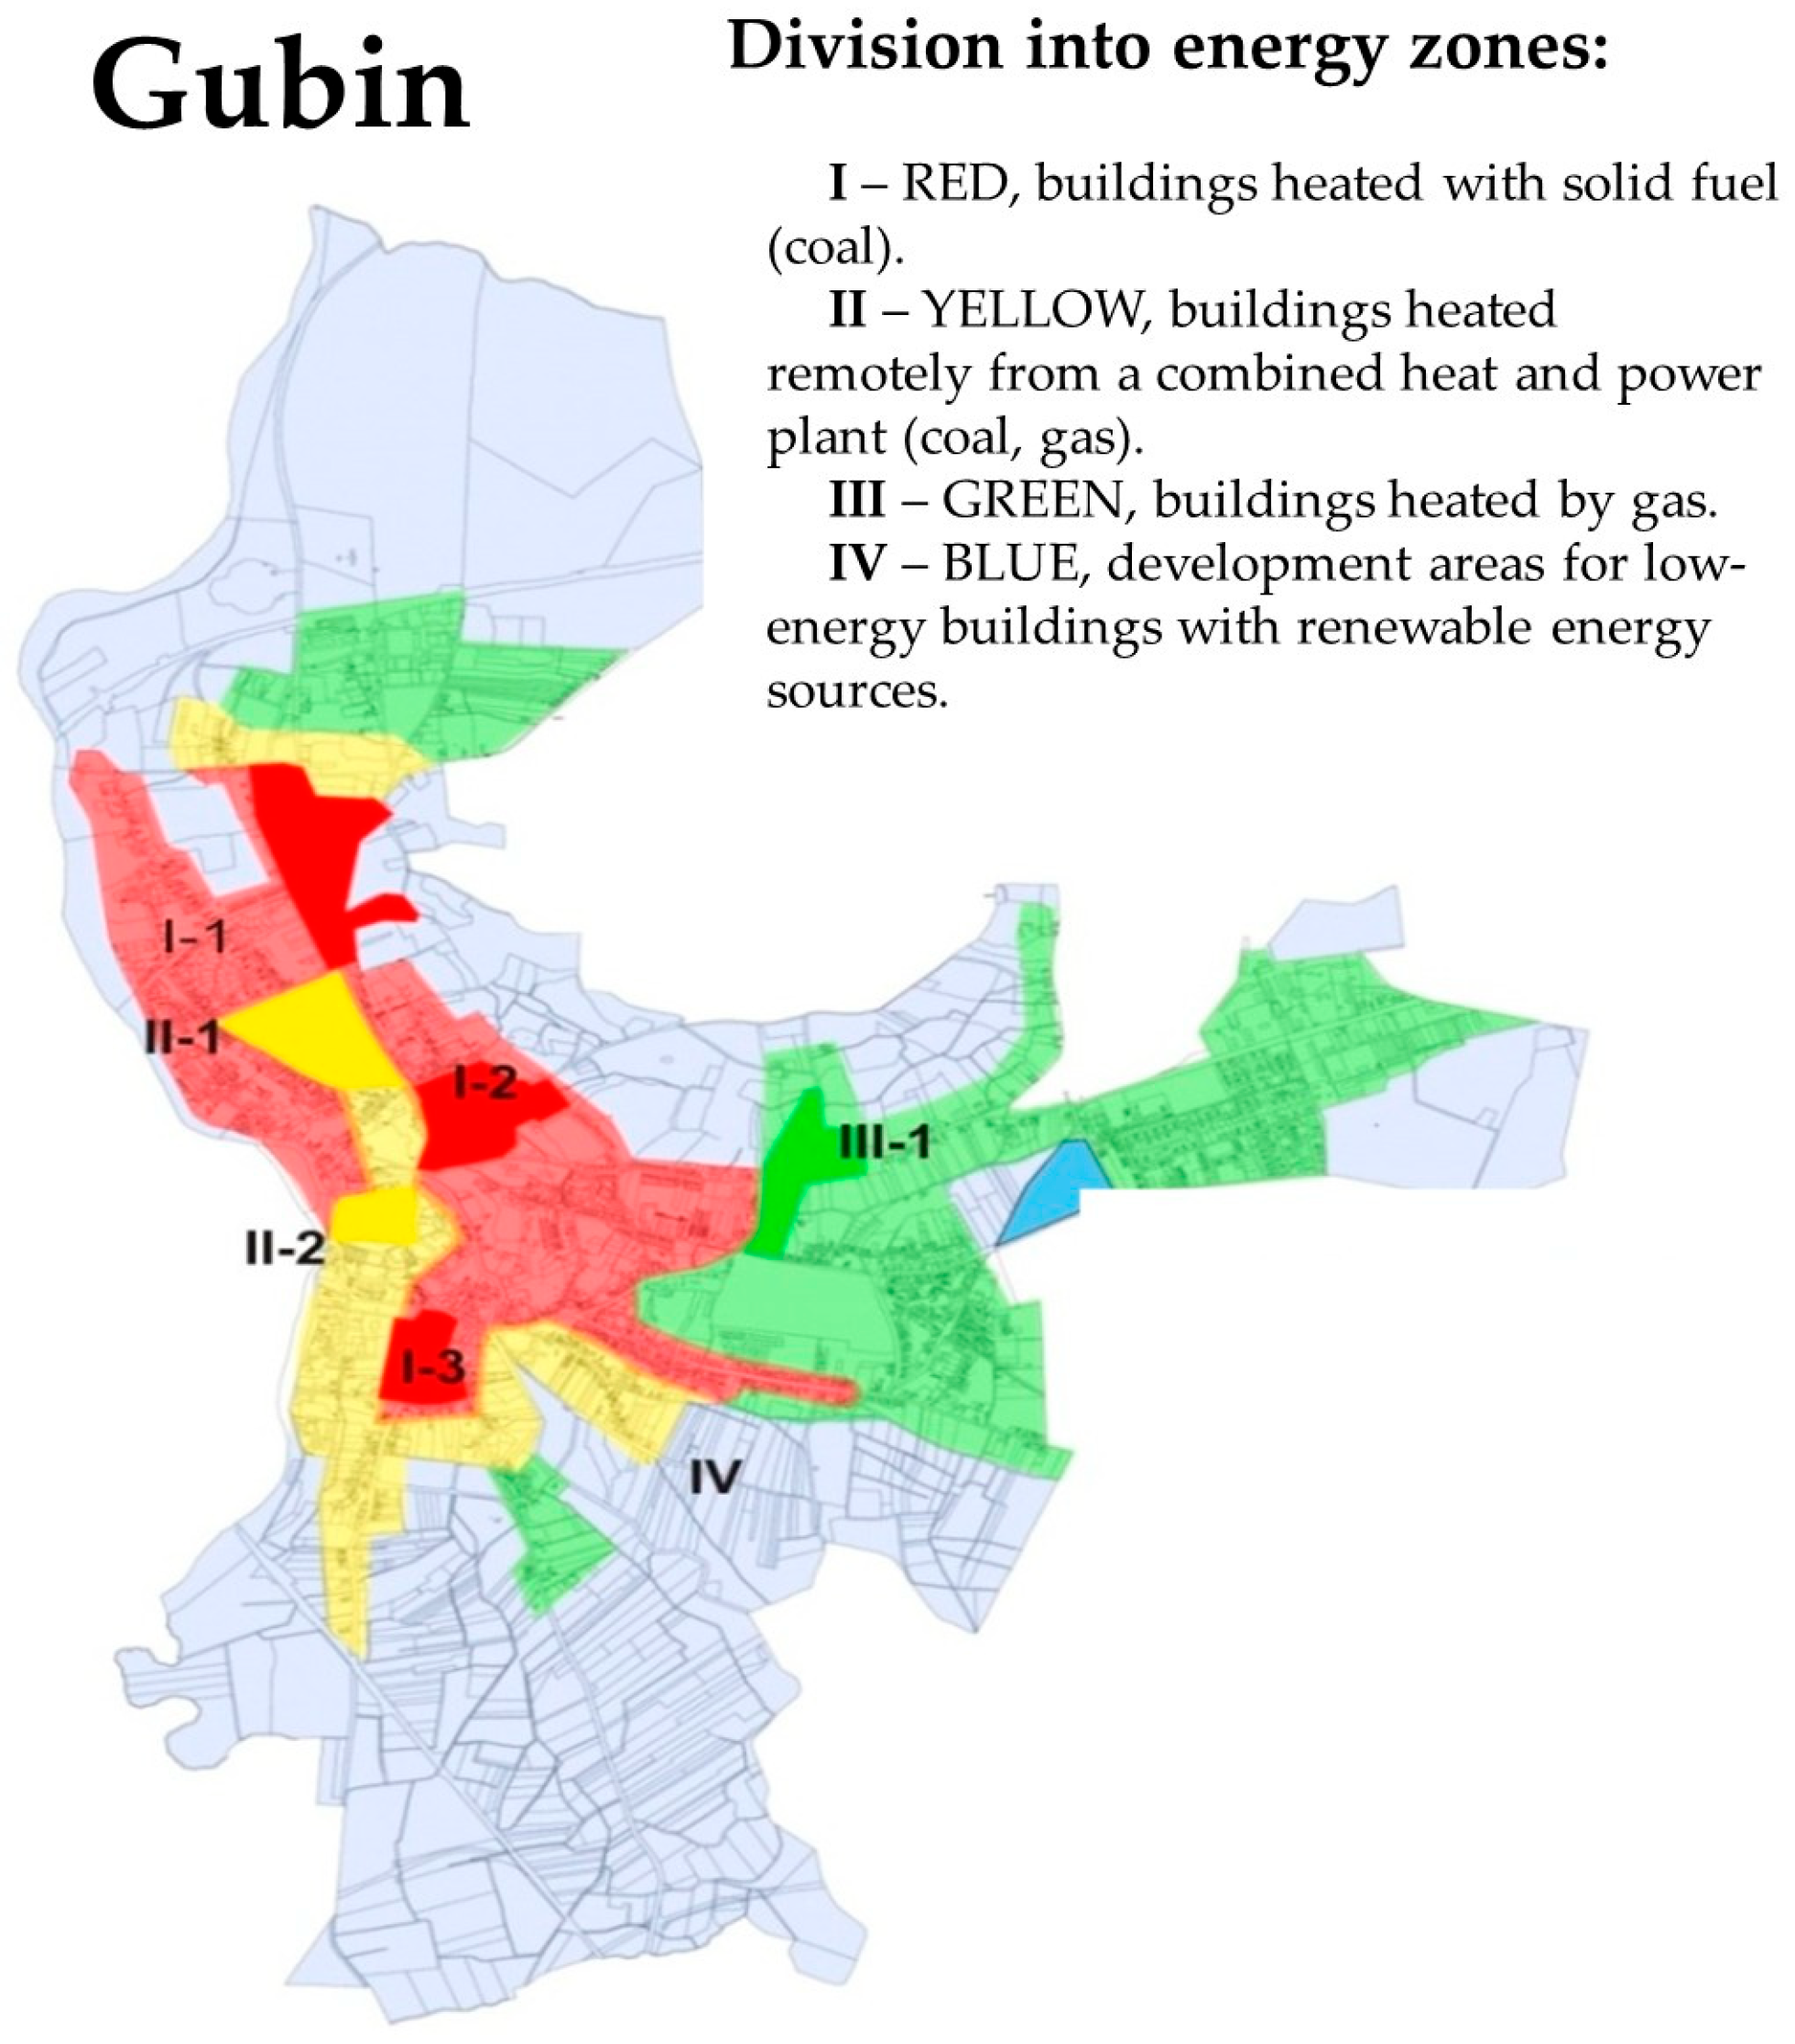
The proposed economic and environmental assessment aligns with recommendations for deep renovation policies [57]. We selected the city of Gubin, Poland (see Figure 3), as a model urban area. Gubin serves as an exemplary case study for the European green transformation, whose methodology could be adopted globally.
Previous studies have defined energy efficiency (EE) climate indicators for urban zones (j: I—red, II—yellow, and III—green) [30]. These indicators incorporate key factors: construction year, technology, heating systems, building surface parameters, operating costs, and energy consumption, and are utilized in stage V of the analysis.
The aim is to rapidly assess the economic and environmental performance of buildings on an urban scale. This is achieved by comparing the estimated value of existing buildings (WGB) with the standard replacement value (KRB) for new buildings that meet current standards. While this method, derived from real estate valuation, does not provide a detailed cost estimation (design, materials, labour, and energy certification), it allows the KST indicator to be used as a key tool for setting economic policy and investment priorities. The final step (Stage V) involves comparing the economic and technical indicators (KST and WGB) with the ecological emission indicators (EEj) across the city zones.
Based on empirical data, the built-up areas of Gubin were divided into four zones (SI–SIV) based on differences in environmental quality, which resulted from variations in technical condition, construction technology, main heat sources, and building typology. Zone SIV, which comprises low-energy buildings compliant with contemporary environmental standards, was excluded from the study.
Following the data collection, the study zones were characterized by distinct CO2 emission indicators:
  • Zone I: average emission indicator EEI = 33,899.0 MgCO2/year;
  • Zone II: average emission indicator EEII = 12,167.0 MgCO2/year;
  • Zone III: average emission indicator EEIII = 2402.0 MgCO2/year.
Emissions in each EE zone are significantly influenced by the technical condition of the buildings and the infrastructure for energy production and management (primary central heating (CO), domestic hot water (DHW), and air conditioning) [30].
The data collection and analysis efforts focused on buildings in Zones I, II, and III, which were designated as model objects for the socio-economic assessment of energy efficiency improvement.
At this stage of the study, it was assumed that residents would co-finance the thermal modernization of their own properties, supplemented by the participation of local authorities and EU subsidies [58,59]. This implementation strategy is projected to yield multiple long-term economic and environmental benefits:
  • Lower operating costs: resulting from reduced energy consumption and heating/cooling costs;
  • Lower emissions: achieved through the use of modern energy sources and improved building insulation, which can significantly reduce CO2 emissions;
  • Job creation: building modernization generates demand for skilled workers in the construction and energy sectors, supporting the local labour market.

3. Study Procedure and Results

The assessment of the urban area was structured into four distinct stages: Stage I (Inventory and Data Collection), Stage II (Determination of Technical Wear), Stage III (Valuation of Existing Buildings), and Stage IV (Economic Participation in Deep Thermal Modernization), ultimately addressing the currently required energy and technical standards.

3.1. Stage I—Data Inventory

Stage I involved collecting interdisciplinary inventory data for model buildings (R1-R6) [6] that represent specific development zones with similar typological characteristics. The gathered data encompassed construction technology, building function, year of construction, and operational costs. This information was primarily obtained through direct interviews with residents and owners.
The socio-economic data collected are essential for the fast-track thermal modernization path outlined in subsequent stages (II to V), particularly focusing on the economic, energy, and technical (EET) aspects of the ASEET methodology. Based on the inventory, a clear path for assessing the costs of energy and environmental improvement is presented (Table 1). Note that Zone IV was excluded from this stage as it comprises only low-energy buildings already compliant with contemporary environmental standards.
Therefore, in accordance with the ASEET methodology, Stage I relied on empirical data gathered through surveys [30,60]. This involved the following factors:
  • Inclusion of buildings with diverse social statuses, for which detailed technical and metric data were collected, including the year of construction, primary construction technology, type of heating system, number of stories, number of users, and total heated area ratio.
  • Designation of surveyed areas that contain buildings exhibiting similar typological characteristics.
  • Assignment of buildings to development zones based on the heat source criterion, which is directly related to the building’s emission profile [30].
The building data presented in Table 1 represent specific types used in the subsequent socio-economic assessment stages (II–IV). The analysis strategically focused on the oldest buildings within each given type.

3.2. Stage II—Technical Assessment of the Degree of Wear

The technical aspect of the ASEET assessment methodology requires calculating the degree of technical wear (Szt) for buildings based on empirical data, including construction technology, age, heating system, and building function.
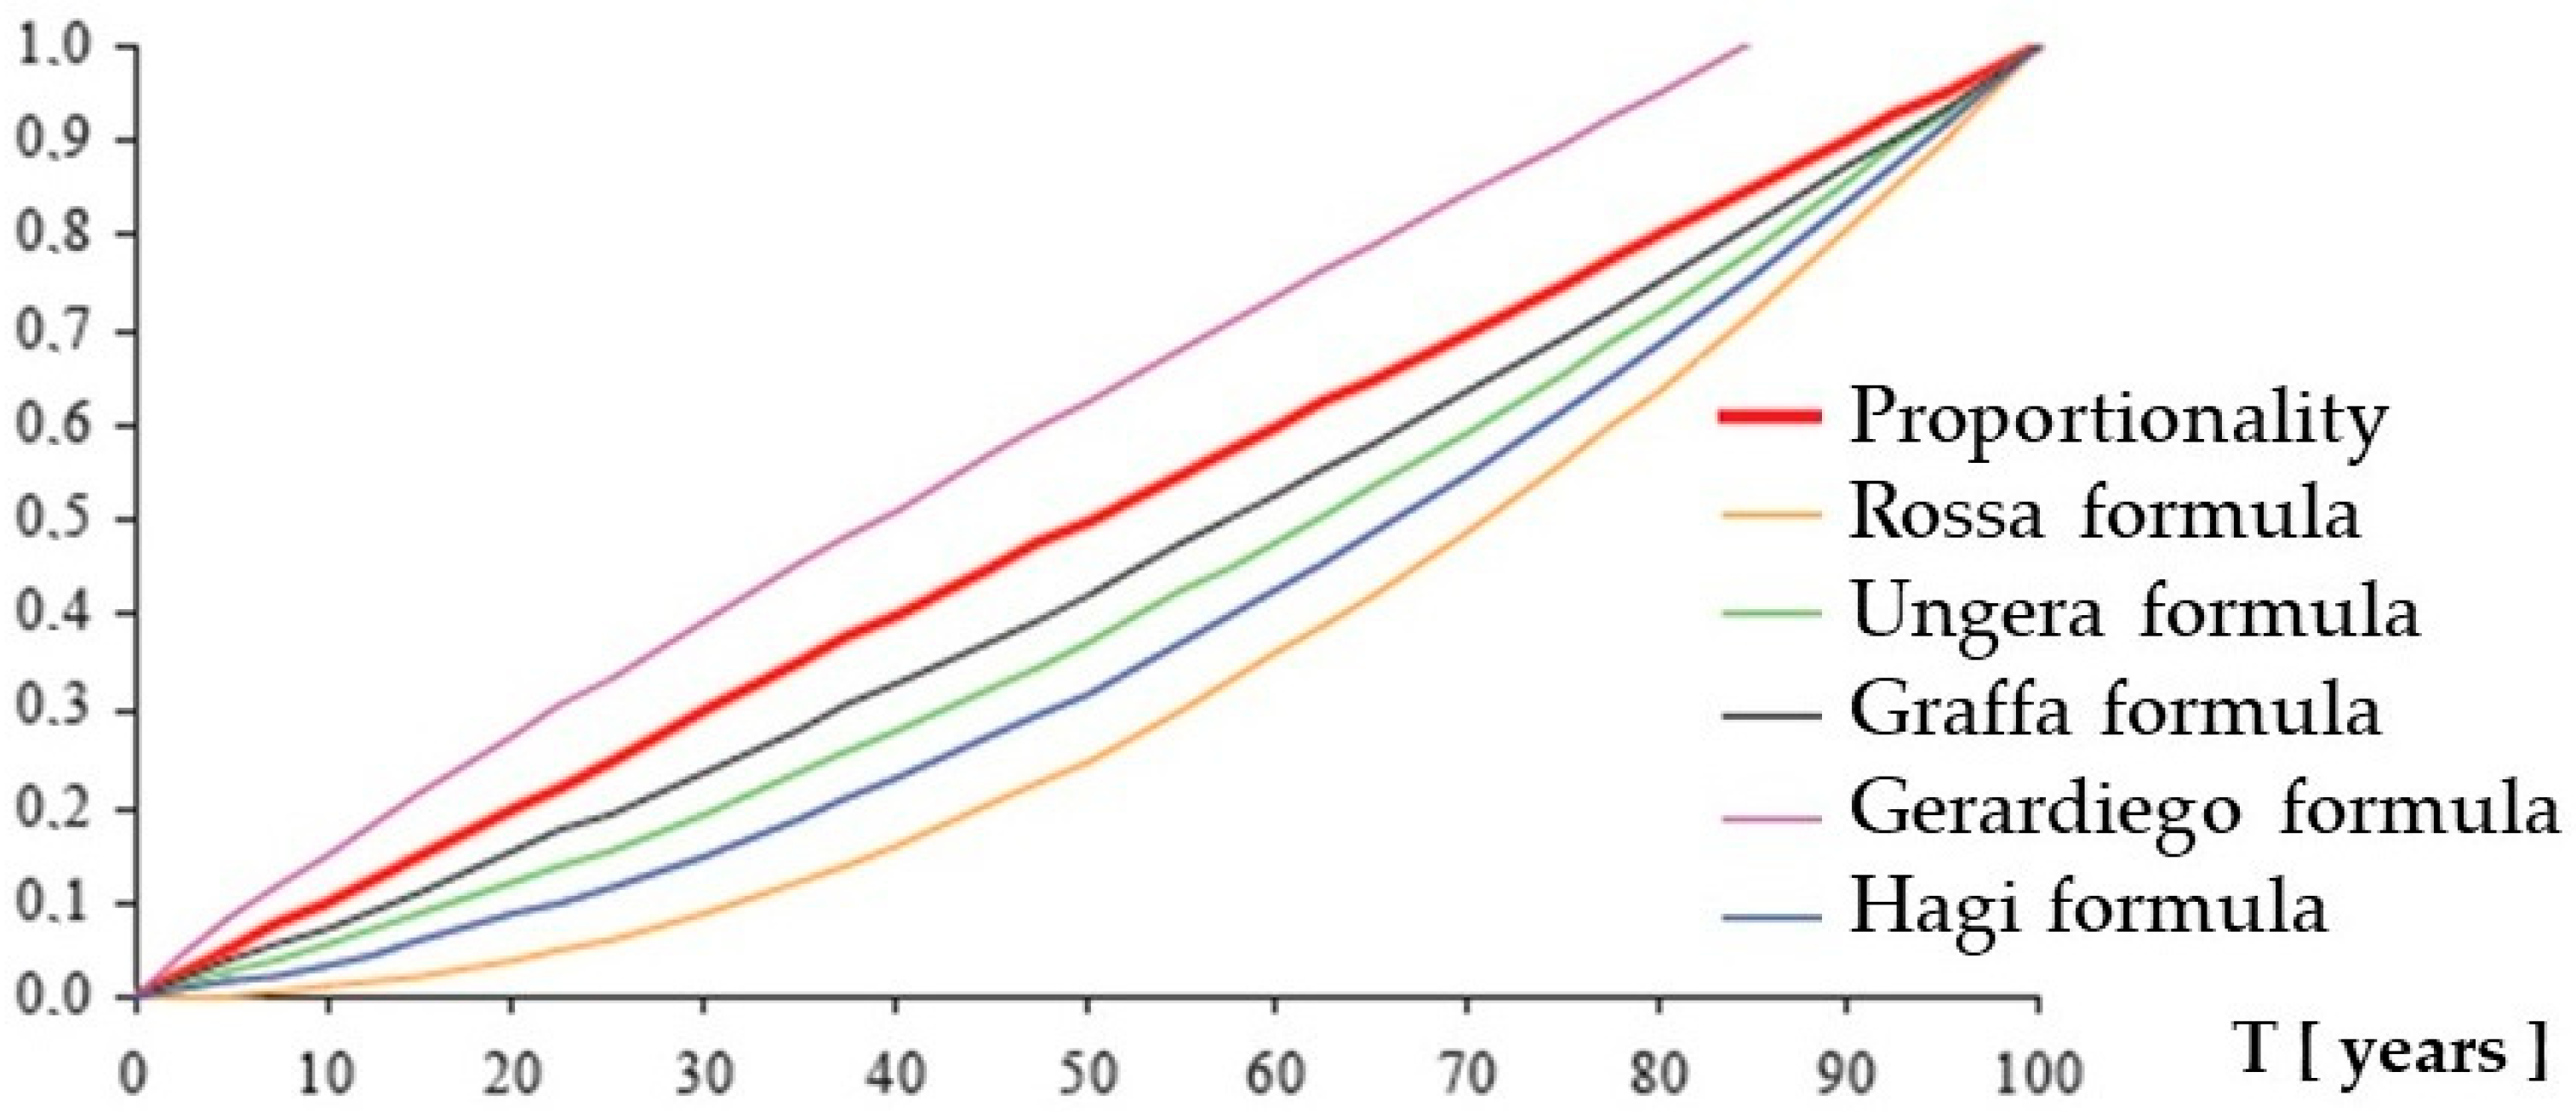
The foundation for assessing the technical condition of the analysed buildings with the lowest technical status (those located in zones I–III) is a calculation formula establishing the proportionality between the building’s age and its theoretical service life [61] as visually represented in Figure 4 (the Szt formula is detailed below).
This linear formula is specifically applied to buildings identified as being in poor technical condition, typically characterized by 50–70% technical wear (Szt). This high degradation is presumed to result from inadequate financing for regular renovations and unsystematic maintenance.
Consequently, the technical wear degree (Szt) was calculated using the following linear relationship [61]:
S z t = t T     100
where
  • Szt—degree of technical wear of the object [%];
  • t—age of the object [years];
  • T—expected service life [years], referenced in Table 2.
Table 2 presents the estimated service life (T) based on building type and construction technology, following the methodology concerning the determination of the technical wear (or degradation) degree of large-panel buildings [63].
The next step in the assessment is to calculate the combined technical and functional Degradation Factor (Wz or Wz (t,f)) [64].
This coefficient was initially calculated using the following formula:
W z t , f = 1 ( S z t × S z f ) 100
where
  • WZ(t,f)—combined technical and functional Degradation Factor [%];
  • Szt—degree of technical wear [%];
  • Szf—degree of functional wear [%].
The analysed residential buildings largely fail to meet the requirements set by the Technical Conditions and contemporary resident expectations. Therefore, we assumed a complete functional obsolescence, setting Szf = 100%.
Substituting this assumption into the equation, we derive the following simplifications:
W z t , f = 1   S z t 100 % × S z f 100 %   l e a d i n g   t o   W z t , f = 1 S z t 100 %   × 100 % 100 %
Based on this, the combined technical degradation factor (Wz) was ultimately calculated using the simplified linear relationship:
W z t , f = 1 S z t 100 %
where Wz(t,f) represents the combined technical and functional degradation factor.
Initially, the technical wear of buildings in Zone I was examined (Table 3). This zone comprises the oldest buildings that form the city’s old town, primarily consisting of urban tenements built before 1945 using traditional technology.
Table 3 summarizes the calculated values of the technical wear degree (Szt). The values range from 53–66%, which clearly indicates technical degradation. For planning purposes in subsequent economic analysis, the average wear index (Szt) in Zone I can be assumed to be 50%, which will undoubtedly necessitate substantial renovation costs.
The degradation factor (Wz) is an auxiliary indicator. Therefore, even if its value is less than 0.5, cofinancing for modernization costs (Kst) may still be justified by other factors, such as historical status, location, or social and environmental benefits. The primary purpose of these economic indicators is to inform urban policy decisions.
For the yellow zone (SII), the technical wear coefficients are summarized in Table 4. This zone is characterized by monotype multi-family block flats or multi-family segmented buildings, typically reaching 3–5 stories in height.
Multi-family buildings constructed using the Żerań system were among the first in Poland to be built on a large scale during the 1960s and 1970s. Their estimated technical wear degree (Szt) is relatively low, ranging from 33 to 41%, which positively influences the economic viability of adapting these buildings to contemporary energy requirements.
Buildings located in Zone III are supplied with natural gas and include structures of varying technology and age, ranging from pre-war (before 1945) to contemporary, as summarized in Table 5.
A characteristic feature of these buildings is their better technical condition, resulting from more frequent renovations and adaptations, as well as the inclusion of structures constructed using modern technologies, such as passive buildings. The measured technical wear degree (Szt) exhibits a wide range, from 13 to 66%, depending on the specific type. This broad range requires an individualized approach when setting investment and environmental priorities.

3.3. Stage III and IV—Determination of Existing Building Value and Deep Thermal Renovation Costs

The technical condition of the buildings, as determined in Stage II, serves as the initial basis for assessing their economic value in the urban areas studied. These steps present the valuation of buildings in their existing condition (Stage III) and after adaptation to WT (2024) requirements (Stage 4) [2]. Knowing a building’s value in its adapted condition allows us to determine the required level of economic participation for existing structures.
The authors’ goal was to adopt a method for economic and environmental assessment suitable for an urban scale. The chosen approach involves calculating the estimated value of existing buildings (WGB) and comparing it with the standard replacement value (KRB) of new buildings that comply with current standards. This method, rooted in real estate valuations, is used for macro-level assessment and does not constitute a detailed, design-specific cost estimation based on a procedure of design–technology–materials–labour, audit, and energy certification.
Conversely, the economic indicator for thermal modernization, KST (Modernization cost), can be used as a tool for economic policy when setting investment priorities across the city. Furthermore, the economic and technical indicators (KST and WGB) can be compared with the ecological emission indicator (EEj) for buildings in different zones, facilitating the creation of an environmental intervention map for the city.
Based on regulation [65], the replacement cost method was adopted pursuant to §3, p. 4. The results obtained via the index method are subsequently used to calculate the consumption costs of the facility as the initial state for the analysis, thereby determining the technical conditions, i.e., the wear of the building [66].
The methodology employed in this section, specifically the estimation of replacement costs using the index method, was guided by the methodological framework established by WACETOB and substantiated by pertinent external sources [67].
According to these principles, the technical wear of a building is understood as the depreciation of its value relative to the cost of constructing an equivalent new structure. In the process of determining the replacement value of buildings [68], the following calculation steps were adopted:
  • Step 1—Determining the Replacement Cost of the Building (KRB)
This step involves calculating the cost required to restore the building to its original condition, which simultaneously means adapting the structure to current technical and energy requirements, including the primary energy (EP) standard. This cost encompasses all necessary construction works and technical equipment. The calculation for the restoration cost, or standard replacement value (KRB), is given as follows:
K R B = Q × C j q
where
  • KRB—costs of restoring the building [PLN];
  • Q—number of reference units, defined as the AUH of heated usable floor space [m2] (assumed for this study) or VH of cubic capacity [m3];
  • Cjq—unit price index for a comparable facility. The unit price was adopted based on data from the Central Statistical Office (GUS) [68] as the average price index per 1 m2 of usable floor space in the fourth quarter of 2024, which is 1788.14 USD/m2 (7162 PLN/m2, as of Q4 2024, using an exchange rate of 4.0 PLN per 1 USD).
  • Step 2—Calculation of the Value of the Existing Building (WGB)
The replacement value of existing buildings, calculated using the cost approach (replacement cost method, index method, and coefficient method), is determined by the following formula:
W G B = K R B × W z ( t , f )
where
  • WGB—replacement value of the building in its current condition;
  • KRB—value of a new ‘replica’ building;
  • Wz(t,f)—the combined technical and functional degradation factor.
Based on the simplified degradation factor (as derived in Equation (4)), the replacement value is thus obtained from the following formula:
W G B = K R B × [ 1 S z t 100 % ]
The WGB value is an estimated value used for property valuation purposes and is adopted in these studies as a quantitative indicator on an urban scale.
  • Step 3—Calculation of the Estimated Modernization Cost KST
The cost required to achieve the KST energy standard can be calculated using the difference between the standardized replacement value and the existing value:
K S T = K R B W G B [ U S D ]
This socio-economic assessment uses this formula to estimate the necessary costs of thermal modernization, derived from the difference between the value of a new building KRB that meets current requirements (according to WT (2024)) and the value of the existing building WGB. This assumption allows for the strategic estimation of energy efficiency improvement costs across the study area.
In this research step, a parametric analysis is conducted to demonstrate the economic relationship between the technical condition and energy consumption of the buildings studied [30], thus indicating the economic potential for upgrading their standards. This socio-economic assessment does not exhaust the subject but serves as a crucial foundation for subsequent research on the long-term valuation of energy and climate benefits.
The economic indicators—KRB (cost of a new building), WGB (cost of an existing building), and KST (cost of thermal modernization to the current WT (2024) energy standard)—are presented in Table 6, Table 7 and Table 8.
  • Zone I—the historic center of the city (Old Town area)
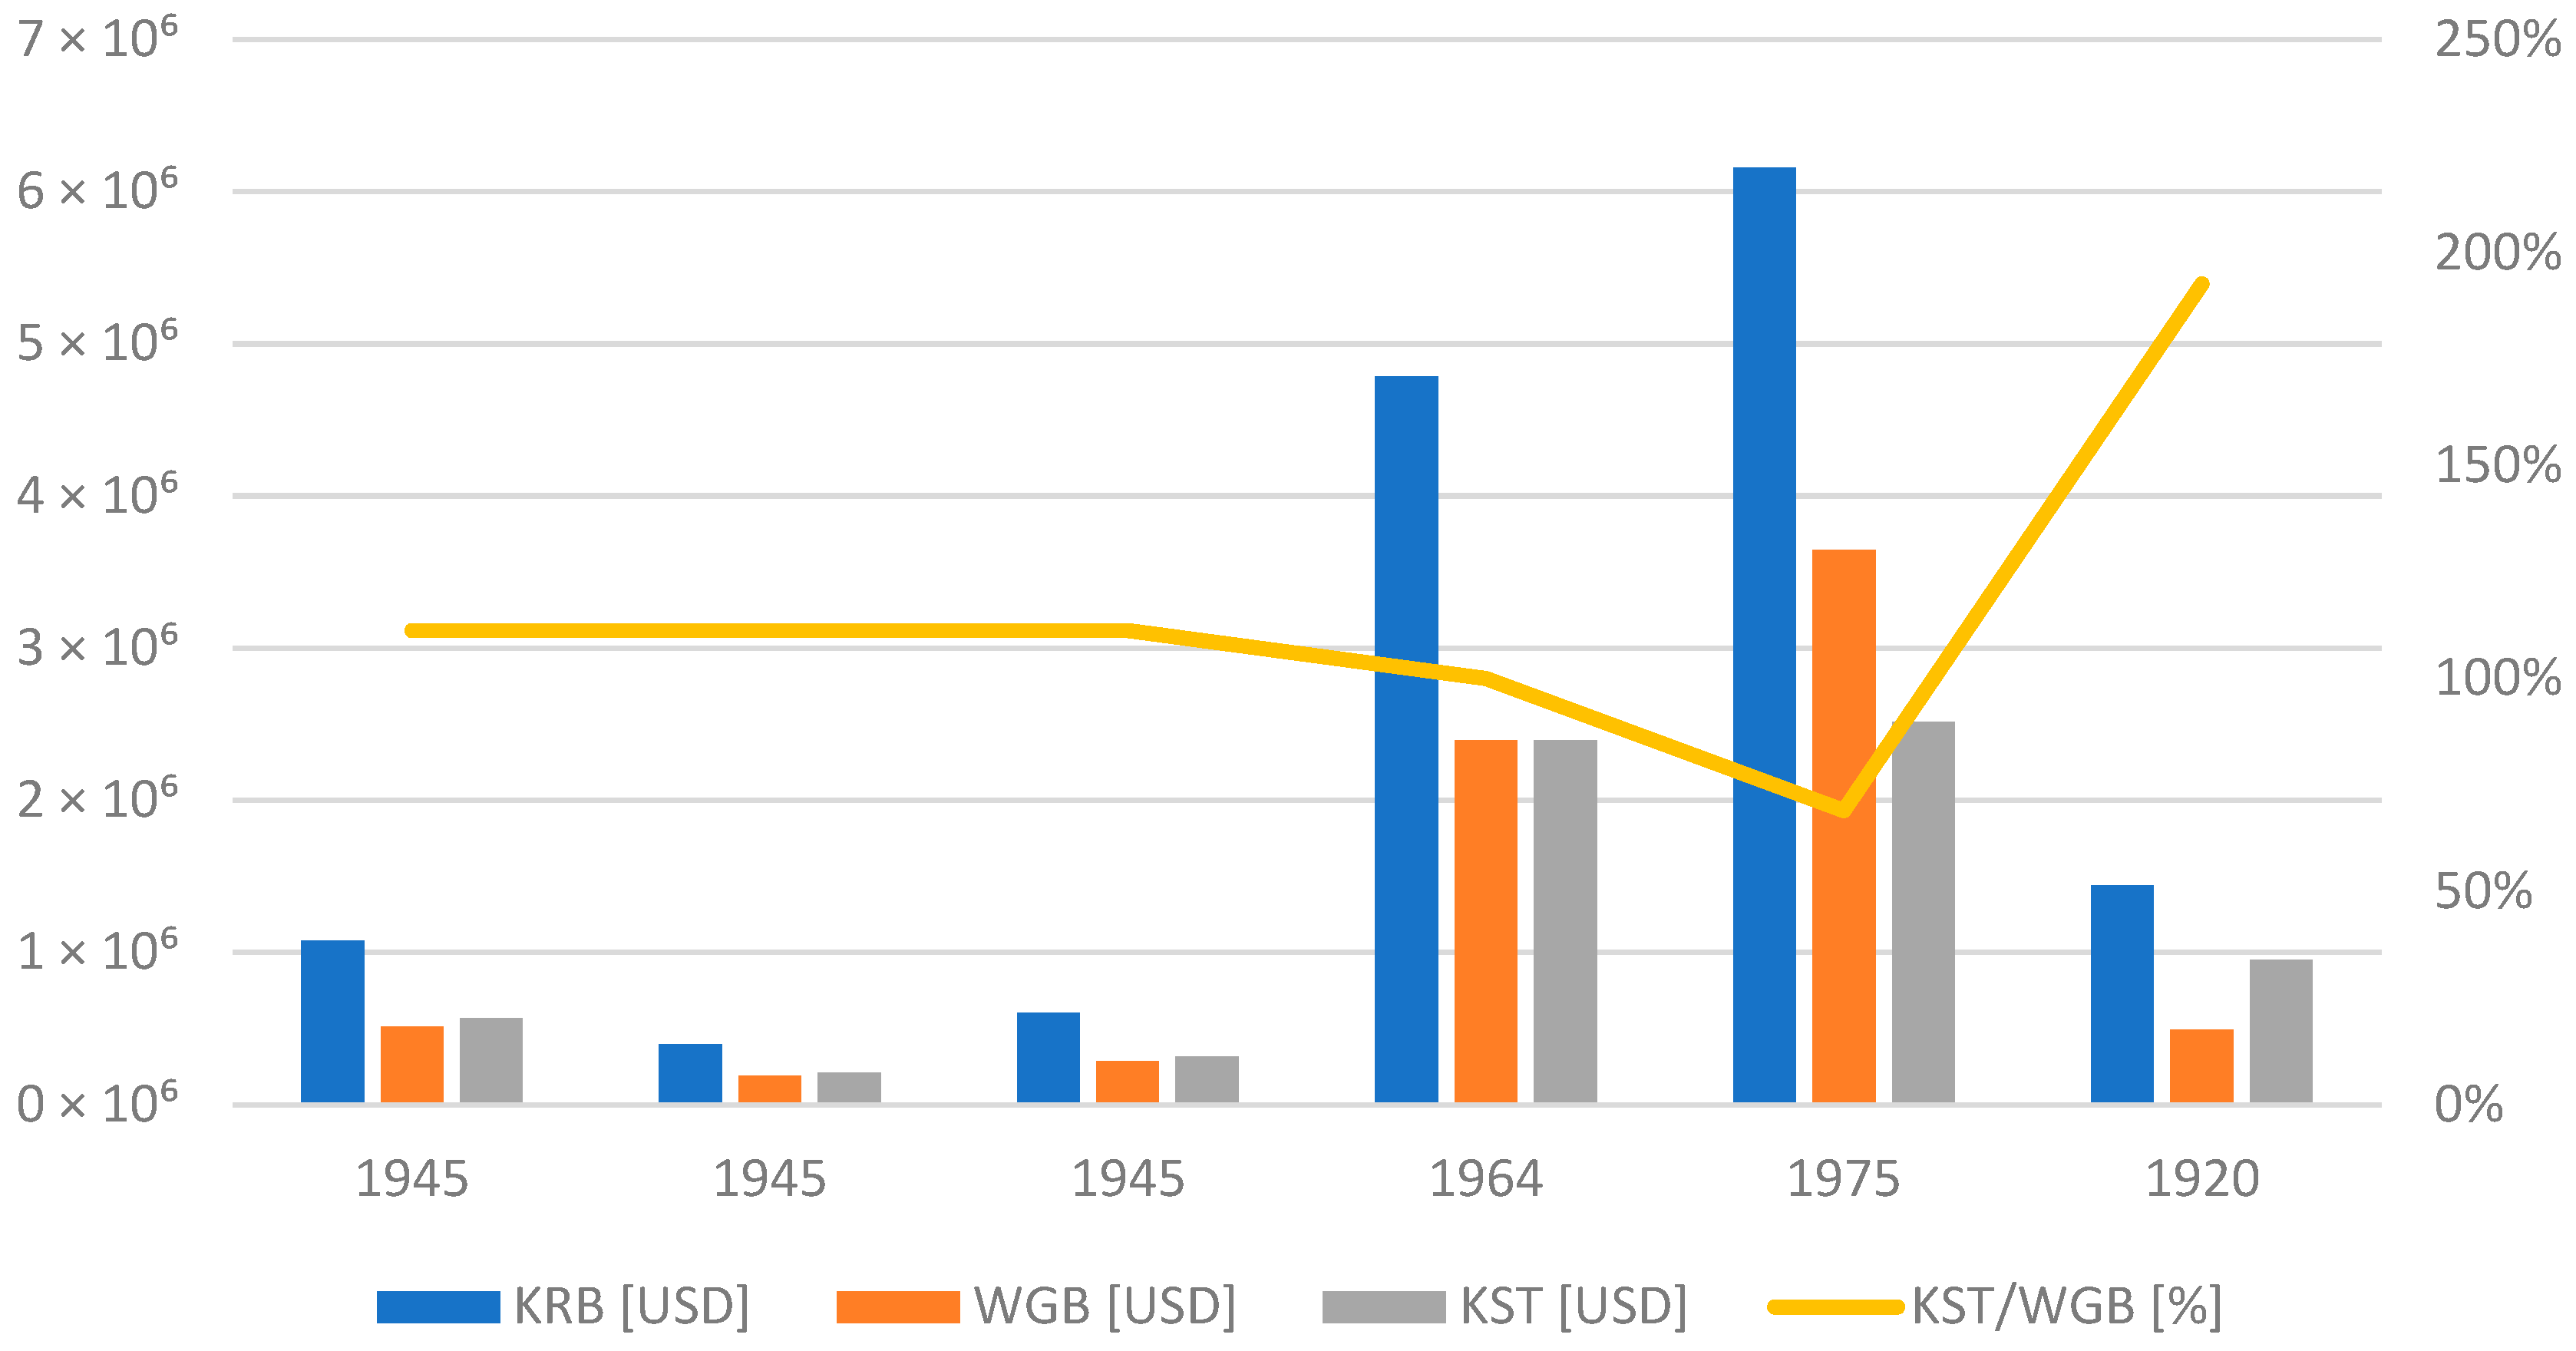
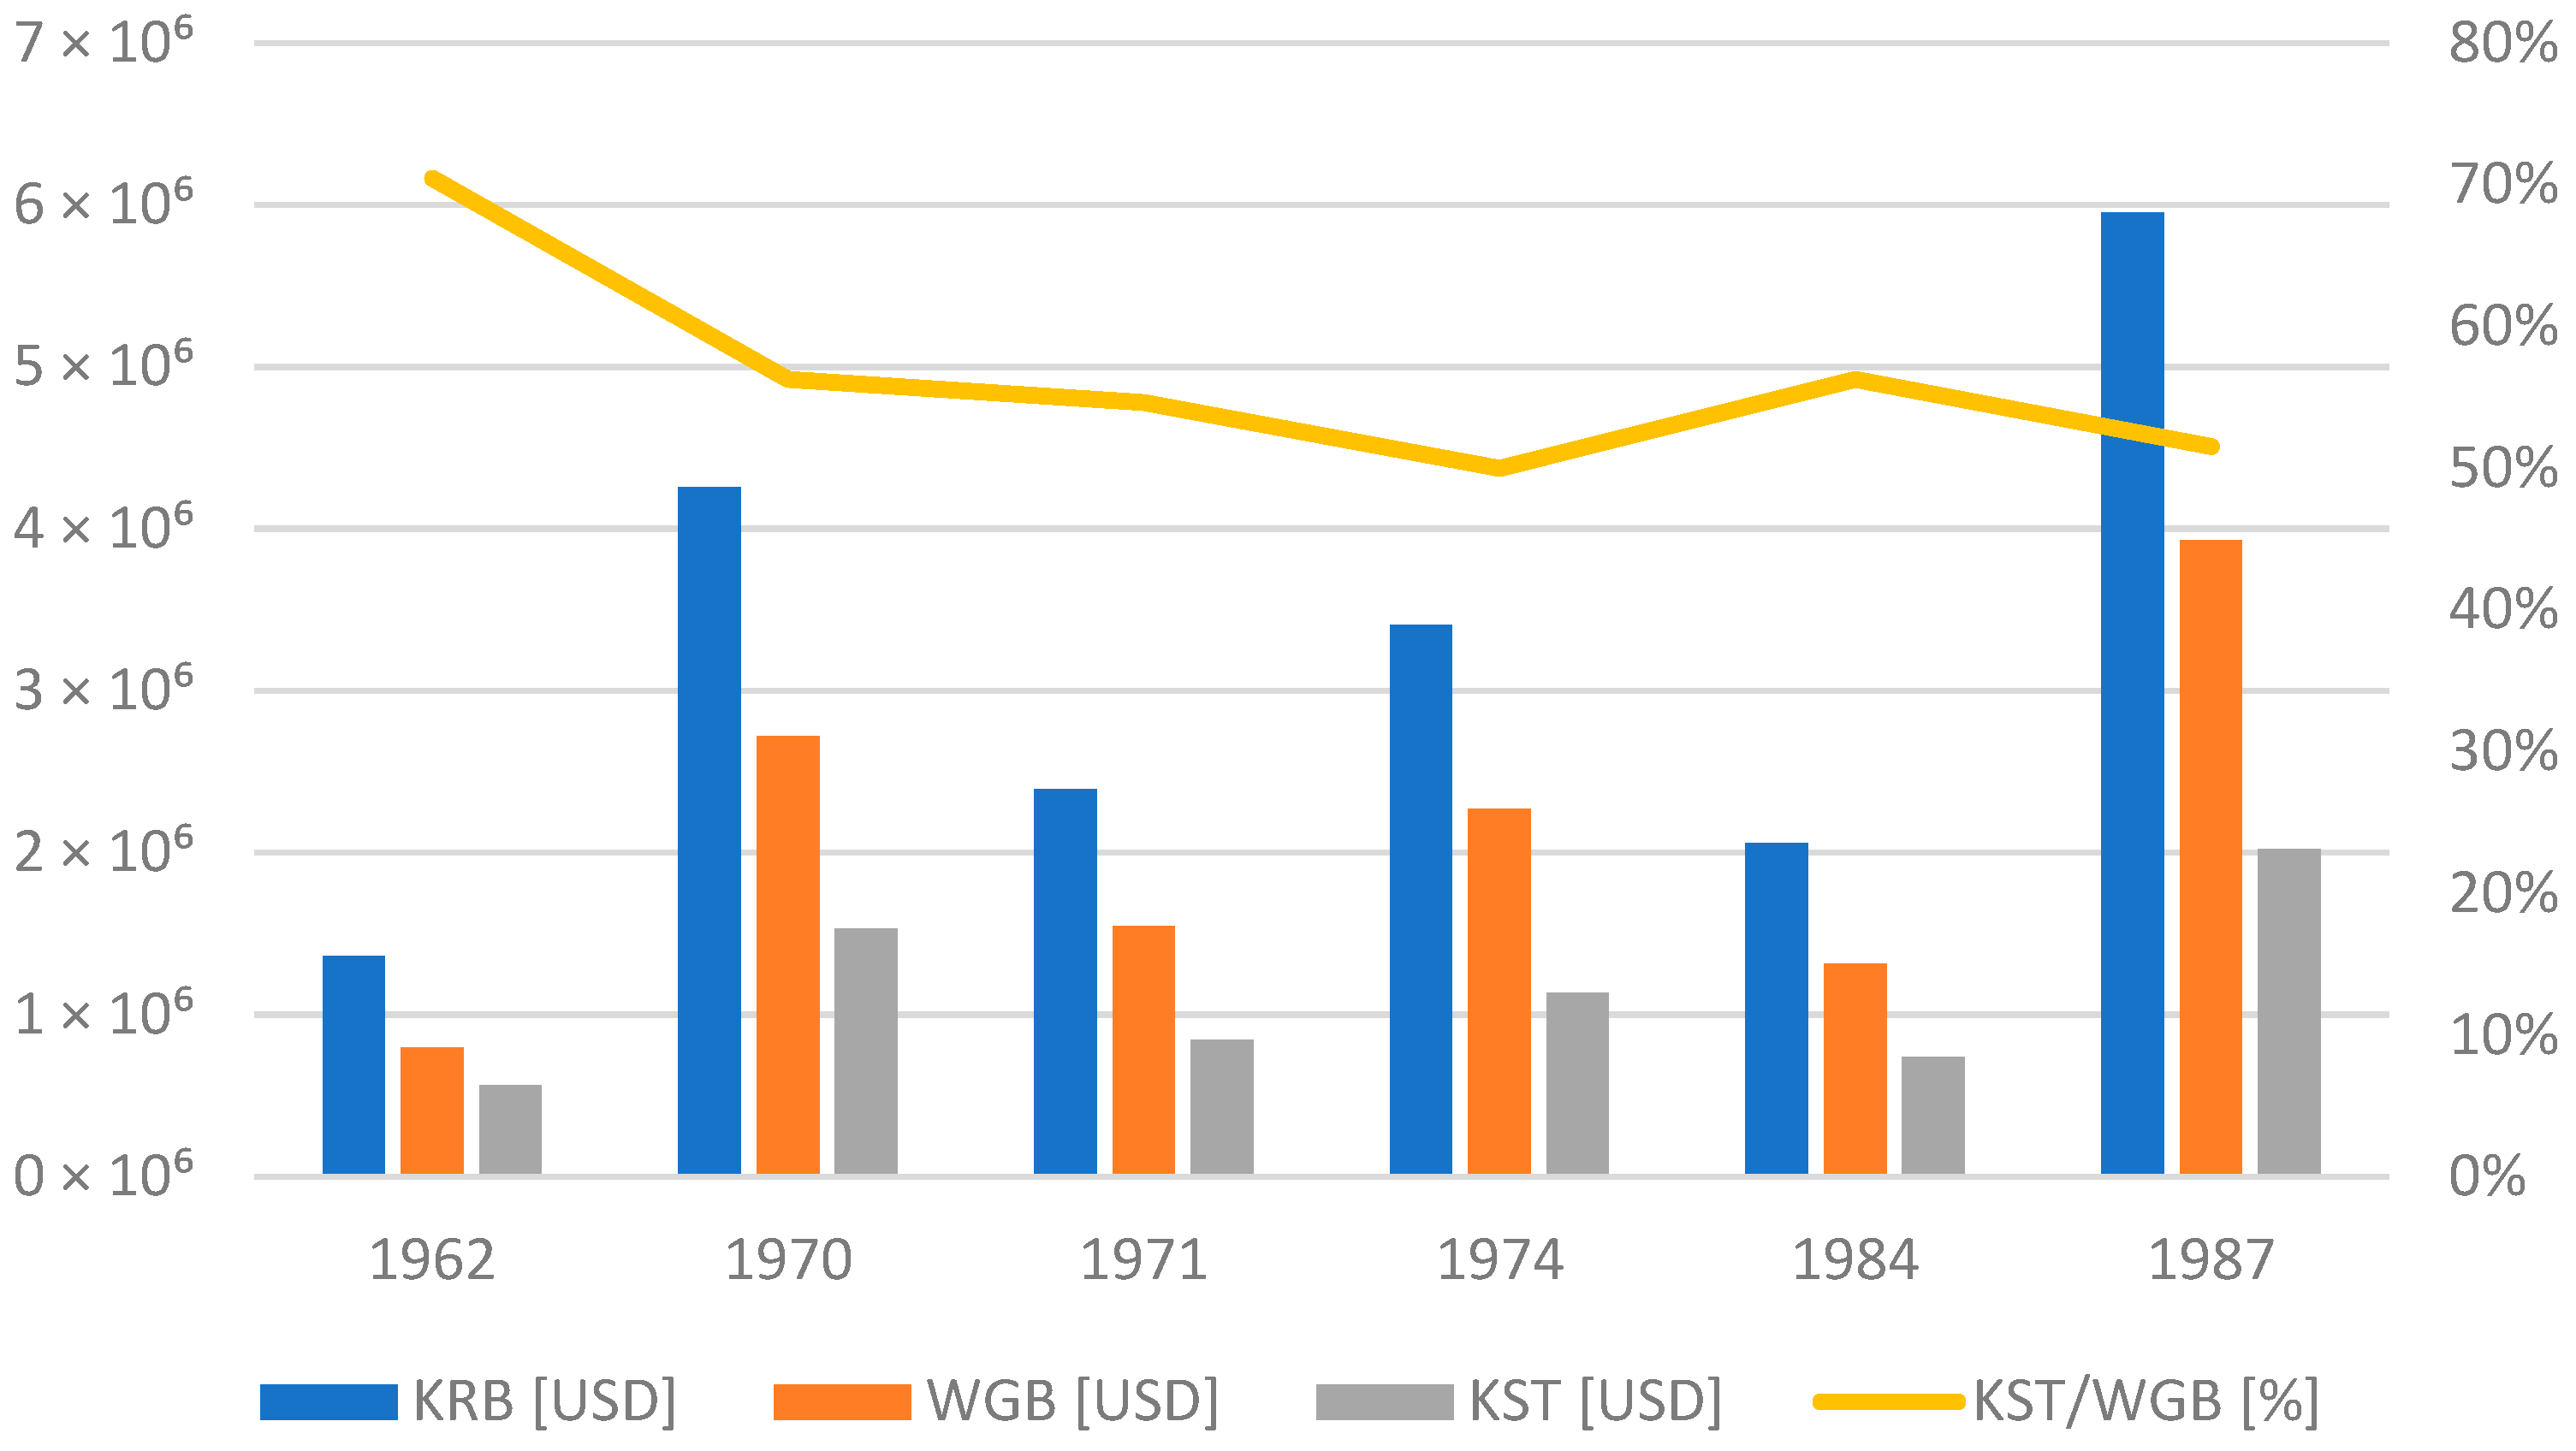
For buildings in Zone I, as illustrated in Figure 5 (and detailed in Table 6), the average KST/WGB ratio is greater than 100%. This ratio indicates that the costs of adopting the building to the KST standard exceed the discounted value of the existing property (WGB). Consequently, in such cases, demolition or full reconstruction should be strongly considered.
Conversely, thermal modernization is economically justified for buildings where the KST/WGB ratio is below 100%, as the costs of raising the KST standard are lower than the discounted value of the building. Furthermore, for buildings where the technical degradation factor (Wz) is near 0.5, thermal modernization may also be an alternative solution to increase the energy standard above class G, provided the KST costs remain below the building’s value. This comparative economic approach is crucial for planning municipal expenditure on improving the energy efficiency of built-up areas.
Buildings in Zone I are among the oldest in the city, with most constructed prior to 1945. Their technical degradation factor (Wz) ranges from 0.34 to 0.59, a clear consequence of their age and construction technology. This range places the analysed buildings in a critical decision space, balanced between options for demolition, major renovation, and thermal modernization.
Crucially, for these structures, the ratio of investment costs to achieve the KST energy standard (KST/WGB) ranges from 111% to 193% of the existing building’s value. In contrast, younger buildings with similar technologies exhibit a significantly smaller share of KST costs, at only 69% of the base value.
  • Zone II—buildings supplied from a central heating plant, primarily utilizing large-panel construction technology
In Zone II, a representative sample housing estate composed of multi-family buildings constructed using the prefabricated WK-70 large-panel technology was selected.
It is important to note the existence of many other construction systems originating in Poland in the 1960s. The mass production of prefabricated elements in systems such as Wk-70, WUF-T 67, OWT-75, WWT-69, the Szczecin System, and others [69,70,71] was widespread between the 1960s and 1980s, primarily in industrial cities. Currently, this type of building construction is beginning to reemerge after a long hiatus, as presented in Table 7.
In Zone II, as shown in Figure 6, the majority of the analysed buildings exhibit a technical degradation factor (Wz) between 0.59 and 0.67, which indicates a good potential for improving energy efficiency. Prefabricated buildings utilizing large-panel technologies are the most widespread type of multi-family housing in Poland and many other Eastern European countries. Notably, between 2000 and 2012, many of these buildings underwent an initial phase of thermal modernization. However, these older modernizations often no longer meet current energy requirements and necessitate further investment. The subsequent comparative analyses will assess the economic value of selected variants for these necessary thermal modernization projects.
For multi-family residential buildings in the Żerań and W-70 large-panel systems, the share of costs for adaptation to the KST/WGB ratio energy standard, in accordance with the WT (2024) technical conditions, is distributed at a level of 52–70% of the existing building’s value (WGB). This percentage represents the required level of additional investment that will translate into significant long-term economic and environmental benefits for residents over the building’s remaining service life.
  • Zone III—buildings supplied with natural gas, comprising structures of various technologies and ages
Among the surveyed buildings supplied with natural gas, we can distinguish between older structures built with traditional technologies, which typically exhibit a higher technical standard, and those recently constructed in accordance with contemporary energy standards (Table 8).
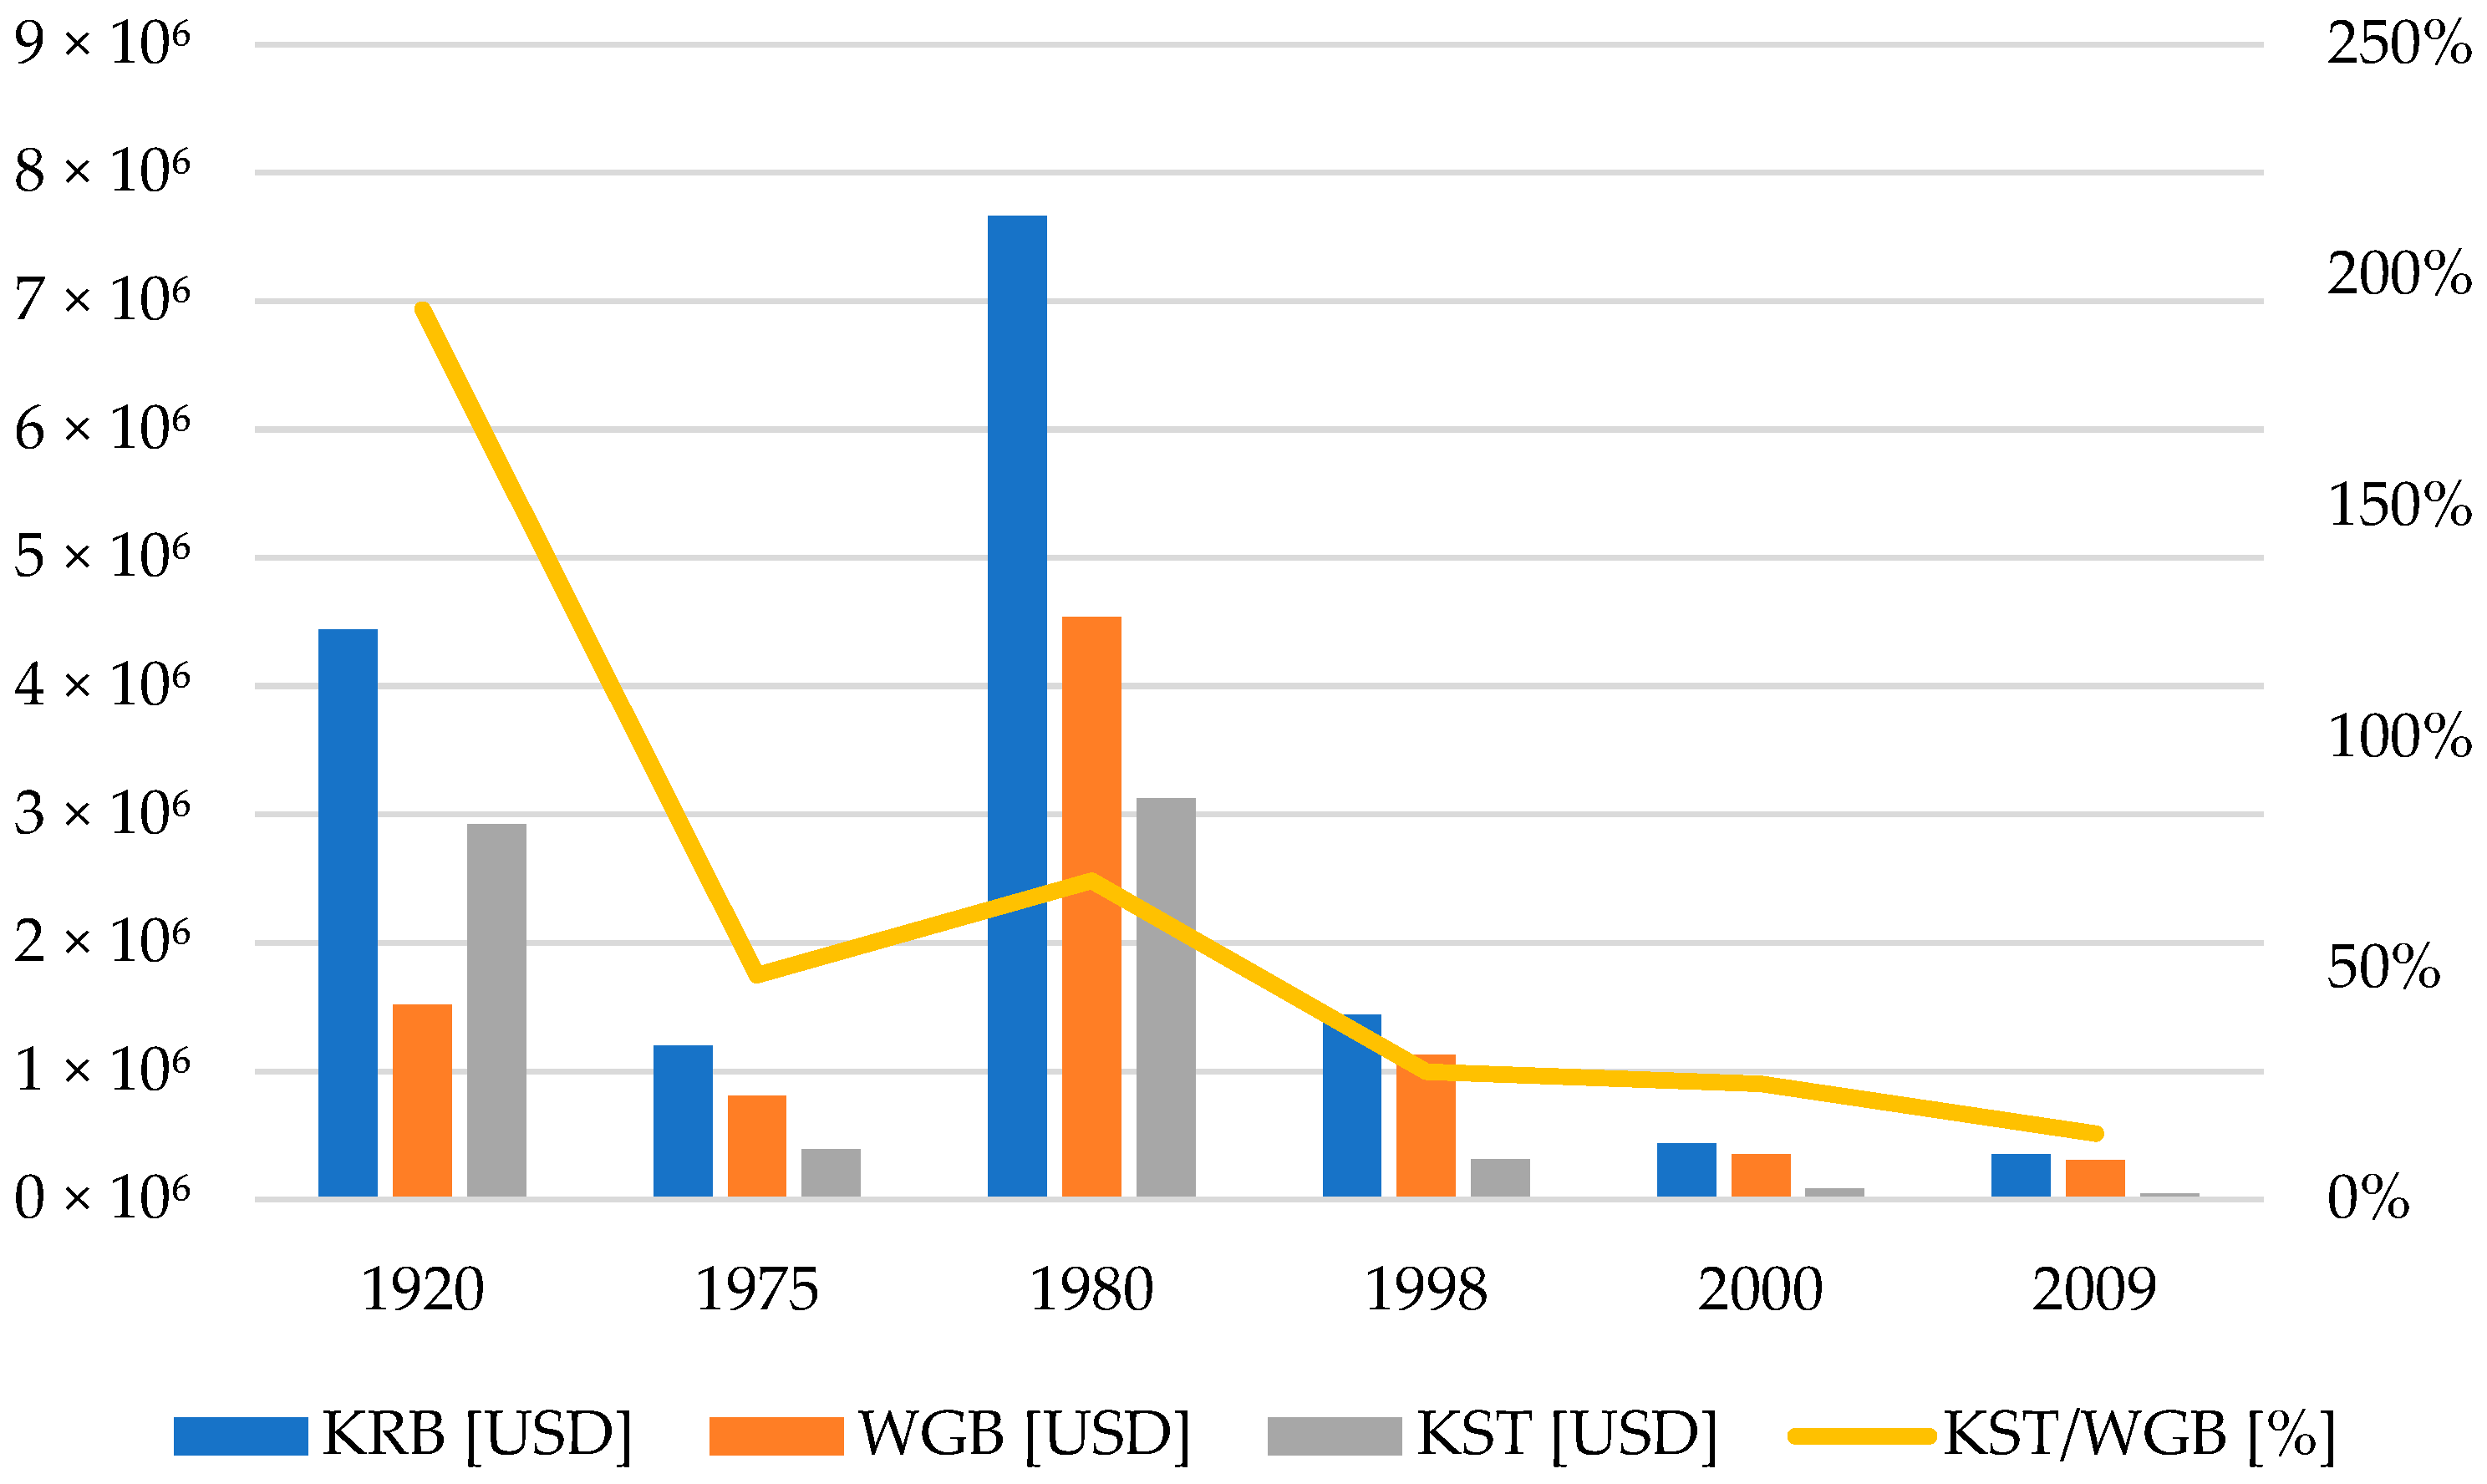
These buildings also exhibit the highest technical degradation factors (Wz), averaging above 0.5 and ranging from 0.34 to 0.88. This high Wz range indicates a good investment potential for improving their energy efficiency. The general trend shows that newer buildings possess greater potential, meaning the costs of energy improvement are proportionally lower (see Figure 7).
Research indicates that the percentage share of costs required to adapt buildings to the new energy requirements (KST/WGB) in the zones exhibiting better technical standards is directly correlated with building age. Specifically, the ratio is highest for the oldest structures, reaching 193.0% for buildings constructed before 1945, but drops to less than 14% of the existing building’s value for structures built after 2009.

4. Discussion

In accordance with the research process in Figure 2, Stage V of the study focused on a cost–benefit analysis (CBA) of the environmental gains resulting from the costs required to raise the energy standards of buildings.
Each of the urban development zones studied has a distinct building typology, which was examined regarding the potential economic feasibility of deep renovation [72]. This feasibility is illustrated by the KST indicators calculated for current energy standards. The benefits of thermal renovation translate into: increased property value, lower operating costs and CO2 emissions, and improved thermal and health comfort for residents.
Improving the energy efficiency of buildings directly impacts their certification class [2]. The KST costs for Zone I (red zone) primarily involve the transition from Class G to higher classes; however, achieving the B/A level may prove difficult and requires an individualized approach for each property.
When analysing environmental benefits across the urban development zones, the average CO2 emission rates resulting from primary energy (EP) consumption were used. Environmental studies show the average primary energy consumption (EPj) and carbon footprint (EEj) of buildings in urban development zones are as follows [30,60,73]:
  • Zone I: average EP of buildings (EPI) = 433.93 kWh/m2/year, CO2 emission factor (EEI) = 0.129 Mg/m2/year;
  • Zone II: average EP of buildings (EPII) = 152.8 kWh/m2/year, CO2 emission factor (EEII) = 0.048 Mg/m2/year;
  • Zone III: average EP of buildings (EPIII) = 97.79 kWh/m2/year, CO2 emission factor (EEIII) = 0.031 Mg/m2/year.
Considering the objective of improving building energy efficiency to at least Class B (current requirement EP = 70 kWh/m2/year), in accordance with the EU directives (EPBD, EED) and with support from EU economic aid funds and public acceptance and partial participation, at least two possible environmental gain scenarios can be outlined.
  • Scenario I
This scenario assumes full thermal modernization, or deep renovation, committing maximum financial resources (i.e., 100% KST) to achieve the greatest environmental gains. The resulting environmental effects for the individual zones in Scenario I are as follows:
  • Zone I: The primary energy indicator (EPI) will decrease from 433.93 to 70.00 kWh/m2/year. Correspondingly, the CO2 emission factor for the zone (EEI) will decrease from 0.1290 to 0.0208 Mg/m2/year, representing a reduction factor of 6.2 times.
  • Zone II: The primary energy indicator (EPII) will decrease from 152.8 to 70.00 kWh/m2/year. The CO2 emission factor for the zone (EEII) will decrease from 0.0480 to 0.0218 Mg/m2/year, representing a reduction factor of 2.2 times.
  • Zone III: The primary energy indicator (EPIII) will decrease from 97.79 to 70.00 kWh/m2/year. The CO2 emission factor for the zone (EEIII) will decrease from 0.0310 to 0.0221 Mg/m2/year, representing a reduction factor of 1.4 times.
  • Scenario II
This scenario assumes partial thermal modernization aimed at meeting the minimum requirements of programs that finance the energy transition of buildings. This involves achieving an energy effect corresponding to a 30–50% reduction in primary energy (EP) indicators compared to the existing state [2,4,60,73,74].
Assuming a 50% reduction in EPj for buildings across all zones (j), the resulting environmental effects are as follows:
  • Zone I: The primary energy indicator (EPI) will decrease from 433.93 to 216.96 kWh/m2/year. Consequently, the CO2 emission factor (EEI) will decrease from 0.1290 to 0.065 Mg/m2/year, achieving a reduction factor of 2 times.
  • Zone II: The primary energy indicator (EPII) will decrease from 152.8 to 76.40 kWh/m2/year. The CO2 emission factor (EEII) will decrease from 0.0480 to 0.0240 Mg/m2/year, achieving a reduction factor of 2 times.
  • Zone III: The primary energy indicator (EPIII) will decrease from 97.79 to 48.90 kWh/m2/year. The CO2 emission factor (EEIII) will decrease from 0.0310 to 0.0155 Mg/m2/year, achieving a reduction factor of 2 times.
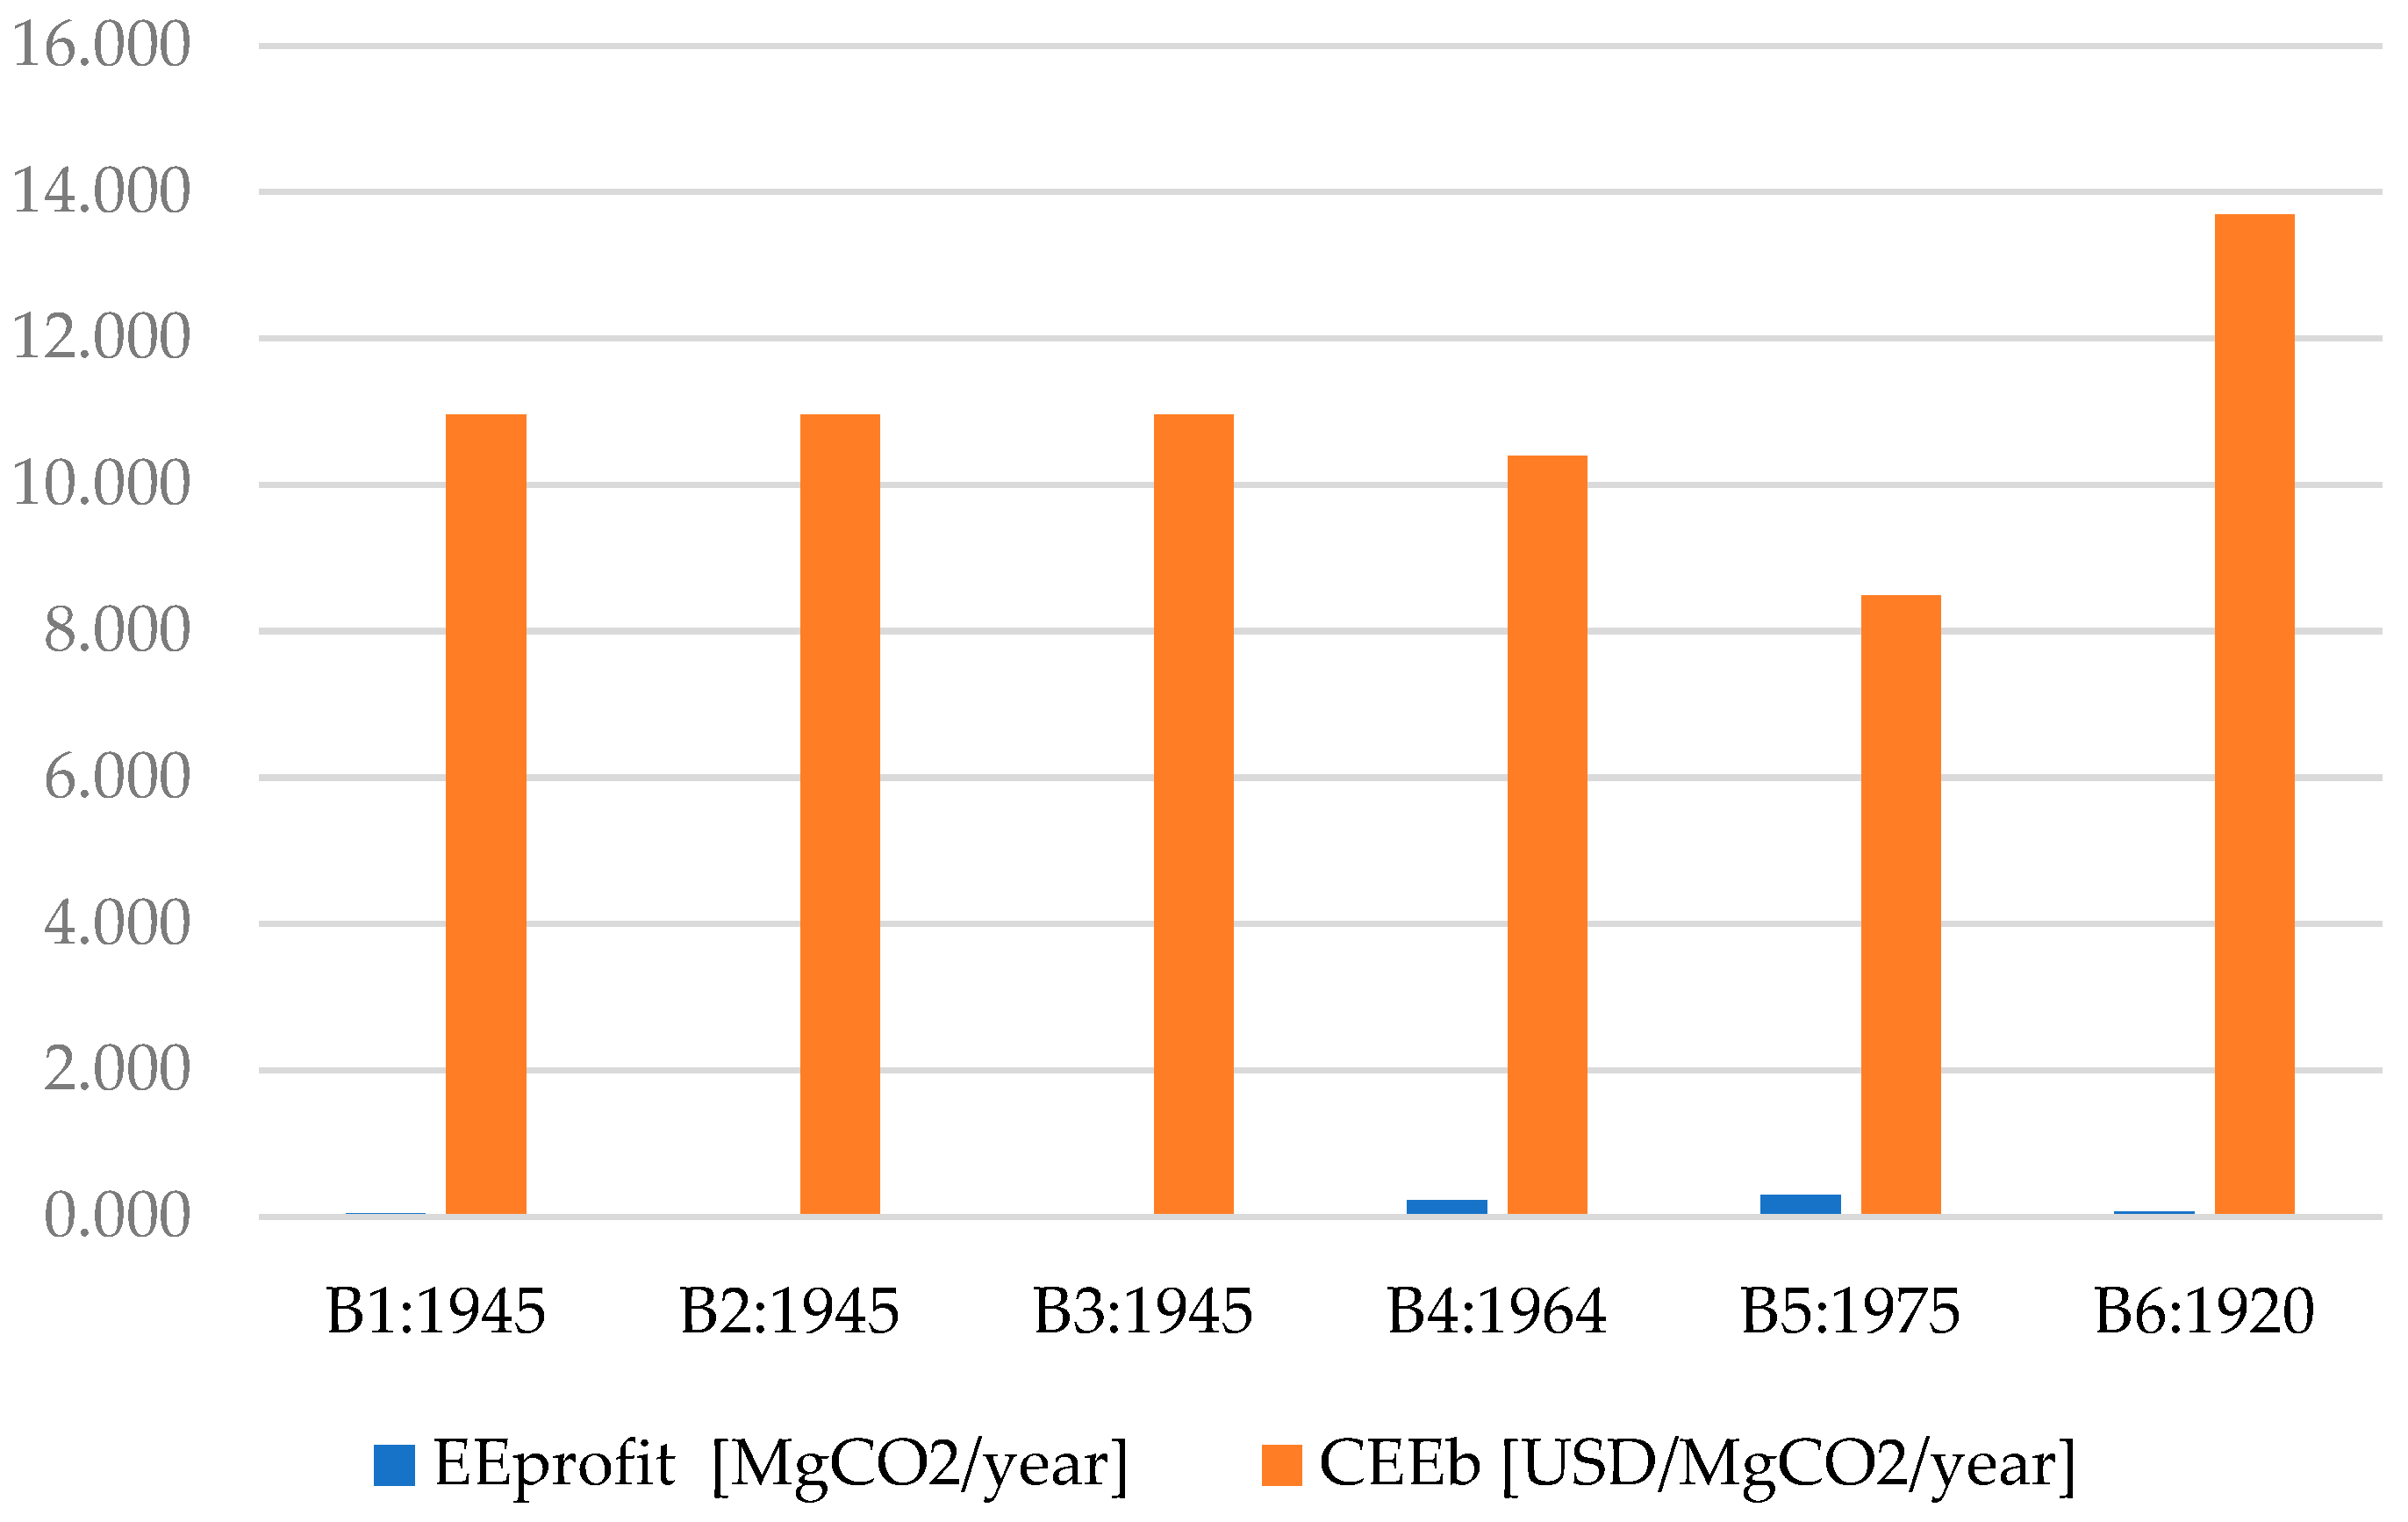
The environmental benefits resulting from the thermal modernization of buildings in urban areas can be quantitatively assessed using the simple cost-effectiveness–environmental benefit (CEEbj) indicator. This indicator compares the modernization costs KSTj with the final post-modernization emission indicators (EEbj), assuming the transition from Class G to B:
C E E b j = K s t j E E b j   [ U S D / M g / m 2 / y e a r ]
Figure 8 illustrates the optimal cost-effectiveness–environmental benefit (CEEbj) for zone j = I.
An analysis of Scenario II indicates that a significant number of buildings, particularly those in Zone I, are unlikely to meet the Class D standard (150–200 kWh/m2/year). However, the remaining buildings are expected to fall within Classes B and A.
This outcome clearly demonstrates the need for EU economic support programs to raise the energy performance threshold requirements to a minimum EP improvement of 60% for existing Class G buildings.
The environmental benefits, as quantified by the cost-effectiveness–environmental benefit (CEEbj) indicator (Figure 8), are derived from the transformation of buildings from energy Class G to Classes B and A, and in certain favourable cases, to Class A. These benefits also significantly impact the cost levels associated with CO2 emissions in urban areas. The CEEbj economic and environmental indicators can provide valuable insights to support the development of sustainable urban transformation policies [75,76,77,78]. Finally, research indicates a direct correlation between urban community economic disadvantage and the technical condition of the buildings they occupy [4,74,79,80,81].

5. Conclusions

In accordance with the ASEET assessment methodology, all procedures were successfully carried out, spanning from Stages I-II to Stages III-V of the study, as outlined in Figure 2. The key findings are summarized below:
1.
Technical Assessment (Stages I and II):
The technical wear of the buildings in the study zones (SI-SIII) was assessed, and the results are as follows:
  • Zone I: The technical wear degree (Szt) of the surveyed buildings ranged from 53% to 66%, placing these structures in the category requiring the highest proportional renovation costs.
  • Zone II: The Szt indicators ranged from 33% to 41%. This range is significantly more favourable for renovation than Zone I, thus greatly increasing the cost-effectiveness of thermal modernization projects.
  • Zone III: The Szt for surveyed buildings was assessed across a broad range, from 13% to 66%, depending on the building type. Such a wide technical variation mandates an individualized approach when considering investment and environmental priorities.
Based on the Szt results, the technical degradation factors (Wz) for the zones were calculated, which are essential inputs for determining the economic indicators of urban development.
2.
Economic Assessment (Stages III and IV):
The modernization cost (KST) economic indicators were calculated for building thermal modernization based on the determined data (KRB and WGB). The KST indicators, combined with the Wz factors, provide a clear analytical picture of thermal modernization costs:
  • Zone I: Average KST costs for thermal modernization exceed 100% of the value of existing buildings (WGB), suggesting that demolition or reconstruction should be considered.
  • Zone II: Average KST costs range from 50% to 60% of the WGB, indicating strong economic justification for deep renovation.
  • Zone III: Average KST costs range from 10% to 50% of the WGB, depending on the construction date. This zone generally possesses the best technical infrastructure.
3.
Environmental Assessment (Stage V):
An assessment of the impact of thermal modernization on the urban environment was conducted by comparing KST costs with the resulting emission reduction limits (EEj). Two potential environmental scenarios were analysed:
  • Scenario I (deep renovation): Assumes the use of 100% KST funds for deep thermal modernization, achieving the maximum environmental impact (a transition from Class G to Class B). For Zone I, this effect results in at least a six-fold reduction in EEI emissions.
  • Scenario II (partial renovation): Assumes KST costs are adjusted to meet minimum requirements (a 30–50% reduction in the EP indicator). The study assumed a 50% EP reduction, resulting in only a two-fold reduction in the EEj emission indicator across the zones.
The study indicates that while adopting solutions from Scenario II is less costly for city budgets, more radical actions from Scenario I should be prioritized due to their significant positive impact on the environment and public health. The analysis confirms the utility of the cumulative cost-effectiveness–environmental benefit (CEEbj) indicator (Figure 8) for illustrating KST costs as ecological benefits resulting from reduced EEj emissions, thereby aiding in the management of public funds.

Limitations and Future Research

This study has several limitations, including its focus on a single case study in Gubin, reliance on survey and inventory data, partial quantification of non-market externalities, and assumptions regarding carbon pricing, resident participation, and policy stability. Future research should expand the methodology to diverse urban contexts, integrate high-resolution data (e.g., digital twins, smart meters), refine life-cycle and carbon accounting, and more deeply examine behavioural and governance barriers. Additionally, a supplementary analysis to encompass architectural and social benefits represents a potential avenue for research. Comparative studies across countries and the integration of circular economy principles and smart urban systems will further enhance the robustness and applicability of the framework.

Author Contributions

Conceptualization, P.S.; methodology, P.S.; software, P.S.; validation, P.S.; formal analysis, P.S.; investigation, P.S. and P.D.; resources, P.S. and P.D.; data curation, P.S.; writing—original draft preparation, P.S. and P.D.; writing—review and editing, P.S. and P.D.; visualization, P.S. and P.D.; supervision, P.S.; project administration, P.S. All authors have read and agreed to the published version of the manuscript.

Funding

This research received no external funding.

Data Availability Statement

The original data presented in the study are openly available in Appendix A.

Conflicts of Interest

The authors declare no conflicts of interest.

Appendix A

Table A1. Matrix of survey data for Zone SI.
No.AddressConstruction YearHeat SourceConstruction TechnologyYear of Thermal ModernizationAdministratorBuilding/Development TypeNo. of StaircasesNo. of Floors Above/UndergroundPlot Area [m2]Building Area [m2]Heated Area
[m2]
1Gdańska 15<1945mixed: gas-coaltraditional: ceramic brick, trussnoMZKTenement/detached building13n/1p290.00290.00603.20
2B. Chłopskich 6/8<1945coal furnacestraditional: ceramic brick, trussnoMZKTenement/semi-detached buildings12n/1p132.06132.06221.40
3Sląska 33<1945mixed: gas-coaltraditional: ceramic brick, trussnoMZKTenement/compact construction12n/1p221.40221.40336.20
4Kresowa 481964(84)solid fuel boiler roomtraditionalnoMZKUZP/detached building42n 1370.002676.00
5Gdańska 171975–80coal/local boiler roomtraditionalnoMZKUZP/detached Building32n/1p2500.001260.933444.00
6Piastowska 201920solid fuel boiler roomtraditionalnoMZKUZP/detached Building33n 299.00807.00
Table A2. Matrix of inventory data for Zone SI.
No.Cubature [m3]Heated Cubature [m3]Total Area of All External Partitions Including Floor and Ceiling [m2]A/V IndicatorWindow Area [m2]No. of PremisesNo. of InhabitantsEnergy End-Use Indicator Ek = QK/Af [kWh/m2/year]Annual End-Use Energy Demand QK = QK,H + QK,W + + QK,L [kWh/year]
13837.003414.931402.500.4198.309.0034.00310.87187,515.00
21266.001126.74574.920.5129.074.006.00376.4283,340.00
31368.001217.52735.920.6028.635.0012.00309.86104,175.00
410,660.0010,660.005543.200.52-26.00325.00415.711,112,441.77
512,416.0011,050.244345.600.39517.7839.00200.00201.66694,500.00
63680.003680.001435.200.39-10.00113.00470.10379,369.24
Table A3. Matrix of survey data for Zone SII.
No.Address Construction Year Heat Source Construction Technology Year of Thermal Modernization Administrator Building/Development Type No. of Staircases No. of Floors Above/Underground Plot Area [m2] Building Area [m2] Heated Area
[m2]
1Chrobrego 121962ECSystem ŻerańnoPrzedsiębiorstwo Usług Miejskich Residential/multi-family 25n/1p253.00253.00763.0
2Roosevelta 11a1970ECSystem Żerań2009Przedsiębiorstwo Usług Miejskich Residential/multi-family 25n/1p630.00630.002380.0
3Konopnickiej 11971ECSystem Żerań2004Spółdzielnia Mieszkaniowa “GUBIN” Residential/multi-family 25n/1p1225.00351.301338.0
4Westerplatte 101974ECSystem Żerań2006Spółdzielnia Mieszkaniowa “GUBIN” Residential/commercial 45n/1p512.80510.701907.0
5Emilii Plater 41970ECSystem W-70noSpółdzielnia Mieszkaniowa “GUBIN” Residential/multi-family 25n/1p1917.00350.201151.5
6Emilii Plater 91973ECSystem W-702008Spółdzielnia Mieszkaniowa “GUBIN” Residential/multi-family 45n/1p2462.00847.003328.0
Table A4. Matrix of inventory data for Zone SII.
No.Cubature [m3]Heated Cubature [m3]Total Area of All External Partitions Including Floor and Ceiling [m2]A/V IndicatorWindow Area [m2]No. of PremisesNo. of InhabitantsEnergy End-Use Indicator Ek = QK/Af [kWh/m2/year]Annual End-Use Energy Demand QK = QK,H + QK,W + + QK,L [kWh/year]
12994.0029941807.190.729210.226.0036.00121.20119,723.47
26720.0058802963.520.504393.2 + 19.860.0094.00102.72244,464.00
35964.005964.00---30.0070.00114.84153,651.18
48529.004849.002822.120.582410.2240.0080.00133.04253,714.74
54960.004960.001929.000.39 20.0043.00160.43184,737.00
614,427.008653.004750.500.549603.6060.00128.00108.64361,556.70
Table A5. Matrix of survey data for Zone SIII.
No.Address Construction Year Heat Source Construction Technology Year of Thermal Modernization Administrator Building/Development Type No. of Staircases No. of Floors Above/Underground Plot Area [m2] Building Area [m2] Heated Area
[m2]
1Piastowska 24<1920gastraditional-brick2009Gmina Gubin UA/detached building 43n/1p 1144.32483.7
2Rydla 21975gastraditionalnoPrzedsiębiorstwo Usług Miejskich M—tenement/detached building 14n/1p1329168672
3Racławicka 21910 (1980, 1900)gastraditionalnoMZK UZP/detached building no data4n/1p 2059.314284.8
4Kresowa 1221998gastraditionalnoWłaściciel Prywatny Hotel/detached building 12n/0p2500490806
5Gdańska 18a2000gastraditionalnoWłaściciel Prywatny single-family/detached building 11n/1p806110245
6Gdyńska 112009gastraditionalnoWłaściciel Prywatny single-family terraced house 12n/0p450132.5197.4
Table A6. Matrix of inventory data for Zone SIII.
No.Cubature [m3]Heated Cubature [m3]Total Area of All External Partitions Including Floor and Ceiling [m2]A/V IndicatorWindow Area [m2]No. of PremisesNo. of InhabitantsEnergy End-Use Indicator Ek = QK/Af [kWh/m2/year]Annual End-Use Energy Demand QK = QK,H + QK,W + + QK,L [kWh/year]
17812.117812.114609.14490.59 6889123.6236285307,044.006
213291182.819680.818390105 1017185.5763815124,707.3284
315,877.115,877.17779.780.49 62840480.10748692,057,164.56
424352167.1513920.642318252308.61942117.930580695,052.048
5550489.52520.51481103215.44592.4110204122,640.7
6695618.55363.120.5870503614.51459.2611854111,698.158

References

  1. European Commission—Department: Energy. In Focus: Energy Efficiency in Buildings. 2020. Available online: https://commission.europa.eu/news-and-media/news/focus-energy-efficiency-buildings-2020-02-17_en (accessed on 28 August 2025).
  2. Directive (EU) 2024/1275 of the European Parliament and of the Council of 24 April 2024 on the Energy Performance of Buildings (recast), OJ L 2024/1275, 8.5.2024. Available online: https://eur-lex.europa.eu/eli/dir/2024/1275/oj/eng (accessed on 5 July 2024).
  3. Ürge-Vorsatz, D.; Khosla, R.; Bernhardt, R.; Chan, Y.C.; Vérez, D.; Hu, S.; Cabeza, L.F. Advances toward a net-zero global building sector. Annu. Rev. Environ. Resour. 2020, 45, 227–269. [Google Scholar] [CrossRef]
  4. Long-Term Building Renovation Strategy. Supporting Renovation of the National Building Stock, Annex to Cabinet Resolution No 23/2022 of 9 February 2022, Warsaw, 2022. Available online: https://www.gov.pl/web/rozwoj-technologia/Dlugoterminowa-strategia-renowacji-budynkow (accessed on 28 August 2025).
  5. Shafi, M.; Ramos-Meza, C.S.; Jain, V.; Salman, A.; Kamal, M.; Shabbir, M.S.; Rehman, M.U. The dynamic relationship between green tax incentives and environmental protection. Environ. Sci. Pollut. Res. 2023, 30, 32184–32192. [Google Scholar] [CrossRef] [PubMed]
  6. RICS. The Outlook for Office Markets: How Will Energy Performance Impact Office Stocks? 2023. Available online: https://www.rics.org/news-insights/wbef/the-outlook-for-office-markets-how-will-energy-performance-impact-office-stocks (accessed on 28 August 2025).
  7. Mišík, M.; Oravcová, V.; Vicenová, R. Energy efficiency of buildings in Central and Eastern Europe: Room for improvement. Energy Effic. 2024, 17, 32. [Google Scholar] [CrossRef]
  8. Karpinska, L.; Śmiech, S. Multiple faces of poverty: Exploring housing-costs-induced energy poverty in Central and Eastern Europe. Energy Res. Soc. Sci. 2023, 105, 103273. [Google Scholar] [CrossRef]
  9. Hugony, C.; Hugony, M.E.; Causone, F.; Morello, E. A working methodology for deep energy retrofit of residential multi-property buildings. In Building Simulation Research; Springer: Singapore, 2020; pp. 687–699. [Google Scholar] [CrossRef]
  10. Ascione, F.; de Rossi, F.; Iovane, T.; Manniti, G.; Mastellone, M. Energy demand and air quality in social housing buildings: A novel critical review. Energy Build. 2024, 319, 114542. [Google Scholar] [CrossRef]
  11. Sovacool, B.K.; Baum, C.M.; Low, S. Determining our climate policy future: Expert opinions about negative emissions and solar radiation management pathways. Mitig. Adapt. Strateg. Glob. Change 2022, 27, 58. [Google Scholar] [CrossRef] [PubMed]
  12. Sigmund, Z. Barriers and incentives for extensive implementation of combined seismic and energy efficiency retrofits. IOP Conf. Ser. Earth Environ. Sci. 2019, 222, 012018. [Google Scholar] [CrossRef]
  13. Fernandez, A.; Haffner, M.; Elsinga, M. Comparing the financial impact of housing retrofit policies on Dutch homeowners. IOP Conf. Ser. Earth Environ. Sci. 2022, 1085, 012044. [Google Scholar] [CrossRef]
  14. Li, S.; Bai, T. The impact of tax reform on corporate green transformation—Evidence based on the value-added tax retained rebate. Finance Res. Lett. 2024, 60, 104881. [Google Scholar] [CrossRef]
  15. Directive (EU) 2023/1791 of the European Parliament and of the Council of 13 September 2023 on Energy Efficiency and Amending Regulation (EU) 2023/955 (recast), 20.9.2023. Available online: https://eur-lex.europa.eu/eli/dir/2023/1791/oj/eng (accessed on 25 February 2024).
  16. Aladwan, Z.; Ahamad, M.S.S. Hedonic pricing model for real property valuation via GIS—A review. Civ. Environ. Eng. Rep. 2019, 29, 34–47. [Google Scholar] [CrossRef]
  17. Ke, Q.; White, M. Does energy performance rating affect office rents? A study of the UK office market. J. Sustain. Real Estate 2024, 16, 2356715. [Google Scholar] [CrossRef]
  18. Gholamzadehmir, M.; Pandolfi, A.M.; Del Pero, C.; Leonforte, F.; Sdino, L. Increasing the market value of buildings through energy retrofitting: A comparison of actual retrofit costs and perceived values. Buildings 2025, 15, 376. [Google Scholar] [CrossRef]
  19. Perez, H.; Amoudi, O.; Famuyiwa, F.; Tah, J.H.M. The impact of EPC ratings on residential property prices: A hedonic study in Oxfordshire. Adv. Build. Energy Res. 2025, 19, 66–86. [Google Scholar] [CrossRef]
  20. European Commission: Directorate-General for Energy. Transition Financing—Financing Projects in Coal+ Regions in Transition—Toolkit; Publications Office of the European Union: Luxembourg, 2025; Available online: https://data.europa.eu/doi/10.2833/2165471 (accessed on 28 August 2025).
  21. European Commission: Directorate-General for Energy; Wehnert, T.; Selimi, P.; Beutel, J. Clean Air—Implications of Air Pollution for Coal+ Regions in Transition—Toolkit; Publications Office of the European Union: Luxembourg, 2025; Available online: https://data.europa.eu/doi/10.2833/8170859 (accessed on 28 August 2025).
  22. King, J.D.; Zhang, S.; Cohen, A. Air pollution and mental health: Associations, mechanisms and methods. Curr. Opin. Psychiatry 2022, 35, 192–199. [Google Scholar] [CrossRef]
  23. Woodhall-Melnik, J.; Haley, T.L.; Reiser, C. Renovate to evict: An analysis of media discussions of renoviction. Hous. Stud. 2025, 1–30. [Google Scholar] [CrossRef]
  24. Ross, H.; McCartney, G. Renoviction and health: An emerging research agenda. J. Epidemiol. Community Health 2025, 79, 239–241. [Google Scholar] [CrossRef] [PubMed]
  25. European Commission. A Renovation Wave for Europe—Greening Our Buildings, Creating Jobs, Improving Lives; Communication from the Commission to the European Parliament, the Council, the European Economic and Social Committee and the Committee of the Regions, Document 52020DC0662; European Commission: Brussels, Belgium, 2020; Available online: https://eur-lex.europa.eu/resource.html?uri=cellar:0638aa1d-0f02-11eb-bc07-01aa75ed71a1.0018.02/DOC_1&format=PDF (accessed on 28 August 2025).
  26. Verma, S.; Mandal, S.N.; Robinson, S.; Bajaj, D.; Saxena, A. Investment appraisal and financial benefits of corporate green buildings: A developing economy case study. Built Environ. Proj. Asset Manag. 2021, 11, 392–408. [Google Scholar] [CrossRef]
  27. Avanzini, M.; Pinheiro, M.D.; Gomes, R.; Rolim, C. Energy retrofit as an answer to public health costs of fuel poverty in Lisbon social housing. Energy Policy 2022, 160, 112658. [Google Scholar] [CrossRef]
  28. Monteiro, C.S.; Causone, F.; Cunha, S.M.P.R.M.; Pina, A.; Erba, S. Addressing the challenges of public housing retrofits. Energy Procedia 2017, 134, 442–451. [Google Scholar] [CrossRef]
  29. Jayalath, A.; Vaz-Serra, P.; Hui, F.K.P.; Aye, L. Thermally comfortable energy efficient affordable houses: A review. Build. Environ. 2024, 256, 111495. [Google Scholar] [CrossRef]
  30. Sobierajewicz, P.; Adamczyk, J.; Dylewski, R. Multi-criterial carbon assessment of the city. Energies 2024, 17, 4555. [Google Scholar] [CrossRef]
  31. Song, P.; Wu, L.; Zhao, W.; Ma, W.; Hao, J. Life cycle sustainability assessment: An index system for building energy retrofit projects. Buildings 2024, 14, 2817. [Google Scholar] [CrossRef]
  32. Cabeza, L.F.; Rincón, L.; Vilariño, V.; Pérez, G.; Castell, A. Life cycle assessment (LCA) and life cycle energy analysis (LCEA) of buildings and the building sector: A review. Renew. Sustain. Energy Rev. 2014, 29, 394–416. [Google Scholar] [CrossRef]
  33. Schleich, J.; Faure, C.; Meissner, T. Adoption of retrofit measures among homeowners in EU countries: The effects of access to capital and debt aversion. Energy Policy 2021, 149, 112025. [Google Scholar] [CrossRef]
  34. Kunze, C.W.; Belay, A.M.; Hedar, A.S.; Dandwate, A. Citizen engagement and co-creation in a net-zero built environment transition: Challenges and best practices. In The 1st International Conference on Net-Zero Built Environment; NTZR 2024, Lecture Notes in Civil Engineering; Kioumarsi, M., Shafei, B., Eds.; Springer: Cham, Switzerland, 2025; Volume 237. [Google Scholar] [CrossRef]
  35. Flos, A.G.F.M. Renovating the retrofit process: People-centered business models and co-created partnerships for low-energy buildings in Norway. Energy Res. Soc. Sci. 2022, 85, 102406. [Google Scholar] [CrossRef]
  36. Bartiaux, F.; Gram-Hanssen, K.; Fonseca, P.; Ozoliņa, L.; Christensen, T.H. A practice–theory approach to homeowners’ energy retrofits in four European areas. Build. Res. Inf. 2014, 42, 525–538. [Google Scholar] [CrossRef]
  37. Galal Ahmed, K.; Hamza, N.; Kordi, A.O.; Shareef, O.S.M. Retrofit with residents: Proposed locally responsive participatory method for public housing in the UAE. Smart Sustain. Built Environ. 2025, 14, 1038–1072. [Google Scholar] [CrossRef]
  38. Gupta, R.; Barnfield, L.; Hipwood, T. Impacts of community-led energy retrofitting of owner-occupied dwellings. Build. Res. Inf. 2014, 42, 446–461. [Google Scholar] [CrossRef]
  39. Hosan, S.; Sen, K.K.; Rahman, M.M.; Chapman, A.J.; Karmaker, S.C.; Alam, M.J.; Saha, B.B. Energy innovation funding and social equity: Mediating role of just energy transition. Renew. Sustain. Energy Rev. 2024, 197, 114405. [Google Scholar] [CrossRef]
  40. Kozul-Wright, R.; Gallogly-Swan, K.; Ahmed, M. Financing a just transition to a carbon-free world: A developmental perspective. In Understanding Green Finance; Edward Elgar Publishing: Cheltenham, UK, 2024; pp. 159–181. [Google Scholar]
  41. Tsahor, M.; Katoshevski-Cavari, R.; Alfasi, N. Assessing urban adaptability: The key is in the land use plan. Land Use Policy 2023, 126, 106508. [Google Scholar] [CrossRef]
  42. Zhai, J.; LeClaire, N.; Bendewald, M. Deep energy retrofit of commercial buildings: A key pathway toward low-carbon cities. Carbon Manag. 2011, 2, 425–430. [Google Scholar] [CrossRef]
  43. Minister of Investment and Development. Regulation of 21 December 2018; Journal of Laws of 2018, Item 2489. Available online: https://eur-lex.europa.eu/legal-content/PL/TXT/PDF/?uri=NIM:285556 (accessed on 20 April 2024).
  44. Millot, A.; Maïzi, N. From open-loop energy revolutions to closed-loop transition: What drives carbon neutrality? Technol. Forecast. Soc. Change 2021, 172, 121003. [Google Scholar] [CrossRef]
  45. Mobaraki, A.; Nikoofam, M.; Mobaraki, B. The Nexus of Morphology and Sustainable Urban Form Parameters as a Common Basis for Evaluating Sustainability in Urban Forms. Sustainability 2025, 17, 3967. [Google Scholar] [CrossRef]
  46. Hosseinzadehfard, E.; Mobaraki, B. Corrosion Performance and Strain Behavior of Reinforced Concrete: Effect of Natural Pozzolan as Partial Substitute for Microsilica in Concrete Mixtures. Structures 2025, 79, 109397. [Google Scholar] [CrossRef]
  47. European Parliament and Council. Regulation (EU) 2021/241 of 12 February 2021 Establishing the Recovery and Resilience Facility; Official Journal of the European Union, 2021. Available online: http://data.europa.eu/eli/reg/2021/241/oj (accessed on 28 August 2025).
  48. European Commission. Commission Delegated Regulation (EU) 2021/2106 of 28 September 2021 Supplementing Regulation (EU) 2021/241 Establishing the Recovery and Resilience Facility. Available online: https://eur-lex.europa.eu/eli/reg_del/2021/2106/oj (accessed on 20 March 2024).
  49. Bank Gospodarstwa Krajowego (BGK). National Recovery Plan—B115 Improvement of Energy Efficiency in Multi-Family Residential Buildings. Available online: https://www.bgk.pl/krajowy-plan-odbudowy/b115-poprawa-efektywnosci-energetycznej-w-budynkach-mieszkalnych-wielorodzinnych/ (accessed on 28 August 2025).
  50. Banerjee, R.; Mishra, V.; Maruta, A.A. Energy poverty, health and education outcomes: Evidence from the developing world. Energy Econ. 2021, 101, 105447. [Google Scholar] [CrossRef]
  51. Halkos, G.E.; Gkampoura, E.C. Evaluating the effect of economic crisis on energy poverty in Europe. Renew. Sustain. Energy Rev. 2021, 144, 110981. [Google Scholar] [CrossRef]
  52. Igawa, M.; Managi, S. Energy poverty and income inequality: An economic analysis of 37 countries. Appl. Energy 2022, 306, 118076. [Google Scholar] [CrossRef]
  53. Chen, H.; Oliver, B.G.; Pant, A.; Olivera, A.; Poronnik, P.; Pollock, C.A.; Saad, S. Effects of air pollution on human health—mechanistic evidence suggested by in vitro and in vivo modelling. Environ. Res. 2022, 212, 113378. [Google Scholar] [CrossRef] [PubMed]
  54. Gul, H.; Das, B.K. The impacts of air pollution on human health and well-being: A comprehensive review. J. Environ. Impact Manag. Policy 2023, 36, 1–11. [Google Scholar] [CrossRef]
  55. Wu, D.; Zheng, H.; Li, Q.; Jin, L.; Lyu, R.; Ding, X.; Huo, Y.; Zhao, B.; Jiang, J.; Chen, J.; et al. Toxic potency-adjusted control of air pollution for solid fuel combustion. Nat. Energy 2022, 7, 194–202. [Google Scholar] [CrossRef]
  56. Ministry of Climate and Environment. National Energy and Climate Plan for 2021–2030. Available online: https://www.gov.pl/web/climate/national-energy-and-climate-plan (accessed on 29 August 2025).
  57. European Commission. Commission Recommendation (EU) 2019/786 of 8 May 2019; Official Journal of the European Union, 2019. Available online: https://eur-lex.europa.eu/legal-content/EN/TXT/PDF/?uri=CELEX:32019H0786 (accessed on 20 March 2024).
  58. Development Fund and on the Cohesion Fund; Official Journal of the European Union, 2021. Available online: https://www.feniks.gov.pl/en/sites/learn-more-about-the-programme/look-through-the-programme-documents/regulation-eu-20211058-of-the-european-parliament-and-of-the-council-of-24-june-2021-on-the-european-regional-development-fund-and-on-the-cohesion-fund/ (accessed on 1 April 2025).
  59. European Funds for Infrastructure, Climate and Environment. European Funds for Infrastructure, Climate and Environment 2021–2027 Programme. Available online: https://www.feniks.gov.pl/en/sites/learn-more-about-the-programme/look-through-the-programme-documents/european-funds-for-infrastructure-climate-and-environment-2021-2027-programme/ (accessed on 8 April 2025).
  60. Adamczyk, J.; Dylewski, R.; Sobierajewicz, P. Economic and ecological benefits of thermal insulation of external partitions depending on the temperature in residential premises. J. Clean. Prod. 2023, 384, 135622. [Google Scholar] [CrossRef]
  61. Nowogońska, B.; Korentz, J. Value of technical wear and costs of restoring performance characteristics to residential buildings. Buildings 2020, 10, 9. [Google Scholar] [CrossRef]
  62. WACETOB—Warszawskie Centrum Postępu Techniczno-Organizacyjnego Budownictwa. Zużycie obiektów budowlanych. Available online: http://www.wacetob.com.pl (accessed on 29 August 2025).
  63. Dębowski, J. Problematyka określania stopnia zużycia technicznego budynków wielkopłytowych. Czas. Tech. Archit. 2007, 104, 27–34. [Google Scholar]
  64. Konior, J. Overdurability and Technical Wear of Materials Used in the Construction of Old Buildings. Materials 2021, 14, 378. [Google Scholar] [CrossRef]
  65. Council of Ministers. Regulation of 21 September 2021 on property valuation; Journal of Laws 2021, Item 555. Available online: https://isap.sejm.gov.pl/isap.nsf/download.xsp/WDU20210000555/O/D20210555.pdf (accessed on 15 June 2024).
  66. Nowogońska, B. Ocena potrzeb remontowych na podstawie okresów trwałości elementów budynku. Przegląd Bud. 2005, 76, 14–18. [Google Scholar]
  67. Baranowski, W. Zużycie Techniczne Obiektów Budowlanych, 2nd ed.; WACETOB—Warszawskie Centrum Postępu Techniczno-Organizacyjnego Budownictwa: Warsaw, Poland, 2022. [Google Scholar]
  68. Central Statistical Office (GUS). Price per Square Metre of Usable Floor Space in Residential Buildings Completed; Subject Areas: Industry, Construction, Fixed Assets. Available online: https://stat.gov.pl (accessed on 15 January 2025).
  69. Kanoniczak, M. Możliwości modernizacji budynków wielkopłytowych—Balkony i loggie. Przegląd Bud. 2020, 91, 27–31. [Google Scholar]
  70. Biliński, T.; Gaczek, W.; Klorek, E. Systemy Uprzemysłowionego Budownictwa Ogólnego; Politechnika Poznańska: Poznań, Poland, 1978. [Google Scholar]
  71. Jasiczak, J.; Kanoniczak, M.; Suchecki, J. W sprawie nowoczesnego budownictwa wielkopłytowego. Postulaty rozwiązań technicznych i kierunki rozwoju. Sr. Mieszk. 2023, 42, 66–79. [Google Scholar] [CrossRef]
  72. Buildings Performance Institute Europe (BPIE). iBRoad2EPC D5.5 EU Roadmap for Uptake of iBRoad2EPC Schemes; BPIE: Brussels, Belgium, 2024; Available online: https://www.bpie.eu/wp-content/uploads/2024/09/iBRoad2EPC-D5-5-EU-roadmap-for-uptake-of-iBRoad2EPC-schemes-2024-07-BPIE-1.pdf (accessed on 29 August 2025).
  73. Sobierajewicz, P. Kształtowanie Zabudowy Miejskiej o Zwiększonej Efektywności Ekologicznej i Energetycznej: Architektura, Rozwój, Społeczeństwo, Ekologia, 2013; Oficyna Wydawnictwo Uniwersytetu Zielonogórskiego: Zielona Góra, Poland, 2013; p. 274. ISBN 9788378420828. [Google Scholar]
  74. Sovacool, B.K.; Martiskainen, M.; Hook, A.; Baker, L. Decarbonization and its discontents: A critical energy justice perspective on four low-carbon transitions. Clim. Change 2019, 155, 581–619. [Google Scholar] [CrossRef]
  75. Castaño-Rosa, R.; Solís-Guzmán, J.; Rubio-Bellido, C.; Marrero, M. Towards a multiple-indicator approach to energy poverty in the European Union: A review. Energy Build. 2019, 193, 36–48. [Google Scholar] [CrossRef]
  76. Primc, K.; Slabe-Erker, R. Social policy or energy policy? Time to reconsider energy poverty policies. Energy Sustain. Dev. 2020, 55, 32–36. [Google Scholar] [CrossRef]
  77. Skiba, M. Modelling City Development: Strategic Spatial Decision Support Tools. Teka Kom. Urban. I Archit. 2024, T. 52/1, 421–433. [Google Scholar] [CrossRef]
  78. Moskwa-Bęczkowska, D.; Moskwa, A. Renewable Energy Sources in the Processes of Thermal Modernization of Buildings—Selected Aspects in Poland. Energies 2022, 15, 4613. [Google Scholar] [CrossRef]
  79. National Energy and Climate Plans (NECPs). Available online: https://commission.europa.eu/energy-climate-change-environment/implementation-eu-countries/energy-and-climate-governance-and-reporting/national-energy-and-climate-plans_en (accessed on 30 August 2025).
  80. Renovation Deal: The European Green Deal. Available online: https://ec.europa.eu/info/strategy/priorities-2019-2024/european-green-deal_en (accessed on 30 August 2025).
  81. European Parliament and Council. Directive 2010/31/EU of 19 May 2010 on the energy performance of buildings. Off. J. Eur. Union 2010, L 153, 13–35.
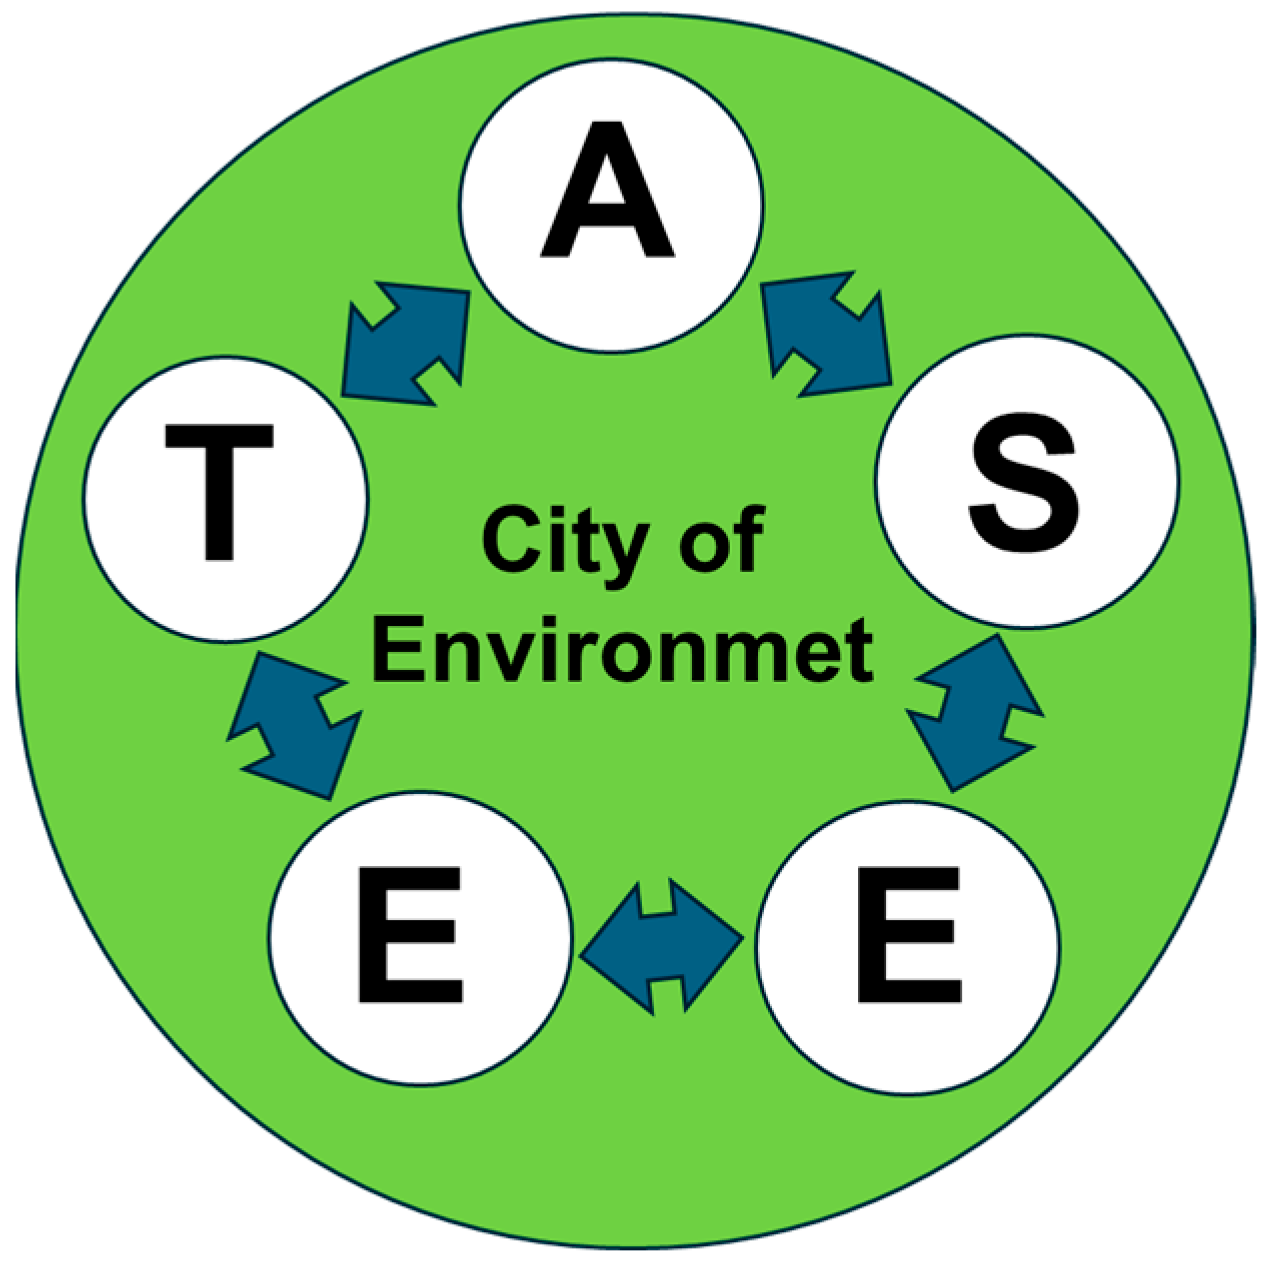
Figure 1. Conceptual framework of the ASEET methodology in the urban ecosystem.
Energies 18 05324 g001
Figure 2. Methodological diagram for the ASEET assessment of thermally modernized buildings.
Energies 18 05324 g002
Figure 3. Map of Gubin showing four energy zones (SI, SII, SIII, and SIV).
Energies 18 05324 g003
Figure 4. Comparison of different formulas for estimating the technical wear of buildings [62].
Energies 18 05324 g004
Figure 5. Ratio of modernization cost to gross energy benefit (KST/WGB) in Gubin Zone SI. Note: status of the 4th quarter of 2024.
Energies 18 05324 g005
Figure 6. Ratio of modernization cost to gross energy benefit (KST/WGB) in Gubin Zone SII. Note: Status of the 4th quarter of 2024.
Energies 18 05324 g006
Figure 7. Ratio of modernization cost to gross energy benefit (KST/WGB) in Gubin Zone SIII. Note: The standard version refers to the thermal modernization compliant with legal status as of the fourth quarter of 2024. The unit price index (Cjq) was adopted at 1788.14 USD/m2, according to data from the Central Statistical Office (GUS).
Energies 18 05324 g007
Figure 8. Cost-effectiveness–environmental benefit (CEEbI) for buildings in Zone I during transformation from Energy Class G to Class B.
Energies 18 05324 g008
Table 1. Number of buildings by construction period and zone.
Construction YearNo. of Buildings
Zone SI
No. of Buildings
Zone SII
No of Buildings
Zone SIII
Until 1945–66512
1967–92152
1993–2008--1
Since 2009--1
Table 2. Estimated service life (T) based on building type and construction technology.
Building Type/PurposeWoodenMixedMassive
Residential buildings80–10090–120100–150
Summer housesUp to 40Up to 60Up to 80
Farm/Utility buildings60–7070–9080–100
Livestock buildings40–5050–6060–70
Detached garagesNone50–8080–100
Repair workshops40–5050–80Up to 100
Table 3. Technical wear parameters for traditional technology buildings in Gubin Zone SI.
No.AddressHeated Area
[m2]
Building Age
[Year]
Durability
[Year]
Szt
[%]
WZ
1Gdańska 15 (KM *)603.279150530.47
2Bat. Chłopskich 6/8 (KM *)221.479150530.47
3Śląska 33 (KM *)336.279150530.47
4Kresowa 48 (School No. 3)2676.060120500.50
5Gdańska 17 (Clinic NFZ)3444.049120410.59
6Piastowska 20 (Kindergarten)807.079120660.34
* KM—residential tenement house.
Table 4. Technical wear parameters for prefabricated buildings in Gubin Zone SII.
No.AddressHeated Area
[m2]
Building Age
[Year]
Durability
[Year]
Szt
[%]
WZ
1Chrobrego 12763.062150410.59
2Roosevelta 11a2380.054150360.64
3Konopnickiej 11338.053150350.65
4Westerplatte 101907.050150330.67
5Emilii Plater 41151.554150360.64
6Emilii Plater 93328.051150340.66
Table 5. Technical wear parameters of mixed technology buildings in Gubin Zone SIII.
No.AddressHeated Area
[m2]
Building Age
[Year]
Durability
[Year]
Szt
[%]
WZ
1Piastowska 24 (A*)2483.779120660.34
2Rydla 2 (R*)672.049150330.67
3Racławicka 2 (School)4284.849120410.59
4Kresowa 122 (Hostel)806.026120220.78
5Gdańska 18a (R*)245.024120200.80
6Gdyńska 11 (R*)197.415120130.88
A*—administration, R*—residential.
Table 6. Economic indicators for energy efficiency improvement investments in Gubin Zone SI.
No.Construction YearHeated Area
[m2]
KRB
[USD]
WzWGB
[USD]
KST
[USD]
KST/WGB
[%]
11945603.21.08 × 1060.475.11 × 1055.68 × 105111
21945221.43.96 × 1050.471.87 × 1052.09 × 105111
31945336.26.01 × 1050.472.85 × 1053.17 × 105111
419642676.04.79 × 1060.502.39 × 1062.39 × 106100
519753444.06.16 × 1060.593.64 × 1062.51 × 10669
61920807.01.44 × 1060.344.93 × 1059.50 × 105193
Note: The standard version is defined as the thermal modernization version compliant with the legal status as of the fourth quarter of 2024. The unit price index (Cjq) was adopted at 1788.14 USD/m2, according to data from the Polish Central Statistical Office (GUS).
Table 7. Economic indicators for energy efficiency improvement investments in Gubin Zone SII.
No.Construction YearHeated Area
[m2]
KRB
[USD]
WzWGB
[USD]
KST
[USD]
KST/WGB
[%]
11962763.01.36 × 1060.598.00 × 1055.64 × 10570
219702380.04.26 × 1060.642.72 × 1061.53 × 10656
319711338.02.39 × 1060.651.55 × 1068.45 × 10555
419741907.03.41 × 1060.672.27 × 1061.14 × 10650
519841151.52.06 × 1060.641.32 × 1067.41 × 10556
619873328.05.95 × 1060.663.93 × 1062.02 × 10652
Note: The standard version is the thermal modernization version as of the legal status in the fourth quarter of 2024. Cjq was adopted at 1788.14 USD/m2 according to the Central Statistical Office (GUS).
Table 8. Economic indicators for energy efficiency improvement investments in Gubin Zone SIII.
No.Construction YearHeated Area
[m2]
KRB
[USD]
WzWGB
[USD]
KST
[USD]
KST/WGB
[%]
119202483.74.44 × 1060.341.52 × 1062.92 × 106193
21975672.01.20 × 1060.678.09 × 1053.93 × 10549
319804284.87.66 × 1060.594.53 × 1063.13 × 10669
41998806.01.44 × 1060.781.13 × 1063.12 × 10528
52000245.04.38 × 1050.803.50 × 1058.76 × 10425
62009197.43.53 × 1050.883.09 × 1054.41 × 10414
Note: The standard version refers to the thermal modernization compliant with legal status as of the fourth quarter of 2024. The unit price index (Cjq) was adopted at 1788.14 USD/m2, according to data from the Central Statistical Office (GUS).
Disclaimer/Publisher’s Note: The statements, opinions and data contained in all publications are solely those of the individual author(s) and contributor(s) and not of MDPI and/or the editor(s). MDPI and/or the editor(s) disclaim responsibility for any injury to people or property resulting from any ideas, methods, instructions or products referred to in the content.