Article

Evaluation of Development Performance and Adjustment Strategies for High Water-Cut Reservoirs Based on Flow Diagnostics: Application in the QHD Oilfield

1
School of Energy, China University of Geosciences (Beijing), Beijing 100083, China
2
Tianjin Branch, CNOOC (China) Co., Ltd., Tianjin 300459, China
3
School of Ocean Sciences, China University of Geosciences (Beijing), Beijing 100083, China
4
Department of Chemical and Petroleum Engineering, University of Calgary, Calgary, AB T2N 1N4, Canada
*
Authors to whom correspondence should be addressed.
Energies 2025, 18(19), 5310; https://doi.org/10.3390/en18195310
Submission received: 27 August 2025 / Revised: 22 September 2025 / Accepted: 30 September 2025 / Published: 8 October 2025
(This article belongs to the Special Issue Advances in Unconventional Reservoirs and Enhanced Oil Recovery)

Abstract

Offshore reservoirs in the high water-cut stage present significant development challenges, including declining production, complex remaining oil distribution, and the inadequacy of conventional evaluation methods to capture intricate flow dynamics. To overcome these limitations, this study introduces a novel approach based on flow diagnostics for performance evaluation and potential adjustment. The method integrates key metrics such as time-of-flight (TOF) and the dynamic Lorenz coefficient, supported by reservoir engineering principles and numerical simulation, to construct a multi-parameter evaluation system. This system, which also incorporates injection–production communication volume and inter-well fluid allocation factors, precisely quantifies and visualizes waterflood displacement processes and sweep efficiency. Applied to the QHD32 oilfield, this framework was used to establish specific thresholds for operational adjustments. These include criteria for infill drilling (waterflooded ratio < 45%, remaining oil thickness > 6 m, TOF > 200 days), conformance control (TOF < 50 days, dynamic Lorenz coefficient > 0.5), and artificial lift optimization (remaining oil thickness ratio > 2/3, TOF > 200 days). Field validation confirmed the efficacy of this approach: an additional cumulative oil production of 165,600 m3 was achieved from infill drilling in the C29 well group, while displacement adjustments in the B03 well group increased oil production by 2.2–3.8 tons/day, demonstrating a significant enhancement in waterflooding performance. This research provides a theoretical foundation and a technical pathway for the refined development of offshore heavy oil reservoirs at the ultra-high water-cut stage, offering a robust framework for the sustainable management of analogous reservoirs worldwide.

1. Introduction

The effective development of mature oilfields, particularly in offshore environments, is a critical challenge for global energy security [1,2]. As these fields enter the high water-cut stage (Figure 1), they are characterized by increasingly complex geological conditions, highly discrete remaining oil distribution, and significant interlayer heterogeneity, which collectively diminish recovery efficiency [3,4]. For instance, challenges such as poor well pattern adaptability in the Shengtuo oilfield [5] and complex fluid dynamics in the faulted P oilfield [6] exemplify the limitations of conventional development strategies. With China’s crude oil import dependency exceeding 70% and mature fields constituting the bulk of its domestic reserves, optimizing production from these assets is a strategic imperative for ensuring national energy security [7,8,9].
To address the challenges inherent in high water-cut reservoirs—strong heterogeneity, severe water channeling, and dispersed remaining oil—a precise evaluation of fluid flow dynamics is essential for optimizing recovery. Historically, reservoir performance evaluation has relied on traditional reservoir engineering techniques, such as decline curve analysis and well testing. Methods like the Arps decline curve [10] provide production forecasts but their accuracy is often compromised in heterogeneous reservoirs where complex fluid and rock properties are not fully accounted for. While modified approaches have been proposed to accommodate data limitations [11], and well testing can yield physical parameters, these methods often fail to capture the dynamic, layer-specific performance in complex settings [12]. More advanced techniques that incorporate water-cut curves [13] or vector flow fields from numerical simulations [14] offer improved characterization of channeling paths and sweep efficiency. However, they can be computationally intensive and may not fully resolve the dynamic heterogeneity of the flow field.
Streamline simulation has emerged as a powerful tool for visualizing fluid flow and integrating dynamic data [15]. It offers significant computational speed advantages over conventional numerical methods and provides excellent flow visualization, particularly for thermal recovery processes [16]. Similarly, tracer monitoring integrated with numerical simulation can clarify sand body connectivity and injection–production correspondence [17]. Nevertheless, the accuracy of all simulation-based approaches is fundamentally dependent on the quality of the underlying geological model. Uncertainties in reservoir characterization and the idealizations inherent in numerical models can lead to significant prediction biases, especially in reservoirs with complex fracture networks.
The limitations of both traditional empirical methods and computationally demanding simulation techniques highlight the need for an alternative evaluation framework that can efficiently integrate dynamic data and precisely capture complex flow field characteristics. This study proposes such a framework, founded on the principles of flow diagnostics. Our approach utilizes key metrics derived from streamline or numerical models—principally the time-of-flight (TOF) and a dynamic Lorenz coefficient—to quantify displacement heterogeneity. TOF measures the travel time of fluid particles along streamlines, while the Lorenz coefficient quantifies the degree of flow uniformity. These metrics are integrated into a multi-parameter evaluation system that also includes injection–production communication volume and inter-well fluid allocation factors. This system enables a precise and visualized assessment of the waterflood process, overcoming the experiential dependency and computational latency of conventional methods in the ultra-high water-cut stage. By applying this methodology to the QHD32-6 oilfield, we establish quantitative criteria for targeted interventions such as infill drilling, conformance control, and artificial lift optimization. This research aims to provide a robust theoretical and technical pathway for the refined development of offshore heavy oil reservoirs, offering a valuable reference for the sustainable management of similar assets, as shown in Table 1.

2. Methods

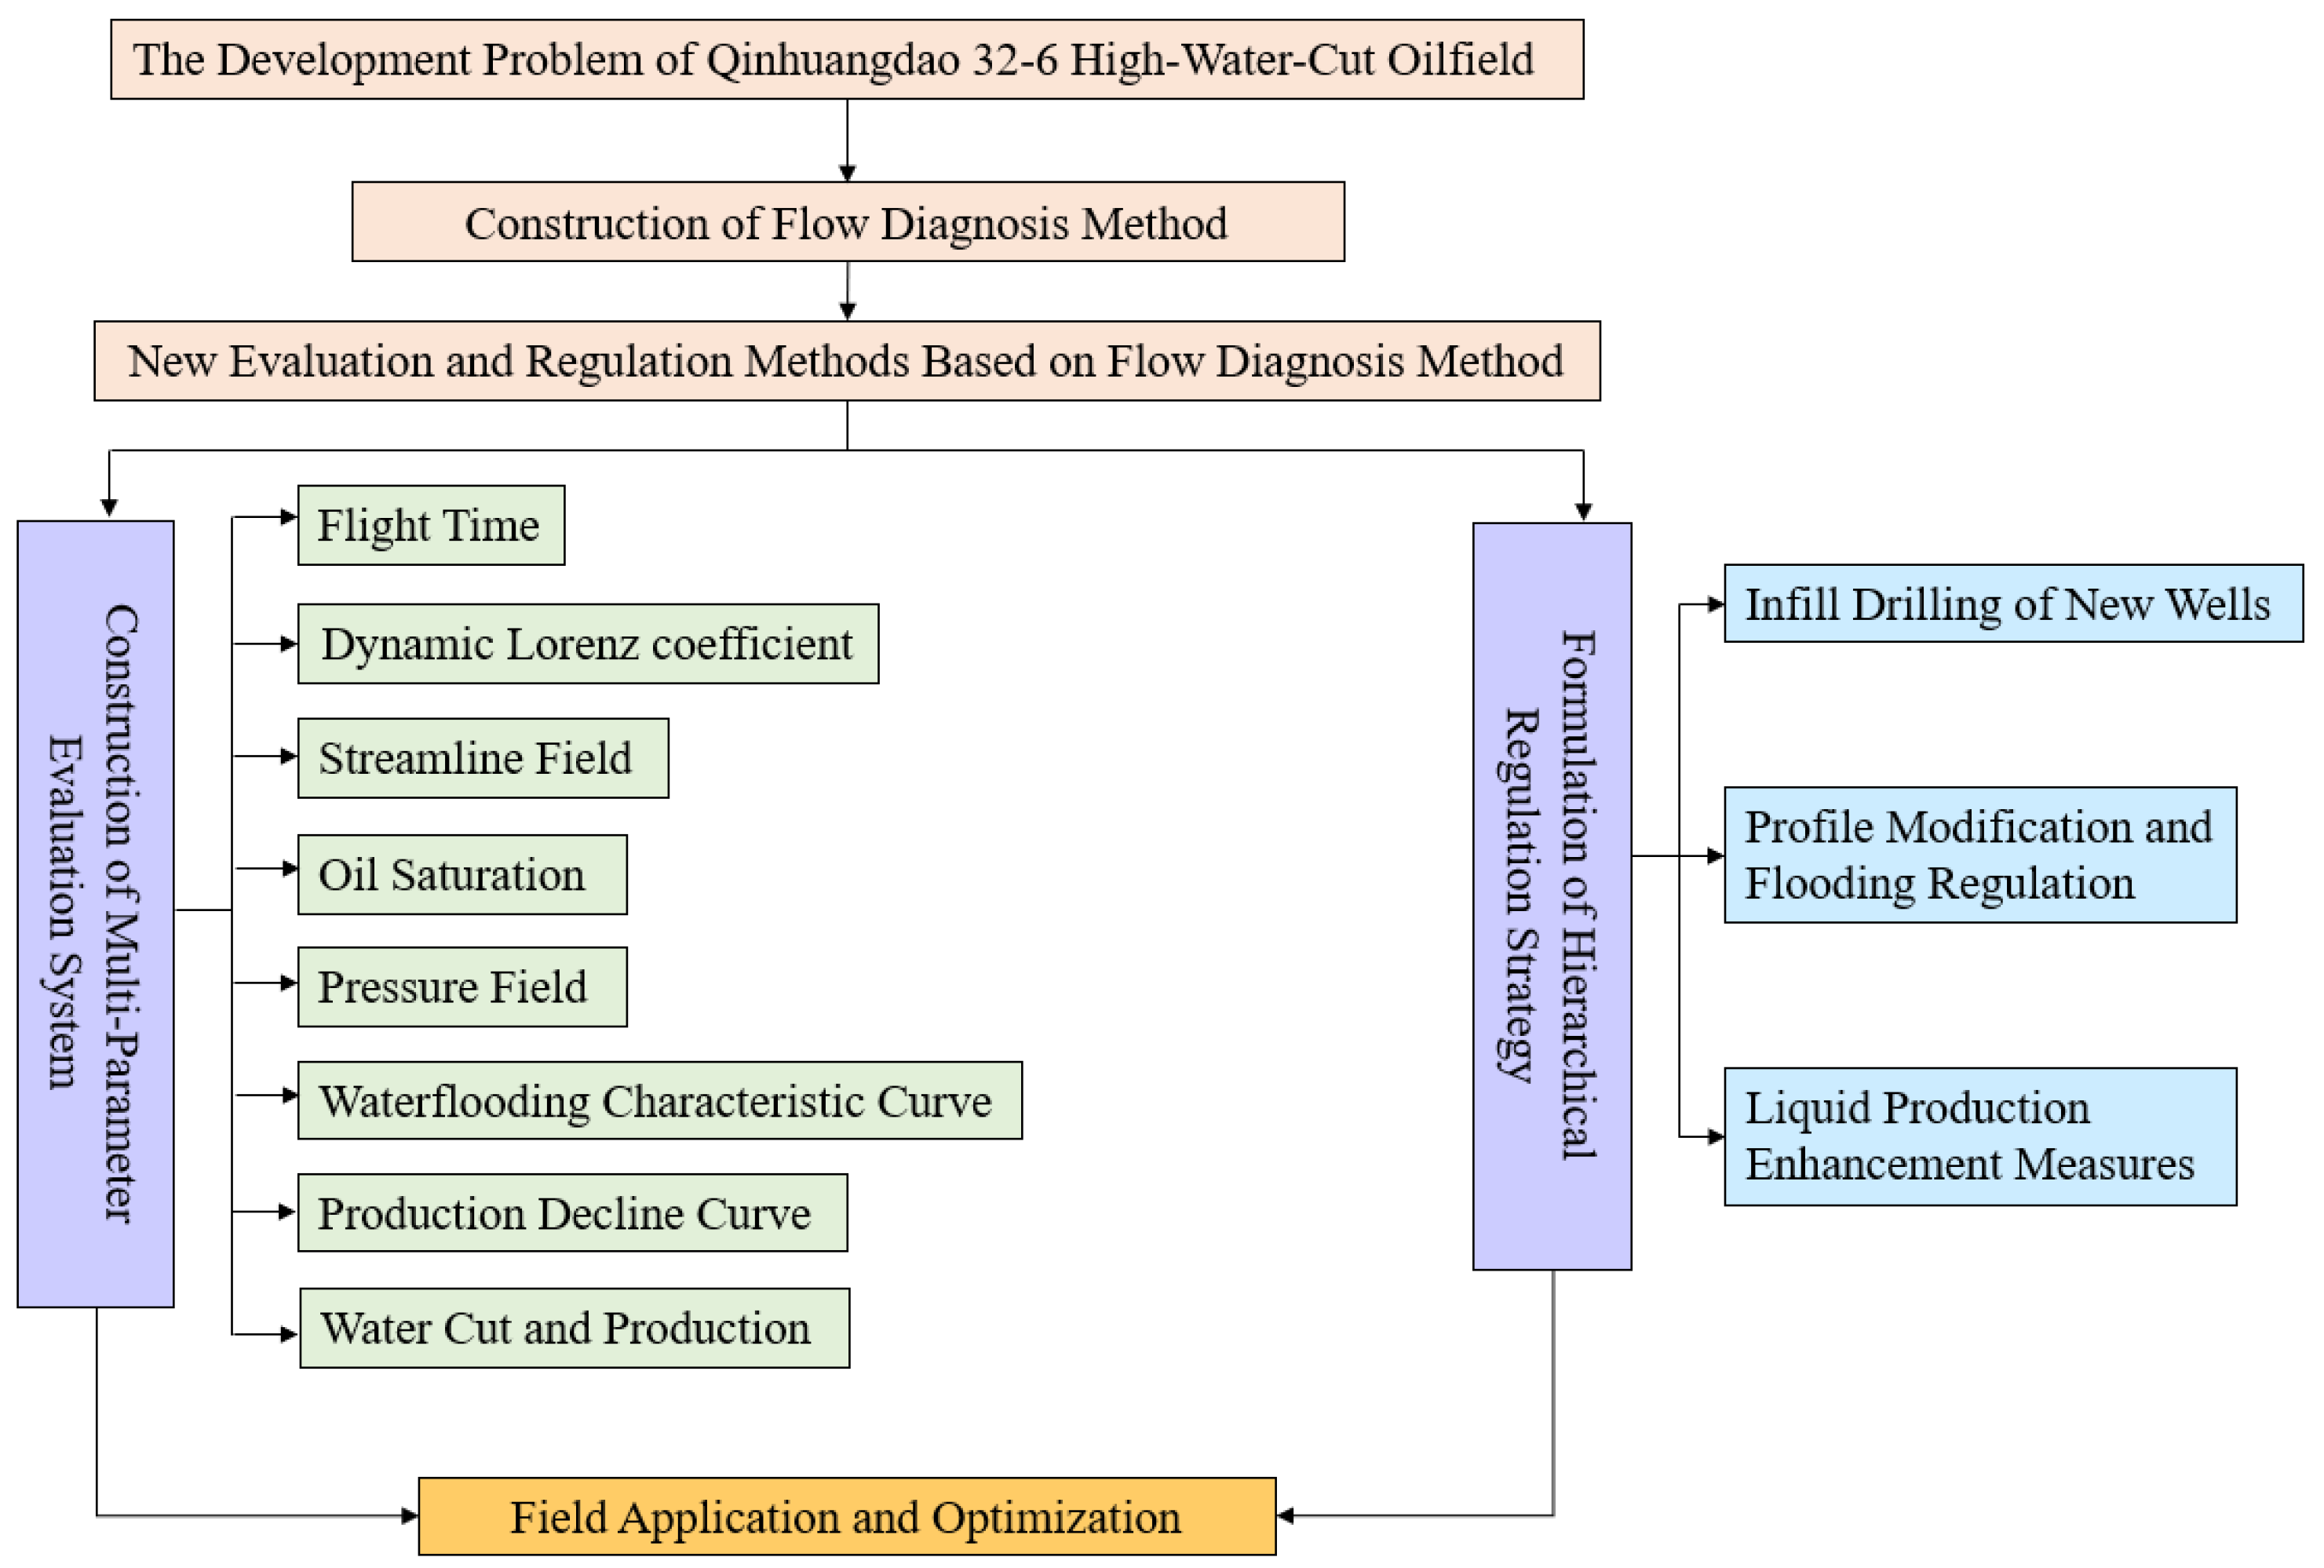
This study proposes and applies a flow diagnostics-based methodology to address the complex development challenges in the high water-cut QHD32-6 oilfield. The core of this approach is a multi-parameter evaluation system that integrates advanced diagnostic metrics—specifically time-of-flight (TOF) and a dynamic Lorenz coefficient—with established reservoir engineering techniques and numerical simulation outputs. The comprehensive system incorporates data from streamline fields, oil saturation and pressure distributions, waterflooding characteristic curves, and production decline analyses to achieve a precise, quantitative characterization of the waterflood displacement process. Based on this evaluation, a hierarchical adjustment strategy is formulated, encompassing infill drilling, conformance control, and artificial lift enhancement. The methodology’s effectiveness is validated through field application and optimization in the QHD32-6 oilfield, with the overall research workflow detailed in Figure 2.

2.1. Flow Diagnostics Method

To tackle issues in ultra-high water-cut reservoirs such as high water cut, declining oil production, and complex remaining oil distribution, flow diagnostics introduce time of flight (TOF) and dynamic Lorenz coefficient for precise waterflooding performance evaluation and adjustment optimization, providing scientific basis for development. The flow diagnostics model by Shahvali et al. [22] is based on incompressible fluid steady-state flow theory. For single-phase flow, the continuity and motion equations are:
· ν = q ~ , ν = K μ p
where is the divergence; ν is velocity (m/s); q ~ is source/sink strength (positive for sinks, negative for sources); K is permeability (μm2); μ is fluid viscosity (Pa·s); p is pressure (Pa). For waterflooding oilfields involving oil–water or oil–gas–water multiphase flow with significant mobility differences, the multiphase flow equation is:
· ν = q t ~ , ν = K λ t p
where q t ~ is total multiphase source/sink strength; λ t is total mobility, calculated from relative permeability curves given saturation distribution. Equation (2) unknowns are pressure and velocity, termed the pressure equation. With boundary conditions, pressure distribution is solved via linear algebra, yielding fluid velocity. If multiphase unsteady flow simulations are available, more accurate pressure values can be used directly for velocity computation.
(1)
TOF Equation
Pressure or velocity fields alone cannot fully describe actual fluid migration; visualization aids like streamline methods are needed to track fluids effectively, characterizing fluid migration paths from injectors to producers in reservoirs. Streamlines are curves tangent to fluid particle velocity vectors at a given time, non-intersecting, reflecting flow paths. Let x(r) be a streamline at a moment, with r as arc length; by definition:
d x d r × ν x , t = 0
For a streamline at a given moment, the rate of change of x with respect to the arc length r is equal to the component of the velocity vector in the x direction divided by the magnitude of the velocity vector.
This can also be written as:
d x d r = ν ( t ^ ) ν ( t ^ )
To further describe displacement intensity within different injection sweep ranges, the concept of TOF is adopted instead of arc length. The mathematical expression for TOF is:
τ r = 0 r ϕ ( x ( s ) ) ν ( x ( s ) )
where τ is the time (s) for a particle to travel a distance along the streamline; defined as interstitial velocity; ϕ is the distance coordinate along the streamline.
Computing TOF via the above requires solving the velocity field, tracing streamlines ν ( x ( s ) ) , and numerical integration along them. This study establishes a TOF equation based on finite integration, directly solved to avoid cumbersome streamline tracing and integration. Differentiating Equation (5) using calculus and directional derivatives yields:
d τ d r = ϕ ν = v ν · τ
Considering both injectors and producers, forward and backward TOF equations are defined.
The forward TOF equation is:
ν · τ f = ϕ ,         τ f i n f l o w = 0
This describes the time for a particle to travel from the nearest source or inflow boundary along a streamline to a point. τ f i n f l o w is the time at the nearest source (starting point). The backward TOF equation is:
ν · τ b = ϕ , τ b o u t f l o w = 0
τ b o u t f l o w is the time to the nearest sink or outflow. The sum of forward and backward TOF reflects the time for a particle from source along the streamline to sink. TOF values are determined by static properties like porosity and permeability, and dynamic attributes like injection–production intensity and fluid mobility. Compared to pressure and velocity fields, TOF comprehensively characterizes seepage resistance and dominant flow directions in water-injection reservoirs, evaluating injection sweep range, displacement intensity, and waterflooding efficiency. High-TOF regions often indicate poor properties or imperfect well patterns, potentially areas difficult for injected fluids to sweep.
(2)
Tracer Concentration Equation
The time-of-flight (TOF) method only reflects fluid migration velocity, making it challenging to characterize injected fluid distribution and inter-well connectivity in reservoirs. Tracer simulation adds compatible tracers at injectors to track movement trajectories, assessing fluid allocation and inter-well connectivity. To delineate well control regions, tracers label well positions, establishing tracer equations along fixed streamlines, neglecting adsorption and diffusion. As development time increases, tracer sweep expands, precisely characterizing fluid distribution and dynamic properties, providing key basis for reservoir management. The tracer concentration equation mirrors conventional mass transfer equations:
( ϕ C ) t + · ν C = q ~ C
where C is tracer concentration (mg/L); is the gradient operator; ν is velocity (m/s); q ~ is source/sink strength (positive for sinks, negative for sources).
Consider a simple tracer simulation experiment: set tracer concentration at one injector to 1, others to 0; neglecting diffusion, tracer concentration reflects regions swept by injected fluid. At steady state, tracer concentration distribution is solved by:
ν · C = 0
where C is the tracer concentration gradient from injection to production. Similar to TOF equations, injector and producer tracer equations are defined.
The injector tracer equation is:
ν · C i k = 0 , C i k i n f l o w = 1
In Equation (11), C i k represents concentration gradient for a specific injector or inflow boundary point, describing the extent of influence from that source or boundary on a reservoir point.
The producer tracer equation is:
ν · C p k = 0 , C p k o u t f l o w = 1
In Equation (12), C p k o u t f l o w represents a producer or outflow boundary point, describing the extent of influence from that sink or boundary on a reservoir point. After solving tracer concentration equations for injection and production wells, concentrations C label injection–production pairs, enabling delineation of pairs, computation of control volumes, fluid allocation coefficients, etc.
Table 2 provides a more detailed explanation of the aforementioned equations.

2.2. Quantitative Diagnostic Evaluation System for Water Injection Development Performance

Conventional waterflood evaluation systems exhibit significant limitations. First, traditional reservoir engineering methods, which rely on metrics such as water cut and production decline rates, effectively capture the performance of individual wells or well groups but fail to quantitatively delineate injection–production correspondence or subsurface fluid migration pathways. Second, while numerical simulation can visualize saturation and velocity fields, it often lacks the sensitivity required to quantify changes in sweep efficiency or displacement intensity, particularly in the ultra-high water-cut stage.
To overcome these deficiencies, this study establishes a quantitative diagnostic evaluation system that serves as a robust supplement to existing methods. This system is founded on principles derived from time-of-flight (TOF) calculations and tracer analysis and is structured around four core indicators:
(1)
Time-of-Flight (TOF): Quantitatively describes the injection sweep range, defines displacement fronts, and assesses displacement intensity.
(2)
Dynamic Lorenz coefficient: Characterizes the uniformity of displacement and the heterogeneity of flow distribution within an injection–production pattern.
(3)
Injection–Production Communication Volume: Measures the degree of inter-well connectivity and the effective sweep efficiency of the injected fluids.
(4)
Inter-well Fluid Allocation Factor: Assesses the dynamic correspondence and fluid transfer architecture between injectors and producers.
The calculation and application of each indicator are detailed in the subsequent sections.
(a)
Time-of-Flight (TOF)
Time-of-flight is computed by solving the TOF equation, yielding three distinct metrics: forward TOF, backward TOF, and total TOF. Forward TOF represents the transit time from the nearest injection source to a specific grid block, thereby characterizing the injection sweep volume. Conversely, backward TOF measures the time from a grid block to the nearest production sink, defining the drainage volume. The sum of these two, the total TOF, reflects the overall hydraulic resistance, or tortuosity, of the flow path between an injector–producer pair.
The spatial distribution of TOF effectively delineates high-velocity flow paths from stagnant, unswept regions. Areas with low τ values indicate rapid fluid transit and high displacement intensity, often corresponding to preferential flow channels. In contrast, regions with high τ values signify areas that remain poorly swept under the current operational strategy, thereby identifying them as priority targets for subsequent interventions, such as infill drilling or conformance control.
(b)
Dynamic Heterogeneity
Reservoir heterogeneity, particularly in permeability, is a primary factor governing fluid flow and connectivity. Static measures of heterogeneity, such as the Lorenz coefficient or Dykstra–Parsons coefficient, have been widely used but often exhibit a weak correlation with ultimate recovery. This is because static parameters like permeability and porosity do not account for the dynamic interactions between geological heterogeneity, the evolving flow field, and the specific well pattern. Consequently, assessments based solely on static data may be unreliable for predicting dynamic reservoir performance.
As a dynamic indicator, TOF provides a more insightful characterization of multiphase flow by inherently capturing the interplay between reservoir heterogeneity and the flow field under defined operational and boundary conditions. This offers a superior description compared to relying on pressure or velocity fields alone. Static heterogeneity governs the distribution of storage capacity and intrinsic fluid mobility, whereas dynamic heterogeneity reflects variations in the effective flow path lengths and communication structures that emerge during production. By integrating TOF-based analysis with static heterogeneity evaluation, we construct a dynamic heterogeneity evaluation system. This provides a more precise and physically grounded basis for analyzing the reservoir flow field and optimizing development strategies.
(1)
F-Φ Diagnostic Curve
Assume the reservoir consists of N independent flow tubes, each with volume V i and flow rate q i ; total TOF is the fluid transit time or residence time in the tube, τ i = V i / q i . Sort N flow tubes by ascending residence time, τ 1 τ 2 τ N . Assuming piston-like displacement in each tube, define normalized storage capacity Φi and flow capacity Fi as:
storage   capacity :   Φ i = j = 1 i V j / j = 1 N V j
flow   capacity :   F i = j = 1 i q i / j = 1 N q j
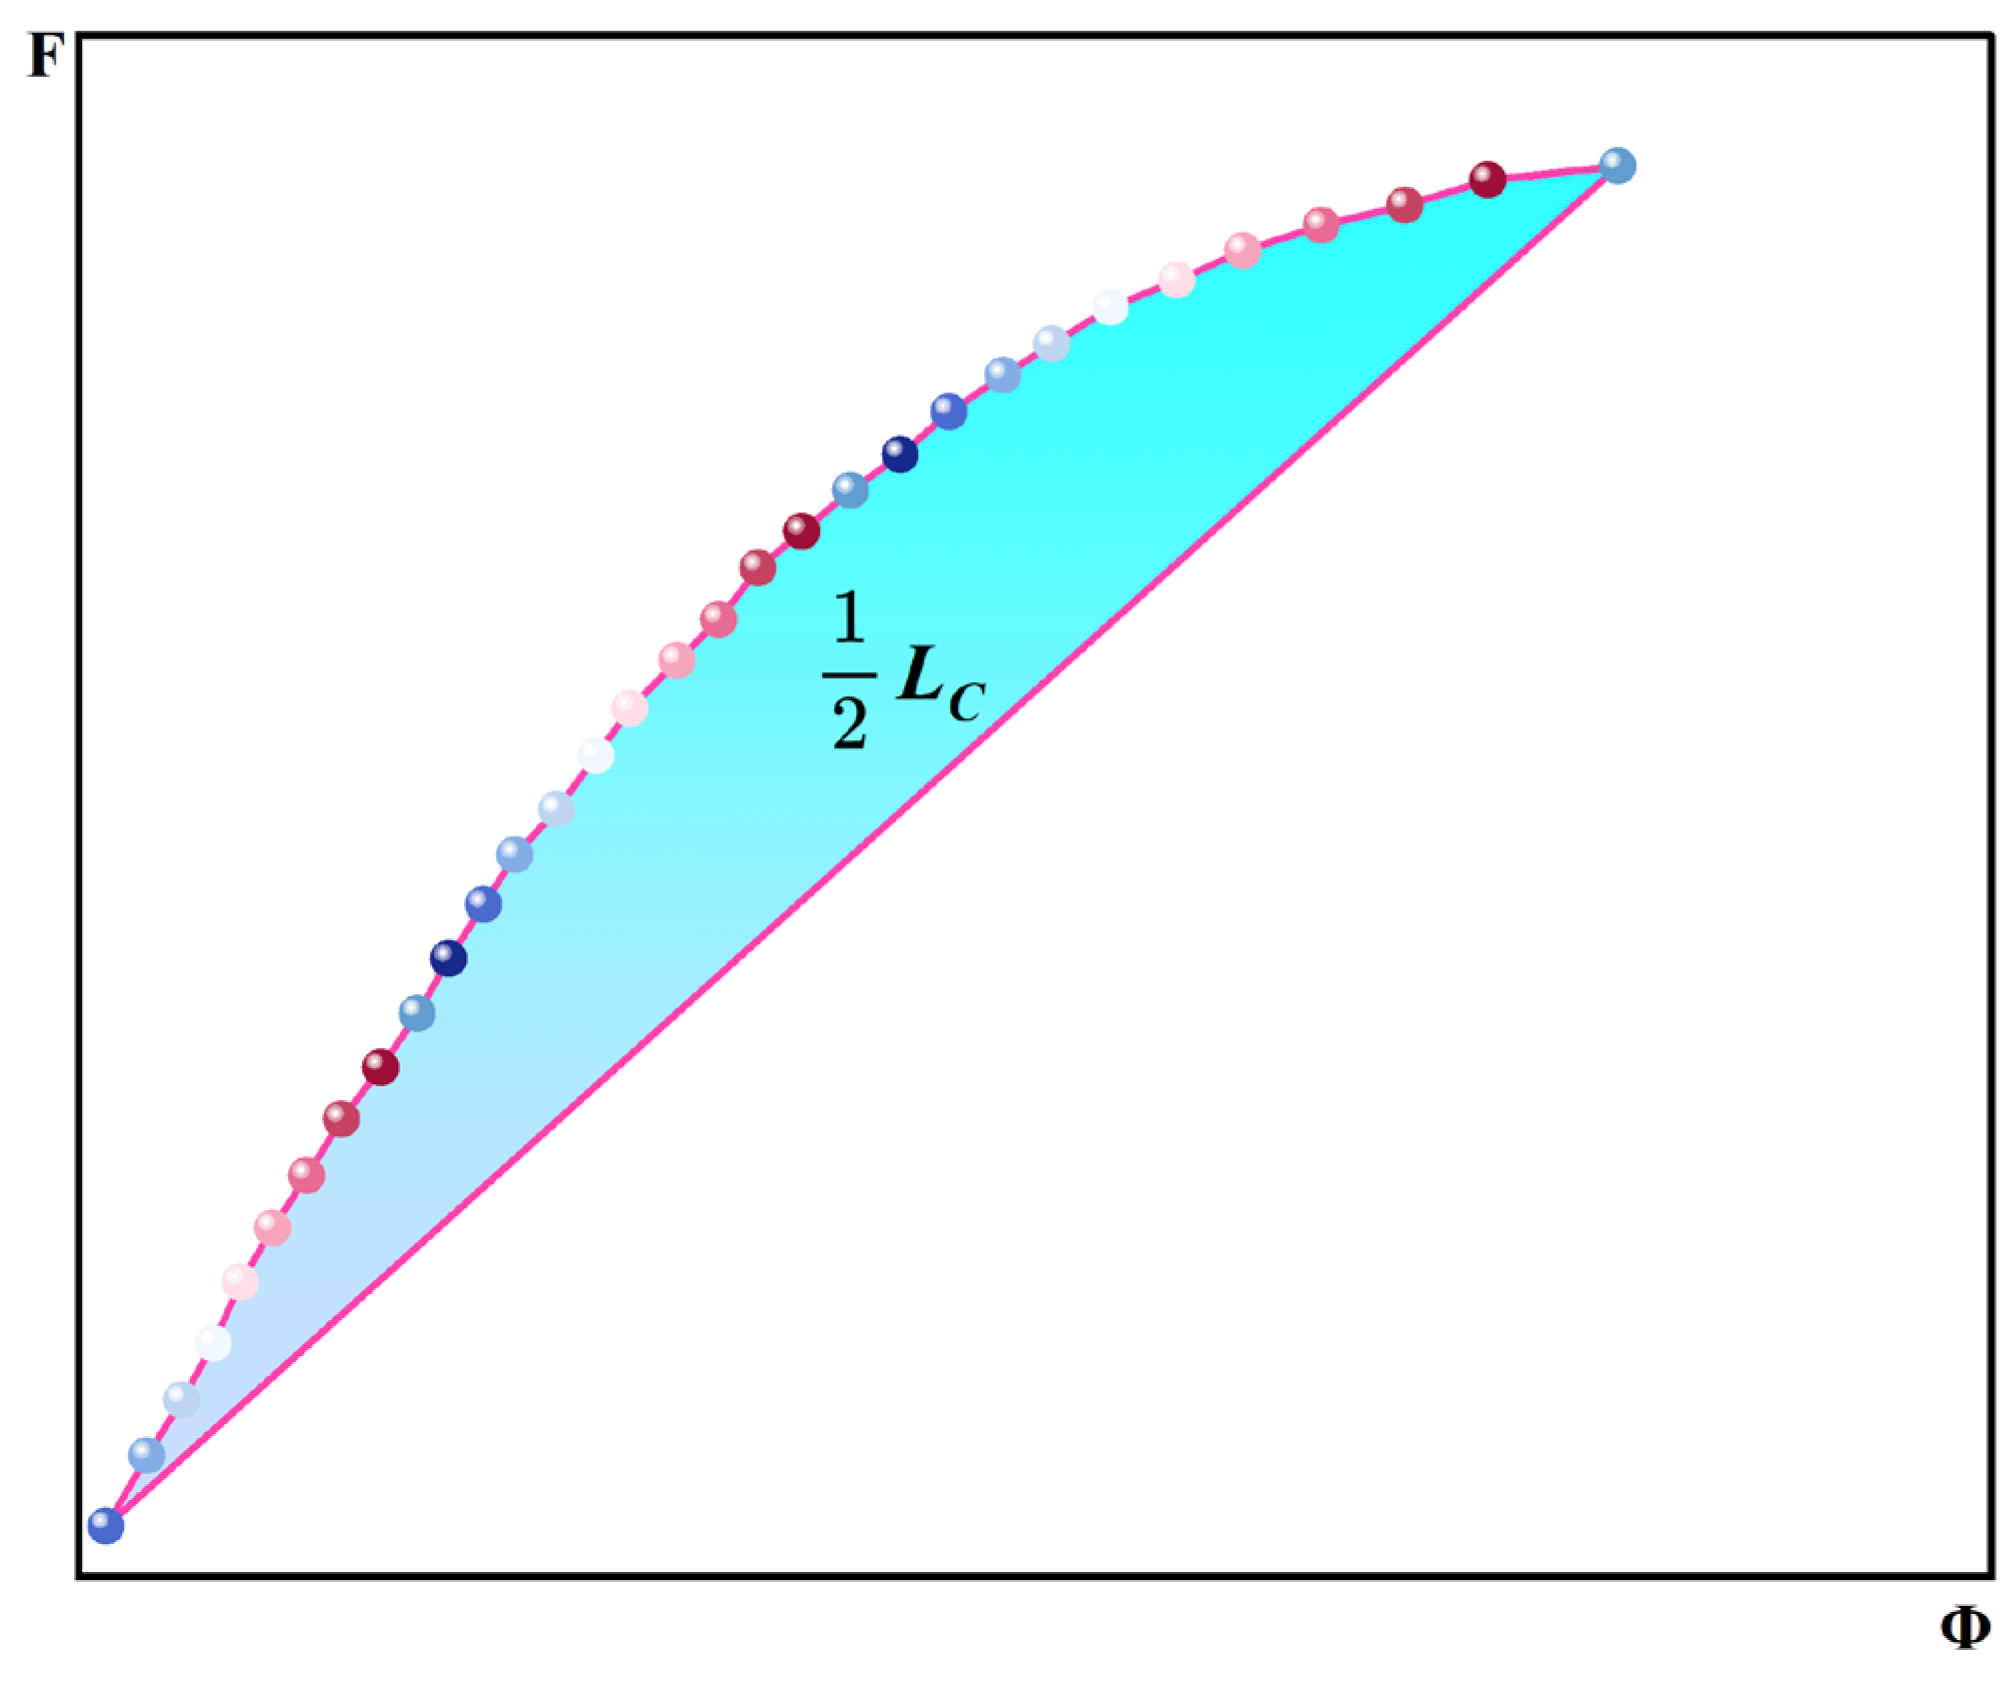
Thus, Φi is the ratio of flow tube volumes with breakthrough at τi to total volume, and Fi is the corresponding fractional flow, i.e., produced injected fluid ratio to total. The F-Φ relationship curve resembles the fractional flow curve f-Sw, reflecting displacement uniformity. Figure 3 shows typical F-Φ curves, with the light blue solid line for uniform displacement and dotted line for nonuniform.
(2)
Dynamic Lorenz Coefficient
From storage and flow capacities, the dynamic Lorenz coefficient is further defined as:
L c = 2 0 1 ( F Φ Φ ) d Φ
When considering remaining oil distribution, it is modified to:
L c = 2 0 1 ( F Φ Φ ) S o d Φ
The dynamic Lorenz coefficient quantitatively indicates reservoir displacement heterogeneity, as the envelope area between the F-Φ curve and the 45-degree line. Higher Lc indicates more uneven displacement; for fully uniform displacement, Lc = 0. By computing dynamic Lorenz coefficients for the reservoir, layers, and well groups, waterflooding efficiency can be measured hierarchically, identifying remaining oil potential tapping targets.
(3)
Injection–Production Communication Volume
From tracer equations, tracer concentration distributions for each well are solved, labeling reservoir regions to determine injection–production control ranges.
Injection   Well   Sweep   Volume   V i = k V k i = k c k i V k G C
Production   Well   Drainage   Volume   V j = k V k j = k c k j V k G C
Injection Production   Communication   Volume   V i j = k V k i j = k c k i c k j V k G C
where c k i is injector i tracer concentration distribution; c k j is producer j tracer concentration distribution; k is grid index; V k G C is grid pore volume.
The injection–production communication volume calculated from tracer concentration equations reflects the ultimate achievable communication state under current well patterns and production conditions. Combined with TOF between injection–production pairs, it effectively guides well pattern optimization and provides scientific basis for assessing remaining oil potential tapping.
(4)
Inter-Well Fluid Allocation Factor
Similar to communication volume, tracer concentration distributions also label inter-well fluid allocation.
Injection allocation factor:
a n i m w k n = q i w k n c m p w k n
Production allocation factor:
a n p m w k m = q p w k m c n i w k m
where c n i is the injector n tracer concentration (mg/L); c m p is the producer m tracer concentration (mg/L); w k n ( m ) is the perforation grids for well n or m; q is the injection–production rate.
The selection of the four core indicators—time-of-flight (TOF), dynamic Lorenz coefficient, injection–production communication volume, and inter-well fluid allocation factor—is based on their collective ability to precisely quantify waterflood displacement processes, flow field heterogeneity, and dynamic inter-well relationships. Each metric provides a unique diagnostic perspective: TOF characterizes hydraulic resistance by identifying high- and low-permeability pathways; the dynamic Lorenz coefficient quantifies flow field non-uniformity; communication volume assesses inter-well connectivity; and the allocation factor details the fluid distribution between injector–producer pairs. Together, these indicators form a comprehensive evaluation system that integrates dynamic and static data across multiple scales to precisely analyze waterflood performance in high water-cut reservoirs.
The comparative strengths of these advanced diagnostics versus traditional methods are illustrated in Figure 4. The radar charts evaluate various metrics against key performance criteria. Figure 4a demonstrates the complementary nature of the flow diagnostic indicators. For instance, TOF excels at evaluating displacement intensity and mapping oil–water movement, while the dynamic Lorenz coefficient and oil saturation provide superior quantification of dynamic heterogeneity and material balance. The streamline field is unparalleled in characterizing displacement direction. This visualization highlights how the indicators collectively provide a holistic assessment. In contrast, Figure 4b shows the limitations of conventional tools. While metrics like waterflooding characteristic curves and pressure fields can effectively describe oil–water movement, they, along with production decline curves, are less effective at quantifying material basis, characterizing displacement direction, and assessing dynamic heterogeneity. Although simpler to implement, their diagnostic precision is significantly lower. This analysis validates the superiority of the proposed flow diagnostics system, emphasizing its ability to provide a more accurate basis for identifying remaining oil potential and guiding targeted development adjustments.
These visualizations, complemented by field-validated thresholds (e.g., dynamic Lorenz >0.5 for conformance control), demonstrate the method’s enhanced sensitivity over traditional tools, as evidenced in the QHD32-6 adjustments detailed in Section 3.

2.3. Hierarchical Adjustment Strategies for Water Injection Development

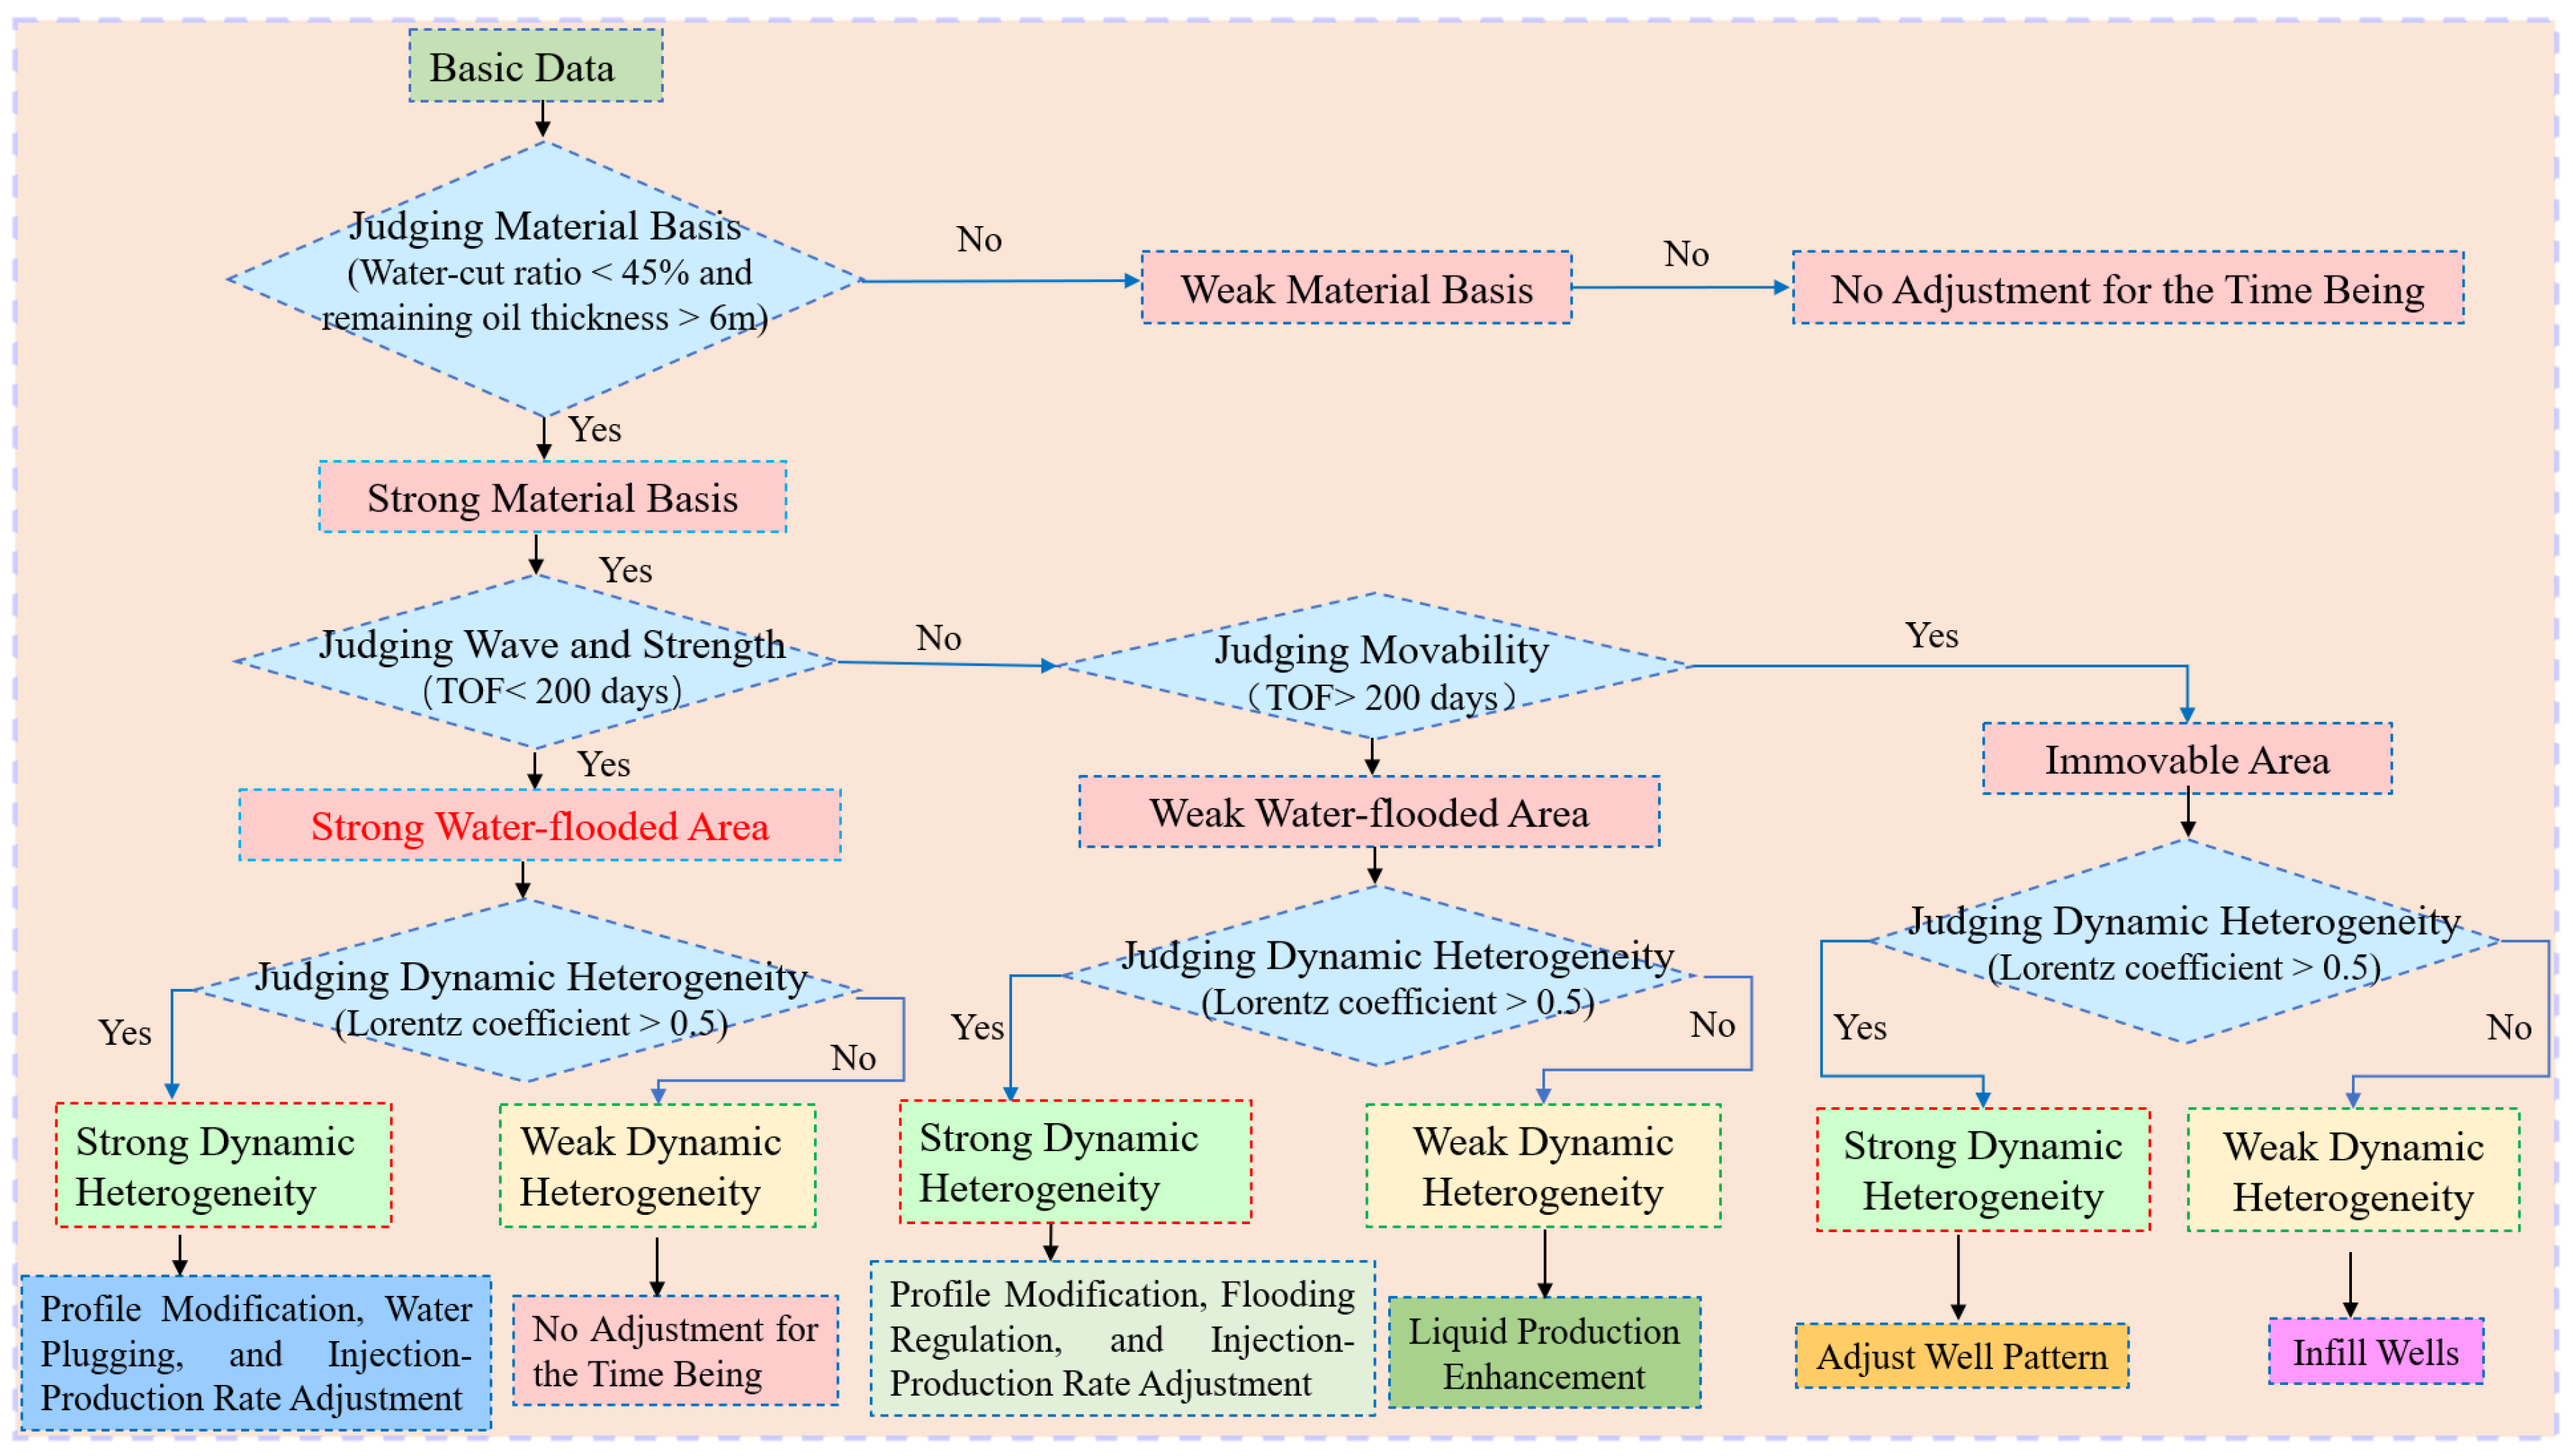
Building upon the diagnostic evaluation, a hierarchical adjustment strategy was developed to provide a systematic management framework, as depicted in the workflow in Figure 5. This decision-making process begins with a primary screening for material basis, where a region is considered a candidate for intervention only if its water-cut ratio is below 45% and remaining oil thickness exceeds 6 m. For qualified regions, the strategy then bifurcates based on a TOF threshold of 200 days. Areas identified as “Strongly Water-flooded” (TOF < 200 days) are further assessed for dynamic heterogeneity; if high (Lorenz coefficient > 0.5), profile modification and water plugging are prescribed to mitigate channeling, otherwise, no immediate action is needed. Conversely, for “Weakly Water-flooded” or “Immovable” regions (TOF > 200 days), which hold significant remaining oil potential, interventions are similarly guided by heterogeneity. Low-heterogeneity zones are targeted for artificial lift enhancement or infill drilling, while high-heterogeneity zones require conformance control or well pattern adjustments to improve sweep efficiency and access unswept reserves. This structured approach ensures that specific interventions are precisely matched to the diagnosed reservoir conditions.

2.4. Limitations and Uncertainty Considerations

The flow diagnostics method relies on inputs like permeability (k) and porosity (φ), which affect total mobility in Equation (2) and TOF computations (Equations (5)–(8)). Uncertainties from core/log data (±10–20% for k in heterogeneous reservoirs) may alter TOF, potentially misidentifying sweep thresholds (e.g., TOF <50 days for channeling). Similarly, Lorenz coefficient (Equation (15)) sensitivities to φ variations could overstate heterogeneity. Tracer Equations (9)–(12) assume steady-state, limiting transient accuracy.
Mitigation in this study used QHD32-6 history-matched simulations to calibrate inputs, aligning diagnostics with field trends. Future work could include ±15% perturbation analyses for threshold robustness. This qualitative approach complements the method’s visualization strengths and field validations.

3. Block Application and Practice

3.1. Block Overview

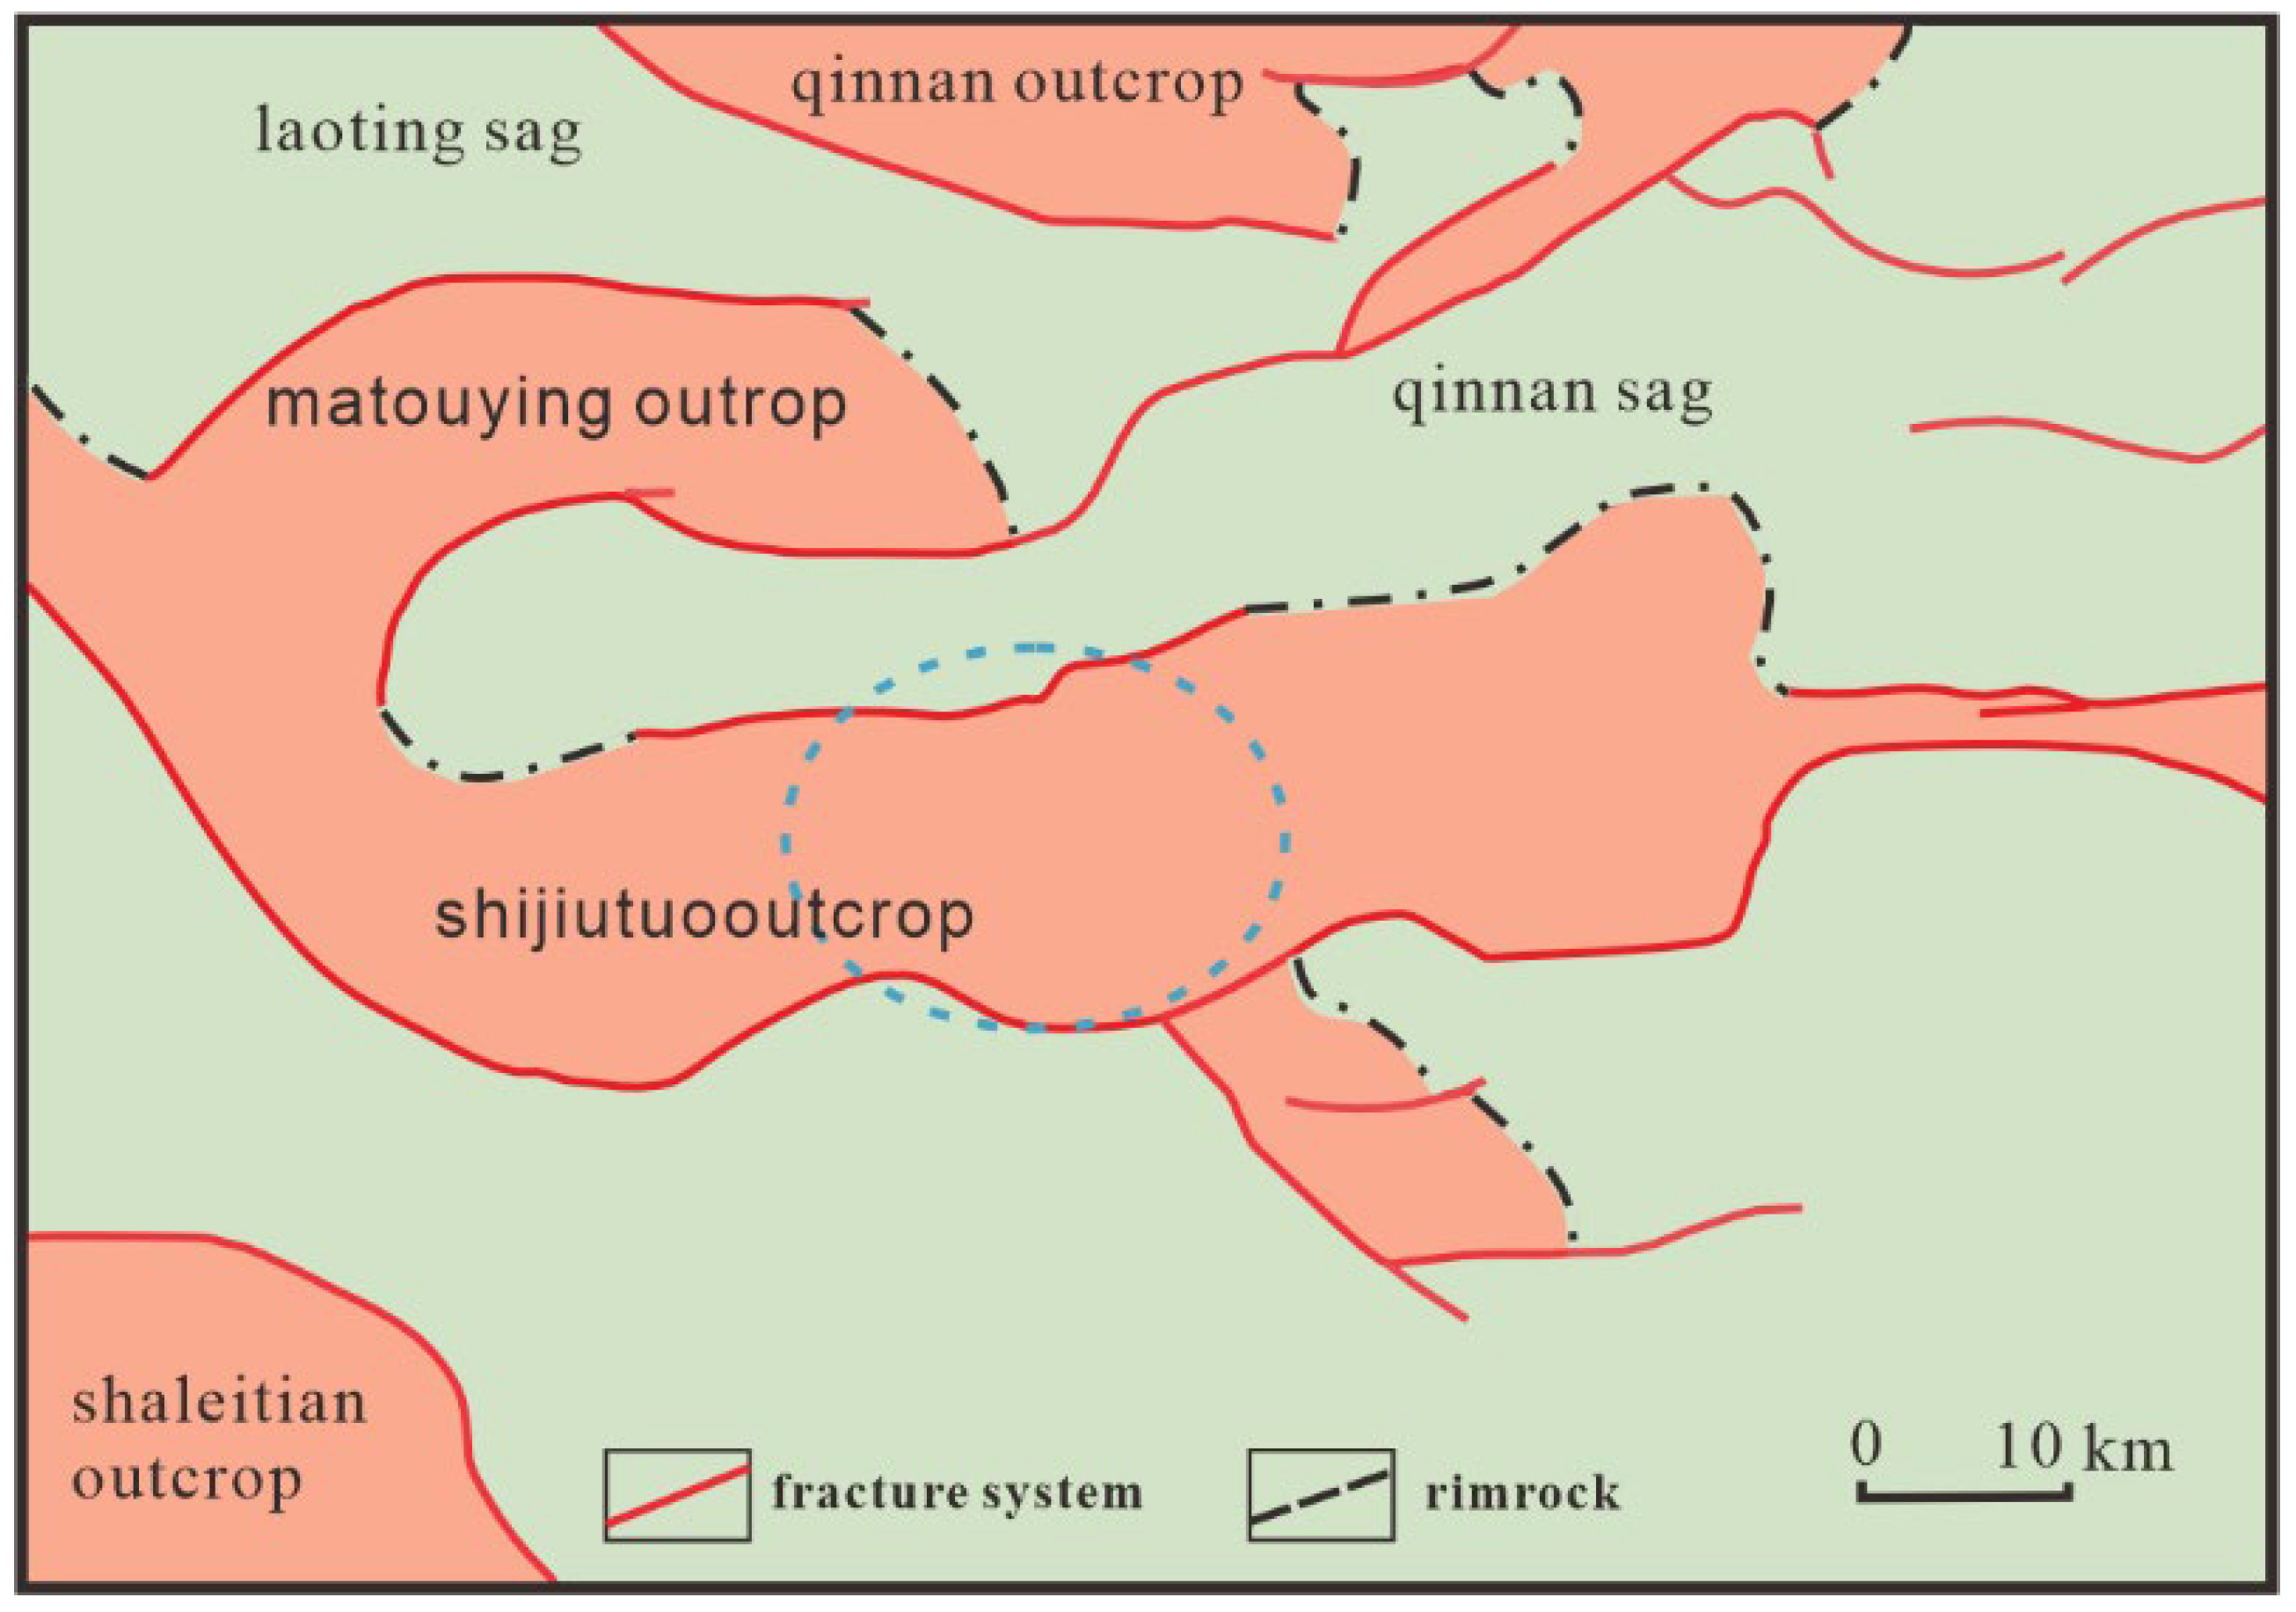
The QHD32-6 oilfield, the subject of this study, is a fluvial heavy oil reservoir located in the central Bohai Sea (Figure 6, blue dashed circle). Situated on a low-amplitude anticline structure over a paleo-uplift, the reservoir is characterized by medium porosity (32%), high permeability (2300 mD), and a crude oil viscosity range of 22–260 mPa·s. The field is subject to an active edge-bottom water drive and features a loose sandstone structure prone to sand production. Currently, it is in an ultra-high water-cut, mature development stage, with an overall water cut of 94% and a cumulative recovery factor of 18.4%. Although early operational adjustments effectively improved waterflooding performance, the current well pattern has led to a complex remaining oil distribution. This complexity, compounded by inaccurate performance characterization, has exacerbated the effects of reservoir heterogeneity and resulted in inefficient drainage of remaining reserves.

3.2. Water Injection Development Performance Evaluation in Target Block

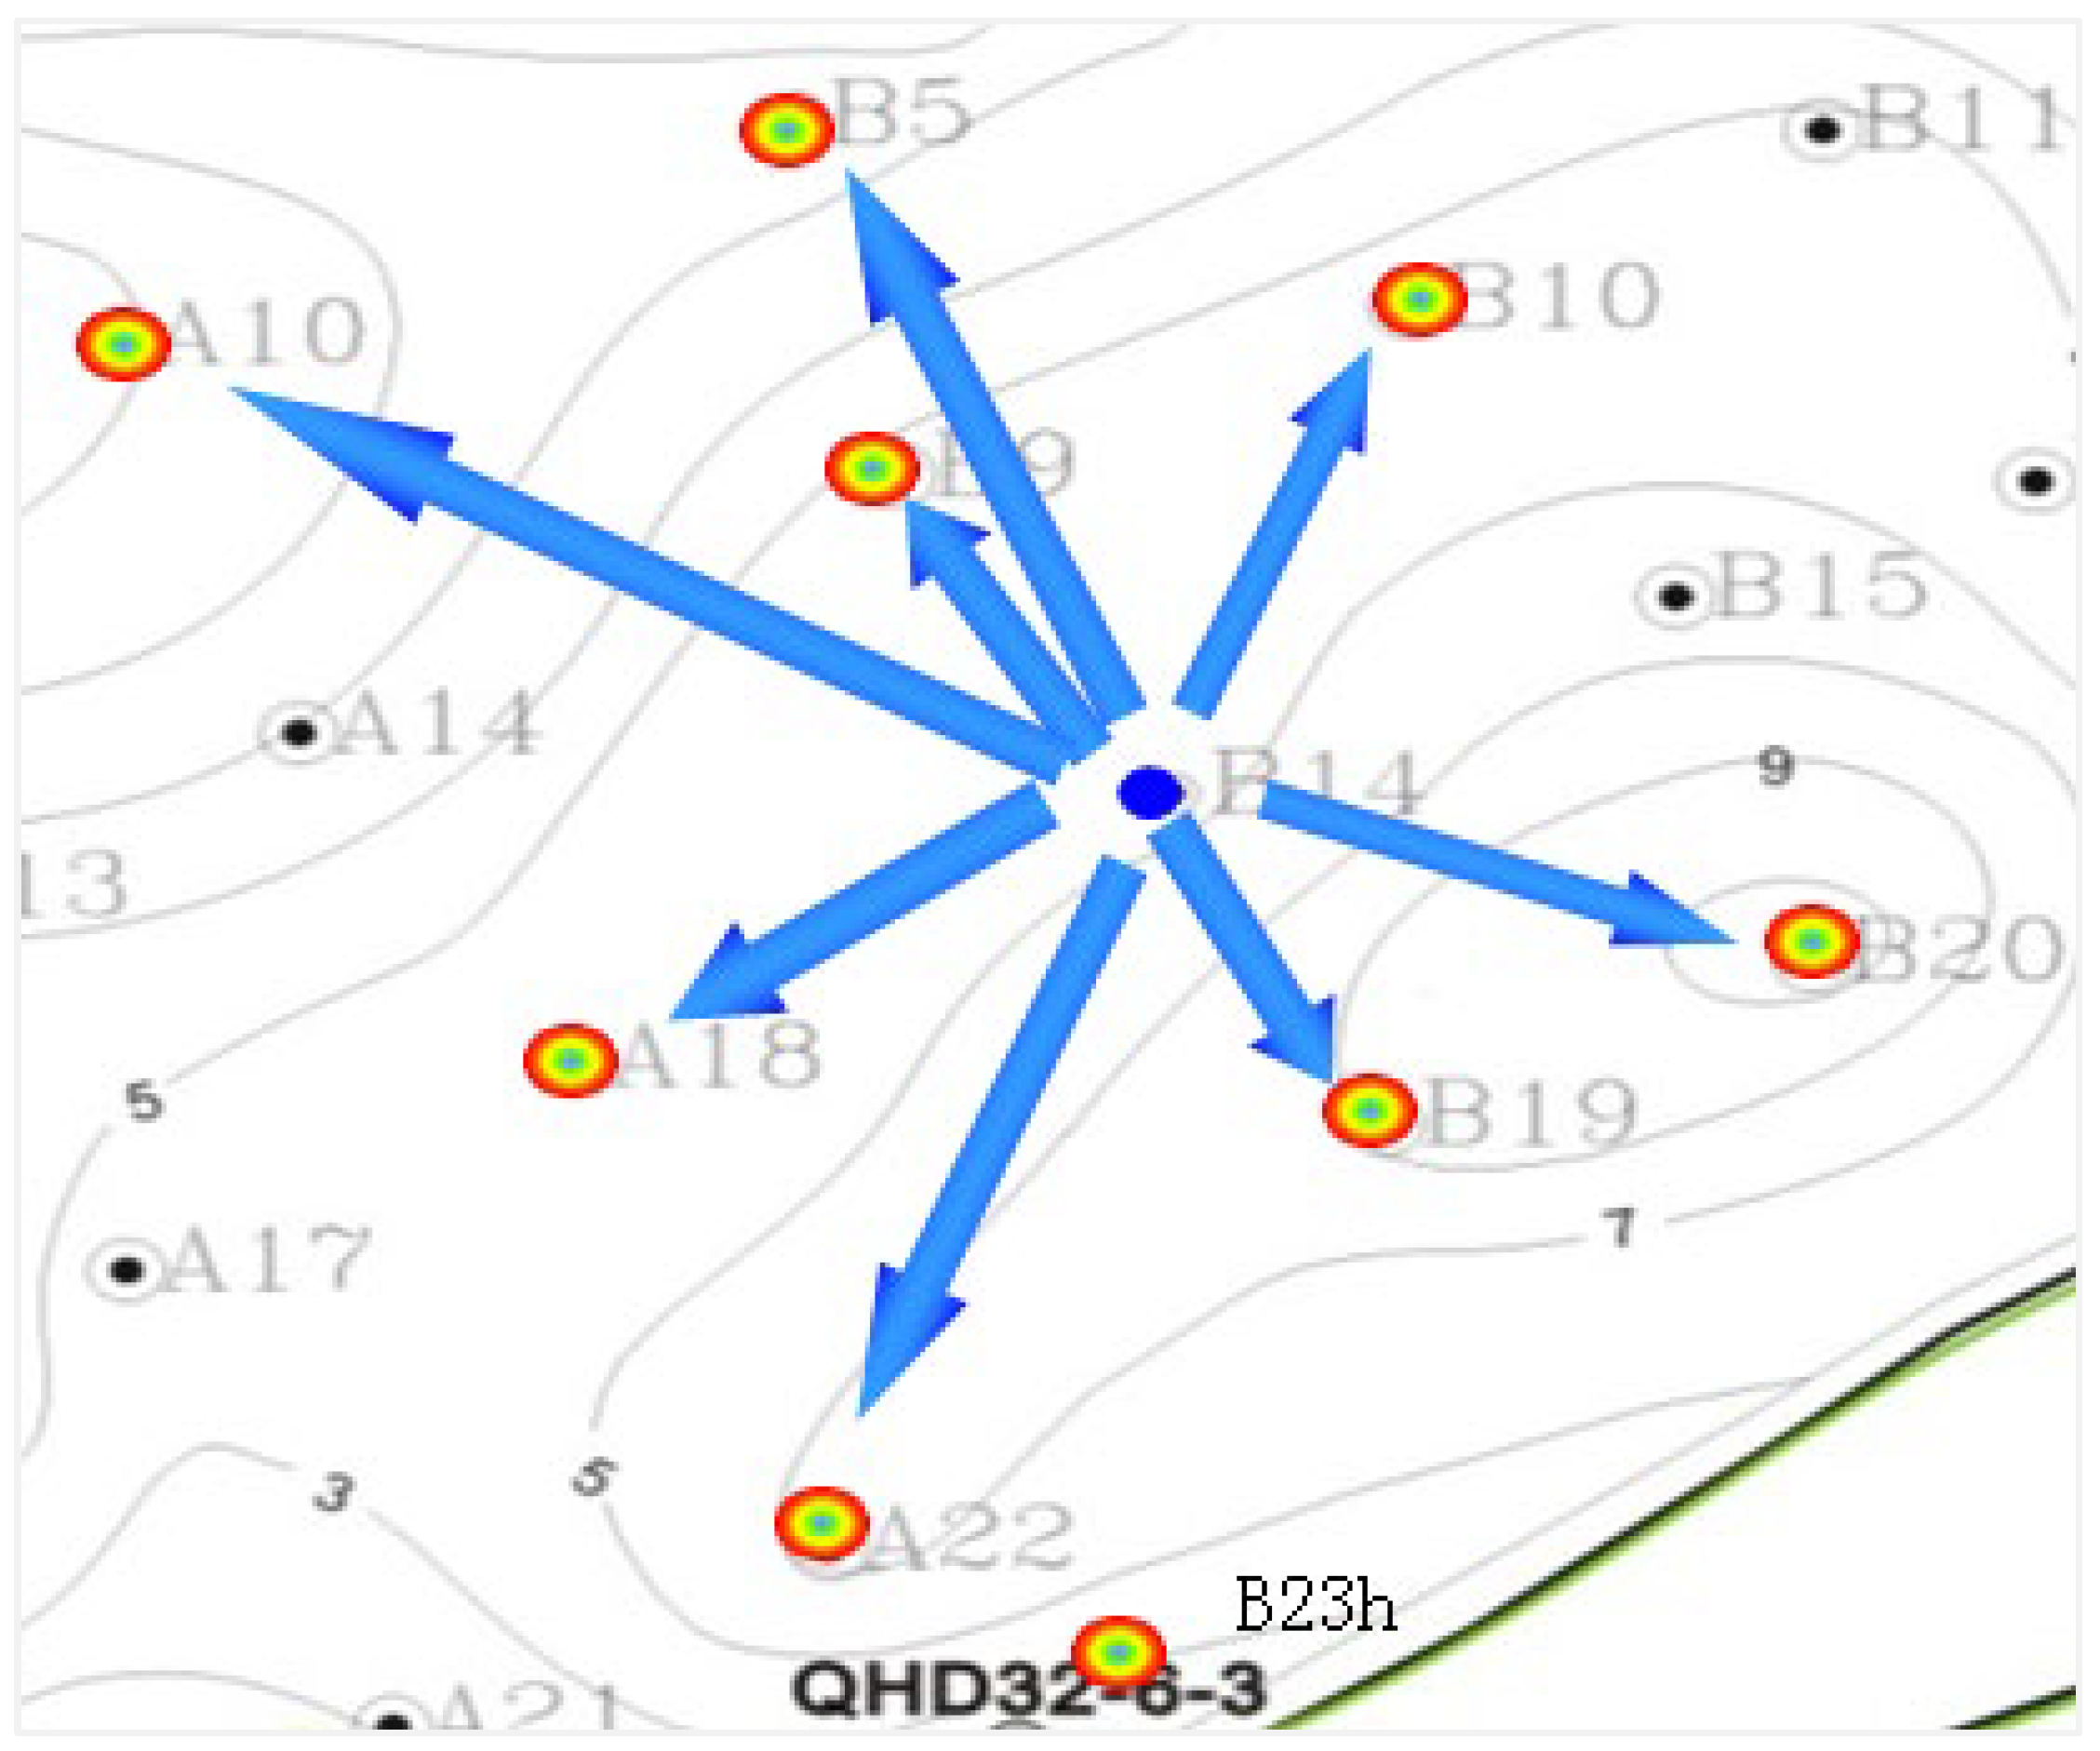
An evaluation of the B14 well group using flow diagnostics illustrates the system’s ability to identify preferential flow paths. As shown in Figure 7, streamline analysis reveals that injected water from the B14 well flows towards eight surrounding producers, with significantly stronger flow intensity directed at wells A10 and A22. This qualitative observation is quantitatively confirmed by the dynamic Lorenz coefficients (Figure 8), which were calculated to be 0.6679 for A10 and 0.7840 for A22. These high coefficient values are indicative of severe channeling and strong planar heterogeneity, where injected fluid preferentially sweeps along high-permeability pathways. This phenomenon leads to poor sweep efficiency in other parts of the pattern and contributes to an accelerated production decline.
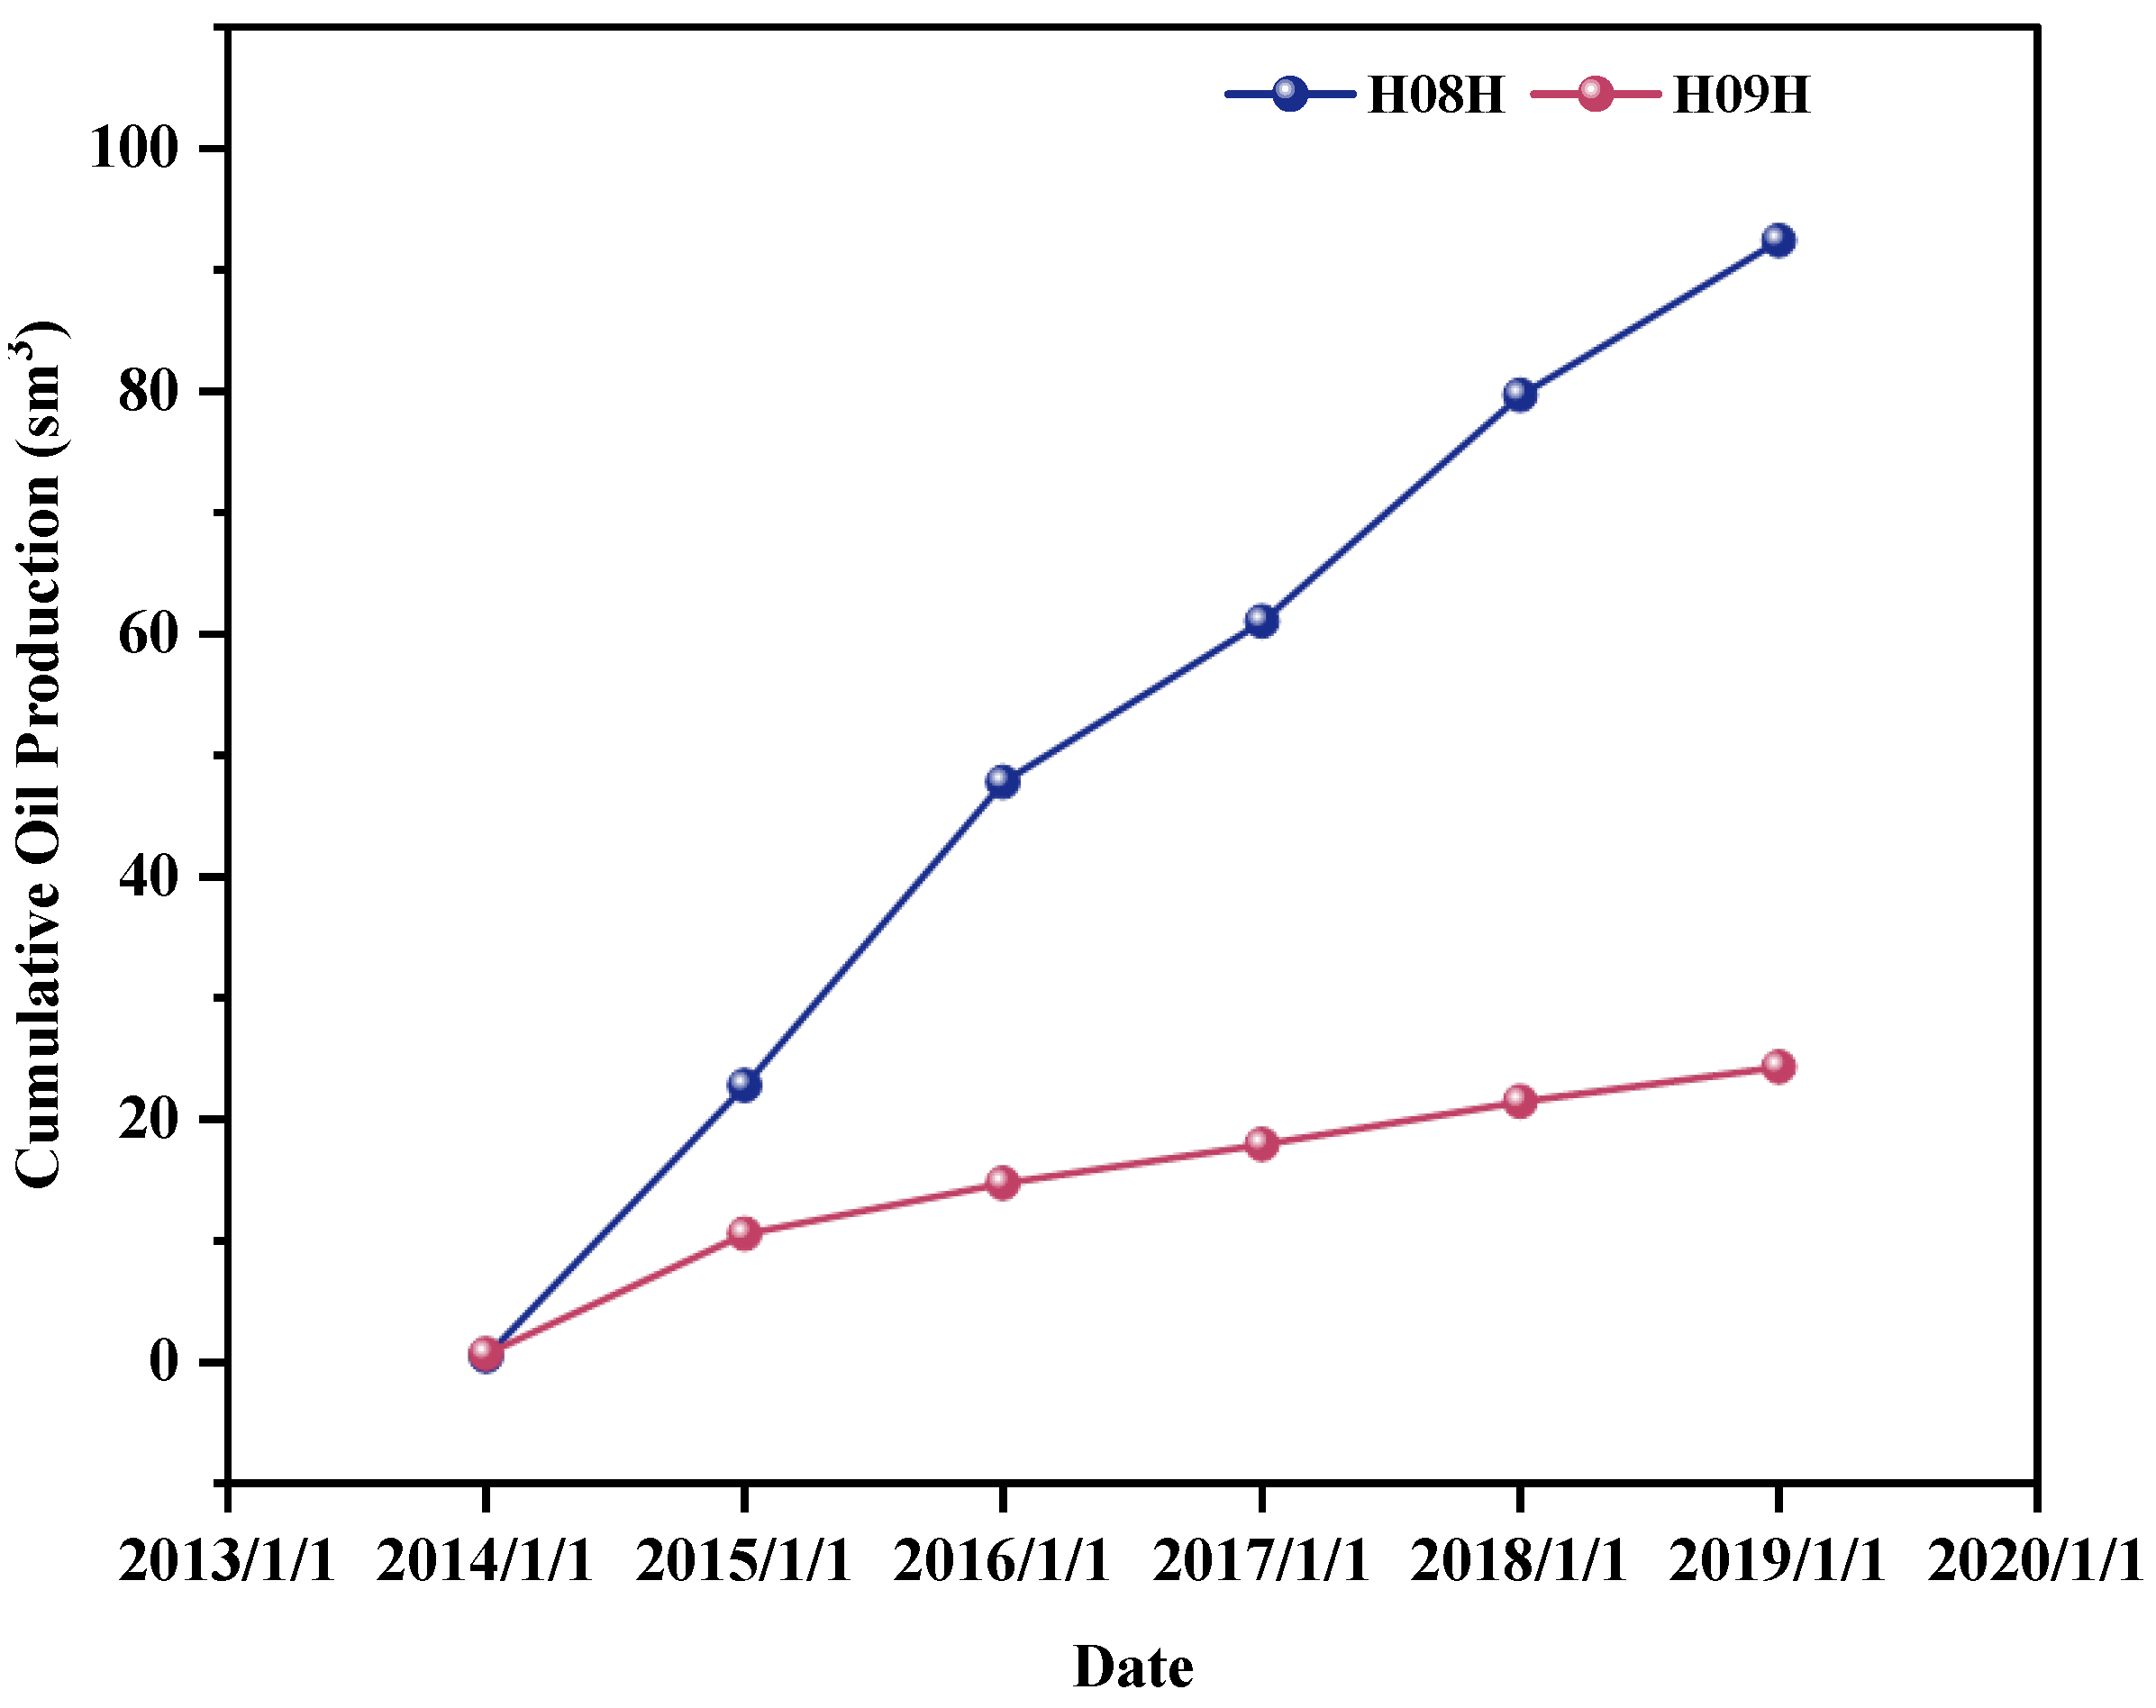
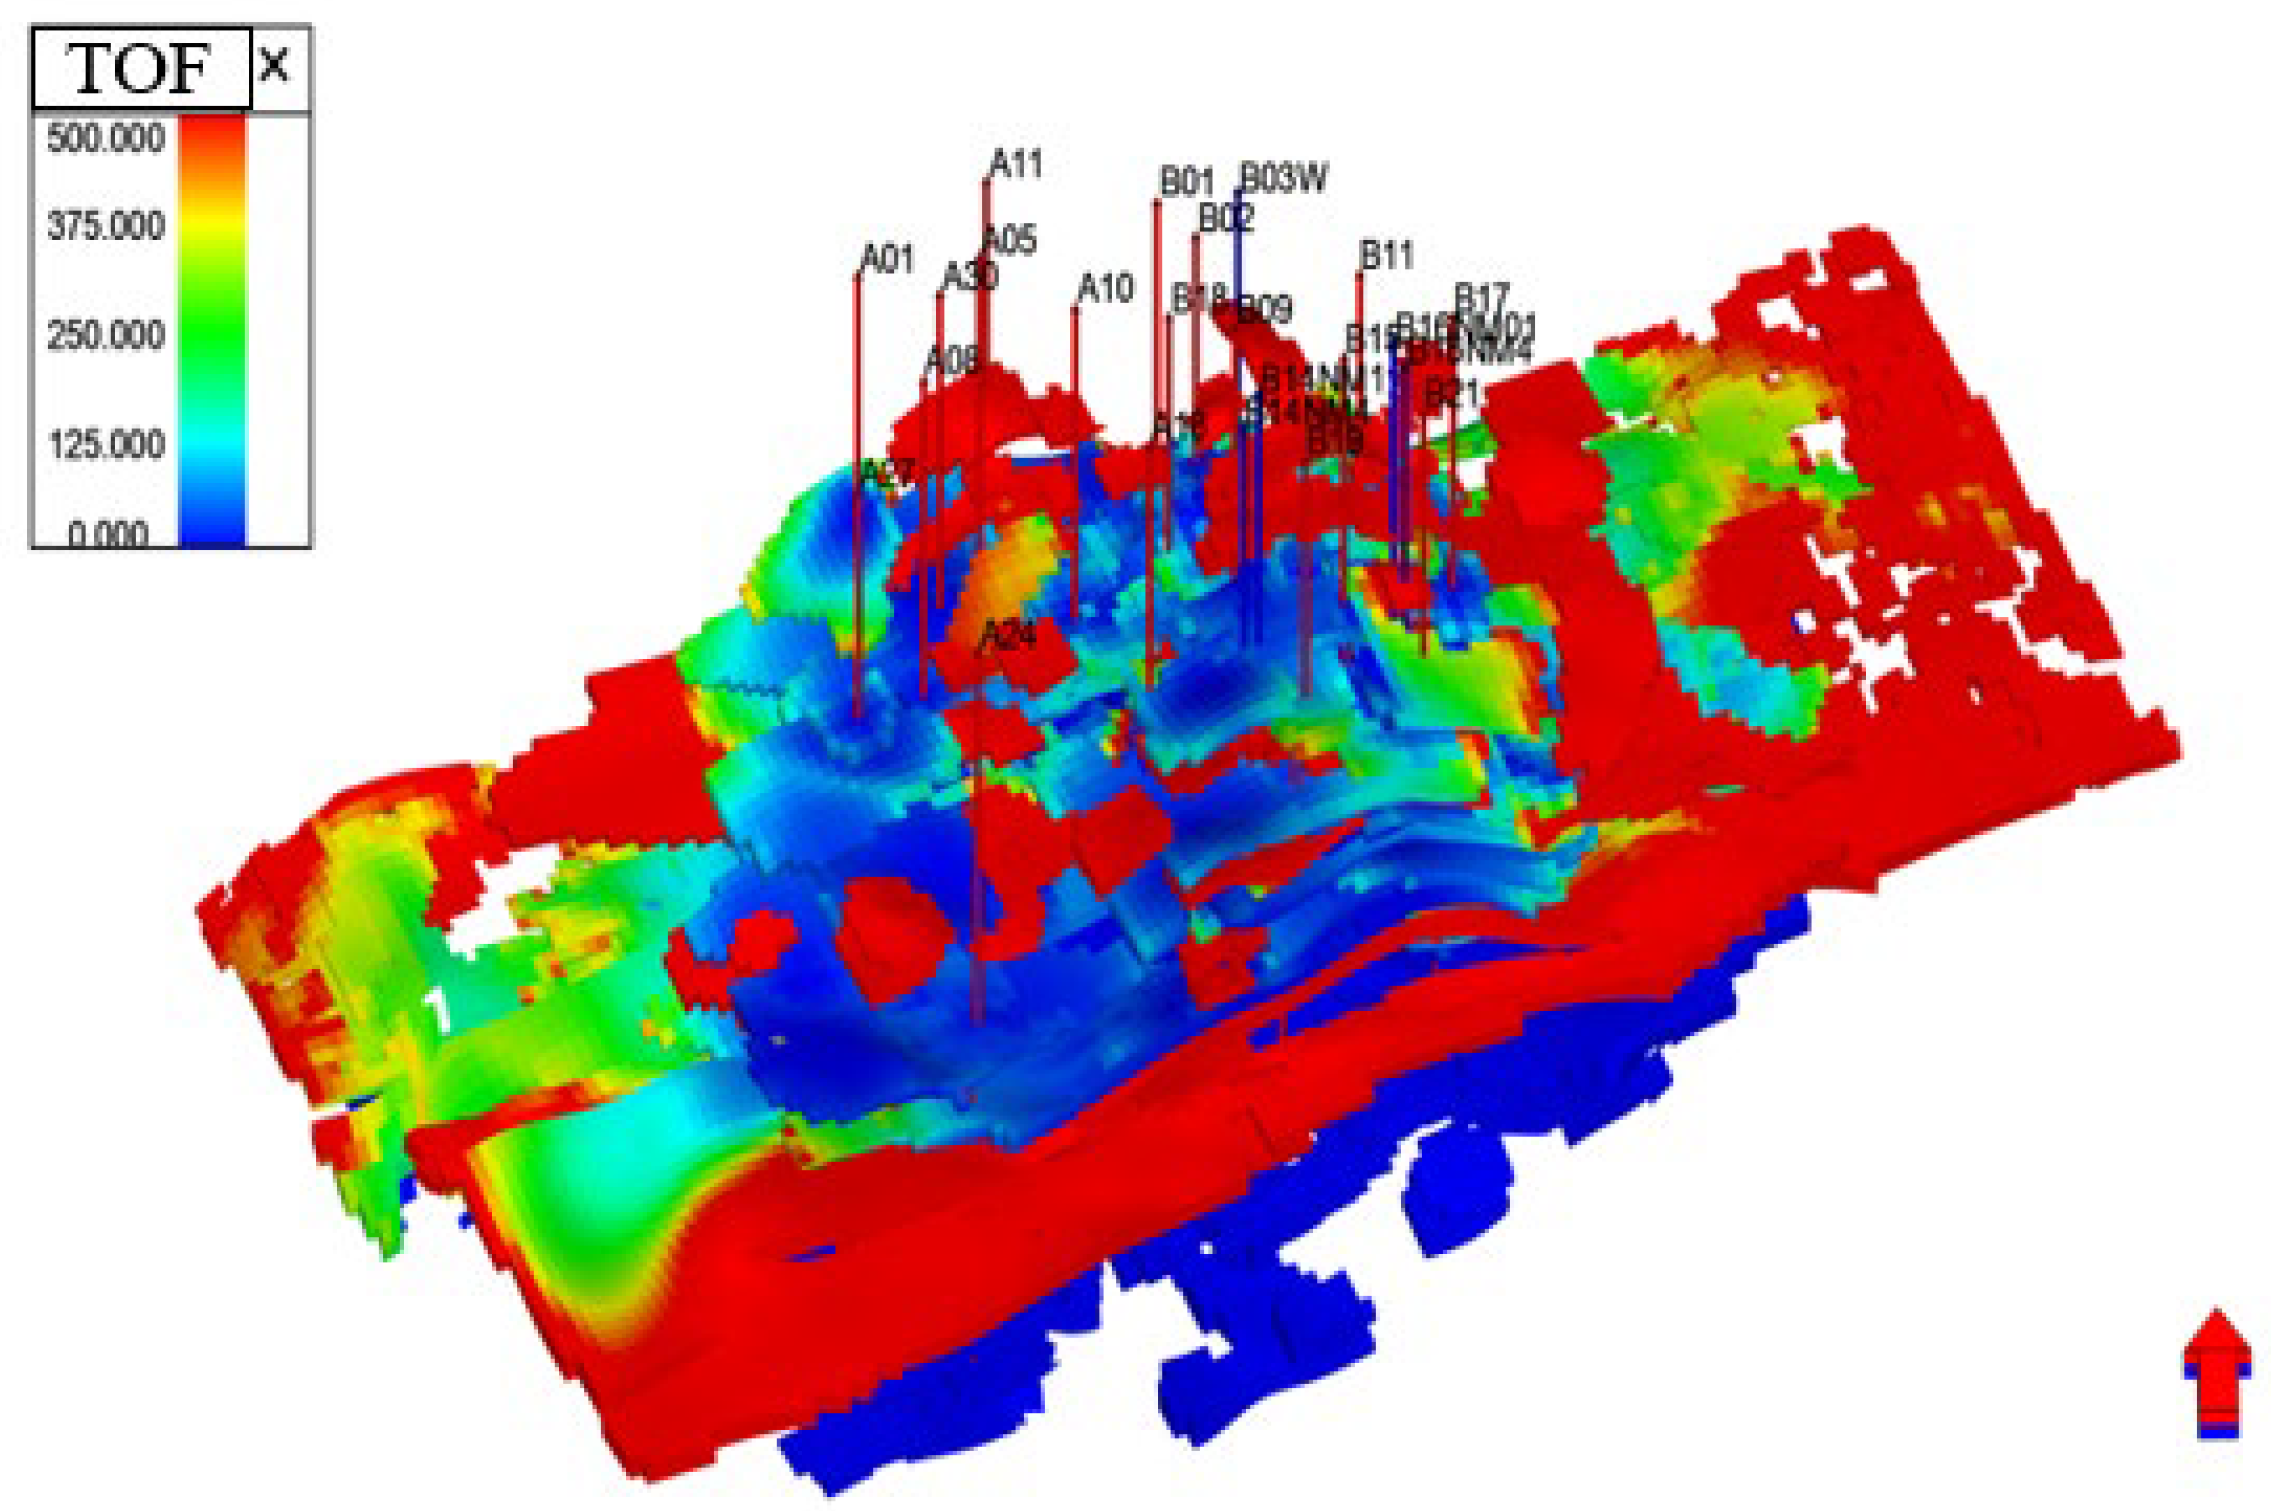
A comparative analysis of two horizontal infill wells, H08H and H09H, drilled in January 2014, further highlights the utility of flow diagnostics in explaining production disparities. Despite their similar locations and initial remaining oil saturations, their five-year cumulative production profiles diverged significantly (Figure 9). Well H09H exhibited robust production, reaching 9.2 m3, whereas H08H produced only 2.5 m3 over the same period—a difference of 268%. The diagnostic evaluation provides a clear explanation for this performance variance. The time-of-flight (TOF) distribution map (Figure 10) shows that H09H was drilled in a low-resistance area (blue, TOF ≈ 75 days), indicating favorable hydraulic connectivity. In contrast, H08H is situated in a high-resistance region (red, TOF ≈ 300 days), characteristic of poor reservoir connectivity. This disparity in local flow dynamics is the primary cause of the observed production difference. Further validation is provided by the water saturation and velocity fields (Figure 11), which show that the area surrounding the underperforming H08H well is characterized by high water saturation and low fluid velocity. This indicates that the region contains largely bypassed oil that the infill well is unable to effectively mobilize due to the poor local flow properties.
Table 1 underscores the proposed method’s advantages in diagnostic precision and scalability, with empirical support from field applications in Section 3, such as the B14 well group’s heterogeneity evaluation (Figure 8) and production gains in the C29 (165,600 m3) and B03 (2.2–3.8 tons/day increase) groups.

3.3. Adjustment Thresholds

3.3.1. Infill Drilling Thresholds

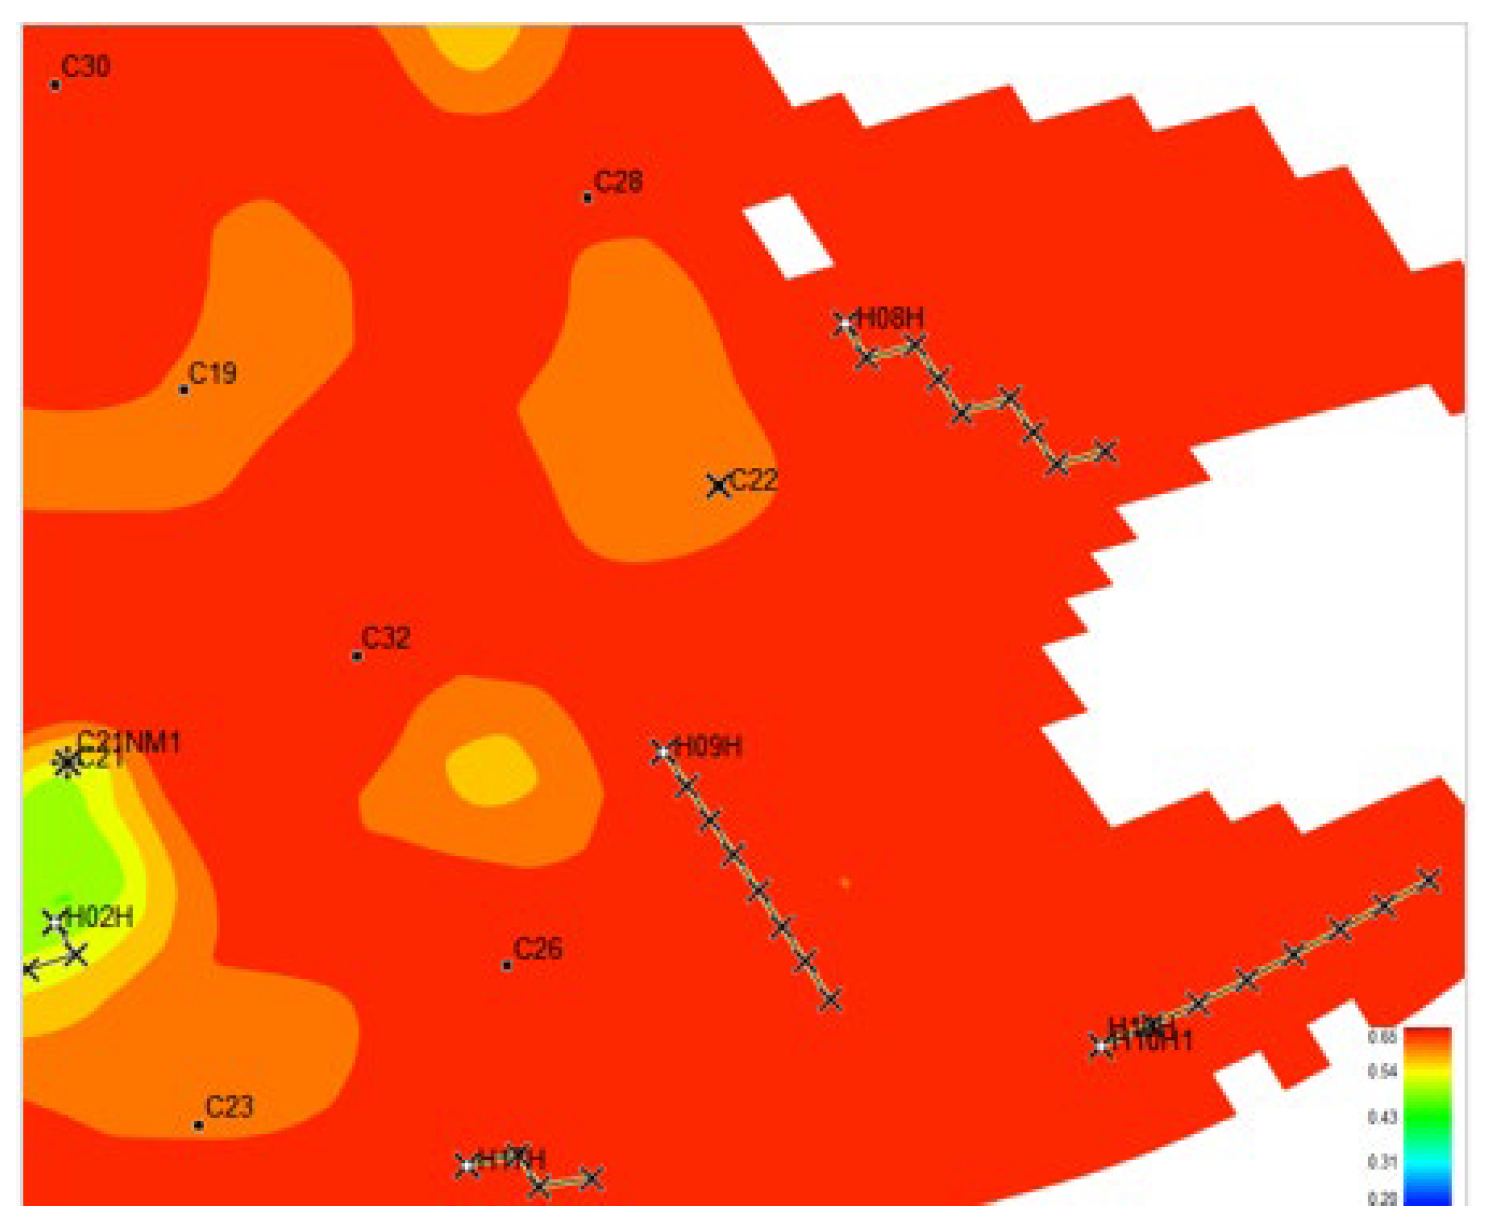
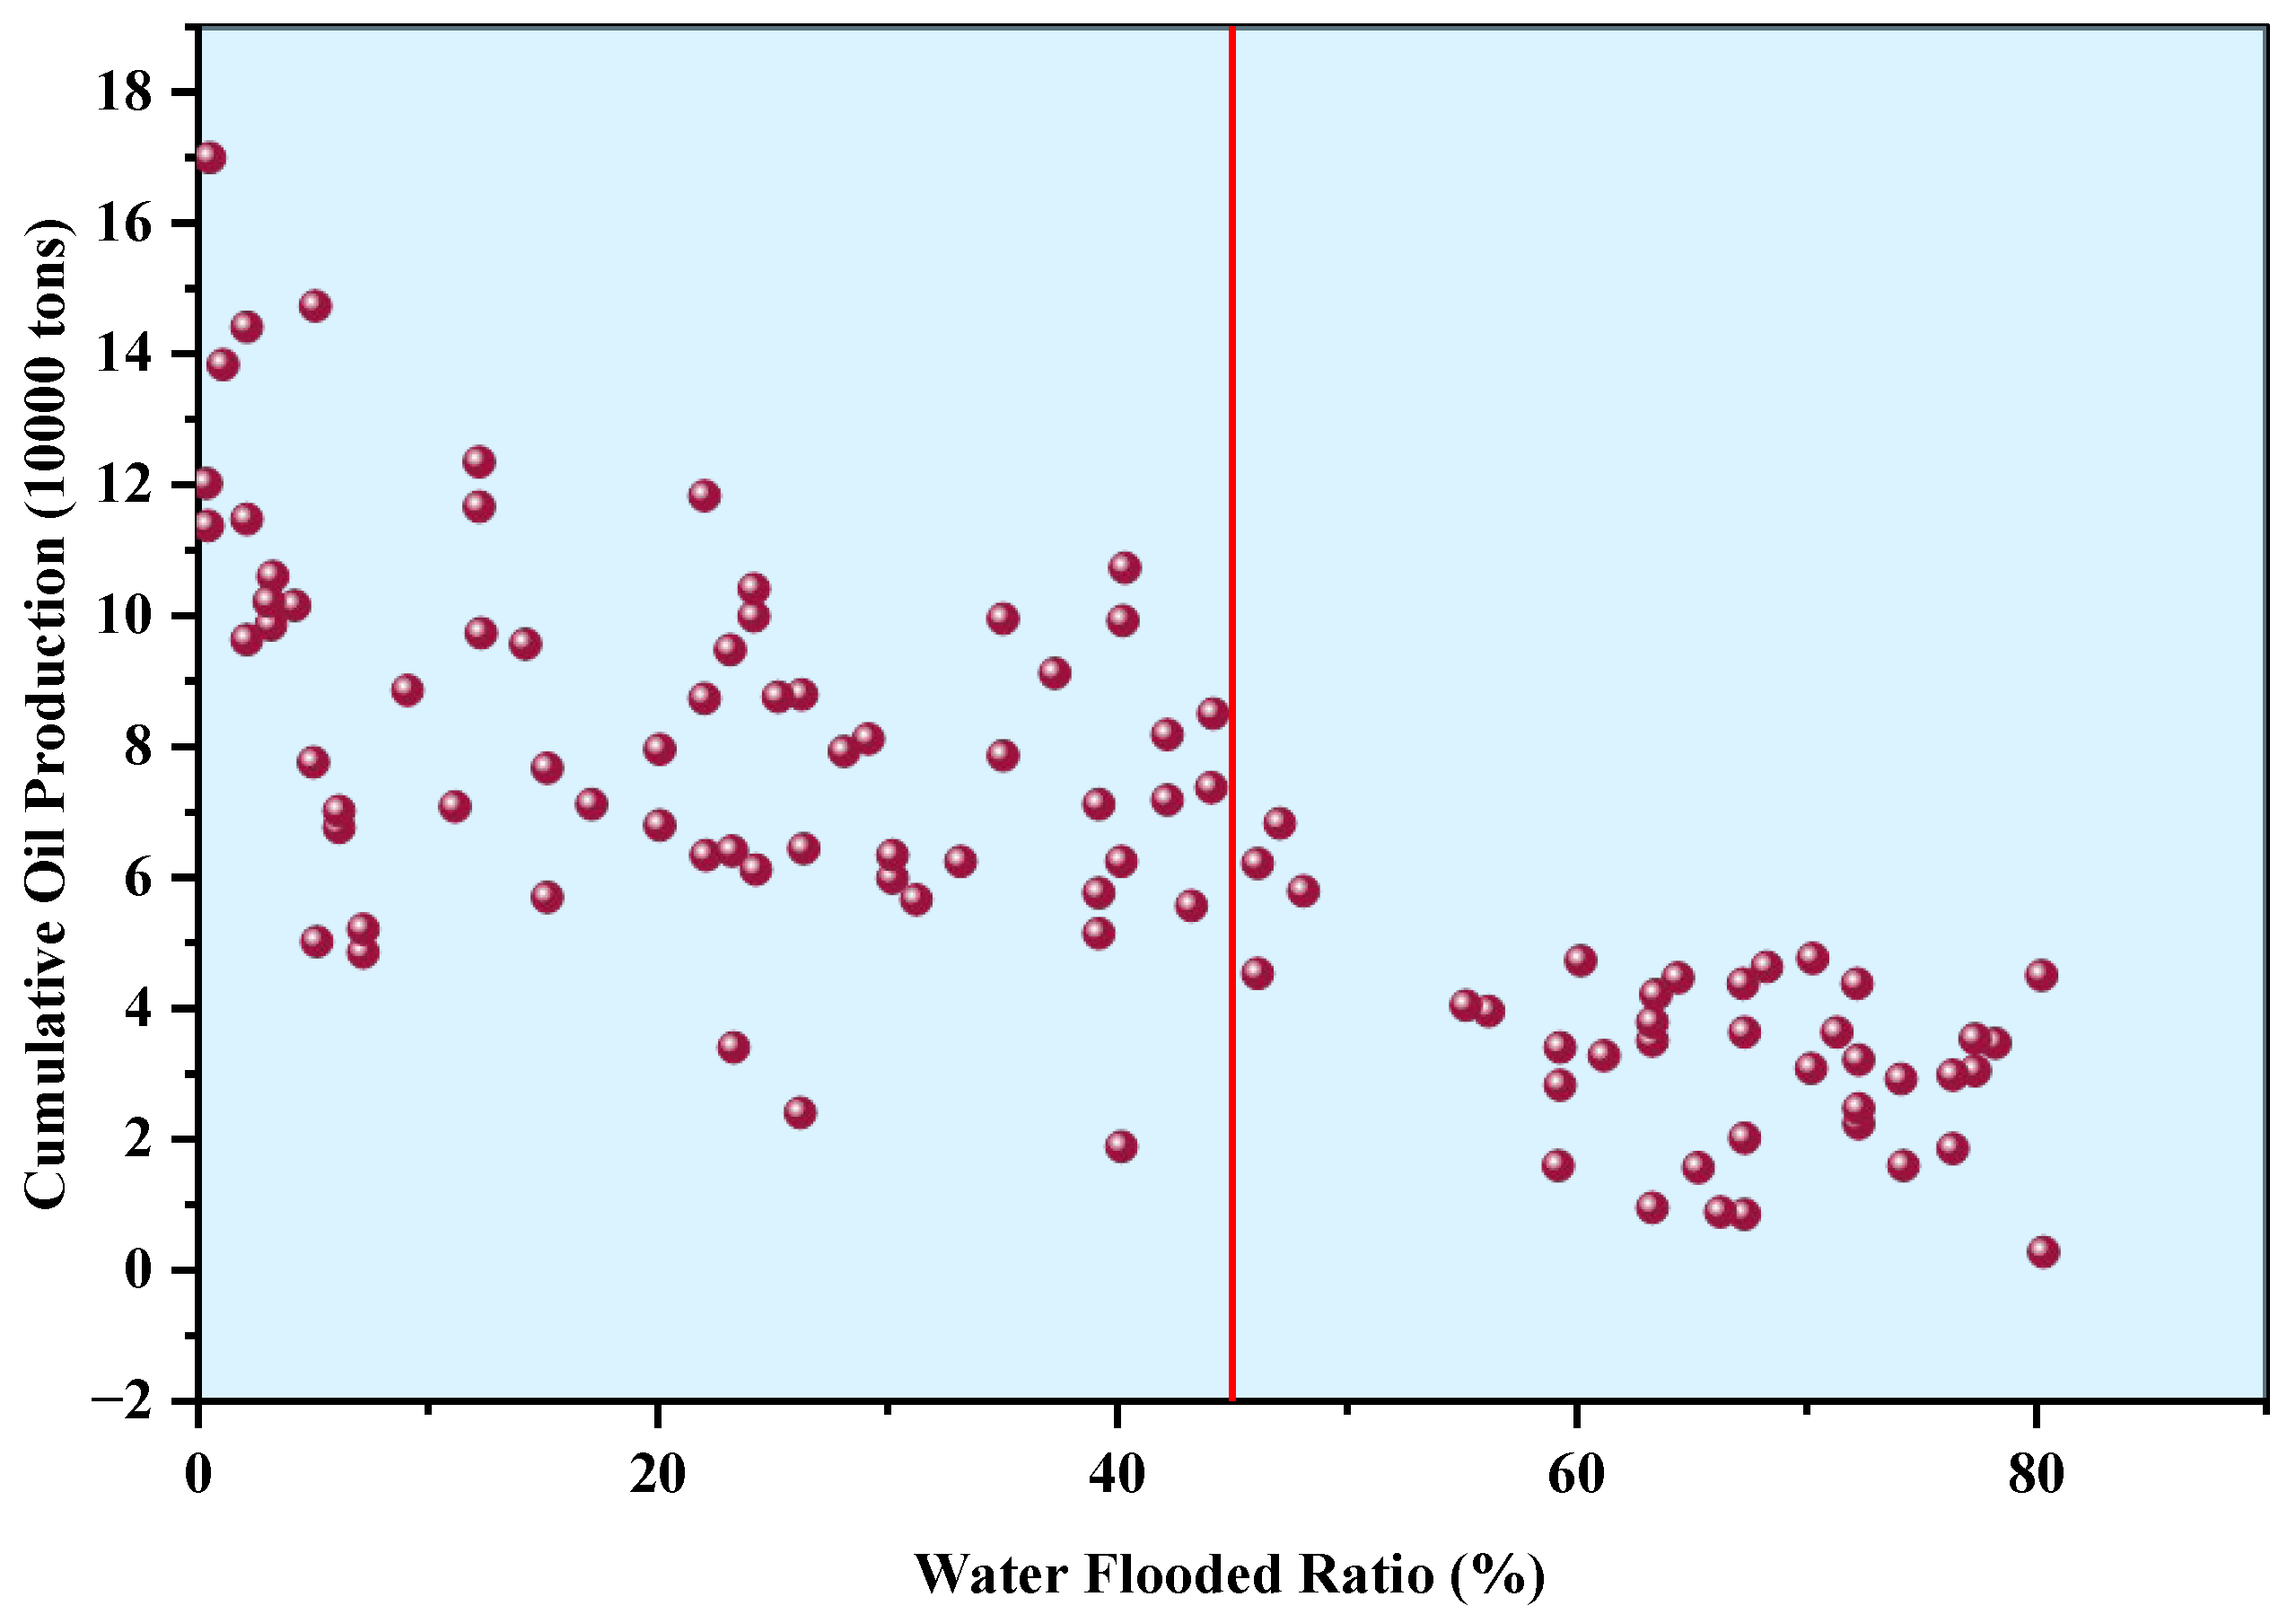
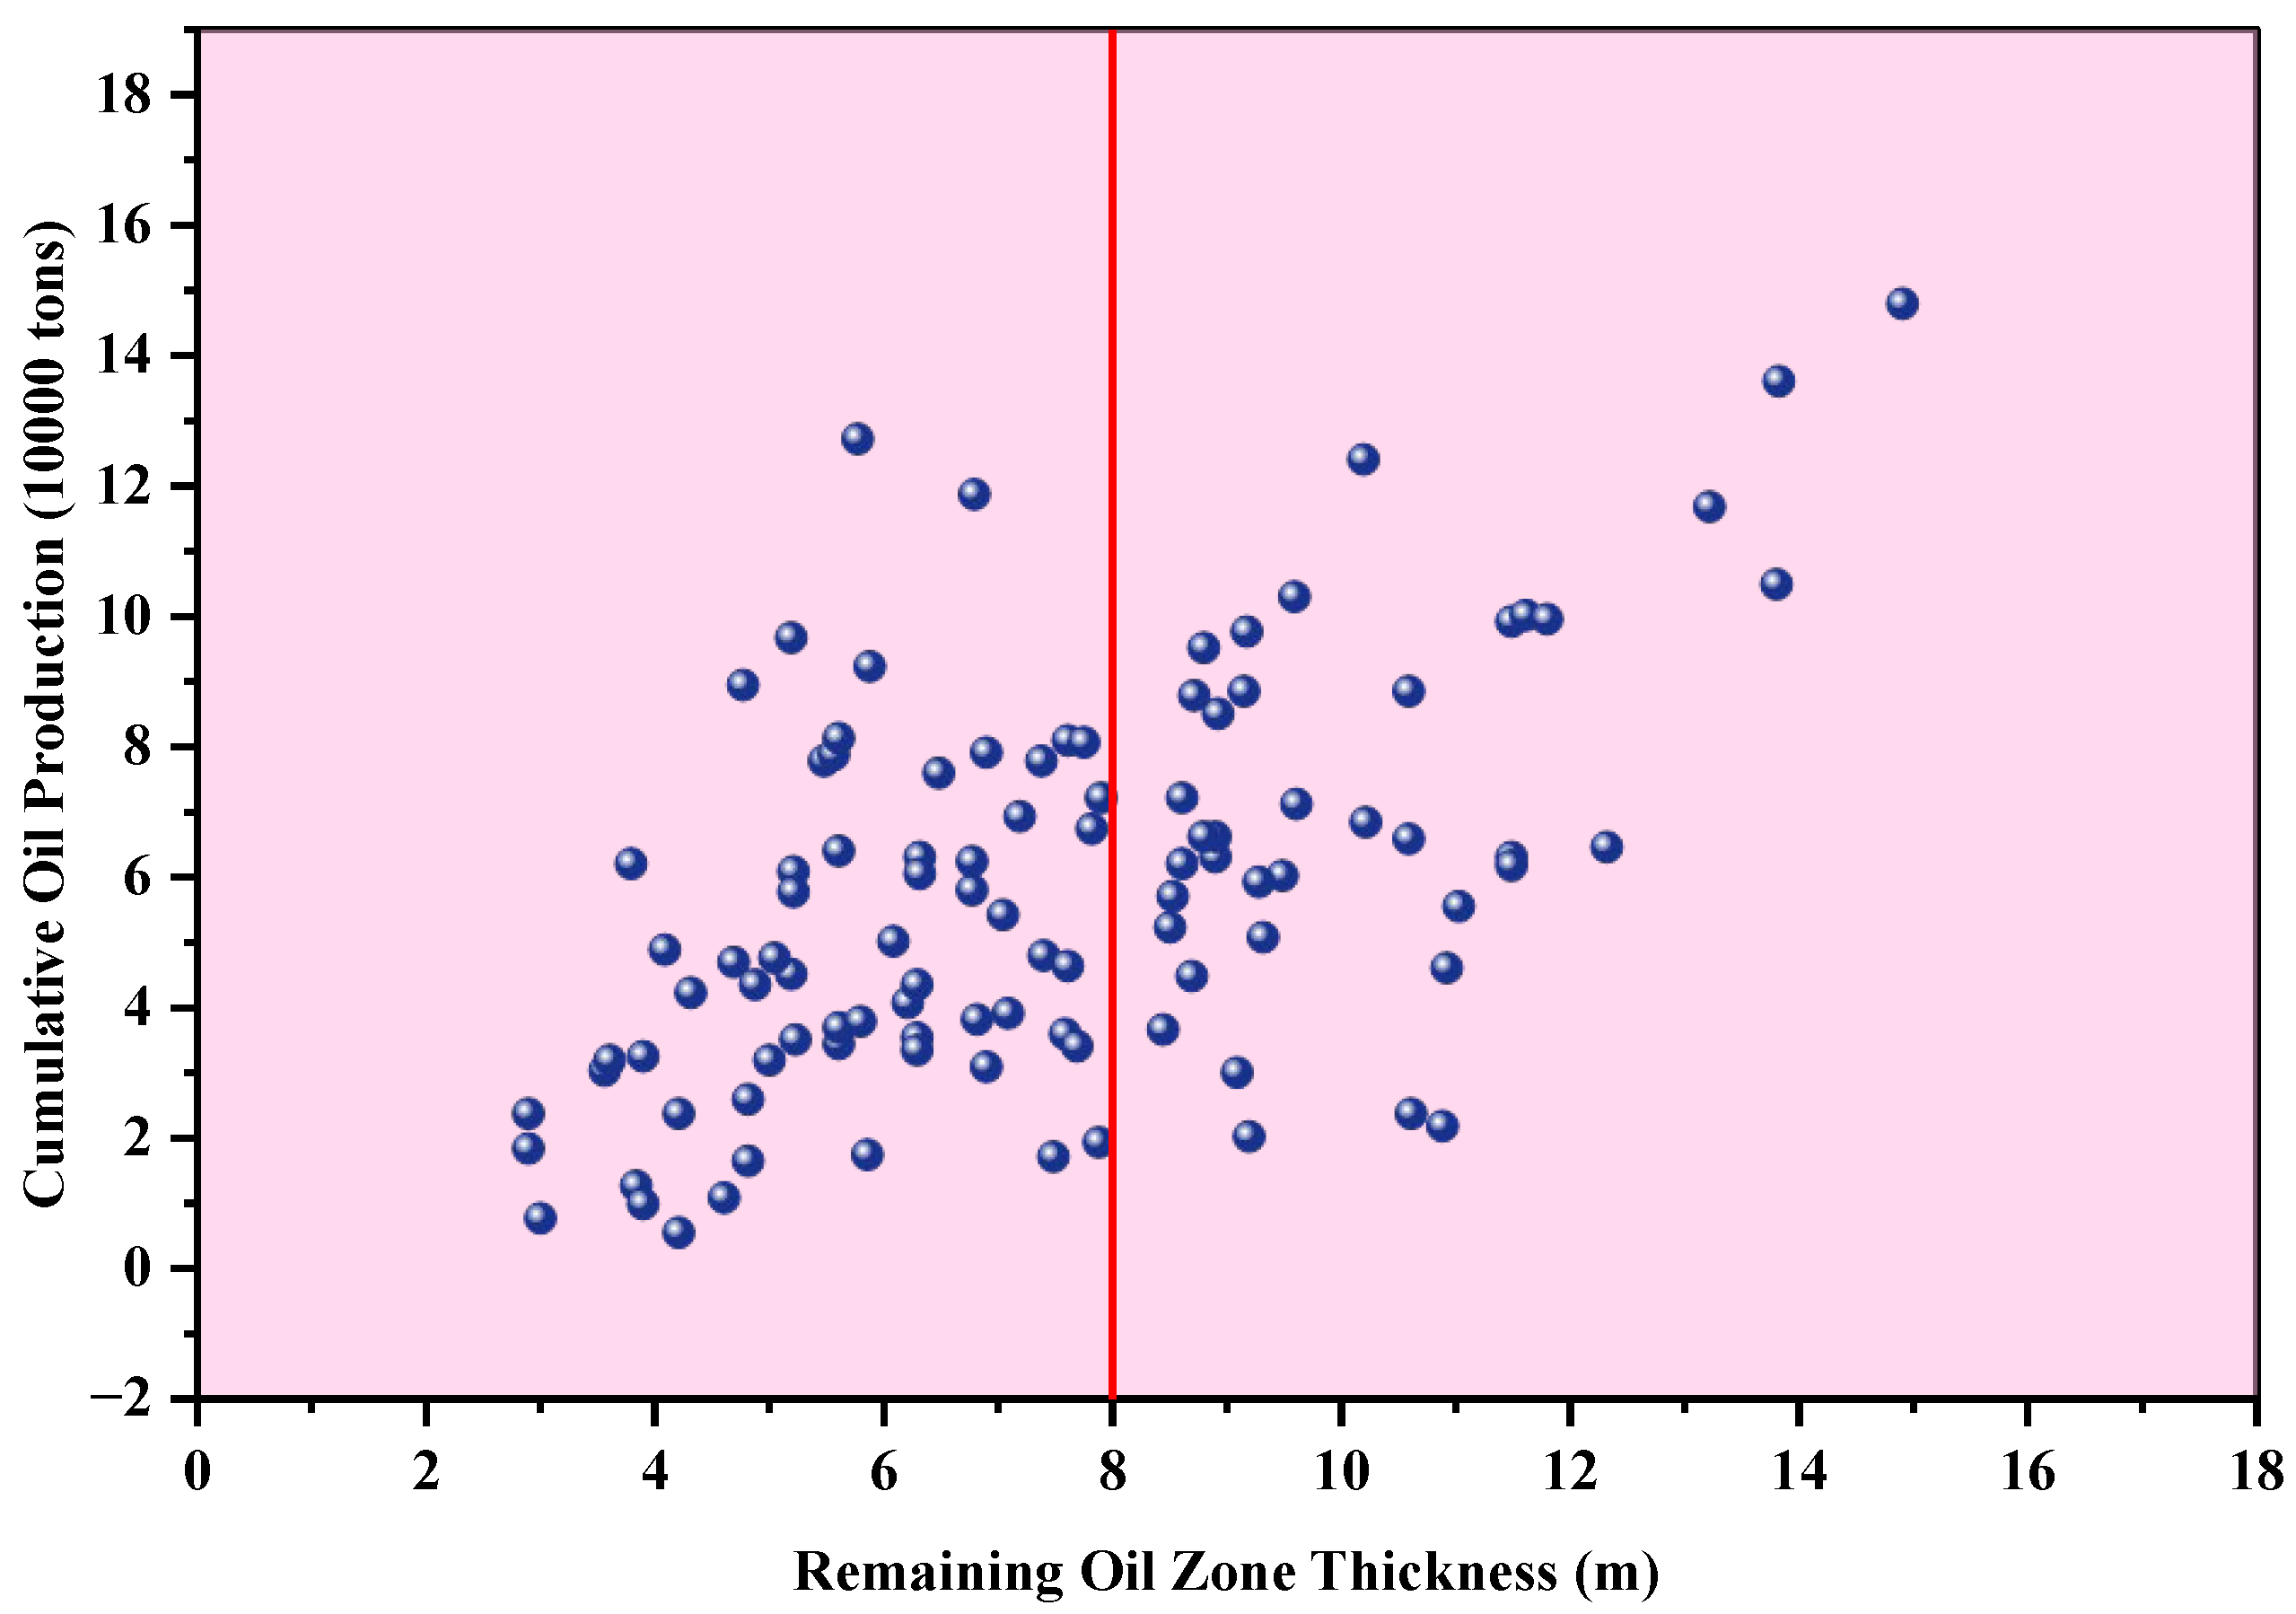
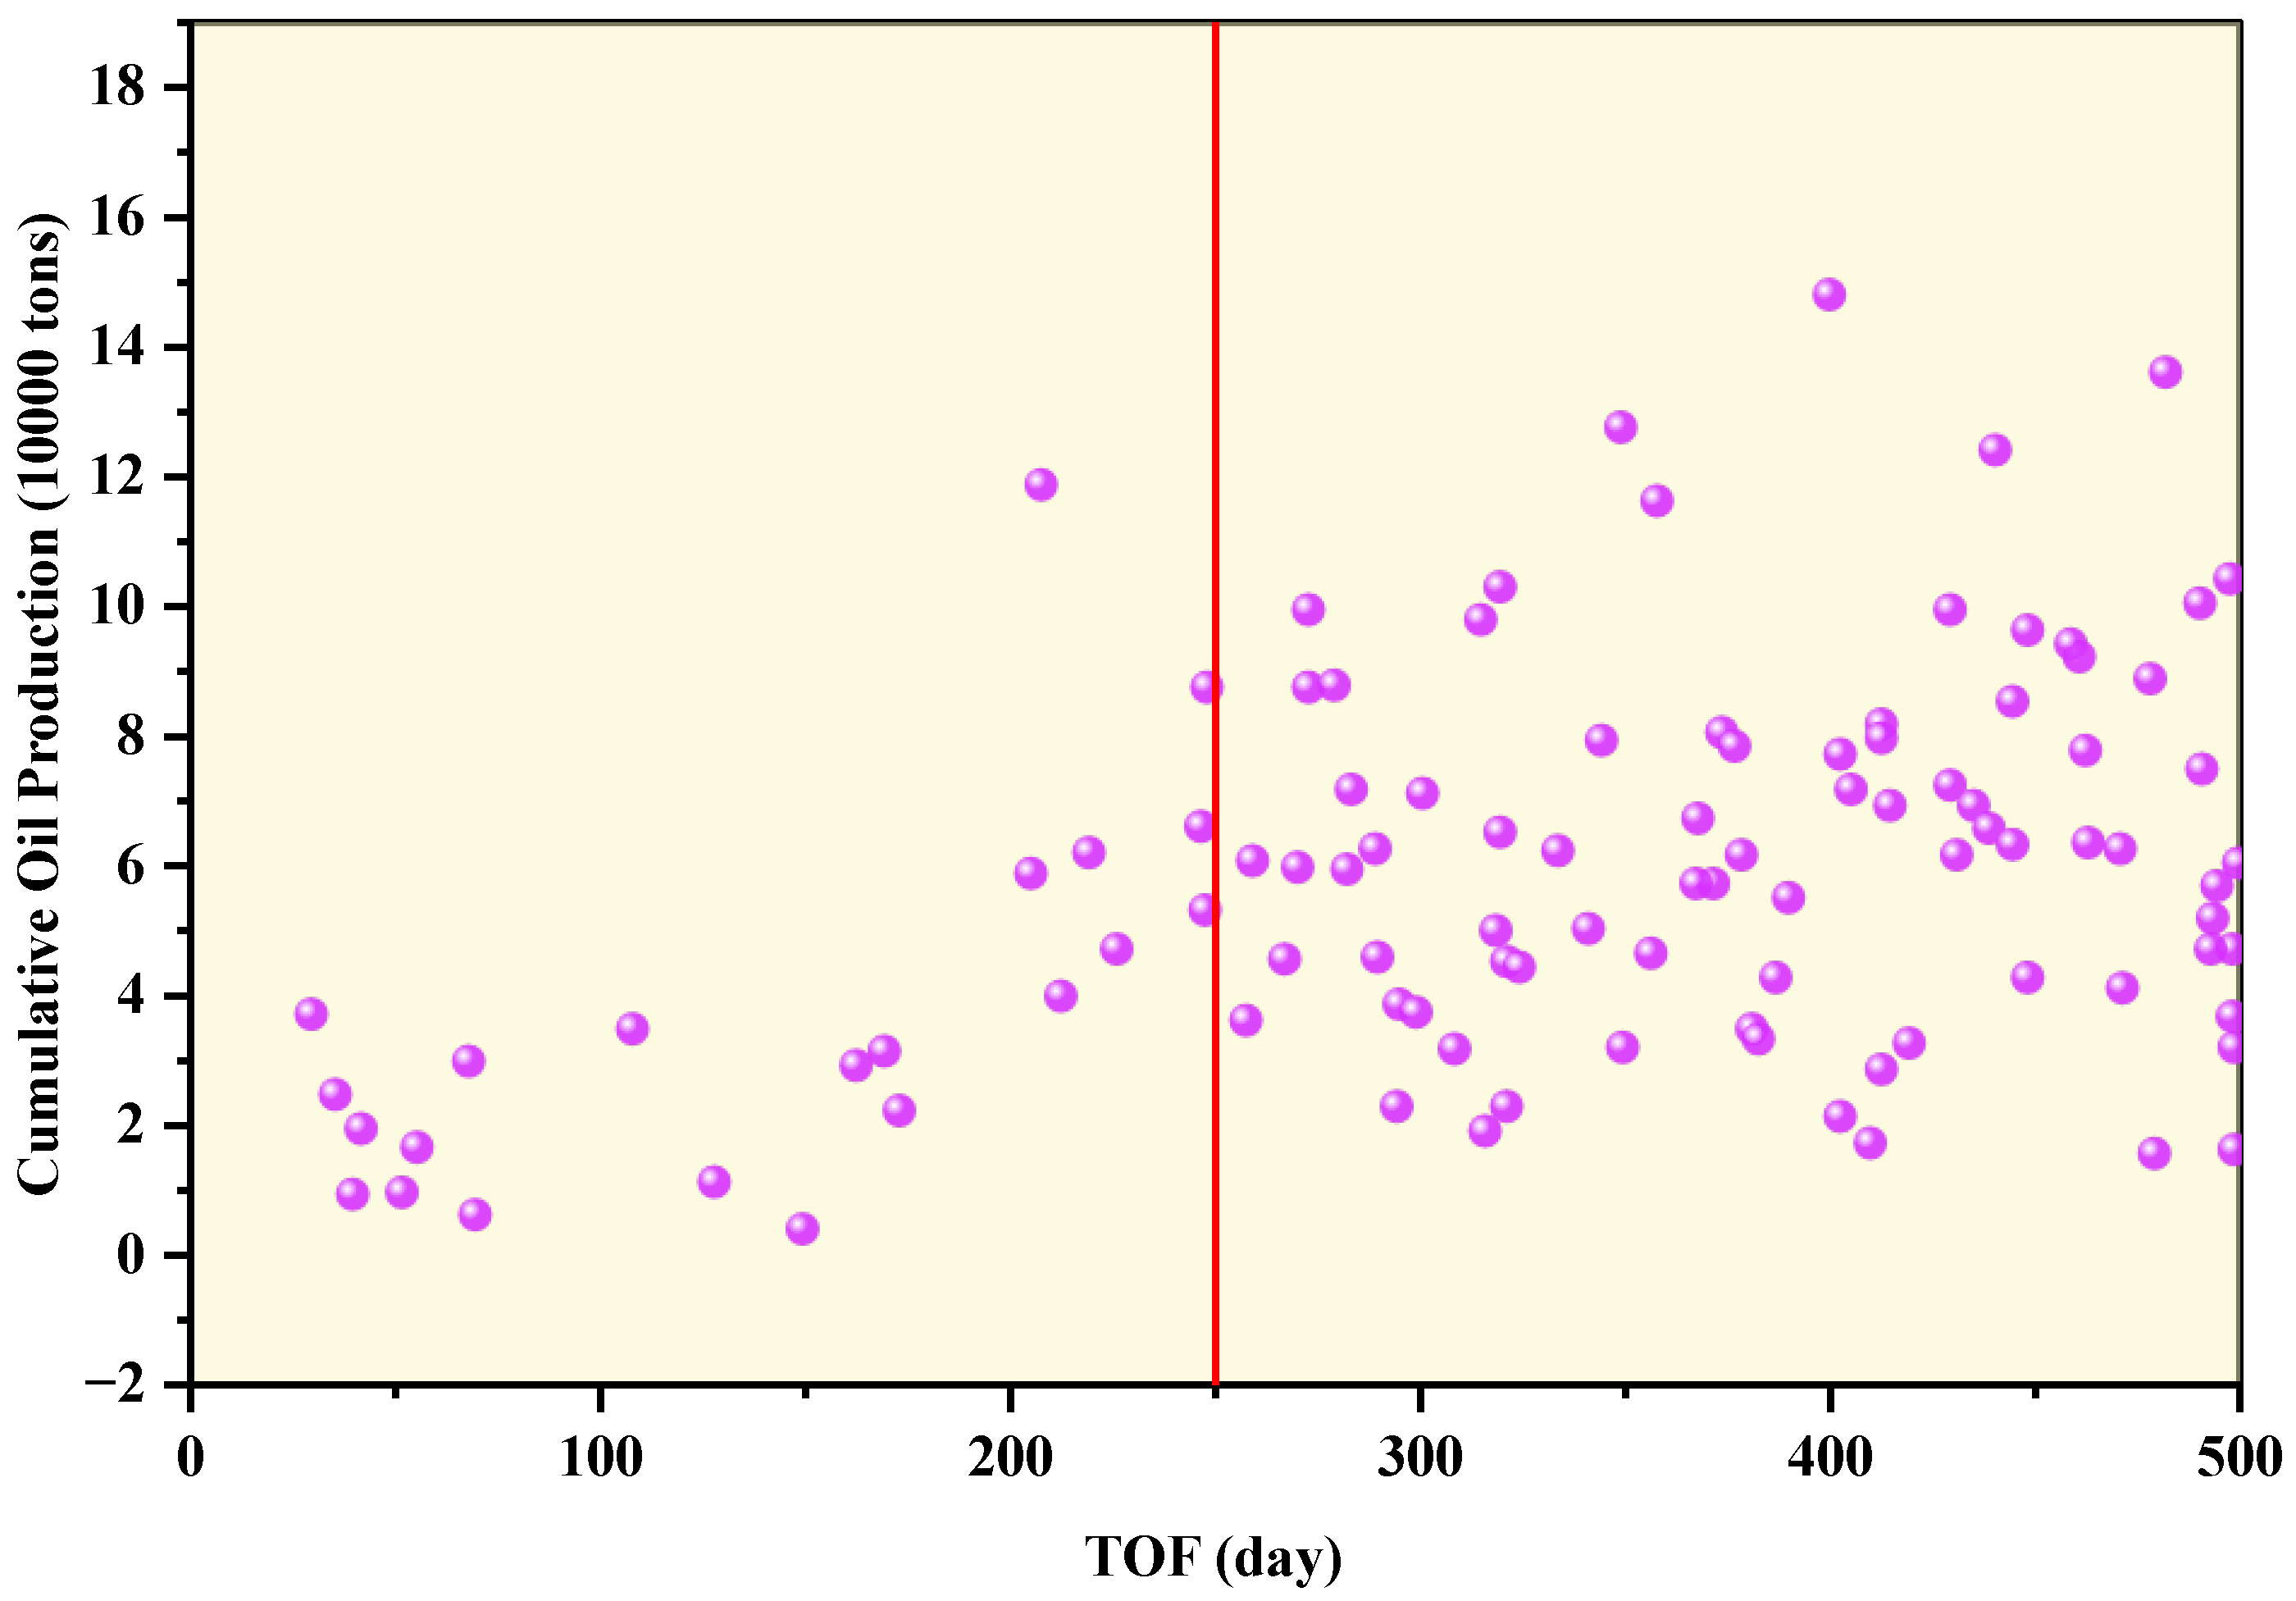
To establish quantitative thresholds for infill drilling, a statistical analysis was conducted on 105 infill wells drilled in the study area prior to 2017 (Figure 12). This analysis correlated pre-infill reservoir parameters—waterflooded ratio, remaining oil thickness, and TOF—with post-infill cumulative oil production. The analysis demonstrated a clear inverse correlation between the pre-infill waterflooded ratio and production (Figure 13); wells in areas with a ratio below 45% yielded significantly higher production. Furthermore, a positive linear relationship was observed between remaining oil thickness and cumulative production (Figure 14), with a notable increase in performance when the thickness exceeded 6 m. Finally, production exhibited an exponential relationship with pre-infill TOF (Figure 15), confirming that infill wells are most effective in high-resistance, poorly connected regions (TOF > 200 days).
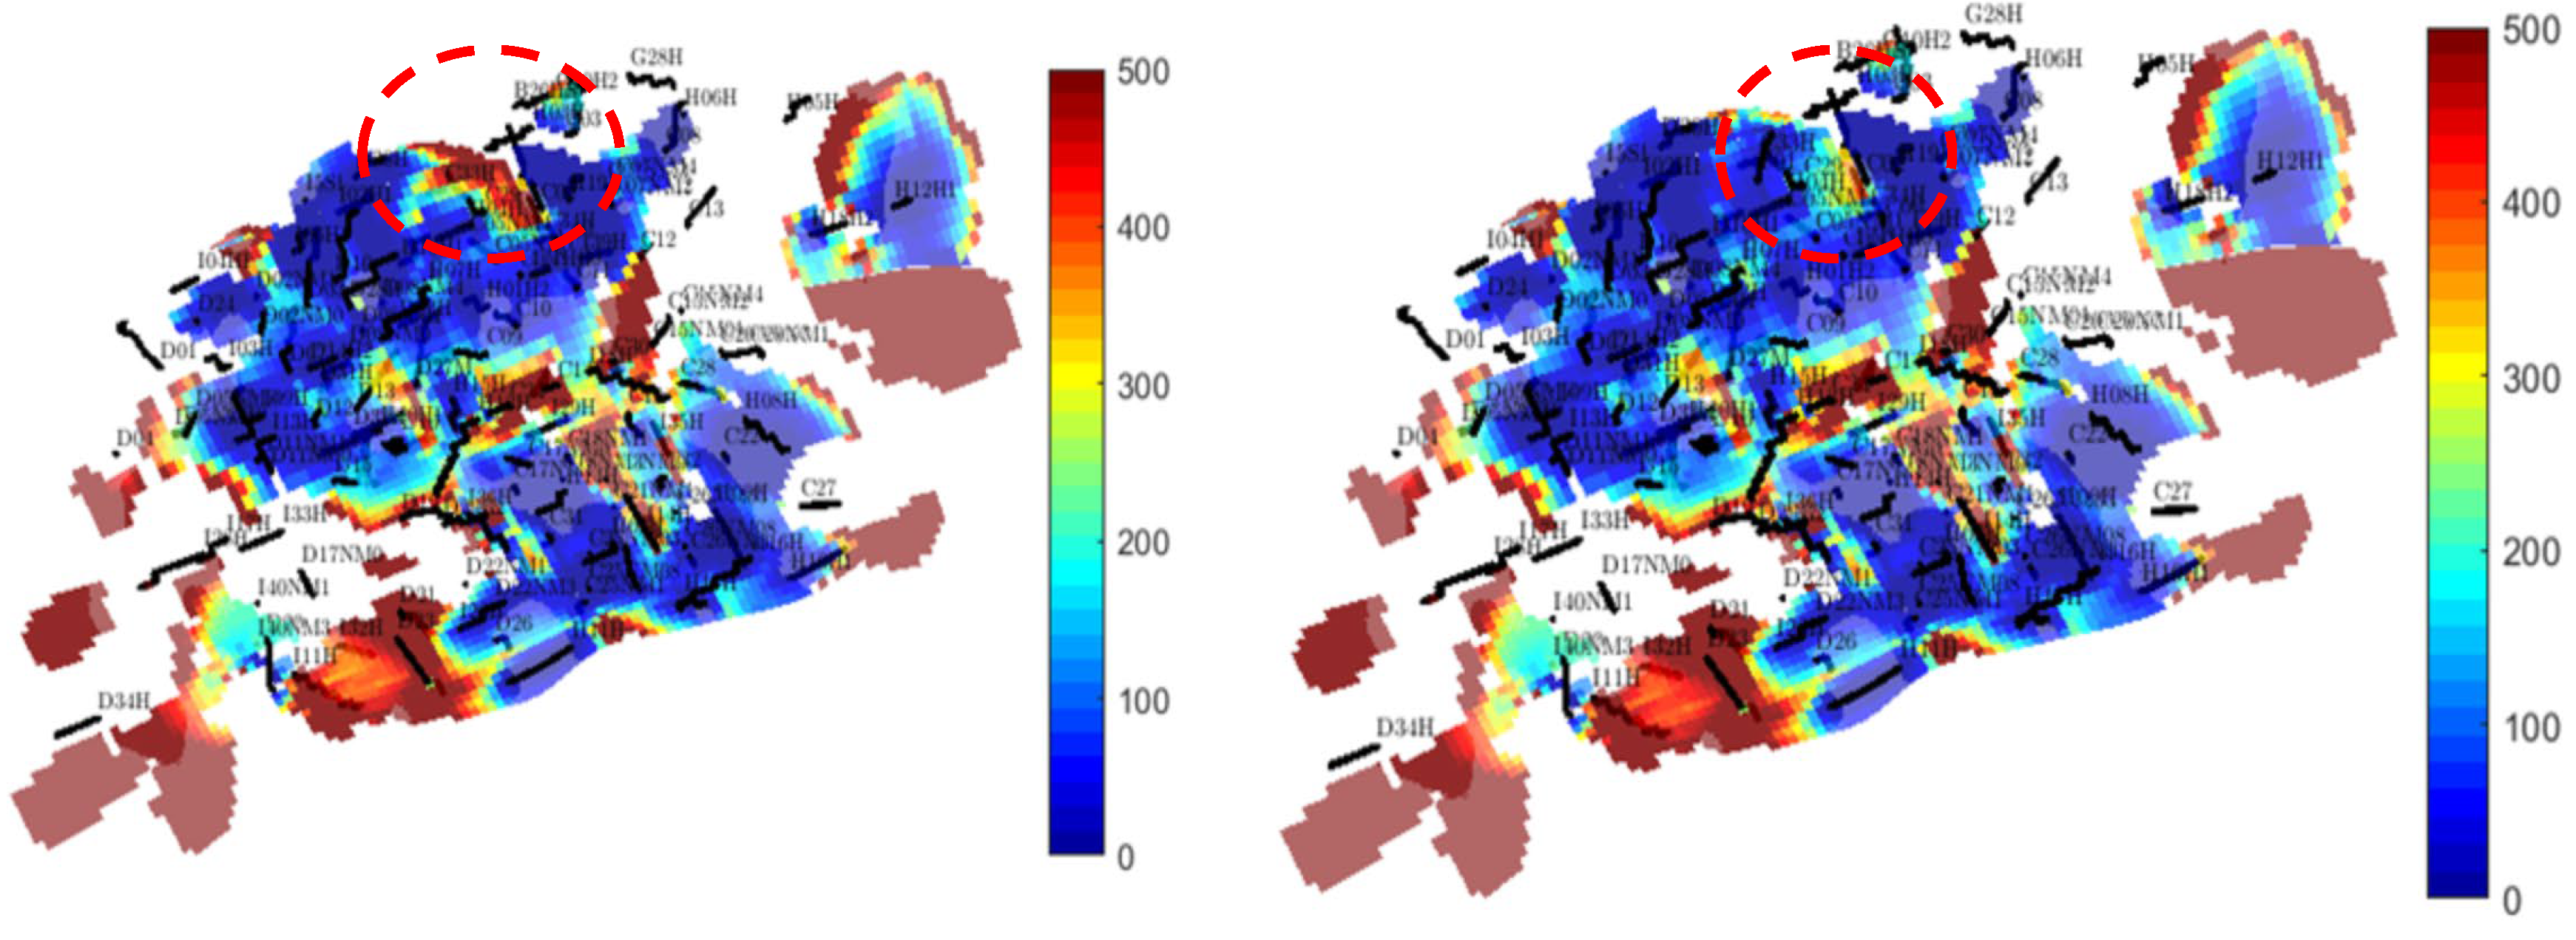
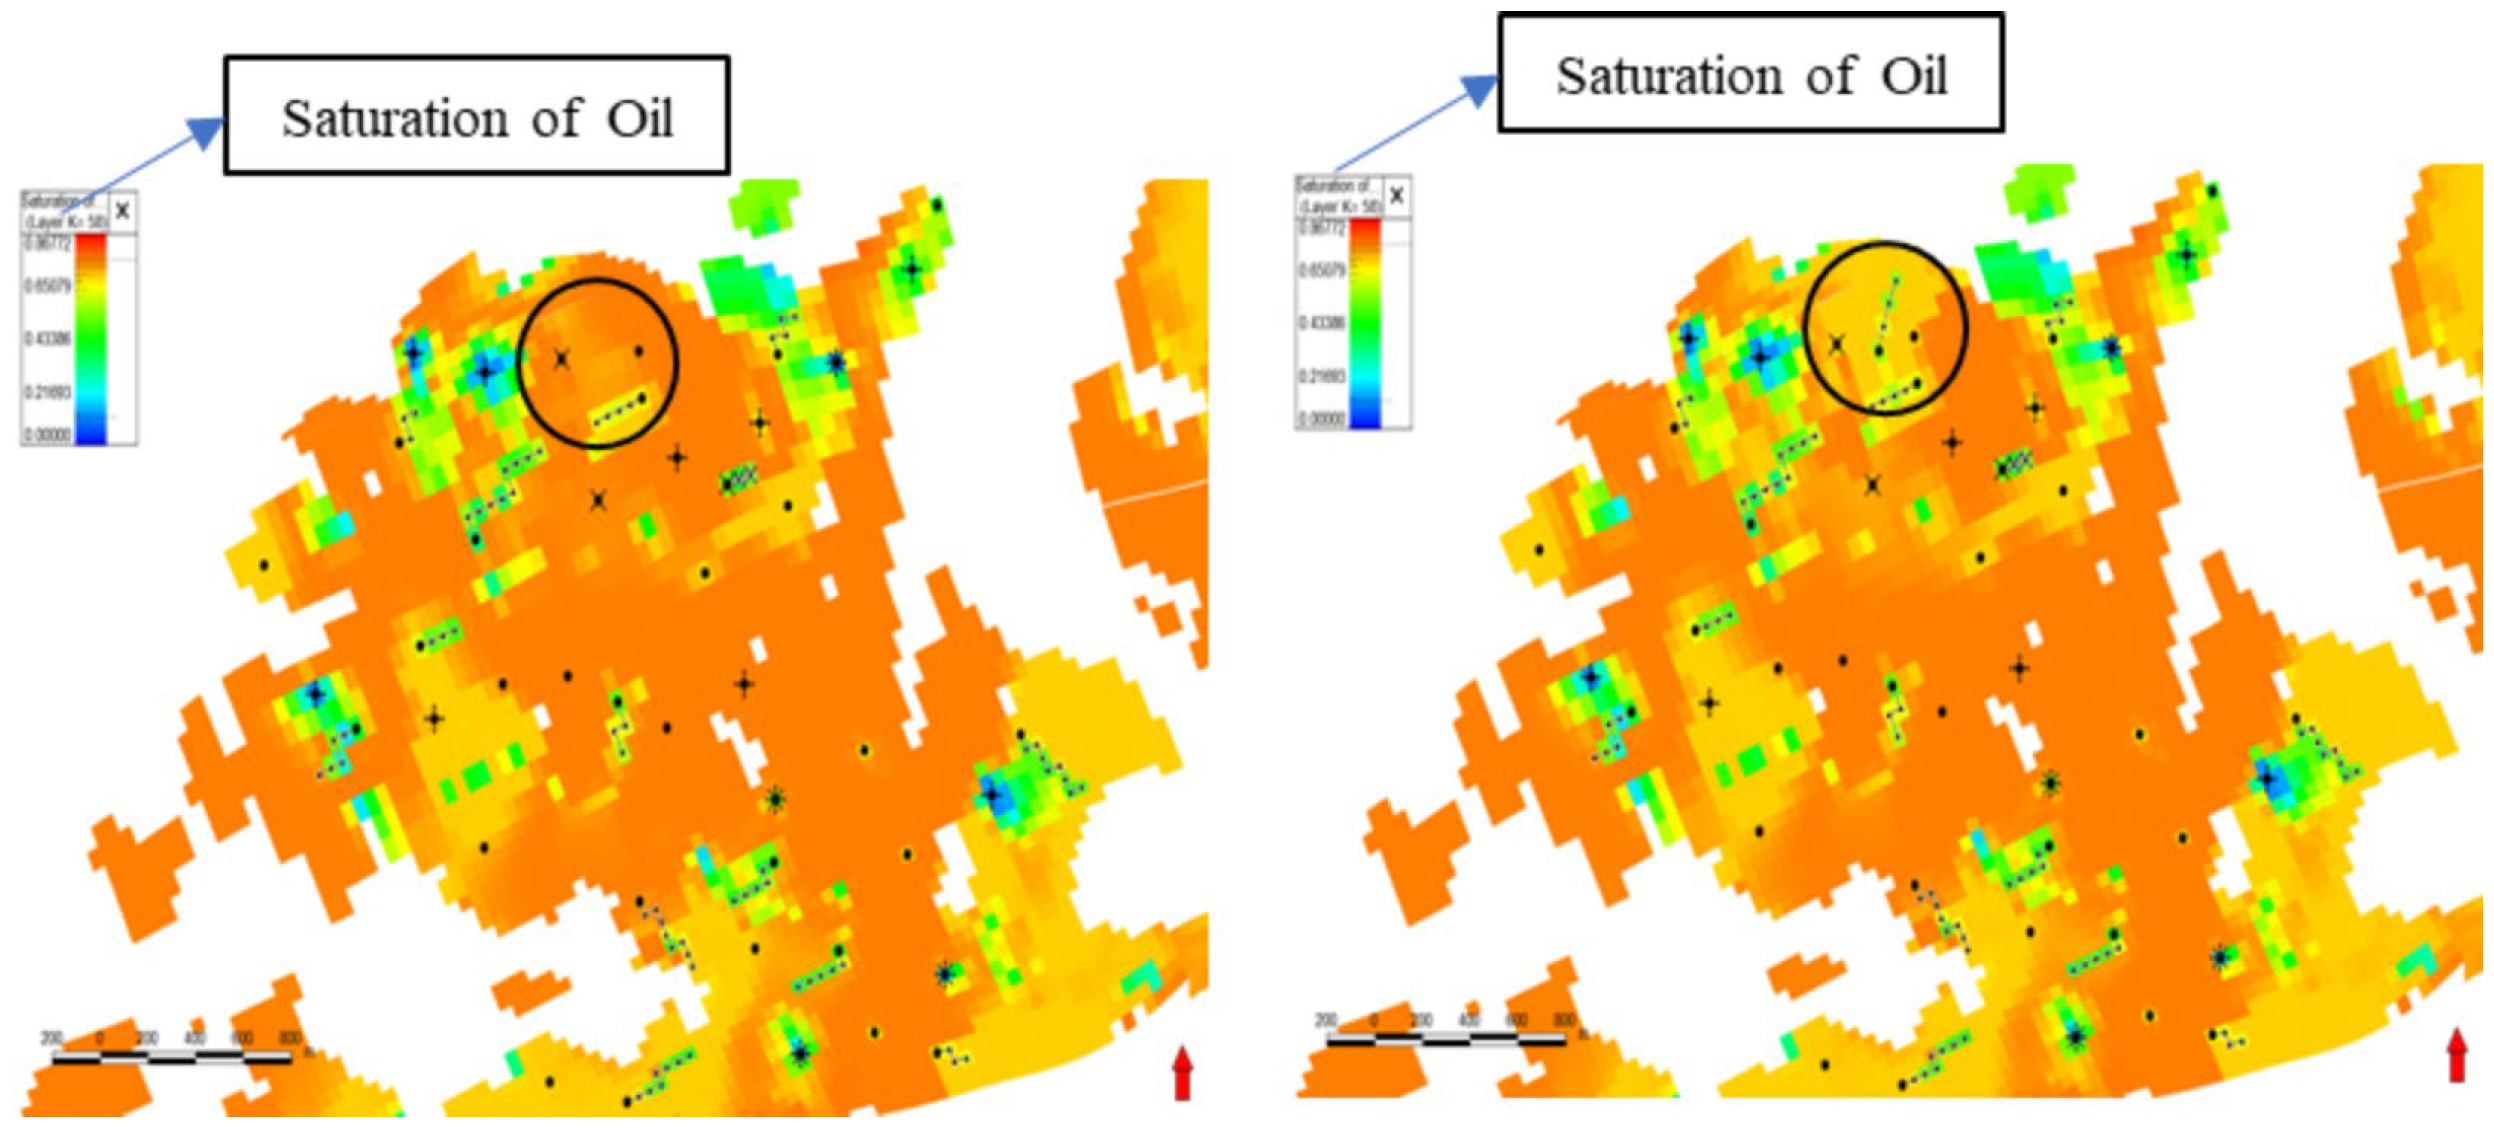
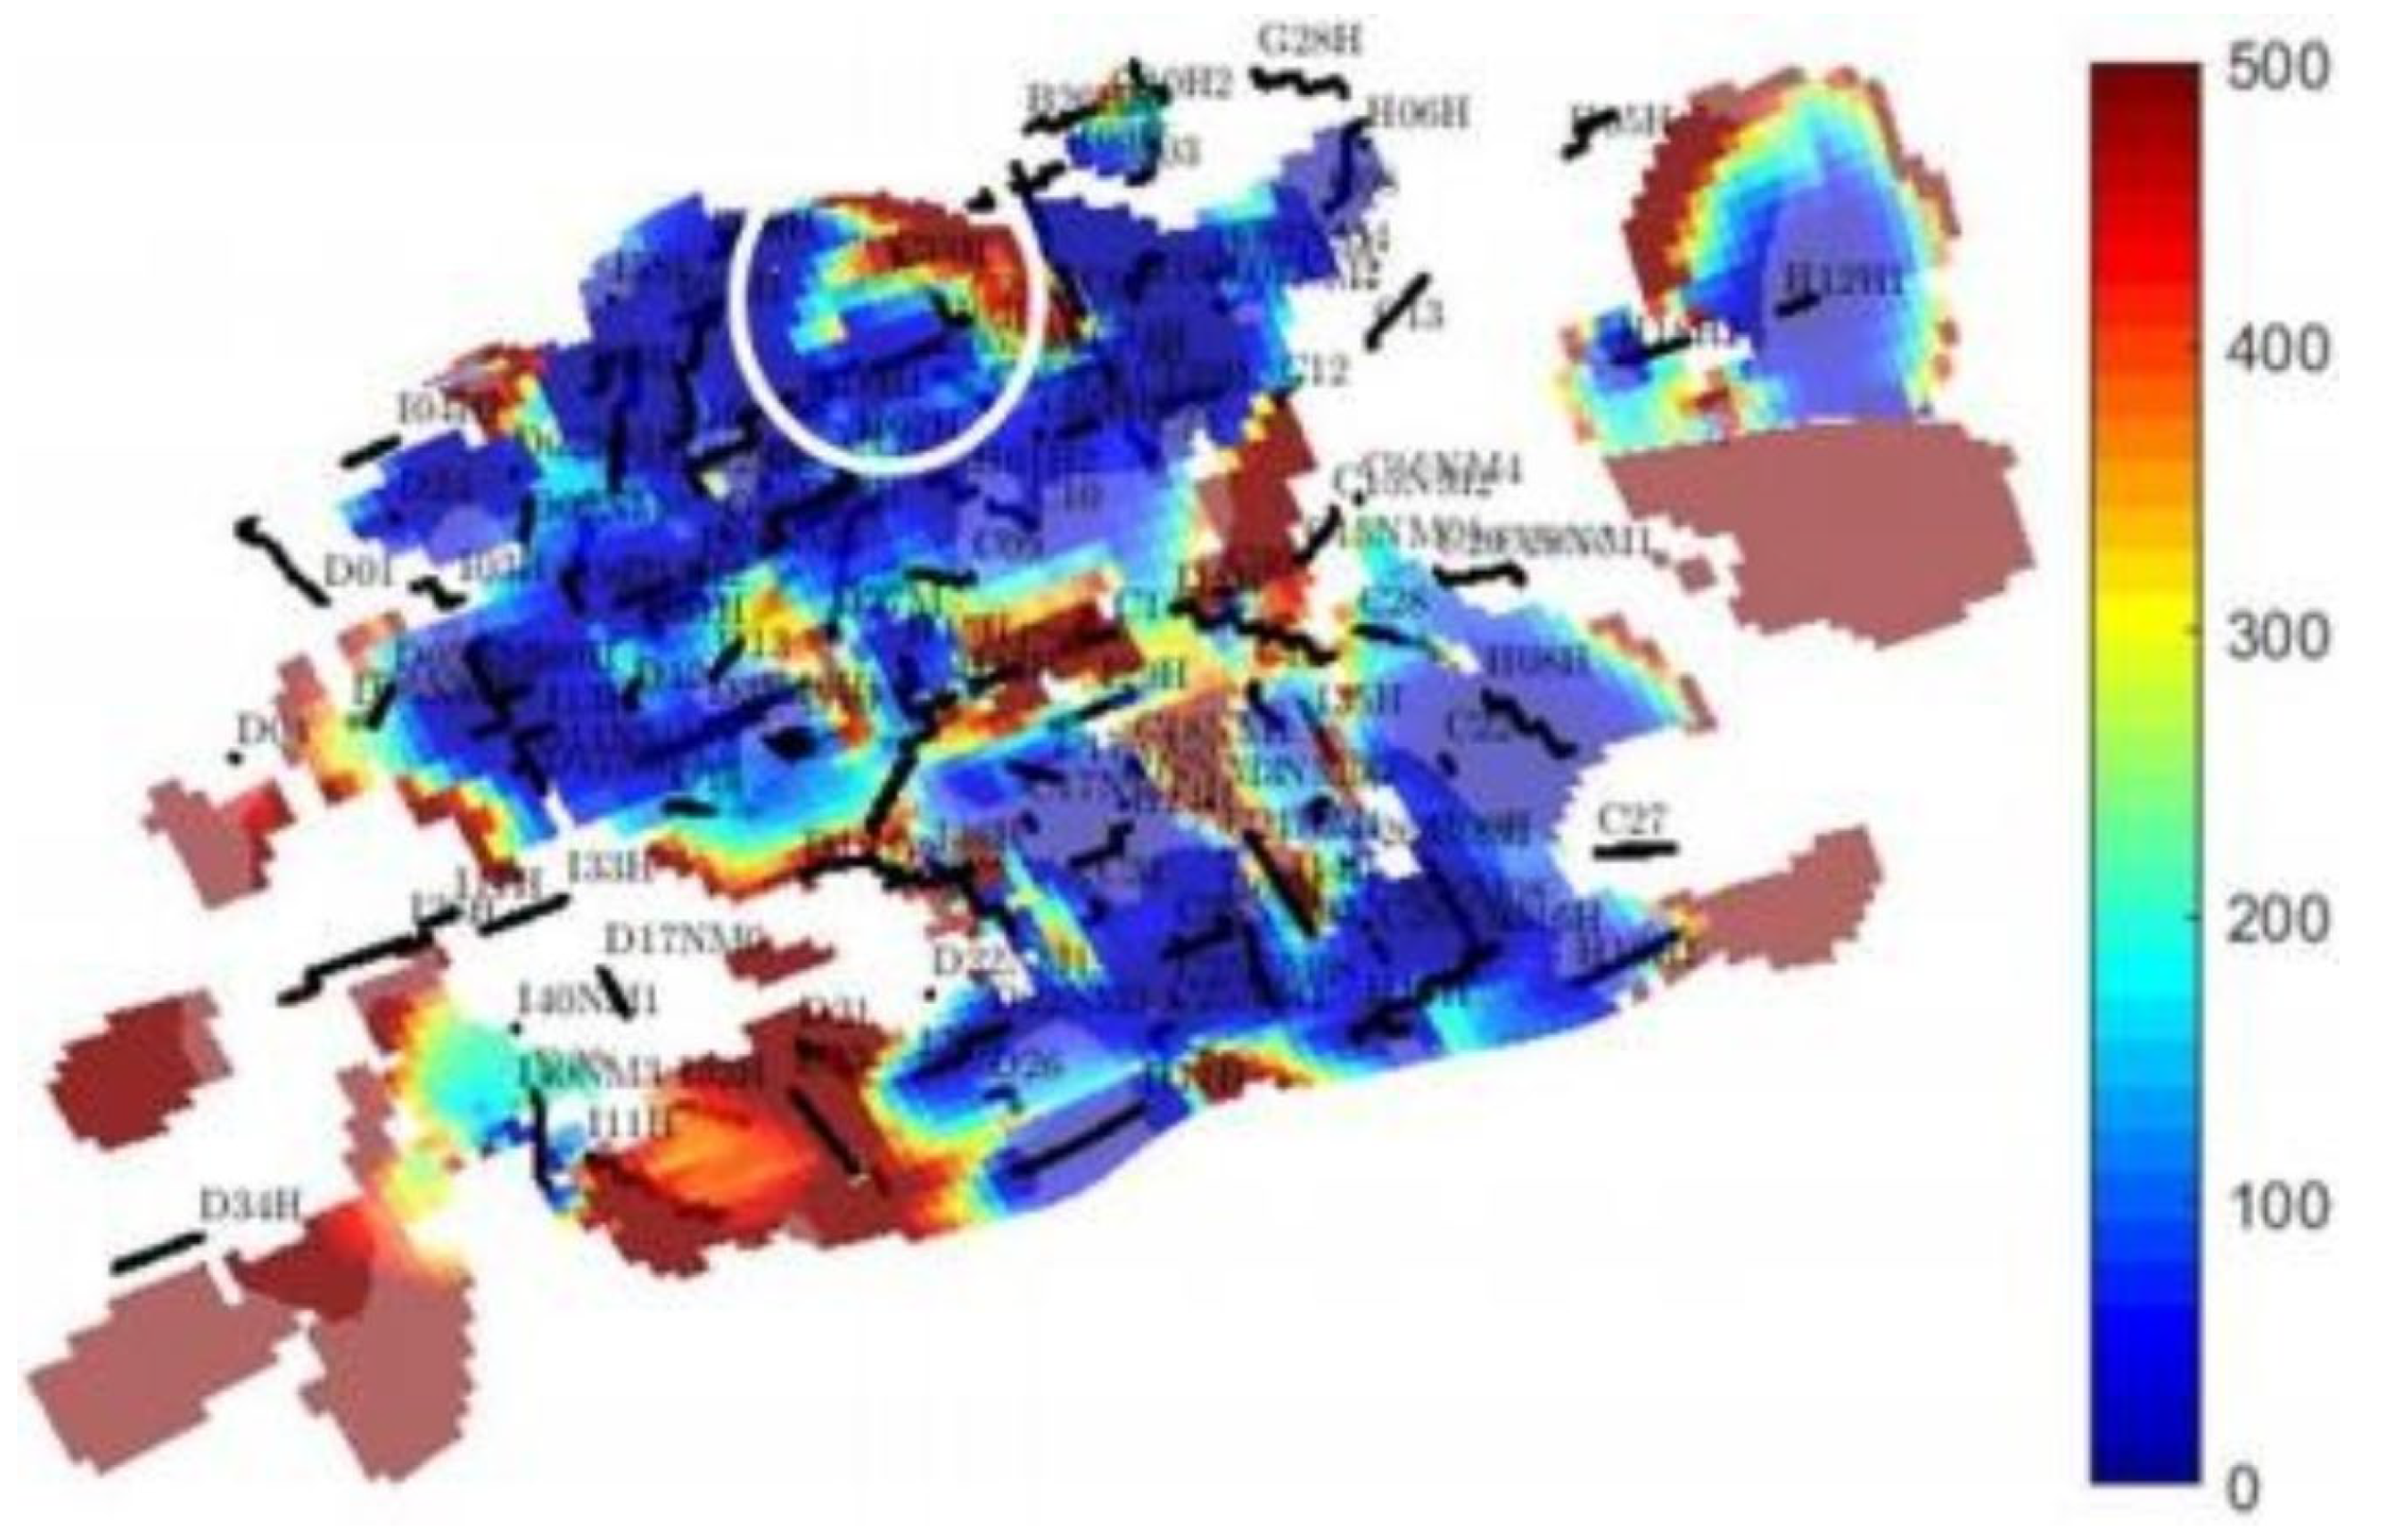
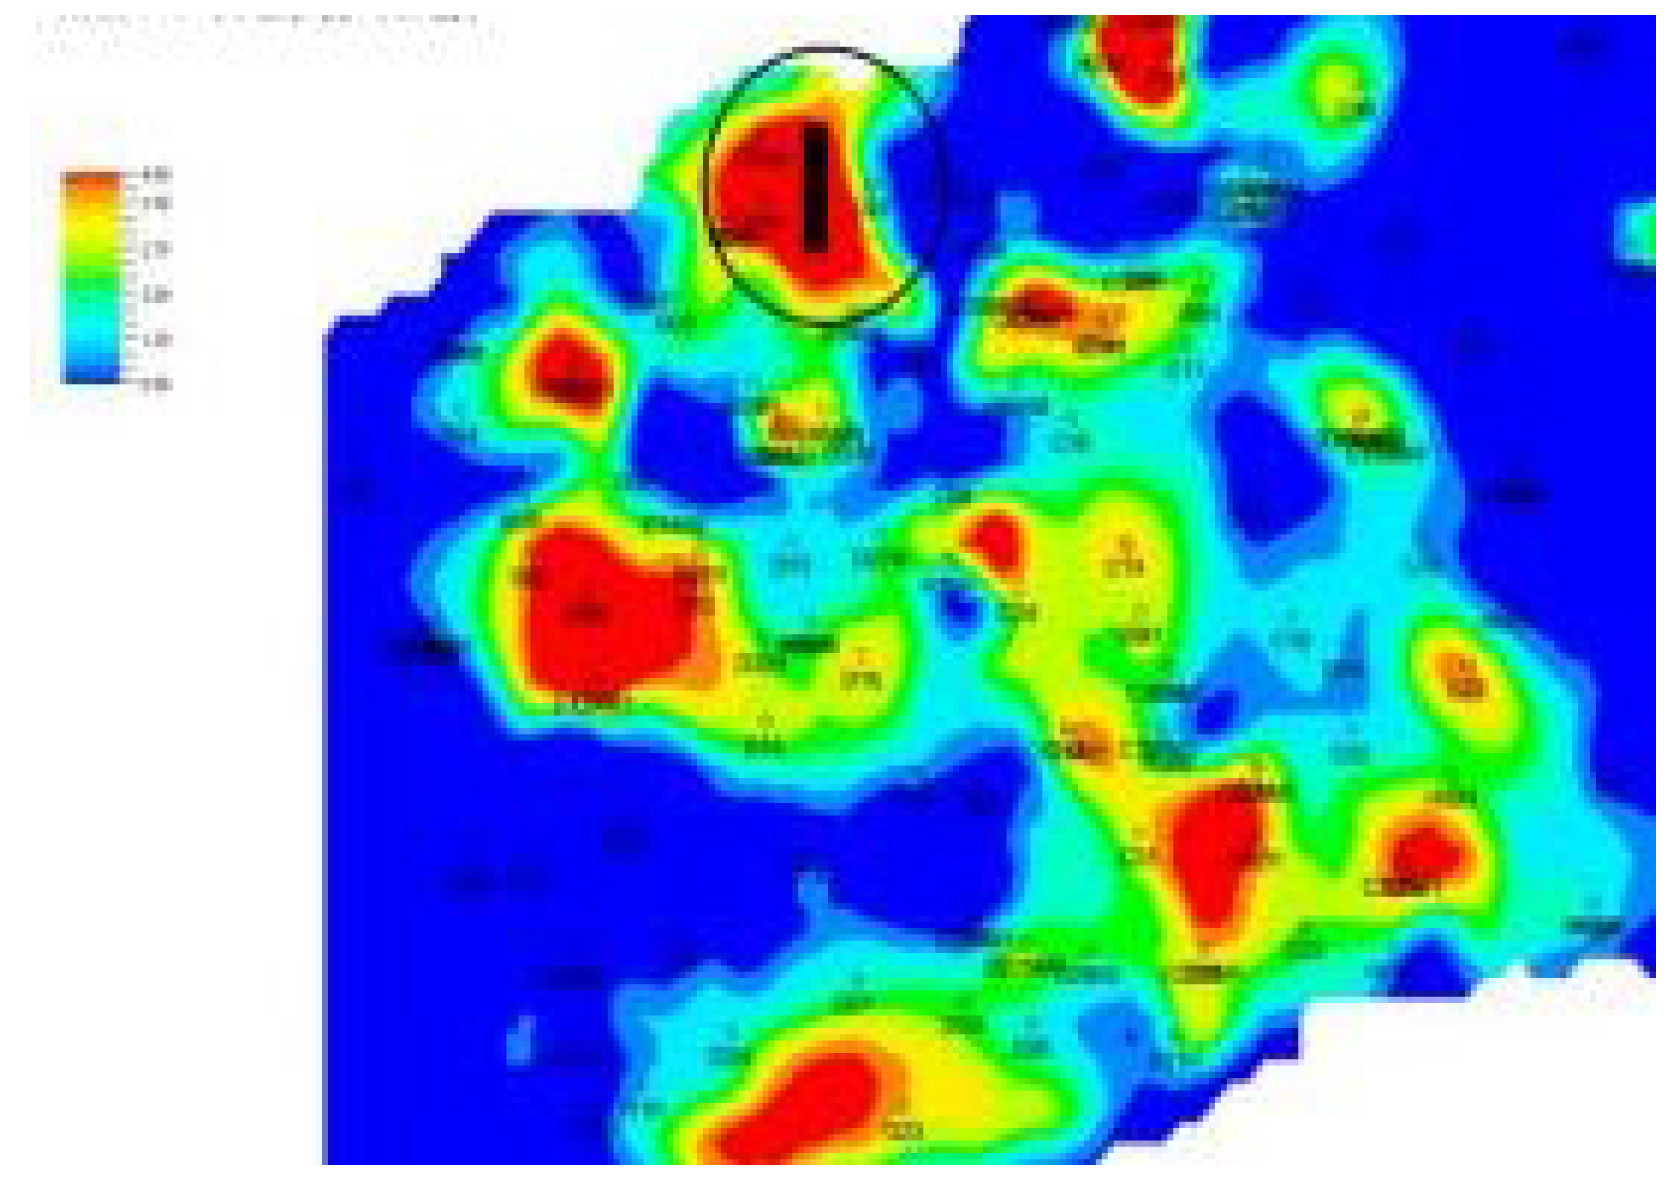
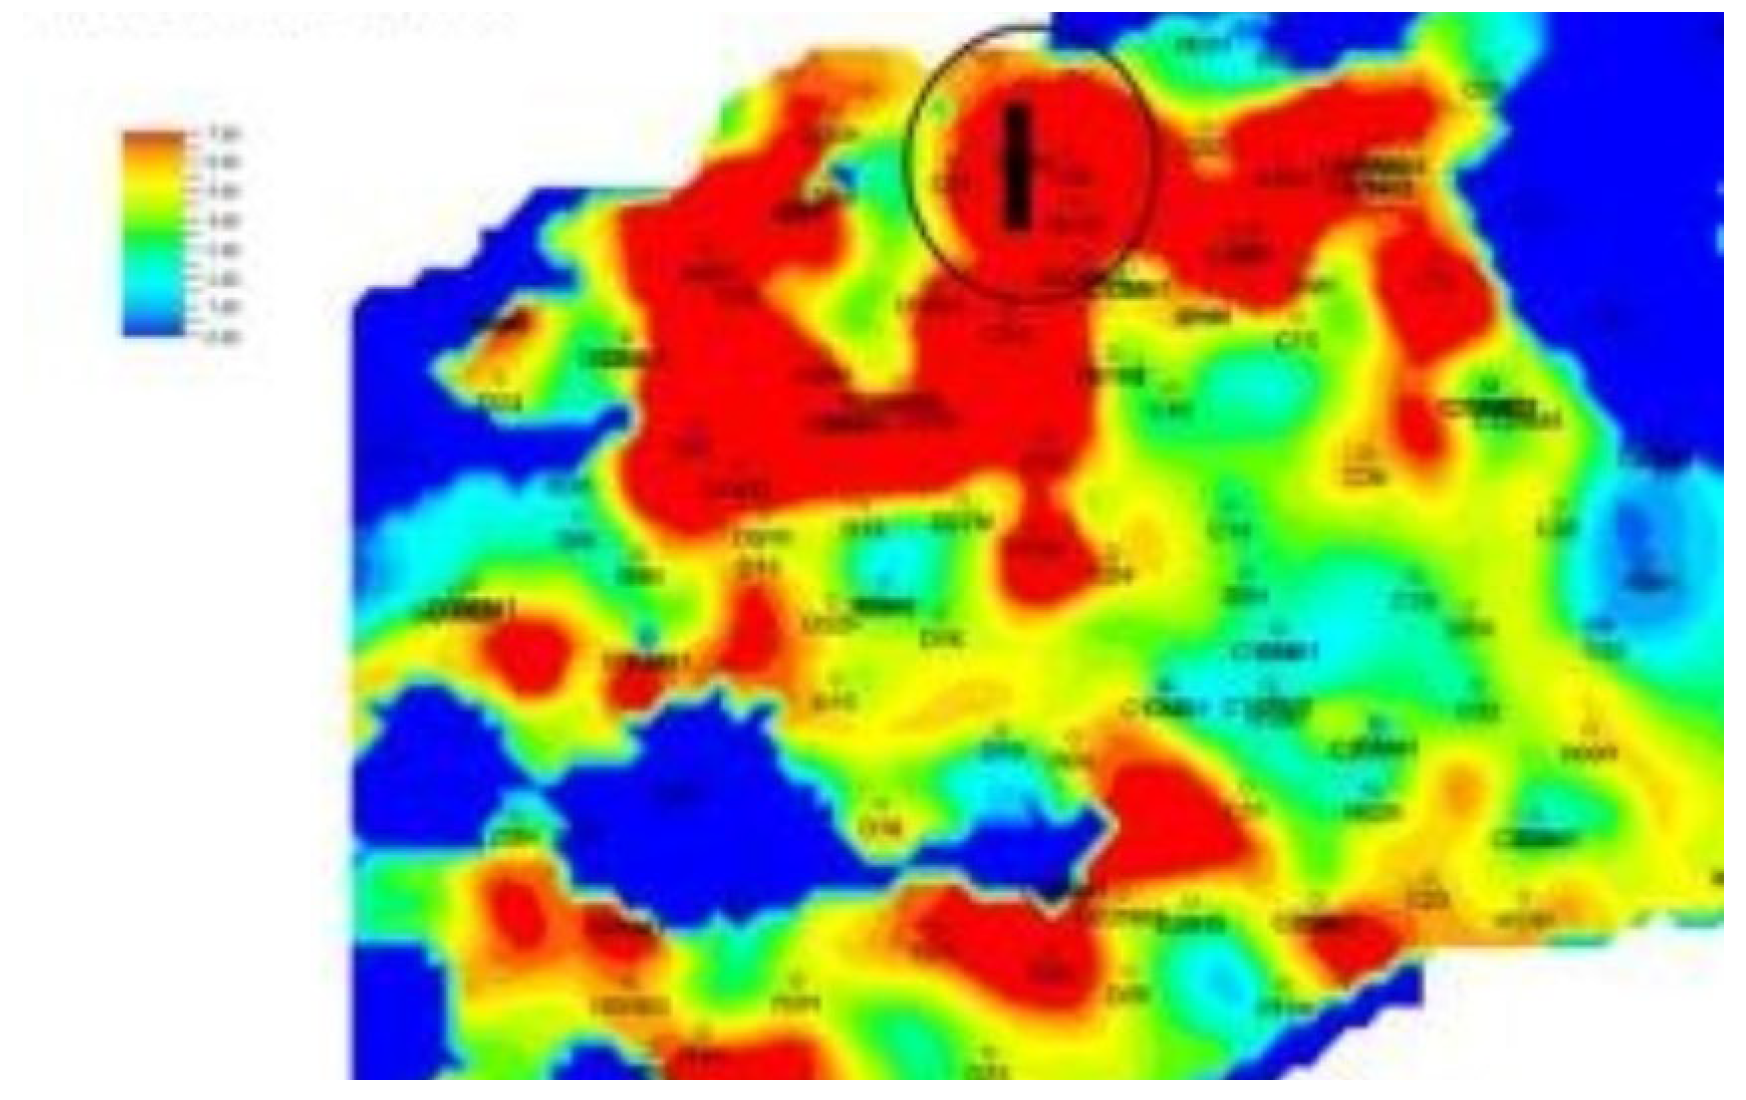
The direct impact of infill drilling on reservoir dynamics is illustrated in Figure 16 and Figure 17. The pre-infill TOF distribution (Figure 16) was characterized by extensive high-TOF regions (>500 days), reflecting inefficient waterflooding. Post-infill, the TOF in these areas was significantly reduced, indicating that the new wells successfully optimized the flow field and improved sweep efficiency(the red dashed circles). Similarly, the pre-infill oil saturation map (Figure 17, the black dashed circles) showed an uneven distribution, which became more uniform following infill drilling as the new wells mobilized previously bypassed oil.
Synthesizing these findings, this study proposes a set of comprehensive screening criteria for identifying optimal infill drilling locations. The established thresholds are: a waterflooded ratio <45%, a remaining oil thickness >6 m, and a time-of-flight >200 days. Adherence to these criteria ensures that infill wells are strategically placed in areas with high remaining oil potential and inefficient existing sweep patterns. Field applications have confirmed that wells meeting these standards consistently deliver significant production gains, providing a scientific basis for refined field management.

3.3.2. Conformance Control and Displacement Adjustment Thresholds

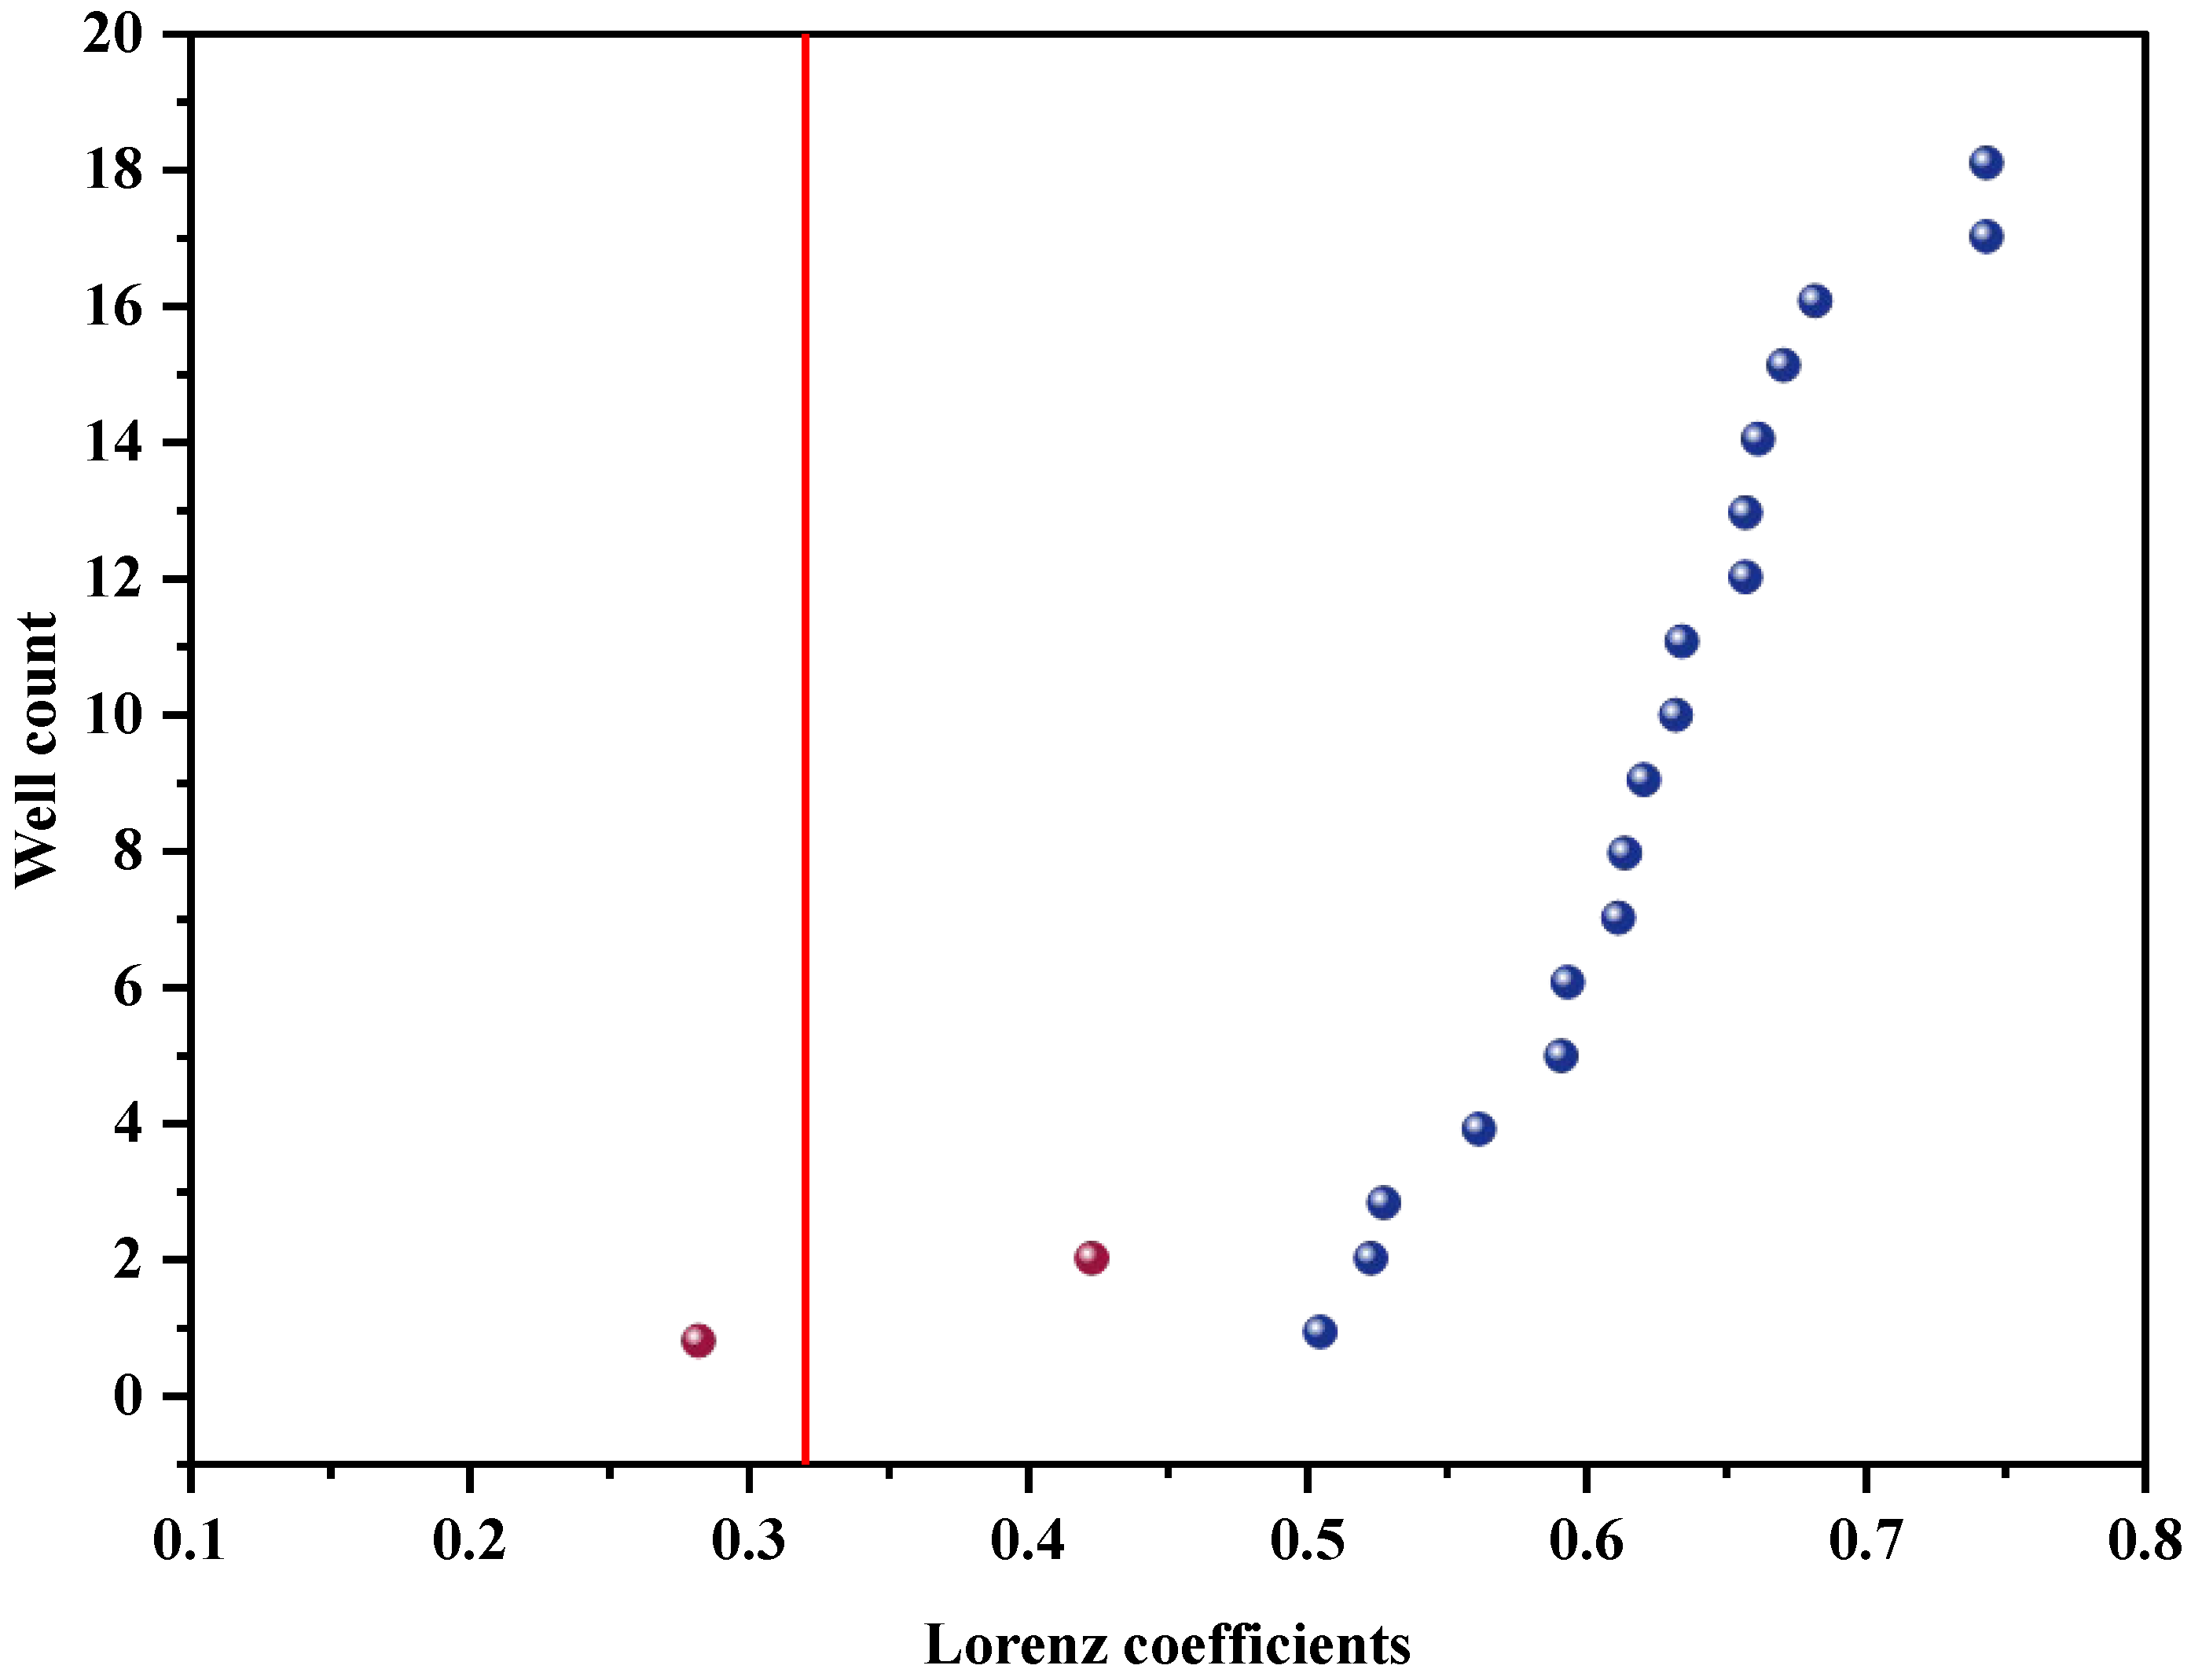
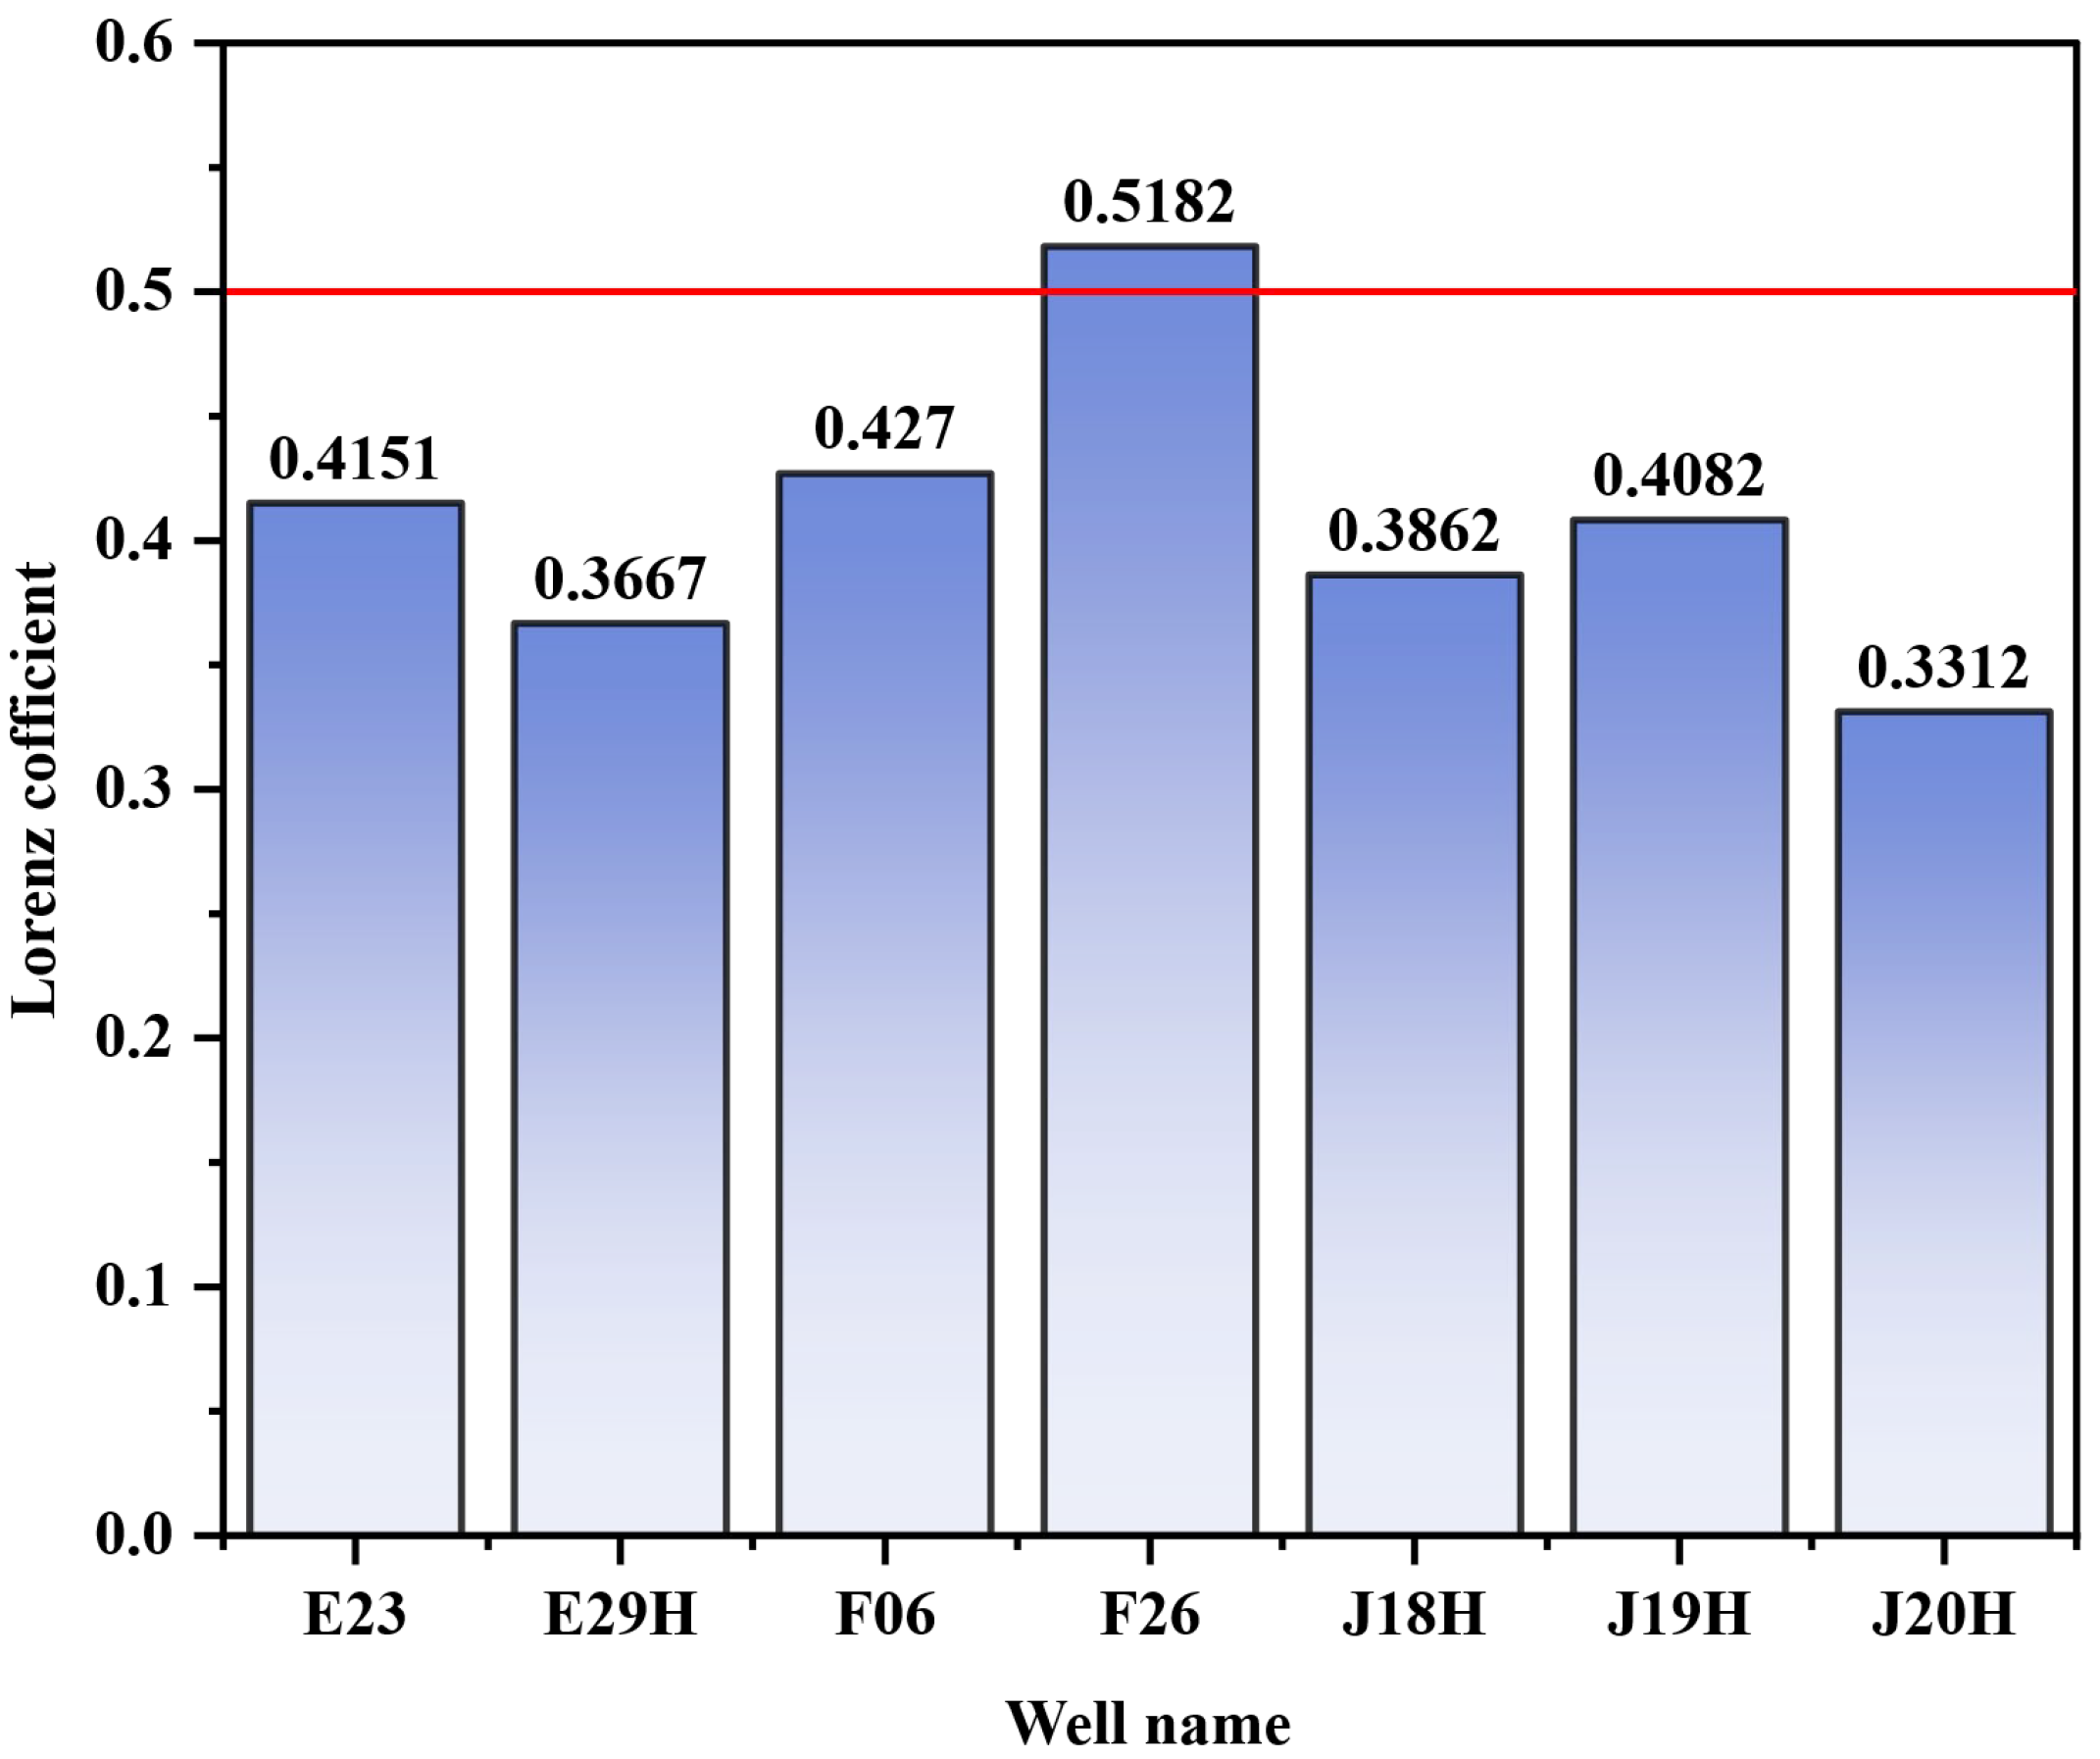
To define quantitative criteria for conformance control, dynamic data from 25 well groups subjected to tracer injection were analyzed. This investigation revealed a direct correlation between the dynamic Lorenz coefficient and the incidence of channeling. As depicted in Figure 18, a sharp increase in the number of channeling wells occurs when the Lorenz coefficient surpasses 0.5, establishing this value as a robust indicator of severe inter-well heterogeneity and the formation of preferential flow paths.
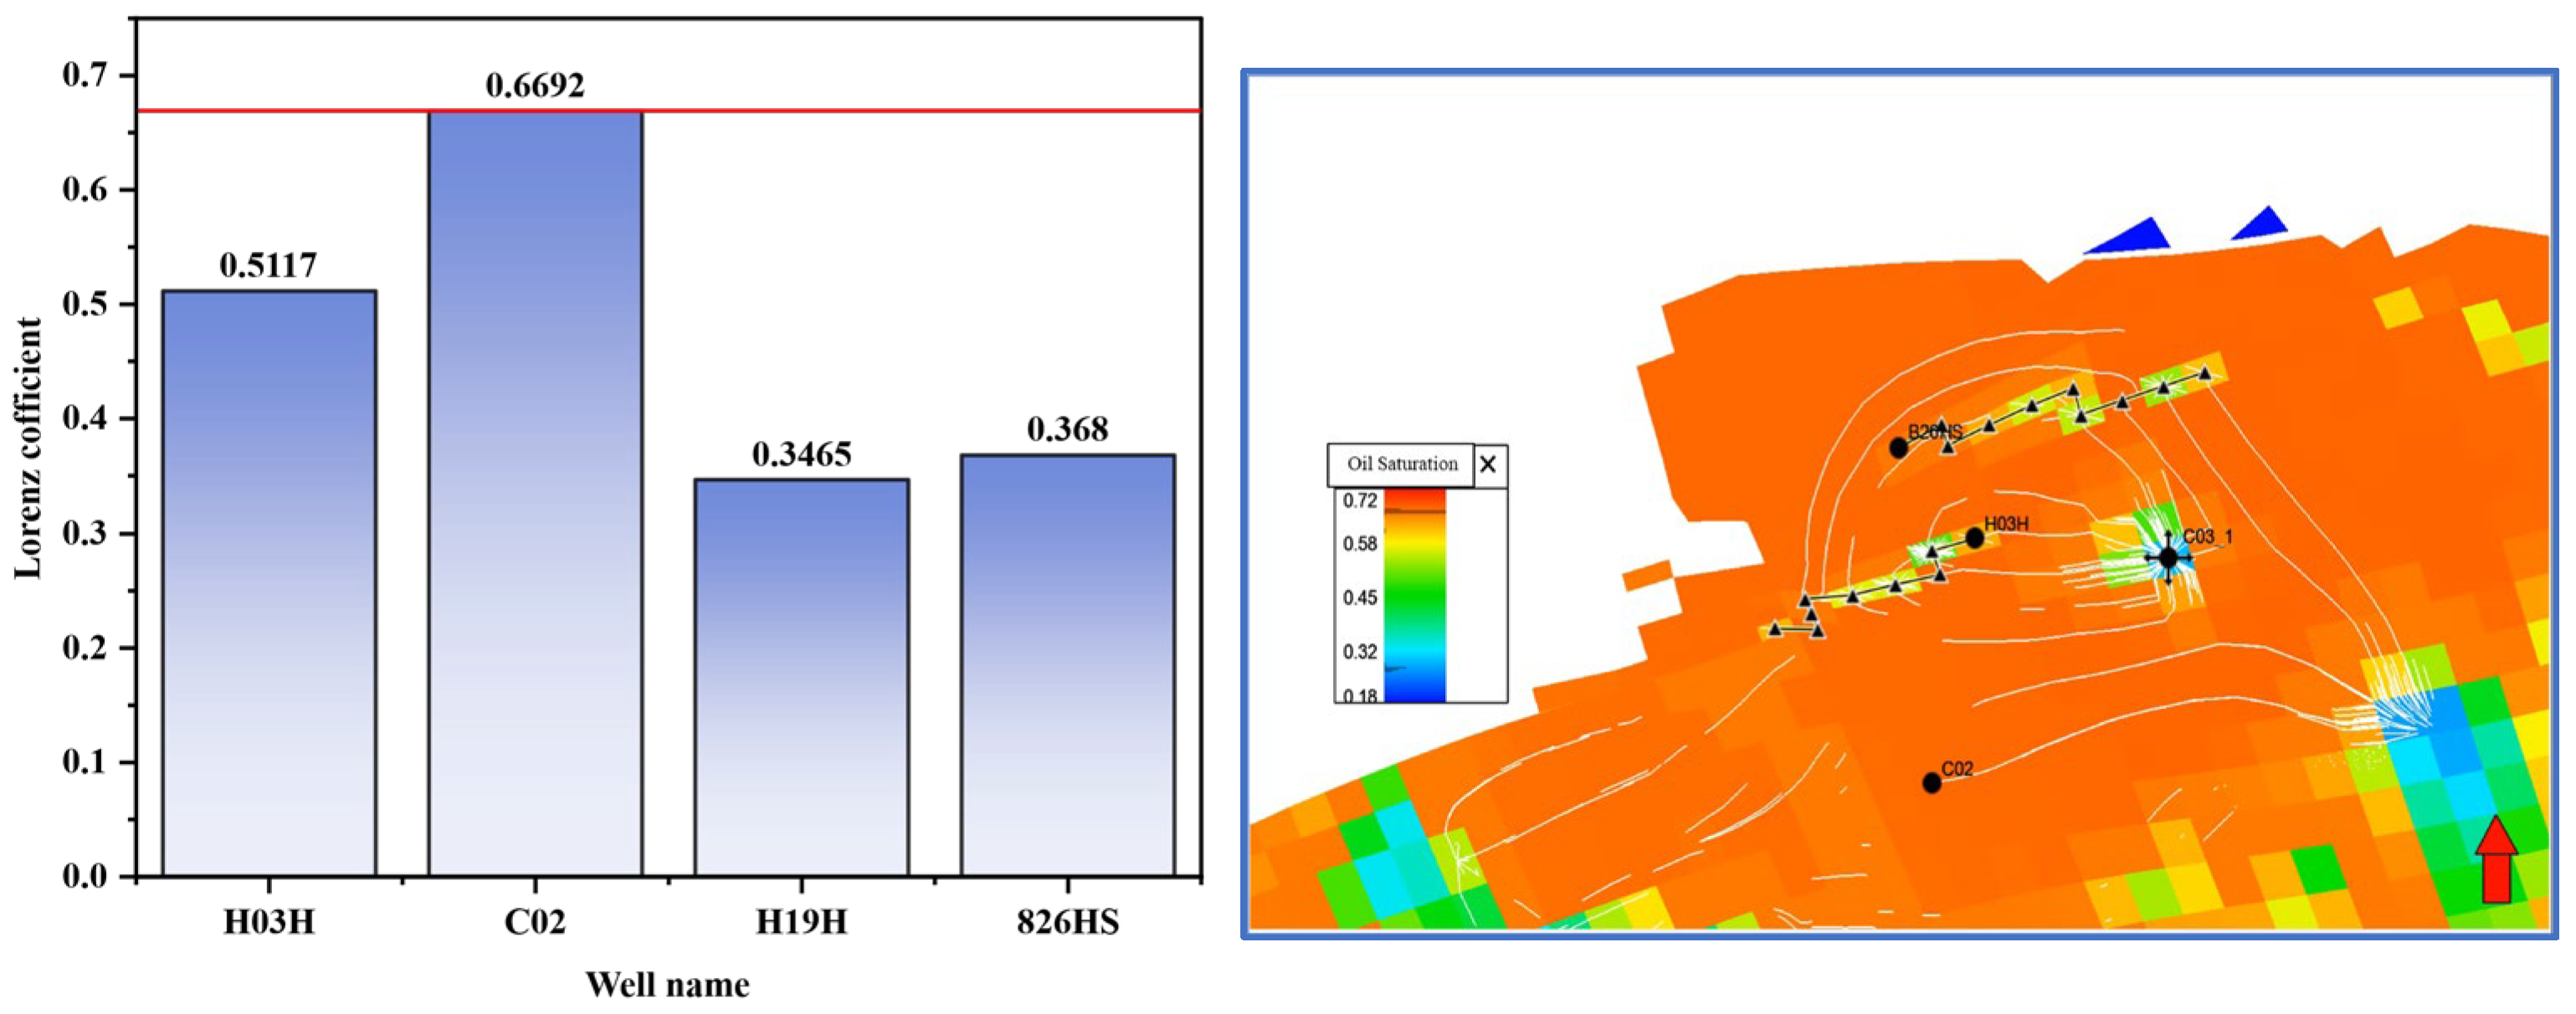
Furthermore, the efficacy of conformance treatments was found to be contingent upon the degree of reservoir heterogeneity. A comparative analysis of the D08 and C03 well groups exemplifies this principle (Table 3). The D08 group, which presented with a high initial Lorenz coefficient, exhibited a marked improvement in sweep uniformity post-treatment; this signifies the successful diversion of injected fluid and the mobilization of previously bypassed oil (Figure 19). In contrast, the C03 group, characterized by low heterogeneity and a TOF below 50 days, showed a negligible response to the intervention, with minimal change in oil saturation (Figure 20). This disparity underscores that conformance control is most impactful in highly heterogeneous settings and offers limited benefit in relatively homogeneous reservoirs lacking well-defined thief zones.
Consequently, based on this empirical evidence, the following thresholds were established for identifying candidate well groups for conformance control: a time-of-flight (TOF) of less than 50 days combined with a dynamic Lorenz coefficient greater than 0.5. Applying interventions to well groups that meet these criteria enables the targeted sealing of dominant flow paths, which in turn redirects injection fluids into unswept, lower-permeability zones to substantially improve overall sweep efficiency.

3.3.3. Liquid Lifting Thresholds

To define criteria for optimizing production through liquid lifting, historical data from measures implemented before 2023 were analyzed (Table 4). The analysis showed a strong positive correlation between post-treatment production gains and two key parameters: the remaining oil thickness ratio and the TOF. A significant “oil increase without water increase” effect was observed in wells where the TOF was greater than 200 days, yielding a success rate of 87%—a substantial improvement over the sub-40% rate achieved with traditional methods. Moreover, the most substantial production gains occurred when the remaining oil thickness ratio exceeded two-thirds. By combining these parameters, a refined screening methodology was developed that increased the success rate for liquid lifting to 78% across 23 interventions.
Accordingly, the final thresholds for implementing liquid lifting measures were established as: a remaining oil thickness ratio >2/3 and a time-of-flight (TOF) >200 days.

3.4. Adjustment Strategies and Schemes

The practical application of this diagnostic framework is demonstrated through two case examples. First, an analysis of the southern block identified a large, poorly swept area adjacent to the C29 well, even after liquid lifting measures were applied (Figure 21). This region, characterized by high remaining oil potential, was prioritized as a target for infill drilling, leading to the planned deployment of a new horizontal well to enhance local recovery (Figure 22 and Figure 23 show the flooded thickness and oil reservoir thickness of Layers 1–3 in the Southern Block, Within the area enclosed by the black coil is the hard-to-produce portion of this region, where significant remaining oil is present.).
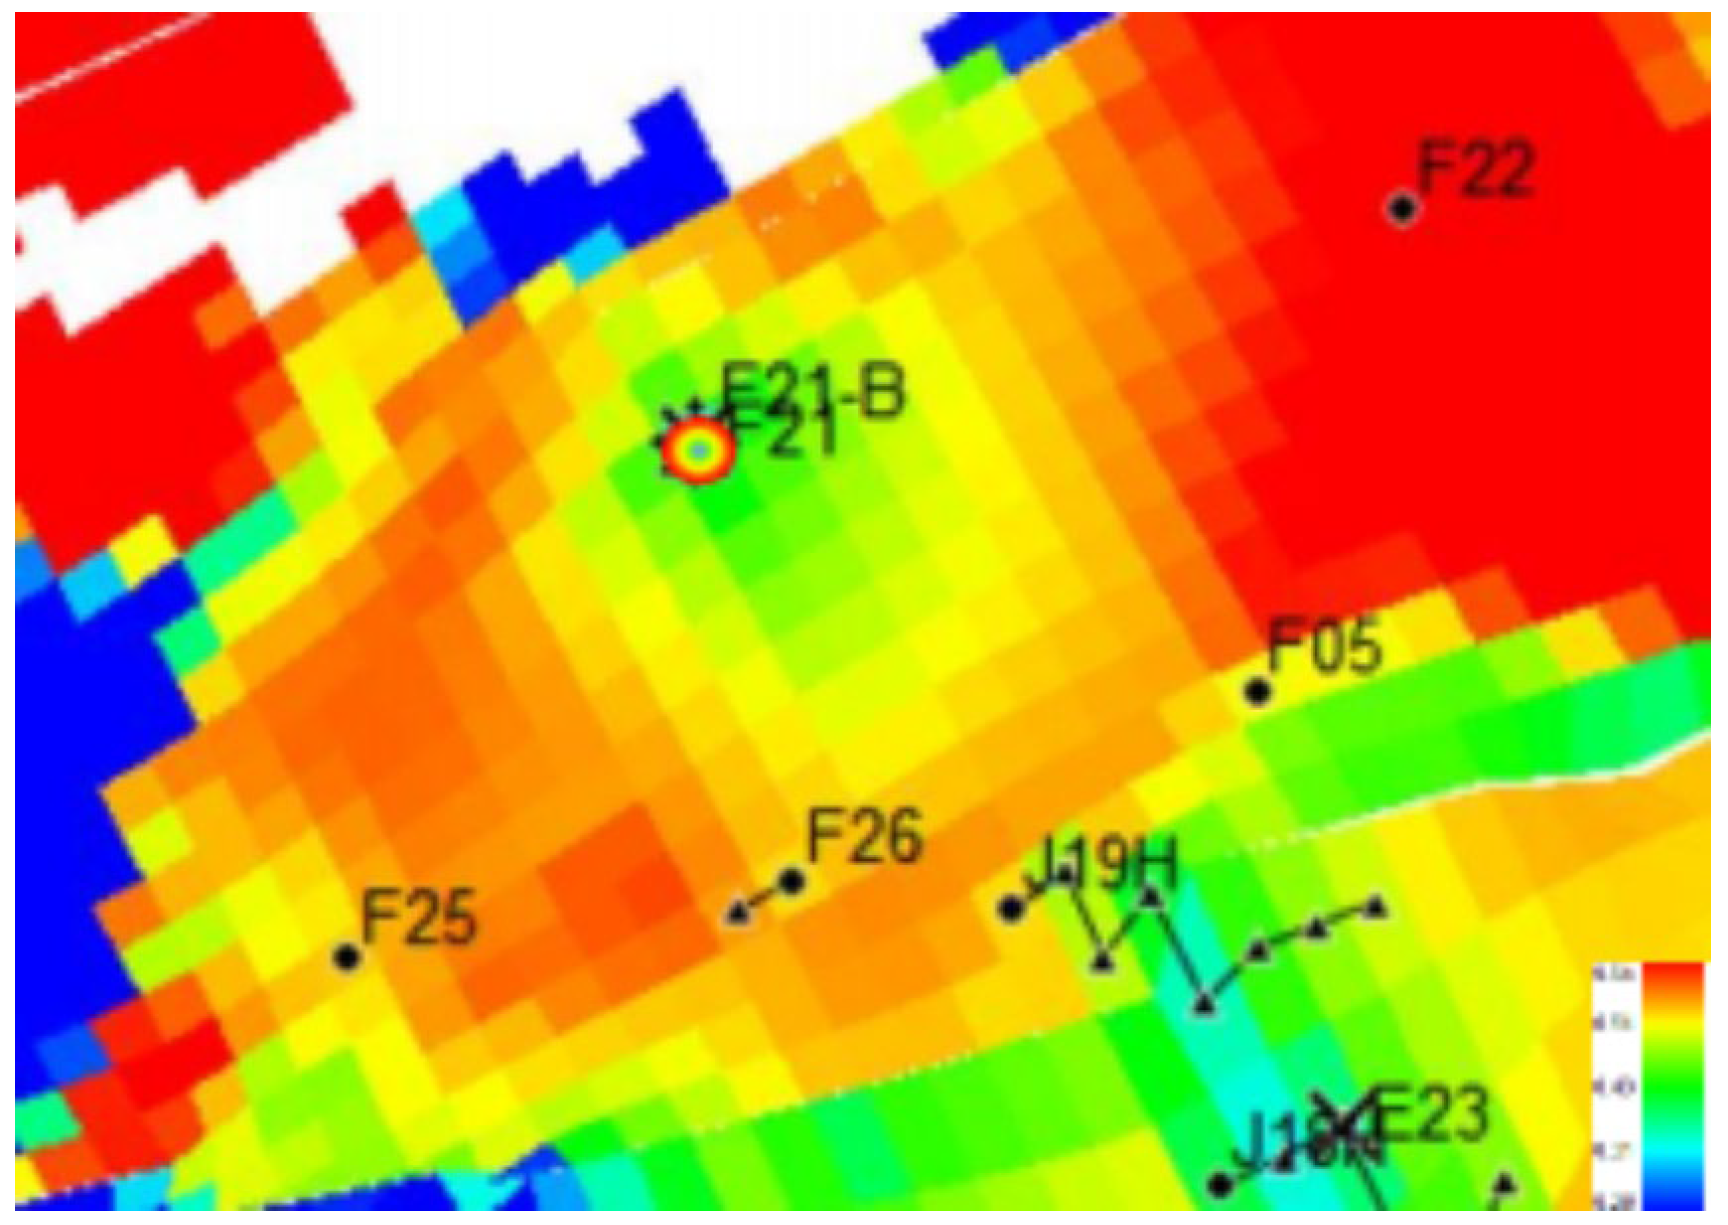
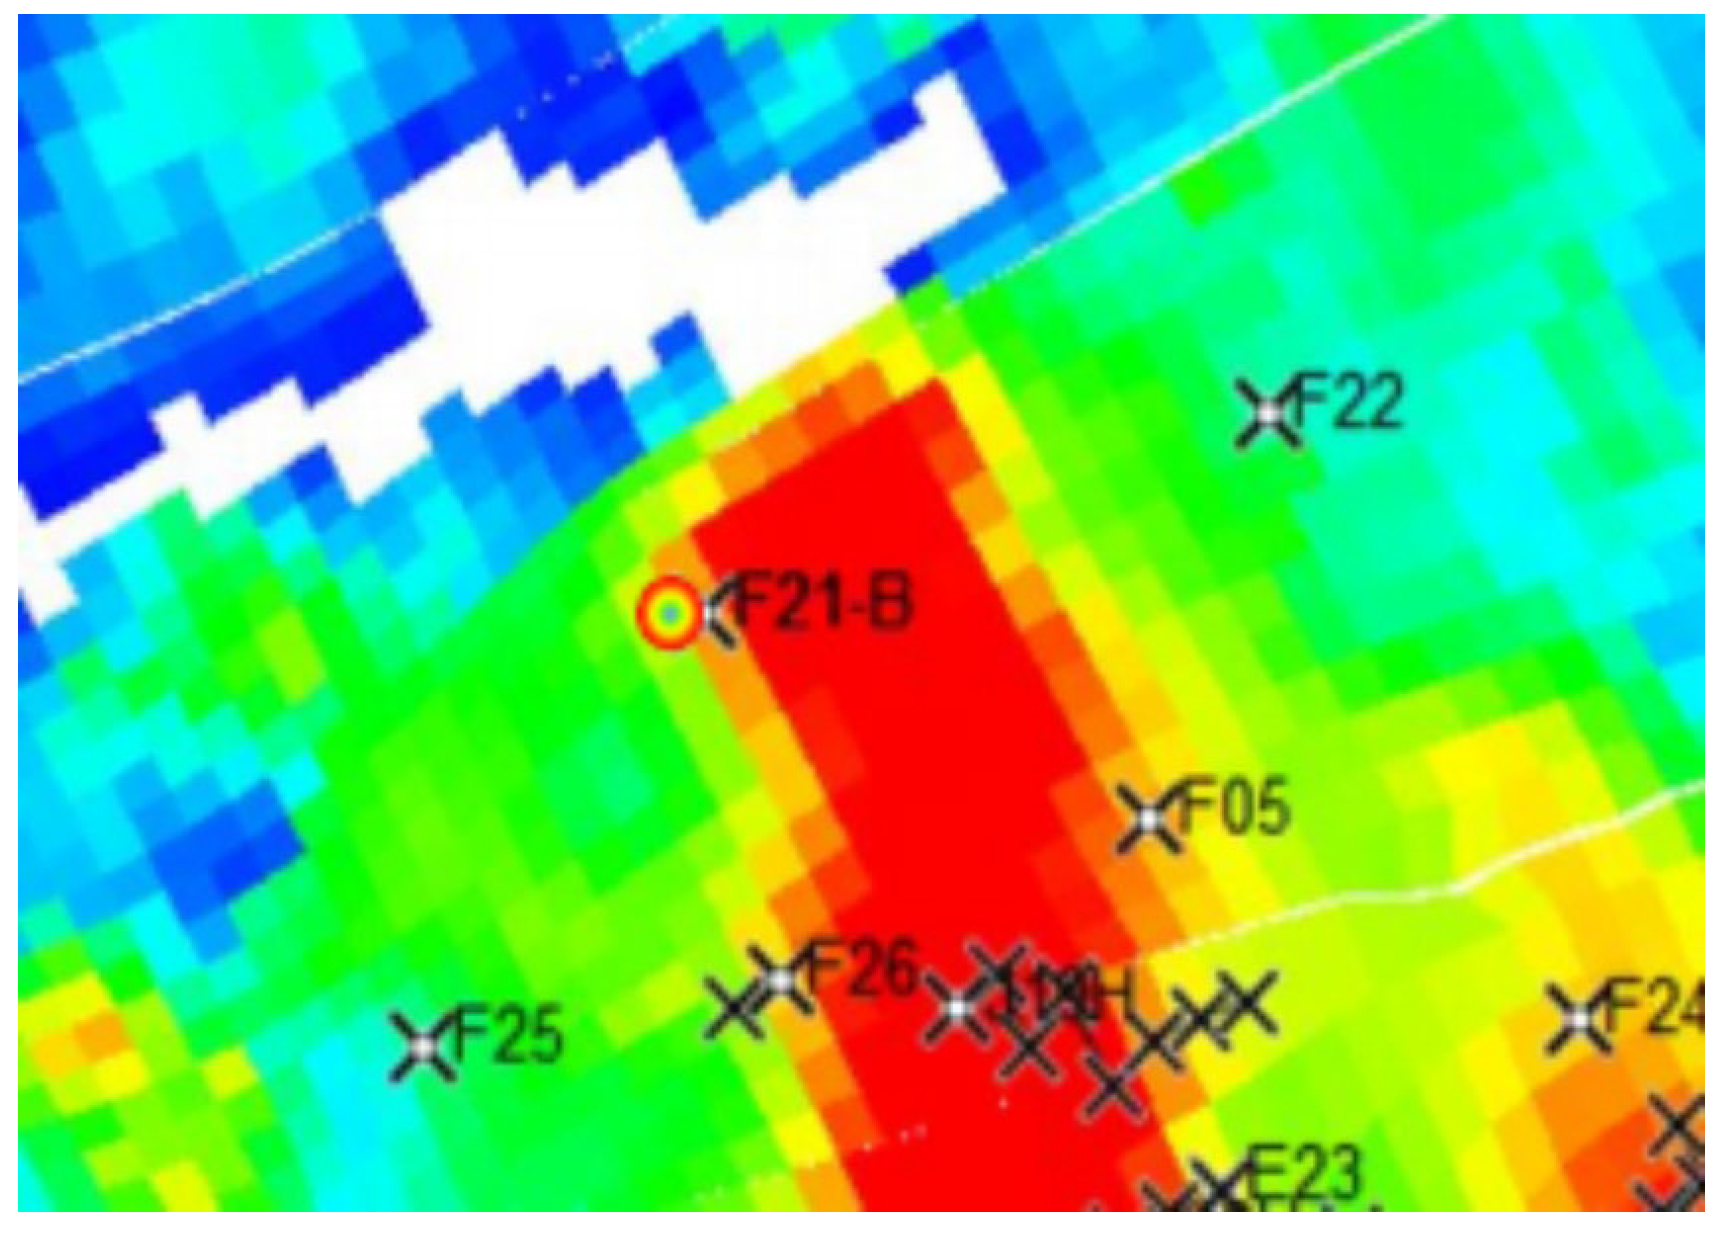
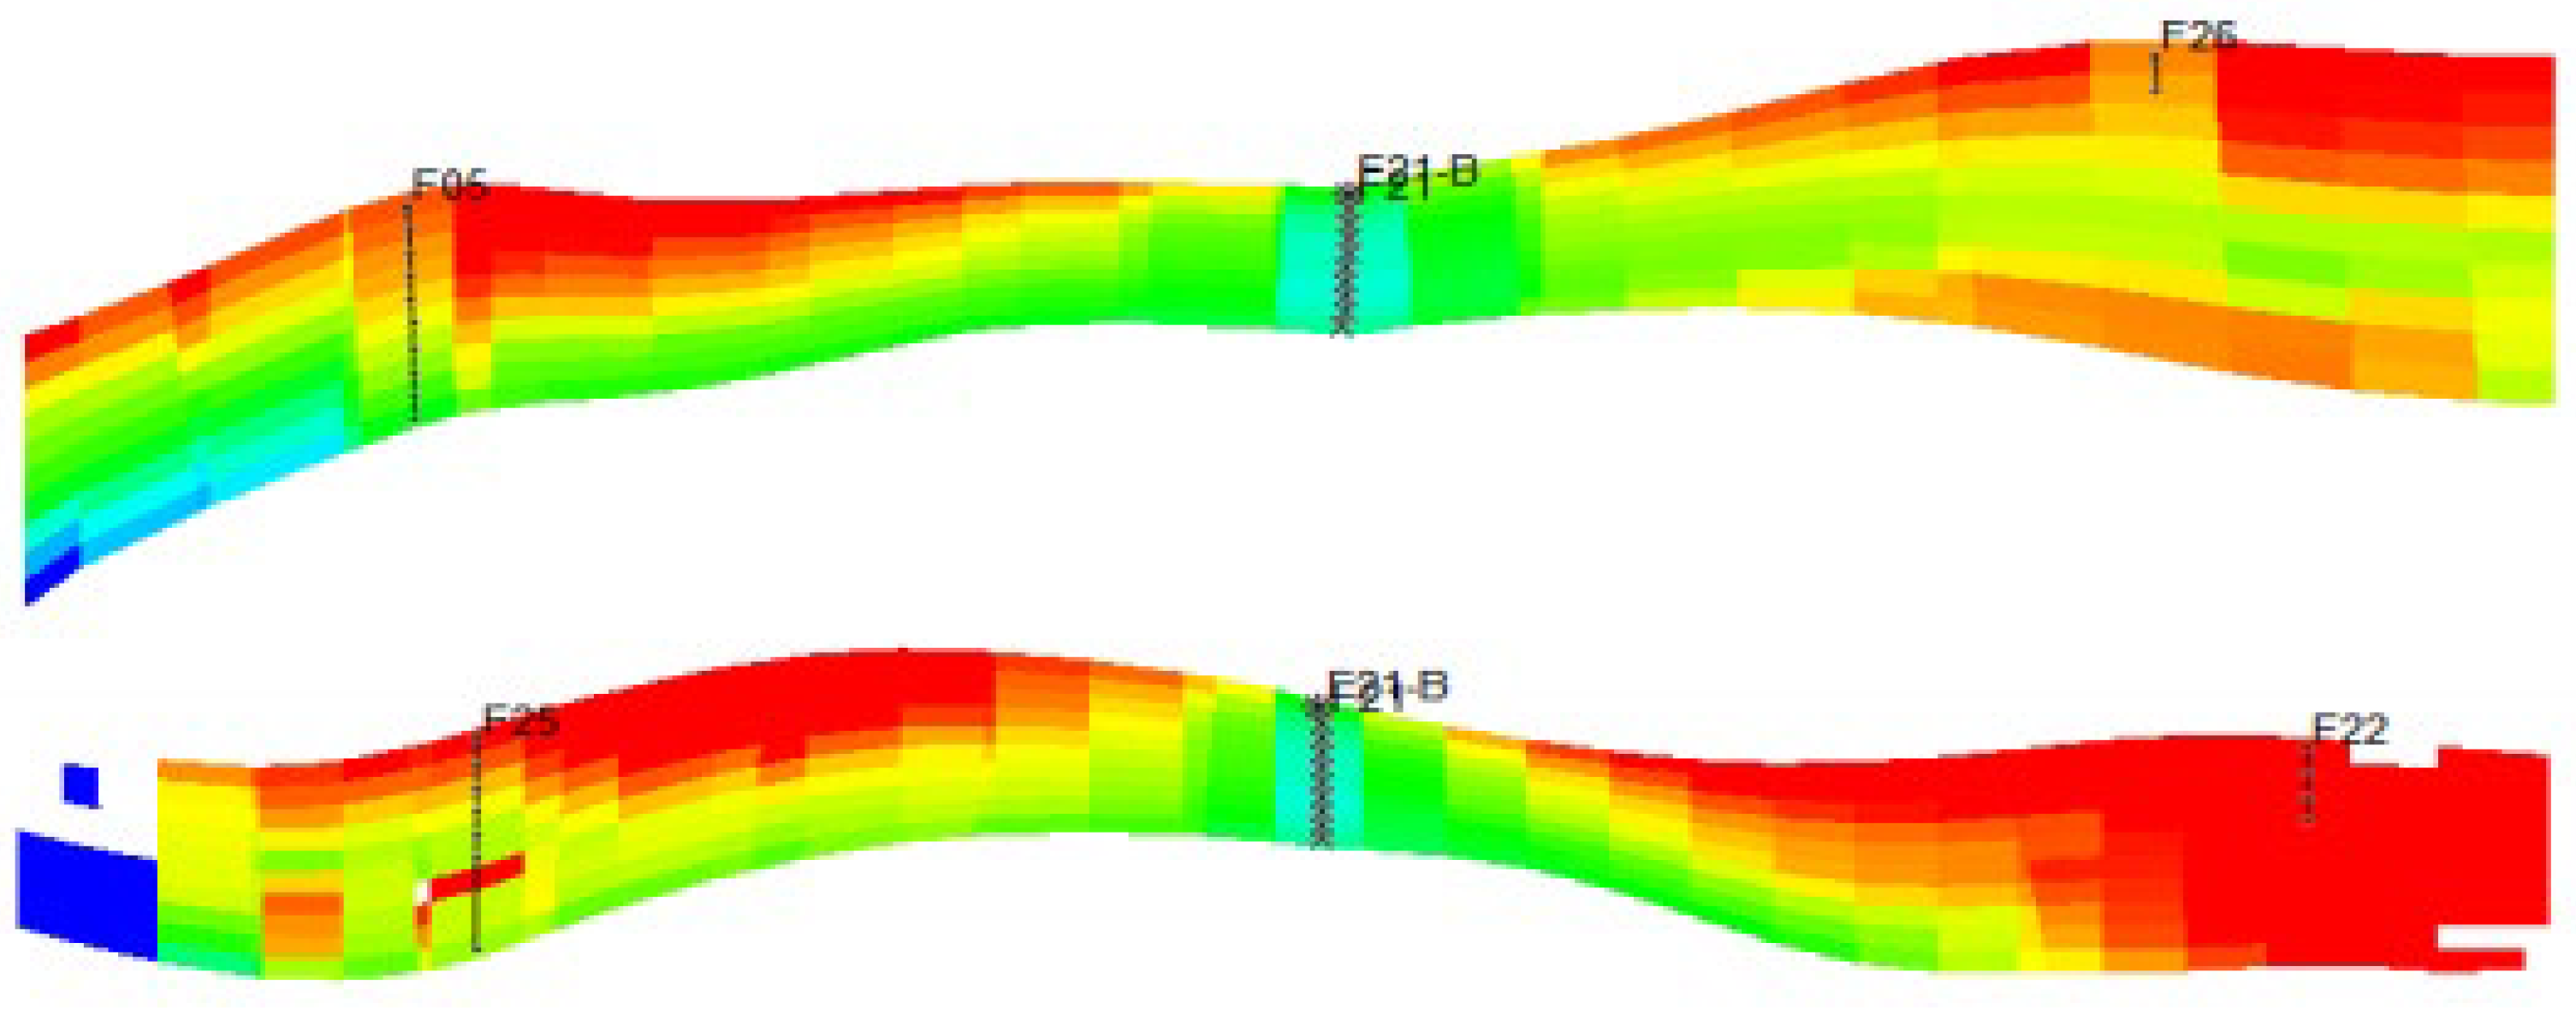
As a further illustration, a detailed diagnostic evaluation was performed on a well group including producers F21, F22, F25, and F26. The analysis revealed high remaining oil saturation between wells F21, F26, and F05 (Figure 24), which coincided with a zone of low permeability (Figure 25). While static permeability data alone might suggest this oil is immobile, the dynamic diagnostics revealed a different mechanism. The dynamic Lorenz coefficient for well F26 was high (>0.5), indicating that active channeling was bypassing the oil within the lower-permeability matrix (Figure 26). A cross-sectional view confirmed the presence of a thick, insufficiently swept remaining oil column between wells F25 and F22 (Figure 27). This integrated analysis, which combined static and dynamic indicators, correctly identified the primary production issue as channeling rather than merely poor reservoir quality (Figure 28). Consequently, a conformance control treatment was recommended to optimize the flow field and mobilize the substantial remaining oil in this area.
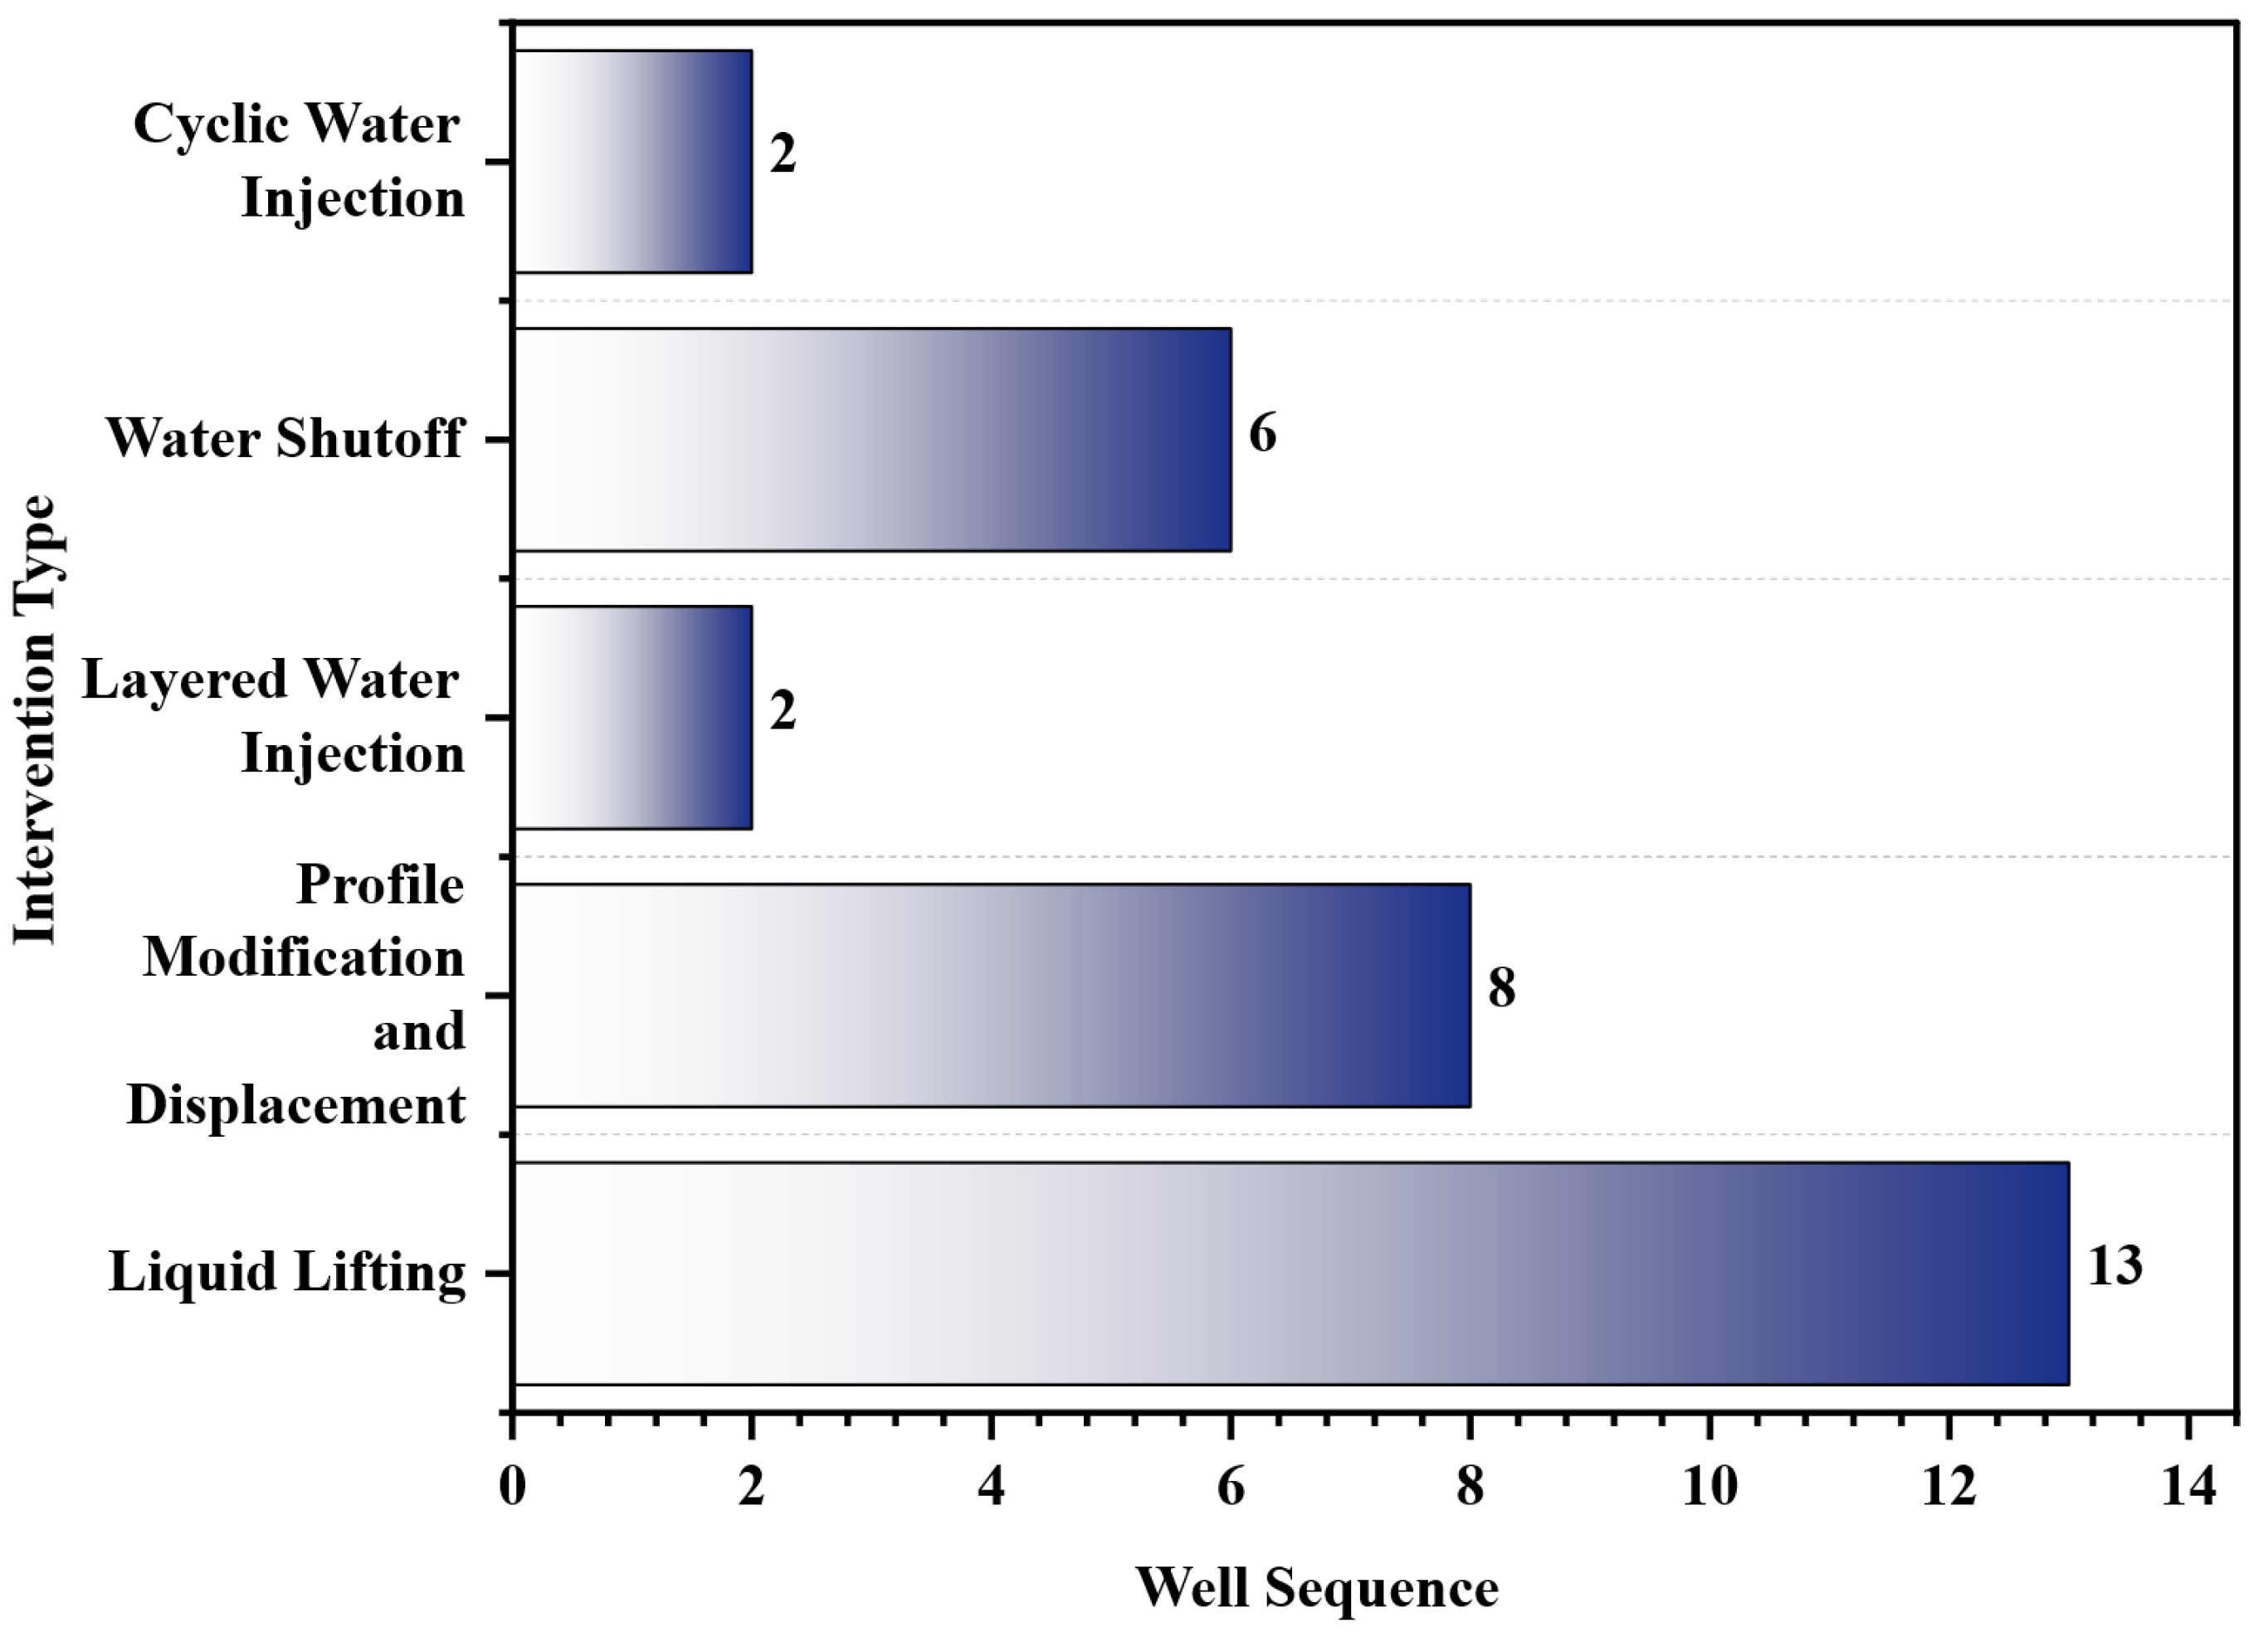
Based on measure effect assessment and numerical simulation, propose 31 well-time measures: 13 liquid lifting, 8 conformance and displacement, 2 layered injection, 6 water shutoff, 2 cyclic injection groups. See Figure 29:

3.5. Adjustment Effects

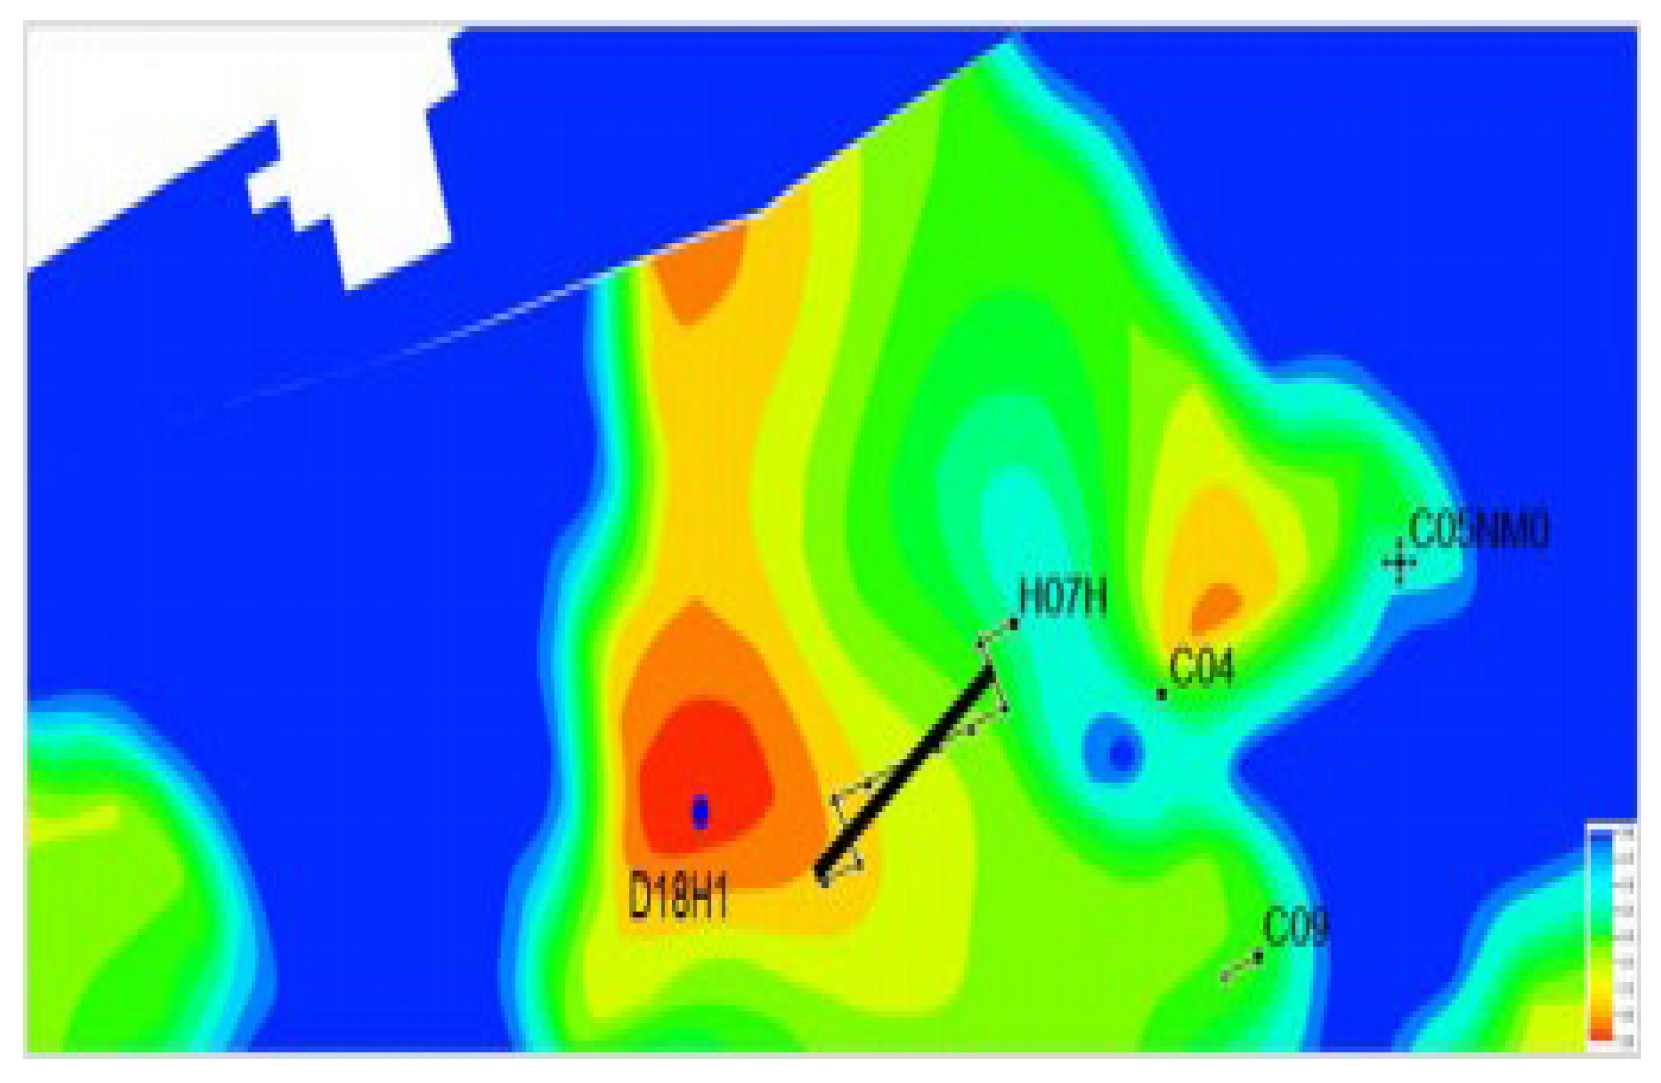
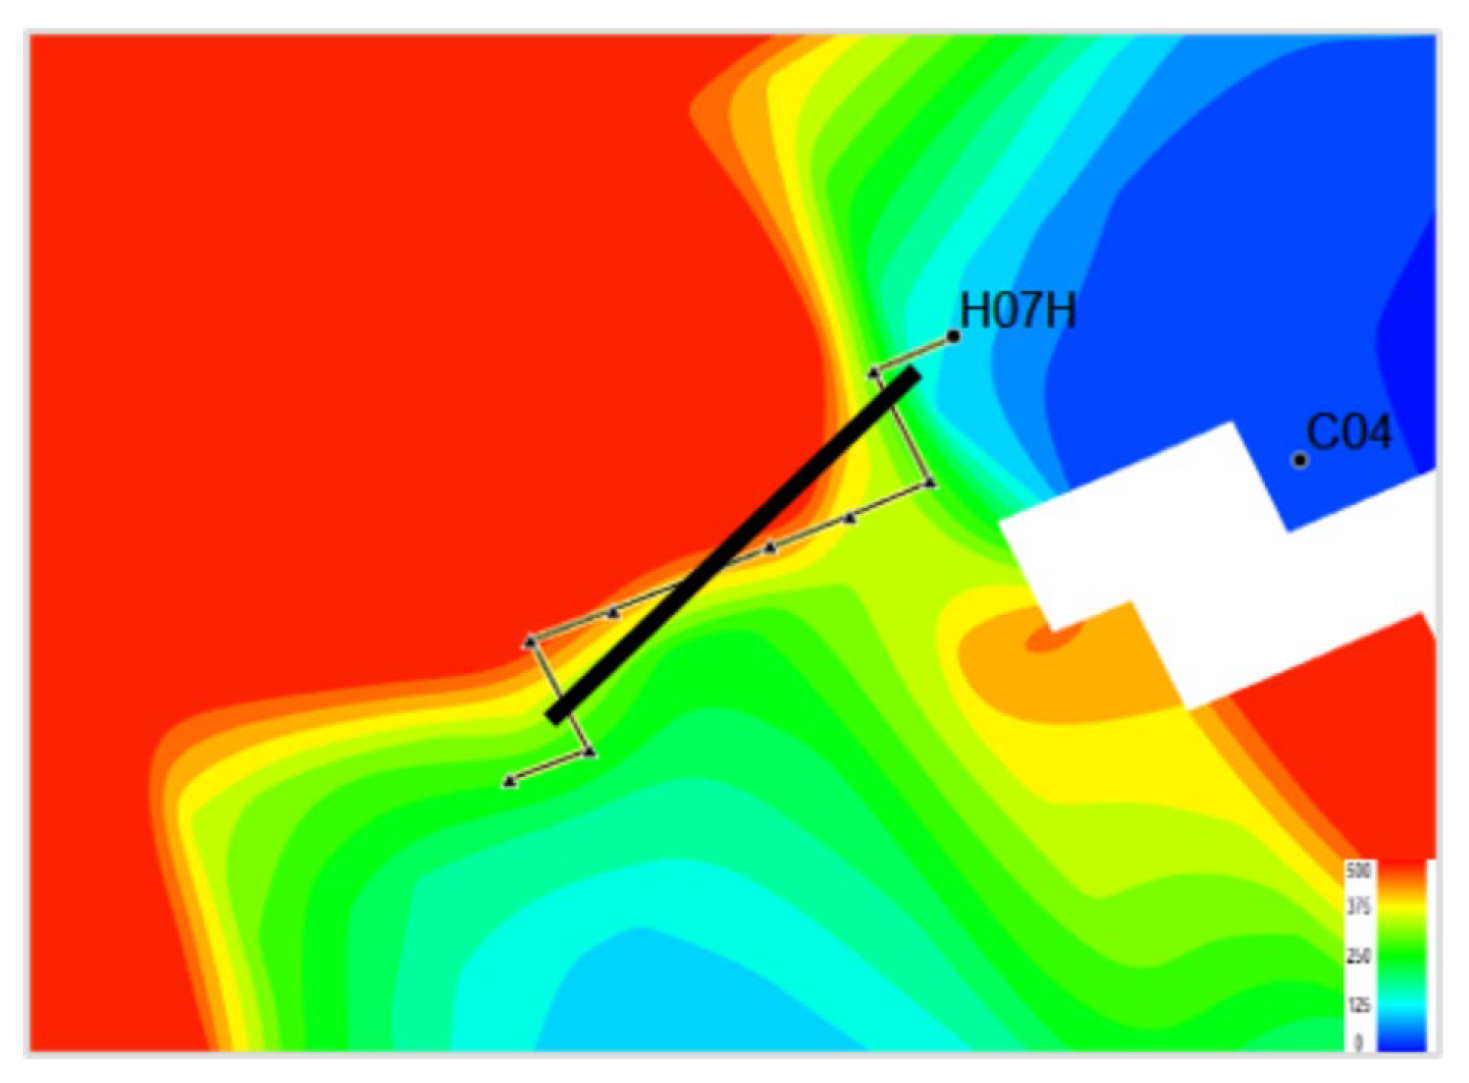
Field results confirmed the efficacy of the proposed adjustment strategies. In a pilot test, a synergistic operation was implemented, coupling water injection in well D18H1 (Nm03 layer) with coordinated liquid lifting in the adjacent well H07H. This combined intervention successfully mobilized previously bypassed inter-well oil, resulting in a sustained incremental production of approximately 7 tons/day. Subsequent diagnostic analysis confirmed the physical mechanism behind this success: the flow field had been significantly optimized (Figure 30 and Figure 31). The waterflooded ratio in the target area became more uniform, falling below the 45% threshold, while the TOF increased to over 200 days. This indicates that the injected fluid was successfully diverted, enhancing sweep into lower-permeability zones and mitigating the risk of channeling.
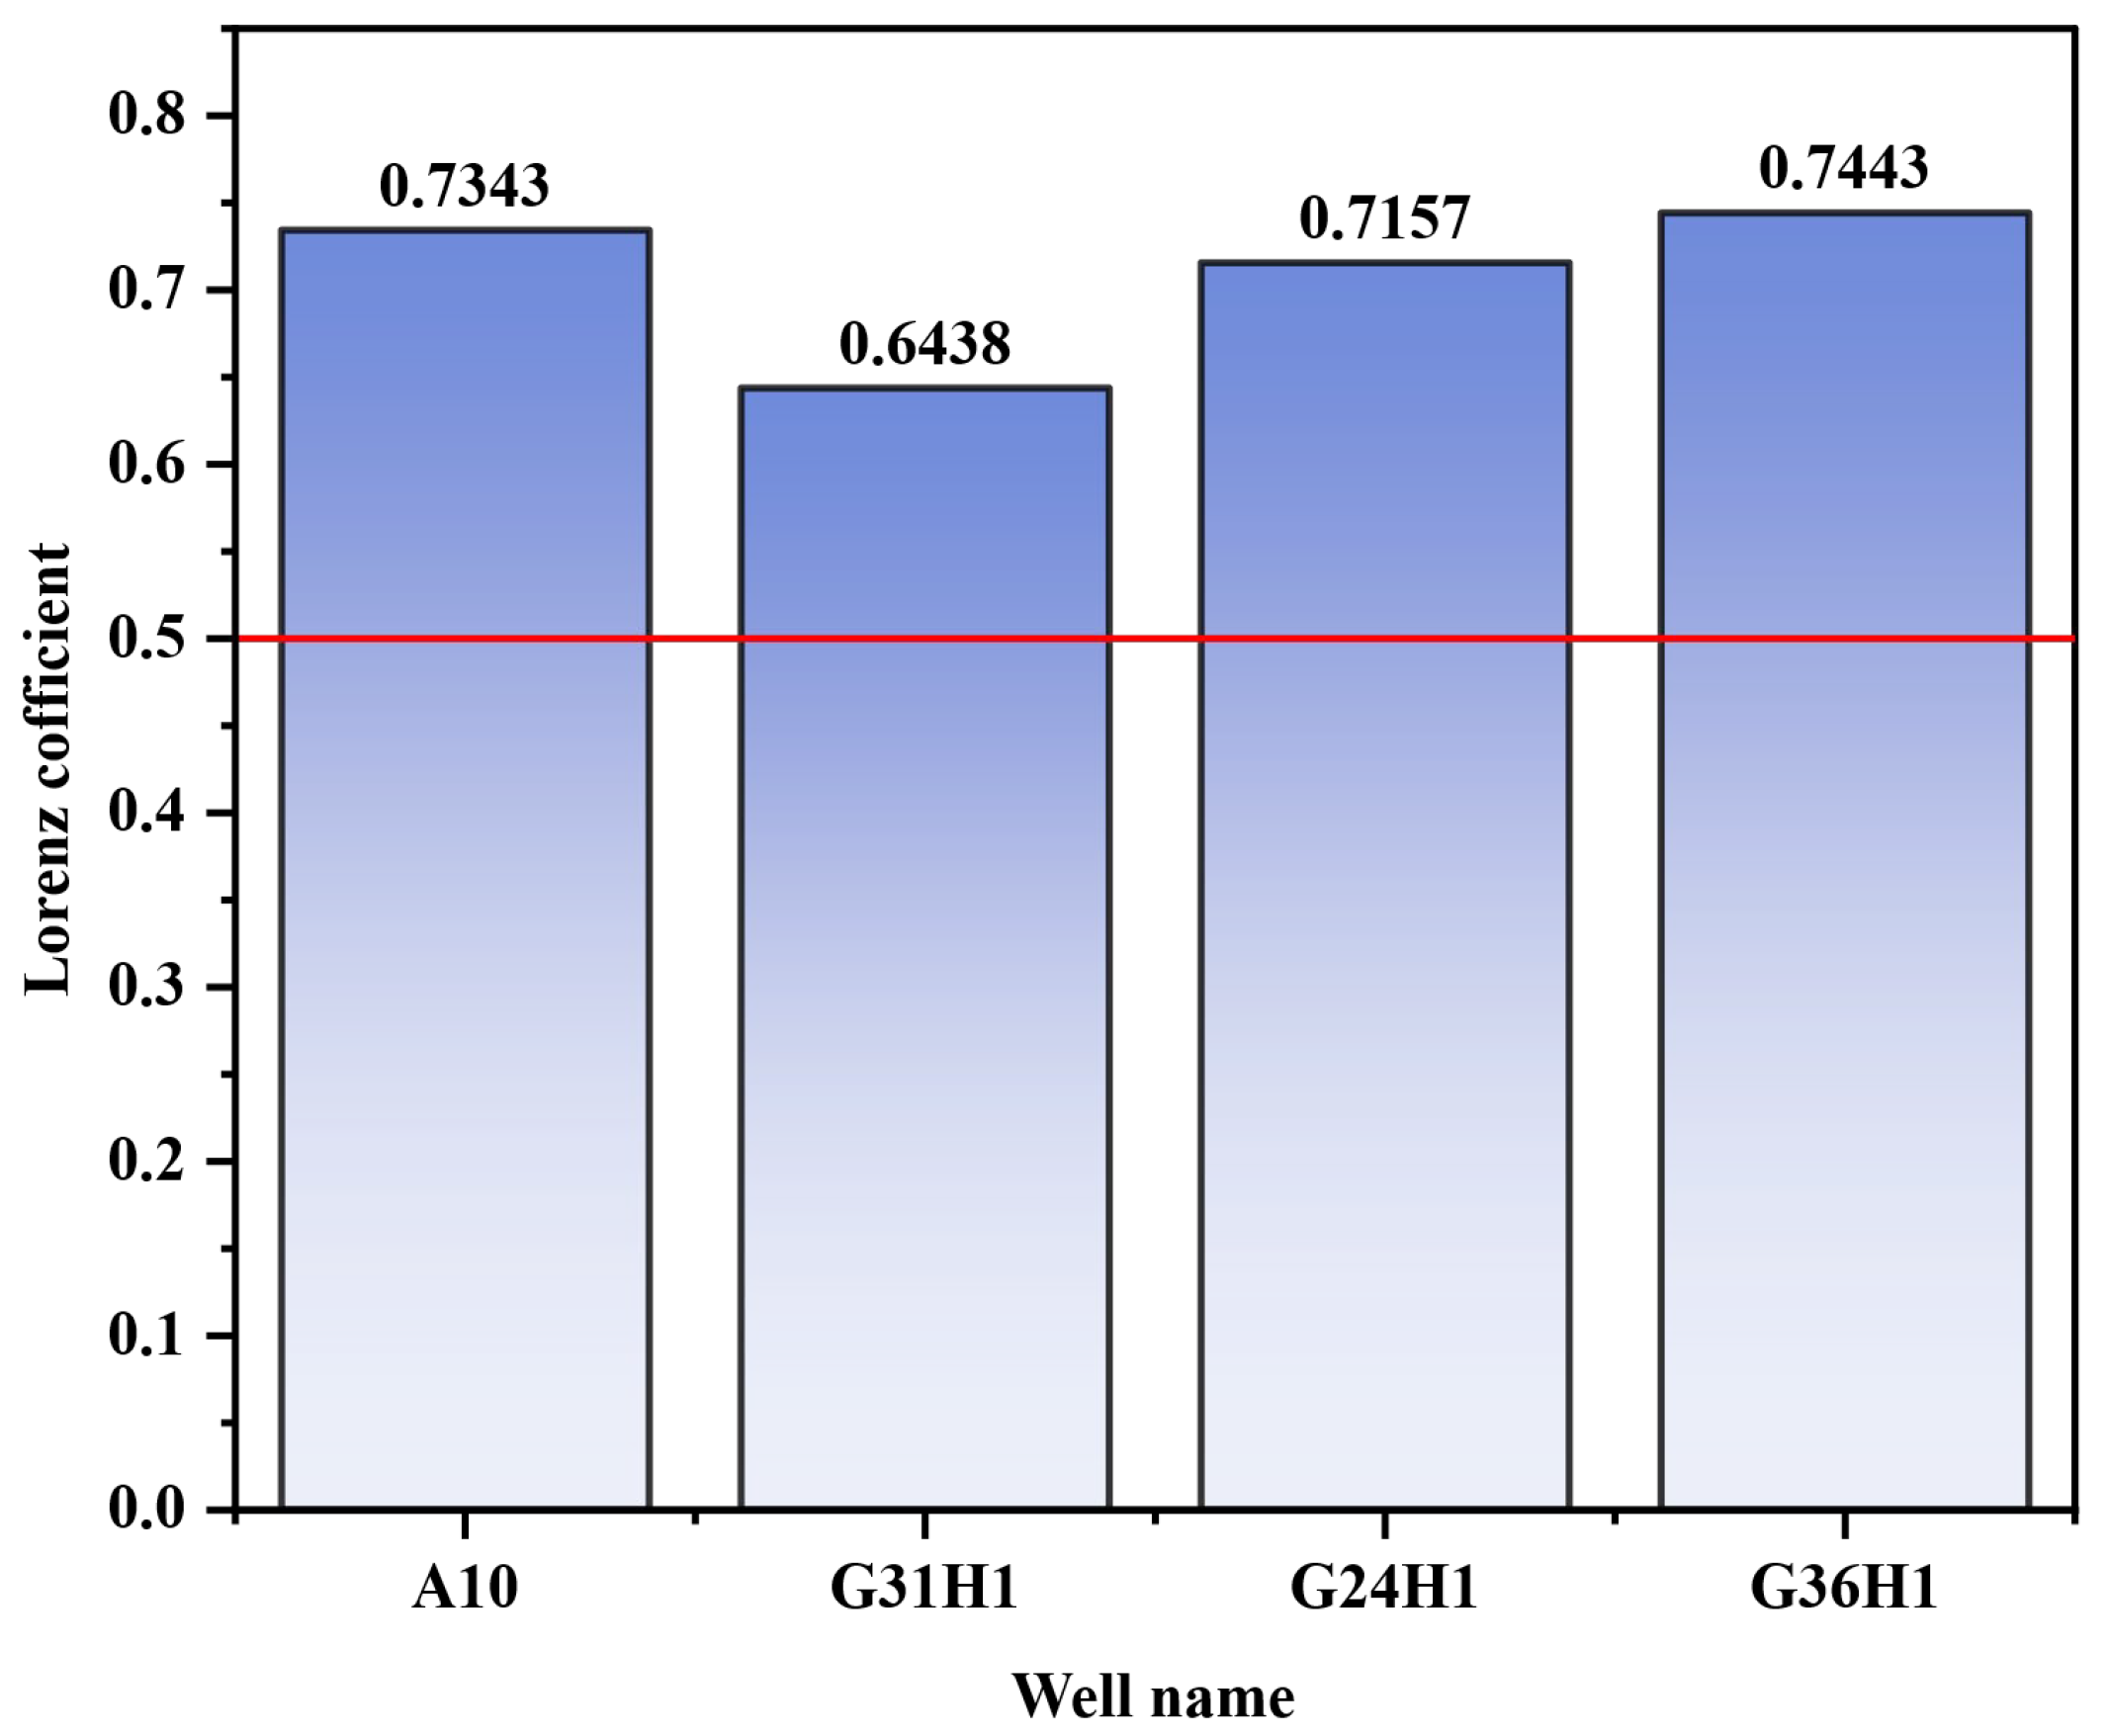
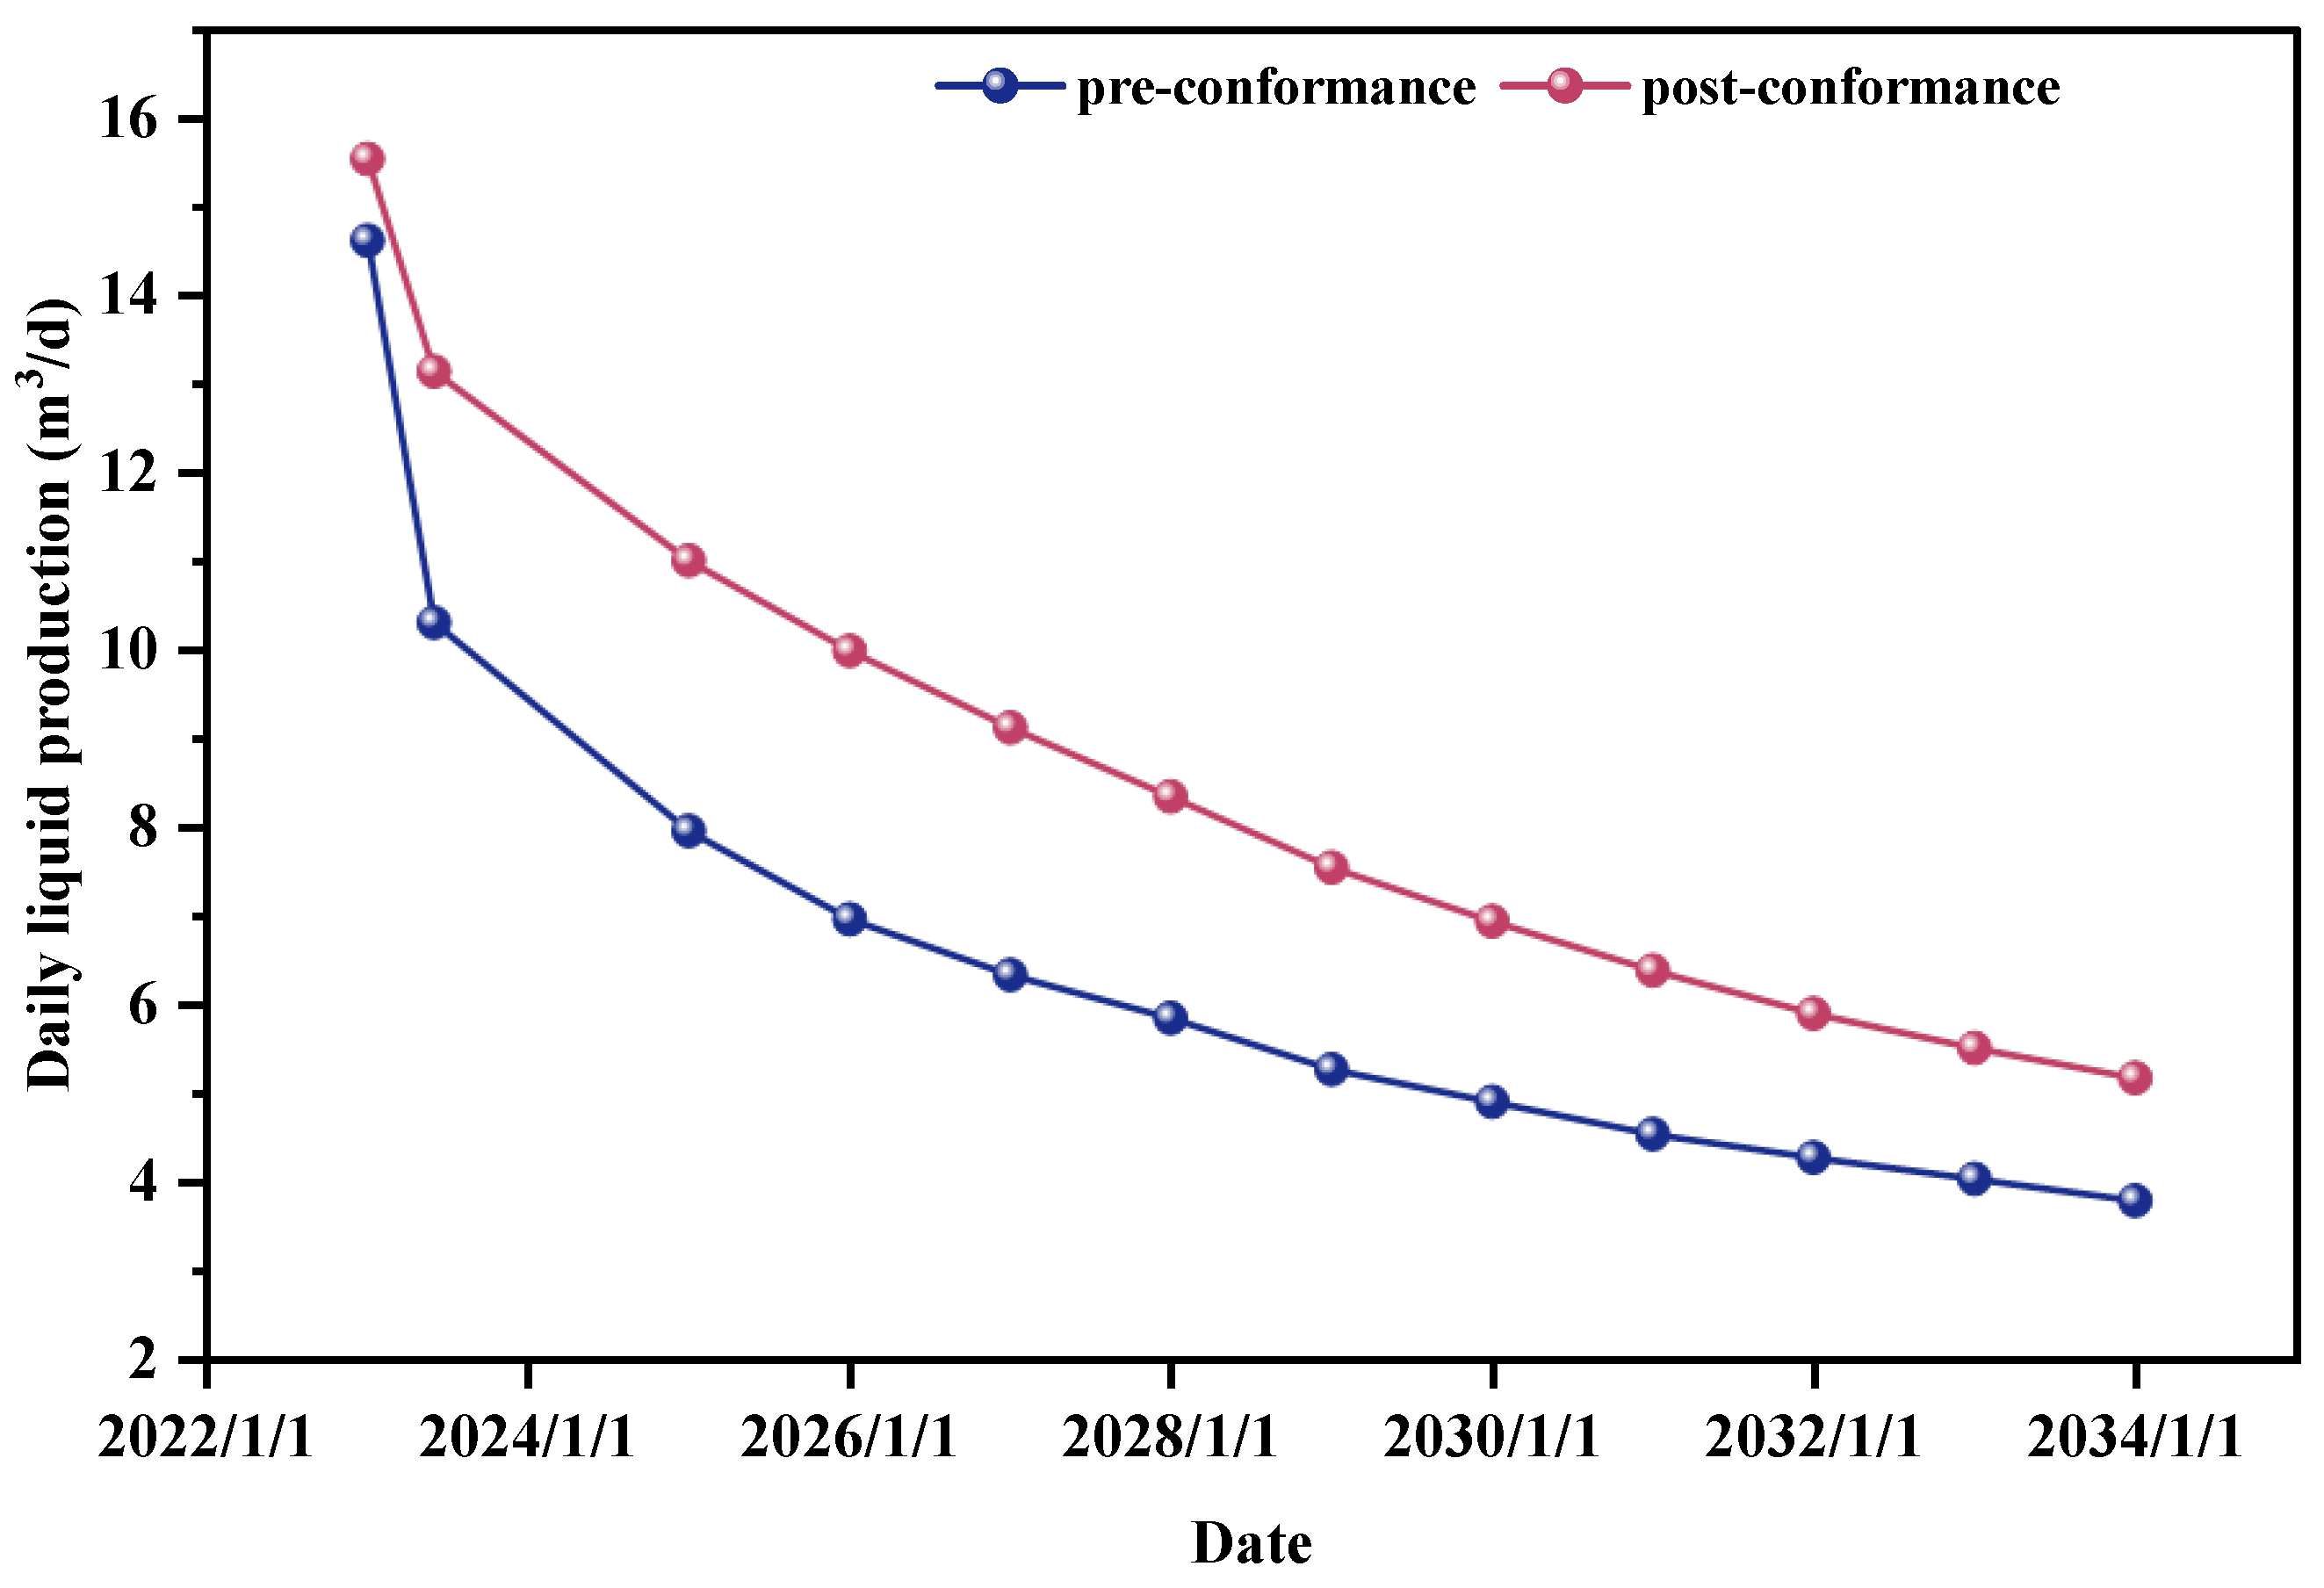
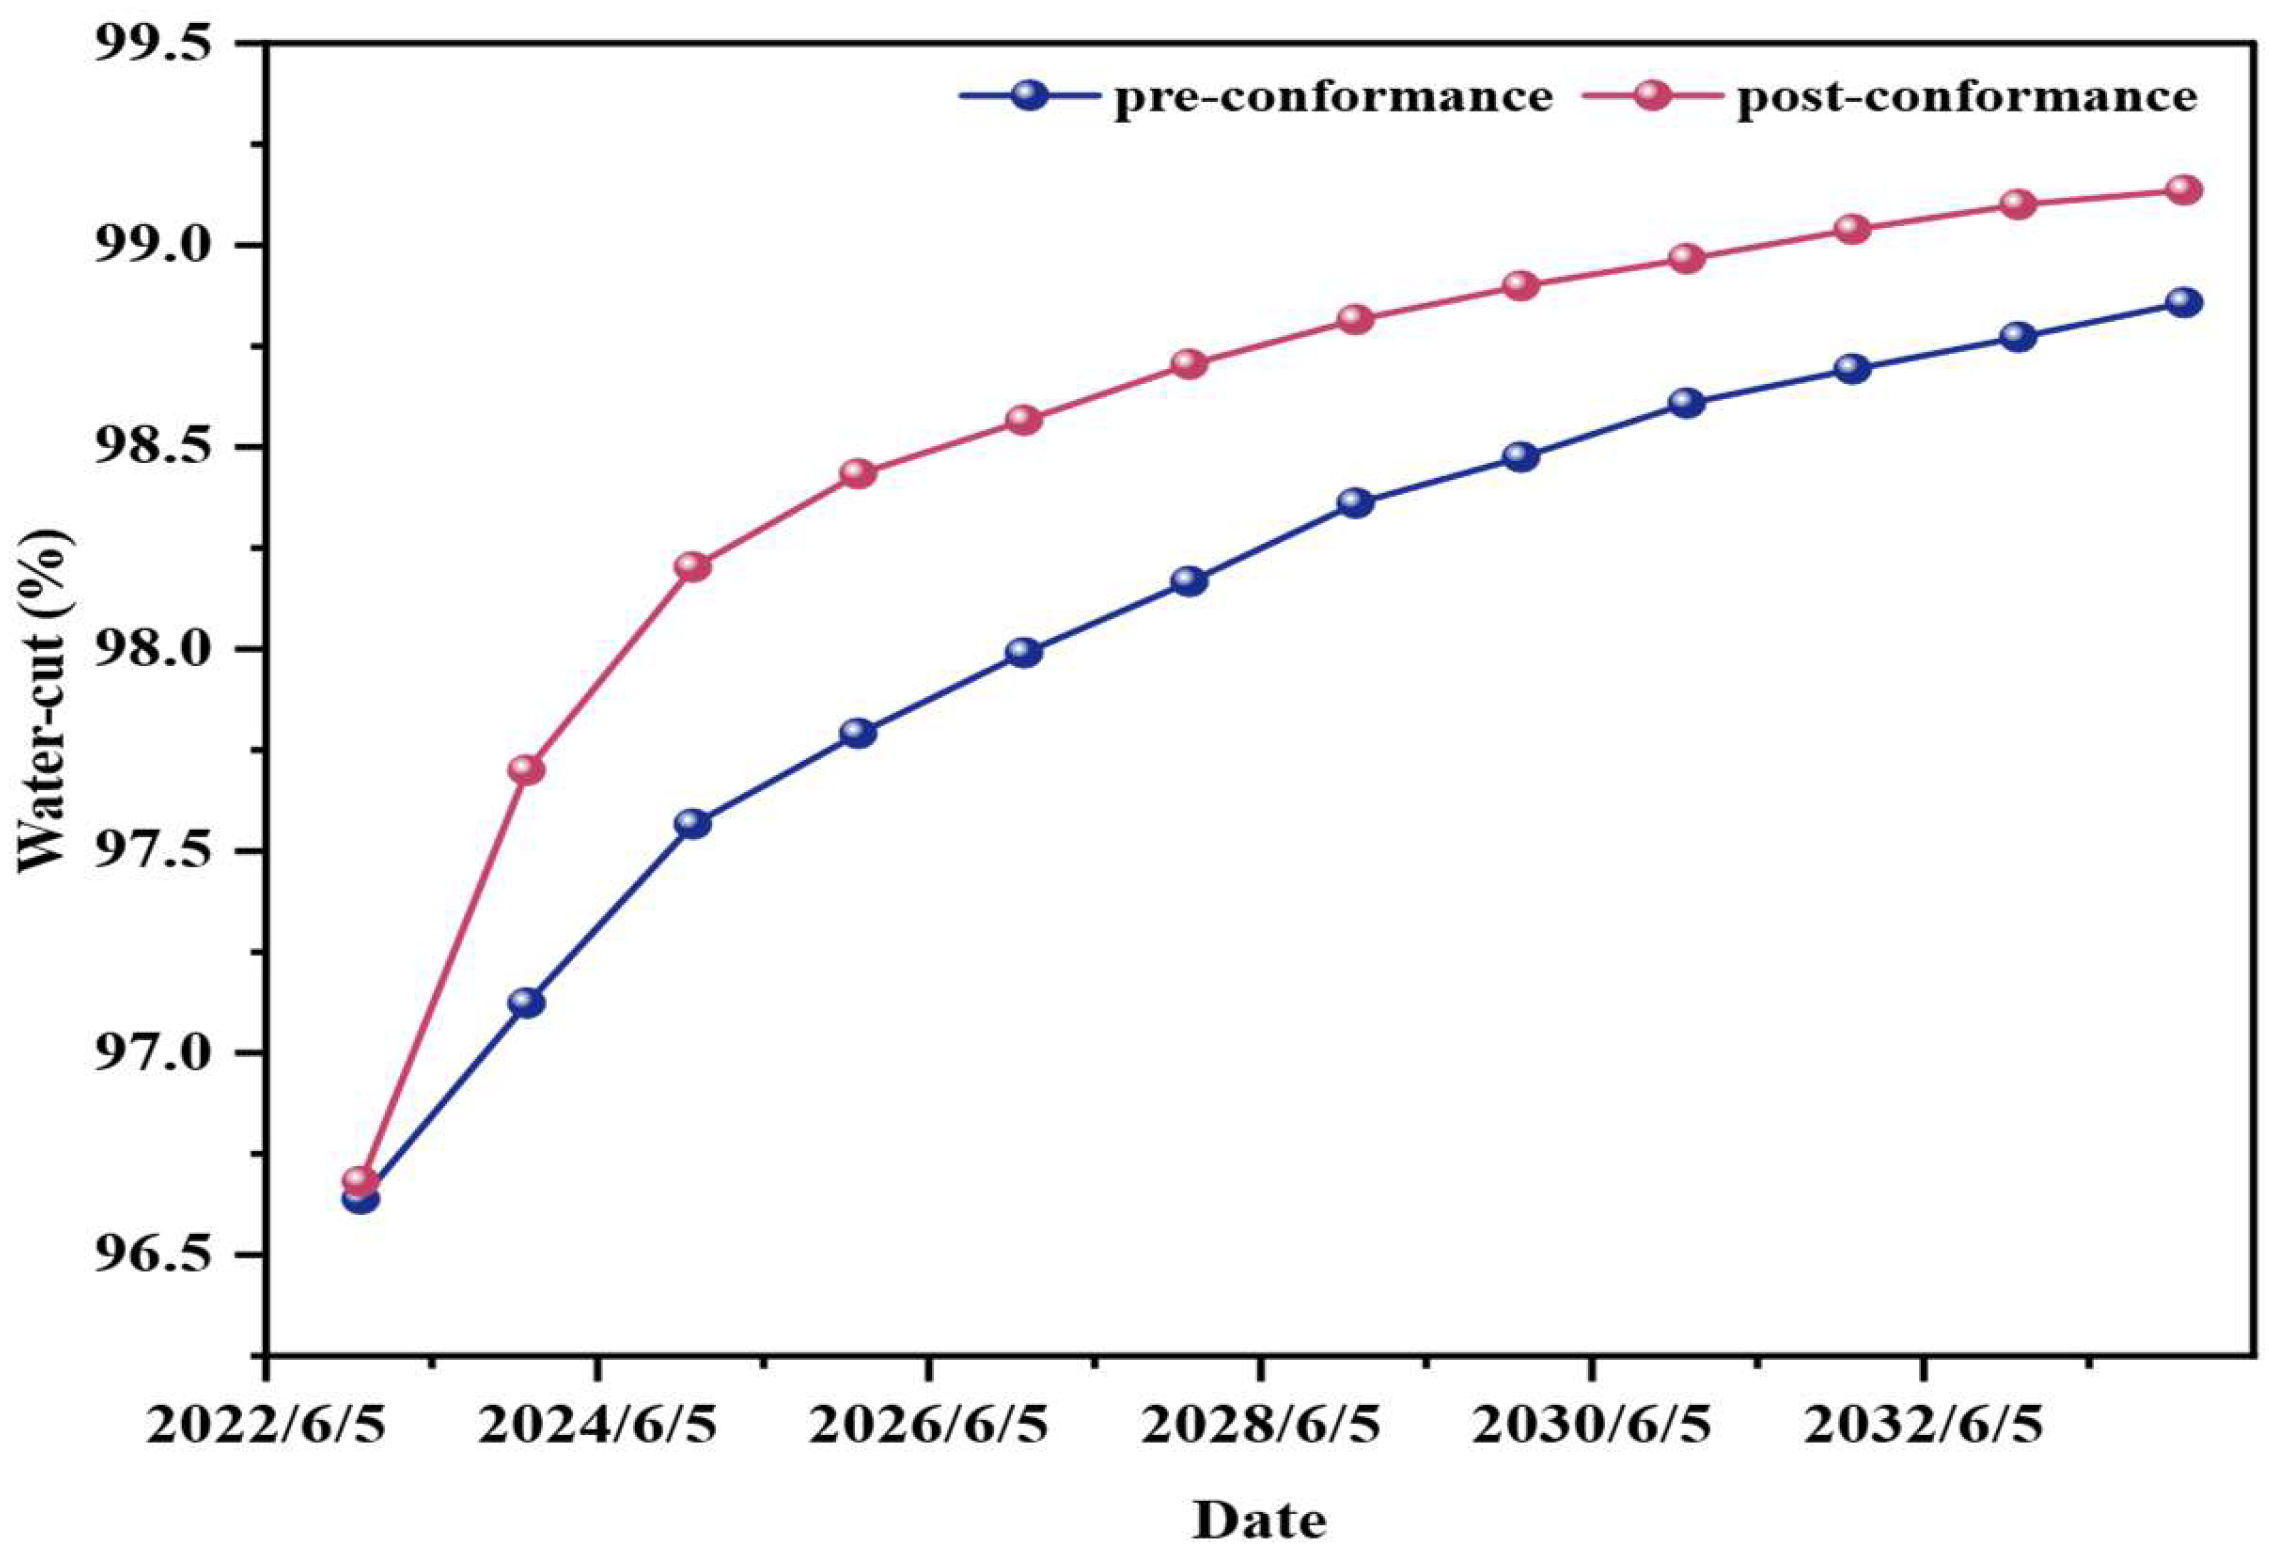
The diagnostic thresholds for conformance control were validated in the A31NM1 well group. The area exhibited a TOF of less than 50 days and a dynamic Lorenz coefficient of 0.6438 (well above the 0.5 threshold), confirming the presence of strong heterogeneity and dominant flow paths suitable for treatment (Figure 32 and Figure 33). The subsequent success of the conformance treatment in the analogous G31H1 well demonstrated the validity of these criteria. Post-treatment, the well showed a significant and sustained increase in oil production (Figure 34) and a corresponding stabilization of the water cut at a lower level (Figure 35), indicating that the treatment successfully redirected injected fluid to previously unswept oil zones.
Figure 34 and Figure 35 show G31H1 pre- and post-conformance daily oil and water cut changes. Figure 34 post-conformance significant oil rise, upward trend, sealing dominant paths diverted to low-permeability, utilizing prior unswept oil. Figure 35 post water cut decrease, stable curve, effective channeling suppression. Validates dynamic Lorenz >0.5 and TOF <50 days thresholds optimize uniformity, enhance efficiency.
A31NM1 and G31H1 via conformance achieved marked oil increase, effective water cut reduction, reflecting sealing optimized distribution. Dynamic Lorenz >0.5 and TOF <50 days thresholds engineering-validated.
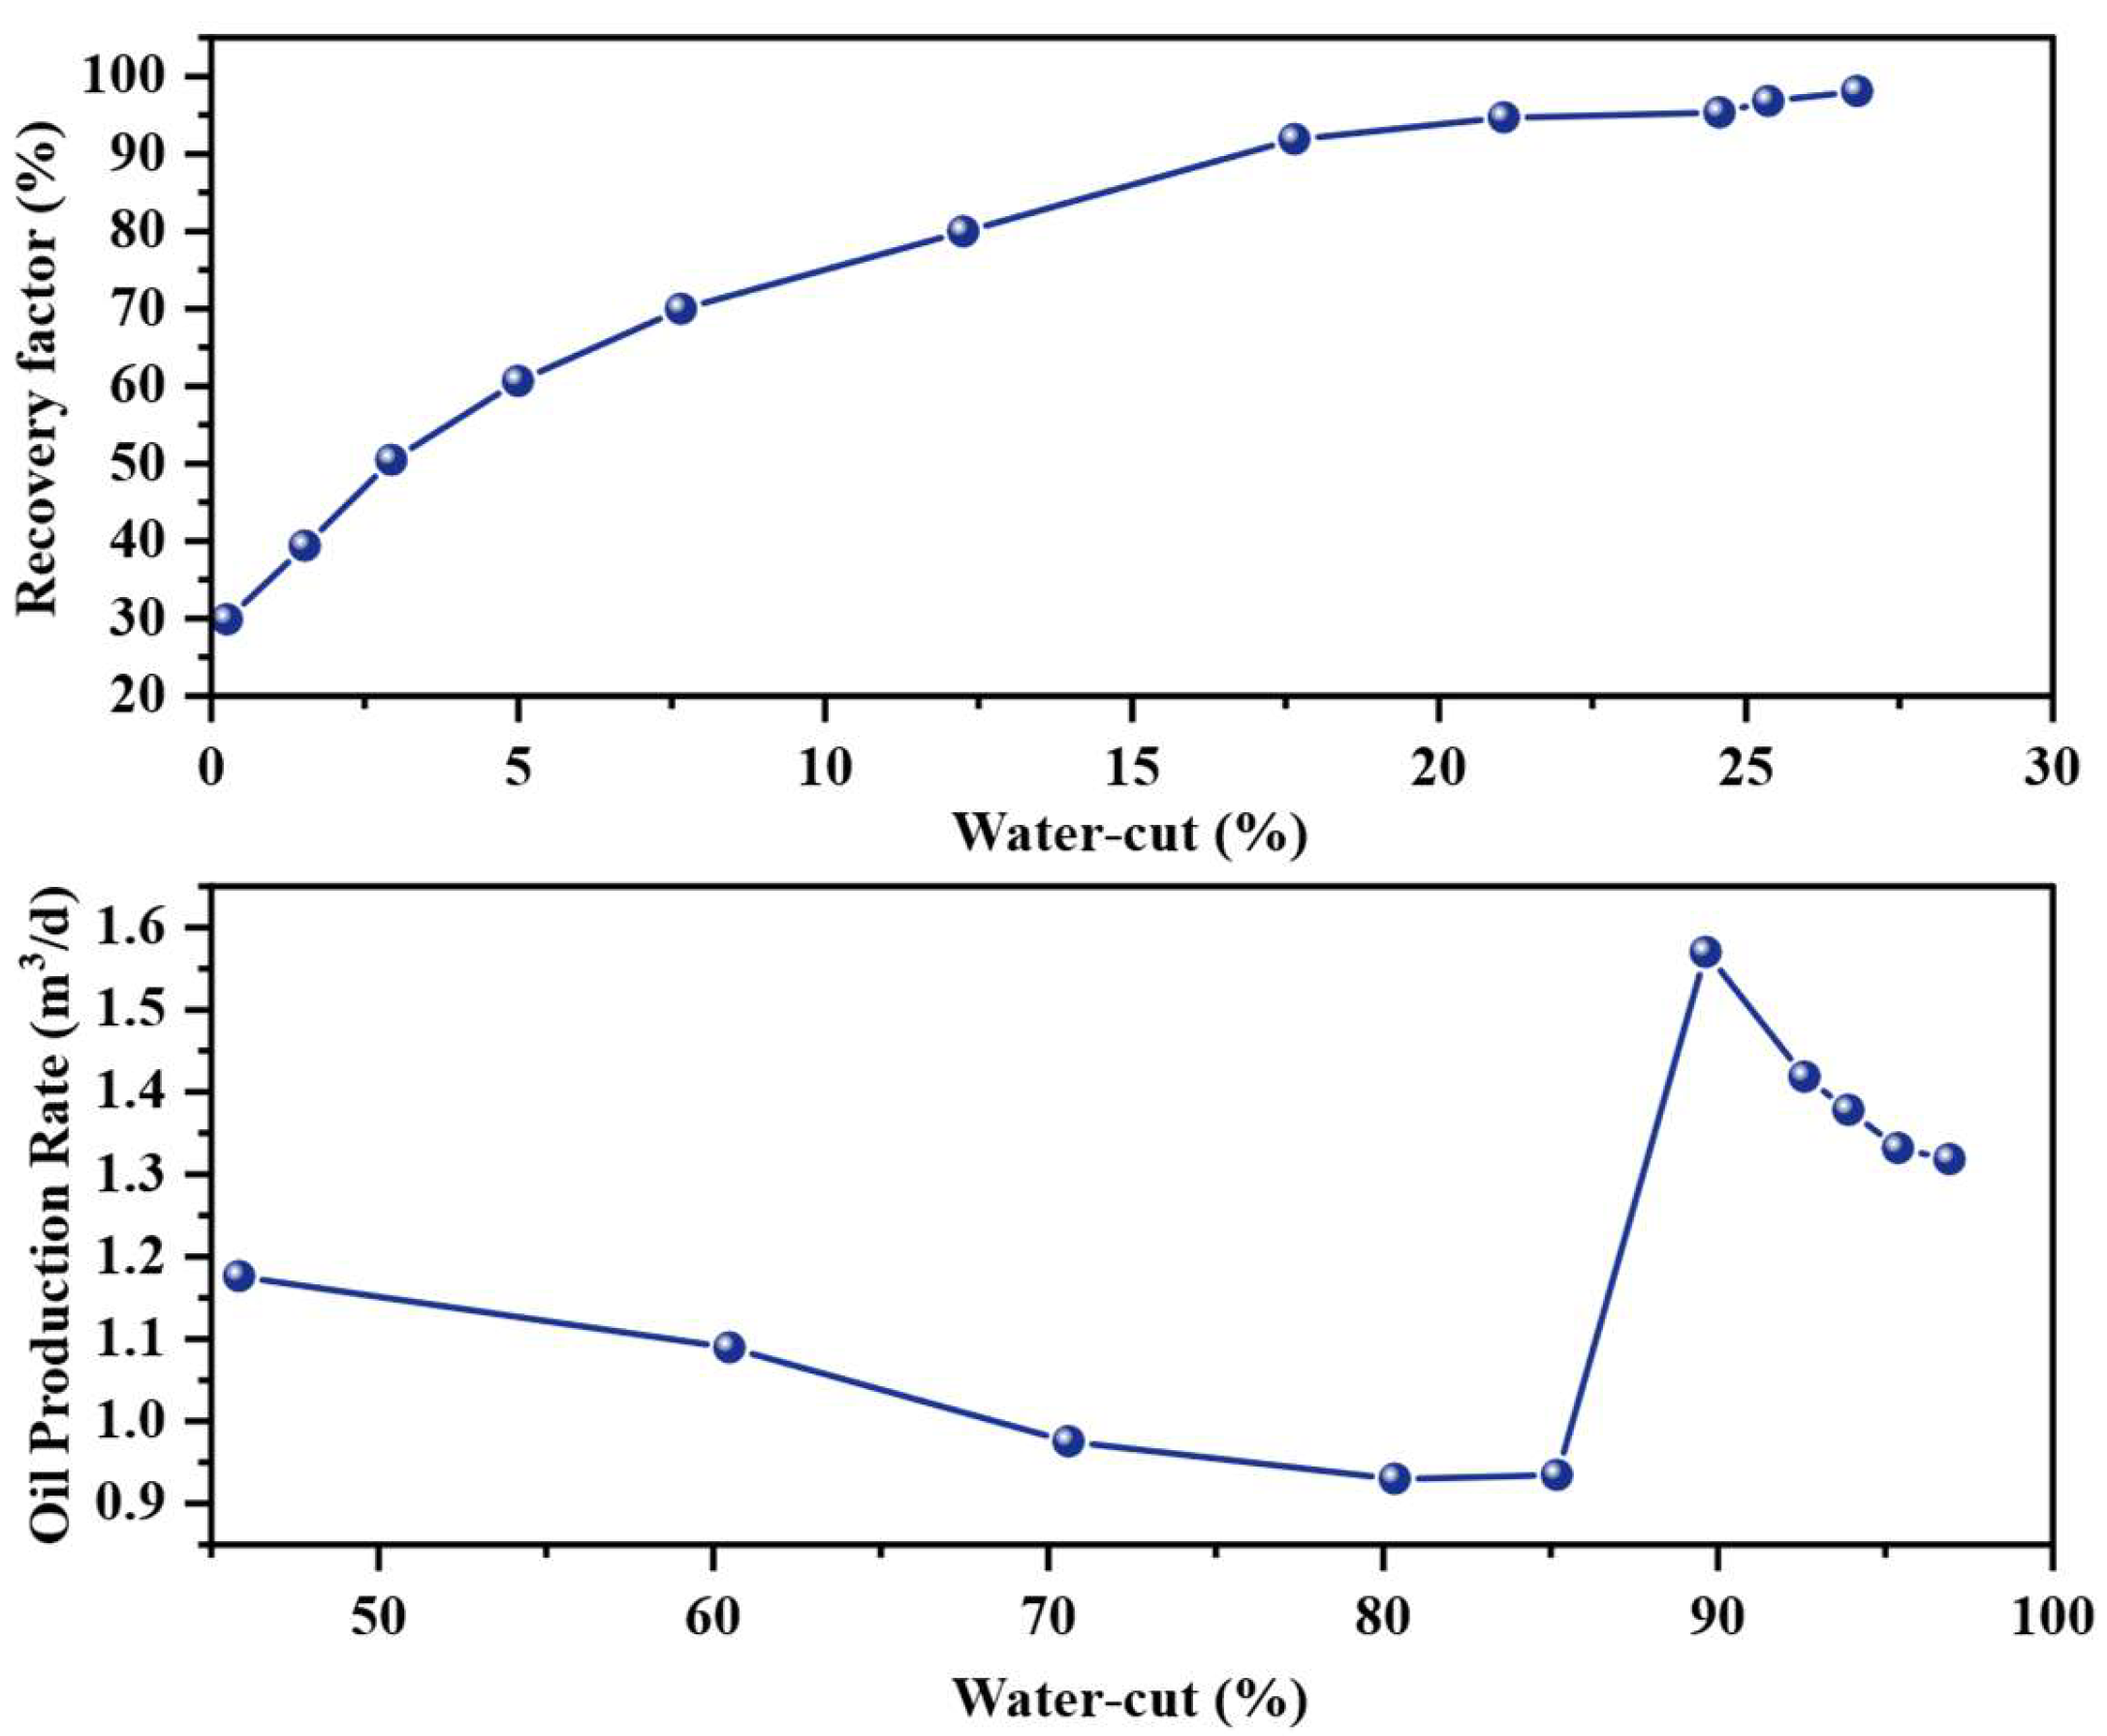
Collectively, these field results validate the diagnostic thresholds and adjustment strategies proposed in this study. The application of this methodology has enabled the successful implementation of the world’s smallest offshore infill spacing (100–150 m) and has significantly improved the field’s performance. As shown in Figure 36, the average oil production rate in the QHD oilfield increased from 0.95 m3/d to 1.6 m3/d. The ultimate recovery factor is now projected to reach 26.63%, demonstrating that stable, efficient production can be achieved and sustained even in the ultra-high water-cut stage of a complex heavy oil reservoir.
Based on QHD water injection adjustment strategies, 15 field well-time injection–production adjustments were carried out: 8 lifting, 4 conformance, and 3 shutoff, with a success rate of 93.3%. Field implementation is carried out as shown in Table 5:

4. Conclusions

This study established and applied a new flow diagnostics methodology to enhance oil recovery in the challenging QHD32-6 heavy oilfield. We developed a multi-parameter evaluation system, using time-of-flight (TOF) and the dynamic Lorenz coefficient, to precisely map the distribution of remaining oil. This system provided quantitative, data-driven thresholds to guide targeted interventions, including infill drilling and conformance control. Field results directly confirmed the method’s effectiveness, leading to significant production gains and validating its practical value.
The specific quantitative thresholds derived in this work are, however, tailored to the unique geological and fluid properties of the QHD32-6 field. Consequently, while the diagnostic framework itself is robust, applying these exact numerical criteria to other reservoirs will require field-specific recalibration. The scalability of the methodology across geologically diverse formations warrants further investigation.
In conclusion, this work delivers a validated, practical framework for the refined management of mature heavy oilfields. Its application in QHD32-6 demonstrates a targeted approach crucial for unlocking remaining oil in complex, high water-cut reservoirs. Future work will focus on adapting and testing this methodology in a wider range of fields to establish its broader utility for improving oil recovery.

Author Contributions

Conceptualization, Y.H.; Methodology, L.W.; Software, Y.G.; Validation, Y.H. and Y.G.; Formal analysis, Y.H.; Resources, S.W.; Data curation, Y.H.; Writing—original draft, Y.H.; Writing—review and editing, L.W., L.J., S.W., S.N. and Z.K.; Visualization, S.N.; Supervision, L.W., L.J. and Z.K.; Project administration, S.W. All authors have read and agreed to the published version of the manuscript.

Funding

This research was funded by the National Natural Science Foundation of China (Grant Nos. 52374051 and U24B2037), and the project “Key Technologies Research on Deep Potential Tapping in Ultra-High Water Cut Stage of Bohai Water-Drive Heavy Oil Fields” (Grant No. KJZH-2024-2204).

Data Availability Statement

The original contributions presented in this study are included in the article. Further inquiries can be directed to the corresponding author.

Conflicts of Interest

Authors Yifan He and Yishan Guo were employed by the company CNOOC (China) Co., Ltd., Tianjin Branch. The remaining authors declare that the research was conducted in the absence of any commercial or financial relationships that could be construed as a potential conflict of interest. The funder provided financial support solely and did not participate in the scientific research process (e.g., study design, data collection/analysis, manuscript preparation, or publication decisions).

References

  1. Yuan, S.; Han, H.; Wang, H.; Luo, J.; Wang, Q.; Lei, Z.; Xi, C.; Li, J. Research progress and potential of new enhanced oil recovery methods in oilfield development. Pet. Explor. Dev. 2024, 51, 963–980. [Google Scholar] [CrossRef]
  2. Feng, G.; Zhou, Y.; Yao, W.; Liu, L.; Feng, Z.; Yi, Y.; Feng, Y. Countermeasures to Decrease Water Cut and Increase Oil Recovery from High Water Cut, Narrow-Channel Reservoirs in Bohai Sea. Geofluids 2021, 2021, 6671098. [Google Scholar] [CrossRef]
  3. Temizel, C.; Canbaz, C.H.; Tran, M.; Abdelfatah, E.; Jia, B.; Putra, D.; Irani, M.; Alkouh, A. A comprehensive review heavy oil reservoirs, latest techniques, discoveries, technologies and applications in the oil and gas industry. In Proceedings of the SPE International Heavy Oil Conference and Exhibition, Kuwait City, Kuwait, 10–12 December 2018. [Google Scholar]
  4. Liu, J.; Liu, S.; Gao, P.; Zhang, Q.; Liu, Y.; Chen, X.; Zhong, L.; Lin, Y. Efficient development strategies for heavy oil reservoirs with a focus on rational utilization of water resources. Sep. Purif. Technol. 2025, 362, 131943. [Google Scholar] [CrossRef]
  5. Yu, H.; Wang, Y.; Zhang, L.; Zhang, Q.; Guo, Z.; Wang, B.; Sun, T. Remaining oil distribution characteristics in an oil reservoir with ultra-high water-cut. Energy Geosci. 2024, 5, 100116. [Google Scholar] [CrossRef]
  6. Ma, K.; Li, A.; Guo, S.; Pang, J.; Xue, Y.; Zhou, Z. Techniques for improving the water-flooding of oil fields during the high water-cut stage. Oil Gas Sci. Technol. Rev. d’IFP Energ. Nouv. 2019, 74, 69. [Google Scholar] [CrossRef]
  7. Shi, H.; Liu, Y.; Jiang, L.; Zheng, J.; Gan, L. Integrated Solutions for the Redevelopment Plan of Offshore Mature-Oilfield. In Proceedings of the International Petroleum Technology Conference, Virtual, 23 March–2 April 2021. [Google Scholar]
  8. Liu, H. Challenges and development direction for deep development of high water-cut mature oilfields. Pet. Geol. Oilfield Deve. Daqing 2024, 43, 15–24. (In Chinese) [Google Scholar]
  9. Arps, J.J. Analysis of decline curves. Trans. AIME 1945, 160, 228–247. [Google Scholar] [CrossRef]
  10. Miao, F.; Zhang, H.; Zhang, Y. New method for evaluating waterflooding effect by decline rate index. Fault-Block Oil Gas Field 2015, 22, 353–355. (In Chinese) [Google Scholar]
  11. Miguel, P.R.; Joanna, Z.; Stefano, Z.; Alejandro, S.; Eduardo, T. Fluid dynamics analysis and performance of polymer flow regulators for polymer flooding in multilayered reservoirs. J. Pet. Sci. Eng. 2022, 208, 109680. [Google Scholar] [CrossRef]
  12. Wang, Q.; Ma, X.; Bi, Y.; He, H.; Gu, X.; Liu, T.; Zhao, L. Analysis of Channeling-Path Phenomena in a Complex Fault-Block Reservoir with Low Recovery Factor and High Water-Cut Ratio. Fluid Dyn. Amp; Mater. Process. 2022, 19, 361–377. [Google Scholar]
  13. Zhao, P.; He, S.; Cai, M.; Tao, Z.; Zhao, M.; Wu, X.; Ni, T.; Guo, Q.; Wei, P.; Wang, Q.; et al. Streamline simulation based vector flow field characterization and reconstruction method for high water cut reservoir. In Proceedings of the International Petroleum Technology Conference, Shanghai, China, 26–28 August 2020. [Google Scholar]
  14. Guan, C.; Zhang, J.; Li, X. Quantitative Research on Development Status of Heterogeneous Reservoirs in Offshore Oilfields. In Proceedings of the International Petroleum Technology Conference, Riyadh, Saudi Arabia, 21–23 February 2022. [Google Scholar]
  15. Li, L.; Yuan, X.; Dai, D.; Yan, C.; Ping, F.; Wang, W. Evaluation of Water Injection Development Effect in Block B of the Bohai Sea. Chem. Eng. Manag. 2024, 7, 152–156. (In Chinese) [Google Scholar]
  16. Ning, L.; Yang, L.; Zheng, X.; Zhang, J.; Liu, Y.; Ma, J. Evaluation on injection-production connectivity of low-permeability reservoirs based on tracer monitoring and numerical simulation. Xinjiang Pet. Geol. 2021, 42, 735. [Google Scholar]
  17. Kulkarni, K.N.; Datta-Gupta, A.; Vasco, D. A Streamline Approach for Integrating Transient Pressure Data into High-Resolution Reservoir Models. SPE J. 2001, 6, 273–282. [Google Scholar] [CrossRef]
  18. Wen, H.; Sun, N.; Liu, Y. Index system evaluating water flooding development effect of oilfield at ultra-high water cut stage. J. Pet. Explor. Prod. Technol. 2017, 7, 111–123. [Google Scholar] [CrossRef]
  19. Chu, Q.; Chen, X.; Shi, P. Developed effects analyses and quantitative evaluating method for QinJiaTun Complex fault-block oilfield. Pet. Geol. Oilfield Dev. Daqing 2016, 35, 58–63. (In Chinese) [Google Scholar]
  20. Li, Z.; Guo, Q.; Zhuang, T.; He, S. Evaluation method of producer development effect in high water-cut reservoirs. Pet. Geol. Recovery Effic. 2022, 29, 85–93. (In Chinese) [Google Scholar]
  21. Wang, C.; Sun, Z.; Sun, Q.; Zhang, L.; Zhang, X. Comprehensive evaluation of waterflooding front in low-permeability reservoir. Energy Sci. Eng. 2021, 9, 1394–1408. [Google Scholar] [CrossRef]
  22. Shahvali, M.; Mallison, B.; Wei, K.; Gross, H. An Alternative to Streamlines for Flow Diagnostics on Structured and Unstructured Grids. SPE J. 2012, 17.3, 768–778. [Google Scholar] [CrossRef]
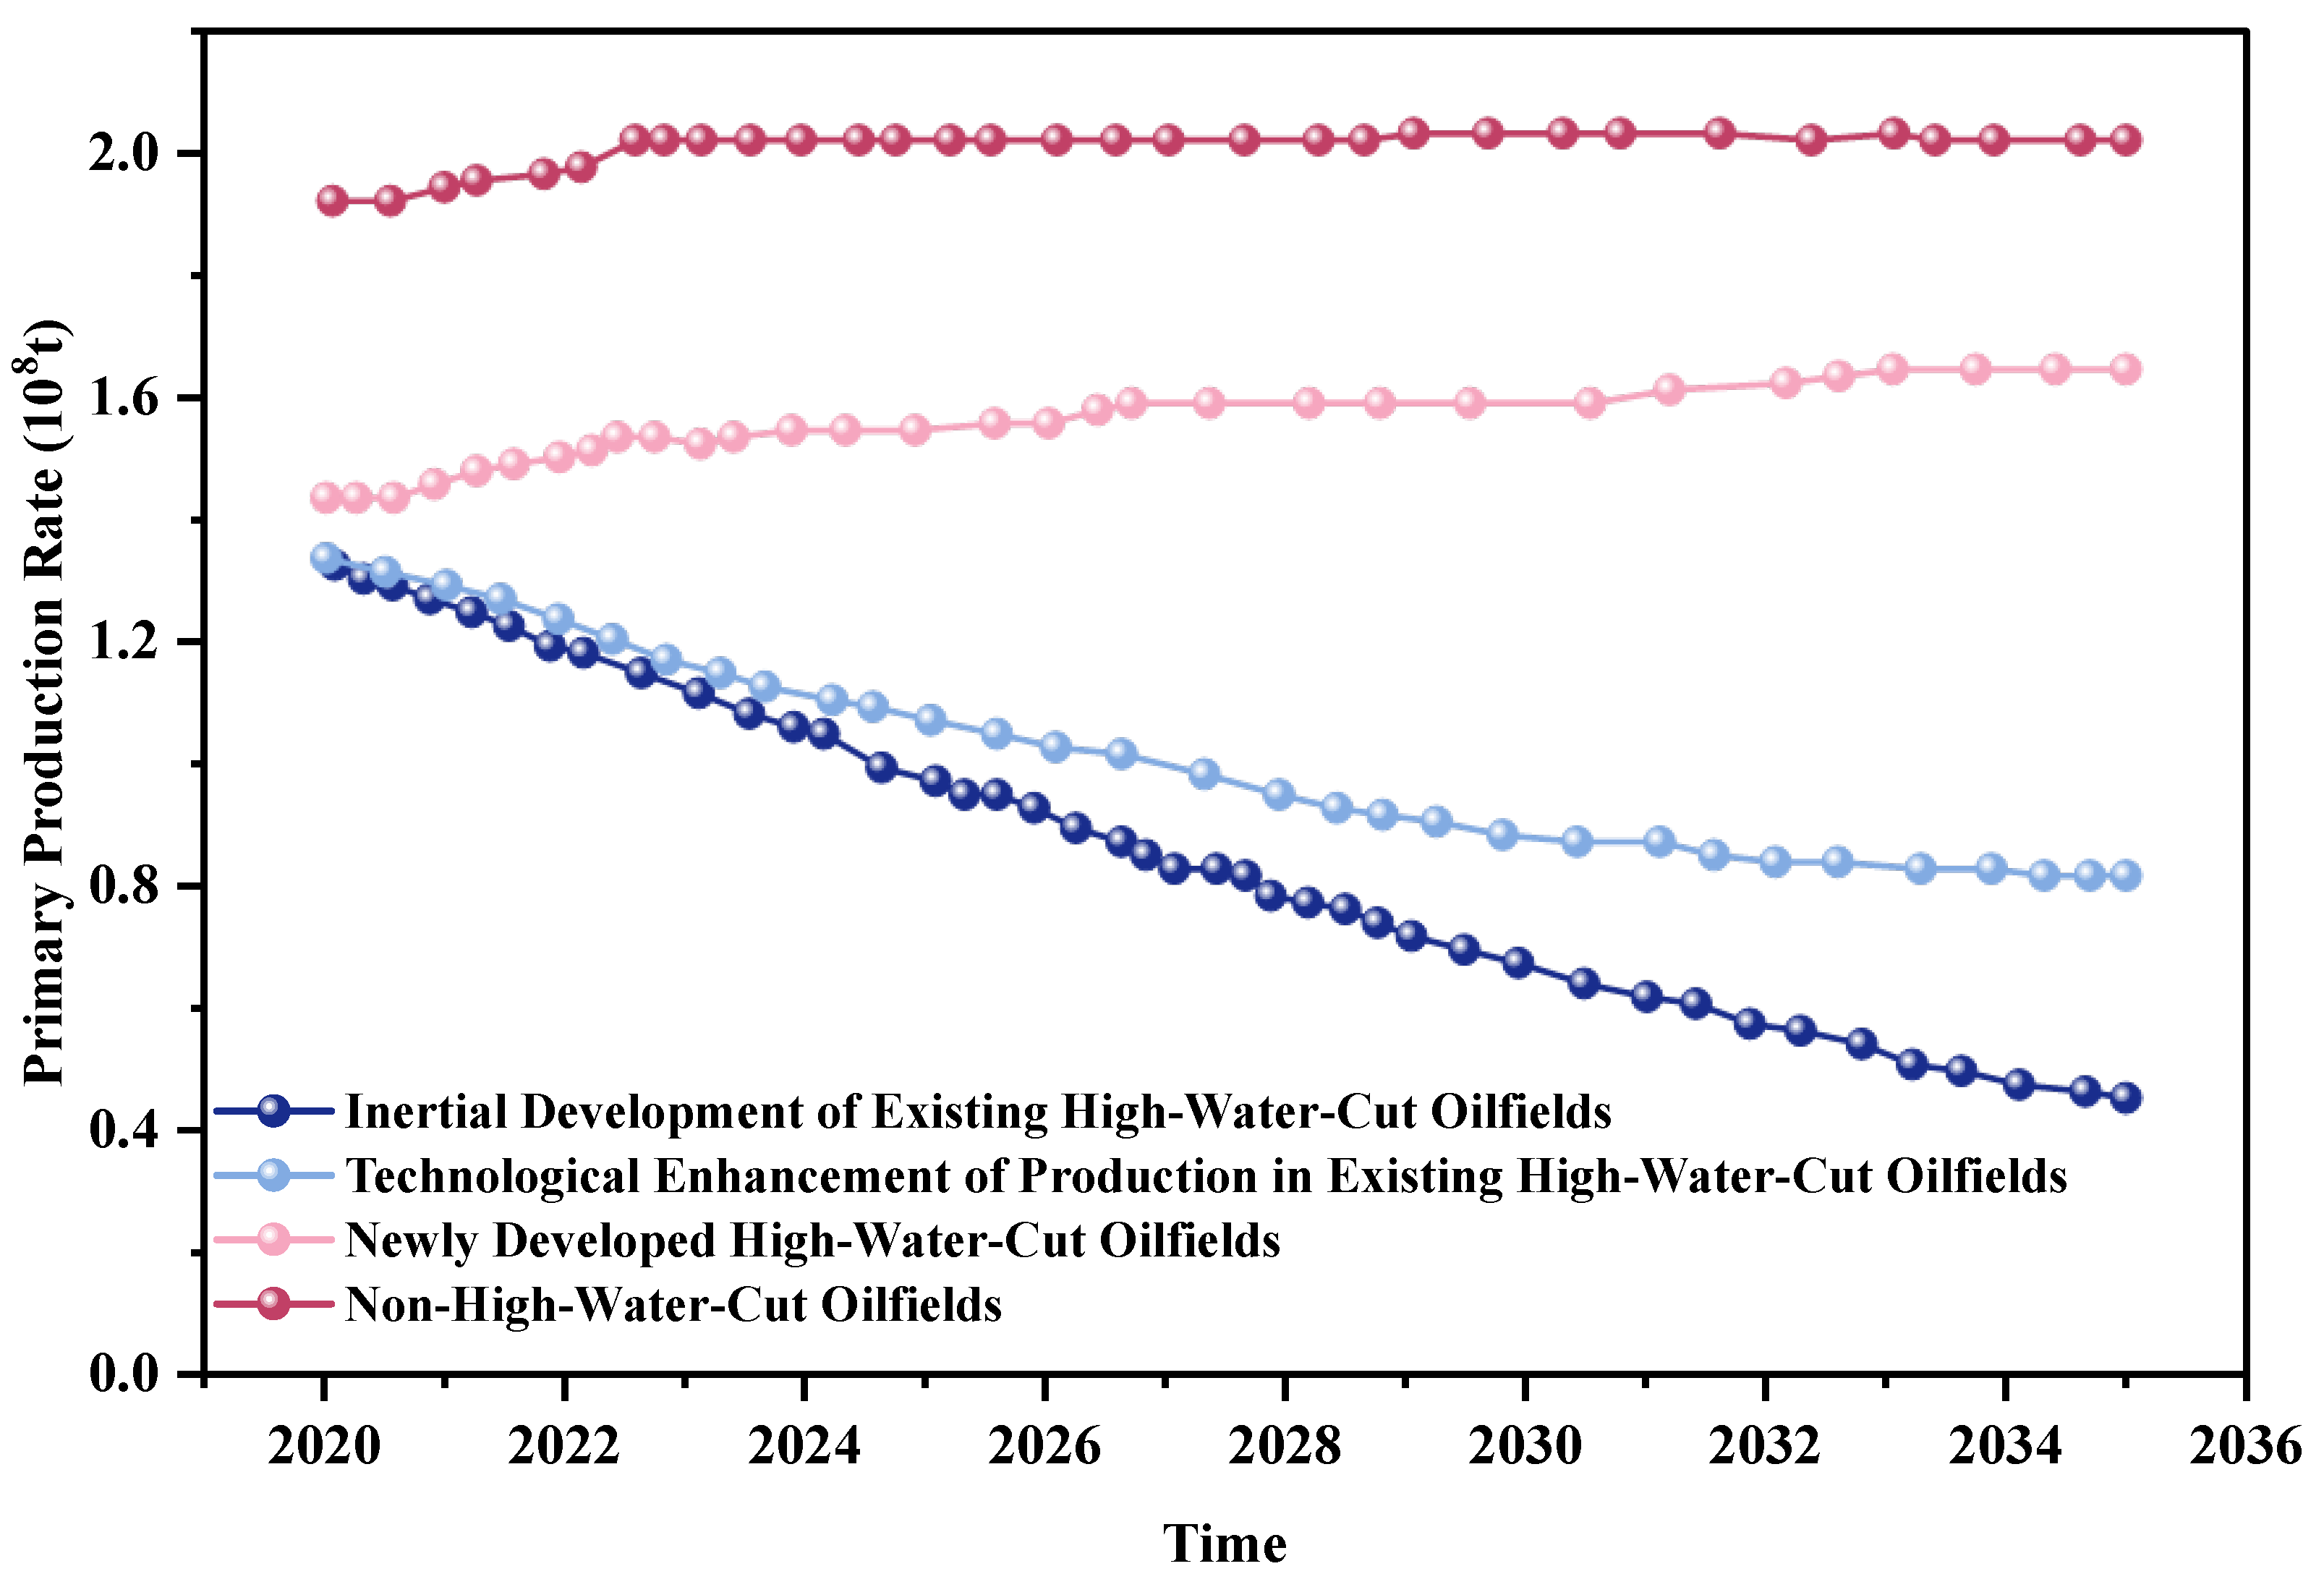
Figure 1. Predicted production composition of high water-cut oilfields in China [8].
Energies 18 05310 g001
Figure 2. Research workflow diagram.
Energies 18 05310 g002
Figure 3. Typical F-Φ curves.
Energies 18 05310 g003
Figure 4. Evaluation system based on flow diagnostics. (a) Dynamic Indicator Evaluation System; (b) Static Indicator Evaluation System.
Energies 18 05310 g004
Figure 5. Adjustment strategies for different levels of channeling paths.
Energies 18 05310 g005
Figure 6. Regional location map.
Energies 18 05310 g006
Figure 7. Waterflooding direction and intensity in B14 well group.
Energies 18 05310 g007
Figure 8. Dynamic heterogeneity in B14 well group before conformance control.
Energies 18 05310 g008
Figure 9. Cumulative production comparison of two infill wells.
Energies 18 05310 g009
Figure 10. Time-of-Flight Distribution Map Around Wells in Layers 1–3 of the Southern Block.
Energies 18 05310 g010
Figure 11. Oil Saturation Distribution Map Around Wells in Layers 1–3 of the Southern Block.
Energies 18 05310 g011
Figure 12. Southern block time-of-flight map.
Energies 18 05310 g012
Figure 13. Correlation between cumulative oil and waterflooded ratio.
Energies 18 05310 g013
Figure 14. Correlation between cumulative oil and remaining oil thickness.
Energies 18 05310 g014
Figure 15. Correlation between cumulative oil and time of flight.
Energies 18 05310 g015
Figure 16. Southern block layers 1–3 initial well positions pre- and post-infill time of flight.
Energies 18 05310 g016
Figure 17. Southern block layers 1~3 well positions pre- and post-infill oil saturation distribution.
Energies 18 05310 g017
Figure 18. Lorenz coefficients for different wells.
Energies 18 05310 g018
Figure 19. Lorenz Coefficient and Oil Saturation Distribution Map for the D08 Well Group.
Energies 18 05310 g019
Figure 20. Lorenz Coefficient and Oil Saturation Distribution Map for the C03 Well Group.
Energies 18 05310 g020
Figure 21. Southern block layers 1–3 pre-infill flow diagnostics results.
Energies 18 05310 g021
Figure 22. Waterflooded Thickness Map for Layers 1–3 of the Southern Block.
Energies 18 05310 g022
Figure 23. Oil Layer Thickness Map for Layers 1–3 of the Southern Block.
Energies 18 05310 g023
Figure 24. Near-well remaining oil.
Energies 18 05310 g024
Figure 25. Near-well permeability.
Energies 18 05310 g025
Figure 26. Dynamic Lorenz Coefficient Map.
Energies 18 05310 g026
Figure 27. Remaining oil profile.
Energies 18 05310 g027
Figure 28. Time-of-Flight Distribution Map of Well F21 and Its Surrounding Wells.
Energies 18 05310 g028
Figure 29. Block measure adjustment suggestions.
Energies 18 05310 g029
Figure 30. Waterflooded Ratio Map.
Energies 18 05310 g030
Figure 31. Time-of-Flight Distribution Map.
Energies 18 05310 g031
Figure 32. A31NM1 well group Lorenz coefficient map.
Energies 18 05310 g032
Figure 33. A31NM1 well group time-of-flight map.
Energies 18 05310 g033
Figure 34. G31H1 pre- and post-conformance daily liquid production.
Energies 18 05310 g034
Figure 35. G31H1 pre- and post-conformance daily water cut.
Energies 18 05310 g035
Figure 36. QHD water cut, oil production rate, and recovery degree effects.
Energies 18 05310 g036
Table 1. Comparison of three evaluation methods.
MethodEvaluation ParametersFeaturesAdvantagesApplication
Traditional Reservoir EngineeringWaterflood Characteristic Curves, Production Decline CurvesTraditional curve-fitting methods are computationally efficient but possess low diagnostic accuracy, with their application being constrained by empirical assumptions.Wide applicability; relies on empirical and engineering judgment.Daqing Oilfield, Qinjiatun Oilfield Bohai Oilfield
[18,19,20]
Reservoir Numerical SimulationSaturation, Streamlines, Flow Velocity, etc.Reservoir numerical simulation is computationally intensive and time-consuming, making it difficult to satisfy real-time diagnostic needs. However, it excels at meticulously characterizing the internal physical dynamics and remaining oil distribution within the reservoir, though its application scale is generally restricted to localized studies.High accuracy; capable of evaluating multi-parameter changes during the waterflooding process; offers 3D visualization.Gangxi Oilfield, Jilin Oilfield
[21]
Flow Diagnostics (The proposed method)TOF, Dynamic Lorenz Coefficient, Streamlines, Oil Saturation, Pressure Field, Waterflood Characteristic Curve, Production Decline CurveThe flow diagnostics method is computationally efficient, provides targeted diagnostics, and its application is both flexible and scalable.Rapid evaluation of waterflood performance for different well groups at various times. Facilitates the screening of candidate interventions and remedial actions.QHD Oilfield
Table 2. Key Equations in Flow Diagnostics: Functional Objectives and Intuitive Explanations.
Brief DescriptionFunctional ObjectiveRole in Decision-Making in Reservoir Development
Continuity equation for single-phase flowEnsures mass conservation in steady-state incompressible flow, deriving baseline velocity fields.Supports initial sweep efficiency evaluation for well pattern screening
Multiphase pressure equationSolves pressure and velocity in oil–water systems, accounting for mobility contrasts from relative permeability.Identifies flow paths; aids conformance control (TOF < 50 days).
Time-of-flight (TOF) along streamlineComputes particle travel time based on interstitial velocity and streamline distance.Quantifies intensity; flags unswept areas for infill (TOF > 200 days).
Differentiated TOF equationDerives partial differential form for direct numerical solution without streamline tracing.Accelerates tortuosity assessment for flow field planning.
Forward TOF equationMeasures transit time from nearest injector to grid block along streamline.Defines sweep volume; guides modification for channeling.
Backward TOF equationMeasures transit time from grid block to nearest producer.Defines drainage; supports lift optimization (TOF > 200 days).
Tracer concentration equationModels advective transport of tracers along velocity fields, neglecting diffusion.Tracks allocation; quantifies heterogeneity for oil targeting.
Steady-state tracer equationSolves equilibrium concentration distribution from injectors.Maps swept regions; informs connectivity adjustments.
Injector tracer equationComputes concentration gradients from specific injectors.Quantifies control volumes; balances injection allocation.
Producer tracer equationComputes concentration gradients to specific producers.Quantifies drainage; enables communication volume for shutoff.
Table 3. Conformance control and displacement adjustment results for tracer well numbers.
Intervention Well NumberTreatment Well NumberDistance to Water Well (m)Treatment Duration (d)Treatment Rate (m/d)TOFMaximum Lorenz CoefficientAverage Lorenz CoefficientLorenz Coefficient Surge Factor
D08Well Group
(NmI3Segment)
/2020.9.2
D074371043.78140.66210.621.068
D13311625.0258
D27M346665.2478
D28H257416.2630
C04352.11053.35139
C03Well Group
(NmISegment)
/2019.7.18
H03H4003212.5320.66920.710.943
C02370389.733
H19H250475.354
B26HS270377.326
Table 4. Statistics on producer liquid lifting measures.
Production WellWater Zone Thickness (m)Remaining Oil Zone Thickness (m)Reservoir Thickness Ratio (%)Pre-Intervention Production Rate (m3)Pre-Intervention Water Cut (%)Post-Intervention Production Rate (m3)Post-Intervention Water Cut
(%)
TOF
A012086.962090958375264
A056375.901493459331273
A104366.152094409520273
B097889.662095509530322
B157691.572376408317304
B23H1083.333671757039350
G29H20100.001556456830270
G34H872.732295389516292
C015566.2721.88952.79230.8275
C243775.517.68827.09419.4261
C304171.939.89130.79221.0214
D075776.0049.38677.58728.2329
D28H350.0029.770124.47894.7253
H02H3100.0014.49639.69425.2287
H03H12100.0047.67070.08422.4323
H04H10100.0022.19544.89622.6343
H09H7100.009.69427.39517.7211
H10H7100.0026.47554.68128.2283
H11H14100.0018.19442.29424.0268
H17H5100.0030.17653.88423.7240
I09H866.6727.483110.97783.5343
I09H11881.8220.39738.59718.2237
I28H1359.0921.88642.48920.6247
I33H1466.6724.29558.99234.7277
I36H466.6725.28656.08930.8252
B26HS450.0012.39330.79518.4257
Table 5. Field adjustment measure implementation table.
Intervention RecommendationsImplementation Well GroupImplementation TimeImplementation Effectiveness
Monthly Incremental Oil Production (10,000 m3)Cumulative Incremental Oil Production (up to October 2024)
Liquid LiftingG34H22 January 20240.00.0153
G44H2024 August 220.06060.1324
G46H27 August 20240.04090.0741
G37H19 September 20240.01640.0164
G47H13 August 20240.01920.1088
D1328 May 20240.02280.1175
I16H17 March 20240.00320.0119
D28H3 June 20240.03980.2757
Profile Modification and DisplacementC0320 August 20240.11040.6973
C0522 August 20240.07370.5523
C0620 August 20240.11610.7248
C2920 August 20240.11000.6993
Water ShutoffB171 March 20240.0120.0956
B217 March 20240.00940.0412
I18H30 March 20240.00320.0119
Disclaimer/Publisher’s Note: The statements, opinions and data contained in all publications are solely those of the individual author(s) and contributor(s) and not of MDPI and/or the editor(s). MDPI and/or the editor(s) disclaim responsibility for any injury to people or property resulting from any ideas, methods, instructions or products referred to in the content.