1. Introduction
The total installed capacity of wind energy worldwide has grown significantly, underscoring its vital role in the global energy mix. The Global Wind Report 2024 highlights the importance of wind power in meeting the goal set at the 28th Conference of the Parties (COP28) to triple renewable energy by 2030 [
1]. Advances in wind energy rely on larger wind turbines with longer blades, taller hubs, and wider rotor diameters, which improve the efficiency of power harvesting at both onshore and offshore sites [
2]. However, larger blades bring challenges to the structural integrity, due to greater mass and elastic deformations. Made from lightweight high-stiffness materials like fiberglass, these blades show geometric nonlinearity, requiring sophisticated engineering to maintain reliability under operational loads [
3]. Analyzing the aerodynamic responses, loads, and fatigue damage remains essential for optimizing turbine performance.
The implementation of yaw offset, a technique used to intentionally deflect the wake away from downstream wind turbines, is one of the most promising methods for maximizing the power harvesting capacity of a wind farm [
4,
5]. However, the yaw offset increases the fatigue damage to wind turbine components [
6,
7]. Modern large wind turbine blades, made as thin-walled shells from composite materials, endure complex forces, including aerodynamic loads, which are strongest in the flapwise direction toward the tip, and gravity-induced loads, driven by material density, in the edgewise direction, decreasing outward. The cross-sectional properties and stiffness of the blades are vital for structural dynamics and aeroelastic analysis, yet their composite nature and intricate geometries pose challenges in selecting efficient accurate numerical models to capture coupled effects [
7,
8,
9]. Analysis methods range from advanced three-dimensional (3D) finite-element techniques [
10] with shell-element laminate theory praised for precise stress and displacement results to simpler two-dimensional (2D) lamination theory. While 3D methods excel, they do not directly yield cross-sectional data for broader assessments, unlike shell-based 3D structural models [
11]. One-dimensional (1D) beam models deliver a practical balance of accuracy and computational efficiency for blade analysis [
12], rendering them a preferred choice.
Within the OpenFAST-v3.5.4 framework [
13], the ElastoDyn module employs a simplified Euler–Bernoulli beam [
14] approach to model the blade as a flexible cantilever beam with continuously distributed mass and stiffness. This beam model effectively captures the behavior of flexure-dominated blades, assuming a straight isotropic structure without accounting for cross-sectional couplings or shear effects. However, its applicability is constrained when analyzing significant torsional deformations or bend–twist coupling phenomena [
14,
15,
16,
17]. In contrast, the BeamDyn module [
18] leverages GEBT, first proposed by Reissner (1973) [
19], accommodating full geometric nonlinearity and large deformations. The state–space formulation of this theory has been integrated into BeamDyn [
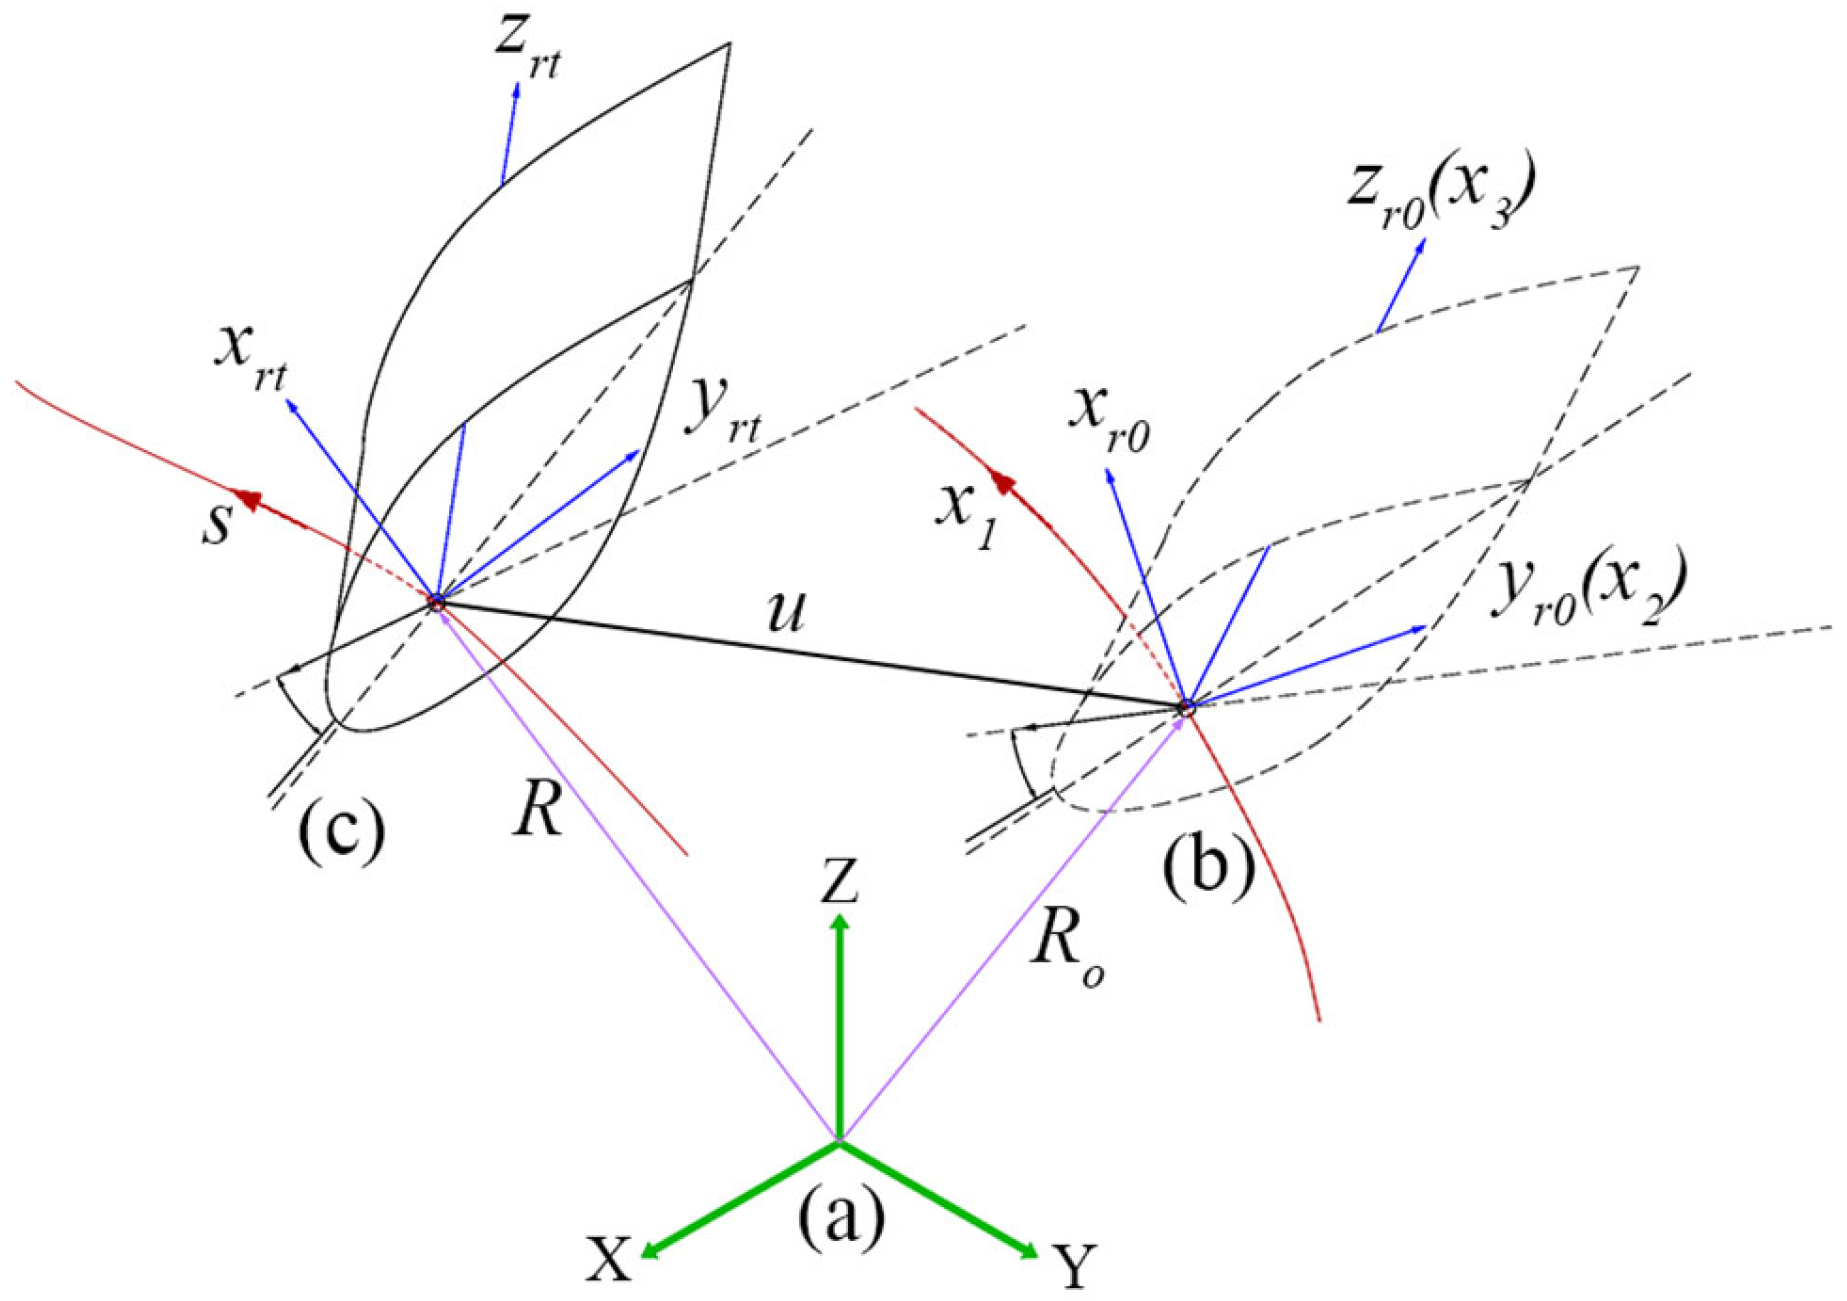
20], which is designed to interface distinct instances of BeamDyn with OpenFAST for each blade. Structurally, this integration into OpenFAST entails transferring the root motions (translations and rotations) of each blade from the ElastoDyn module to BeamDyn, while reciprocally conveying root loads (forces and moments) from BeamDyn to ElastoDyn. Aerodynamically, the coupling involves transmitting nodal motions (translations and rotations) along each blade from BeamDyn to AeroDyn module, with aerodynamic loads distributed along the blade returned from AeroDyn to BeamDyn [
21]. The integration of these solvers enables the simulation of a complete wind turbine system, accurately capturing the large deformations and torsional effects of large composite wind turbine blades.
Analyzing wind turbine blades demands advanced tools like BeamDyn to tackle the geometric nonlinearity, with foundational work by Bauchau et al. (2011) [
3] introducing a nonlinear composite beam model that handles large displacements, rotations, and elastic couplings in curved twisted blades under small strains. Wang et al. (2014b) introduced a nonlinear aeroelastic model integrating BEM theory with GEBT to analyze large deflection cantilever beams. The model effectively captured geometric nonlinearity due to significant blade deflections, showing good agreement with experimental data [
9]. For small deflections, the nonlinear model produced results consistent with linear aeroelastic codes, suggesting that geometric nonlinearity can be neglected in such cases. Accounting for geometric nonlinearity in large deflection scenarios significantly reduced the tip deflection [
22]. Pai (2011) [
23] studied GEBT that uses a variable without rotation and revealed that the rotation angles used for geometrically nonlinear can be spatially discontinuous. The author suggested GEBT that fully accounts for geometric nonlinearity, initial curvature exact coordinate transformation, and orthogonal virtual rotation. McDonnell and Ning (2024) [
24] implemented GEBT to optimize a cantilever beam with large tip displacement, computing bending moments to match the analytical results. They also analyzed a wind turbine blade under sinusoidal tip load, with the GEBT results aligning with the analytical and experimental data. Later, they enhanced the accuracy with a nonlinear Timoshenko beam theory using mechanics-based variables and quadrature elements, while [
25] merged GEBT with blade element momentum methods, revealing how the wind shear boosts the flap deflection, tower shadow spikes thrust, and yawed inflow cuts to power.
An aeroelastic framework [
26] uses nonlinear beam models to capture large deformations from aerodynamic and rotational loads, including centrifugal and Coriolis effects across flapwise, edgewise, and torsional motions. Hansen et al. (2006) [
27] simplified 3D structures into 1D beams for bending, torsion, and tension, refining predictions with second-order strain FEM models, while Chen et al. (2010) [
28] benchmarked tools like variational asymptotic beam sectional analysis (VABS (precise)) and pre-processor for computing composite blade properties (PreComp (simpler)) for composite blade sections, favoring VABS for complexity. Blade aerodynamics heavily stress the LSS, critical in three-point mount designs, where Ishihara et al. (2025) [
29] validated a 3D elastic drivetrain model exposing LSS load gaps, and Zhang et al. (2024) [
30] reduced LSS fatigue under frequency regulation through torsional vibration control, reducing the DEL.
Sun et al., 2022 [
31] conducted a fatigue load evaluation primarily based on simulations of a single NREL 5 MW turbine model, limiting its applicability to larger modern wind turbines such as the IEA 15 MW, which experience different structural responses, due to increased rotor diameters, hub heights, and slender blade flexibility. These larger turbines show distinct aerodynamic and structural loading conditions, making it essential to incorporate them into fatigue assessments to ensure more accurate and comprehensive load predictions. Zalkind and Pao (2016) [
32], used ElastoDyn to study fatigue loads on NREL 5 MW wind turbine components such as the blade root OOP moment, LSS torque, LSS moment, and tower base moment under yaw control; however, it lacked the detailed spatial resolution of blade deformations due to its simplified modeling.
To address these challenges, the advanced and geometrically nonlinear blade analysis provided by BeamDyn, which standalone ElastoDyn cannot capture for large turbine blades with pre-twist and pre-bend, is utilized. Integrating BeamDyn with ElastoDyn bridges this gap, enabling a more comprehensive fatigue assessment and enhancing the structural integrity of modern large-scale wind turbines. This study investigates the short-term aggregated DELs of two yawed wind turbine models, onshore NREL 5 MW [
33] and offshore IEA 15 MW [
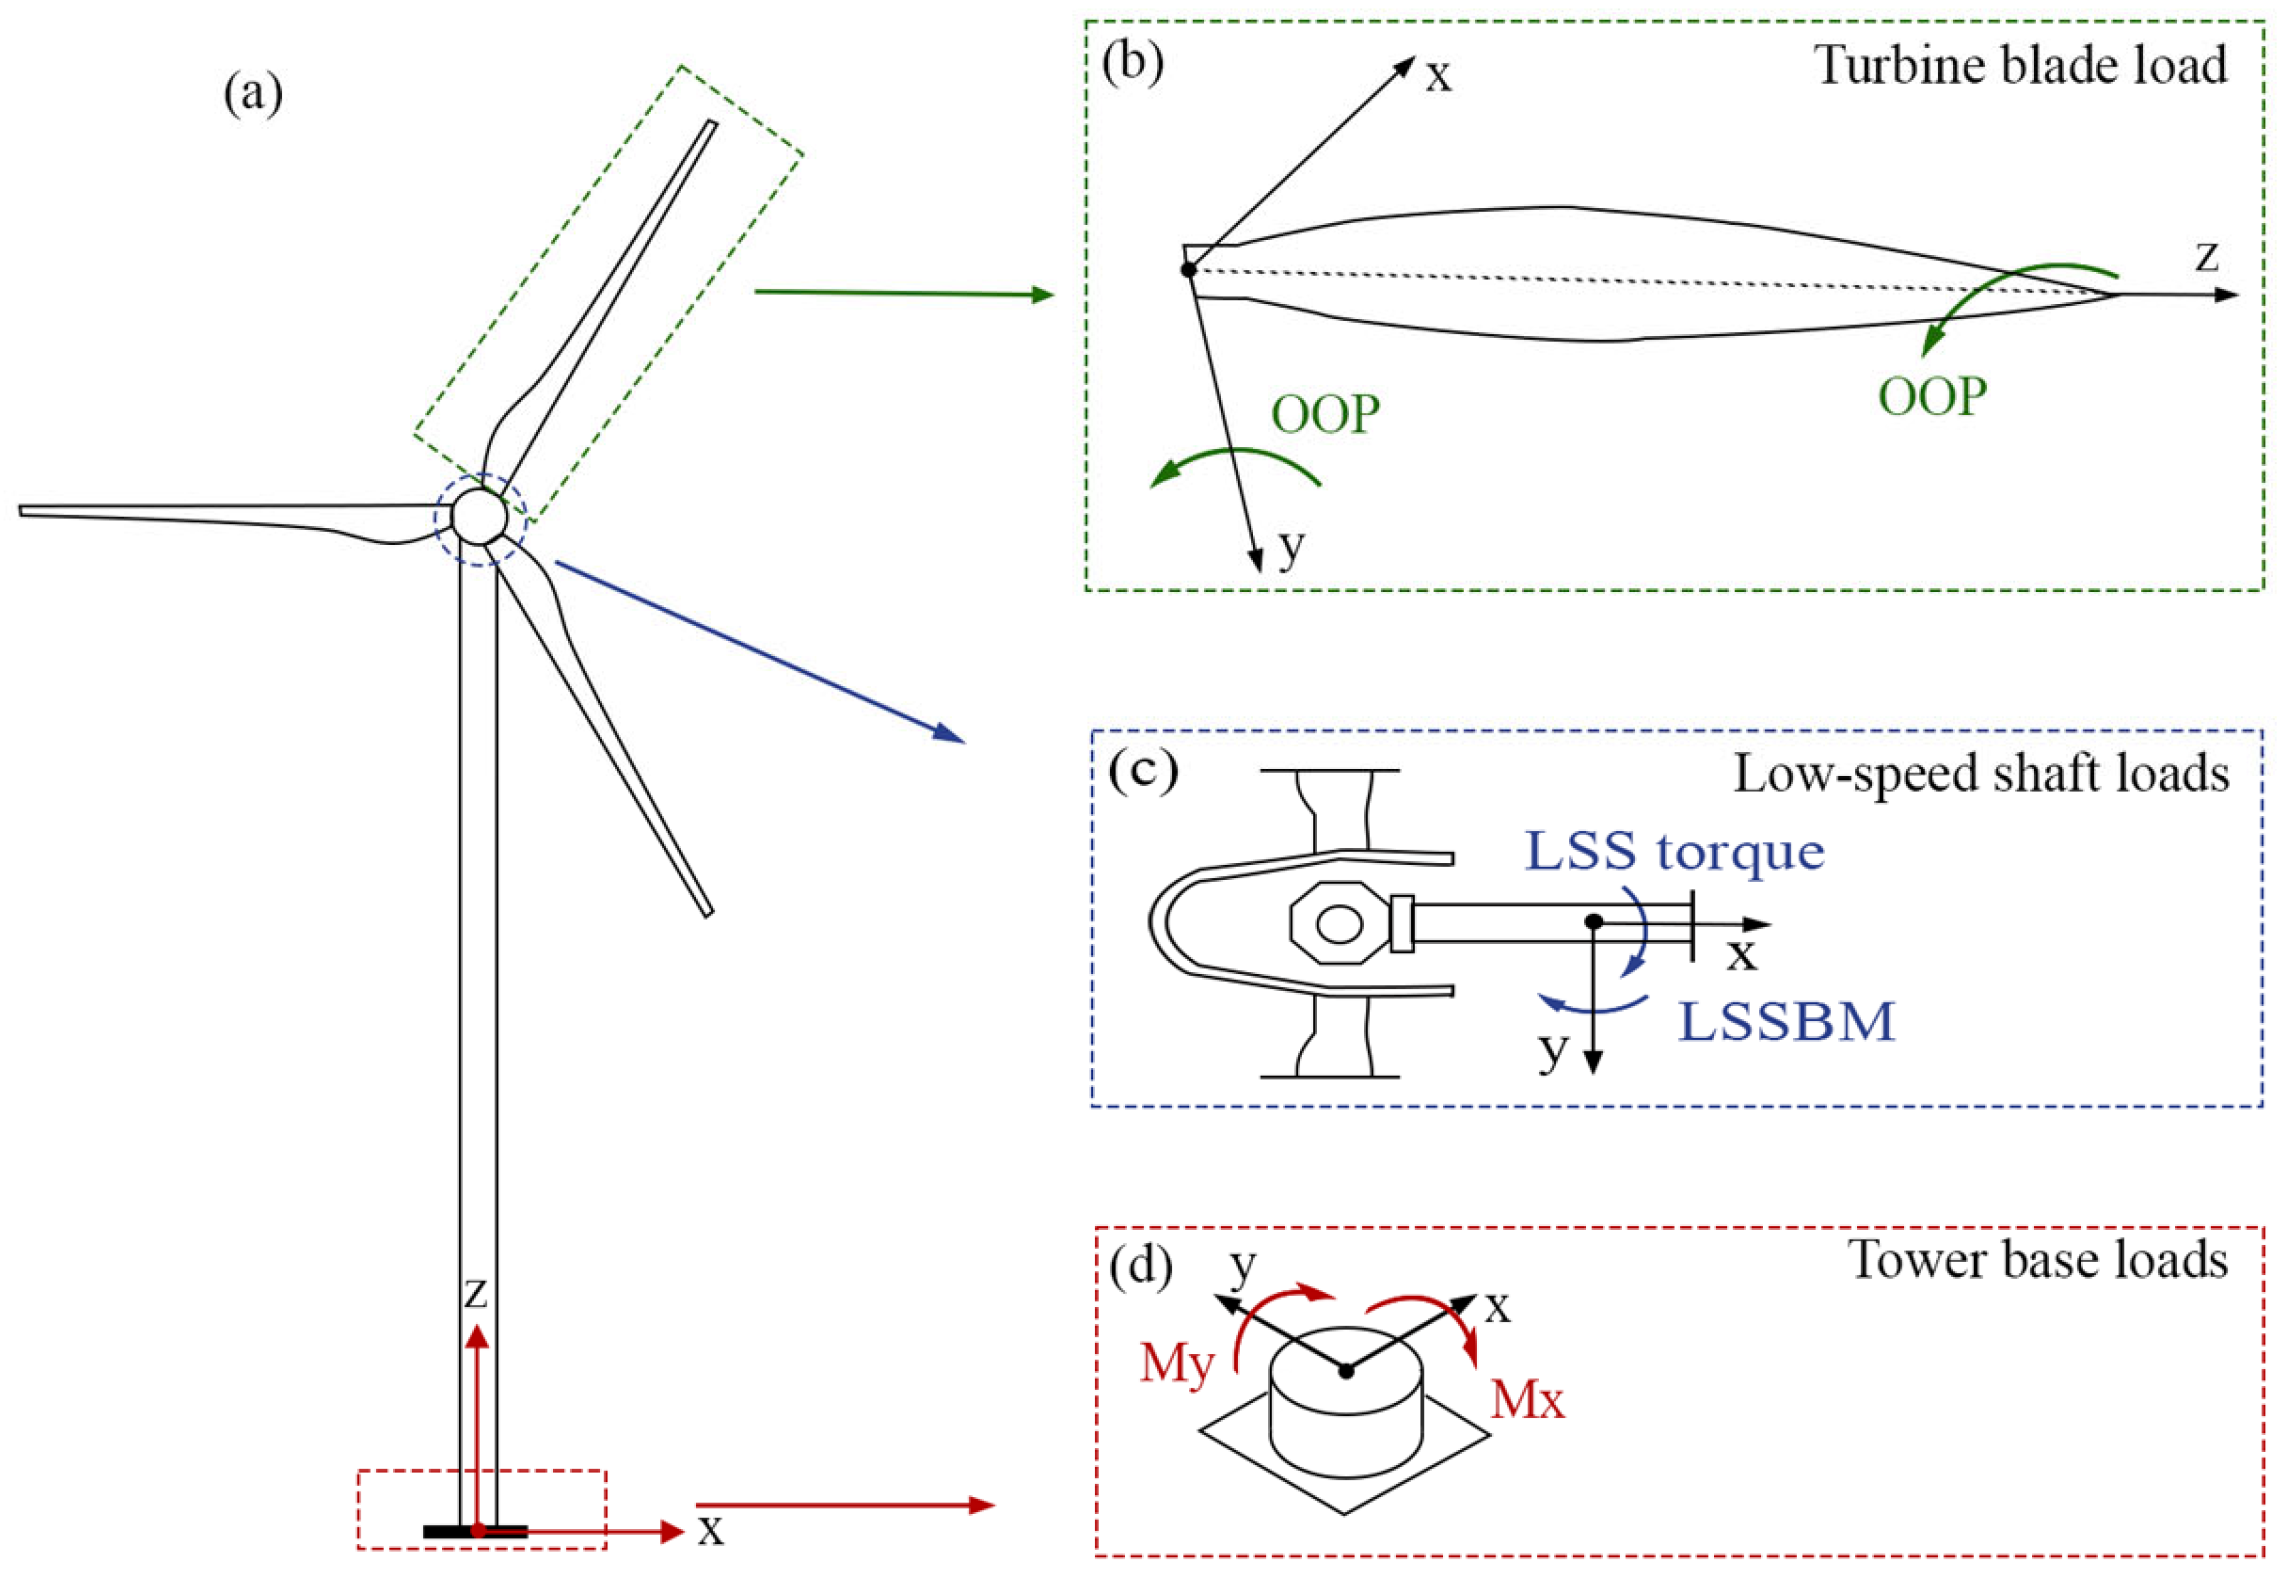
34], under representative stochastic turbulent wind conditions below and above the rated wind speeds. The analysis focuses on critical turbine components, including blade root OOP, LSS torque, LSSBM, and the resultant TBBM (combining fore-aft and side-to-side components). The loads are calculated using the nonlinear aero-servo-elastic tool OpenFAST [
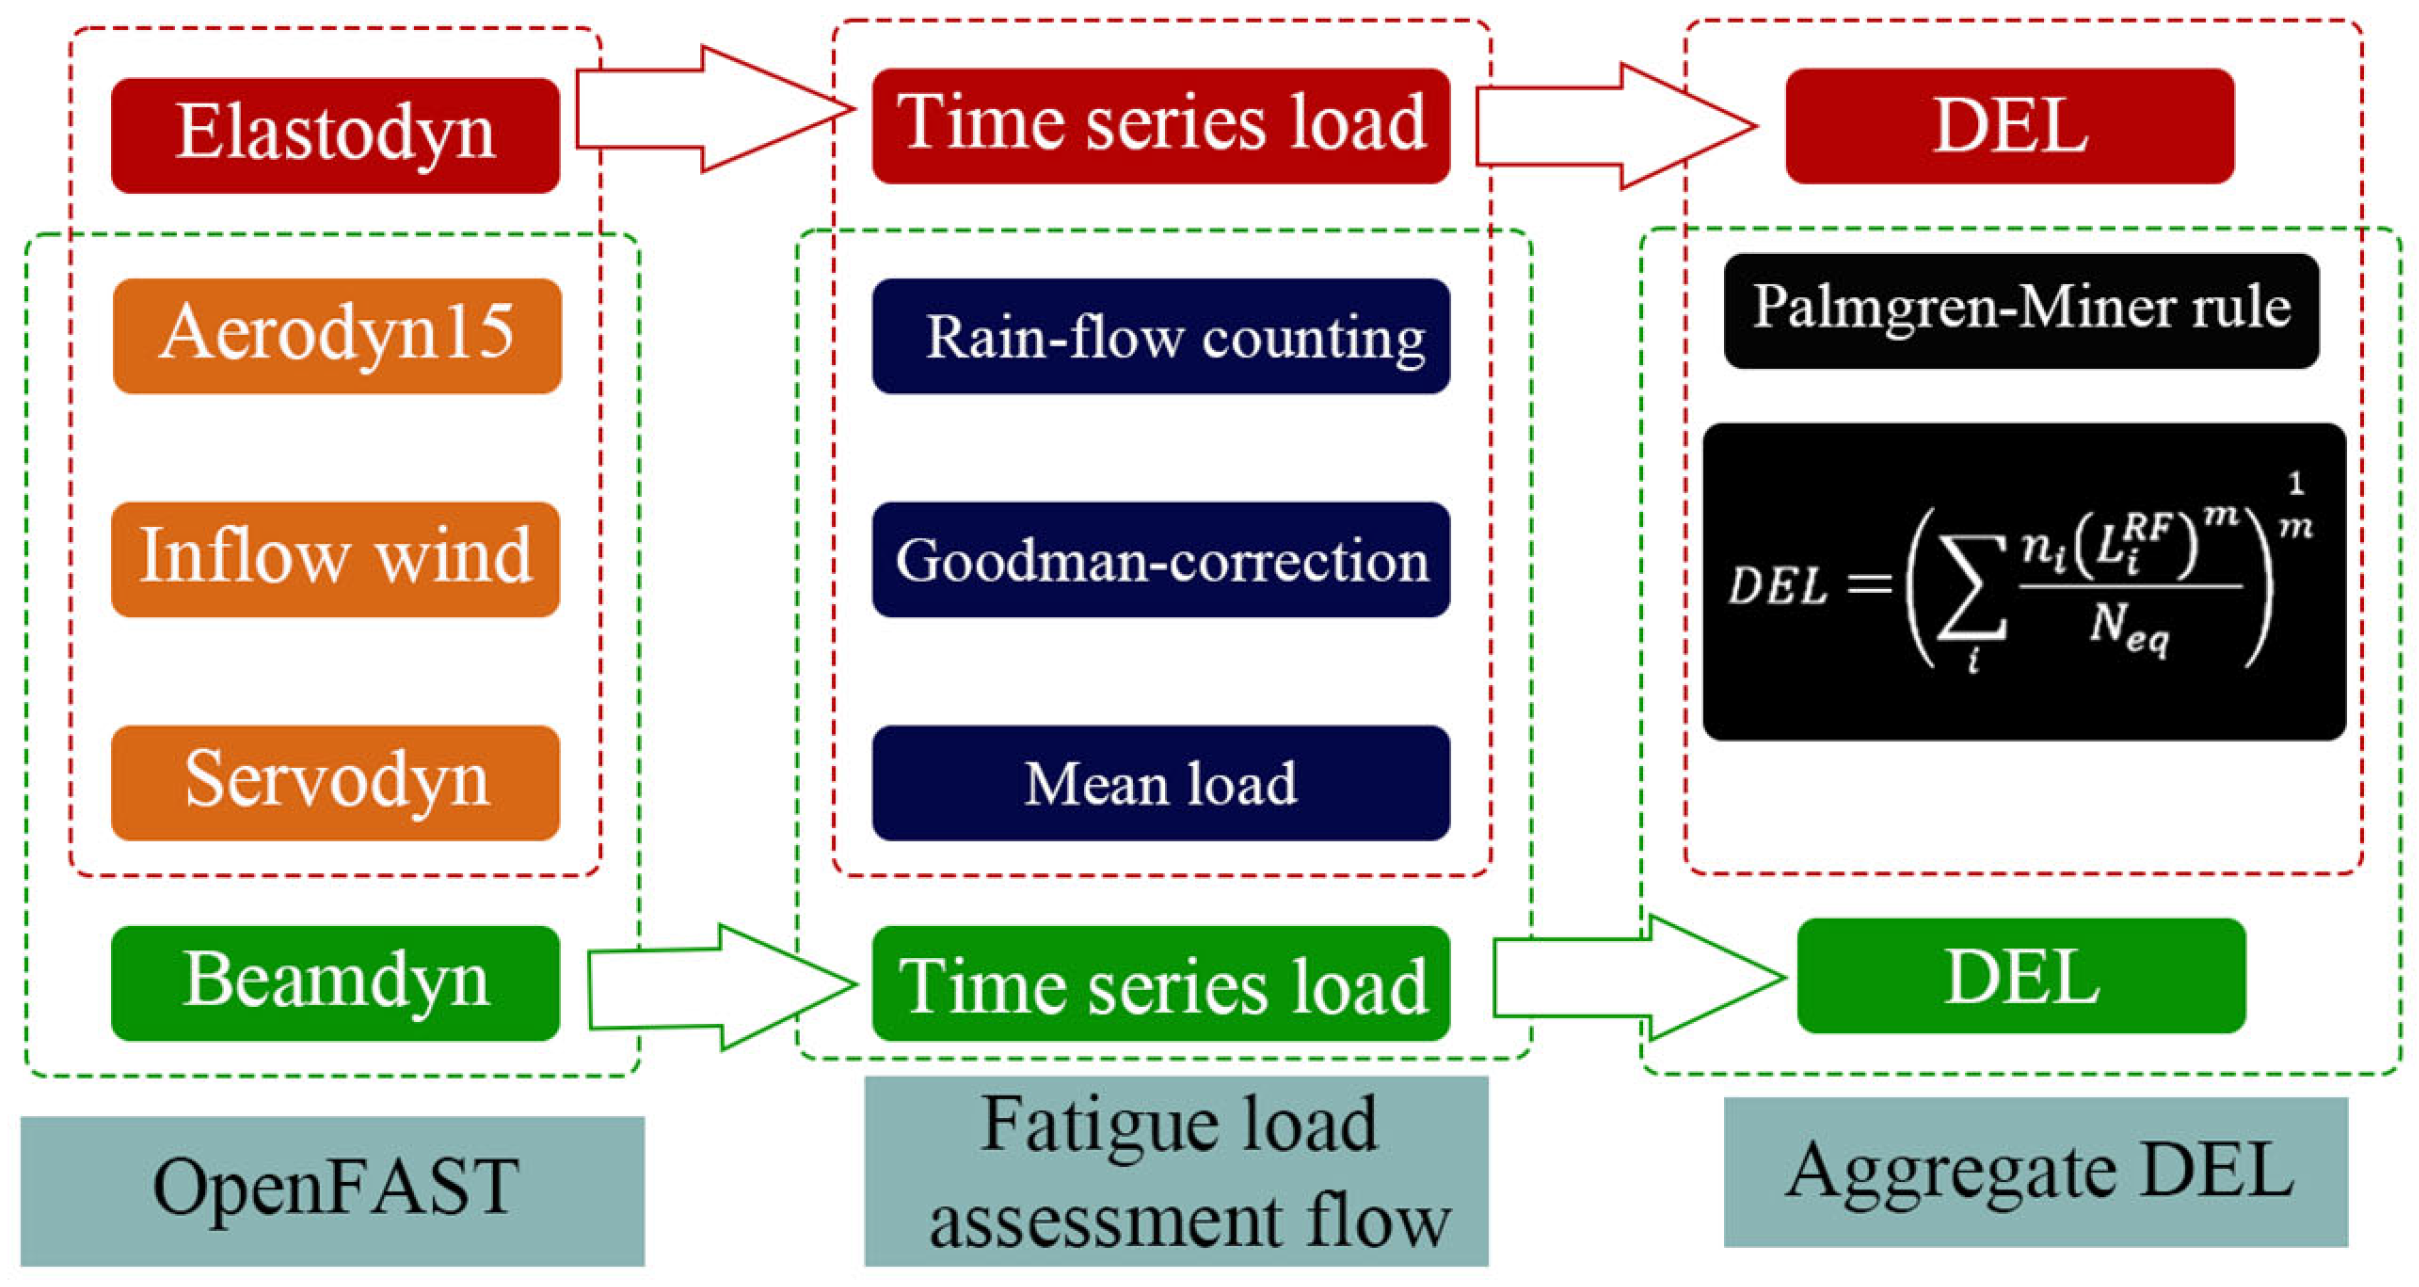
13], employing two blade models, ElastoDyn and BeamDyn. Time-series load data are processed using the Rainflow counting method, which enables the analysis of variable amplitude loading by breaking down complex irregular loads into individual simple load cycles. For each hysteresis loop, the method identifies the peaks and valleys and counts each loop as a separate cycle, noting the amplitude (half the difference between the peak and valley) and the mean load (the average of the peak and valley) [
35].
The response of material to the mean load can allow for the selection of a mean load with the Goodman correction that suits the material behavior; to obtain the ratio of minimum to maximum load equal to
requires an additional transformation process. Such a method can formulate a mean load correction equation that assumes a linear relationship between the mean load and the ratio of the load amplitude to the equivalent load [
36]. Material-specific S-N curve values are utilized, and the aggregated DELs are computed according to Miner’s rule for both the BeamDyn and ElastoDyn results, followed by a comparative analysis. The objectives of this study are threefold: (1) to compare the fatigue loads predicted by BeamDyn and ElastoDyn, (2) to assess the influence of yaw misalignment on the fatigue damage of wind turbine components, and (3) to evaluate differences in fatigue loads across the NREL 5 MW and IEA 15 MW turbine models.
This paper is structured as follows.
Section 2 introduces the wind turbines model description, wind field modeling, turbine blade analysis, and fatigue load assessment. In
Section 3, we present aggregated short-term DELs for critical wind turbine components and a comparative study of two wind turbine models.
Section 4 presents the conclusions of the overall study.
3. Results and Discussion
In this section, we normalize the results in two ways: (1) In
Section 3.1 and
Section 3.2, all DEL results are normalized by the DEL from the zero-degree yaw offset ElastoDyn case, as this serves as the baseline model to facilitate comparison of variations in the BeamDyn results. (2) In
Section 3.3, the DEL for each turbine model component is normalized by the corresponding value from the ElastoDyn case at the same yaw offset, again to observe load variations relative to the ElastoDyn baseline. The fatigue load result for the NREL 5 MW wind turbine model is presented in
Section 3.1, while the IEA 15 MW wind turbine model is detailed in
Section 3.2. A comparative analysis of the fatigue loads across the NREL 5 MW and IEA 15 MW wind turbine models is provided in
Section 3.3.
3.1. The DEL of NREL 5 MW Wind Turbine Model
Figure 5a,b illustrate the DEL of the blade OOP moment at various
γ for below-rated (left) and above-rated (right) wind speeds in both the ElastoDyn and BeamDyn cases. For below-rated wind speeds, the DEL of the OOP moment in the ElastoDyn case remained fairly similar as
γ changed. In contrast, the BeamDyn case saw a more linear increase in DEL as
γ changed from −40° to 40° from 0°, though it recorded lower DEL values at 0° for below-rated wind speed and the same DEL value for above-rated wind speeds compared to ElastoDyn. The BeamDyn case shows a nearly consistent upward pattern in DEL across
γ from 0° to ±40°. For above-rated wind speeds, both ElastoDyn and BeamDyn cases saw a similar trend, with DEL values rising across
γ; however, the increase in DEL is more pronounced in the BeamDyn case compared to ElastoDyn. The discrepancies arise from the assumptions in ElastoDyn that the material is isotropic and linear elastic and that plane sections remain plane and perpendicular to the neutral axis, which limit its ability to capture the geometric nonlinearity, pre-bend, and twist of the blade sections.
The results presented in
Figure 6, show that the OOP blade tip displacement deviates in a pattern similar to that of the fatigue load. The blade tip in-plane displacement saw greater deviations at
and lower variations at
for both below-rated and above-rated wind speeds. Regarding the blade tip twist, the load deviation decreased as the
γ increased in the ElastoDyn case, whereas the opposite was true for the BeamDyn case at below-rated wind speeds. For above-rated wind speeds, the load variation in the blade tip twist followed a trend similar to the blade tip OOP displacement in both ElastoDyn and BeamDyn cases. In addition to the blade tip in-plane displacement, the geometric nonlinearity affected the performance of the ElastoDyn case for the blade-tip OOP displacement and blade-tip twist.
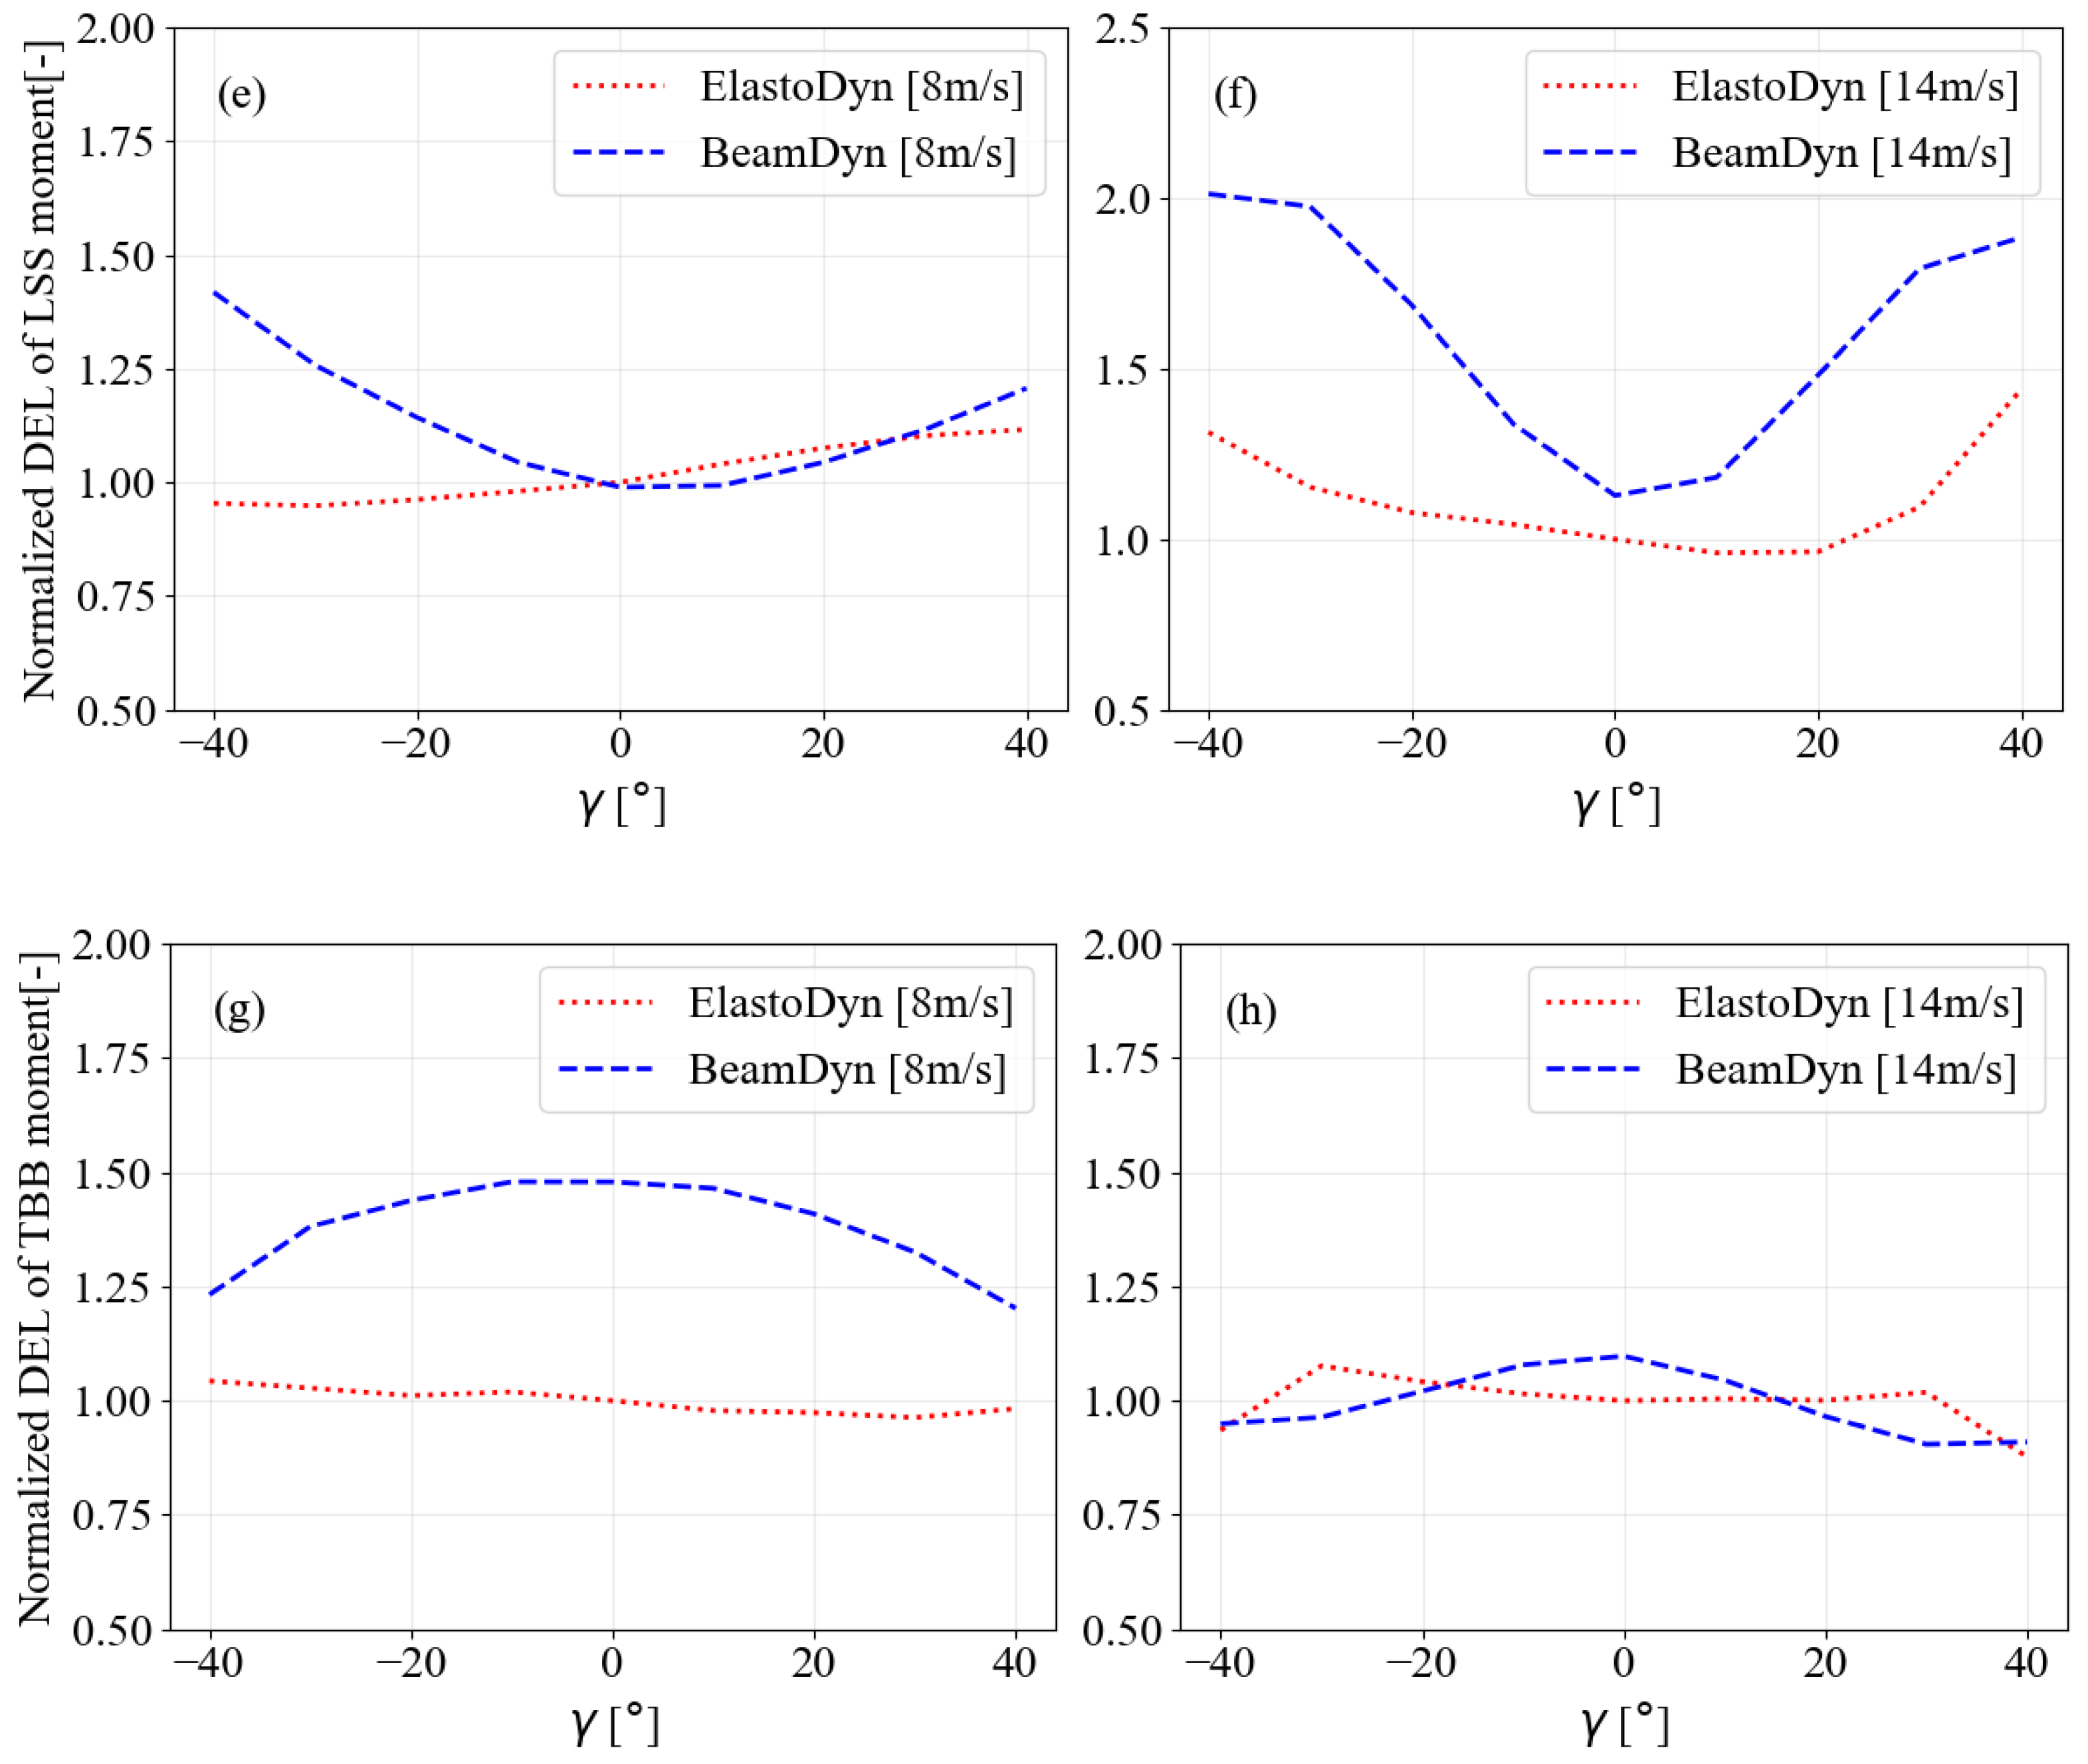
Figure 5c,d depict the LSS torque (a torsional moment transmitted through the LSS about its rotational axis) and DEL of ElastoDyn and BeamDyn for below-rated (left) and above-rated (right) wind speeds. For the below-rated wind speed, the LSS experienced lower DEL as the
γ increased in both positive and negative directions in both ElastoDyn and BeamDyn. LSS experienced the highest DEL at
in both the ElastoDyn and BeamDyn cases and dropped significantly as the
γ increased. The BeamDyn shown approximately 20% lower DEL compared to ElastoDyn. For the above-rated wind speeds, the DEL of the LSS torque fluctuated with increasing yaw misalignment. Between
γ of −40° and 20°, the DEL dropped significantly, with notable rises at 30° and 40°. However, the lowest DEL at negative
γ occurred at −20°. In the BeamDyn case, the DEL of the shaft generally increased as
γ rose from 0° to
, but it then dropped at
. The DEL of the LSS for both BeamDyn and ElastoDyn showed a similar pattern across positive and negative yaw misalignment. In general, the LSS torque experienced similar fatigue damage in both methods, with geometric nonlinearity having a moderate influence on LSS torque.
Figure 5e,f compare the DEL of the LSS moment (a force couple that causes the shaft to bend, resulting in loads that could lead to deflection) across varying
γ in the ElastoDyn and BeamDyn simulations for below-rated (left) and above-rated (right) wind speeds. As
γ increased, the DEL of the LSS moment in BeamDyn rose linearly for both wind speed conditions. In the ElastoDyn case, however, the DEL of the LSS moment showed a gradual increase but decreased only for negative
γ from 0° to −40°. The DEL of the LSS moment was generally higher in BeamDyn, except between
γ of 0° and 20°, where it was higher in ElastoDyn for below-rated wind speeds. The imbalance in the aerodynamic thrust across the rotor area induced by
γ caused an increase in the DEL of the LSS moment.
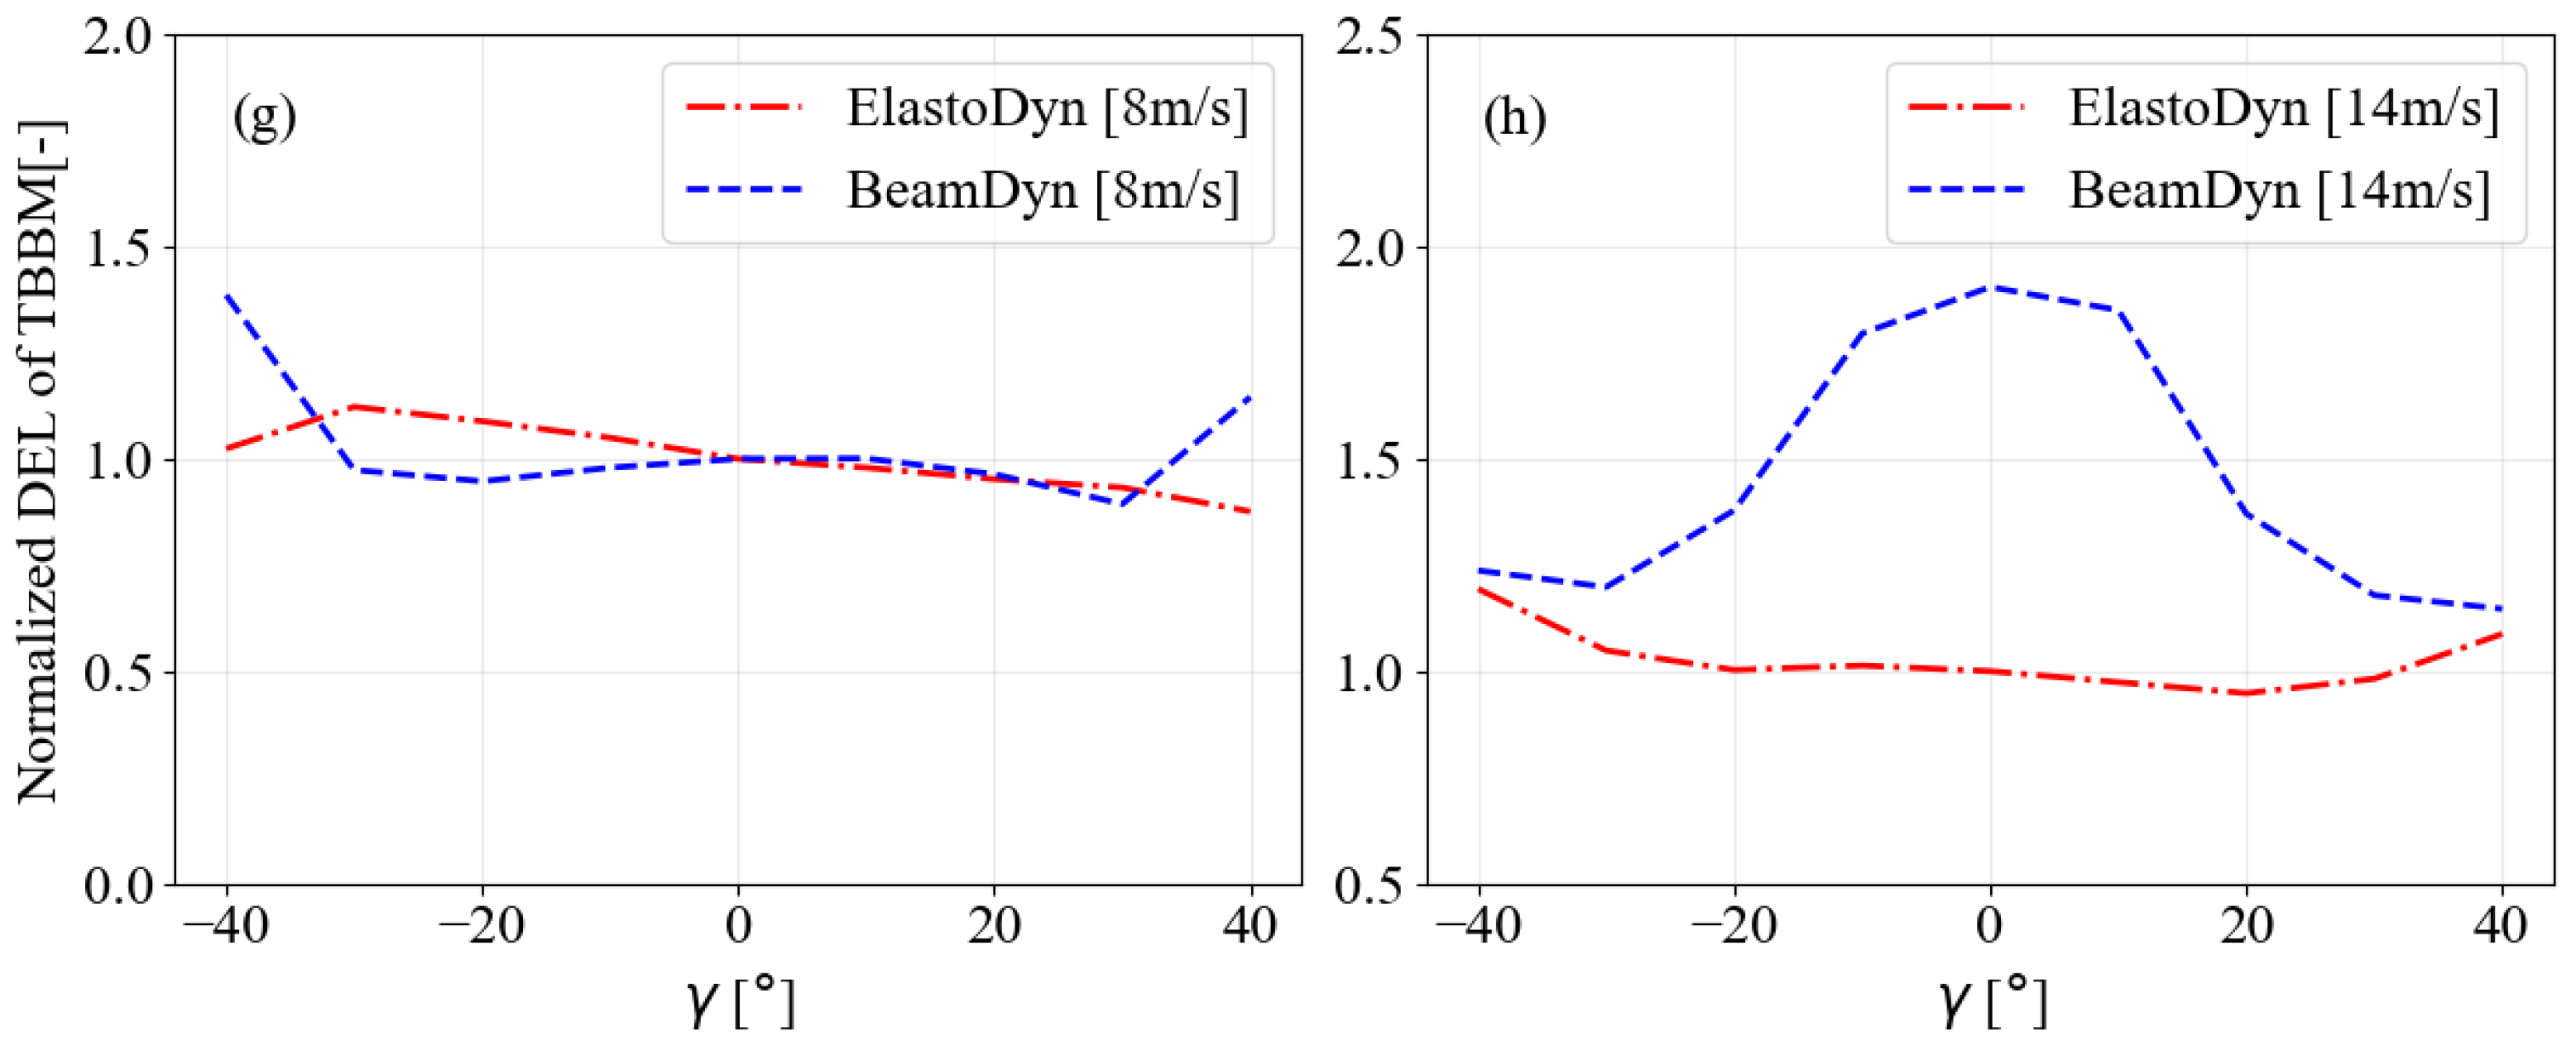
Figure 5g,h compare the TBBM DEL of ElastoDyn and BeamDyn across varying
γ for below-rated and above-rated wind speeds. In BeamDyn, the TBBM DEL decreased with increasing
γ for both wind speed conditions, with a gradual change observed under the below-rated conditions compared to the above-rated. For ElastoDyn, the TBBM DEL increased for negative
γ from 0° to
and gradually declined from 0° to 40° at below-rated speeds. In contrast, at above-rated speeds, the TBBM DEL increased with both positive and negative
γ up to
, after which, it decreased with further
γ increases. The ElastoDyn case showed lower TBBM DEL at below-rated speeds and more fluctuation at above-rated speeds.
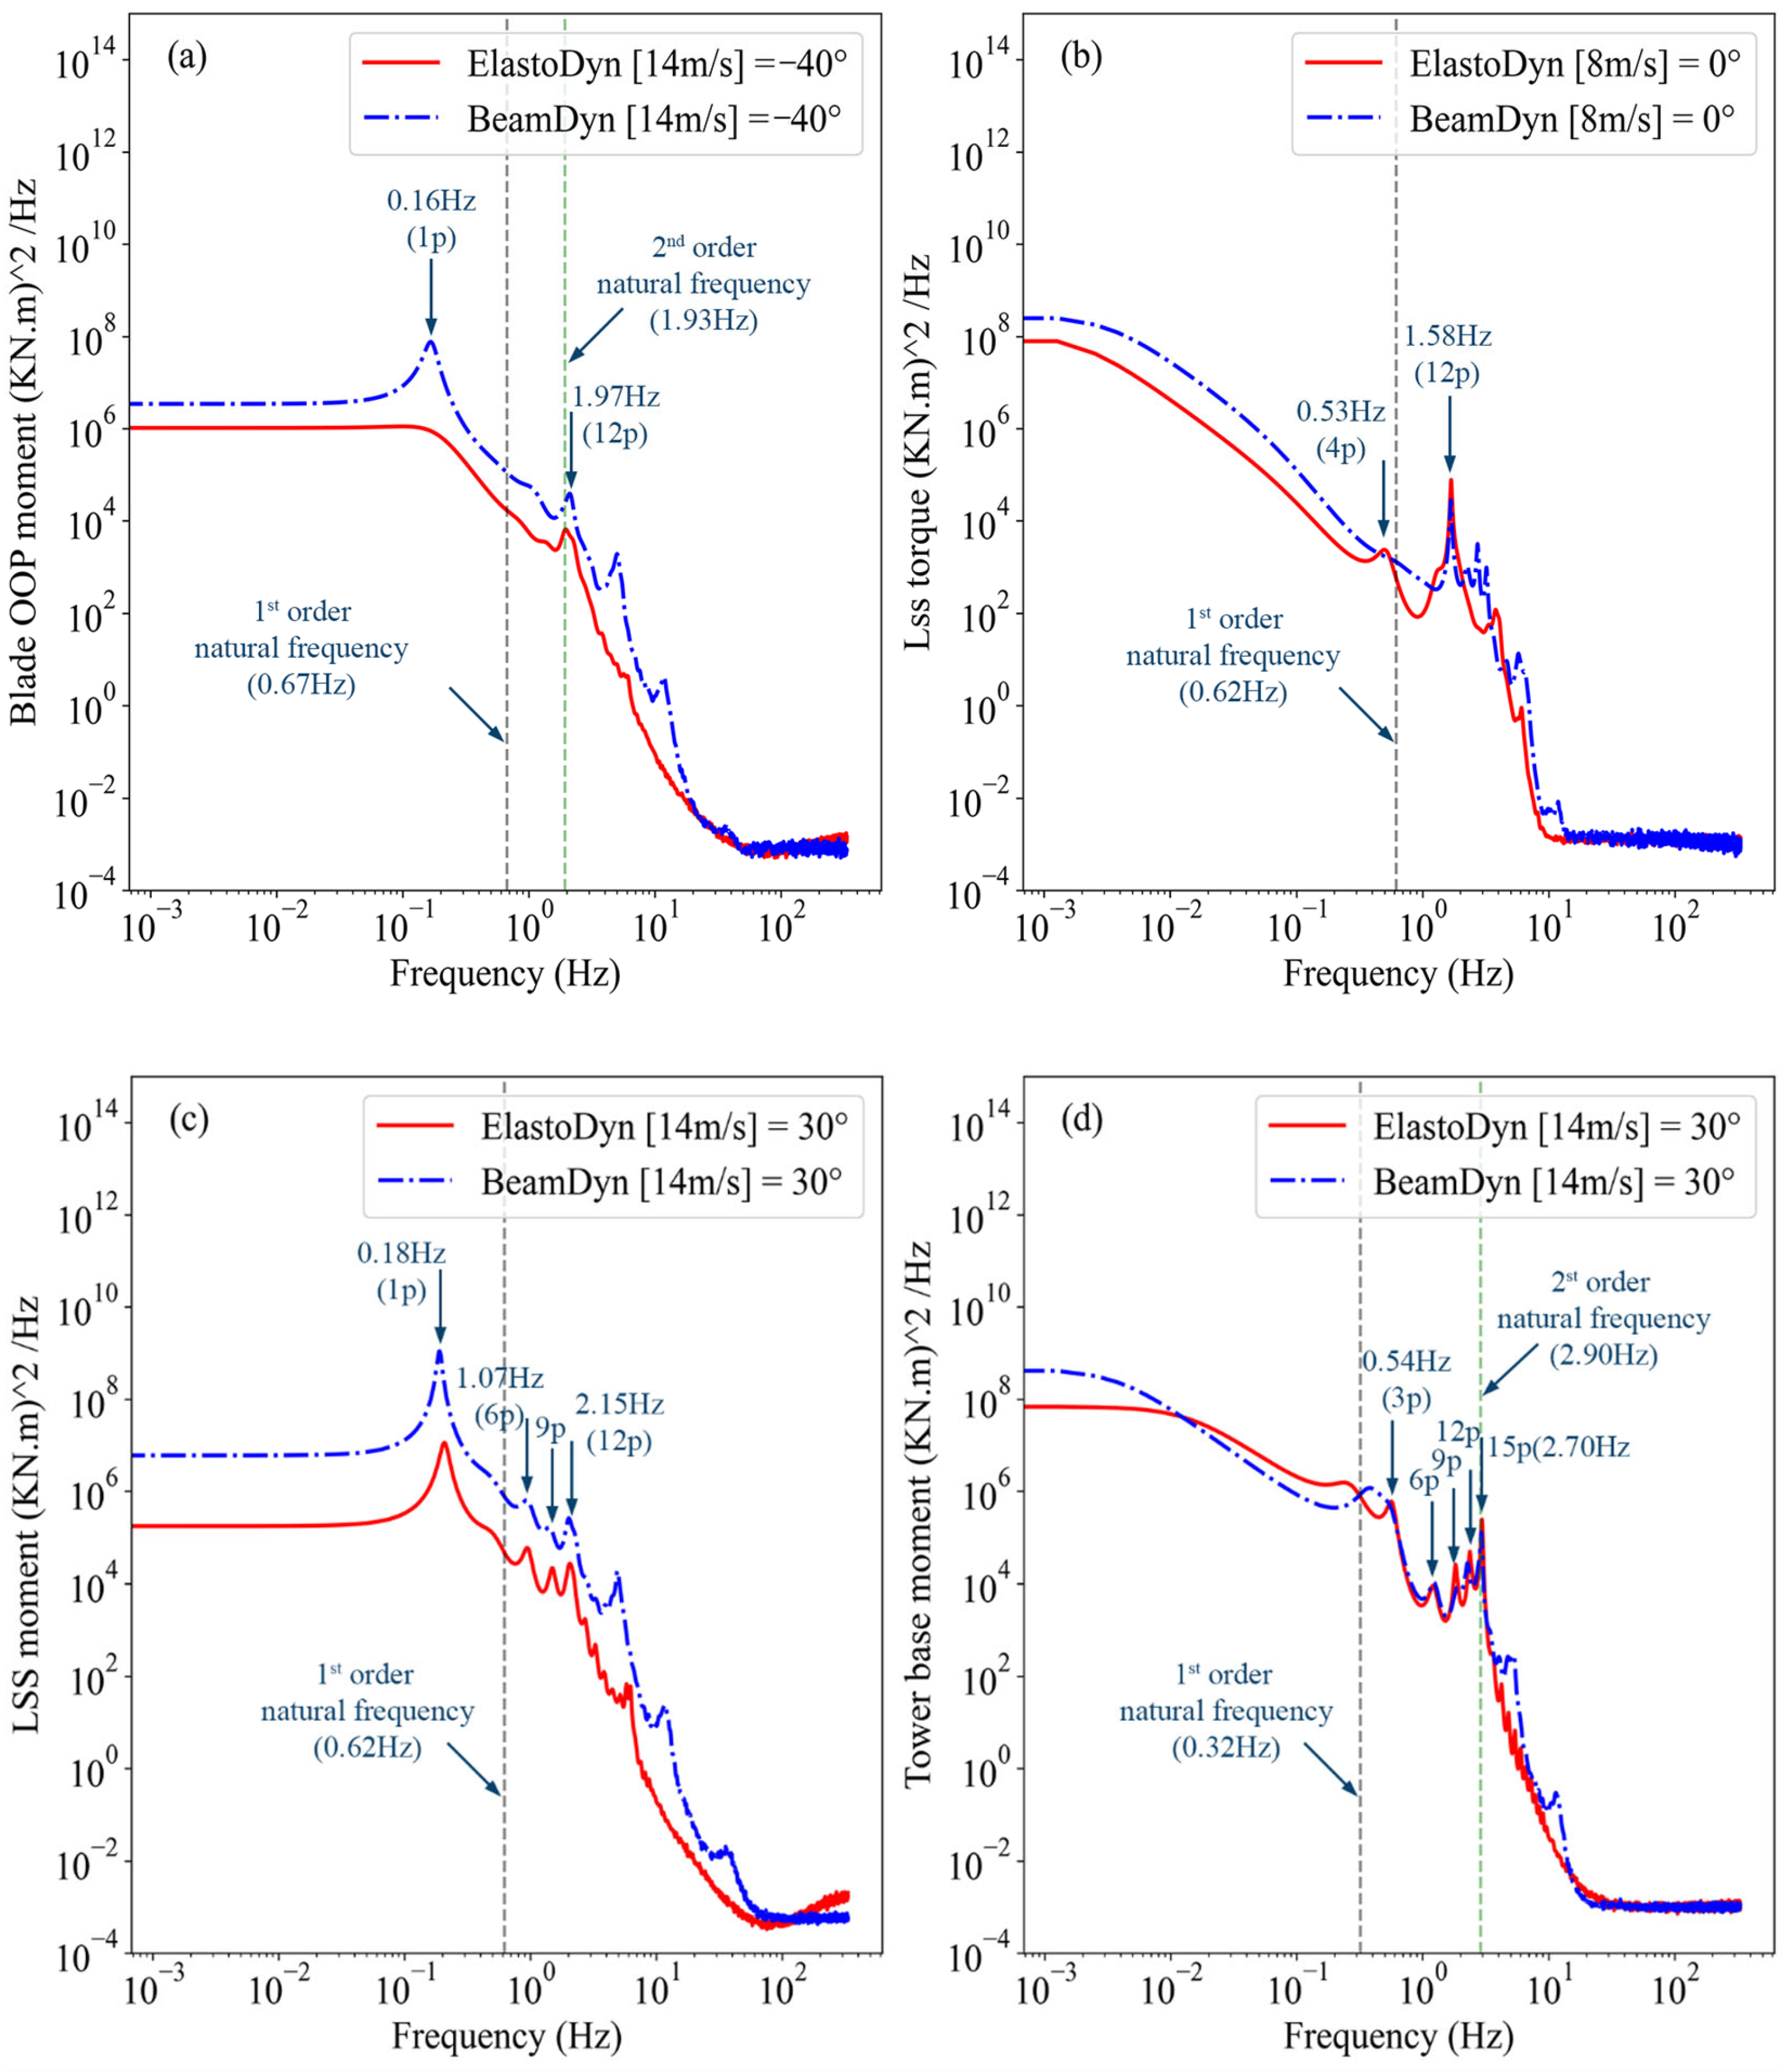
Figure 7 shows the power spectral density (PSD) comparison of ElastoDyn and BeamDyn load prediction for turbine critical components under yaw offset for turbulent wind speeds with mean wind speeds of 8 m/s and 14 m/s.
Figure 7a depicts the PSD of the blade OOP moment response to a mean wind speed 14 m/s at
. The harmonic frequencies 1 p (0.16 Hz) and 12 p (1.97 Hz) are dominant, and the second-order natural frequency (1.93 Hz shown with green dashed line) aligned with the harmonic component 12 p, which increased the fatigue damage, while the first-order natural frequency (0.67 Hz shown with dark dashed line) had no effect the blade. The difference in magnitude of the load spectra showed the DEL in BeamDyn to be larger than the case of ElastoDyn, as shown in
Figure 5b. The PSD of the LSS torque in
Figure 7b presents the dominant harmonic component 4 p (0.53 Hz), only for the ElastoDyn case, and 12 p (1.58 Hz) the largest in magnitude for both the BeamDyn and ElastoDyn cases of a mean wind speed 8 m/s at
. The 4 p component of ElastoDyn approaches to the drivetrain torsion first-order natural frequency (0.62 Hz), which may cause a larger fatigue load, as shown in
Figure 5c.
Figure 7c,d compare the PSD of the LSS moment and resultant tower base moment response of a mean wind speed 14 m/s at
for the BeamDyn and ElastoDyn cases. In
Figure 7c, the LSS moment response shows the magnitude of dominant harmonic frequency component is the largest at 1 p (0.18 Hz), decreases in the order of 6 p (1.07 Hz) and 9 p (1.61 Hz), and slightly increases at 12 p (2.15 Hz) in both cases. The first-order natural frequency (0.62 Hz) does not excite on the LSS moment, and the power spectral magnitude of the BeamDyn resonated more compared to the ElastoDyn, which cause a larger DEL, as evidenced in
Figure 5f. Similarly, the resultant tower base moment response shows the dominant harmonic frequency components 3 p (0.54 Hz), 6 p (1.08 Hz), 9 p (1.62 Hz), 12 p (2.16 Hz), and 15 p (2.70 Hz). Among the harmonic frequency components, the magnitude of the 3 p component is the largest, followed by an increase in the order of 6 p, 9 p, and higher multiples. The tower first-order natural frequency (0.32 Hz) is close to 3 p, while the second-order natural frequency (2.90 Hz) is close to 12 p, able to increase the fatigue damage. In terms of the magnitude of the power spectra, the case of ElastoDyn predicts more, as shown in
Figure 5h.
The effect of the geometric nonlinearity on the NREL 5 MW wind turbine model blades revealed that the prediction of DEL for the OOP moment is significantly influenced by the increasing yaw angle. ElastoDyn, which cannot capture the changes in fatigue load effects on the turbine blade OOP moment at below-rated wind speeds, shows an improvement at above-rated wind speeds. Although the ElastoDyn predictions for LSS torque are fairly similar to those of GEBT, the fatigue damage predictions for the LSS moment and TBBM differ significantly. ElastoDyn’s limitations in predicting the fatigue loads for LSS torque, LSS moment, and TBBM arise from its inability to account for the aerodynamic loads on geometrically nonlinear pre-bent and twisted turbine blades.
The aeroelastic analysis of the NREL 5 MW reference wind turbine, as shown in
Figure 5, presents the DEL results, while
Figure 6 displays the blade tip deflection, and
Figure 7 illustrates the power spectral density of the critical turbine components. In addition to the geometric nonlinearity of the turbine blade, the yaw offset influenced the performance of the ElastoDyn case. For instance, the fatigue damage of the blade root out-of-plane bending moment is quite similar for smaller yaw offsets in both cases but diverges as the yaw offset increases. This can be attributed to the resonance of the harmonic frequency 1 p (0.16 Hz), which was induced by the yaw effect combined with the geometric nonlinearity that the ElastoDyn case could not capture. The blade in-plane deflection for the negative yaw offset was twice that of the positive yaw offset, indicating an asymmetric aerodynamic load across the rotor swept area. This provides insight into the phenomenon of increased fatigue damage to the low-speed shaft bending moment. Overall, the aeroelastic simulation performance of ElastoDyn is influenced by the combined effects of the blade’s geometric nonlinearity and yaw offset.
3.2. The DEL of IEA 15 MW Wind Turbine Model
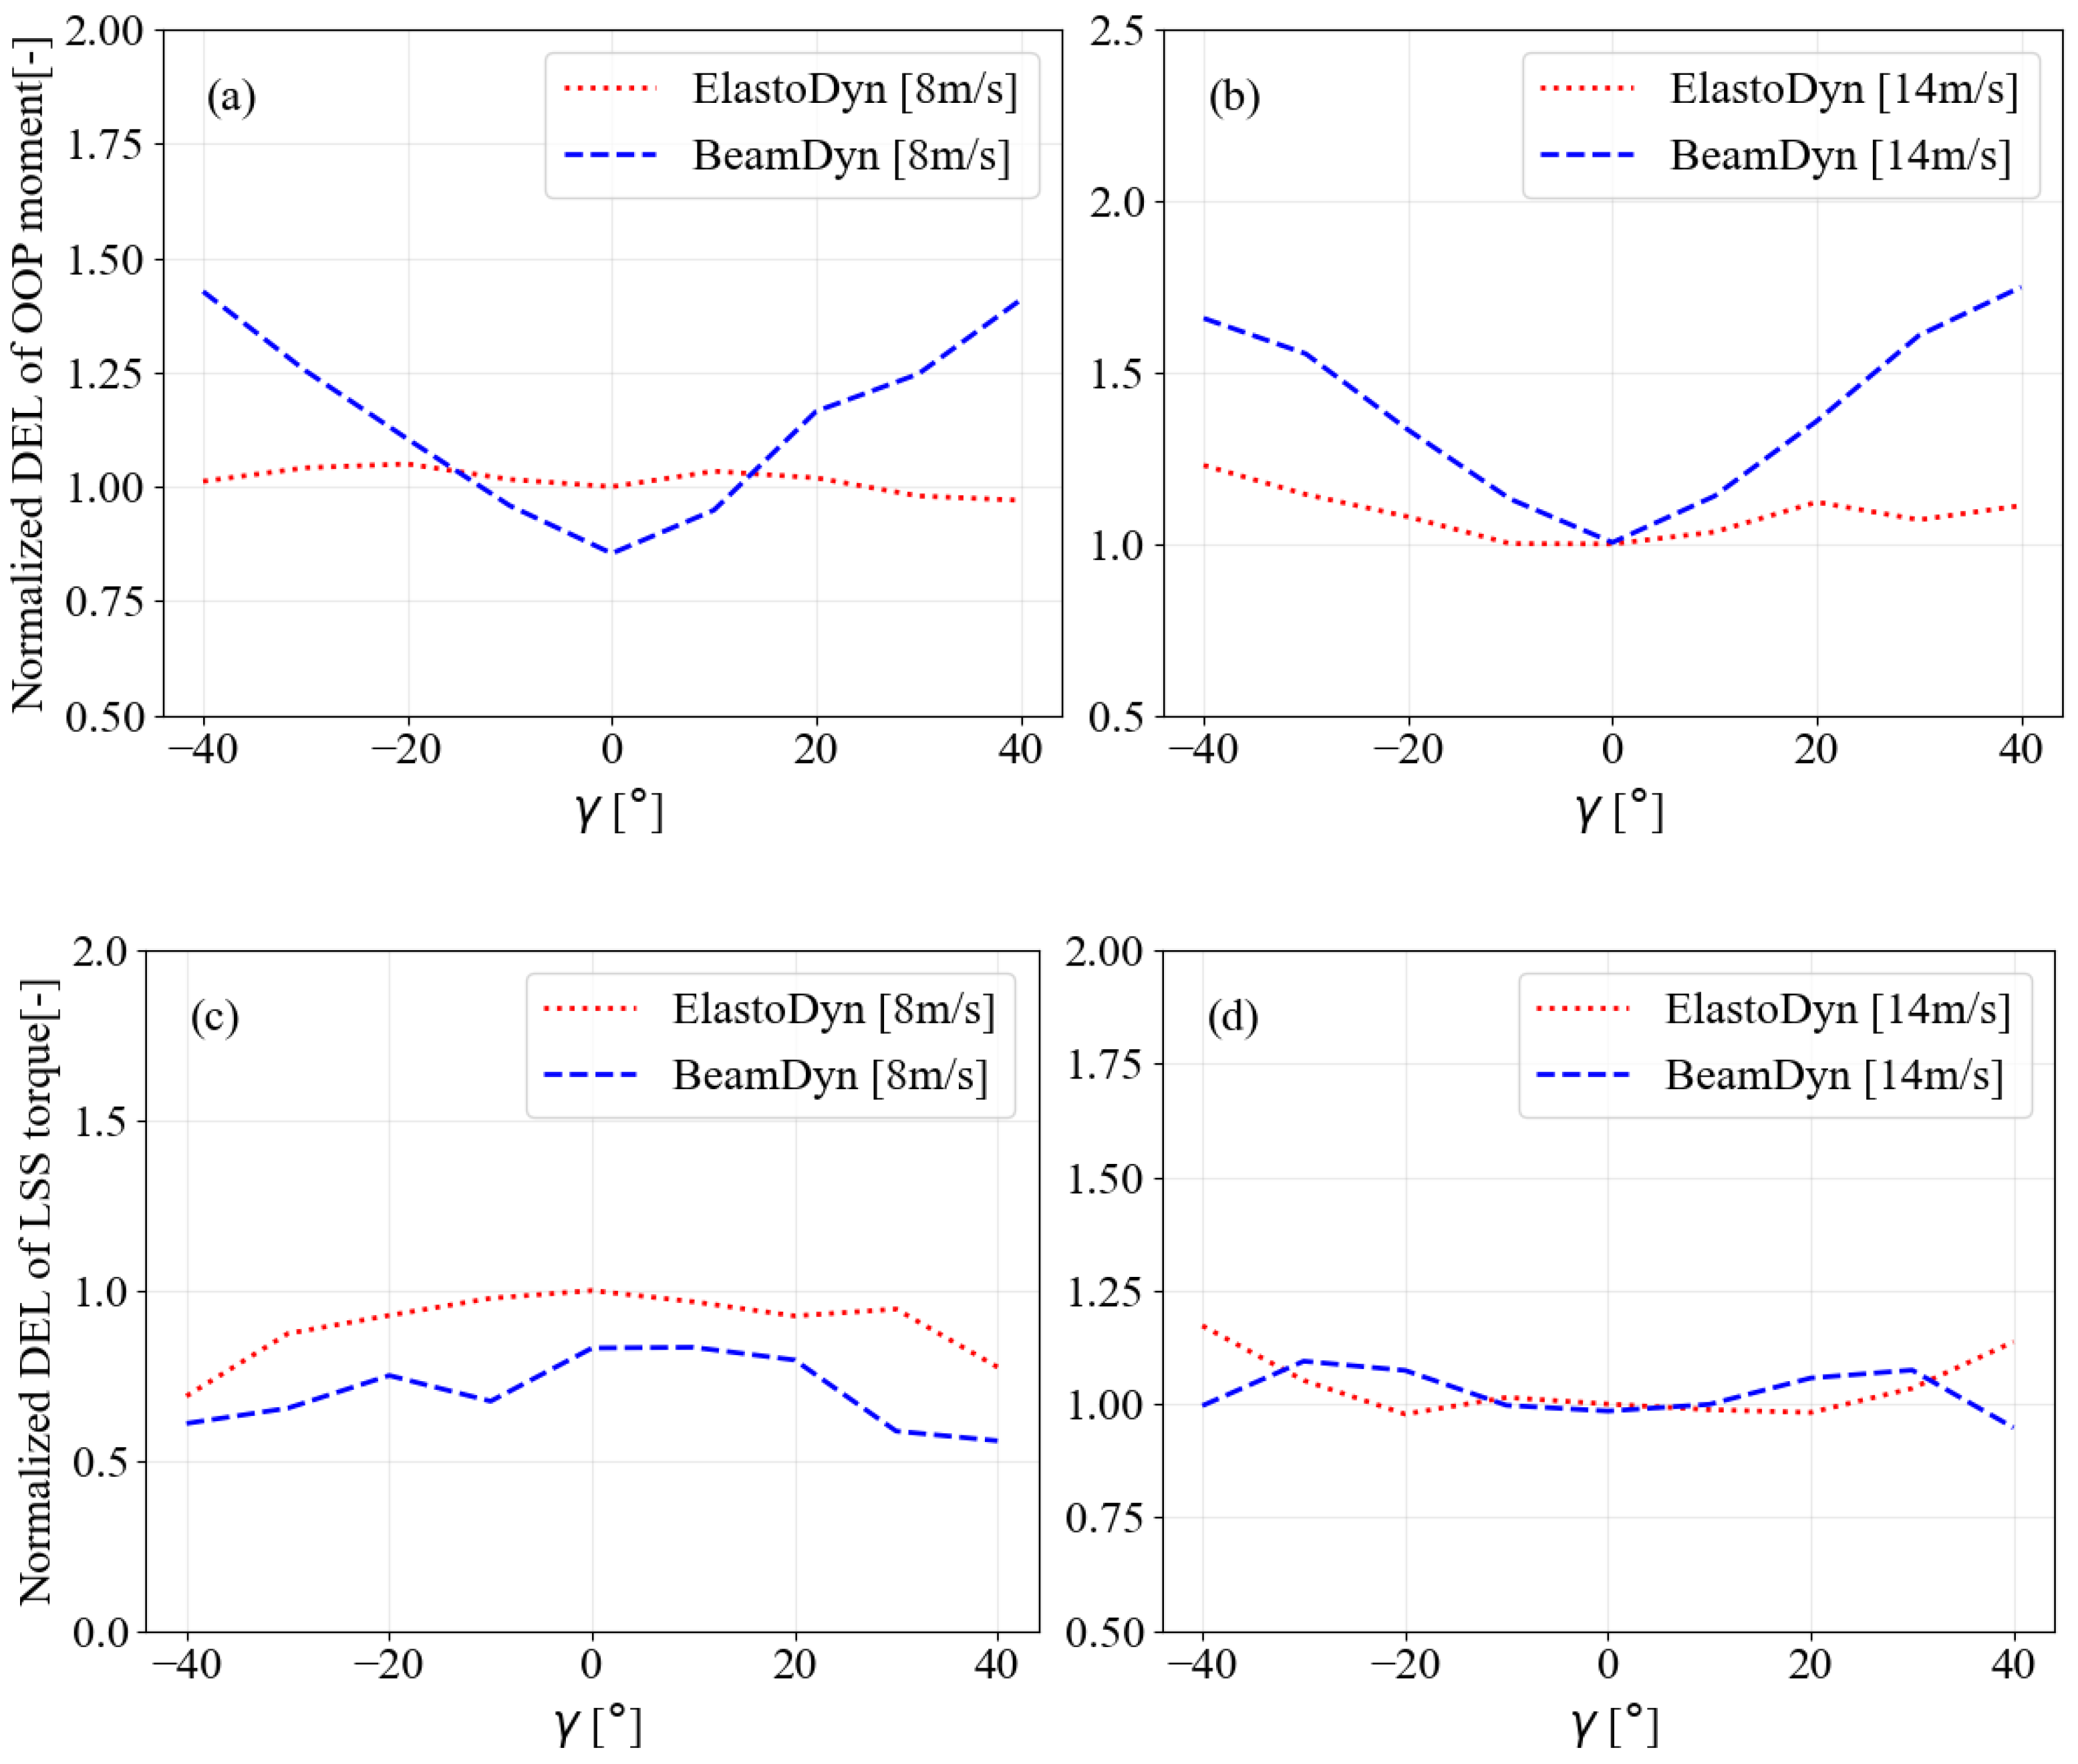
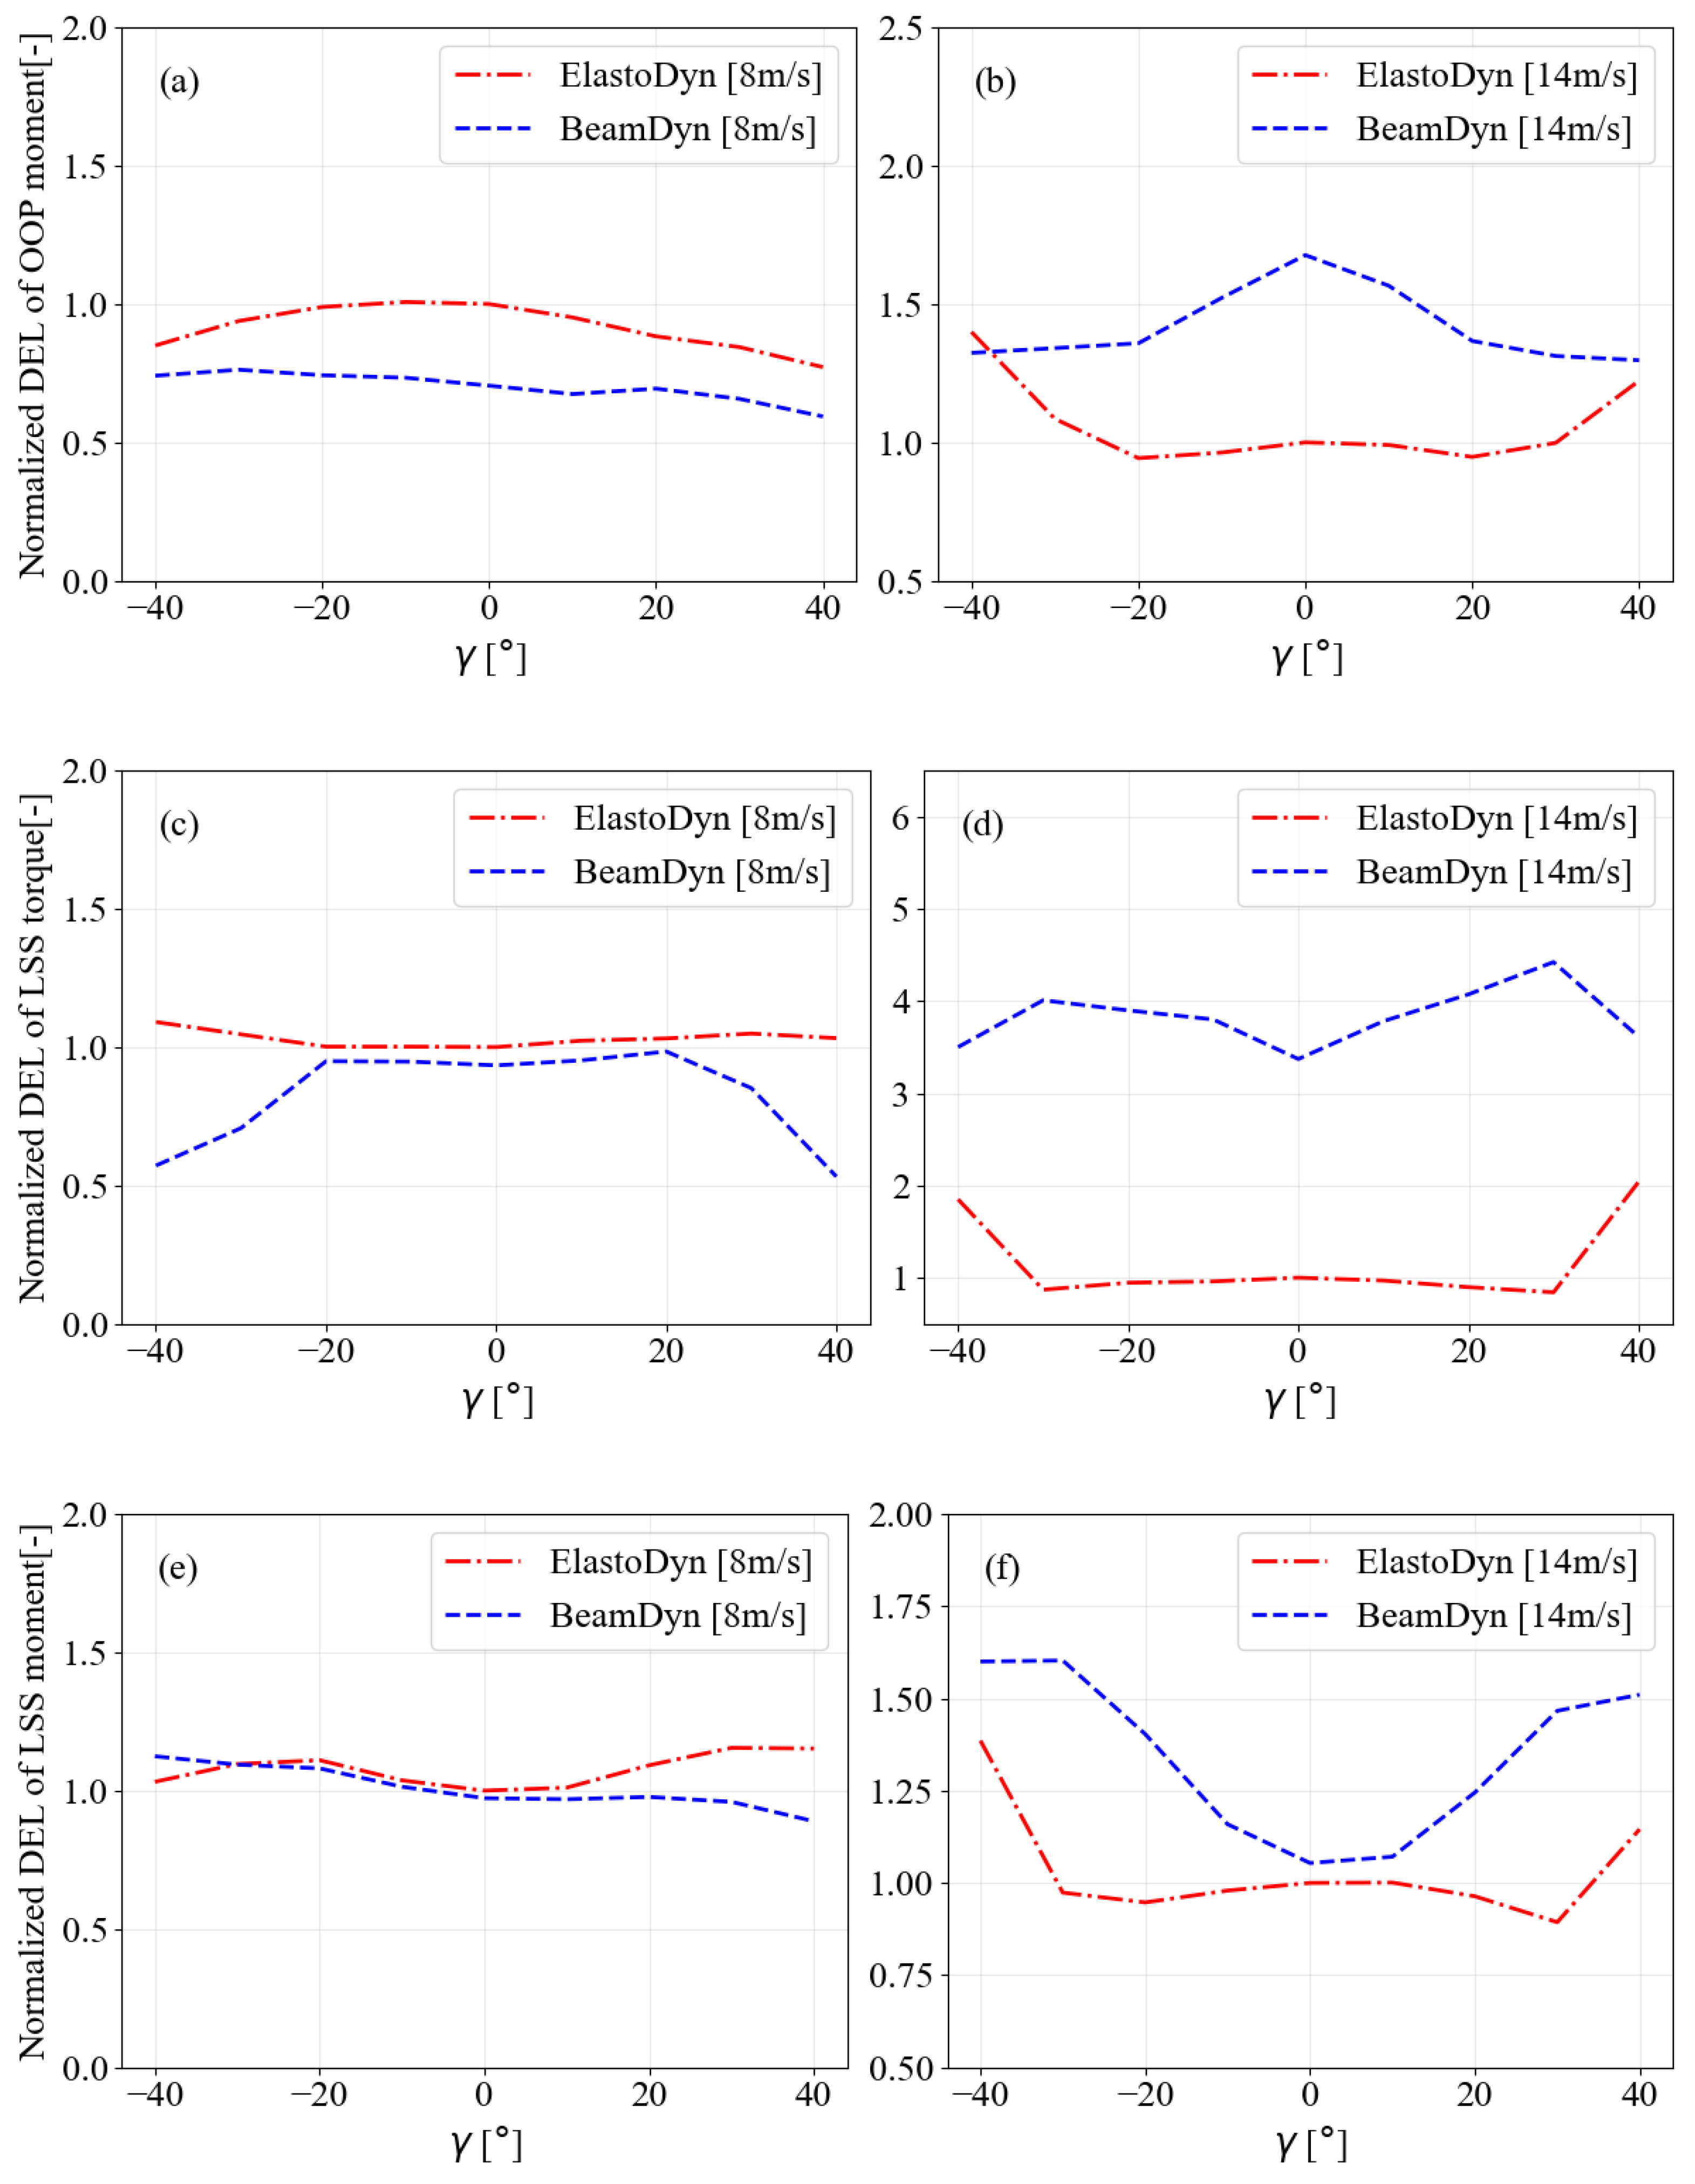
The DEL of the blade OOP moment, as a function of
γ, is shown for both below-rated and above-rated wind speeds in
Figure 8a,b. For the below-rated wind speed case, the ElastoDyn simulation shows a decrease in the fatigue load with increasing negative
γ, while the BeamDyn simulation showed a linear increase. As the positive
γ increases, the DEL of the OOP moment continued to decrease, peaking at
for ElastoDyn. In contrast, for BeamDyn under the below-rated wind speed, the DEL of the OOP moment decreased with positive
γ, reaching a minimum at
. Additionally, for the below-rated wind speed, the fatigue load was higher for ElastoDyn compared to BeamDyn. For the above-rated wind speed, the DEL of the turbine blade OOP moment decreased linearly for
γ up to
under the BeamDyn simulation. However, the ElastoDyn simulation resulted in fairly consistent fatigue loads across this yaw range. Beyond this interval, the fatigue load remained similar for BeamDyn, while it increased significantly for ElastoDyn.
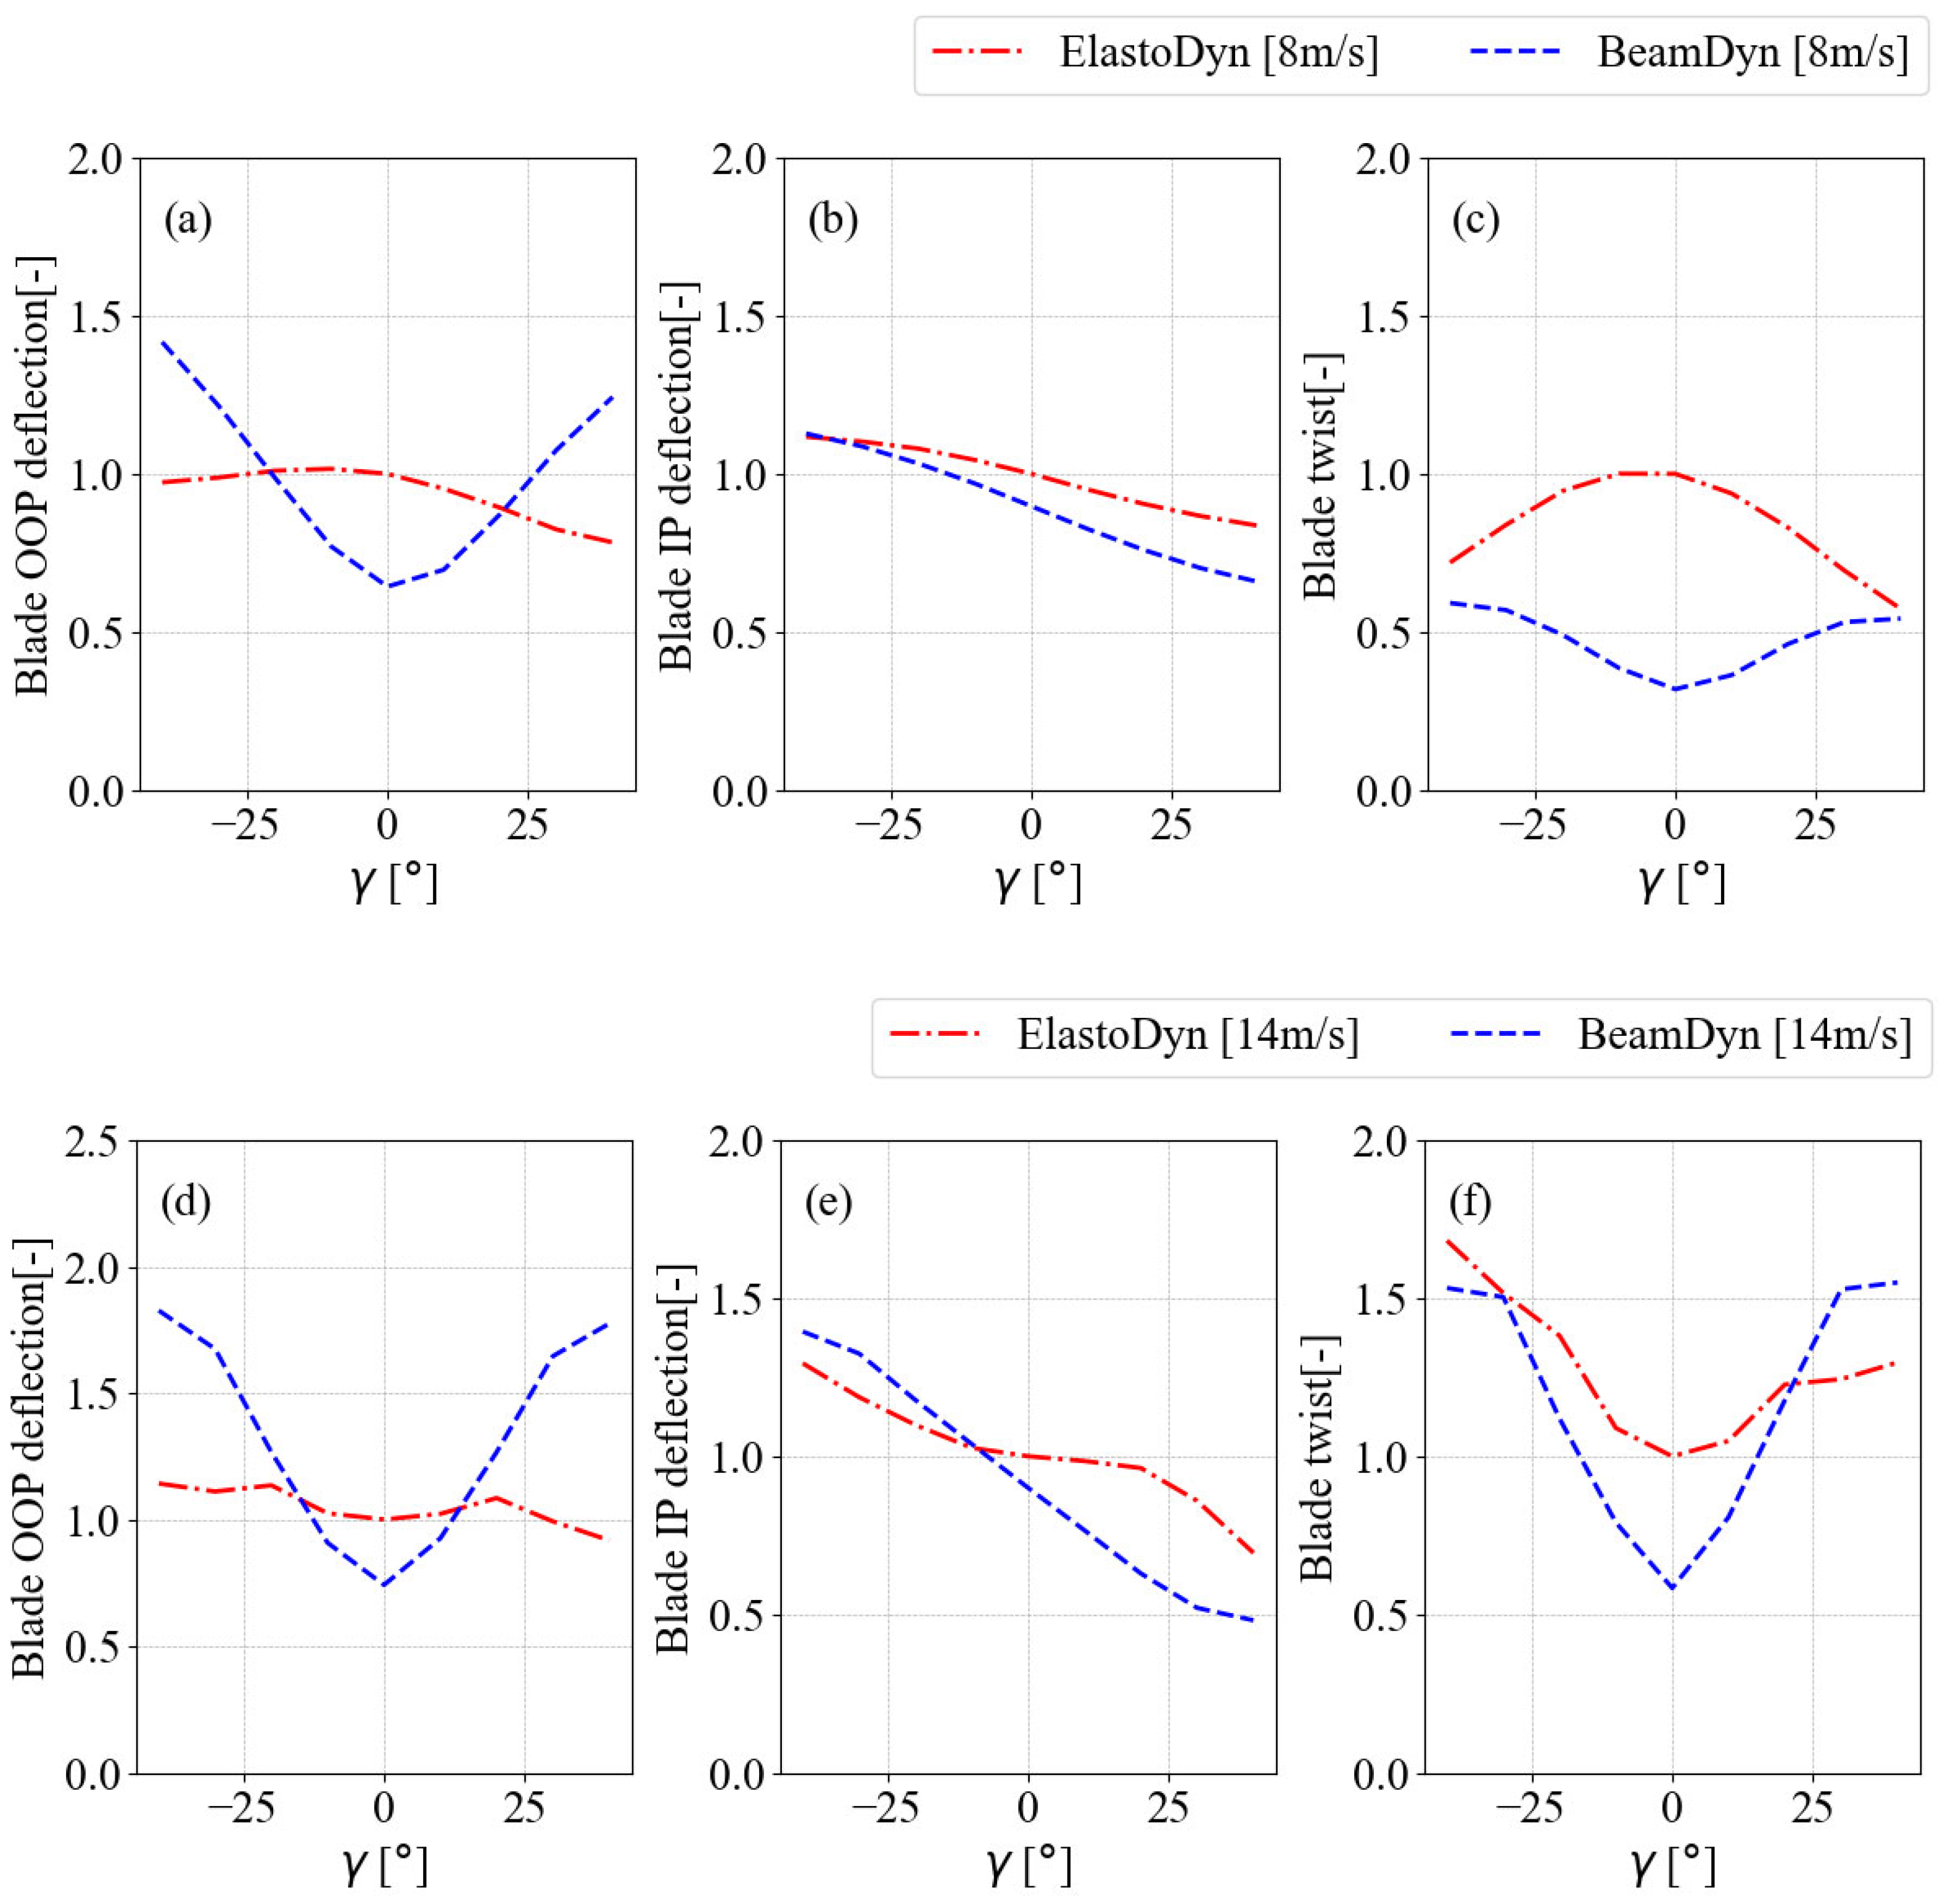
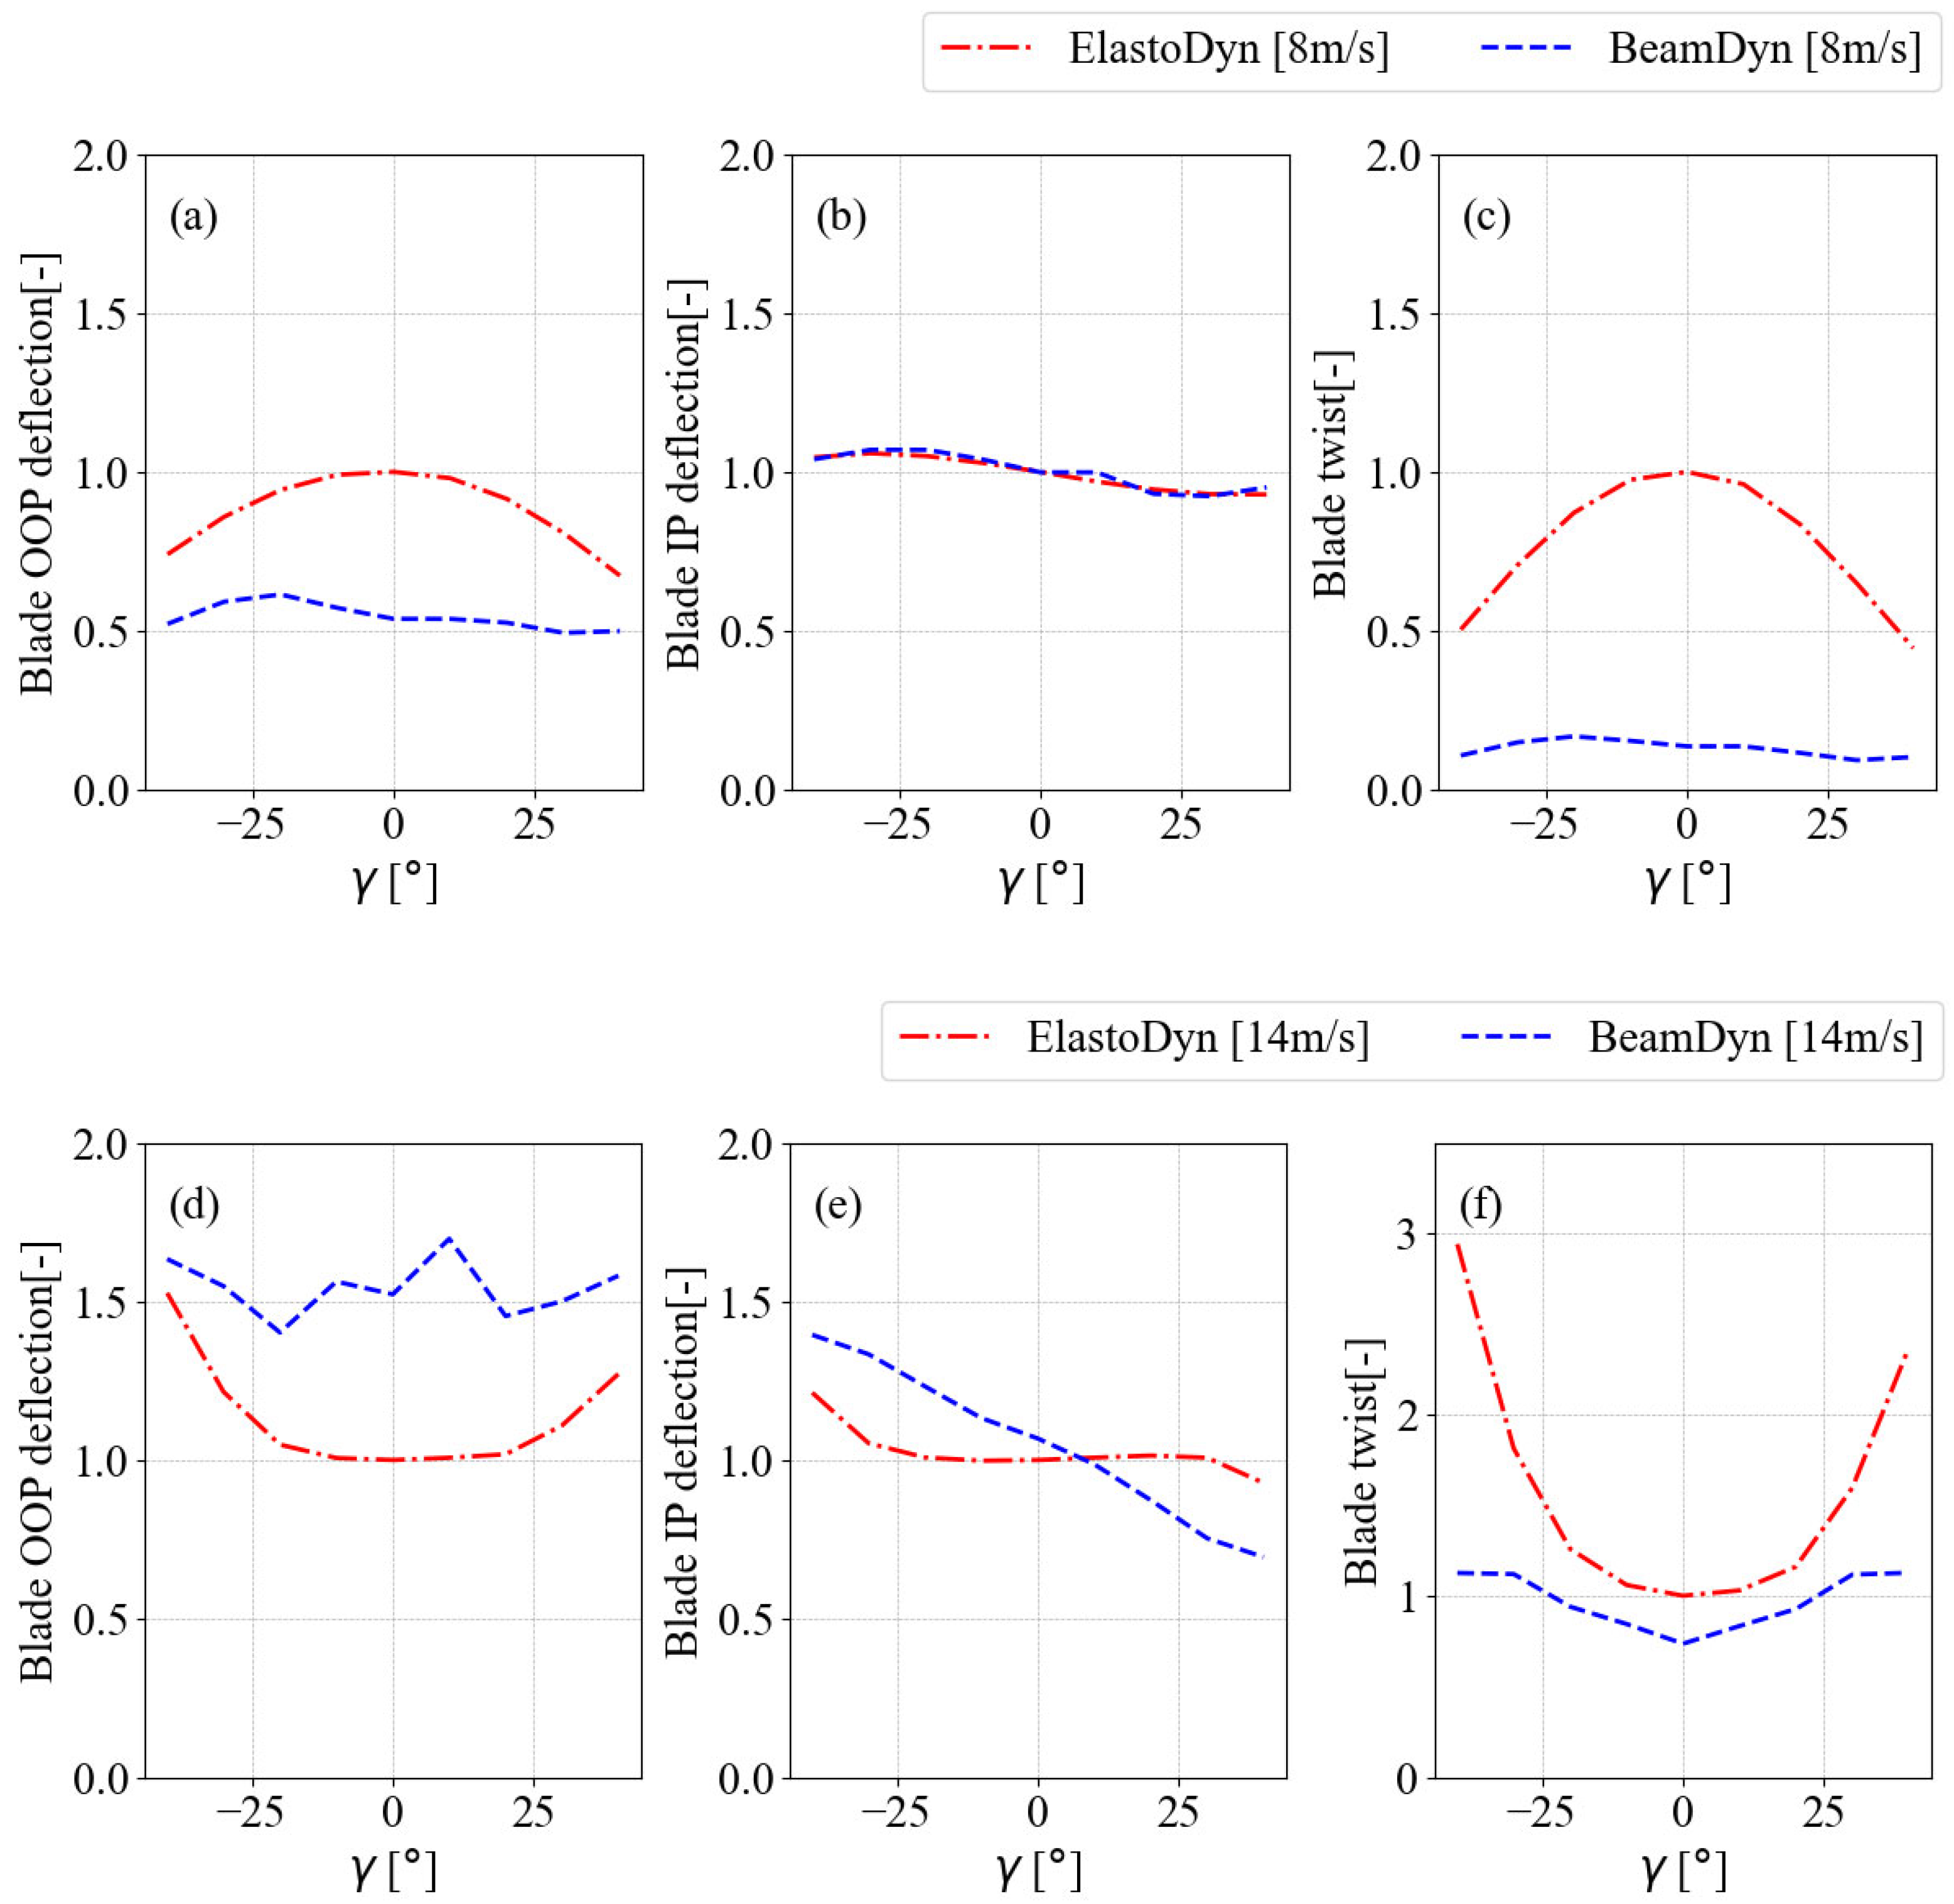
In terms of blade deflections, the blade experienced higher OOP tip deflection and twist under ElastoDyn for below-rated wind speeds, with comparable in-plane displacement to BeamDyn (
Figure 9a–c). For the above-rated wind speed (as shown in
Figure 9d–f), BeamDyn revealed a higher blade OOP tip displacement and lower tip twist than ElastoDyn, while the in-plane deflection remained similar between both methods. The LSS torque under the below-rated wind speed depicted similar DEL values across the
γ range of
in both the ElastoDyn and BeamDyn models. However, for BeamDyn, the fatigue load significantly decreased by approximately
, as the
γ increased in both the positive and negative directions, while ElastoDyn showed only a minor increase. For the above-rated wind speed, BeamDyn saw a slight increase in the DEL of LSS torque as a function of
γ, which then declined at
, as shown in
Figure 9.
The DEL of the LSS moment for the below-rated wind speed, shown in
Figure 8e, increased under negative
γ, reaching a maximum at
γ for the BeamDyn simulation. However, for the ElastoDyn simulation, the DEL of the LSS moment decreased within the
γ range of
to
. For positive
γ, the fatigue load in the BeamDyn simulation continued to decline, reaching a minimum at
γ , while in the ElastoDyn simulation, the fatigue load increased linearly up to
and then remained constant. A similar trend was observed for the above-rated wind speed, shown in
Figure 8f, where the fatigue load of the LSS moment followed comparable patterns. For BeamDyn, however, the DEL of the LSS moment increased for both positive and negative yaw misalignments. In the ElastoDyn simulation, the fatigue load slightly decreased within the
γ range of
to
and increased beyond this range. Additionally, the LSS experienced relatively lower fatigue loads for the LSS moment at the below-rated wind speed in BeamDyn compared to ElastoDyn. Conversely, at the above-rated wind speed, BeamDyn produced higher fatigue loads than ElastoDyn.
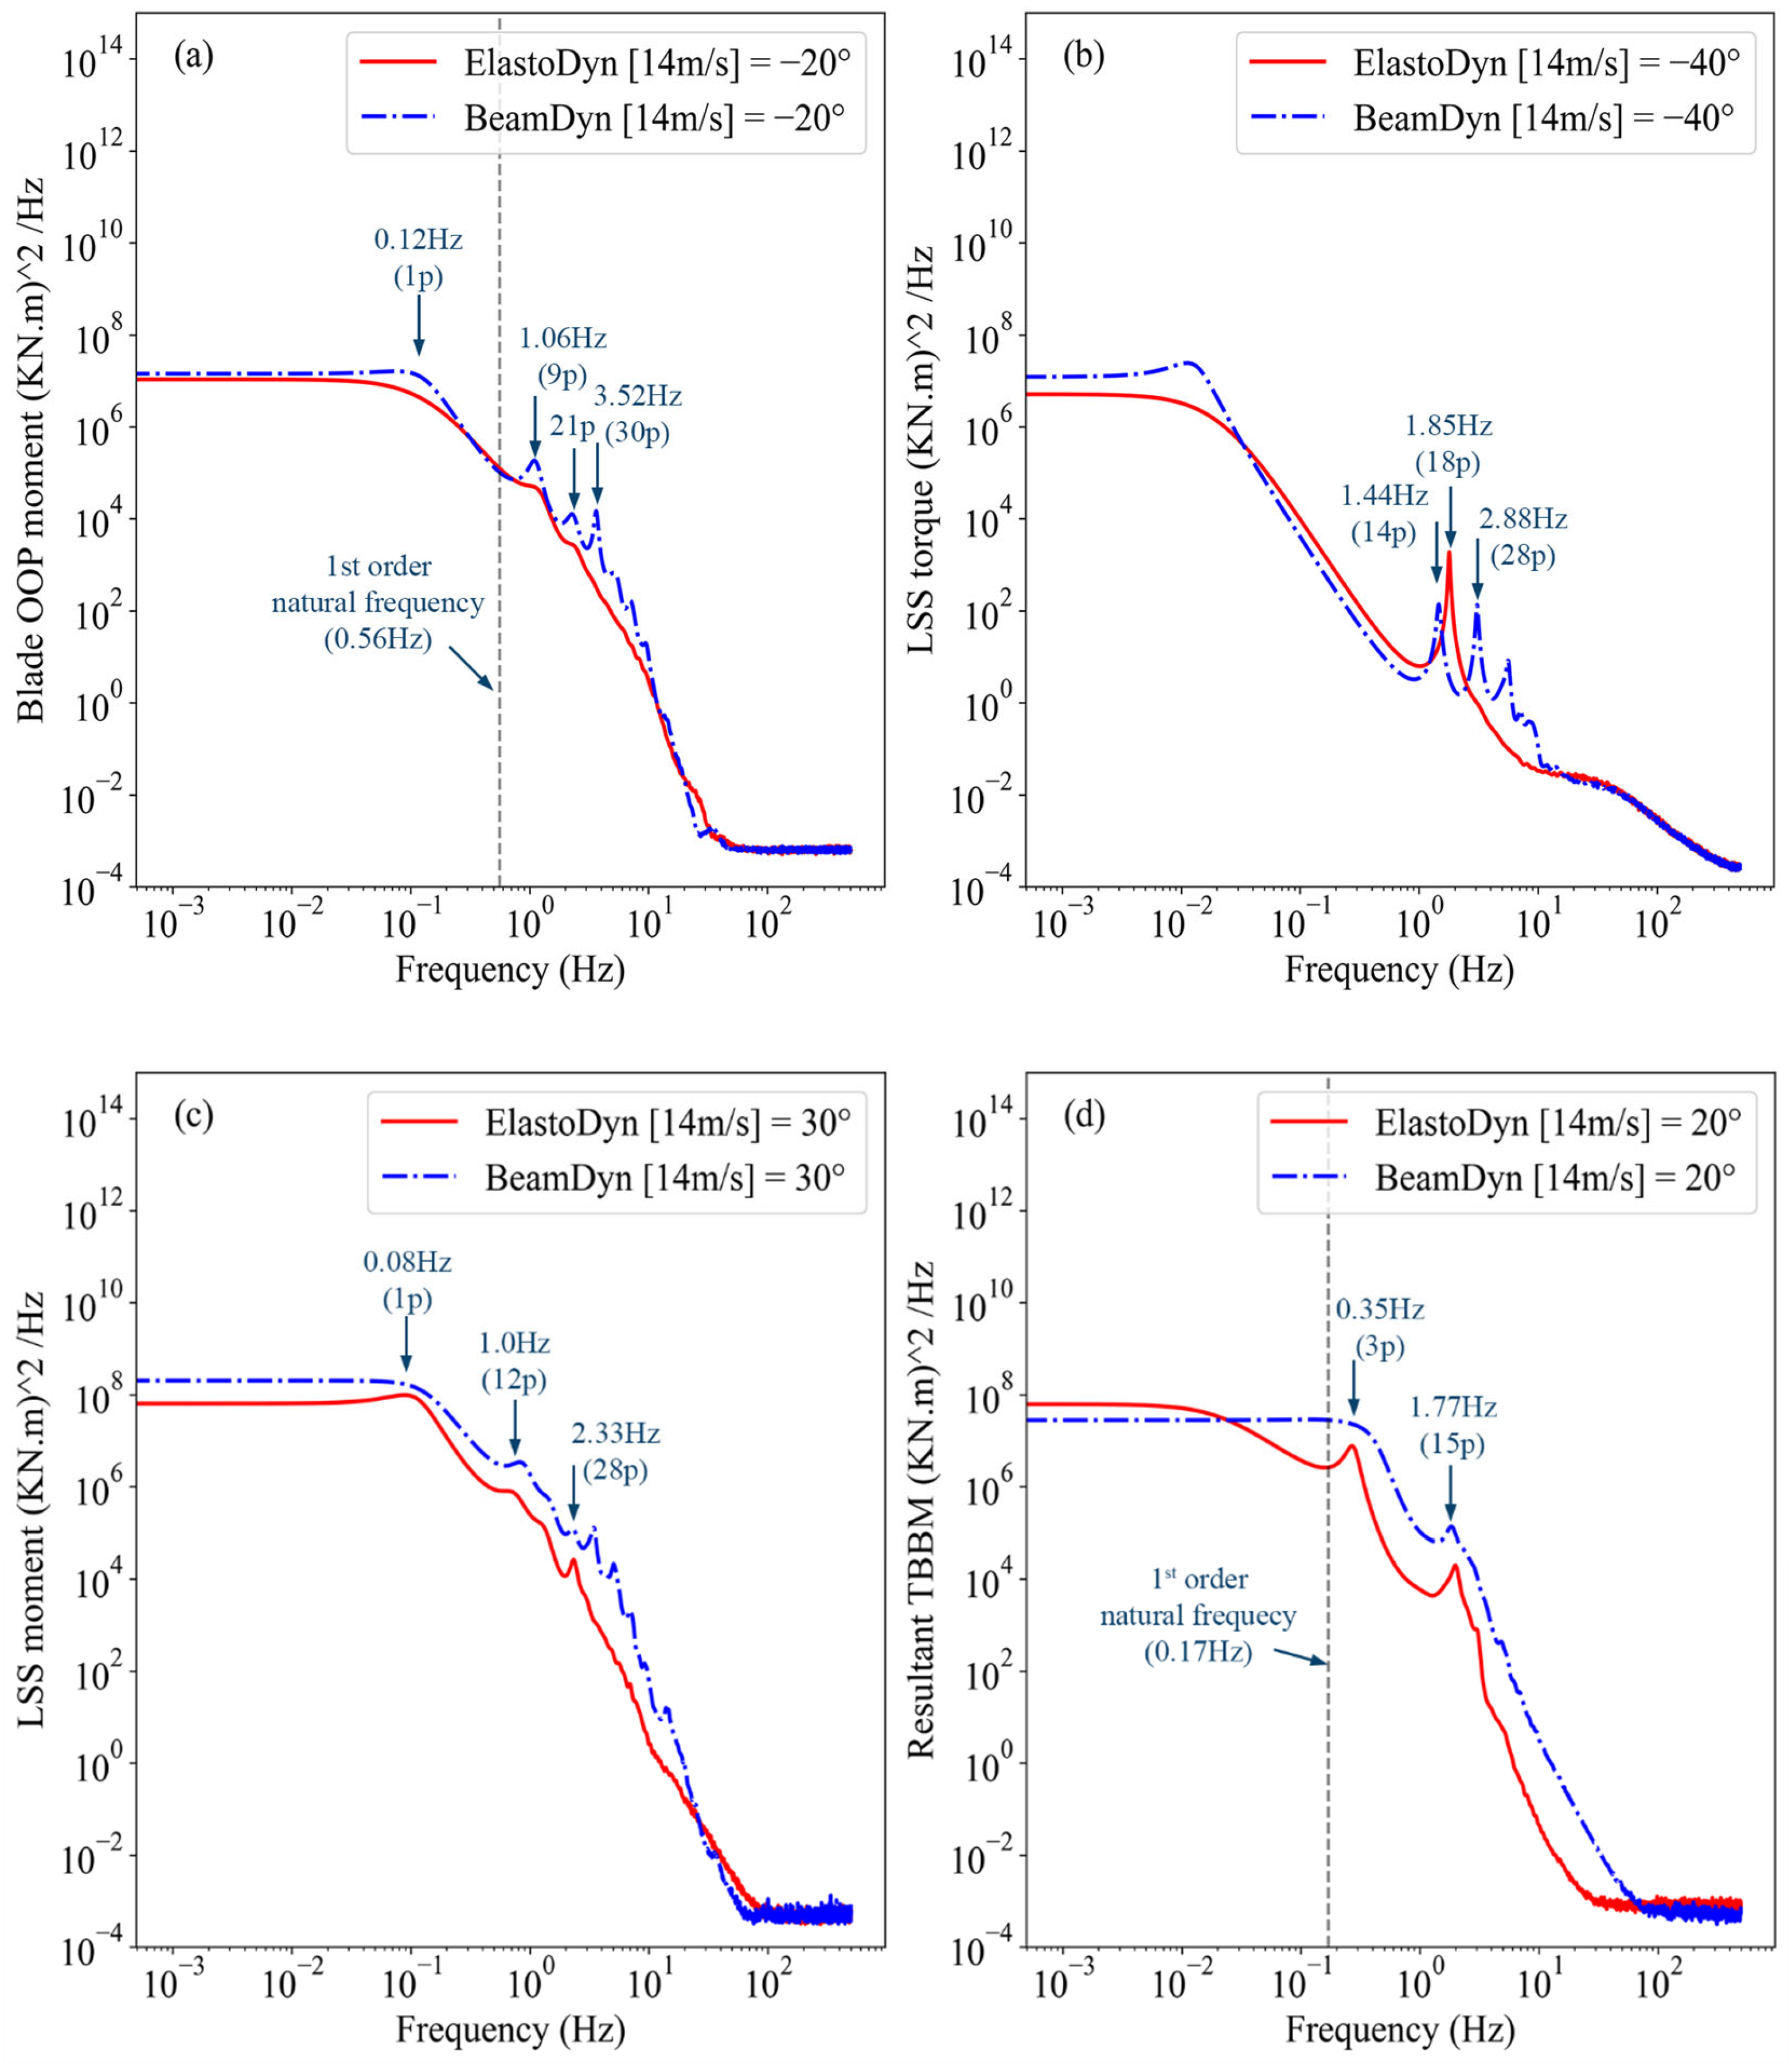
The form of PSD of the IEA 15 MW wind turbine model shown in
Figure 10 is similar to PSD of the NREL 5 MW wind turbine model components (
Figure 7) at two mean wind speeds 8 m/s and 14 m/s as a function of the yaw angle. The obtained results were achieved utilizing the BeamDyn and ElastoDyn modules. The blade OOP moment shows the magnitude of the dominant harmonic frequency components 1 p (0.12 Hz) was the largest and decreased in the order of 9 p (1.06 Hz), 21 p (2.47 Hz) and 30 p (3.52 Hz) for the case of BeamDyn at a mean wind speed of 14 m/s. However, the turbine blade did not resonate any distinct frequency peaks for the case of BeamDyn at
, and the first-order natural frequency (0.56 Hz) did not excite the blade, as shown in
Figure 10a.
Figure 10b shows the PSD of LSS torque response for a mean wind speed 14 m/s at
. The LSS torque of ElastoDyn resonated a single dominant harmonic frequency component 18 p (1.85 Hz) as the largest, and 14 p (1.44 Hz) and 28 p (2.88 Hz) for the case of BeamDyn, in which the multiple load frequencies cause higher fatigue damage, as shown in
Figure 8d.
Figure 10c,d compare the PSD of the LSS moment and resultant tower base moment of a mean wind speed 14 m/s for the case of ElastoDyn against BeamDyn at
. Both cases show dominant harmonic frequency components, with the magnitude of 1 p (0.08 Hz) being the largest, followed by 12 p (1.0 Hz), 28 p (2.33 Hz), etc., in decreasing order. The magnitude of the LSS moment power spectra is larger for the case of BeamDyn and contributes to the larger DEL of the LSS moment, as shown in
Figure 8d. Similarly,
Figure 10d compares the PSD of the resultant tower base moment at a mean wind speed of 14 m/s between BeamDyn and ElastoDyn at
. The tower base moment shows dominant harmonic frequency components at 3 p (0.35 Hz) and 15 p (1.77 Hz), with BeamDyn experiencing maximum power spectral resonance and causing a larger DEL. The first-order natural frequency (0.17 Hz) does not contribute to the increase in fatigue damage of tower base.
The aerodynamic response of the IEA 15 MW wind turbine model exhibits significant variations in fatigue damage between the above-rated and below-rated wind speeds. The ElastoDyn and BeamDyn models show a broadly similar trend for below-rated wind speeds, although their predictions slightly diverge with the increasing yaw angle. For above-rated wind speeds, the fatigue damage of critical wind turbine components in ElastoDyn and BeamDyn differs markedly as a function of the yaw angle. This discrepancy contributes to an increase in the blade size, driven by geometric nonlinearity and blade pre-bend and twist, which the Euler–Bernoulli beam theory, employed by ElastoDyn, is limited in capturing. The variation in fatigue loads of turbine components and blade deformation between ElastoDyn and BeamDyn arises from the effects of geometric nonlinearity.
It is worth noting that the effects of geometric nonlinearity in blades are less pronounced with reduced rotor thrust. As shown in
Figure 8, implementing yaw misalignment reduced the fatigue damage in turbine components for both the below-rated and above-rated wind speeds. However, yaw misalignment introduced aerodynamic imbalance, which caused asymmetric rotor loading across the swept area and significantly increased the fatigue damage to the low-speed shaft moment. This asymmetry in the aerodynamic load on the rotor was more pronounced at larger yaw offsets, further increasing the fatigue damage to the low-speed shaft. These phenomena can be explained by the difference in crossflow over the upper and lower halves from the hub center. Moreover, the blade in-plane deflection for both the below-rated and above-rated wind speeds showed that the deflection increased with the negative yaw offset and decreased linearly with the positive yaw offset, indicating that the negative yaw offset induced greater drag on the blade compared to the positive yaw offset. The IEA 15 MW reference wind turbine, with a blade length exceeding 100 m, exhibited similar blade out-of-plane tip deflection for the above-rated wind speed, due to the maintained constant rotor speed in the BeamDyn case. In contrast, the blade OOP deflection increased as the yaw offset deviated from the inflow angle, demonstrating that larger curved blades with pre-bend, made of nonlinear materials, limited the performance of the ElastoDyn case.
3.3. Comparison of Fatigue Load Between Two Wind Turbines
The results presented in the previous section reveal the influence of geometric nonlinearity on the fatigue loads of wind turbine blades. This section further explores and compares the fatigue loads of each wind turbine model for the case of BeamDyn. The DEL results of the NREL 5 MW and IEA 15 MW wind turbine models using BeamDyn are normalized with the respective DEL values from ElastoDyn for each yaw offset.
Figure 11 illustrates the DEL of the blade OOP moment, the LSS torque, the LSS moment, and the resultant tower base moment for the below-rated wind speed using BeamDyn, normalized against the corresponding
γ results from ElastoDyn. In
Figure 11a, the DEL of the blade OOP moment for the turbine models shows a reduction of approximately 12%, 3%, and 30% at zero
γ compared to the ElastoDyn results for the NREL 5 MW and IEA 15 MW models, respectively. However, the blade fatigue load of the NREL 5 MW model exceeds the DEL of ElastoDyn beyond
, rising by approximately 40% at
In contrast, the IEA 15 MW models remain below the DEL values of their respective OOP moments from ElastoDyn. The IEA 15 MW model exhibited a higher fatigue load magnitude for negative
γ compared to its positive counterparts.
Figure 11b shows the DEL of LSS torque, and the ElastoDyn case experienced higher fatigue loads compared to BeamDyn. The IEA 15 MW models demonstrated similar DEL magnitudes at smaller
γ, with significant reductions at larger
γ. However, the DEL of the NREL 5 MW model fluctuated across the change in
γ.
Figure 11c illustrates the DEL of the LSS moment, where the two wind turbines experienced similar values at
. For the NREL 5 MW model, the DEL rises for negative
γ, reaching a maximum increase of 50% at a
γ of −40°, with the lowest value observed at 10° and a slight increase of up to 10% at 40°. The DEL of LSS moment for the IEA 15 MW model decreases from negative to positive
γ.
Figure 11d illustrates the DEL of the tower base moment. An increase in
γ results in a decrease in the DEL of the tower base moment. The NREL 5 MW and IEA 15 MW models show increases of 48% and 25%, respectively, compared to their corresponding ElastoDyn fatigue loads. Although
γ reduce the tower base moment fatigue loads, the magnitude of the reduction varies among the selected wind turbine models.
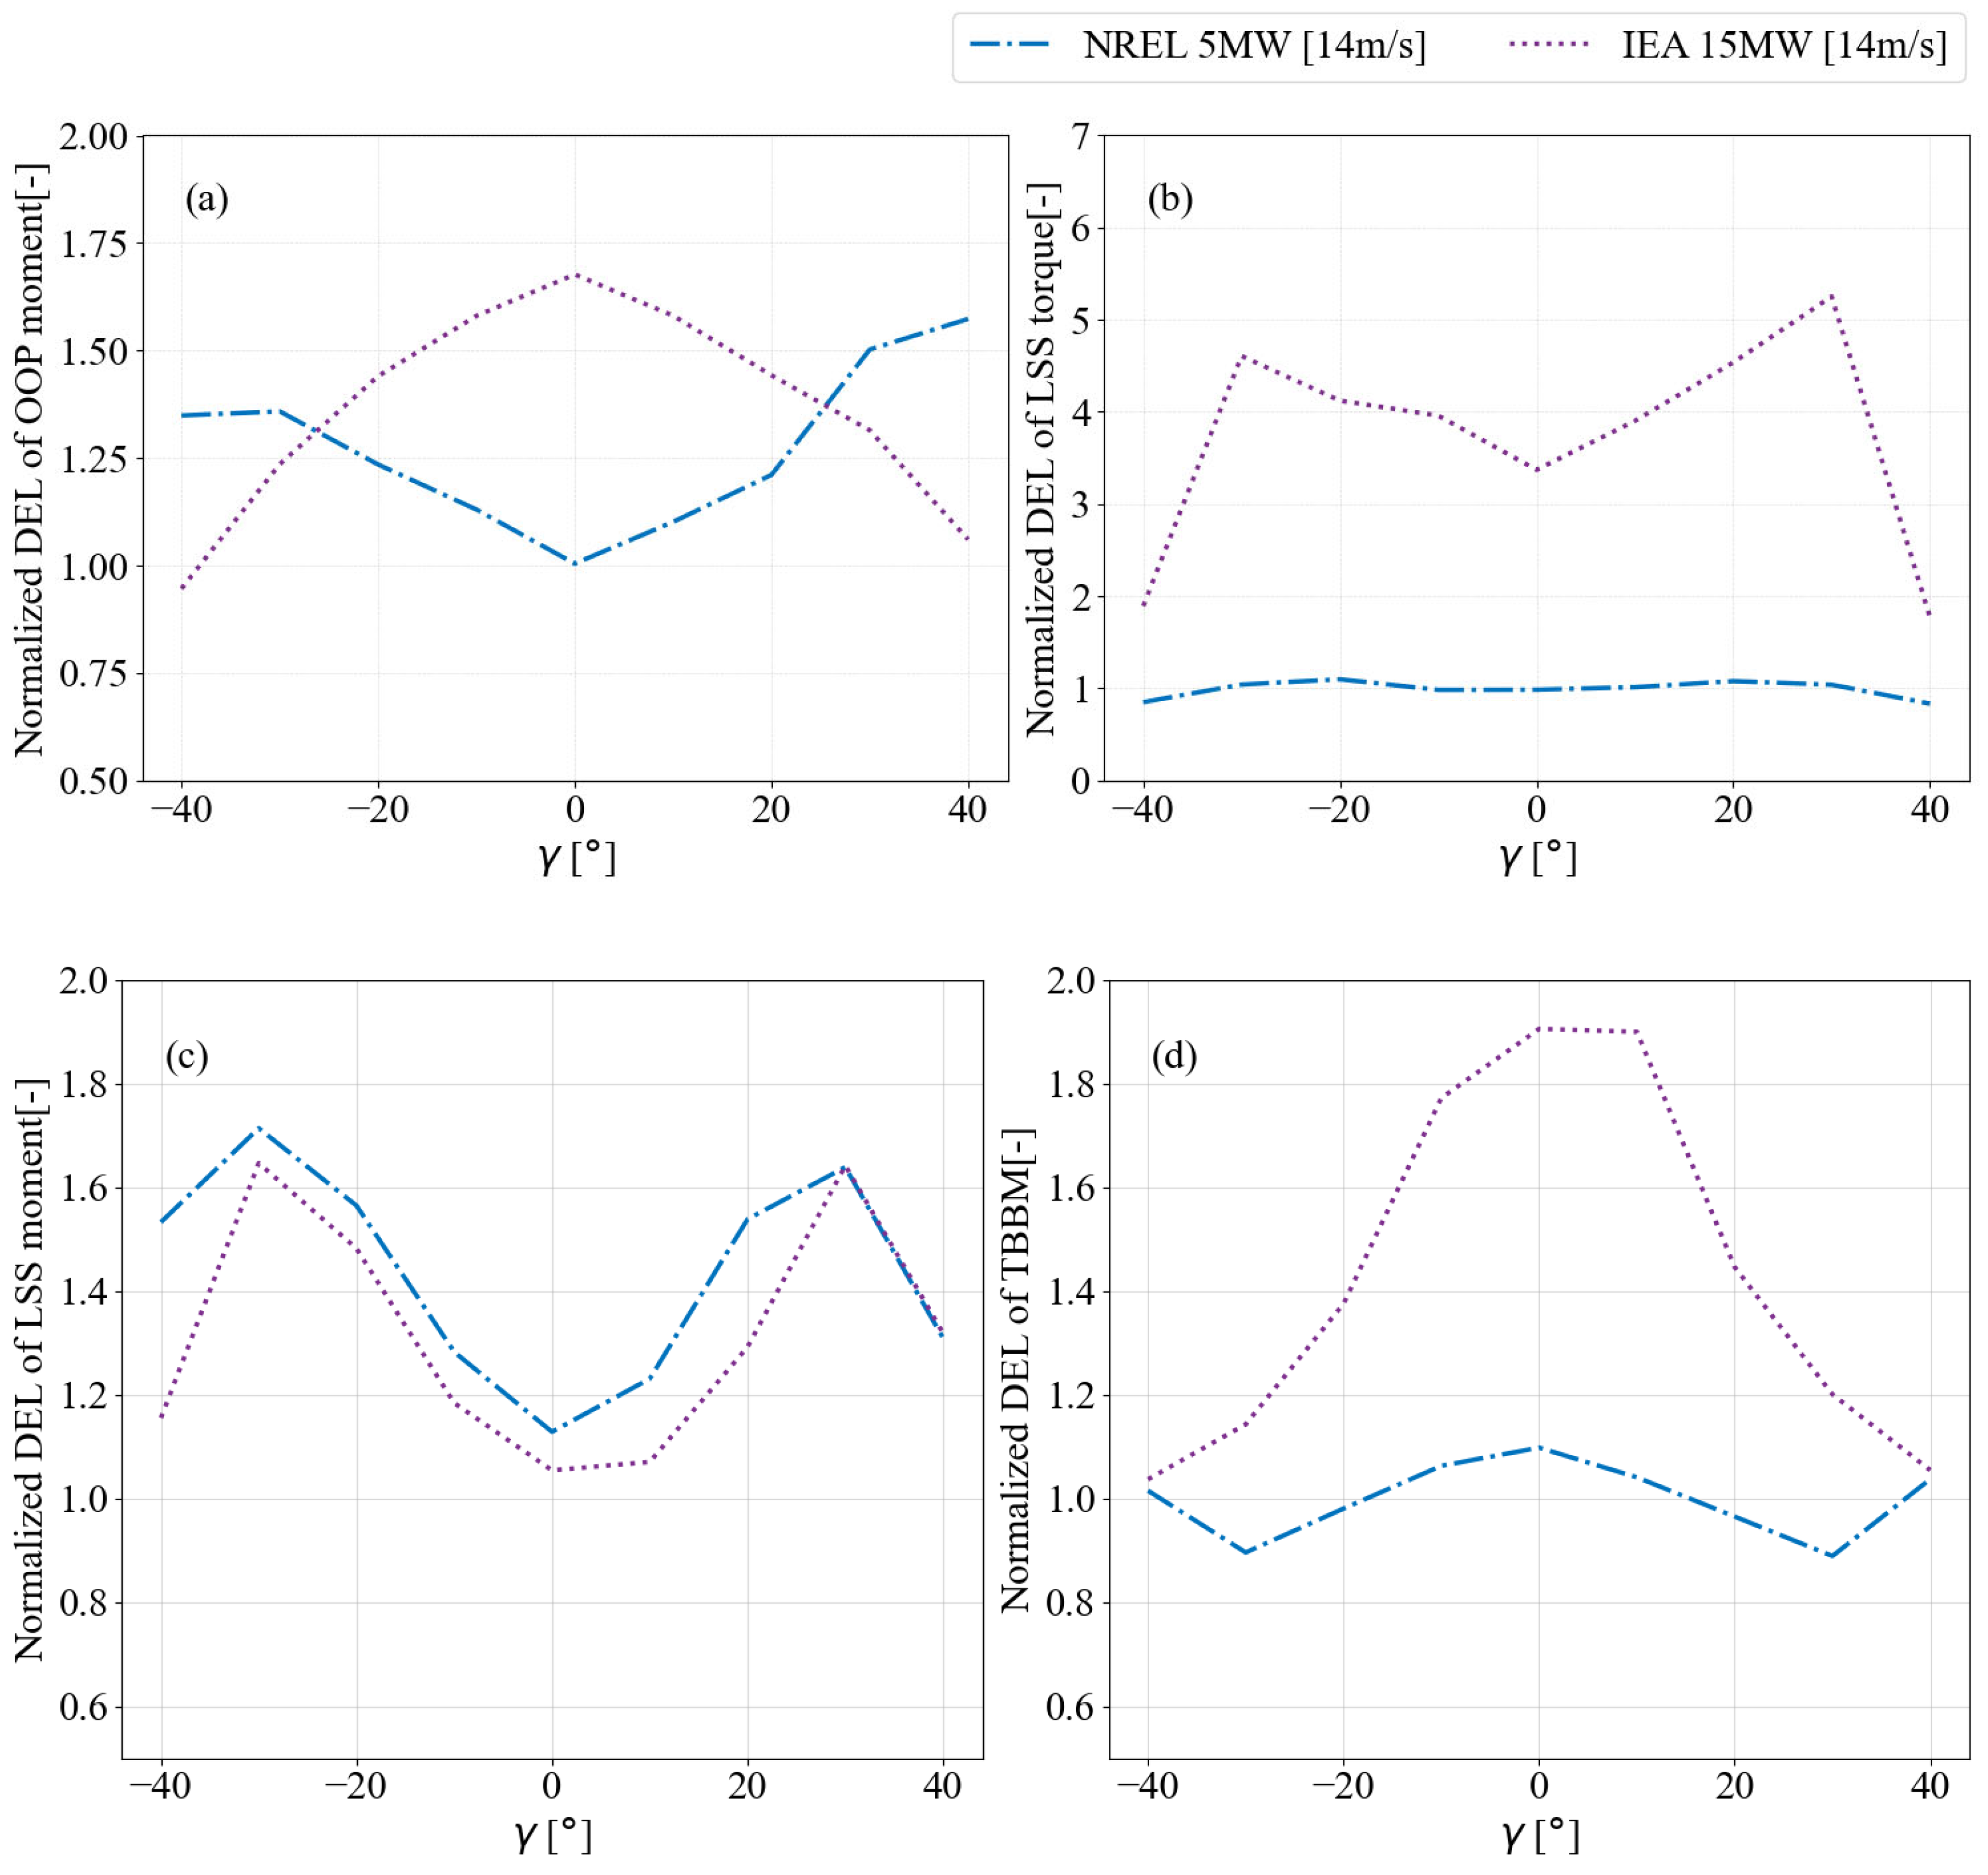
Figure 12 presents the DEL of the blade OOP moment, LSS torque, LSS moment, and resultant tower base moment for turbines operating above the rated wind speed. The results for BeamDyn simulations are normalized to their respective
γ results from ElastoDyn. The DEL of the blade OOP moment for the NREL 5 MW turbine increases as the
γ grows. On the other hand, the IEA 15 MW model exhibits a decrease, followed by a 68% increase at a
γ of zero compared to ElastoDyn. The fatigue load of the LSS torque, shown in
Figure 12b, indicates a significant increase for the IEA 15 MW turbine compared to the ElastoDyn results. The DEL rises with the
γ up to
and then declines.
Figure 12c illustrates the fatigue load of the LSS moment. Both the NREL 5 MW and IEA 15 MW turbine models display similar trends compared to ElastoDyn, with the DEL increasing as the
γ rises to
, peaking at approximately 62%, and then dropping at a
γ of 40°. The fatigue load of the tower base moment, presented in
Figure 12d, increases by 88% for the IEA 15 MW turbine compared to the ElastoDyn results. It then decreases linearly as the
γ moves in both positive and negative directions, reducing by approximately 88% at a
γ of
°. The NREL 5 MW model exhibits a similar trend to the IEA 15 MW model, although the changes in magnitude differ significantly. The fatigue load for the NREL 5 MW turbine is lower than ElastoDyn results within the
γ range of
to
.
The results indicate significant variations in fatigue load predictions between the GEBT and the Euler–Bernoulli beam theory for the analyzed wind turbine models. Specifically, the fatigue loads, expressed as DELs, for the blade OOP moment, LSS torque, and TBBM depicted substantial dependence on yaw offsets for both the NREL 5 MW and IEA 15 MW wind turbine models. The variation in DEL was less sensitive to the below-rated wind speed but saw a linear increase with larger yaw offsets. These differences are primarily attributed to limitations in the Euler–Bernoulli beam theory, as implemented in the ElastoDyn module. The theory struggles to accurately capture the aerodynamic loads on pre-bent geometrically nonlinear blades, particularly for larger wind turbine models. These limitations become more pronounced at above-rated wind speeds, where the DEL for the OOP moment increased by up to 70%, the LSS torque by a factor of five, and the TBBM by up to 90% for the IEA 15 MW model compared to predictions from ElastoDyn. The maximum DEL variation was observed at = 0°, showing the inadequacy of the Euler–Bernoulli beam theory in modeling the complex aerodynamic and structural interactions of large pre-twisted blades under such conditions.
4. Conclusions
This study emphasized significant variations in fatigue load predictions between the GEBT, as implemented in BeamDyn, and the Euler–Bernoulli beam theory, as utilized in the ElastoDyn module, for the NREL 5 MW and IEA 15 MW wind turbine models. The results demonstrate that the DELs for critical components, including the blade OOP moment, LSS torque, LSS moment, and TBBM, showed substantial dependence on the yaw offsets. Notably, the DEL variations were less pronounced at below-rated wind speeds but increased linearly with larger yaw offsets. At above-rated wind speeds, the limitations of the Euler–Bernoulli beam theory became particularly evident, with the DEL for the OOP moment rising by up to 70%, the LSS torque by a factor of five, and the TBBM by up to 90% for the IEA 15 MW model compared to the ElastoDyn predictions. The maximum DEL variation in the critical wind turbine components occurred for the above-rated wind speed at , underscoring the inadequacy of the Euler–Bernoulli beam theory in capturing the aerodynamic loads on pre-twisted geometrically nonlinear blades, especially for larger turbine models.
Additionally, the blade tip deformation for the NREL 5 MW model varied by approximately 60% with increasing yaw offsets, likely due to the geometric nonlinearity not adequately captured by ElastoDyn. For the IEA 15 MW model, the fatigue damage trends diverged significantly at above-rated wind speeds, with the DEL for the OOP moment and TBBM decreasing, while the LSS torque and LSS moment increased, as the yaw offset rose. These discrepancies show the critical role of geometric nonlinearity and blade pre-bend, which the Euler–Bernoulli beam theory fails to model effectively.
The findings of this study have significant implications for wind turbine components’ design and analysis. The limitations of the Euler–Bernoulli beam theory, as implemented in ElastoDyn, suggest that reliance on this model may lead to inaccurate fatigue load predictions, potentially compromising the structural integrity and longevity of large-scale wind turbines. By contrast, the GEBT approach, as used in BeamDyn, offers a more robust framework for capturing the complex aerodynamic and structural interactions of pre-bend, nonlinear blades. These insights underscore the need for advanced beam theories in the design and analysis of next-generation wind turbines, particularly as blade sizes increase to meet growing energy demands. Adopting more sophisticated models like GEBT can enhance fatigue load predictions, improve turbine reliability, and inform the development of optimized blade designs that account for geometric nonlinearity and yaw-induced effects. This study contributes to the advancement of wind turbine components’ aerodynamic resonance, illustrating the importance of selecting appropriate structural models to ensure accurate fatigue analysis and robust turbine performance under varying operational conditions.
