1. Introduction
The global power sector is undergoing a fundamental transition toward carbon neutrality. According to the International Energy Agency (IEA), annual additions of wind and solar capacity reached a record 295 GW in 2022, with China alone contributing more than half of this growth [
1]. However, the inherent variability and forecast errors associated with these resources pose unprecedented challenges to system balancing, transmission planning, and market clearing [
2,
3,
4,
5,
6,
7]. Underestimating the accommodation margin leads to curtailment and stranded assets, whereas over-estimating it may trigger reserve shortages and costly real-time redispatch [
8,
9,
10]. Consequently, the accurate and rapid quantification of renewable energy accommodation capacity under high-dimensional uncertainty has emerged as a critical challenge for researchers and system operators alike.
The analysis methods for renewable energy accommodation capacity can be divided into deterministic methods and uncertain methods. The deterministic method provides the maximum renewable energy that a system can consume during low valley periods through extreme scenario analysis. The uncertainty method calculates the maximum renewable energy that a system can absorb by considering the uncertainty of renewable energy. At present, research into the accommodation capacity of renewable energy mainly focuses on the following aspects: optimizing constraints and evaluating the level of renewable energy generation [
11]; using digital simulation methods to calculate the accommodation capacity of renewable energy [
12,
13]; and evaluating the level of power grid accommodation by utilizing the size of the system’s peak shaving capacity [
14,
15]. Many researchers have conducted research into the assessment of renewable energy accommodation capacity. The study in [
16] comprehensively considered peak regulation capability and static safety constraints and evaluated the renewable energy accommodation capacity. The study in [
17] proposed a renewable energy accommodation capacity evaluation model considering the reliability of wind and solar grid-connected power systems using the Monte Carlo method. The study in [
18] quantitatively analyzed the flexibility potential of retrofitting thermal power generation units in enhancing renewable energy accommodation capacity through coupling integration and optimized scheduling. The study in [
19] was based on time series production simulation methods and established an adaptive calculation model with the optimization objective of maximizing the capacity of renewable energy. The research in [
20] was based on the principle of time series simulation and established an optimal model for studying the annual renewable energy capacity of cross-regional power grids. Although substantial research has been conducted on renewable energy accommodation, many existing studies simplify the problem by focusing on one or two primary driving factors, such as wind/solar resource variability, grid transmission capacity, or load demand fluctuations [
21,
22,
23], often neglecting the coupling effects of multiple uncertainties. When planners must simultaneously consider resource fluctuations, demand growth, network disruptions, and constantly changing flexibility resources, this simplification becomes increasingly untenable.
In view of the above problems, this paper proposes an adaptive renewable power accommodation assessment framework for high-dimensional uncertain environments, which has three core contributions: first, the response surface methodology (RSM) is introduced into renewable energy accommodation modeling, and the closed polynomial is used to explicitly describe multifactor interactions such as resource hours, load, installed capacity, and transmission limit, to achieve millisecond-level rapid assessment. The second is to propose a lasso-regularized RSM variant, which automatically screens out redundant high-order interaction terms through an L1 penalty, and retains interpretability while suppressing overfitting, which is suitable for planning scenarios with limited samples. The third is to construct a Bayesian kernel density expansion and give the complete posterior distribution and confidence interval of rea under small-sample conditions, to realize risk quantification and decision support.
The case study takes the actual data of a renewable-resource-rich power grid in Northwest China in 2019 as an example to verify the effectiveness of the proposed framework.
2. Methodology
2.1. Model
2.1.1. Objective Function
Taking into account the constraints of power balance, system backup, and grid transmission capacity in the actual operation of the power system, a mathematical optimization model is established and optimized to obtain the output results of renewable energy and conventional power sources, providing basic data for the analysis of the impact of accommodation capacity. The optimization objective adopted in this article is to maximize the consumption of renewable energy within the optimization period, and the objective function is:
where
T is the total length of dispatching time.
t is the simulation time step.
N is the total number of aggregated power grids.
n refers to a certain aggregate power grid.
is the solar power output of aggregate grid
n in period
t, and
is the wind power output of aggregate grid
n in period
t.
2.1.2. Constraints
(1) Regional load balancing constraints:
where
denotes the transmission power of the
i-th transmission line during time period
t.
denotes the aggregate output of all conventional generating units within aggregated grid
n of the system during time period
t.
(2) Renewable generation power output constraints:
where
denotes the photovoltaic (PV) time series output of aggregated grid
n at time
t given a fixed installed capacity.
denotes the wind power time series output of aggregated grid n at time t given a fixed installed capacity.
(3) Inter-regional transmission capacity constraints:
where
denotes the upper transmission capacity limit of the
i-th transmission line, and
denotes its lower transmission capacity limit. The reference direction for current is defined as follows: current flowing into the system area is considered positive, and current flowing out of the system area is considered negative.
(4) Generator ramping rate constraints:
where
denotes the ramp-up rate of the
j-th generating unit, and
denotes its ramp-down rate.
(5) Spinning reserve constraints:
where
denotes the maximum technical output limit of the
j-th generating unit, and
denotes the total rotational reserve capacity required by the system during time period
t.
2.2. Response Surface Model
The key factors influencing renewable energy accommodation are fourfold: resource hours, power load, installed capacity, and line maintenance. These correspond to four random variables (X
1,X
2,X
3,X
4) in the response surface function, expressed as follows:
where
denotes the vector of undetermined coefficients. The solution of the response surface function is therefore reduced to determining these coefficients in Equation (6), achieved through application of the least squares method.
For n experimental observations:
The residual for the
i-th observation is:
Least squares optimization:
The coefficients are estimated by minimizing the sum of squared residuals:
2.3. Adaptive Calculation Strategy
2.3.1. LASSO Regression Method
The high-dimensional uncertainty in renewable energy capacity (such as resource variability, load demand, installed capacity, and grid maintenance) exponentially increases the sample demand, resulting in data overfitting. In order to solve this problem, LASSO regression [
24], an L1 regularization method, is used in this paper, which shrinks the insignificant coefficient to zero while retaining all the input characteristics. Based on the influence characteristics of multiple uncertain factors on the renewable energy accommodation capacity, a renewable energy accommodation capacity model suitable for multidimensional space theory is obtained by using LASSO regression.
where
is the regularization term, and
is the regularization parameter.
The parameters of the target function are determined by minimizing the loss function using the gradient descent method.
where
is the influencing factor, and
is the utilization rate of renewable energy.
When there is sufficient historical data, the relationship between factors can be determined. Therefore, the least squares fitting method is adopted, and the cftool command of MATLAB R2018b is used to fit the function, so that the residual error is 0, the average value of the fitting value is equal to the average value of the original data, and the sum of squares of errors is minimized. A three-dimensional model between the three variables of installed capacity, power load and resource hours is then constructed, and the multidimensional renewable energy capacity model is characterized using color dimensions.
The functional relationship between factors is obtained from the above formula:
2.3.2. Probability Density Function Method
In the case of a sparse sample size, the Bayesian estimation method is used to determine the probability density function of model parameters, and a multidimensional factor renewable energy accommodation capacity model is constructed to obtain the confidence interval of each factor change, which can realize the rapid calculation of the change range of renewable energy accommodation capacity under the influence of multiple factors.
Bayesian estimation is based on prior knowledge and samples of parameters [
25]. Bayesian estimation deduces the posterior probability (the conditional probability of an event after considering relevant evidence or data) into two prior probabilities: the prior probability (the probability of uncertainty of an event before considering relevant evidence or data) and the likelihood function (derived from the probability model). Because Bayes’ formula can make all parameters participate in decision-making, which meets the requirements of the multifactor renewable energy accommodation model and has a high convergence speed, it is selected as the probability distribution model.
First, the a priori probability is obtained using category probability.
The posterior probability is obtained from the joint distribution using the Bayesian formula.
The Bayesian estimation is obtained by using the Bayesian estimation formula.
The functional relationship is obtained from the above formula.
where
,
,
,
,
,
, and
.
3. Case Study
This study selected a region abundant in renewable energy resources in Northwest China as a case study. The region possesses significant renewable generation capacity, which can be transmitted to other areas via dedicated transmission lines.
3.1. Initial Conditions
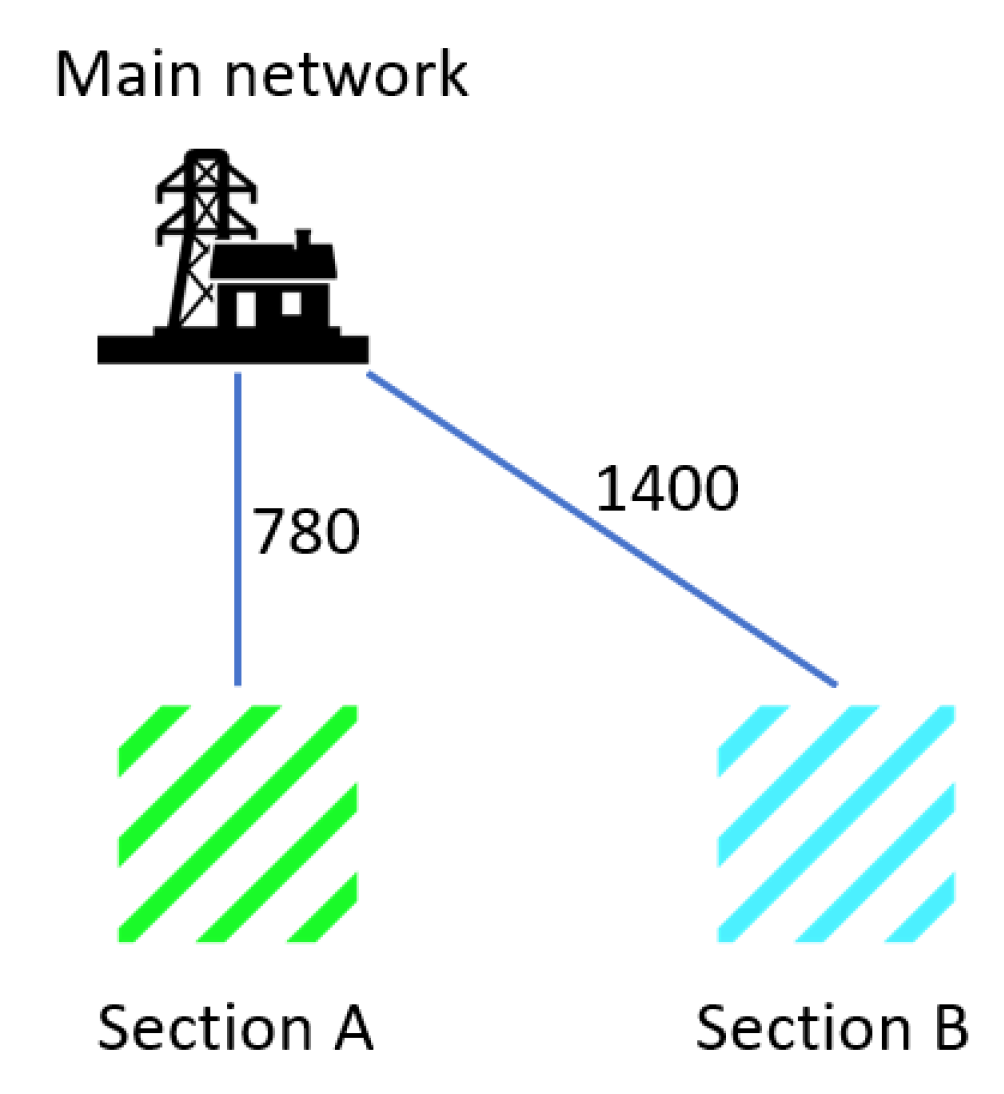
In the selected region for the year 2019, a total of two renewable energy transmission sections were identified, designated as section A and section B, as illustrated in
Figure 1. The transmission limits between the main network and sections A and B were 780 MW and 1400 MW, respectively, with a nodal resolution of 15 min.
The regional power grid in 2019 was taken as a case for calculation and analysis, and the boundary conditions were based on the actual data of the power grid in that year, as shown in
Table 1:
3.2. Results and Analysis
The renewable resource endowment of the region has a marked impact on its ability to absorb renewable energy. Inter-regional differences in renewable resource endowment are chiefly reflected in the maximum utilization hours of renewables. Accounting for annual resource variability, the study adopted a ±10% range around the base-case utilization hours.
Power load—also termed “electricity demand”—is the sum of the electric power drawn at a given moment by all users’ equipment from the power system. As a key component of the power system, the load, acting as the energy consumer, strongly influences system analysis, design, and control. Considering the overall upward trend and inherent fluctuations of annual demand, a variation interval from −5% to +10% of the base-case load was used.
The installed capacity of renewable energy has a significant impact on the system’s ability to absorb renewable generation. With “dual-carbon” targets in place, the region is expected to leverage its advantages to rapidly expand renewables, so capacity was analyzed over a range from −50% to +100% of the base-case value.
Maintenance of transmission section lines alters transmission corridors and thus directly influences renewable energy accommodation. Allowing for the effect of such maintenance on section limits and taking both active power and energy constraints into account, the transmission section limit was varied between 60 MW and 600 MW.
3.2.1. Validation of Renewable Energy Accommodation Model Based on RSM
The power grid data of this region in 2019 was taken as an example for analysis. Firstly, the single-factor change data calculated by the renewable energy accommodation model were counted. The data were then normalized and reconstructed to obtain the data matrix of wind resources, wind power installation, power load, transmission section limit, and renewable energy utilization rate during section A maintenance. The above model was used to fit the maintenance accommodation model of section A, and the data shown in
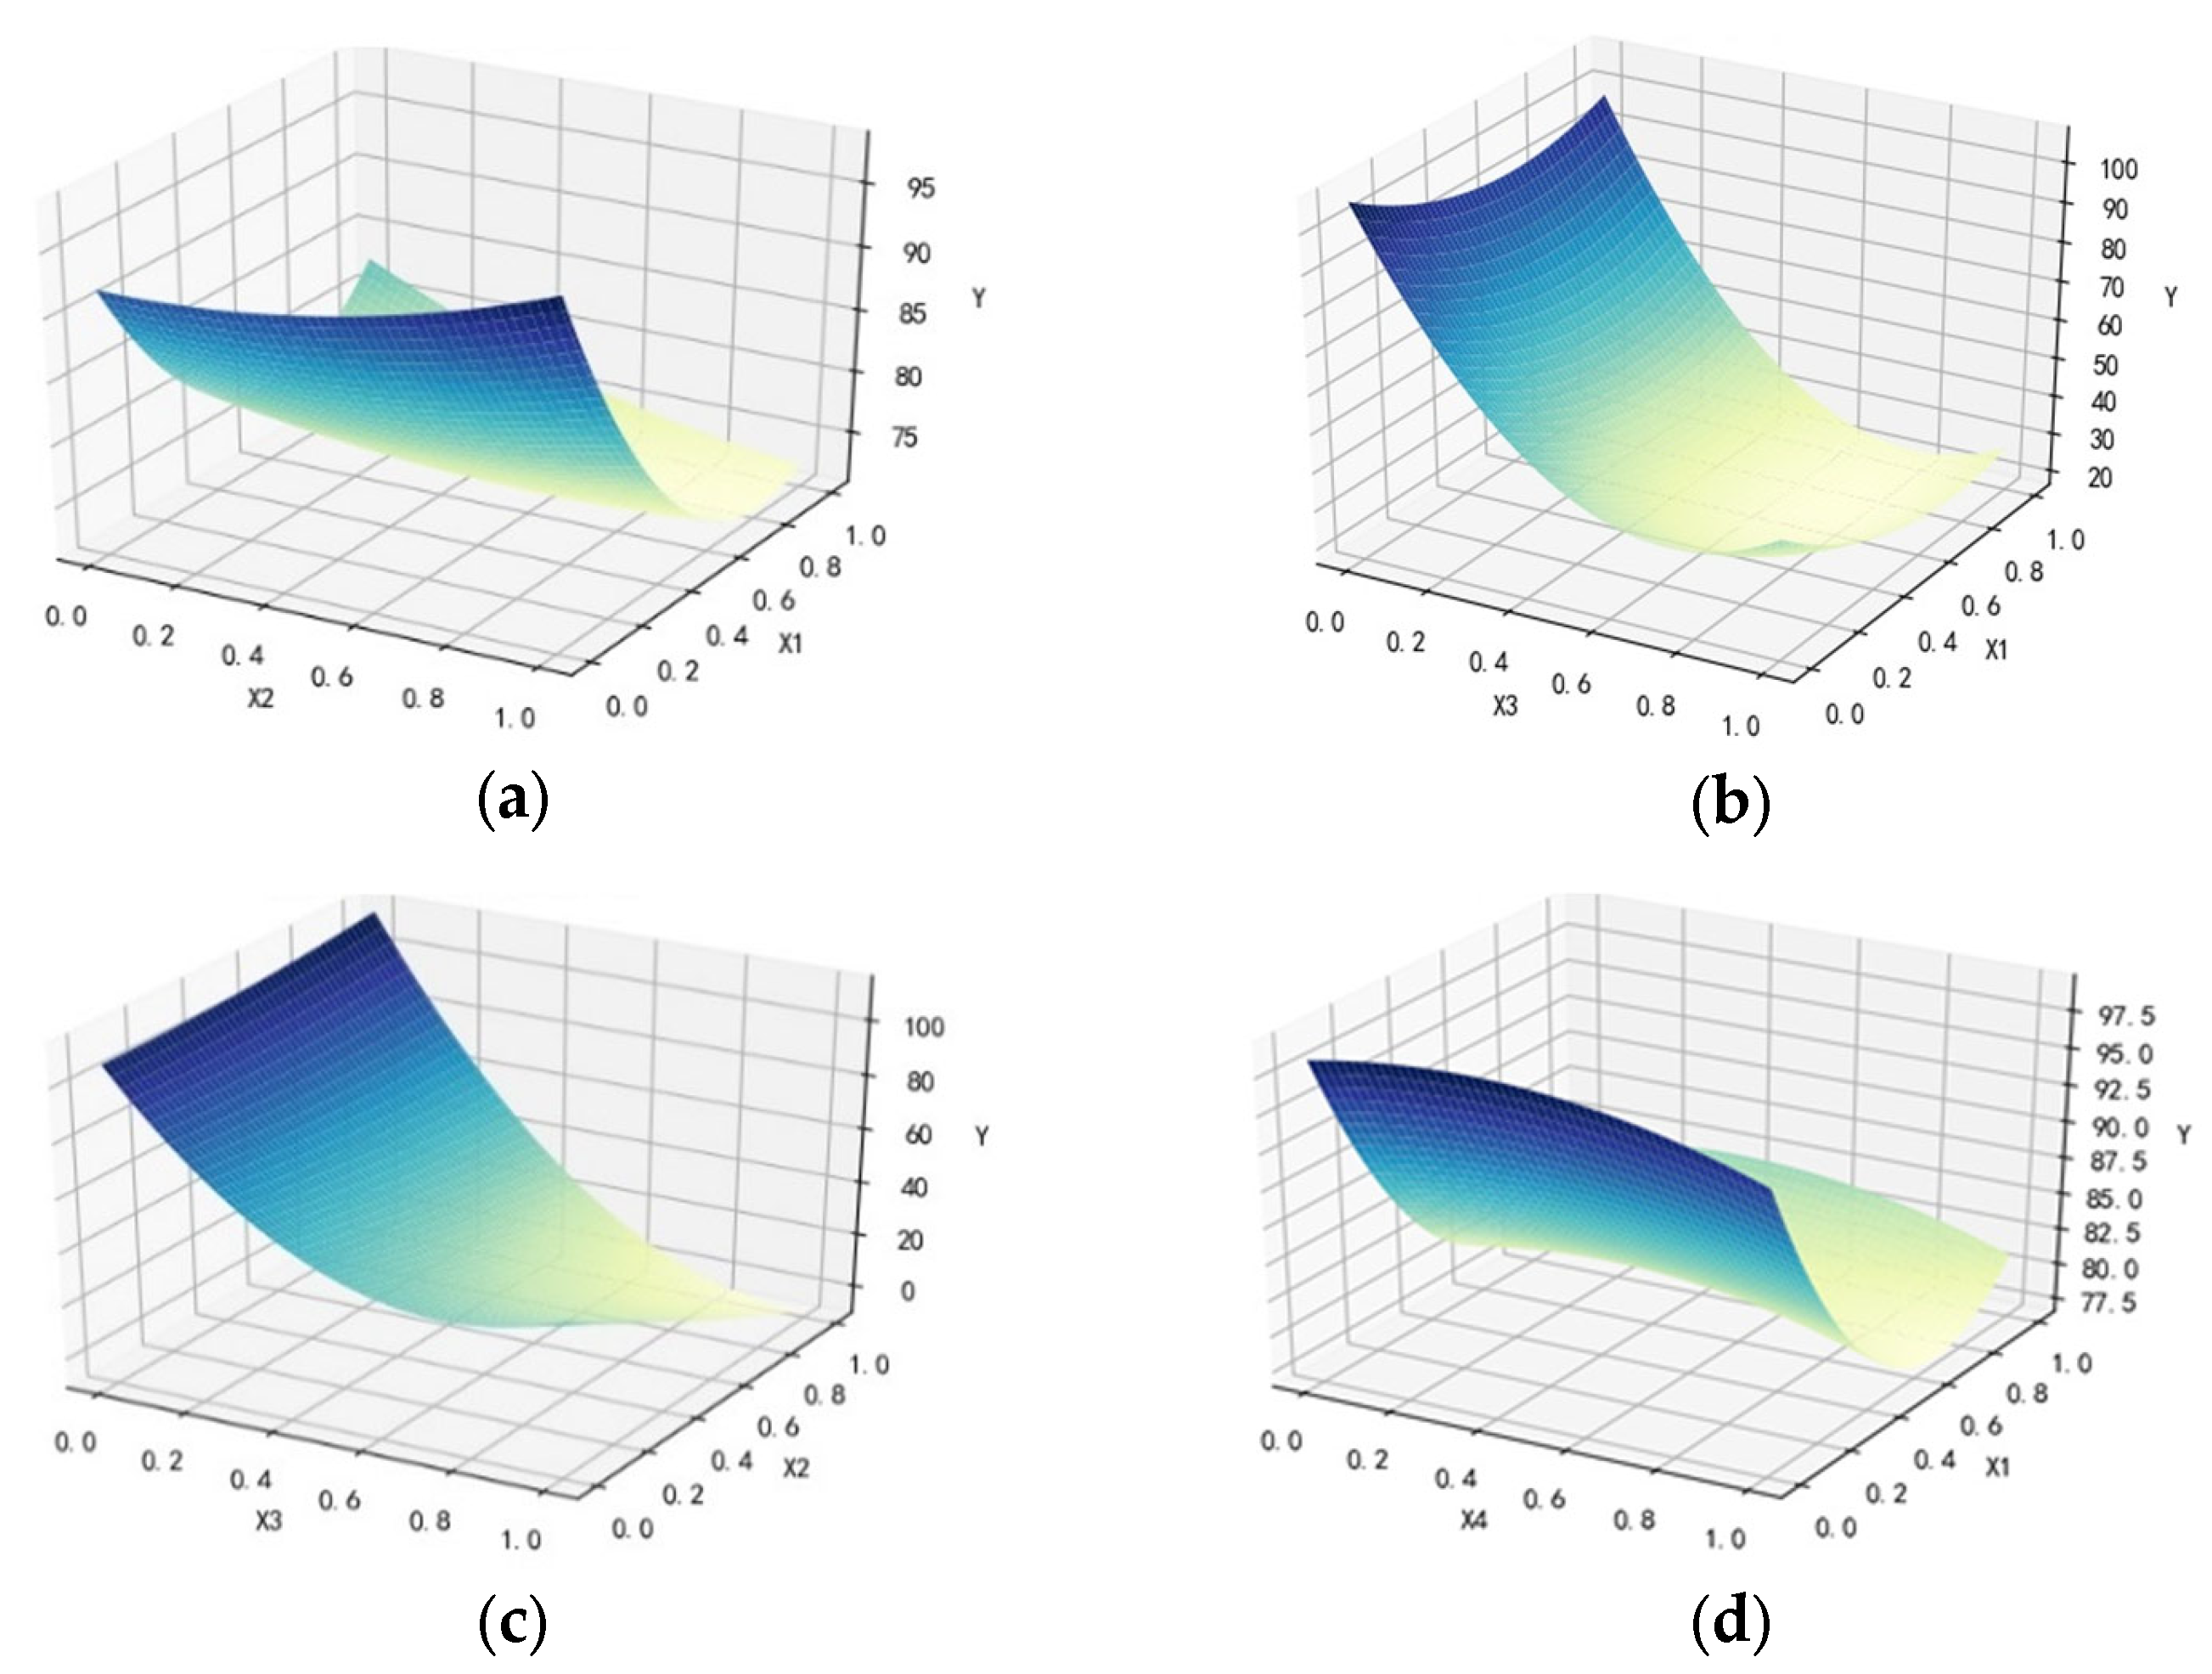
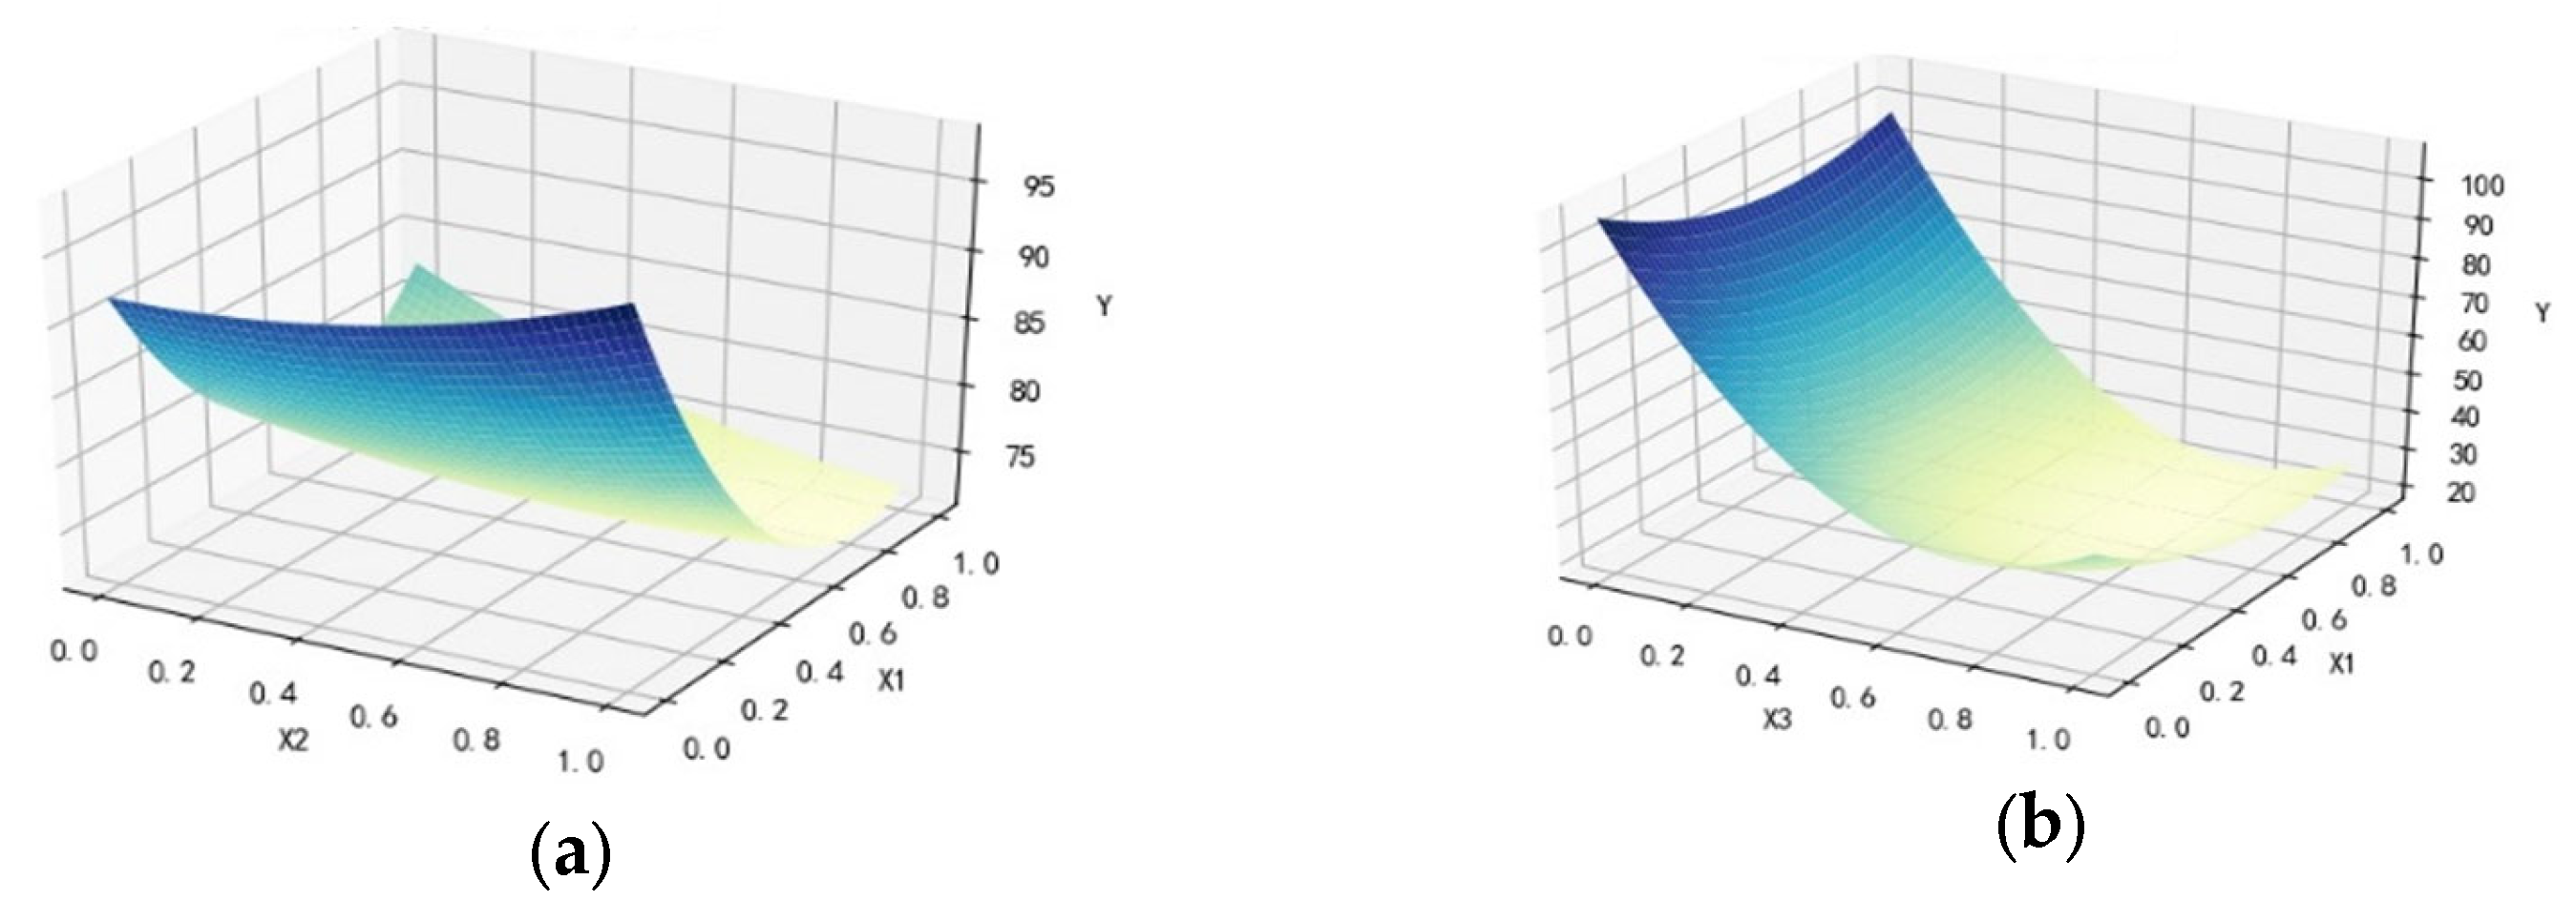
Table 2 were calculated. The two-factor surface is shown in
Figure 2. The results show that under the conditions of an increase in wind resources (−10%, 10%), an increase in power load (−5%, 10%), a change in installed capacity (0.5, 2) and a decrease in section quota (60, 600) MW, the renewable energy accommodation range is (83.90%, 100%), and the joint change of installation and maintenance had the greatest impact on accommodation.
- 2.
Impact analysis of section B maintenance
The above model was also used to fit the maintenance absorption model of section B, and the data shown in
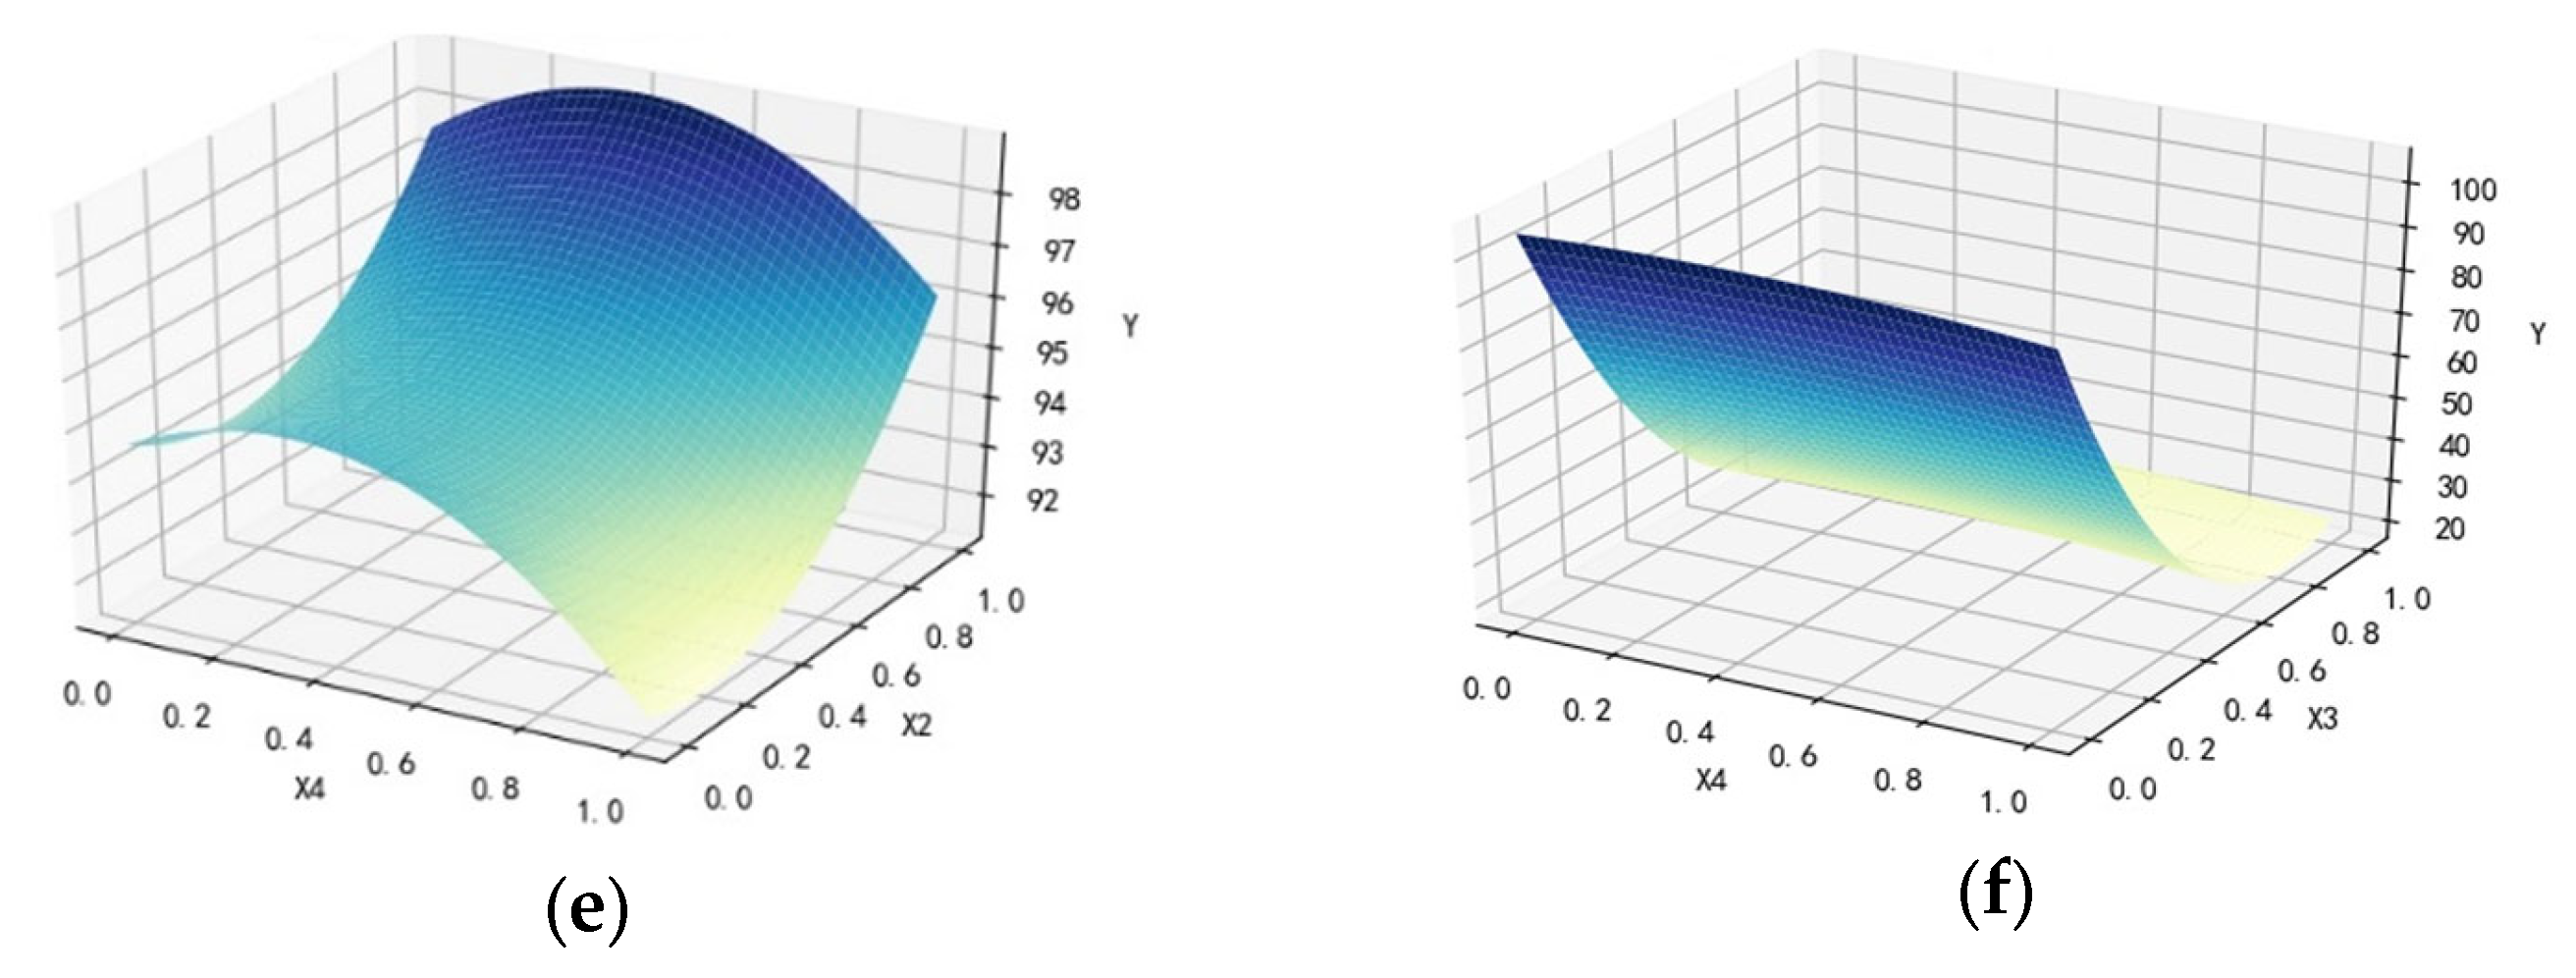
Table 3 were calculated. The two-factor surface is shown in
Figure 3. The results show that, according to the analysis, the change conditions of wind resource change range (−10%, 10%), power load change range (−5%, 10%), installed capacity change range (0.5, 2), and section limit reduction range (60, 600) MW were obtained. The renewable energy accommodation range, with two factors changing together, is shown in
Table 3. The renewable energy utilization rate was within the range 83.23% to 100%. Through comparison, it was found that the joint change in installation and maintenance factors had the greatest impact on renewable energy accommodation.
The analysis revealed that the combined variation in installed capacity and transmission maintenance limits had the most significant impact on the renewable energy accommodation capacity, resulting in the widest operational range. This underscores the critical constraint that grid infrastructure availability imposes on realizing the potential of renewable generation.
- 3.
Model validation
The renewable energy accommodation model based on the response surface method was analyzed and verified from two aspects: feasibility and accuracy.
(1) Model feasibility verification
The calculated p-values and R2 values indicated that both models are valid: all p-values were <0.001, and R2 values exceeded 90%, specifically 91.77% and 91.81%.
(2) Model accuracy verification
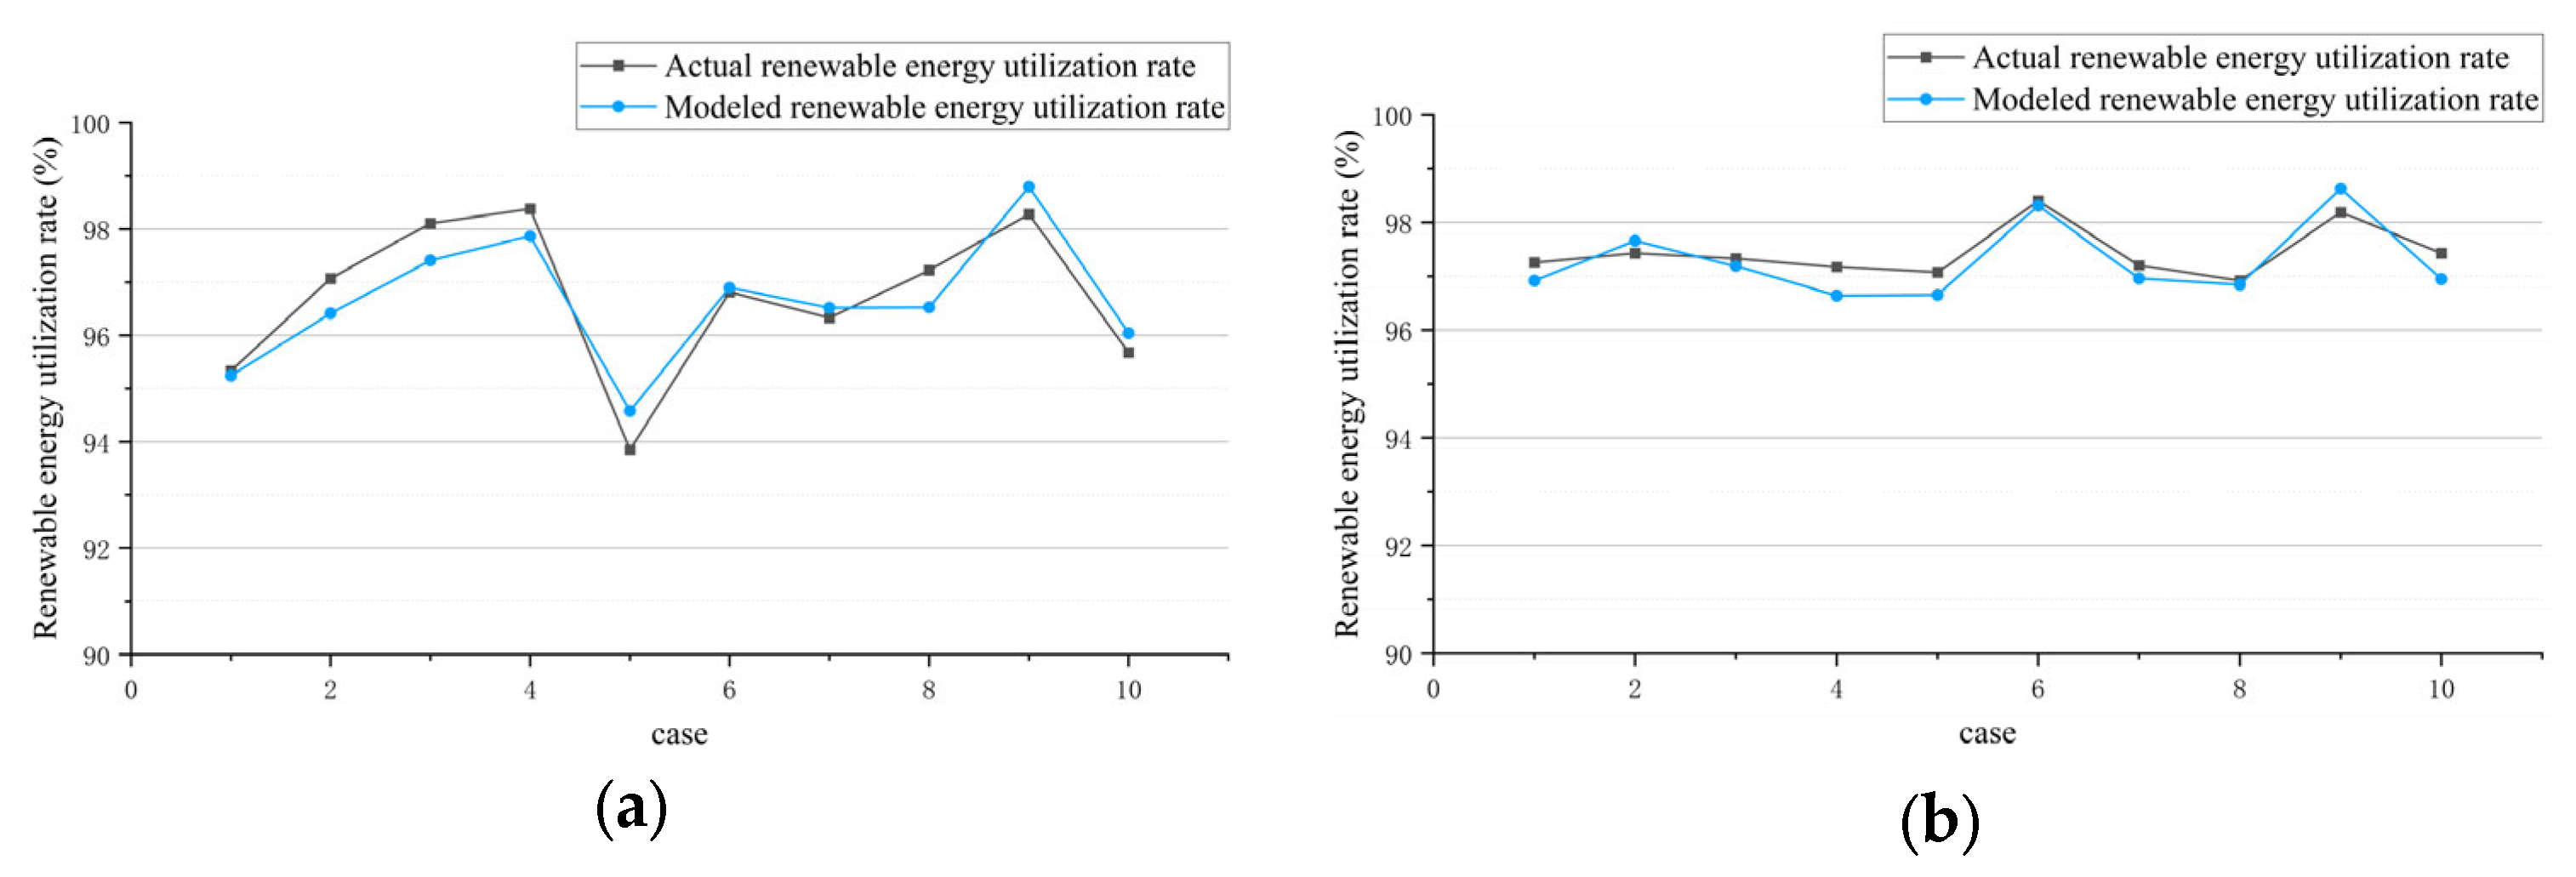
In order to verify the accuracy of the model calculation, the deviation between the fitting value and the real value of the renewable energy utilization rate calculated at random was verified. The two models were verified, respectively. Each model randomly selected 10 groups of historical case data, brought the key factor values into the model, calculated the renewable energy utilization rate, and calculated the deviation between the model fitting value and the historical value. The average deviation between the renewable energy utilization rate of the fitting value and the real value in the two models was less than 0.5%, indicating the accuracy of the absorption model, as shown in
Figure 4.
The validation demonstrates that the response surface methodology (RSM)-based model achieves high accuracy, with an average deviation of less than 0.5% between fitted and actual values across random test cases, thereby confirming the model’s reliability.
3.2.2. Validation of Multidimensional Models Represented by Factor Function Relationships
Considering the issue of overfitting caused by a sufficient sample size, a multidimensional spatial model can be constructed using the factor function relationship under LASSO regression, which can achieve rapid calculation of renewable energy accommodation capacity under the influence of multiple factors. A multidimensional model was constructed using wind resources, electricity load, and installed capacity as examples, and the model was characterized and analyzed.
Considering the high and low levels of renewable energy accommodation capacity, two sets of renewable energy utilization rate sample sets were randomly selected, and the results are shown in
Figure 5 and
Table 4.
The results validate that the multidimensional model constructed using LASSO regression is highly effective, exhibiting an error of less than 1.5% compared with historical data. This confirms the method’s capability to handle high-dimensional factor interactions while mitigating overfitting.
3.2.3. Validation of Multidimensional Models Represented by Probability Density Function
The Bayesian probability density function method transforms the information bottleneck of sparse samples into a controllable uncertainty interval through a “ prior+ posteriori” mechanism. It not only retains the expressive power of multidimensional factor interaction but also provides a reliable confidence boundary even in small samples, thus enabling rapid calculation of the range of changes in renewable energy accommodation capacity under the influence of multiple factors. Therefore, the Bayesian estimation method was used to determine the probability density function of model parameters and construct a multidimensional factor renewable energy accommodation capacity model.
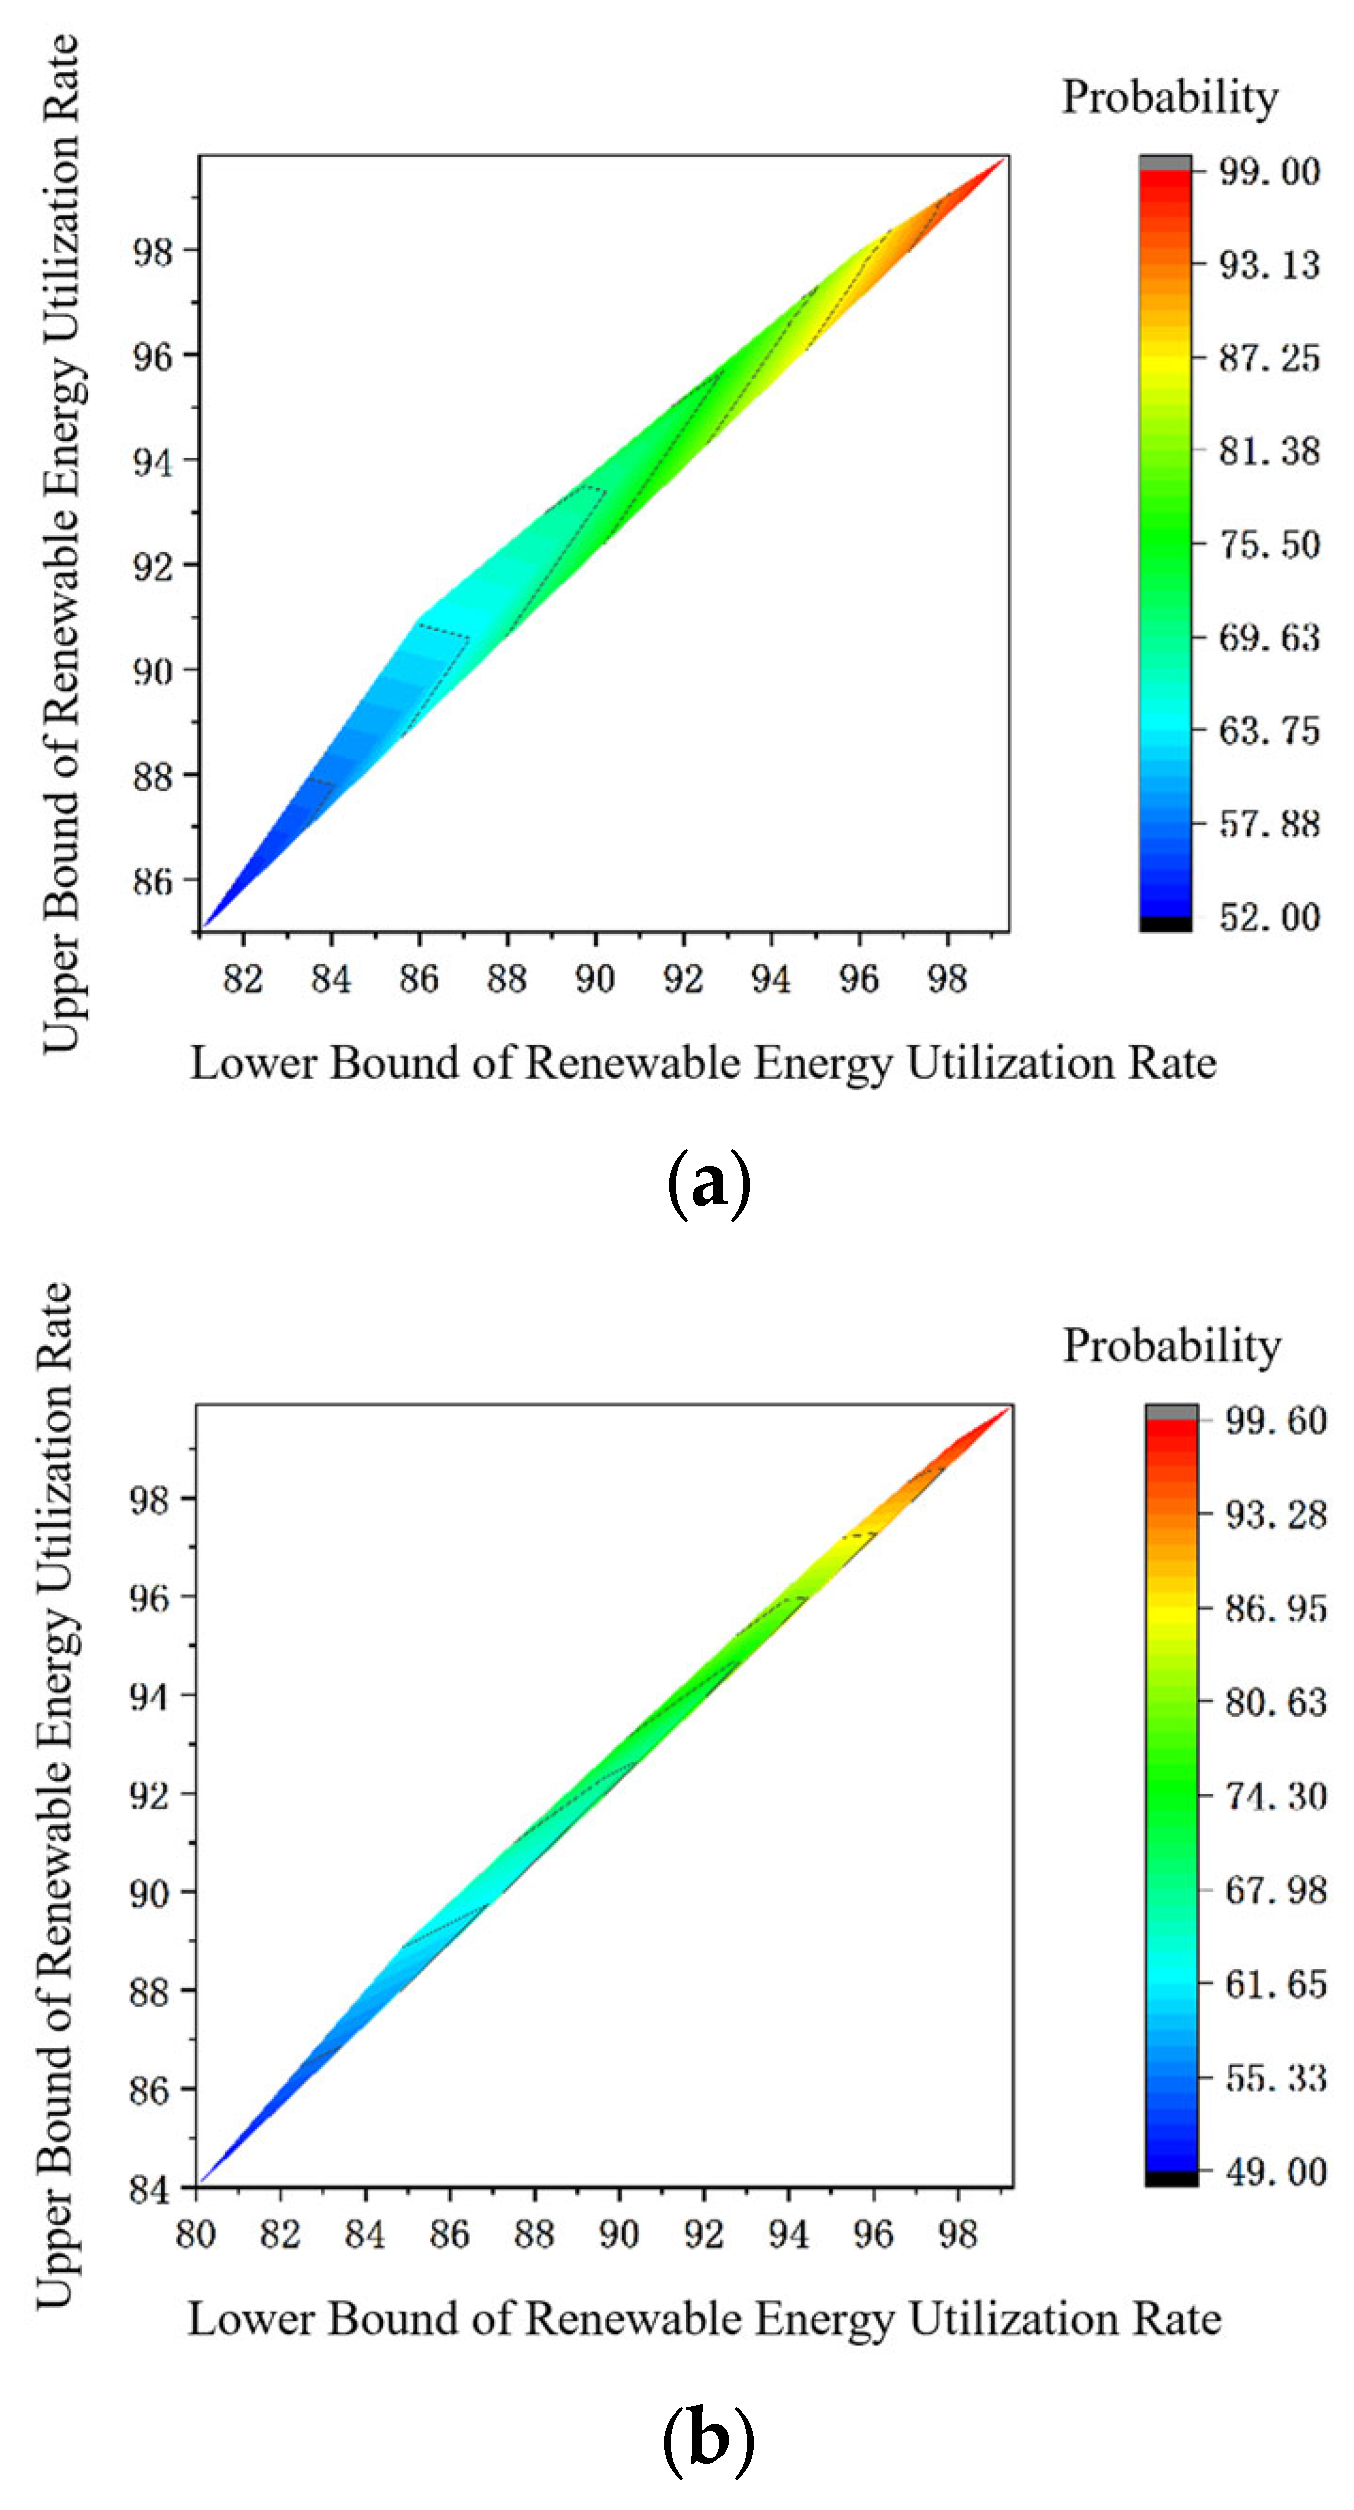
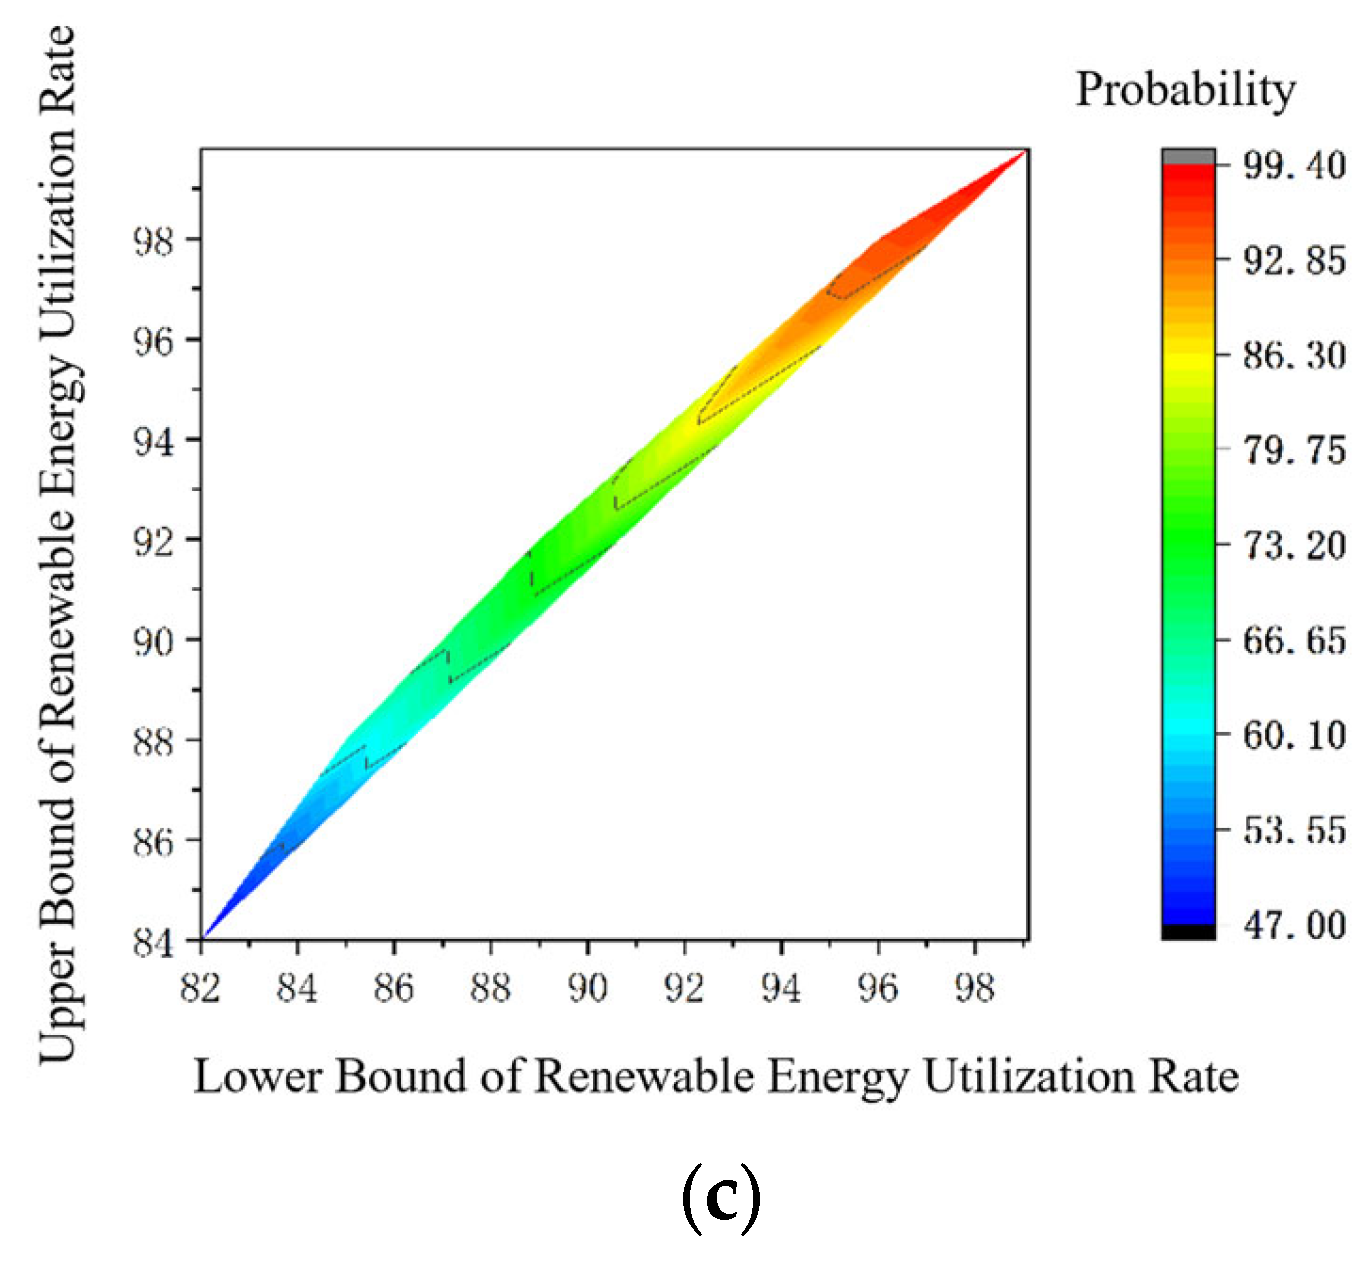
The model was verified, taking the variable value at the boundary at random, and the color represented the probability of falling in the interval between the lower limit and the upper limit. The probability distribution is shown in
Figure 6, and the results are shown in
Table 5.
The Bayesian kernel density estimation method successfully generates confidence intervals that encompass all historical observations. This highlights its utility as a robust tool for quantifying risk and uncertainty in accommodation capacity assessment, particularly under small-sample conditions.
The results indicate that the corresponding accommodation response values are close to the actual values within the range of renewable energy utilization rates calculated by model fitting. Based on the analysis of the multidimensional spatial model constructed using the factor function relationship under LASSO regression, it was found that installed capacity, wind resource factors, and renewable energy accommodation were negatively correlated, while electricity load was positively correlated with renewable energy accommodation.
4. Discussion
4.1. Strength Analysis
Beyond the high statistical fidelity demonstrated in the case study, the proposed framework offers distinct advantages over state-of-the-art methods in terms of computational efficiency, scalability, and policy relevance, which are crucial for practical medium- and long-term planning.
In terms of computational efficiency, our RSM-based approach provides a closed-form polynomial surrogate model, enabling millisecond-level accommodation capacity evaluations. This stands in stark contrast to conventional time series production simulations [
13,
19] or Monte Carlo-based methods [
17], which often require hours or even days to simulate a full year of operation at high temporal resolution. This orders-of-magnitude speedup makes it feasible to conduct extensive scenario analyses and robust optimization under deep uncertainty, which is computationally prohibitive with detailed simulation models.
Regarding scalability, the adaptive framework’s structure is inherently flexible. While traditional methods may require significant structural modifications or become intractable when new variables (e.g., energy storage states, electric vehicle charging demand) are introduced, our framework can seamlessly incorporate additional factors by expanding the predictor matrix in the RSM. The integrated LASSO regularization automatically prunes irrelevant interactions, preventing an explosion of complexity and maintaining model parsimony.
Finally, in terms of policy relevance, the proposed framework provides tangible decision support capabilities for both power system operators and energy policy makers. For system operators, the millisecond-level evaluation speed enables real-time assessment of accommodation capacity under various contingency scenarios (e.g., unexpected transmission line outages, rapid load fluctuations). This facilitates more agile and secure day-ahead grid dispatch and operational planning. For policy makers and long-term planners, the model serves as a powerful scenario analysis tool. It can rapidly quantify the impact of strategic decisions—such as setting renewable portfolio standards, approving new transmission corridor projects, or introducing carbon pricing mechanisms—on accommodation capacity. This capability provides critical support for formulating robust, data-driven energy transition strategies under deep uncertainty.
While this study is grounded in the specific context of the Chinese power system—characterized by its large scale, centrally planned transmission infrastructure and rapid renewable deployment—the challenge of integrating variable renewable energy is undeniably global. Research in Europe has extensively focused on market-based solutions and cross-border coordination to manage uncertainty, often leveraging the integrated European power market [
26,
27,
28]. In contrast, studies in the U.S. have frequently addressed the technical and regulatory challenges within organized wholesale markets like PJM and ERCOT, emphasizing independent system operators (ISOs) and capacity remuneration mechanisms [
29,
30,
31]. The methodology proposed herein offers a unified, planning-oriented framework that complements these region-specific approaches. Its core strength lies in its adaptability to different institutional and market contexts. By providing a rapid, multifactorial assessment tool, it is particularly valuable for power systems worldwide that are undergoing rapid transformation and require fast, reliable capacity assessments, regardless of their specific market structure.
4.2. Exemplary Application Scenarios
To concretely demonstrate the practical utility of the proposed framework, we examine its application within two characteristic power system contexts. In the context of long-term transmission expansion planning, planners are confronted with multiple uncertainties, including future renewable capacity additions, load growth, and conventional generator retirements. The millisecond-level evaluation capability of the proposed framework enables the rapid generation of an accommodation capacity response surface encompassing wide parameter ranges, such as installed capacity variations of ±150%. This allows for the efficient identification, from thousands of potential future states, of critical bottleneck scenarios where new transmission investments yield the greatest benefit, as well as scenarios denoting potential overinvestment risks. Consequently, the framework provides a quantitative basis for robust investment decision-making under deep uncertainty, significantly enhancing the efficiency and scientific rigor of the planning process.
At the level of day-ahead market operations, the Bayesian mode of the framework offers a direct tool for addressing renewable generation uncertainty. System operators can input probability distributions of wind/PV generation and load—derived from ensemble forecasting—into the pre-trained model. The framework subsequently outputs the posterior distribution and confidence intervals for the next day’s accommodation capacity (e.g., indicating a 95% probability that the system can accommodate between 18 GW and 22 GW of renewable energy). This probabilistic insight surpasses the limitations of conventional deterministic methods, enabling operators to assess risks more accurately, optimize unit commitment and reserve requirements, and issue timely market warnings under high curtailment risk scenarios. Thereby, it enhances operational economics substantially while ensuring system security.
5. Conclusions
This paper investigated the morphological characteristics of renewable energy accommodation capacity under multiple uncertain factors and proposes a corresponding multidimensional model. First, a model incorporating multiple uncertain factors was developed based on multidimensional space theory and response surface methodology (RSM). This model enables the rapid calculation of the renewable energy utilization rate when multiple influencing factors change simultaneously. The LASSO regression method and probability density function were applied to characterize the multidimensional renewable energy accommodation capacity model, describing the morphological characteristics of the impact of multiple uncertain factors on the renewable energy accommodation capacity. The main completed work and conclusions are as follows:
(1) Morphological analysis of the impact of dual factors on accommodation capacity.
Based on multidimensional space theory and response surface methodology, a multidimensional renewable energy consumption model was fitted. Taking section A and section B as examples, the impact of multiple key factors changing simultaneously on renewable energy consumption was analyzed, and numerical examples were used for verification. The p-values of the models were all < 0.001, and the R2 values were all > 90%; Each model took 10 random points and compared the fitted renewable energy utilization rate with the actual value. The average deviation was within 0.5%, indicating that the model fits well.
(2) Morphological analysis of the impact of multiple uncertain factors on accommodation capacity.
Based on the response surface methodology, a multi uncertain factor renewable energy consumption model was constructed. The two-dimensional response surface was mapped onto three dimensions using the kernel function of support vector machine to obtain a multidimensional response surface model. By comparing the constructed model with the actual model, it was found that the correlation and degree of influence between key factors and renewable energy utilization rate were almost the same as the actual situation, indicating that the model had a good fitting degree. By using LASSO regression to obtain a multidimensional model representing the relationship between renewable energy consumption functions and comparing it with the actual renewable energy utilization rate, the fitting results of the multidimensional model based on factor function relationship representation were less than 1.5% different from historical cases, indicating that using LASSO regression to determine the multidimensional renewable energy accommodation capacity model achieved very good results. Using the Bayesian formula to obtain the probability density function of model parameters, a renewable energy accommodation capacity model suitable for uncertainty multidimensional space theory was constructed. The constructed model was compared with historical data, and the results showed that the corresponding consumption response values all fell within the renewable energy utilization rate range calculated by the model fitting, indicating that the model fitting was correct.
6. Limitations and Future Work
While the proposed adaptive framework demonstrates promising performance in assessing renewable energy accommodation capacity under multidimensional uncertainties, this study has several limitations that pave the way for future research.
The accuracy and reliability of the framework are inherently dependent on the quality and representativeness of the historical data used for training the response surface and Bayesian models. In regions with scarce operational data or those undergoing rapid technological transformation, the model’s performance might degrade. Furthermore, the current model is developed and validated based on the topological and operational characteristics of a specific bulk power grid in Northwest China. Its direct applicability to fundamentally different grid structures, such as highly distributed distribution networks or isolated microgrids, may require structural adjustments to the model. Lastly, the present work focuses on the core interactions between resource availability, load, capacity, and transmission constraints. It does not explicitly model the dynamic contributions of emerging flexibility resources, such as utility-scale battery energy storage systems (BESSs) or demand-side response, which are becoming increasingly critical for renewable integration.
Building upon these limitations, several directions for future work are identified. First, we plan to integrate models for energy storage and demand-side flexibility as explicit variables within the adaptive framework to more accurately capture the future energy landscape. Second, to mitigate the data dependency limitation, investigating the integration of physics-informed neural networks or transfer learning techniques will be a focus, aiming to enhance the model’s generalizability in data-sparse environments. Third, applying and adapting the proposed framework to the context of multiregional electricity markets and inter-provincial trading mechanisms represents a valuable extension to assess its economic and policy implications. Finally, exploring its scalability and performance in different grid architectures, such as active distribution networks, will be undertaken to verify its broader utility.
Author Contributions
Conceptualization, F.X. and T.L.; methodology, L.Y. and Z.L.; software, K.W. and P.H.; validation, F.X. and T.L. All six authors were involved in revising the paper. All authors have read and agreed to the published version of the manuscript.
Funding
The present work was supported by the Research and Development Project of State Grid Qinghai Electric Power Company Economic and Technical Research Institute ‘Research and Application of Multi type Energy Storage Staged Optimization Configuration Platform for Qinghai Power Grid Considering Random Fluctuations of New Energy’ (SGQHJY00NYJS2400349).
Data Availability Statement
The original contributions presented in this study are included in the article. Further inquiries can be directed to the corresponding author.
Acknowledgments
The authors thank the reviewers whose comments improved the quality of this paper.
Conflicts of Interest
Author Tingxiang Liu, Libin Yang, Zhengxi Li, Kai Wang were employed by the company State Grid Qinghai Electric Power Company Economic and Technical Research Institute. The remaining authors declare that the research was conducted in the absence of any commercial or financial relationships that could be construed as a potential conflict of interest.
References
- IEA. Clean Energy Transitions Programme 2022; IEA: Paris, France, 2023; Available online: https://www.iea.org/reports/clean-energy-transitions-programme-2022 (accessed on 31 March 2023).
- Fang, Y.; Han, J.; Du, E.; Jiang, H.; Fang, Y.; Zhang, N.; Kang, C. Electric energy system planning considering chronological renewable generation variability and uncertainty. Appl. Energy 2024, 373, 123961. [Google Scholar] [CrossRef]
- Wang, J.; Chen, L.; Tan, Z.; Du, E.; Liu, N.; Ma, J.; Sun, M.; Li, C.; Song, J.; Lu, X.; et al. Inherent spatiotemporal uncertainty of renewable power in China. Nat. Commun. 2023, 14, 5379. [Google Scholar] [CrossRef] [PubMed]
- Zhou, A.; Yang, M.; Fang, X.; Zhang, Y. Addressing Wind Power Forecast Errors in Day-Ahead Pricing with Energy Storage Systems: A Distributionally Robust Joint Chance-Constrained Approach. IEEE Trans. Sustain. Energy 2024, 15, 1754–1767. [Google Scholar] [CrossRef]
- Kabouris, J.; Kanellos, F.D. Impacts of large-scale wind penetration on designing and operation of electric power systems. IEEE Trans. Sustain. Energy 2010, 1, 107–114. [Google Scholar] [CrossRef]
- Wong, S.; Fuller, J.D. Pricing energy and reserves using stochastic optimization in an alternative electricity market. IEEE Trans. Power Syst. 2007, 22, 631–638. [Google Scholar] [CrossRef]
- Kazempour, J.; Pinson, P.; Hobbs, B.F. A stochastic market design with revenue adequacy and cost recovery by scenario: Benefits and costs. IEEE Trans. Power Syst. 2018, 33, 3531–3545. [Google Scholar] [CrossRef]
- He, G.; Zhang, X.; Cui, K.; Wang, X.; Zhang, H.; Wang, Z. Research on Quantitative Evaluation Methods of New Energy Accommodation Factors under Synergistic Scenes. Processes 2023, 11, 2896. [Google Scholar] [CrossRef]
- Liu, Y.; Guan, X.; Li, J.; Sun, D.; Ohtsuki, T.; Hassan, M.M.; Alelaiwi, A. Evaluating smart grid renewable energy accommodation capability with uncertain generation using deep reinforcement learning. Future Gener. Comput. Syst. 2020, 110, 647–657. [Google Scholar] [CrossRef]
- Ji, X.; Cheng, Q.; Wang, M.; Meng, X.; Qi, C.; Guo, S. Evaluation of New Energy Accommodation Capability Based on Renewable Energy Power Prediction under “Double Carbon” Goal. In Proceedings of the 2021 IEEE 5th Conference on Energy Internet and Energy System Integration (EI2), Taiyuan, China, 22–24 October 2021; pp. 3970–3974. [Google Scholar]
- Kumar, L.; Sharma, K.; Pathak, P.; Khedlekar, U.K. Optimizing renewable energy integration using advanced mathematical modeling with storage and emission constraints for resilient and sustainable energy systems. Comput. Ind. Eng. 2025, 208, 111379. [Google Scholar] [CrossRef]
- Zhang, D.; Zhao, J.; Dai, W.; Wang, C.; Jian, J.; Shi, B.; Wu, T. A feasible region evaluation method of renewable energy accommodation capacity. Energy Rep. 2021, 7 (Suppl. S7), 1513–1520. [Google Scholar] [CrossRef]
- Wu, J.; Qiu, J.; Wang, X.; Ni, Y.; Han, X.; Du, Z.; Xie, X.; Li, D. Research on calculation method of renewable energy accommodation capacity based on probabilistic production simulation. In Proceedings of the 2018 8th International Conference on Power and Energy Systems (ICPES), Colombo, Sri Lanka, 21–22 December 2018; pp. 151–156. [Google Scholar]
- Liu, P.; Xiao, H.; Qi, S.; Han, S.; Zhang, Z.; Yao, D. Accommodation capability evaluation method of large-scale renewable energy power connected with power grid. In Proceedings of the EMIE 2022; The 2nd International Conference on Electronic Materials and Information Engineering, Hangzhou, China, 15–17 April 2022; pp. 1–5. [Google Scholar]
- Xiang, M.; Zhang, Y.; Li, C.; Qi, C. Peak-shaving cost of power system in the key scenarios of renewable energy development in China: Ningxia case study. J. Energy Storage 2024, 91, 112133. [Google Scholar] [CrossRef]
- Lin, K.; Lu, X.; Wu, F.; Shi, L. Evaluation of the Renewable Energy Accommodation Capacity in the Regional Power Grid. In Proceedings of the 2020 12th IEEE PES Asia-Pacific Power and Energy Engineering Conference (APPEEC), Nanjing, China, 20–23 September 2020; pp. 1–4. [Google Scholar]
- Wang, C.; Liu, S.; Bie, Z.; Wang, J. Renewable Energy Accommodation Capability Evaluation of Power System with Wind Power and Photovoltaic Integration. IFAC-Pap. 2018, 51, 55–60. [Google Scholar] [CrossRef]
- Zou, Y.; Xia, Q.; Chi, Y.; Wang, Q. Enhancing Renewable Energy Accommodation by Coupling Integration Optimization with Flexible Retrofitted Thermal Power Plant. Appl. Sci. 2024, 14, 2907. [Google Scholar] [CrossRef]
- Zhou, D.; Zhang, Q.; Dan, Y.; Guo, F.; Qi, J.; Teng, C.; Zhou, W.; Zhu, H. Research on Renewable-Energy Accommodation-Capability Evaluation Based on Time-Series Production Simulations. Energies 2022, 15, 6987. [Google Scholar] [CrossRef]
- Peng, X.; Gao, G.; Hu, G.; Guo, Y.; Cao, J.; Zhao, J. Research on Inter-regional Renewable Energy Accommodation Assessment Method Based on Time Series Production Simulation. In Proceedings of the 2019 IEEE Sustainable Power and Energy Conference (iSPEC), Beijing, China, 21–23 November 2019; pp. 2031–2036. [Google Scholar]
- Zhao, Z.-J.; Chen, X.; Ma, Z.-Y.; Yang, F.; Zhang, H.-N. Climate impacts on the supply–demand balance of China’s wind–solar energy system based on power grid transmission during the summer peak-load period. Adv. Clim. Change Res. 2025, 16, 718–729. [Google Scholar] [CrossRef]
- Ren, G.; Liu, J.; Wan, J.; Wang, W.; Fang, F.; Hong, F.; Yu, D. Investigating the Complementarity Characteristics of Wind and Solar Power for Load Matching Based on the Typical Load Demand in China. IEEE Trans. Sustain. Energy 2022, 13, 778–790. [Google Scholar] [CrossRef]
- Cai, Q.; Qing, J.; Zhong, C.; Xu, Q.; Liang, Q.-M. Temporal and spatial heterogeneity analysis of wind and solar power complementarity and source-load matching characteristics in China. Energy Convers. Manag. 2024, 315, 118770. [Google Scholar] [CrossRef]
- Saini, V.K.; Kumar, R.; Al-Sumaiti, A.S.; Heydarian-Forushani, E. Learning based short term wind speed forecasting models for smart grid applications: An extensive review and case study. Electr. Power Syst. Res. 2023, 222, 109502. [Google Scholar] [CrossRef]
- Van Dongen, S. Prior specification in Bayesian statistics: Three cautionary tales. J. Theor. Biol. 2006, 242, 90–100. [Google Scholar] [CrossRef]
- Hu, J.; Harmsen, R.; Crijns-Graus, W.; Worrell, E.; van den Broek, M. Identifying barriers to large-scale integration of variable renewable electricity into the electricity market: A literature review of market design. Renew. Sustain. Energy Rev. 2018, 81 Pt 2, 2181–2195. [Google Scholar] [CrossRef]
- Peng, D.; Poudineh, R. Electricity market design under increasing renewable energy penetration: Misalignments observed in the European Union. Util. Policy 2019, 61, 100970. [Google Scholar] [CrossRef]
- Newbery, D.; Pollitt, M.G.; Ritz, R.A.; Strielkowski, W. Market design for a high-renewables European electricity system. Renew. Sustain. Energy Rev. 2018, 91, 695–707. [Google Scholar] [CrossRef]
- Chow, J.H.; De Mello, W.; Cheung, K.W. Electricity Market Design: An Integrated Approach to Reliability Assurance. Proc. IEEE 2005, 93, 1956–1969. [Google Scholar] [CrossRef]
- Brito-Pereira, P.; Mastropietro, P.; Rodilla, P.; Barroso, L.A.; Batlle, C. Adjusting the aim of capacity mechanisms: Future-proof reliability metrics and firm supply calculations. Energy Policy 2022, 164, 112891. [Google Scholar] [CrossRef]
- Cabra, I.P.; Sharma, S.; Callahan, C.; Jani, K.; Kumar, Y.; Toetz, V.; Shuster, E. Market analysis for the integration of new power technologies: A case study of the deployment of hybrid fossil-based generator plus energy storage (ES-FE). Appl. Energy 2023, 351, 121861. [Google Scholar] [CrossRef]
| Disclaimer/Publisher’s Note: The statements, opinions and data contained in all publications are solely those of the individual author(s) and contributor(s) and not of MDPI and/or the editor(s). MDPI and/or the editor(s) disclaim responsibility for any injury to people or property resulting from any ideas, methods, instructions or products referred to in the content. |
© 2025 by the authors. Licensee MDPI, Basel, Switzerland. This article is an open access article distributed under the terms and conditions of the Creative Commons Attribution (CC BY) license (https://creativecommons.org/licenses/by/4.0/).
