Article

Transient Injection Quantity Control Strategy for Automotive Diesel Engine Start-Idle Based on Target Speed Variation Characteristics

1
College of Automotive Engineering, Jilin University, Changchun 130025, China
2
National Key Laboratory of Automotive Chassis Integration and Bionics, Jilin University, Changchun 130025, China
3
FAW Jiefang Commercial Vehicle Development Institute, Changchun 130011, China
*
Author to whom correspondence should be addressed.
Energies 2025, 18(19), 5256; https://doi.org/10.3390/en18195256
Submission received: 5 September 2025 / Revised: 27 September 2025 / Accepted: 1 October 2025 / Published: 3 October 2025

Abstract

Active control of injection quantity during start-up idle optimizes automotive diesel engine starting performance, aligning with low-carbon goals. Conventional methods rely on a calibrated demand torque map adjusted by speed, temperature, and pressure variations, requiring extensive labor for calibration and limiting energy-saving and emission improvements. To address this problem, this paper proposes a transient injection quantity active control method for the start-up process based on the variation characteristics of target speed. Firstly, the target speed variation characteristics of the start-up process are optimized by setting different accelerations. Secondly, a transient injection quantity control strategy for the start-up process is proposed based on the target speed variation characteristics. Finally, the control strategy proposed in this paper was compared with the conventional starting injection quantity control method to verify its effectiveness. The results show that the start-up idle control strategy proposed in this paper reduces the cumulative fuel consumption of the start-up process by 25.9% compared to the conventional control method while maintaining an essentially unchanged start-up time. The emissions of hydrocarbon (HC), carbon monoxide (CO), and nitrogen oxides (NOx) exhibit peak reductions of 12.4%, 32.5%, and 62.9%, respectively, along with average concentration drops of 27.2%, 35.1%, and 41.0%. Speed overshoot decreases by 25%, and fluctuation time shortens by 23.6%. The results indicate that the proposed control method not only avoids complicated calibration work and saves labor and material resources but also effectively improves the starting performance, which is of great significance for the diversified development of automotive power sources.

1. Introduction

Diesel engines are widely used as primary power sources in transportation systems, off-road machinery, and military equipment [1]. Their superior fuel efficiency, torque out-put, reliability, and environmental adaptability also make them a common choice for hybrid vehicles. The improvement of engine economy and emission is of great significance to the further decarbonization and diversification of vehicle power sources.
However, in the actual urban driving process, the vehicle is often restricted by traffic conditions and frequently enters start-up and idling conditions, which account for approximately 30% to 40% of the total driving conditions [2]. Statistical data indicate that 50–70% of HC and CO emissions from automotive diesel engines originate during start-up and idling conditions [2]. Hybrid vehicles require frequent engine starts, leading to excessive fuel consumption and increased pollutant emissions. Wayne State University’s simulation results of a hybrid powertrain with a parallel configuration under the FUDS driving cycle showed that the engine was started 65 times in one driving cycle [3]. Jianbing Gao et al. found that since the SCR device needs to be warmed up to work stably. The conversion efficiency of NOx in the cold start stage is extremely low. And the cold start NOx emissions account for 47.3% to 80.7% of the actual on-road emissions [4]. Baghani et al. found that, in the standard driving cycle, the average rate of cold-start NOx is approximately 75 times that of the rest of the driving time, while this rate is 3.9 and 22.5 for CO and HC emissions, respectively [5]. Therefore, it is of great significance to further improve the economy and emissions of the Start-Idle condition for energy saving and emission reduction in automotive power sources.
Based on the study of start-up spray and mixture formation [6,7,8], ignition and combustion characteristics [9,10,11], and emission characteristics [12,13], researchers have mainly used intake preheating [14,15], fuel performance improvement [16,17,18,19], auxiliary ignition [20], glow plugs [21], and optimization of fuel injection parameters [22,23] to improve the start-up performance of diesel engines. Li et al. employed the intake preheating method to enhance start-up performance. They investigated the minimum intake preheating power at various ambient temperatures and densities, thereby exploring an environmentally adaptive method for estimating intake preheating power under cold start-up conditions [24]. Sun et al. facilitated the transition from low-temperature to high-temperature reactions by doping CeO2 nanoparticles into diesel fuel, which promoted ignition performance in the first injection cycle and successfully lowered the critical temperature required for cold start-up, thereby enhancing cold-start-up performance [18]. Xu et al. found that, under cold start conditions, the two injections can promote the combustion of the main injection, such as shortening the ignition delay, reducing the ignition location, and increasing the flame area [22]. Lu et al. improved the cold-start-up performance at different altitudes by adjusting the pilot injection strategy, which effectively enhanced the combustion environment in the cylinder, thereby improving the cold-start-up performance [23]. Advancing the pilot injection timing and increasing the pilot injection quality are better injection strategies to improve the cold start performance.
The above studies have effectively solved the problem of ignition difficulty during cold start-up. However, they still have not solved the problem of speed overshooting after a successful start-up and the lack of smoothness in switching to idle speed. The advantages of intake air preheating and glow plugs include rapid elevation of intake air temperature and reduced difficulty in cold starts. Their disadvantages involve the need for electric or flame heating devices, resulting in high energy consumption. Preheating response is slow, making them unsuitable for frequent starting scenarios. The advantage of fuel performance enhancement lies in improving fuel atomization and combustion efficiency. Its drawbacks include high costs associated with alternative fuels or fuel additives, making it unsuitable for widespread adoption. The benefit of auxiliary ignition is its ability to increase starting and ignition success rates. Its disadvantages include complex structure, requiring additional engine modifications, and high maintenance costs.
Compared with other auxiliary measures, such as intake preheating, optimized control of fuel injection does not require the addition of additional auxiliary equipment to improve start-up performance. At the same time, the development of electronic control technology and high-pressure common rail technology makes it possible to control the injection cycle-by-cycle and implement multiple injection control during the start-up process, which does not affect the normal operating condition of the engine [25]. The use of appropriate start-up transient injection control helps ensure a high ignition success rate in the early stages of start-up while reducing speed overshoot in the late stages and facilitating a smooth transition to idling conditions. This improvement enhances fuel economy and emissions.
In the early stage of a start-up, the engine speed is low, air leakage loss is high, and the coolant and cylinder wall temperatures are low, resulting in higher heat transfer loss. This results in a lower combustion ignition success rate and reduced combustion efficiency. Additionally, the lubricant temperature is low, and its viscosity is high. Consequently, the piston, cylinder wall, and bearing parts have not formed a lubricant film. Therefore, the engine is often in a semi-dry or even dry friction state, resulting in greater friction losses [14,26,27,28]. Hence, in the early stage of a start-up, the quantity of fuel injection needs to be appropriately increased to improve the success rate of ignition and cylinder power output, prompting the engine speed to rise rapidly. At the late stage of start-up, the engine has reached a higher speed, and the formation of the in-cylinder spray, ignition, and combustion process has become relatively stable. At this time, with the increase in speed, the cylinder air leakage loss has been gradually reduced. The combustion chamber wall temperature and coolant temperature have also increased, which reduces heat transfer loss and improves combustion conditions. The lubricant film between the piston and cylinder wall, as well as between the bearing and other parts, has formed, and the friction resistance has been gradually reduced. At this time, if the injection quantity is still large, it not only consumes more fuel but also leads to a rapid increase in speed, which can easily cause idle speed overshoot. This increases the friction loss and vibration noise of the engine, which is not conducive to energy saving and emission reduction in the start-up process. Therefore, in the late stage of start-up, the injection quantity should be optimized according to changes in speed to promote a gentle and smooth transition of the engine to idle speed, reduce speed overshoot, and promote energy conservation and emission reduction. Su et al. proposed a control strategy that involves setting a large fuel injection quantity in the early stage of start-up and gradually decreasing the fuel injection quantity during the transient process, thereby reducing the number of misfires [29]. However, this study still relies on MAP calibration, which is not conducive to achieving further energy savings and emission reductions in the start-up process.
With the development of electronic control technology, the real-time control of transient fuel injection during start-up has an essential impact on the start-up performance of diesel engines. The current research on injection control strategies for the start-up process can be roughly categorized into three types: study based on constant injection quantity, research based on injection quantity maps, and research on torque-based injection quantity control. The control method of constant injection quantity is simple in logic but requires complicated and detailed calibration work and has poor adaptability to different ambient temperatures. It cannot simultaneously meet the requirements of ignition reliability during the first cycle of starting and the smoothness of transition to idle speed in the late stage of starting, resulting in a significant speed overshoot. This is unfavorable for fuel economy, emissions, and the smoothness of the start-up process [30]. The study, based on the calibration of the injection quantity MAP, enhances adaptability to different temperatures by designing the injection quantity MAP with the coolant temperature and rotational speed. Still, there is some blindness in the calibration of the MAP, which is not conducive to optimizing the start-up process fuel economy and emissions [31]. The torque-based injection quantity control method, which is widely used today, calibrates the demand torque map for the start-up process, corrects for changes by rotational speed, temperature, and atmospheric pressure on this basis, and then determines the final injection quantity based on the conversion relationship between torque and injection quantity [32,33]. Although this control strategy effectively improves the starting performance, it still requires complicated calibration work. The control strategy lacks a clear target function, and the optimization of the starting performance is limited [34].
For this reason, this paper proposes an active control method for the injection quantity during the start-up process based on the target speed variation characteristics. This approach builds upon previous research by our group on target indication torque control strategies in the start-up process [35]. Firstly, the target speed variation characteristics of the start-up process are determined by different acceleration optimization. Secondly, a control strategy for the transient injection quantity of the start-up process is proposed based on the target speed variation characteristics. Finally, the control strategy proposed in this paper is compared with the conventional start-up injection quantity control method. Research findings indicate that the control strategy proposed in this paper significantly enhances the starting performance of automotive diesel engines. Moreover, it requires neither additional auxiliary equipment nor fuel replacement. This approach offers novel methods and insights for controlling and calibrating transient fuel injection quantities during the diesel engine starting process. This method also holds potential for reducing fuel consumption and pollutant emissions during frequent starts in hybrid vehicles while improving starting smoothness. It holds significant importance for the decarbonization and diversification of automotive power sources.

2. Experiment Setup

The schematic diagram of the test bench is shown in Figure 1, and the specific main equipment and apparatus for the test are shown in Table 1. A HORIBA MEXA-7100D gaseous emissions analyzer was used to measure the engine tailpipe emissions. The real-time soot emissions were measured by AVL 483, and the emission opacity was measured by AVL 439. A Kistler 6058AS41 cylinder pressure sensor measures cylinder pressure and the in-cylinder combustion process is analyzed using an AVL Indicom combustion analyzer. ETAS INCA realized the calibration of the engine ECU. The control of the entire test bench, encompassing the control of test equipment, measurement and recording of test data, and monitoring of test parameters and boundary conditions, is achieved through the AVL PUMA OPEN system.
C H C , a v g = 0 T C H C ( t ) × m e x h t d t 0 T m e x h t d t
C C O , a v g = 0 T C C O ( t ) × m e x h t d t 0 T m e x h t d t
C N O x , a v g = 0 T C N O x ( t ) × m e x h t d t 0 T m e x h t d t
Equations (1)–(3) provide the calculation methods for the average concentrations of HC, CO, and NOx during the start-up process, respectively. Here, C represents the instantaneous concentration of different emission at time t. mexh denotes the exhaust mass flow rate at time t. T is the total duration of the start-up process.
The test engine is a six-cylinder heavy-duty diesel engine compliant with China’s National VI emission standards, and its main technical parameters are shown in Table 2. The engine is equipped with a high-pressure common rail system to meet the maximum rail pressure of 1800 bar and an EGR exhaust gas recirculation system to optimize NOx emissions. A Waste Gate exhaust gas bypass valve supercharger is used for intake air boost. Installation of DOC and DPF after-treatment systems to oxidize HC and CO and trap particulate emissions. Installation of SCR for catalytic conversion of NOx emissions to reduce NOx emissions off-board. When the temperature of the after-treatment system does not reach the required point, the TVA opening is adjusted appropriately to reduce intake airflow and increase exhaust temperature, thereby meeting the after-treatment requirements.
During the starting process, a two-stage injection method is employed. The pre-injection volume is 3 mg/hub, with a 1500 us interval between pre-injection and main injection. The main injection timing is 2 °CA after top dead center. The laboratory ambient temperature was maintained at 25 °C, with the engine coolant and lubricant temperature held at 30 °C. 0# diesel fuel was used for the experiments. To ensure the reliability of the test results, each set of starting parameters was repeated ten times, and the results were averaged. After each starting test, the engine was stopped for 30 min to cool down.

3. Design of Start-Idle Control Strategy Based on Target Speed Variation Characteristics

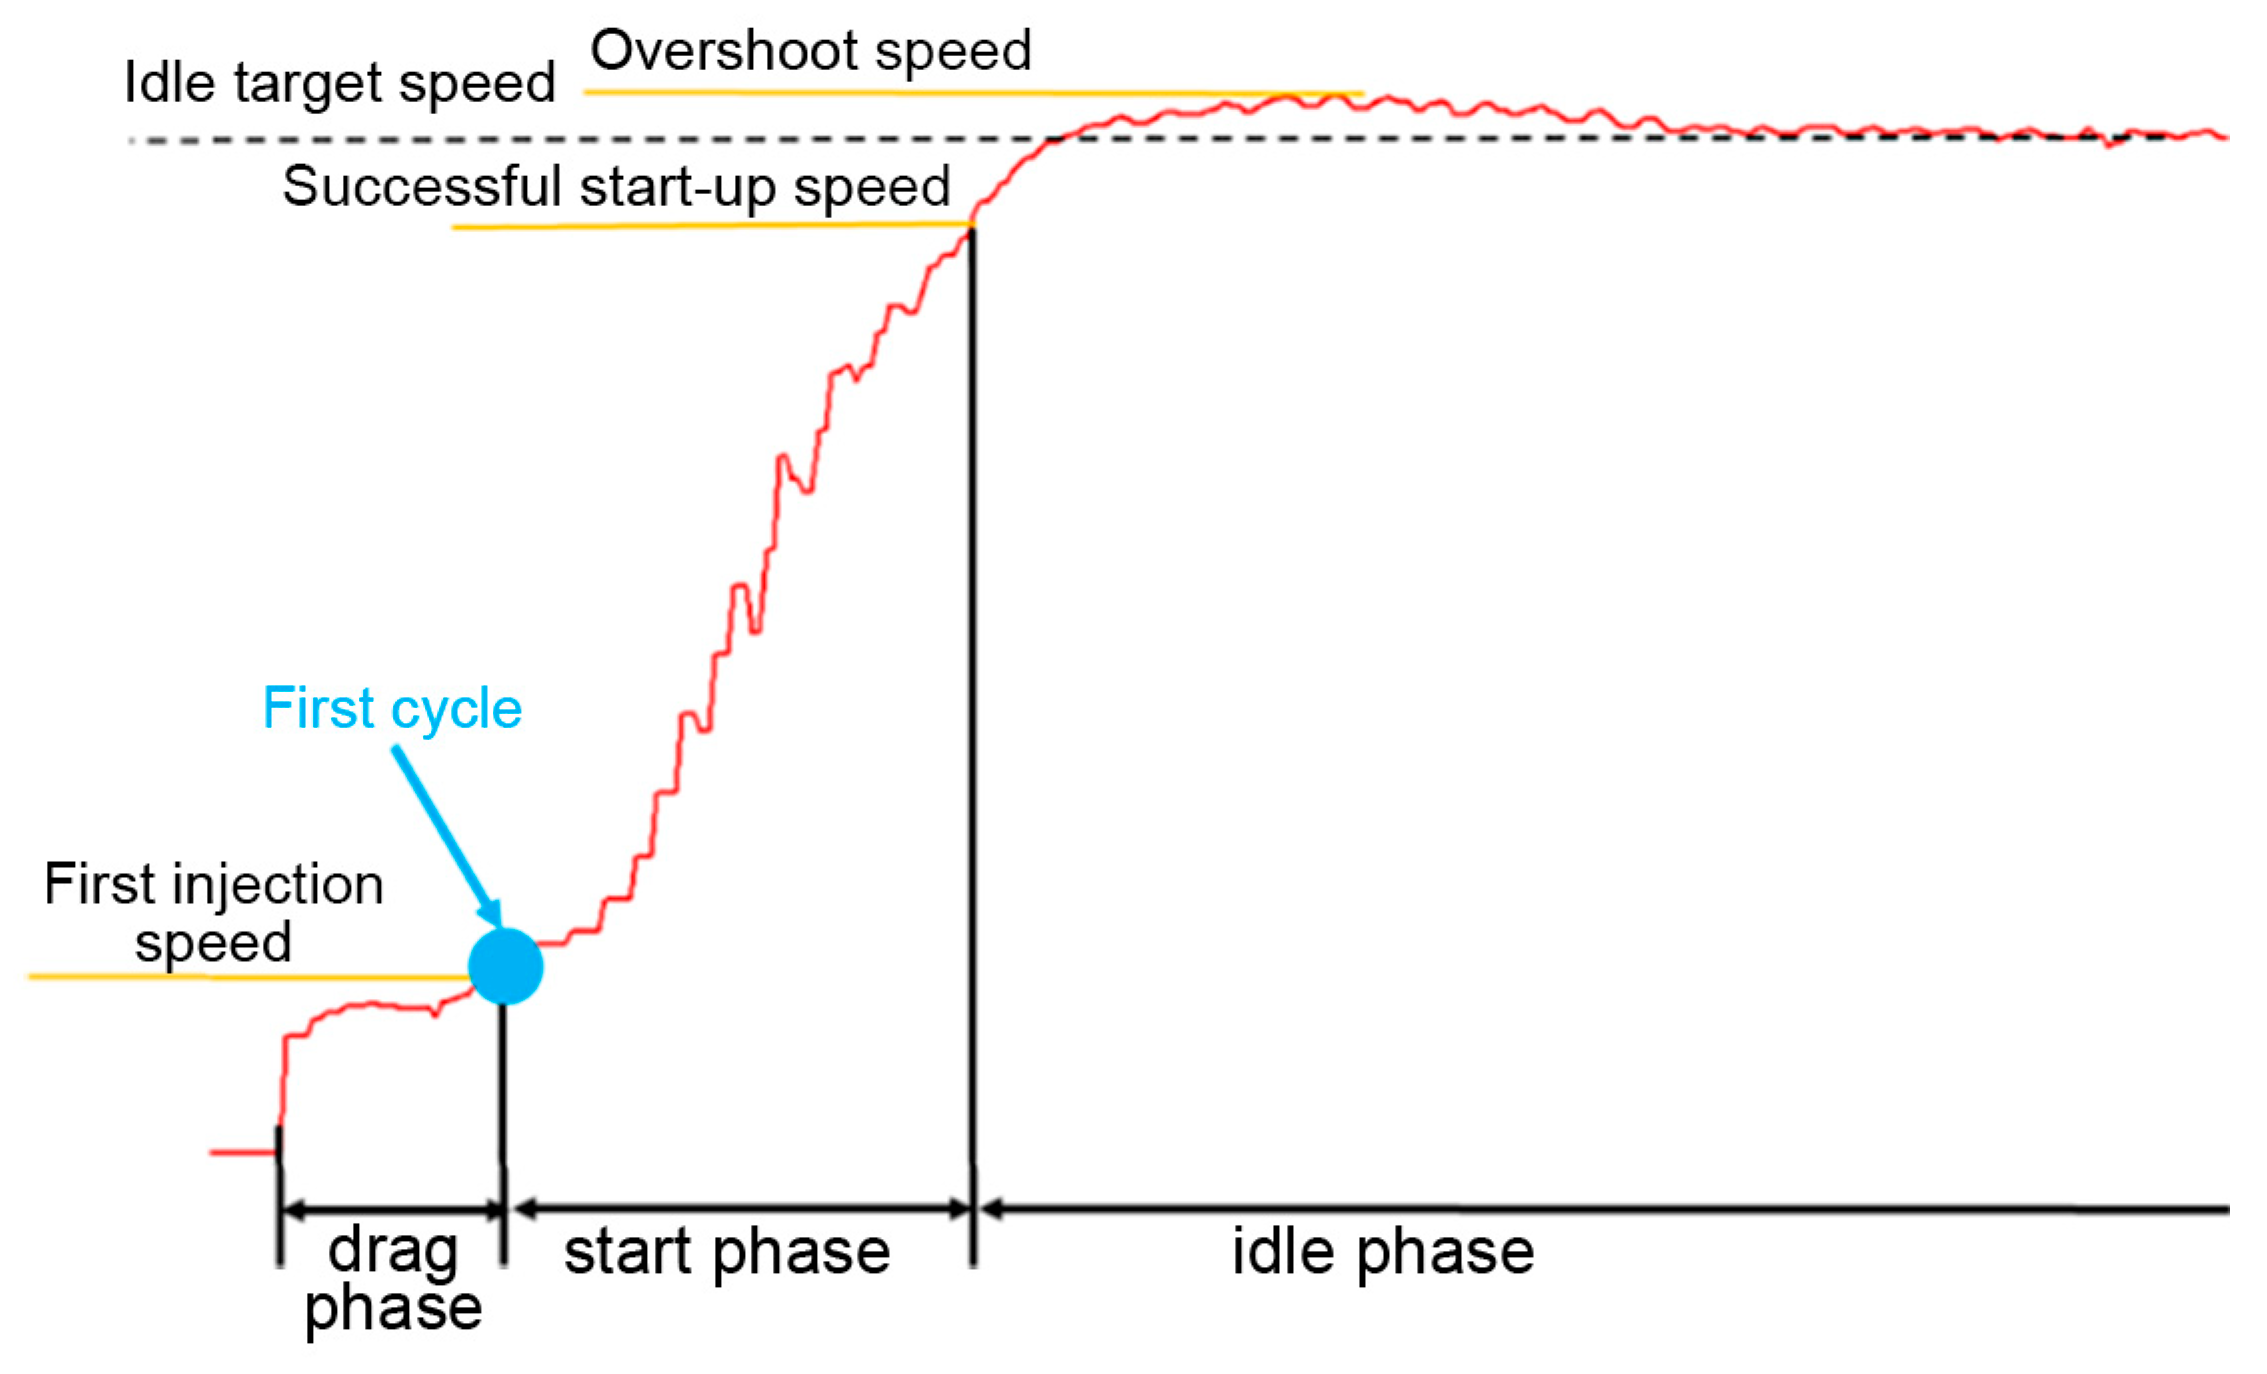
The diesel engine start-up idle process is divided into three phases, as shown in Figure 2: the drag phase, start phase, and idle phase. This study of the start-idle control strategy primarily focuses on controlling the start phase and idle phase. The start phase control refers to the control method of adjusting the injection quantity from the first cycle speed to the successful start-up speed. The idle process control refers to the control method of adjusting the injection quantity from the successful start-up speed to the basic stable idling speed.

3.1. Design of Target Speed Variation Characteristics During the Start-Up Process

3.1.1. Characteristics of Speed Variation During the Start-Up Process

The proposed control strategy begins with designing the target speed variation characteristics for the start-up process. This design is used to determine the crankshaft angular acceleration variation characteristics. Based on these characteristics, a transient target demand torque for the start-up process is then proposed. Finally, according to the working characteristics of the diesel engine, the target demand torque is converted to the transient injection quantity of the start-up process.
During the start-up process, when the starter motor engages the engine to complete the first spray, the rotational speed must rise rapidly and steadily to the successful start-up rotational speed and then smoothly transition to the idling rotational speed. As a result, the angular acceleration is designed as a two-stage process. In the first stage, the rotational speed increases from the initial injection speed (n0) to the intermediate speed (n1), which is slightly lower than the successful start-up speed. The angular acceleration in this stage is designed to be a straight line. In the second stage, the rotational speed rises slowly from the intermediate rotational speed n1 to the successful start-up rotational speed n2, and the angular acceleration in this stage is gradually reduced to 0.
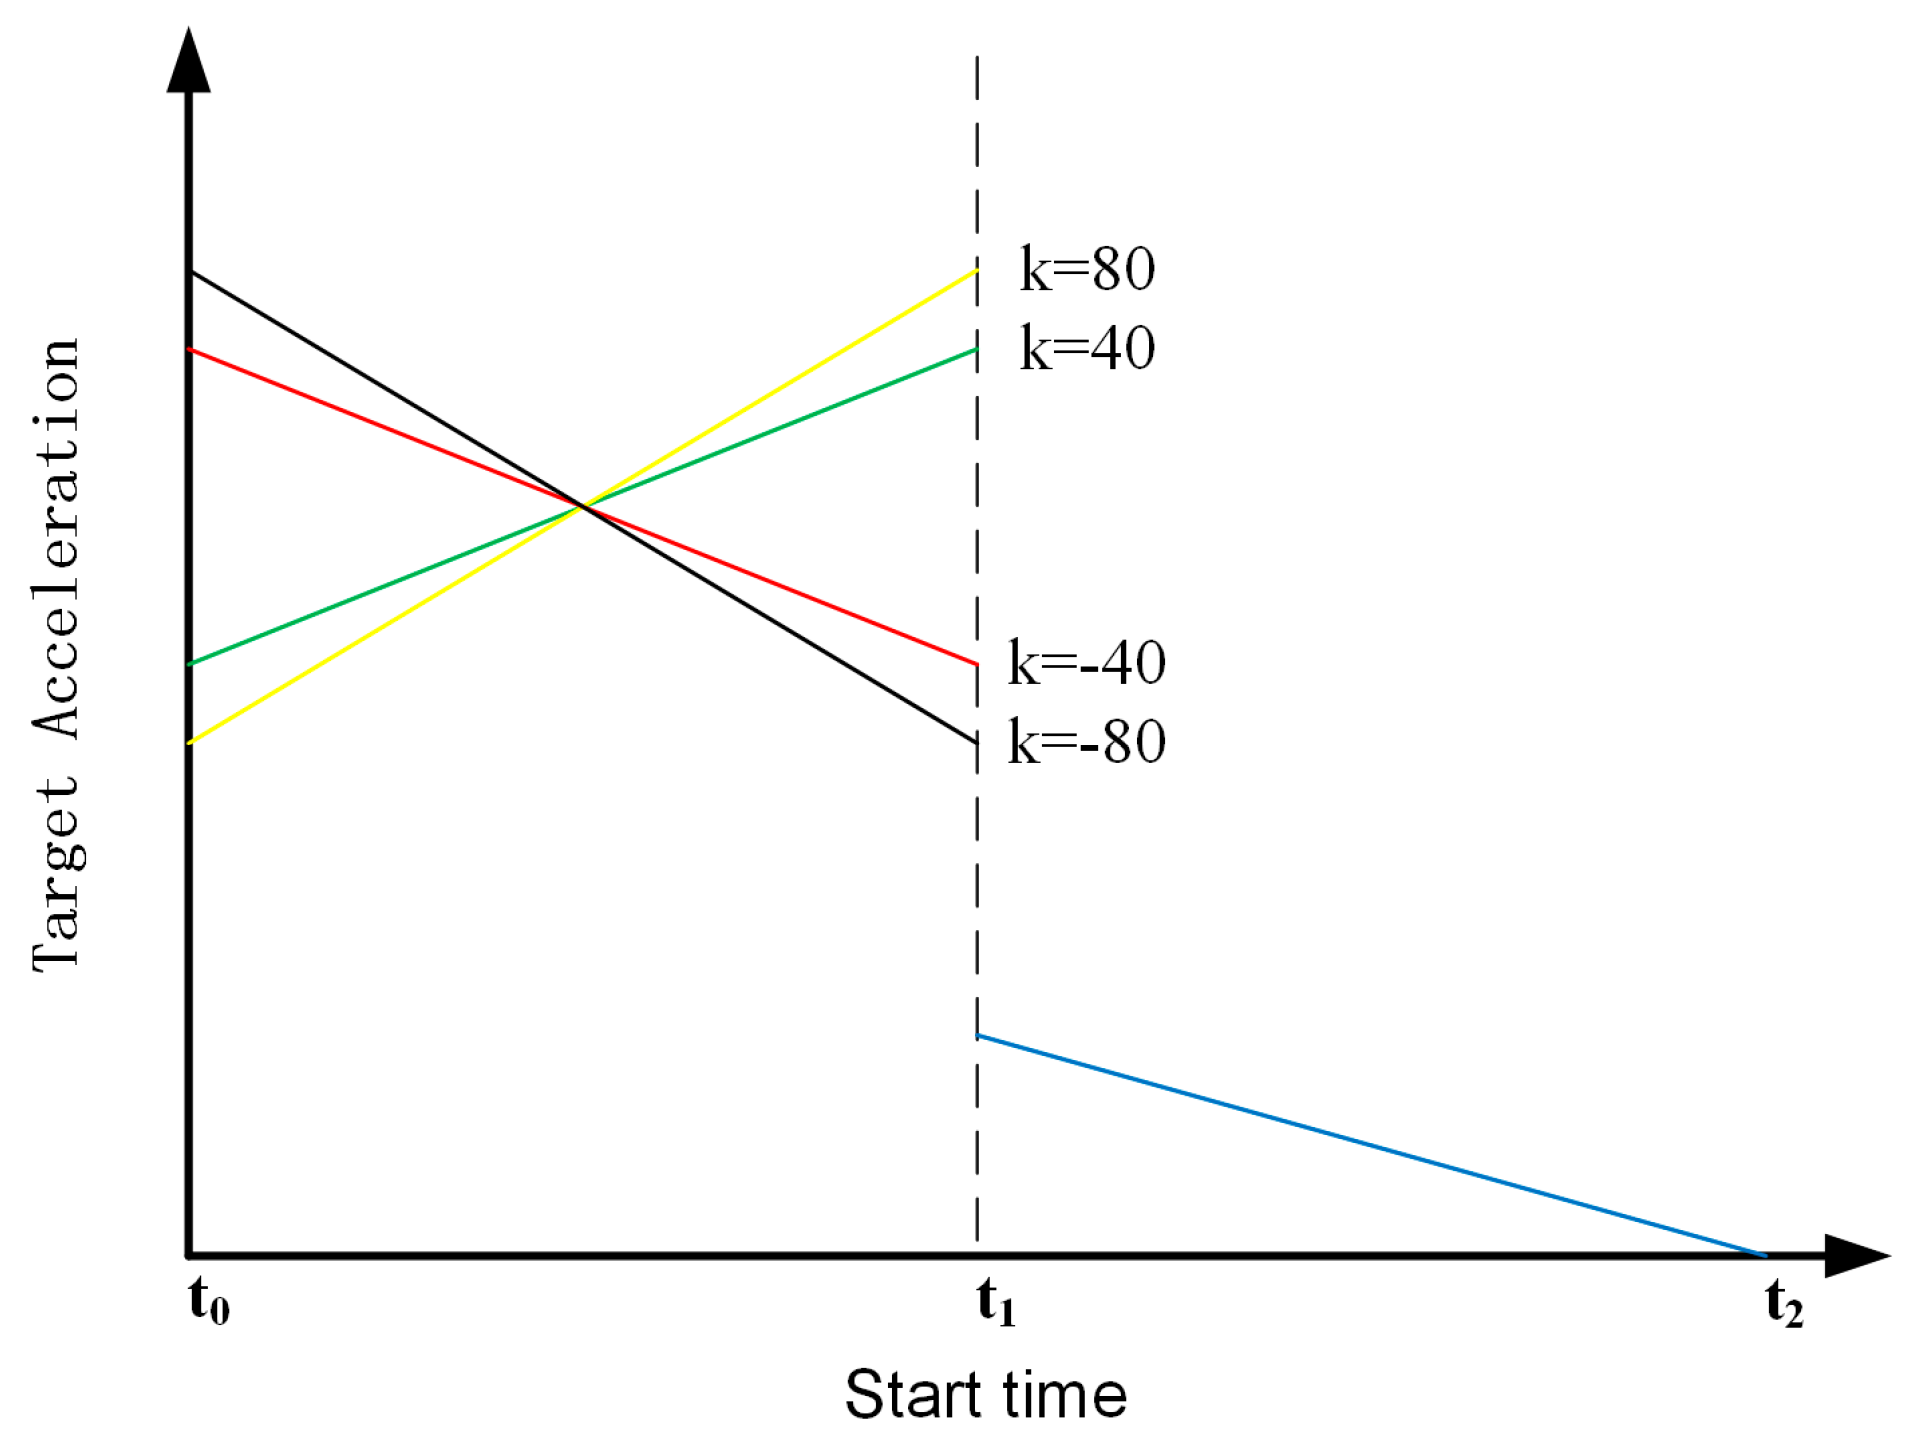
The control strategy proposed in this paper primarily focuses on the injection quantity control method from the start of the first injection to the transition to the idling process, excluding the starter dragging process. Therefore, the entire process begins with the first injection (t0 = 0), and the counter starts timing until the speed reaches the successful start-up speed (t = ts). In this paper, the target speed change characteristics are divided into two segments, as shown in Figure 3. In the (t0, t1) period, the target speed curve is in the form of a parabola from the first injection speed n0 to n1. The corresponding target angular acceleration is a straight line with slope k and always greater than zero. Different angular acceleration slopes k indicate the realization of distinct acceleration processes, corresponding to varying characteristics of speed variation during the start-up process, resulting in different start-up performances. The corresponding target speed equation and target angular acceleration equation are shown in Equation (4). During the period (t1, ts), the target speed curve gradually accelerates from n1 to the successful start-up speed n2. The corresponding target angular acceleration is a straight line with a negative slope. It reduces to 0 at the time of ts, thereby realizing a smooth transition to the idle speed and reducing overshoot. The corresponding target speed equation and target angular acceleration equation are shown in Equation (5). According to the analysis of the results from previous experiments, the preliminary setting ts is within the range of 2–3 s, and t1 = ts/2. Take the first injection speed, n0 = 120 rpm, and the successful start-up speed, n2 = 650 rpm.
a 1 * = n 1 n 0 π 30 t 1 + π k t 30 π k t 1 60 n 1 * = k t 2 2 + n 1 n 0 t 1 k t 1 2 t + n 0 t ( 0 , t 1
a 2 * = π n 1 n 2 t t 1 15 t 2 2 + π n 2 n 1 15 t 2 n 2 * = n 1 n 2 t t 1 2 t 2 2 + 2 n 2 n 1 t t 1 t 2 + n 1 t ( t 1 , t s
t s = t 1 + t 2
where α* is the target angular acceleration of the start-up process, rad/s2; n* is the target rotational speed, r/min; n0 is the first injection speed; n2 is the successful start-up speed; ts is the time elapsed from the moment of first injection to reach the successful start-up speed; t1 is the duration of rapid acceleration section; t2 is the duration of slow acceleration section. Define t0 = 0 moment as the first injection moment, and n1 is the target speed corresponding to the t1 moment.

3.1.2. Optimization of Crankshaft Angular Acceleration During the Start-Up Process

To further investigate the impact of varying target acceleration slopes on the start-up process, as illustrated in Figure 4, the slope k of the target acceleration curve is set to −80, −40, 40, and 80, respectively, and designated as groups A, B, C, and D. These four sets of curves are set up on the basis that the speed increases from n0 to n1 in the t0-t1 phase, the speed increases by the same amount, and the integration of the acceleration in this phase is the same. From this, the acceleration linear slope is designed to take different values. When the four sets of acceleration linear slopes are different, the acceleration value is always greater than 0. When the acceleration linear slope is positive, the acceleration is lower at point t0 and higher at point t1, and the opposite is true when the acceleration linear slope is negative. The trend in injection quantity is similar to the trend in acceleration. The idle target speed is 700 rpm. During the start-up process, a two-stage injection was used, with a pilot injection quantity of 3 mg/hub. The interval between the pilot and main injections was 1500 us, and the main injection timing was 2 °CA after the top dead center.
The settings for different acceleration curves during the start-up process are illustrated in Figure 4. As the acceleration of α1* stage gradually increases from negative to positive, when the slope of the acceleration curve is negative, the acceleration of α1* stage is decreasing progressively with time, and the smaller the slope is, the more obvious the decrease in acceleration value is; when the slope of the acceleration curve is positive, the acceleration of α1* stage is gradually increasing with time and the bigger the slope is, the more obvious the acceleration value is rising as well.
Effect of Angular Acceleration on the Variation Characteristics of Rotational Speed During the Start-Up Process
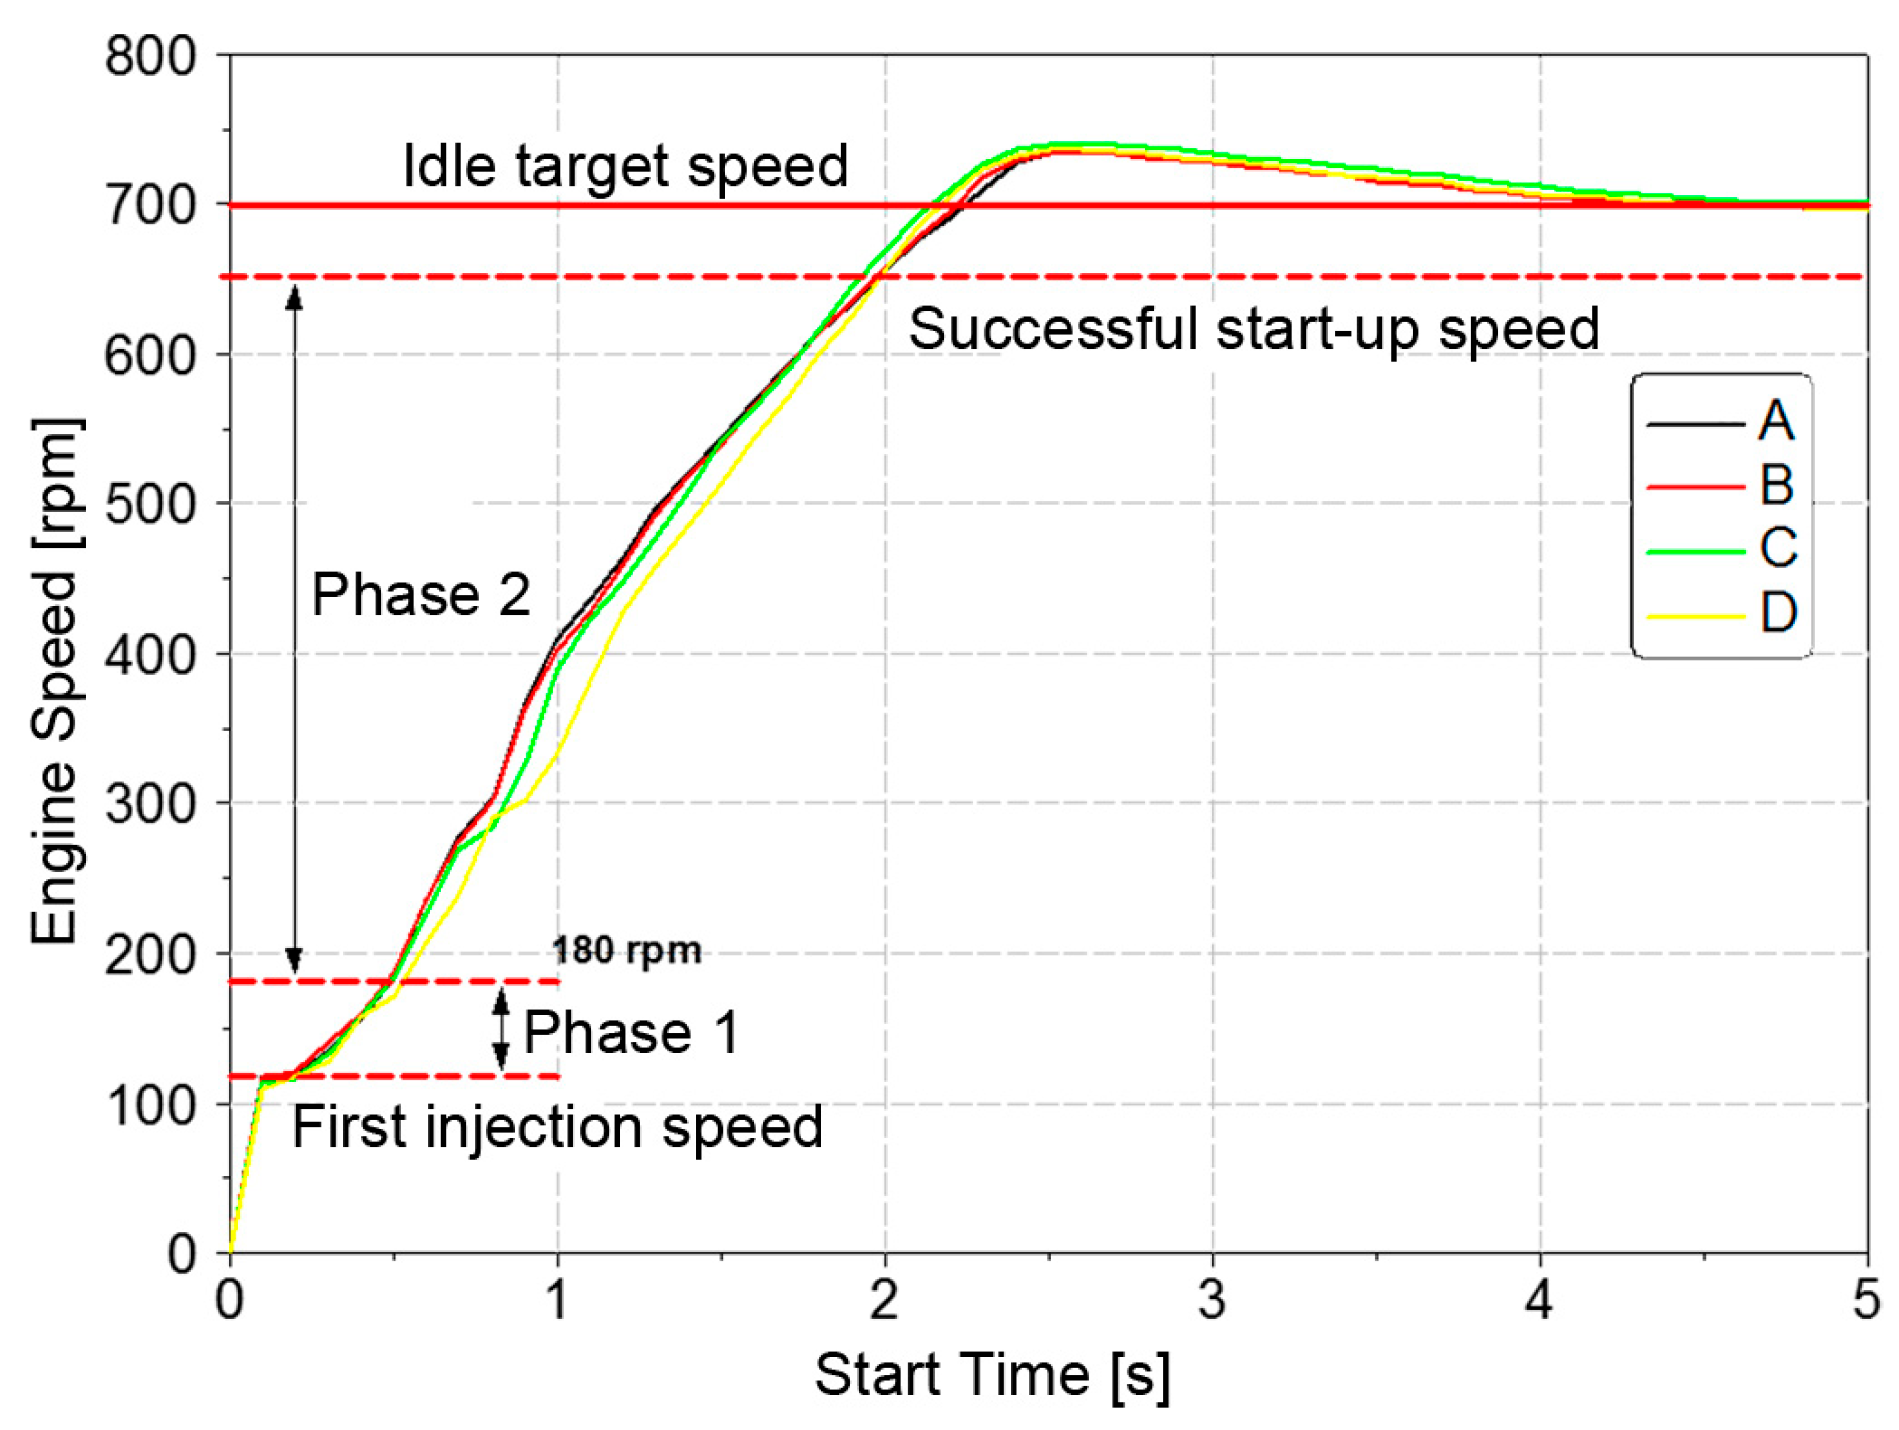
A comparison of the start-up speed control effect under different target acceleration settings is shown in Figure 5. The speed change from the first injection speed to the successful start-up speed is divided into two stages. The first stage, from 120 rpm to 180 rpm, reflects the effect of the first firing cycle of start-up on the speed. The second stage, from 180 rpm to 650 rpm, demonstrates the impact of the acceleration process on speed. In the first stage, different accelerations (i.e., corresponding to different injection quantities) have no significant effect on the speed change, and only the speed curve of group D is slightly lower than those of the other groups. This indicates that, in the first stage of the starting condition, as long as the injection quantity is within a reasonable range, a slight change in the injection quantity has a negligible effect on the engine speed. In the second stage of the start-up process, there is a more significant effect of different accelerations on the speed from 180 rpm to the successful start-up speed. In the early part of the second stage, the smaller the slope of the target acceleration, the higher the engine speed. This is due to the low acceleration slope in groups A and B and the high acceleration values in the initial phase of the start-up process, i.e., the high injection quantity. As a result, the engine speed is higher. Similarly, in the later part of the second stage, the large acceleration slopes in groups C and D correspond to high acceleration, i.e., high injection quantities. This results in a higher engine speed in the later part of the start-up process. At the same time, this also results in a higher overshooting speed in groups C and D compared to groups A and B. This indicates that changes in acceleration and injection quantity have a significant impact on engine speed.
A comparison of the successful start-up time (i.e., the time taken from the first injection to the speed reaching the successful start-up speed of 650 rpm) under different target accelerations is shown in Figure 6a. Among the four groups of target acceleration settings, the group C setting with a target acceleration slope of 40 has the shortest start-up time of only 1.7 s, which is 0.14 s shorter than that of the group A setting with the longest start-up time. A strong positive correlation exists between the start-up time and cumulative fuel injection quantity. As shown in Figure 6b, the C group setting with the shortest start-up time corresponds to the lowest cumulative fuel injection quantity during the start-up process, which is 60.3 mg lower than the A group setting with the longest start-up time. Although the C group setting is only 0.03 s shorter than the D group setting, the cumulative fuel injection quantity during the start-up process is 13.5 mg lower. This shows that the start-up time has a significant impact on the cumulative fuel consumption during the start-up process. Reasonably shortening the start-up time can effectively improve fuel consumption during the start-up process.
Effect of Angular Acceleration on Transient Combustion Process During the Start-Up Process
Figure 7 shows the first 10 cycles of cylinder pressure at the start of the engine. From the figure, it can be seen that the start-up process goes through six cycles and then enters the idling phase under all four sets of different acceleration settings. Under different target acceleration conditions, although the first-cycle injection quantity differs (see Figure 8), there is not a significant difference in the peak cylinder pressure in the first cycle. Only in group D the cylinder pressure is slightly lower, which is because the target acceleration slope of group D is set too large (80), resulting in too small a target acceleration in the early part of the start and too small an injection quantity for the first two cycles of the early stage of start (20 mg/hub in first cycle, as shown in Figure 8). It can also be seen from the speed curve in Figure 5 that, in the first stage of the start-up process, there is little difference in engine speed between the different target acceleration setting conditions, with only Group D being slightly lower than the other settings. As the engine speed increases, the effect of the change in injection quantity on the change in-cylinder pressure and engine speed becomes gradually apparent. In Figure 7, the cylinder pressure curves C and D are higher than A and B from the 3rd cycle to the 5th cycle. The reason for this is that as the engine speed increases, the target acceleration is higher in groups C and D than in groups A and B, resulting in higher injection quantities.
Effect of Angular Acceleration on Emissions of the Start-Up Process
Figure 9a shows the HC emissions during the start-up process under different target acceleration settings. It can be seen from the figure that, due to the poor atomization conditions in the early part of the start-up process, HC emissions during the start-up process increase significantly with the increase in injection quantity in the first cycle. The start-up first cycle injection quantity is A > B > C > D, the angular acceleration size order is D > C > B > A, and the start-up process HC emission size order is C > D > A > B. The transition to idle after a successful start-up process is characterized by high angular acceleration in groups C and D. This leads to increased compensation for injection quantity, resulting in increased HC emissions.
Figure 9b shows the CO emissions during the start-up process under different target acceleration settings. At the initial stage of the start-up process, the CO emissions under different injection quantity settings do not differ much, which conforms to the rule that the larger the injection quantity, the larger the CO emissions. At the early stage of the start-up process, the angular acceleration of group D is set to its maximum, and the injection quantity in the first cycle is minimized, resulting in the lowest CO emission at this stage. However, as the start-up process progresses, the compensation for the injection quantity gradually increases, and CO emissions significantly increase. When the angular acceleration is set low, such as in the first cycle of groups A and B with high injection quantities, CO emissions are high at the beginning of the start-up process, and the rate of increase in CO emissions is relatively slow as the start-up process progresses. When the slope of the angular acceleration of group C is k = 40, the CO emission is generally lower during the period from starting to idling.
Figure 9c illustrates the NOx emissions during the start-up process for different target acceleration settings. At the early stage of the start-up process, the temperature and speed of the cylinder are low, which is not conducive to the mixing of fuel and air. This results in generally poor combustion conditions, characterized by a low combustion temperature. Therefore, the NOx emission level is generally lower under different angular accelerations. However, with the increase in angular acceleration slope (early-stage injection quantity decreases), the NOx emission level tends to decrease. Especially in the later stages of the start-up process, the combustion conditions improve due to the increase in engine speed. NOx emissions rise rapidly, reach a peak, and then decrease rapidly. At this time, with the increase in acceleration slope, such as in groups C and D, the compensated injection quantity increases, resulting in a significant increase in peak NOx emission. At the same time, the angular acceleration slope is low in groups A and B, resulting in a lower compensated injection quantity, which in turn leads to a lower NOx emission level in these two groups. After entering the idling stage, the idle injection quantity control strategy starts to work. The injection quantity is lower, and NOx emissions are kept at a lower level.
Table 3 illustrates the impact of varying target accelerations on the starting performance, where the emissions represent the average pollutant concentrations during the phase from start to stabilization of idling speed. It can be seen that Group B has the smallest speed overshoot, the shortest overshoot time, the lowest average HC emission, and relatively low cumulative fuel consumption and starting time. Therefore, Group B has the best overall starting performance, and the corresponding speed curve of Group B is selected as the optimized target starting speed.

3.2. Injection Quantity Control Strategy Based on Start-Up Phase Target Speed Variation Characteristics

Determining the target indicated torque and its changing characteristics during the start-up process is a crucial issue in controlling the start-up transient injection quantity and thereby optimizing start-up performance. The central idea of the target speed variation characteristics of injection quantity control strategy proposed in this paper is as follows: firstly, based on the target speed variation characteristics determined in the previous section, choose the corresponding target acceleration, which calculates the corresponding starting accelerating torque; then accelerating torque plus the drag torque under the transient speed of the start-up process to get the target indication torque of the start-up process; finally target indicated torque is multiplied by the starting torque to fuel conversion factor to determine the transient injection quantity for the start-up process.
During the start-up process of a diesel engine, the working medium in the cylinder does work outputs, the power generated on the one hand to overcome the internal frictional resistance of the engine and drive the operation of the components and accessories, on the other hand, generate crankshaft accelerating power so that the crankshaft speed increases. Therefore, the target indicated torque during the start-up process is equal to the sum of the starting drag torque and starting acceleration torque.
T t q s t = T r + T a
where Ttqst is the start-up target indicates demand torque, Tr is the start-up drag torque, and Ta is the start-up acceleration torque.
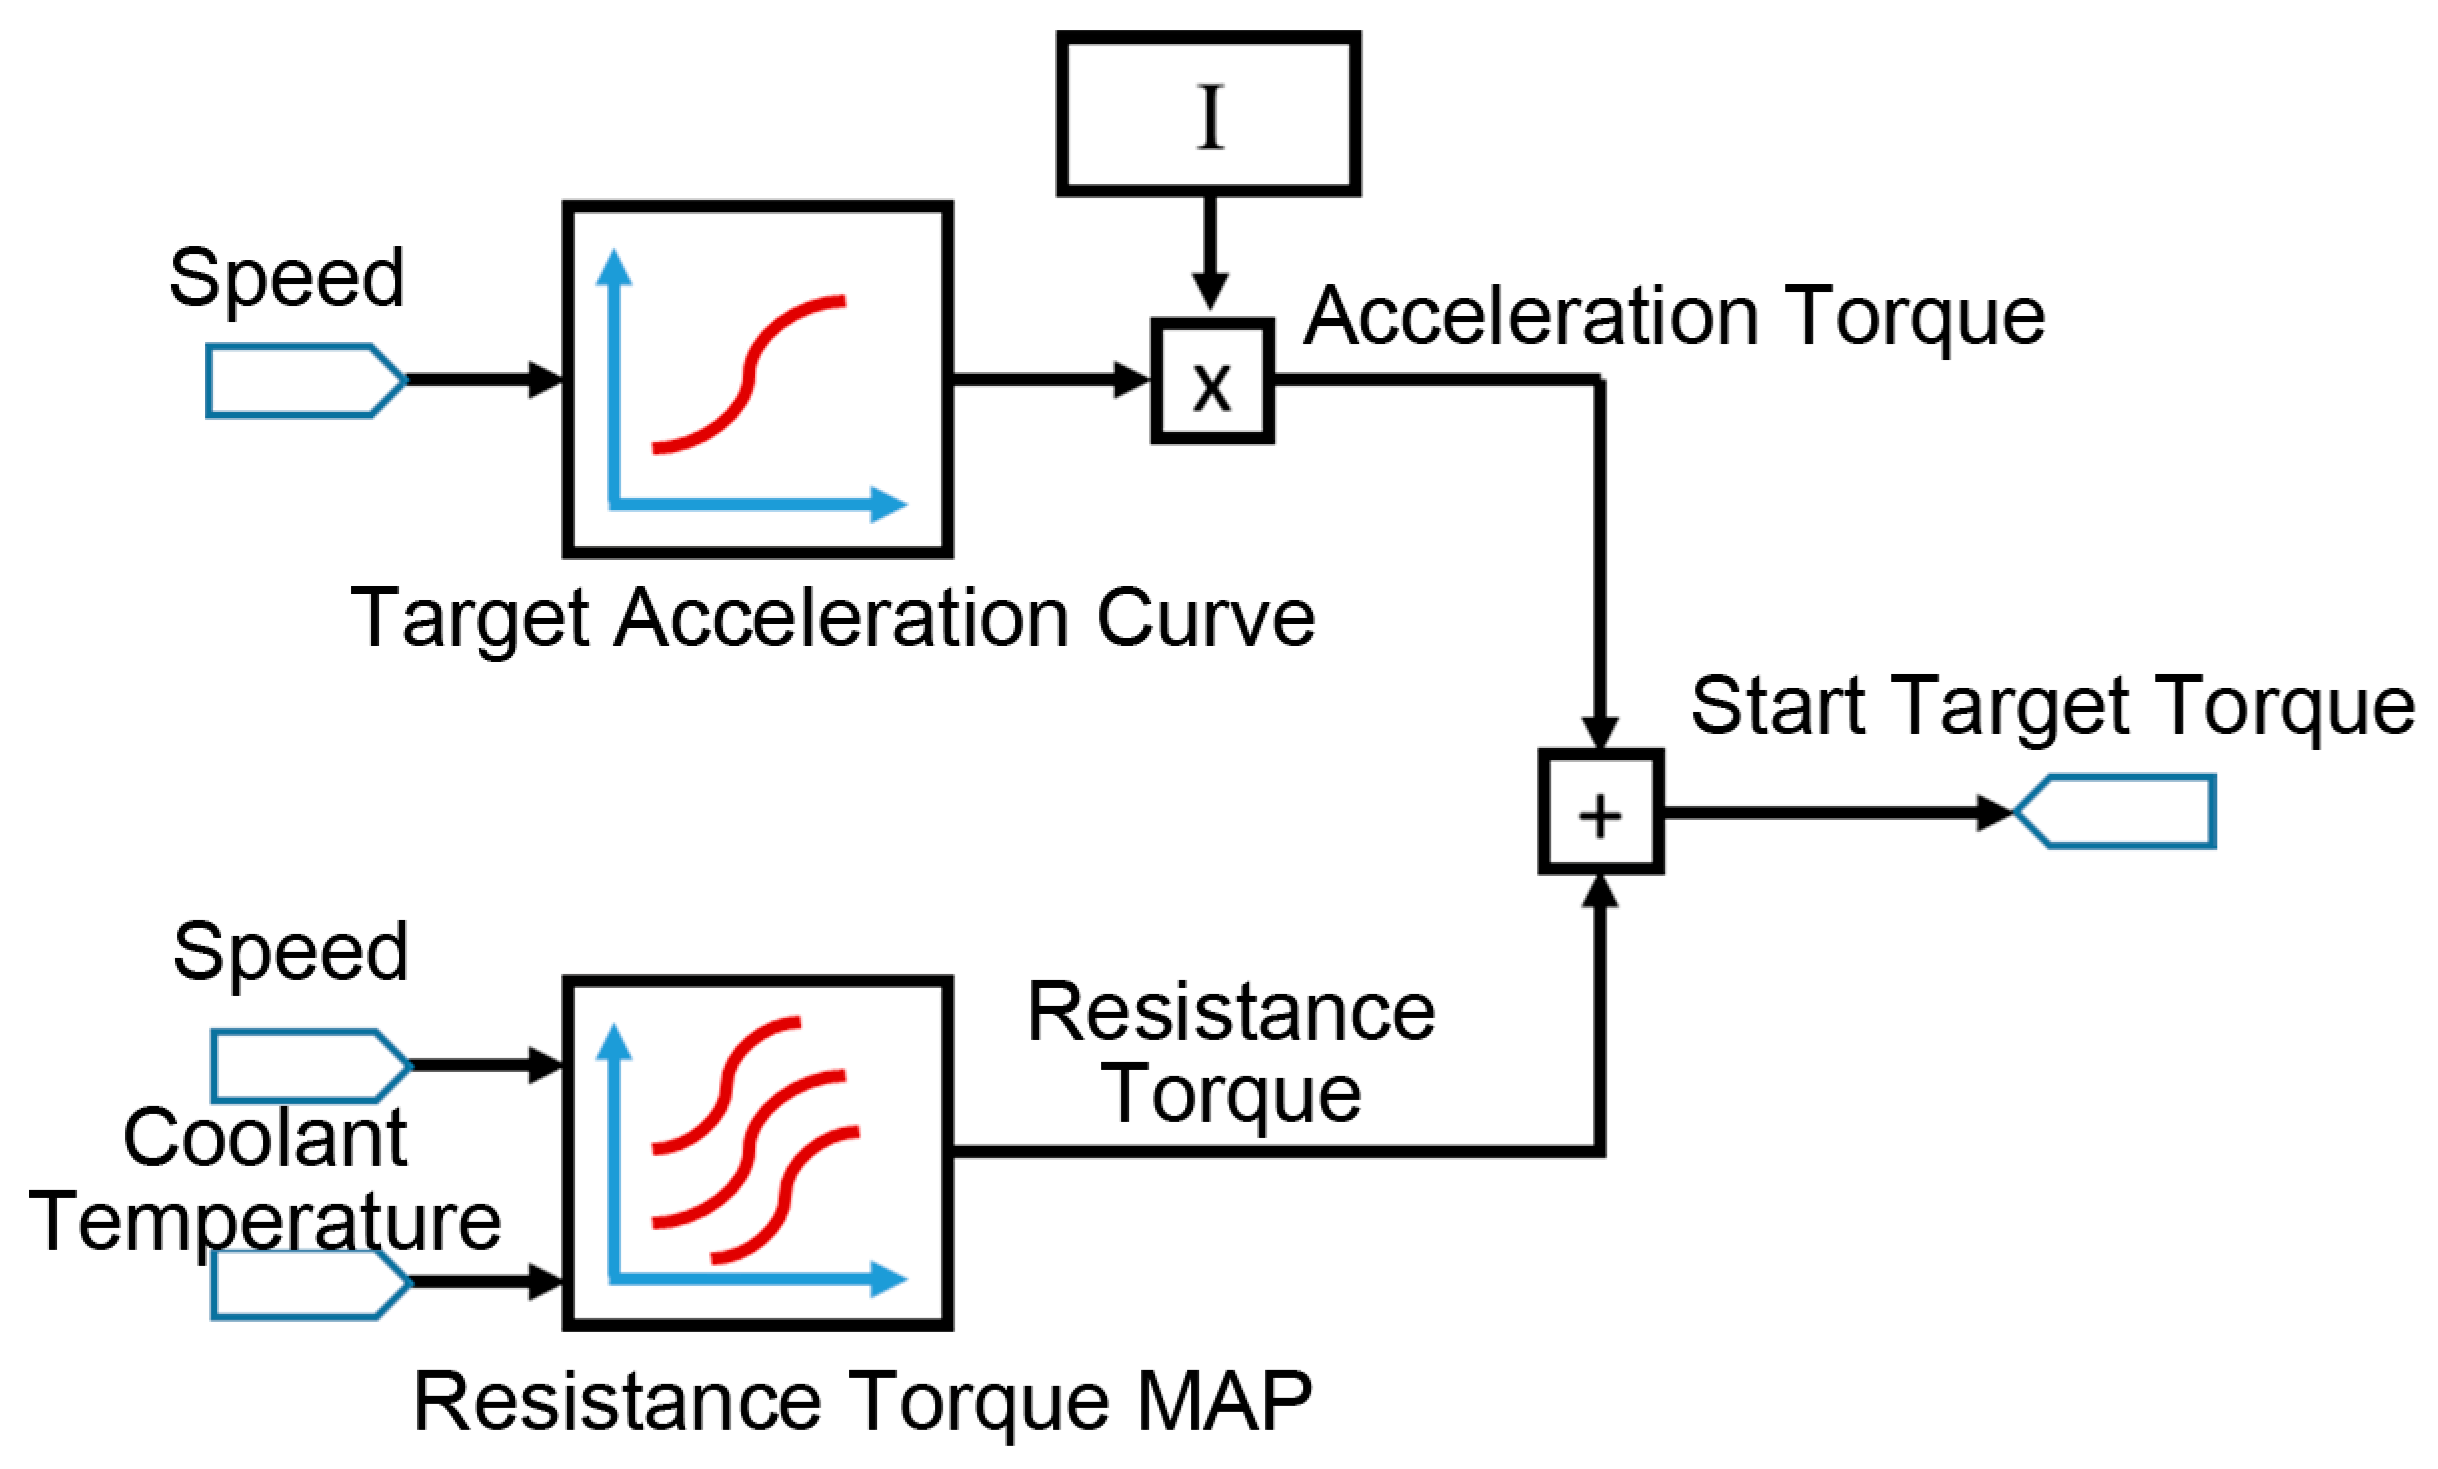
As shown in Figure 10, the start-up drag torque is the sum of the internal engine friction resistance torque and the driving accessory torque during the start-up process, which is a function of speed and ambient temperature and is stored in the ECU’s memory in the form of a 3D-MAP. In the calculation, the MAP of the start-up drag torque is queried in real time based on the engine speed and coolant temperature, and the corresponding start-up drag torque is calculated through interpolation. Typically, as the coolant temperature decreases, the friction loss increases and the start-up drag torque also increases.
The start-up acceleration torque is the torque that drives the engine to overcome inertia and increase the speed during start-up. From the target angular acceleration multiplied by the engine inertia, the start-up acceleration torque can be obtained, as shown in Equations (5) and (6).
T a 1 = n 1 n 0 π I 30 t 1 + π I k t 30 π I k t 1 60 , t ( 0 , t 1
T a 2 = π I n 1 n 2 t t 1 15 t 2 + π I n 2 n 1 15 t 2 , t ( t 1 , t s
q s t = f × T t q s t , t ( 0 , t s
f = π η i × H u × 10 3 , t ( 0 , t s
where qst is the starting injection quantity, f is the torque-fuel conversion factor, ηi is the indicated thermal efficiency, and Hu is the fuel low calorific value. The starting injection quantity is obtained by multiplying the starting target indicated torque by the starting torque-fuel conversion factor. In practical applications, the torque-fuel flow conversion factor is stored in the map. This conversion factor is calibrated based on experimental data collected at various engine speeds and coolant temperatures. The torque-fuel flow conversion factor is retrieved from the map in real time based on the current engine speed and coolant temperature.

3.3. Idle Phase Injection Quantity Control Strategy

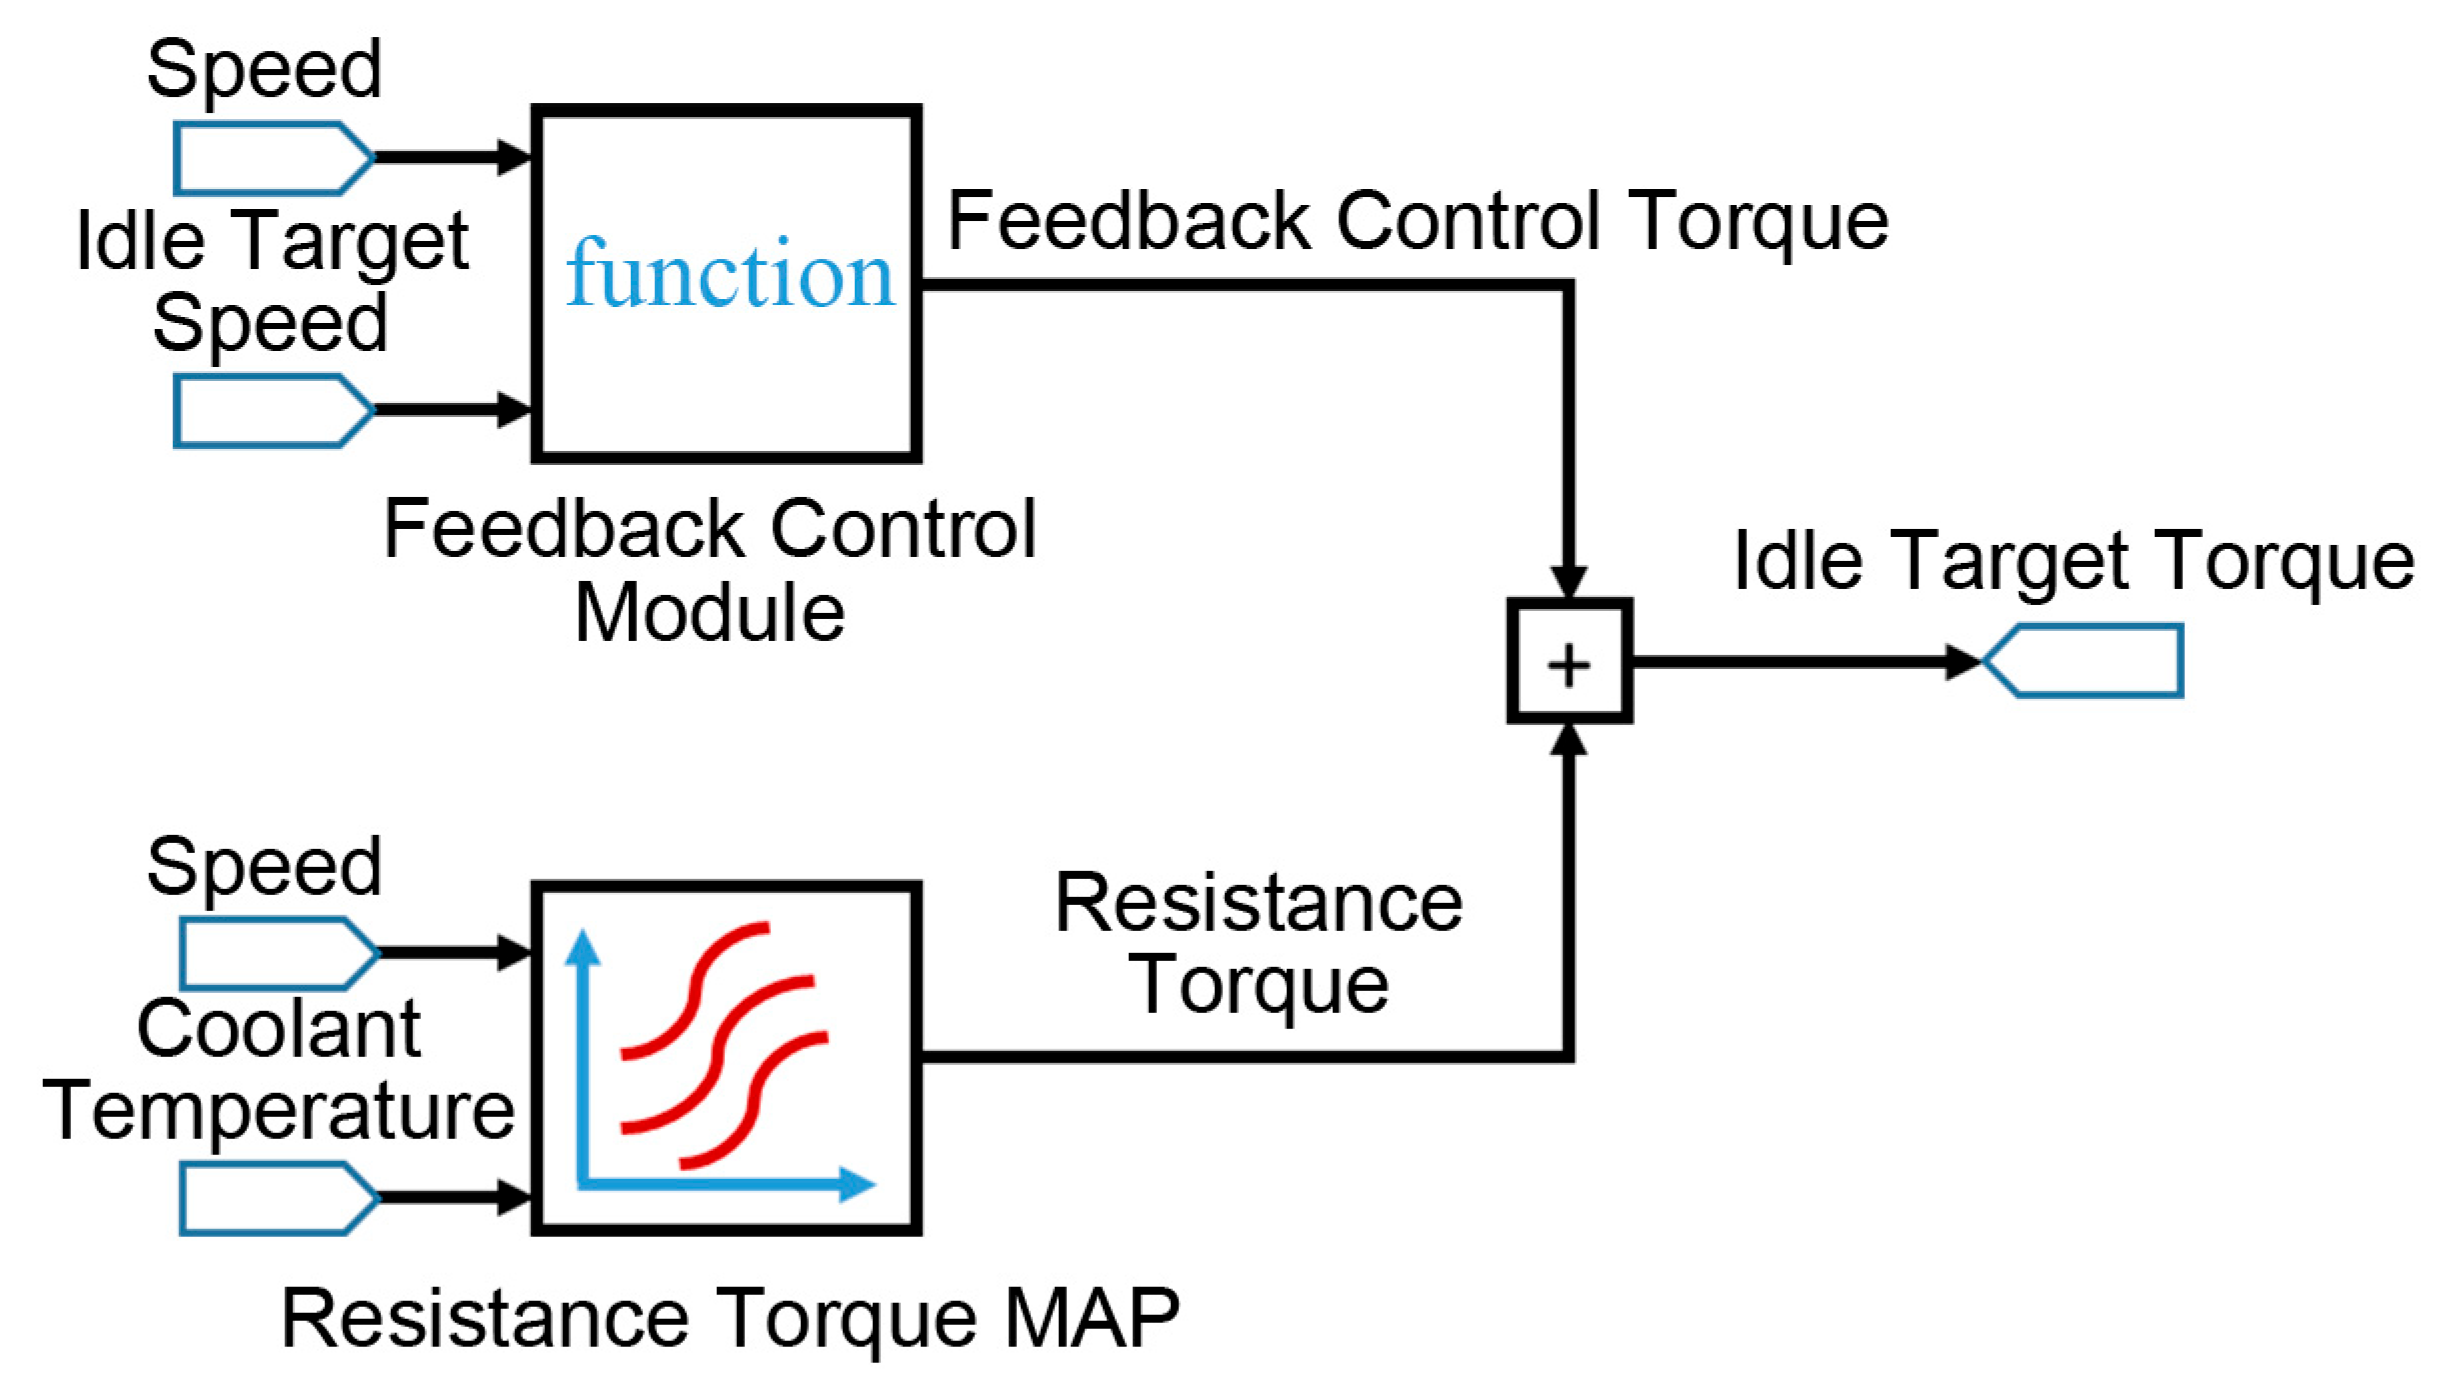
When the engine speed exceeds the successful start-up speed, the idle control strategy is used to control the injection quantity. The idle process injection quantity control employs a closed-loop control strategy based on the target torque, as illustrated in Figure 11. The idle target torque comprises the closed-loop control torque and the resistance torque. Among them, the closed-loop control torque is obtained by the speed closed-loop PID calculation module. Resistance torque is obtained by querying MAP based on speed and coolant temperature.
T t q i d = T p i d + T r
The torque closed-loop PID calculation utilizes the incremental discrete PID algorithm, and the calculation formulas are presented in Equations (13) and (14). After obtaining the idle target indication torque, the idle injection quantity is obtained by multiplying the torque-fuel conversion factor.
e n = n i d l e g o a l n
T p i d = k p × e n e n 1 + k i × e n + k d e n 2 e n 1 + e ( n 2 )
q i d = f × T t q i d
where nidlegoal is the idle target speed, qid is the idle injection quantity, f is the torque-fuel conversion factor, e(n) is the speed deviation, kp is the proportionality coefficient, ki is the integration coefficient, and kd is the differentiation coefficient.
It is worth mentioning that the magnitude of the injection quantity in the late stage of the start-up process has an essential influence on the transition between start-up and idle injection quantity control, which affects the stability of the early idle speed.

4. Results

4.1. Comparison of Transient Injection Quantities Under Different Control Strategies

The conventional start-up process control strategy determines the starting target torque mainly through the sum of the starting base torque map, the starting torque correction, the starting ramp torque, and the additional correction torque. Then, the starting torque is multiplied by the starting torque-fuel quantity conversion factor to obtain the starting transient injection quantity.
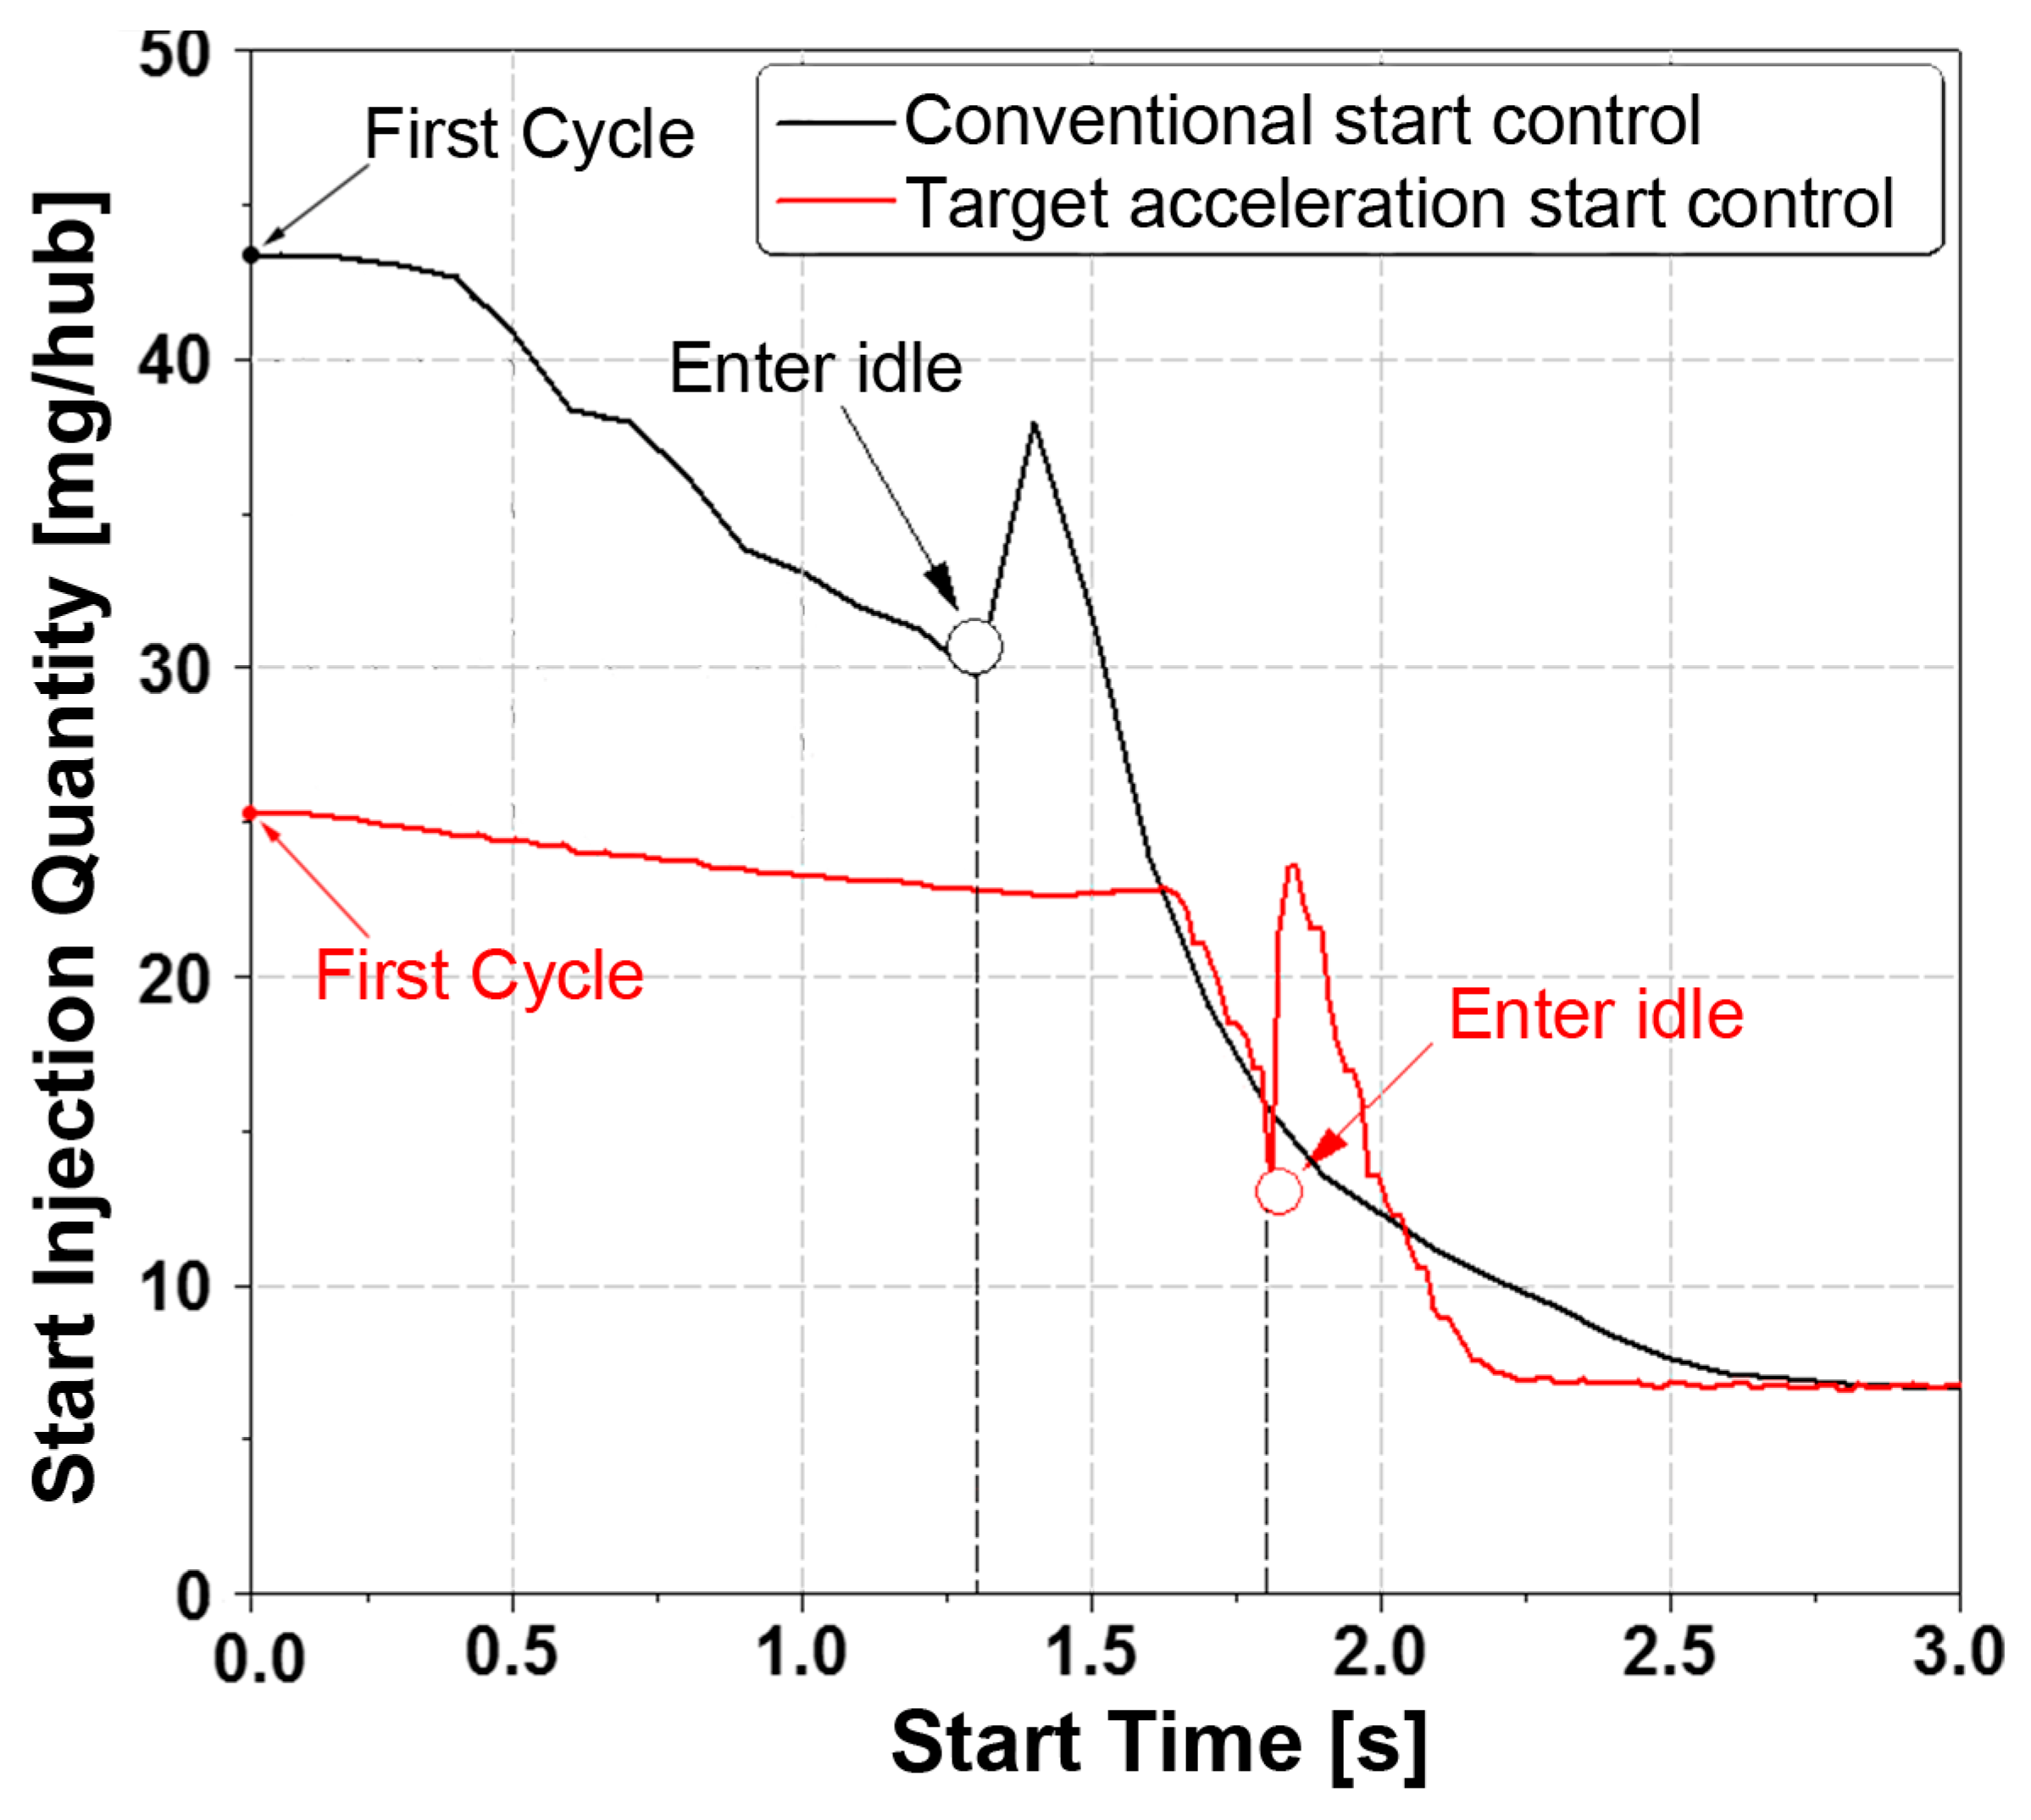
The starting transient injection quantity variation curves under the proposed starting control strategy and the conventional starting control strategy are shown in Figure 12. The turning point of the injection quantity curve in the figure indicates the starting point of idle speed control, and the injection process before the turning point is considered the start-up process. As shown in the figure, the starting injection quantity of the traditional starting control strategy is higher. As shown in the figure, the starting injection quantity of the conventional starting control strategy is higher. The first cycle of start-up injection quantity is as high as 43.3 mg, and the injection quantity during the start-up process is always higher than 30 mg. The cumulative injection quantity until idle stabilization reaches as high as 1200 mg, resulting in a shorter start-up time. In contrast, the control strategy proposed in this paper has a start-up first-cycle injection quantity of only 25 mg. The injection quantity has been maintained within the range of 22–25 mg during the start-up process. The cumulative injection quantity up to idle stabilization is only 889.3 mg, representing a reduction of 310.7 mg compared to the traditional control strategy, resulting in a 25.9% decrease in fuel consumption.
At the beginning of idle control, the feedback control increases the injection quantity initially because the successful starting speed is lower than the idle target speed. The injection quantity then gradually decreases when the speed is greater than or equal to the idle target speed. As shown in the figure, the fluctuation time of the transient injection quantity when switching to idle control is reduced by 0.93 s, and the adjustment amplitude is decreased by 13.9 mg. It can be seen that the adoption of the starting control strategy proposed in this paper effectively reduces the starting speed overshoot time, reduces the cumulative fuel consumption during starting, and minimizes fluctuations in injection quantity and speed when switching to idle.

4.2. Effect of Different Starting Control Strategies on Starting Performance

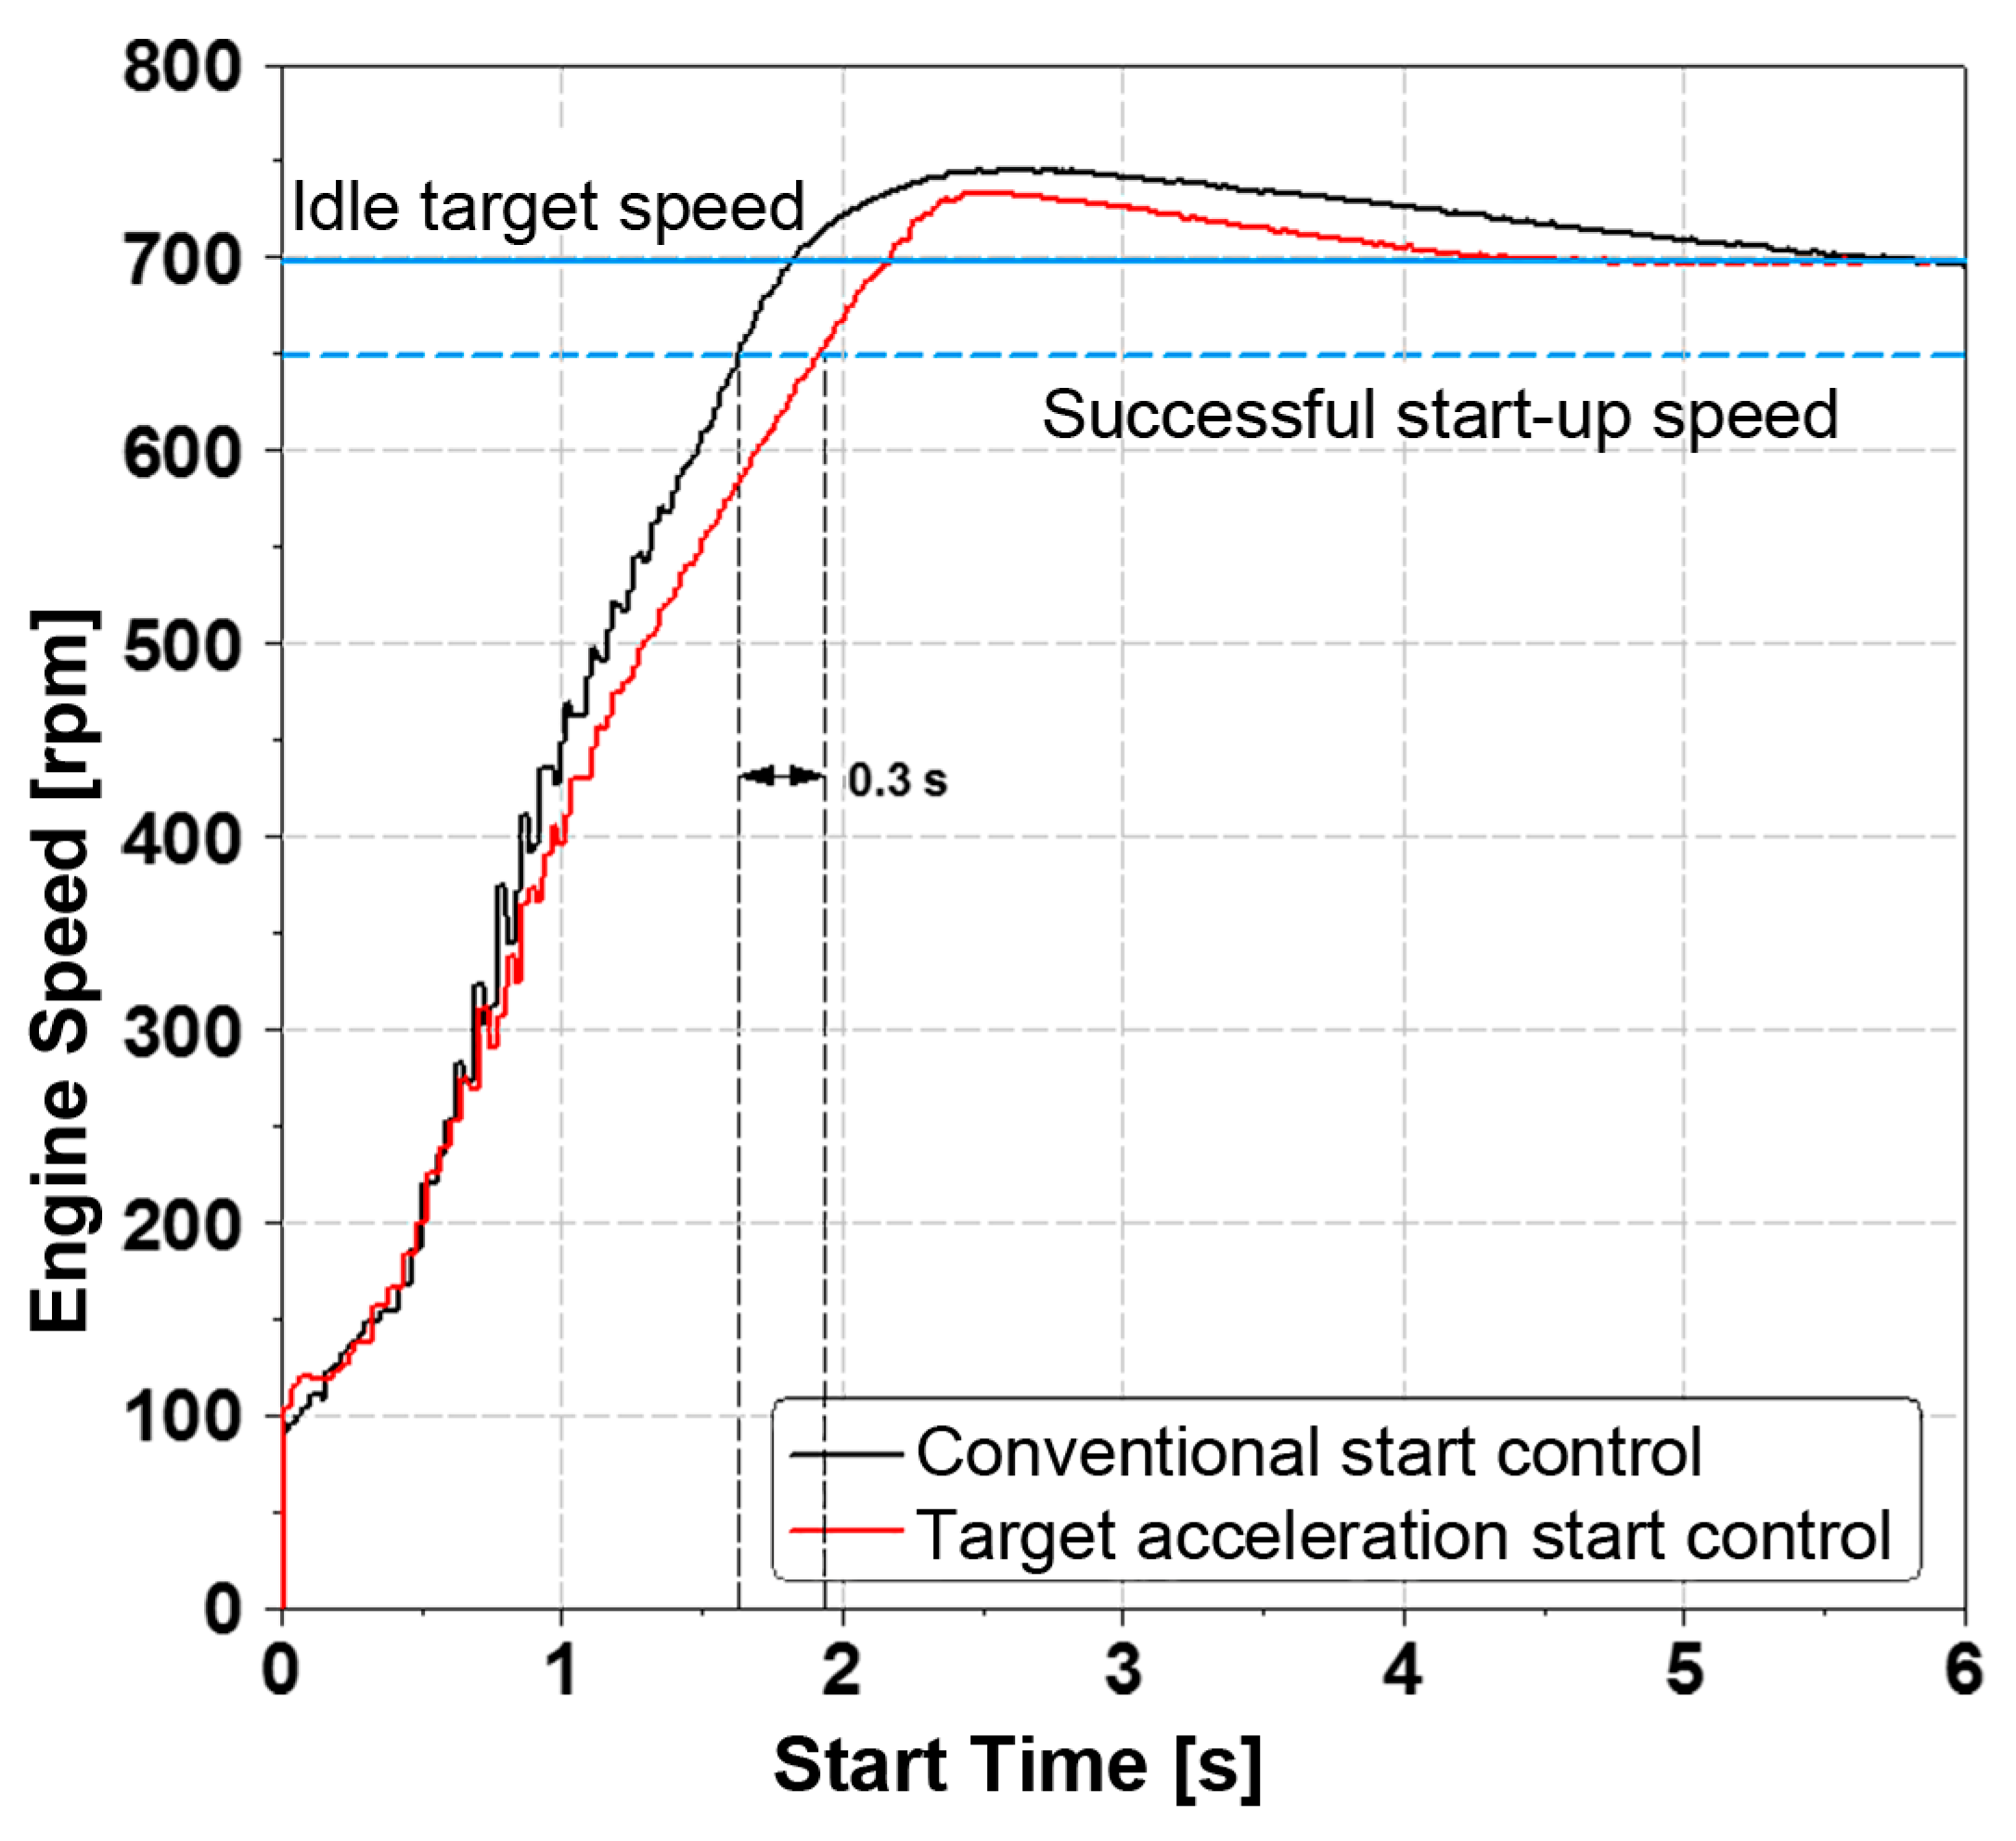
A comparison of the speed change curves under different start-up control strategies is shown in Figure 13, in which the black curve is the result of conventional start-up control after full calibration and optimization, and the red curve is the starting speed curve of the proposed start-up process control strategy based on the target speed variation characteristics. Comparing the two sets of curves, it can be seen that under the premise that the starting time of the control strategy proposed in this paper is only 0.3 s longer than that of the conventional starting control strategy, the speed overshoot during the transition to idling speed after successful starting is significantly improved. The speed overshoot is reduced by 12 rpm compared to the conventional control strategy, which is a 25% reduction. The time taken to stabilize the speed at the idle target speed was reduced by 1.3 s, representing a 23.6% decrease in time.
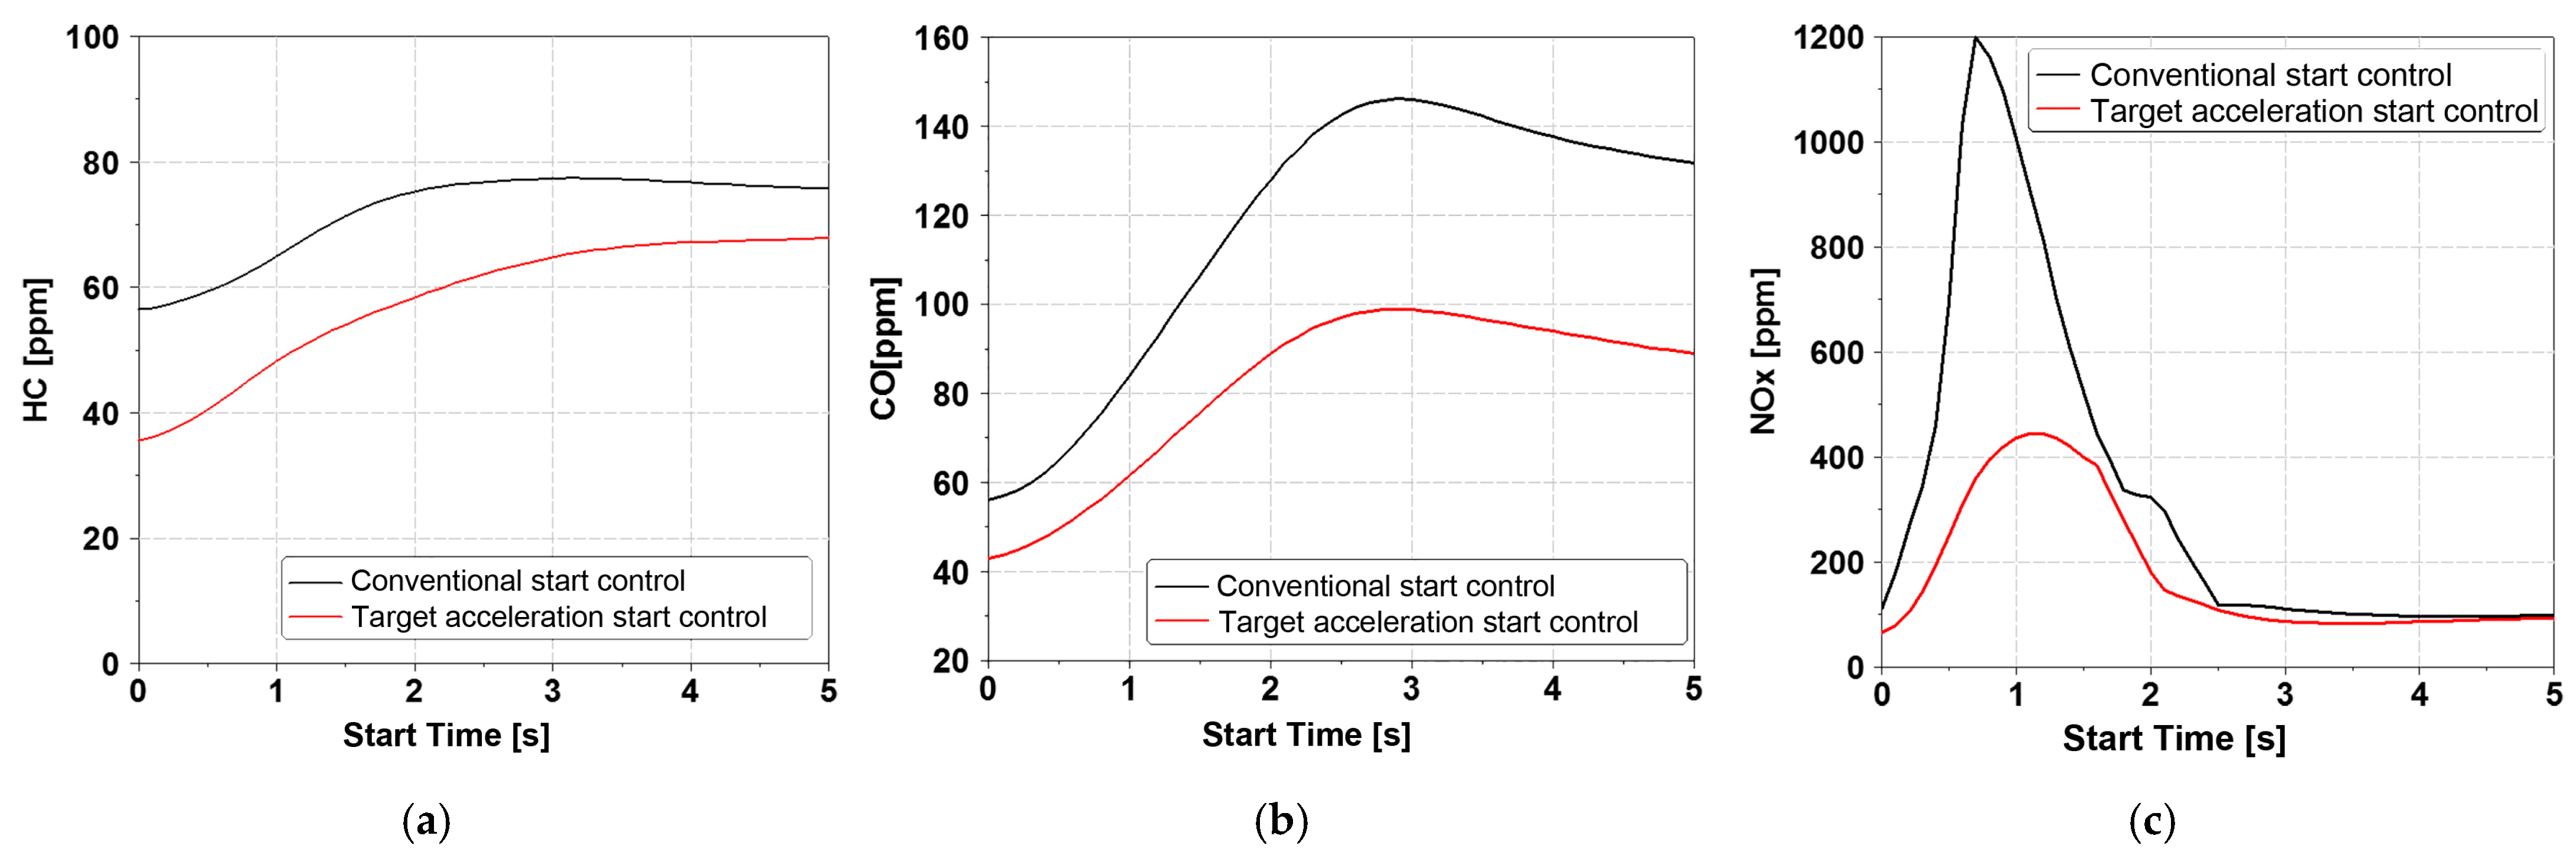
The comparisons of HC, CO, and NOx emissions during the start-up process under different start-up control strategies are shown in Figure 14a–c, respectively. Due to the high injection quantity of the traditional start-up control strategy, which results in insufficient combustion during the start-up process, the HC and CO emissions are significantly higher than those proposed in this paper. The injection quantity controlled by the start-up control strategy proposed in this paper is more in line with the target speed variation characteristics set during the engine start-up process. Therefore, the peak value of HC emission is reduced from 77.5 ppm to 67.9 ppm, representing a 12.4% decrease in emissions. The average value between start-up and idle stabilization is also reduced, from 72.0 ppm to 52.4 ppm, representing a 27.2% decrease. The peak CO emission concentration was reduced by 32.5% from 146.3 ppm to 98.8 ppm, and the average value between the start and idle stabilization was decreased by 35.1% from 117.5 ppm to 76.3 ppm. Due to the high injection quantity of the traditional start-up control strategy, the combustion temperature in the cylinder during the start-up process is excessively high, leading to more severe NOx emissions. After adopting the control strategy proposed in this paper, the peak NOx emission concentration is significantly reduced from 1199 ppm in the conventional control strategy to 445.3 ppm, which is 62.9% lower, and the average value between the start and idle stabilization is reduced from 330.0 ppm to 194.7 ppm, which is 41.0% lower.

5. Conclusions

This article proposes a control strategy for transient fuel injection during the starting process of automotive diesel engines based on the target speed variation characteristics. Experimental research on control strategies was conducted on a 7 L six-cylinder high-pressure common rail diesel engine at an ambient temperature of 25 °C. This approach addresses the problems of limited energy-saving and emission reduction effects, complex calibration work, and unfavorable low-carbon development associated with traditional diesel engine starting control strategies. The required torque for the starting process is divided into two parts: starting acceleration torque and starting resistance torque, where the starting acceleration torque is obtained through the designed target speed variation characteristics.
(1)
To determine the target speed variation characteristics of the start-up process, linear functions with slopes of −80, −40, 40, and 80 were set as the target accelerations for comparison tests. It can be seen that the characteristics of speed variation based on different accelerations have a significant influence on the starting time, the stability of the transition to idle speed, and the cumulative fuel consumption and emission characteristics. When the speed variation characteristics corresponding to acceleration with a slope of 40 are the control target curve, the cumulative injection quantity of the start-up process is reduced by 25.9% compared to the traditional control method while maintaining minimal changes in start-up time and emission characteristics.
(2)
To verify the advantages of the proposed control strategy, an emission comparison test was conducted with the conventional starting control strategy. The results show that the proposed control strategy significantly improves HC, CO, and NOx emissions, with peak concentrations reduced by 12.4%, 32.5%, and 62.9%, and average concentrations reduced by 27.2%, 35.1%, and 41.0%, respectively, under the premise that the starting time is extended by only 0.3 s. Meanwhile, the stability of the start-up process was significantly improved, with a 12 rpm reduction in overshooting speed, equivalent to 25% less, and a 1.3 s reduction in speed fluctuation time, which was 23.6% shorter. It demonstrates that the current control method effectively enhances the starting performance, which is of great significance for the diversified development of automotive power sources.
(3)
The control strategy proposed in this paper demonstrates significant effectiveness in enhancing the starting performance of automotive diesel engines. Moreover, it requires neither additional auxiliary equipment nor fuel replacement. This approach offers novel methods and insights for controlling and calibrating transient fuel injection quantities during the diesel engine starting process. This methodology also holds potential for reducing fuel consumption and pollutant emissions during the frequent starting cycles of hybrid vehicles while improving starting smoothness. This holds significant importance for the decarbonization and diversification of automotive power sources.
(4)
However, this study has several limitations. The ambient temperature during the experiments was set at 25 °C. Current research indicates that the cold-start combustion reliability of diesel engines progressively deteriorates at lower ambient temperatures. The control strategy proposed in this paper, when combined with auxiliary measures such as in-take air preheating, has the potential to further enhance starting performance.

Author Contributions

Y.L.: Conceptualization, Data curation, Formal analysis, Investigation, Methodology, Software, Visualization, Writing—original draft. D.L.: Data curation, Funding acquisition, Project administration, Resources, Software, Supervision, Writing—review & editing. M.Y.: Data curation, Investigation, Writing—review & editing. H.Z.: Formal analysis, Funding acquisition, Supervision, Validation, Writing—review & editing. L.G.: Investigation, Resources, Supervision, Writing—review & editing. D.Q.: Investigation, Supervision, Validation, Writing—review & editing. J.L.: Writing—review and editing. X.L.: Conceptualization, Methodology, Project administration, Resources, Software, Supervision, Validation, Writing—review & editing. All authors have read and agreed to the published version of the manuscript.

Funding

This work was supported by the Natural Science Foundation of Jilin Province (Project code: 20240101139JC).

Data Availability Statement

The original contributions presented in this study are included in the article. Further inquiries can be directed to the corresponding author.

Conflicts of Interest

Author, Jianjiang Liu, was employed by the company FAW Jiefang Group. The remaining authors declare that the research was conducted in the absence of any commercial or personal relationships that could have appeared to influence the work reported in this paper. The authors declare that this study received funding from the Natural Science Foundation of Jilin Province. The funder was not involved in the study design, collection, analysis, interpretation of data, the writing of this article.

References

  1. Yang, L.J.; Lei, J.L.; Wang, Z.J.; Wang, D.F.; Chen, J.L.; Li, D.S.; Liu, K.; Sun, L. Impacts of different ambient temperatures on cold-start characteristics of speed-up duration of an ISAD hybrid diesel engine in plateau. Fuel 2025, 381, 133492. [Google Scholar] [CrossRef]
  2. Bielaczyc, P.; Merkisz, J.; Pielecha, J. Investigation of Exhaust Emissions from DI Diesel Engine During Cold and Warm Start; Technical Paper; SAE International: Warrendale, PA, USA, 2001. [Google Scholar]
  3. Henein, N.A.; Taraza, D.; Chalhoub, N.; Lai, M.-C.; Bryzik, W. Exploration of the Contribution of the Start/Stop Transients in HEV Operation and Emissions; Technical Paper; SAE International: Warrendale, PA, USA, 2000. [Google Scholar]
  4. Gao, J.B.; Chen, H.B.; Li, Y.; Chen, J.Y.; Zhang, Y.J.; Dave, K.; Huang, Y. Fuel consumption and exhaust emissions of diesel vehicles in worldwide harmonized light vehicles test cycles and their sensitivities to eco-driving factors. Energy Convers. Manag. 2019, 196, 605–613. [Google Scholar] [CrossRef]
  5. Baghani, A.; Chitsaz, I.; Teymoori, M.M. A novel method for real driving emission prediction utilizing an artificial neural network. Eng. Appl. Artif. Intel. 2024, 137, 109267. [Google Scholar] [CrossRef]
  6. Xu, K.; Liu, Y.L.; Zhang, H.; He, X.; Wei, W.; Duan, J.F. Experiments and modeling of the thermal spray-chasing phenomenon during split injection processes. Int. J. Therm. Sci. 2024, 205, 109255. [Google Scholar] [CrossRef]
  7. Wang, X.R.; Li, H.M.; Li, G.X.; Gao, Y.; Huo, H.B.; Zhang, X.Q.; Wang, Z.G.; Bai, H.L. Experimental investigation of atomization characteristics at low temperature environments during diesel engine cold start. J. Energy Inst. 2024, 113, 101544. [Google Scholar] [CrossRef]
  8. Wu, Z.K.; Deng, P.; Han, Z.Y. A numerical study on fuel film and emissions formations during cold start in a diesel engine using an improved spray-wall impingement model. Fuel 2022, 320, 123898. [Google Scholar] [CrossRef]
  9. He, X.; Xu, K.; Liu, Y.L.; Zhang, Z.; Zhang, H.; Zhao, J. Effects of ambient density and injection pressure on ignition and combustion characteristics in diesel spray under plateau cold-start conditions. Fuel 2023, 352, 129039. [Google Scholar] [CrossRef]
  10. Trivedi, M.J.; Raut, P.D.; Alkhayat, S.; Henein, N.A. Analysis of the ion current in misfiring and firing cycles during the cold starting of a compression ignition engine. Int. J. Engine Res. 2024, 25, 466–483. [Google Scholar] [CrossRef]
  11. Duan, L.S.; Tan, P.Q.; Liu, J.T.; Liu, Y.; Chen, Y.J.; Lou, D.M.; Hu, Z.Y. Emission characteristics of a diesel engine with an electrically heated catalyst under cold start conditions. J. Clean. Prod. 2022, 380, 134965. [Google Scholar] [CrossRef]
  12. Li, D.; Wu, D.Y.; Gui, X.L.; Liao, S.D.; Zhu, M.N.; Yu, F.; Zheng, J.Y. Exploring ultrafine particle emission characteristics from in-use light-duty diesel trucks in China using a portable measurement system. Environ. Res. 2024, 263, 120234. [Google Scholar] [CrossRef]
  13. Cho, S.; Wu, A.; Kim, N.; Busch, S.; Pintor, D.L. Formation of CH2O and UHC emissions during catalyst-heating operation compression ignition engines: High-speed FID and mid-IR extinction diagnostics. Fuel 2023, 342, 127832. [Google Scholar] [CrossRef]
  14. Wang, P.; Qin, B.; Shi, L.; Kang, W.; Zhao, B.; Deng, K.Y. Experimental investigation of the effects of preheating temperature on low-temperature cold start performance, emissions and energy conversion of diesel-electric hybrid. Energy Convers. Manag. 2023, 281, 116844. [Google Scholar] [CrossRef]
  15. Deng, Y.W.; Liu, H.W.; Zhao, X.H.; Jiaqiang, E.; Chen, J.M. Effects of cold start control strategy on cold start performance of the diesel engine based on a comprehensive preheat diesel engine model. Appl. Energy 2018, 210, 279–287. [Google Scholar] [CrossRef]
  16. Sun, H.; Zhang, W.G.; Wang, Y.X. Cold start performance of diesel engine at extremely low ambient temperatures and high altitudes: The superiority of premixing diethyl ether. Fuel 2024, 372, 132249. [Google Scholar] [CrossRef]
  17. Sun, H.; Zhang, W.G.; Wang, Y.X. Experimental study on improving cold start performance of diesel engines at extremely low ambient temperatures with diethyl ether. Energy 2023, 283, 129122. [Google Scholar] [CrossRef]
  18. Sun, H.; Zhang, W.G.; Wang, Y.X. Experimental study on the cerium oxide nanoparticles doped in diesel fuel improving the cold start performance of diesel engines at high-altitude and low-temperature environments. Fuel 2025, 381, 133333. [Google Scholar] [CrossRef]
  19. Zare, A.; Nabi, M.N.; Bodisco, T.A.; Hossain, F.M.; Rahman, M.M.; Van, T.C.; Ristovski, Z.D.; Brown, R.J. Diesel engine emissions with oxygenated fuels: A comparative study into cold-start and hot-start operation. J. Clean. Prod. 2017, 162, 997–1008. [Google Scholar] [CrossRef]
  20. Shen, K.; Matthews, R.D.; Chiu, J.P.; Darden, M.H.; Faidley, R.W.; Nichols, S.P.; Weldon, W.F. Initial Study of Railplugs as an Aid for Cold Starting of Diesels; Technical Paper; SAE International: Warrendale, PA, USA, 1994. [Google Scholar]
  21. Pastor, J.V.; Bermúdez, V.; García-Oliver, J.M.; Ramírez-Hernández, J.G. Influence of spray-glow plug configuration on cold start combustion for high-speed direct injection diesel engines. Energy 2011, 36, 5486–5496. [Google Scholar] [CrossRef]
  22. Xu, K.; Liu, Y.L.; Zhao, J.; Zhang, H.; He, X. Investigation of the dynamic interaction mechanism of split injections during the ignition process under diesel engine-like cold- and hot-start conditions. Fuel 2024, 370, 131830. [Google Scholar] [CrossRef]
  23. Lu, K.B.; Qiu, H.J.; Chen, Z.Q.; Shi, L.; Deng, K.Y. Environmental adaptability method for improving the cold start performance of the diesel engine based on pilot injection strategy. Energy 2023, 281, 128215. [Google Scholar] [CrossRef]
  24. Li, Y.K.; Wang, D.F.; Shi, Z.J.; Chen, H.Y.; Liu, F.S. Environment-adaptive method to control intake preheating for diesel engines at cold-start conditions. Energy 2021, 227, 120423. [Google Scholar] [CrossRef]
  25. Boehner, W.; Hummel, K. Common Rail Injection System for Commercial Diesel Vehicles; Technical Paper; SAE International: Warrendale, PA, USA, 1997. [Google Scholar]
  26. Liu, R.C.; Meng, X.H.; Li, P. Transient tribodynamic analysis of crankshaft-main bearing system during engines starting up. J. Eng. Tribol. 2018, 232, 535–549. [Google Scholar] [CrossRef]
  27. Liu, R.C.; Meng, X.H.; Cui, Y. Influence of numerous start-ups and stops on tribological performance evolution of engine main bearings. Int. J. Engine Res. 2020, 21, 1362–1380. [Google Scholar] [CrossRef]
  28. da Silva, L.F.M.; Adams, R.D.; Sato, C.; Dilger, K. Proceedings of the Institution of Mechanical Engineers, Part D: Journal of Automobile Engineering. J. Automob. Eng. 2021, 235, 3223. [Google Scholar] [CrossRef]
  29. Su, Y.; Liu, Z.; Han, Y.; Guo, L.; Li, J. Improvements on the Start Performance of Diesel Engine by Fuel Control Strategy Optimization and Heating Measures; Technical Paper; SAE International: Warrendale, PA, USA, 2008. [Google Scholar]
  30. Yang, F.; Zhang, J.; Han, Q.; Ouyang, M. Optimization of a Common Rail Diesel Engine Start-Up Process; Technical Paper; SAE International: Warrendale, PA, USA, 2004. [Google Scholar]
  31. Miyaki, M.; Fujisawa, H.; Masuda, A.; Yamamoto, Y. Development of New Electronically Controlled Fuel Injection System ECD-U2 for Diesel Engines; Technical Paper; SAE International: Warrendale, PA, USA, 1991. [Google Scholar]
  32. Stotsky, A. Adaptive estimation of the engine friction torque. Eur. J. Control. 2007, 13, 618–624. [Google Scholar] [CrossRef]
  33. Konrad, R. Diesel Engine Management Systems and Components; Springer Vieweg: Wiesbaden, Germany, 2014; pp. 220–271. [Google Scholar]
  34. Huang, Y.; Yang, F.; Ouyang, M.; Chen, L.; Yang, X. Optimal Feedback Control with in-Cylinder Pressure Sensor Under Engine Start Conditions; Technical Paper; SAE International: Warrendale, PA, USA, 2011. [Google Scholar]
  35. Lin, X.D.; Han, X.M.; Li, D.G. Design and Evaluation for Target Indicated Torque Based Engine Starting Control Strategy in a High Pressure Common Rail Diesel Engine. Math. Probl. Eng. 2016. [Google Scholar] [CrossRef]
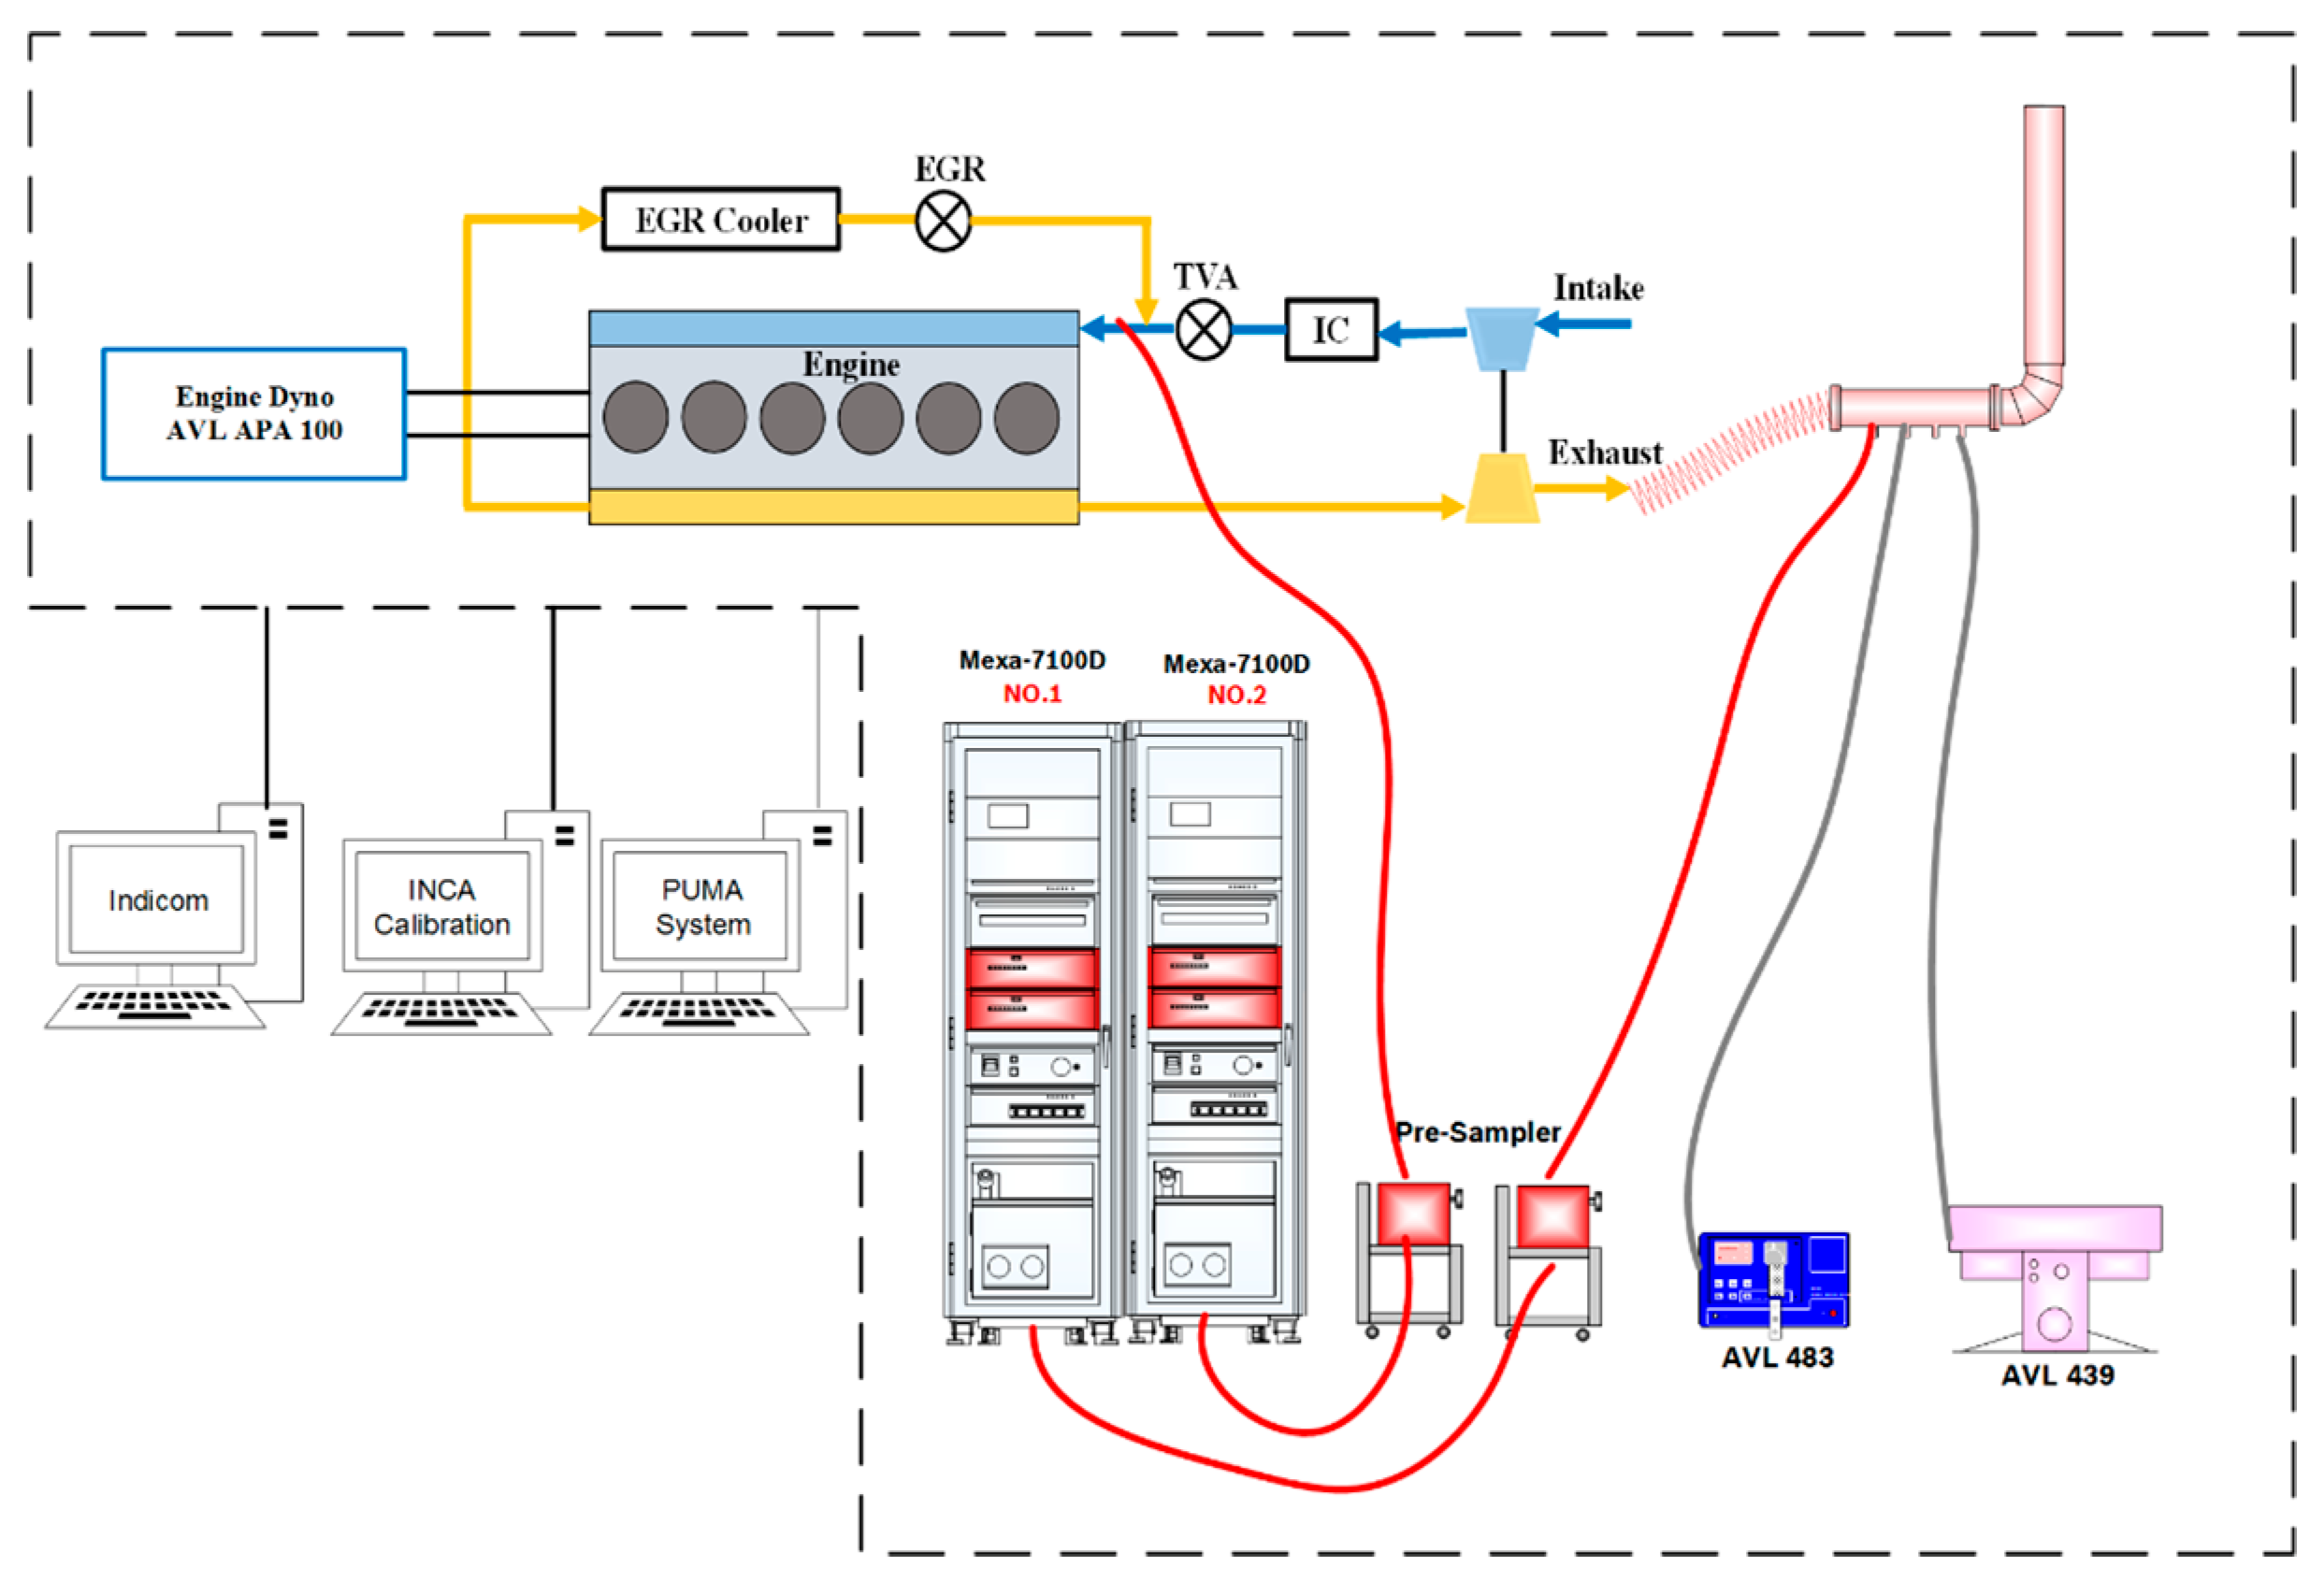
Figure 1. Schematic diagram of test bench.
Energies 18 05256 g001
Figure 2. Division of the start-idle process.
Energies 18 05256 g002
Figure 3. Target speed curve and target acceleration curve during start-up. (Black line: target speed. Green and blue lines: target acceleration).
Energies 18 05256 g003
Figure 4. Target acceleration curves for the start-up process with different slopes.
Energies 18 05256 g004
Figure 5. Comparison of the effect of different target accelerations on start-up speed control.
Energies 18 05256 g005
Figure 6. Comparison of (a) start-up success time of different target accelerations and (b) cumulative injection quantity of different target acceleration starts.
Energies 18 05256 g006
Figure 7. First ten-cycle cylinder pressure diagrams of different target acceleration controls.
Energies 18 05256 g007
Figure 8. First cycle injection quantity for different target acceleration control.
Energies 18 05256 g008
Figure 9. Effect of different target accelerations on start-up transient emissions: (a) HC emission; (b) CO emission; (c) NOx emission.
Energies 18 05256 g009
Figure 10. Start target torque control logic diagram.
Energies 18 05256 g010
Figure 11. Idle target torque control logic diagram.
Energies 18 05256 g011
Figure 12. Comparison of start transient injection quantity with different start control strategies.
Energies 18 05256 g012
Figure 13. Comparison of start speed control effects of different start control strategies.
Energies 18 05256 g013
Figure 14. Comparison of transient emissions of different start control strategies: (a) HC emission; (b) CO emission; (c) NOx emission.
Energies 18 05256 g014
Table 1. Main equipment and apparatus.
CategoryMeasuring InstrumentsManufacturer/LocationMeasurement RangeAccuracy
DynamometerAPA100AVL (Graz, Austria)0–12,000 r/min
Gas emission analyzerMEXA-7100DHORIBA (Kyoto, Japan)THC: 0–50,000 ppm
NOx: 0–10,000 ppm
CO(L): 0–5000 ppm
<0.5% FS
<0.5% FS
<0.5% FS
Soot emission analyzer483AVL (Graz, Austria)0.005–50 mg/m3~5 μg/m3
Opaque smoke meter439AVL (Graz, Austria)0–100%0.01%
Fuel flow meter735SAVL (Graz, Austria)0–125 kg/h≤0.0005 g/cm3
Cylinder pressure sensor6058AS41Kistler (Winterthur, Switzerland)0–250 bar≤±0.4%/FSO
Charge amplifier5011Kistler (Winterthur, Switzerland)±10–999,000 pC<±0.05% FS
Combustion analyzerIndicomAVL (Graz, Austria)
Table 2. The tested engine specifications.
DescriptionSpecification
Engine typeFour-stroke inline diesel
Number of cylinders6
Bore102 mm
Stroke120 mm
Displacement volume7 L
Compression ratio16.1
Rated power at speed248 kW@2100 r/min
Maximum torque at speed1150 Nm@1200–1800 r/min
Connecting rod length198 mm
Eddy current ratio1.5
Table 3. Effect of different target accelerations on starting performance.
GroupsStart Time (s)Cumulative Fuel Consumption (mg)Speed Overshoot (rpm)Overshooting Time (s)Average HC (ppm)Average CO (ppm)Average NOx (ppm)
A1.84919.0352.1854.1472.55191.92
B1.81889.3342.0252.4376.29194.68
C1.7858.7402.3559.7173.73188.11
D1.73872.2372.2353.11976.68193.41
Disclaimer/Publisher’s Note: The statements, opinions and data contained in all publications are solely those of the individual author(s) and contributor(s) and not of MDPI and/or the editor(s). MDPI and/or the editor(s) disclaim responsibility for any injury to people or property resulting from any ideas, methods, instructions or products referred to in the content.