1. Introduction
An electromagnetic railgun is an advanced system that launches projectiles utilizing electromagnetic launch effects. As an innovative weapon platform, it offers multiple advantages, including rapid response, high energy output, precise control, strong concealment (low detectability), and relatively low cost. Due to these benefits, electromagnetic railgun technology has attracted significant worldwide attention in recent years and has become a key research focus in military technology [
1].
During launch, the passage of transient current through the rail induces significant heating. This thermal load elevates rail temperature, potentially leading to deformation or melting [
2], which compromises the electromagnetic railgun’s effectiveness and safety. Consequently, managing thermal dissipation during continuous firing is critical for extending service life, necessitating the implementation of practical cooling techniques to rapidly reduce rail temperature. Available methods include liquid cooling, air cooling, jet impingement cooling, micro-channel cooling, and spray cooling. Among these active cooling approaches, spray cooling demonstrates exceptionally high heat removal capacity. Therefore, this study investigates an electromagnetic rail spray cooling system through combined experimental and simulation methods.
Using non-contact optical measurement techniques, A.G. Pautsch et al. [
3] determined the local average liquid film thickness generated by low-flow single-nozzle and high-flow four-nozzle array sprays. For four-nozzle arrays, it was discovered that although the region with the worst heat transfer performance typically has the thickest liquid film, the region with the thickest liquid film is in the spray overlap region, where variables like localized liquid film velocity and spray flow rate affect the heat transfer capability. Zhao Rui [
4] established a mathematical model of spray cooling. It was discovered that for different wall heating powers under liquid film heat transfer, the liquid film is in the single-phase zone when the heating power is low. At this time, the heat is primarily removed from the wall through the flow of the liquid film and air convection heat transfer. Wang et al. [
5] discovered that as the wall temperature rose, the thin liquid film evaporation and spray cooling’s capacity to transfer heat increased in the single-phase zone. When spray cooling operates in the non-boiling regime, the relationship between the Nusselt number, Reynolds number, and dimensionless temperature is more clearly defined. To investigate the heat transfer characteristics within this regime, Abbasi et al. [
6] conducted an experimental study on the heat transfer efficiency of single-phase flow using a multi-nozzle spray configuration. The findings demonstrated a strong correlation between the normal pressure on the wall and the local heat transfer coefficient of the cooled surface. Cheng et al. [
7] reported a contrasting conclusion in their experimental study. They observed that the maximum total heat transfer coefficient at the wall was achieved under specific conditions: a spray height of 4.3 mm, which resulted in a surface spray coverage of merely 12%.
Bhatt et al. [
8] examined the impact of cooling medium specific heat capacity and surface tension on spray cooling heat transfer performance. Their findings demonstrated that employing C
6H
6, C
3H
6O, and C
6H
14 as coolants yielded critical heat flux values 20%, 40%, and 30% higher, respectively, compared to pure water. Separately, Cui et al. [
9] explored the influence of three inorganic salt additives (NaCl, Na
2SO
4, and MgSO
4) when using water as the base coolant. The results indicated that elevating the salt concentration in the cooling fluid markedly enhanced the heat transfer capacity of the spray cooling system within the boiling heat transfer regime.
To elucidate the heat transfer mechanism of single-phase spray cooling under vibrational conditions, Chen et al. [
10] established a closed-loop experimental system specifically designed for spray cooling on vibrating surfaces. Their research experimentally examined the effects of various vibration parameters, including the vibrational Reynolds number (Rev), dimensionless acceleration (Ac), amplitude, and frequency, on the heat transfer performance. In a separate study, Isares et al. [
11] proposed a novel hybrid cooling system that integrates a spray of hydrofluoroether (HFE)—an integrated, non-electrically conductive liquid—with forced air convection. A three-dimensional transient heat transfer model for a cylindrical lithium-ion battery module was developed using ANSYS Fluent. Numerical simulations were performed to assess how the liquid injection rate and the configuration of the injectors influence the module’s overall cooling performance.
Li et al. [
12] pointed out that the spray cooling system with R134a as a coolant can reduce the cabin wall temperature to 275 K, and the temperature drop rate can reach 1.05 K/s, so that the cabin cooling needs can be realized. Ni et al. [
13] attempted to explore the enhancement of the spray cooling of a vapor-liquid separation structure. Focusing on the contradiction between the heat transfer coefficient and critical heat flow, a double-decker surface was proposed to decouple the liquid supply and vapor separation.
Tan et al. [
14] developed a high-power spray cooling system and employed a multi-factor orthogonal experimental design, using heat transfer power and energy consumption ratio as evaluation metrics, to systematically investigate the influence of various parameters on system performance. Exploring a different approach, Fu et al. [
15] integrated spray cooling with a non-azeotropic mixture (R245fa/R142b) to achieve precise temperature control of heated surfaces, conducting experimental studies on the heat transfer characteristics within the boiling regime. Addressing the thermal management of high-power LEDs, Xiang et al. [
16] designed and established a high-performance spray cooling system, experimentally and numerically examining the effects of nozzle configuration, flow rate, and nozzle-to-surface distance on heat transfer.
Jin et al. [
17] created a numerical model to analyze evaporative and air cooling processes in an intermittent spray cooling system, focusing on the impact of heat load and liquid film thickness on evaporation time and heat transfer enhancement. For safety-critical applications, Liu et al. [
18] proposed an emergency refrigerant spray cooling method targeting the overheating stage of lithium-ion batteries to prevent thermal runaway. They developed a coupled model simulating battery overheating behavior and emergency spray cooling, using numerical simulation to define the onset and range of the decomposition reaction stage for NCM111 ternary batteries.
Li et al. [
19] performed a comparative study between standard spray cooling and immersed spray cooling. Their findings demonstrated that with appropriate control of immersion depth and spray pressure, immersion does not impair but can enhance heat transfer, with a maximum enhancement ratio of 12.2%. Myers et al. [
20] introduced a thermal management concept for railguns utilizing combined spray and evaporative cooling to remove heat directly from the rail’s inner surface. Experiments revealed that nozzle pressure had the most significant influence on the heat transfer coefficient, which reached a maximum value of 20,000 W/m
2 at a nozzle pressure of 60 lbf/in
2.
There have been a lot of investigations about the heat transfer characteristics of spray cooling at different conditions. However, there are few studies on the spray cooling of electromagnetic rail, but it is very important for the thermal management of electromagnetic railguns, and this is the main motivation for this study.
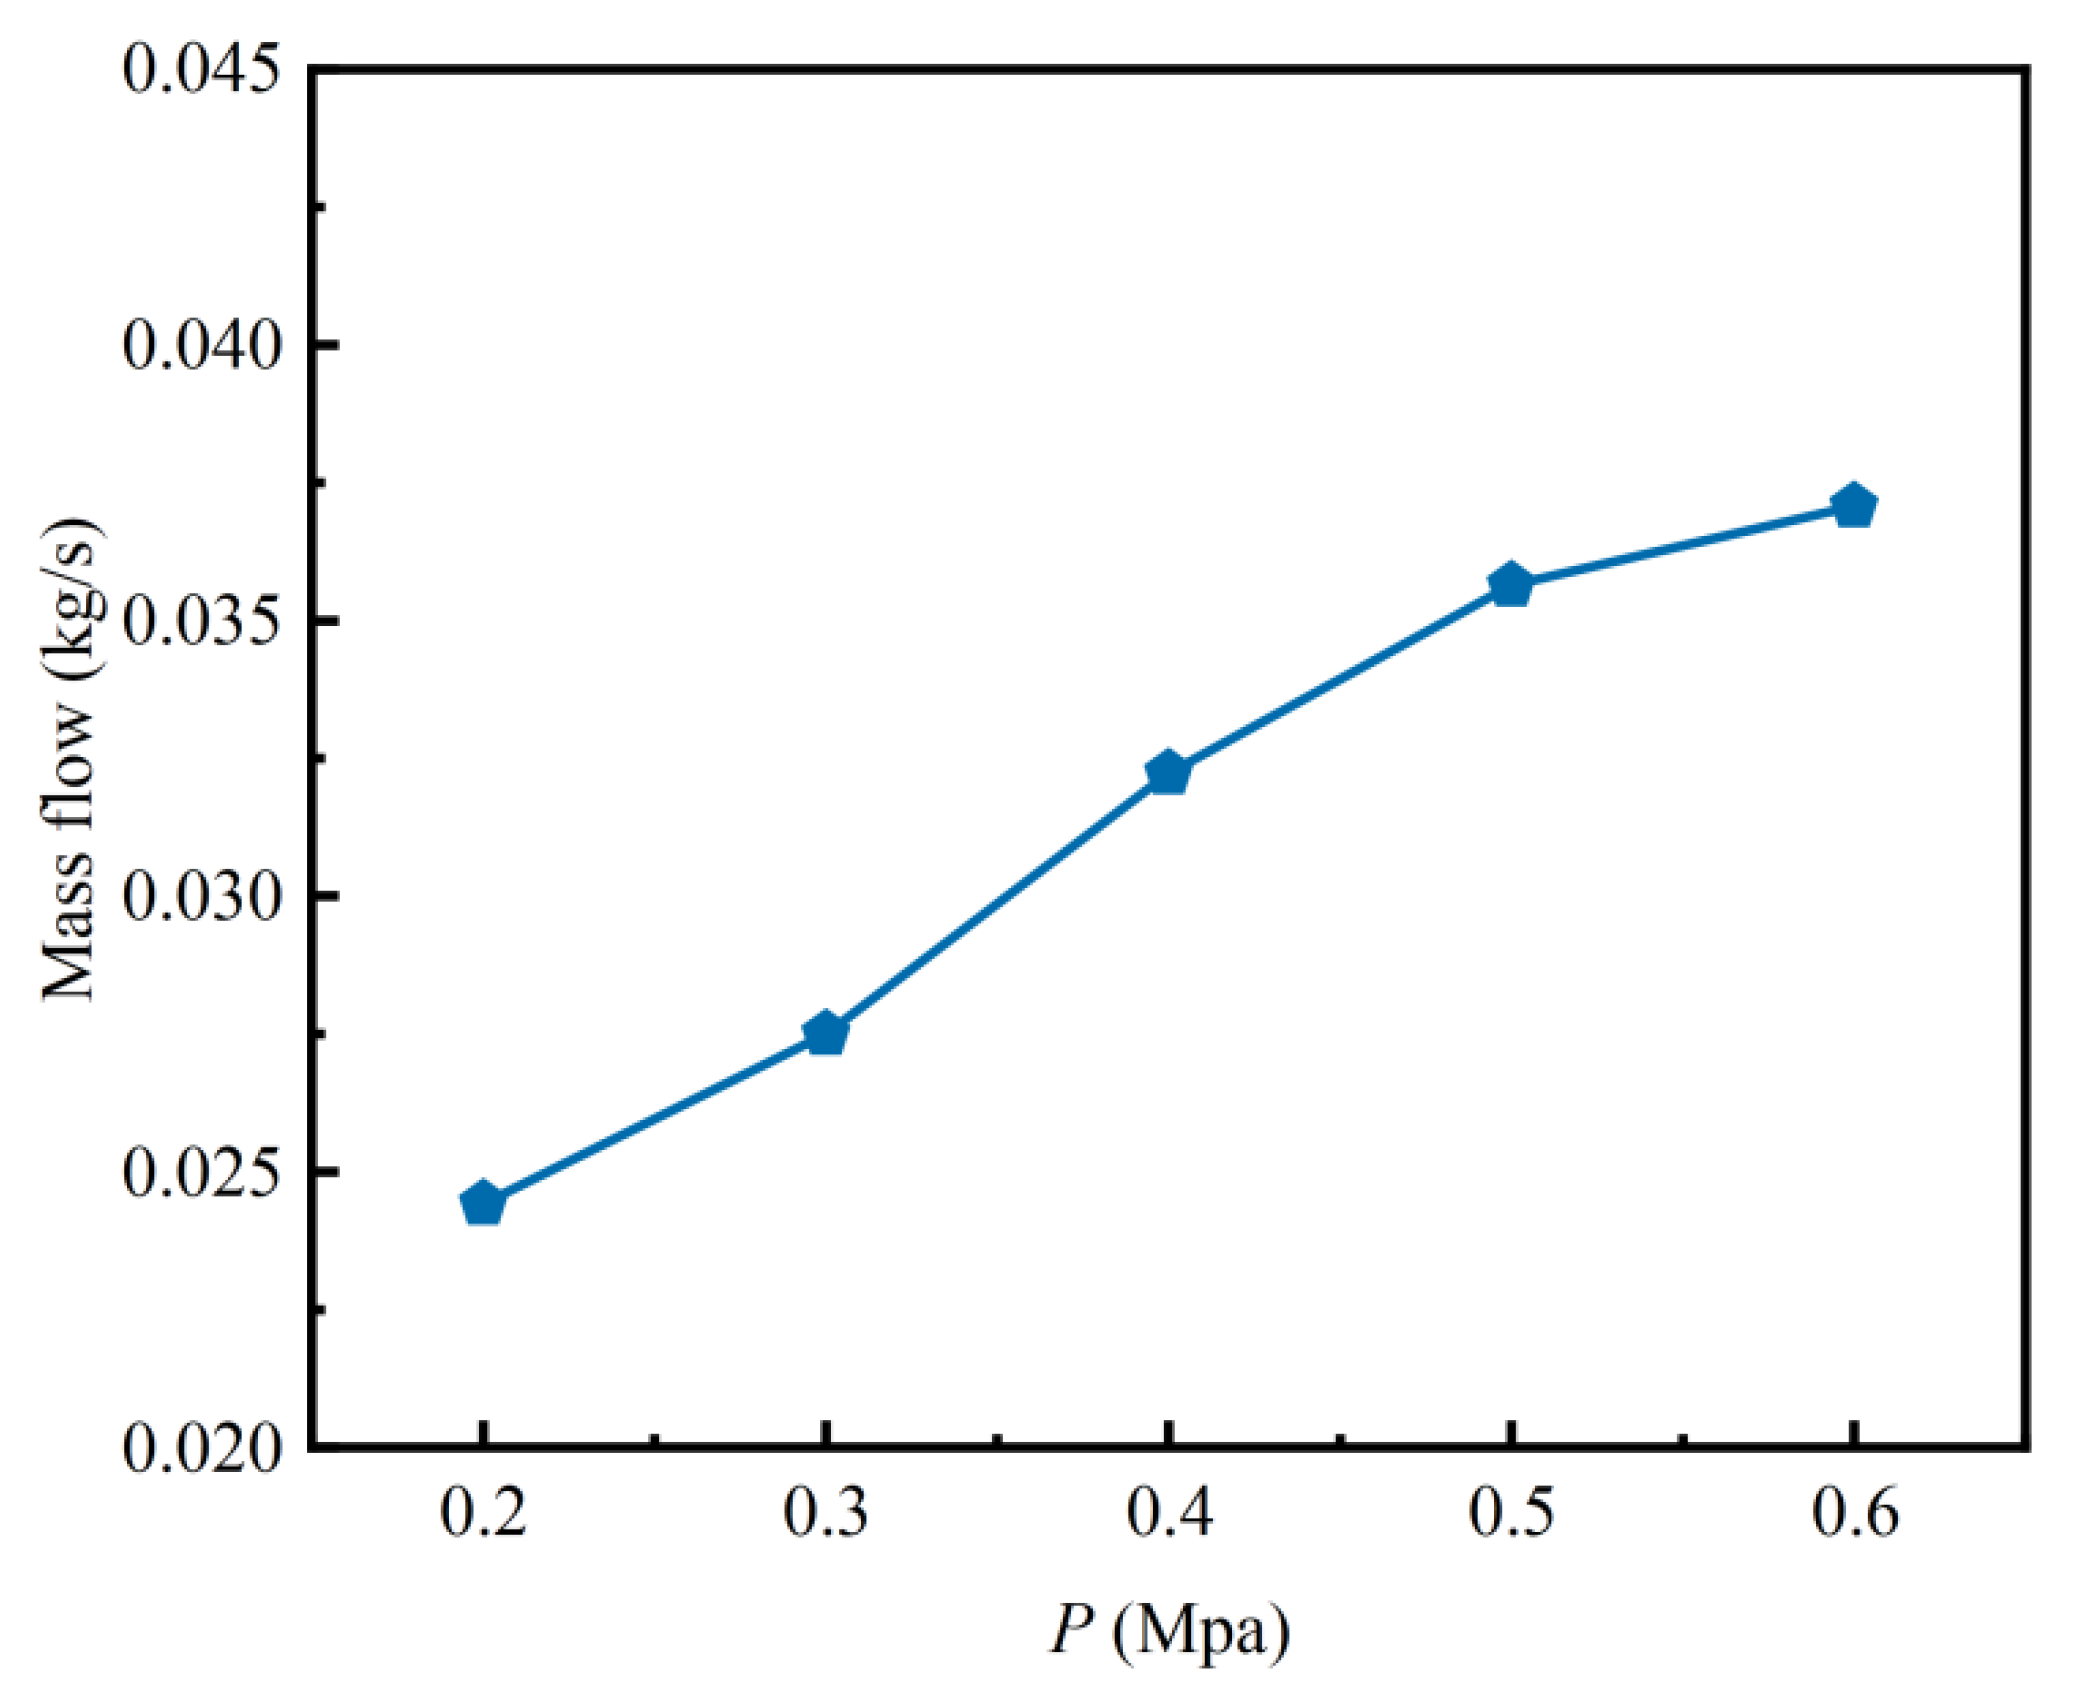
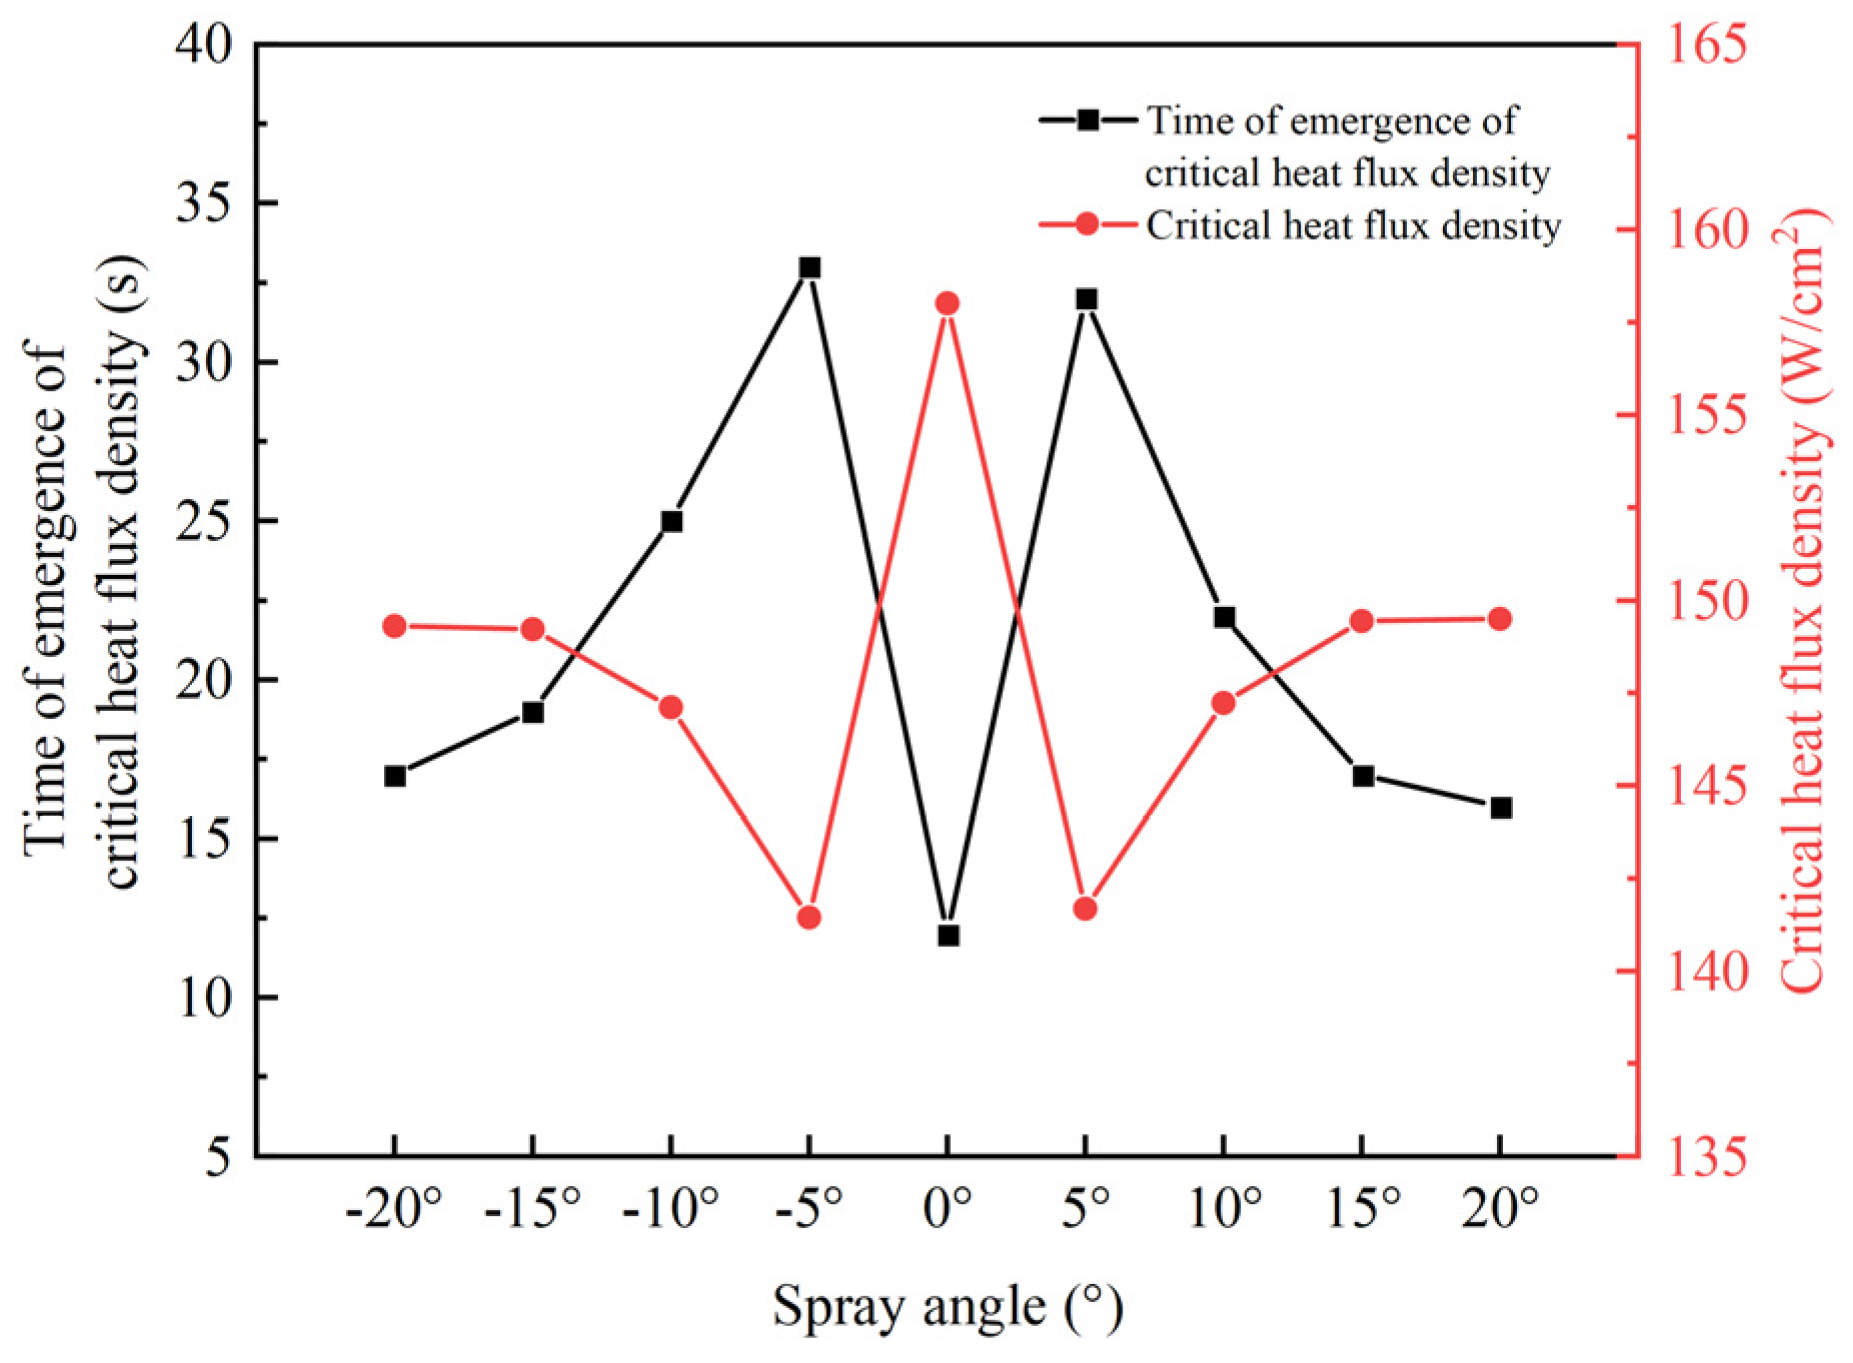
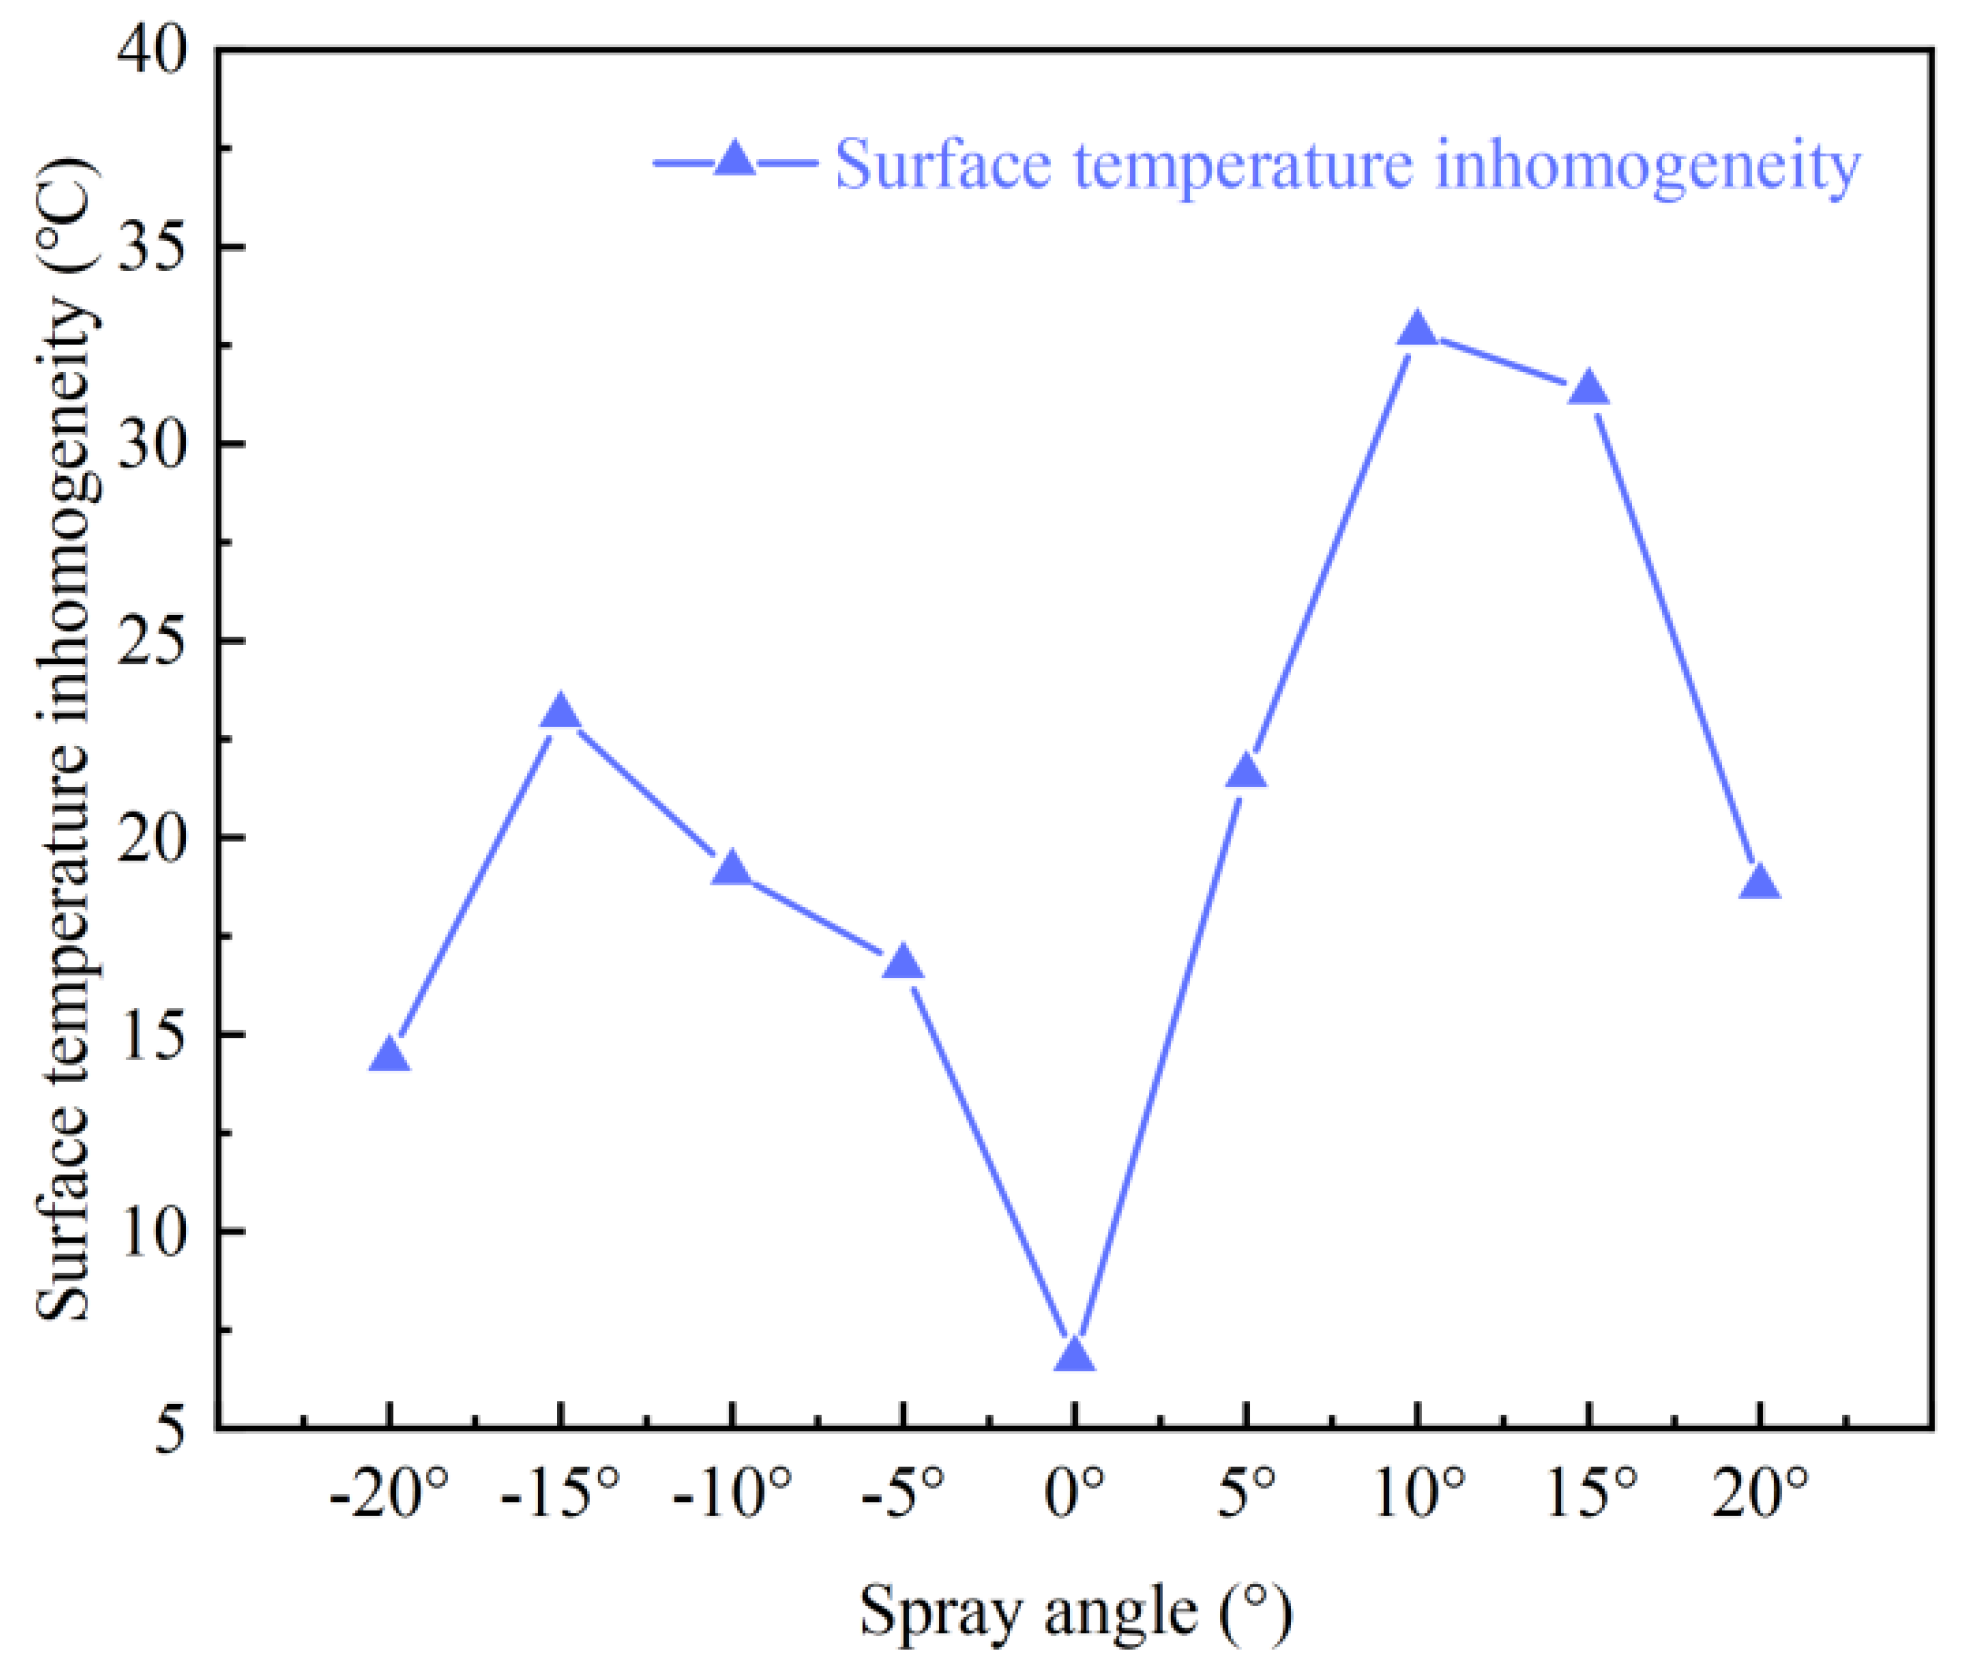
This paper established an experimental setup and conducted a simulation on the heat transfer characteristics of spray cooling on the rail surface. The main objectives are: (i) to analyze the the variation of nozzle flow rate under with inlet pressures, (ii) to study the influence of inlet pressure on the critical heat flux density, average wall heat flux density, average temperature drop and non-uniformity of the wall temperature, (iii) to investigate the effect of the spray angle on the critical heat flux, average wall heat flux density, the average temperature drop and temperature non-uniformity, and (iv) to simulate the impact of spraying cone angle and spray distance on the heat transfer characteristics.
The innovations of this work include: (i) By experimentally investigating the influence of spraying parameters on the cooling effect of the rail surface, the quantitative relationship between nozzle inlet pressure and flow rate can be definited, and the optimal nozzle inlet pressure and spraying angle can be determined, (ii) By simulating the effects of spray cone angle and spray distance on the critical heat flux and temperature uniformity of rail surface, the optimal spray cone angle and spray distance are obtained, and (iii) By optimizing and combining different spray parameters, the best effect of active cooling and thermal management of electromagnetic rail can be achieved.
3. Simulation of Spray Cooling of the Electromagnetic Gun Rail
In this paper, by using the ANSYS 2023 simulation software, a comprehensive study was conducted to analyze the impact of spray parameters on the heat transfer characteristics of a cooling system.
3.1. Physical Model
The calculation domain is a hexahedral spray chamber with a length of 400 mm, a width of 500 mm, and a height of 300 mm, as shown in
Figure 12.
A copper plate with a length of 400 mm, a width of 300 mm, and a thickness of 40 mm is selected as the simulated high-temperature section of the rail and placed on one side. The atomized droplets generated by the cooling medium passing through the nozzle are directly sprayed onto the heated wall, while the other surfaces are considered to be under adiabatic conditions. This article does not simulate the internal structure and heat transfer flow of the nozzle, and the nozzle type and nozzle parameters are directly given in the model.
Based on the set geometric size parameters and Fluent software, a geometric model of the spray cooling rail surface was established.
3.2. Mathematical Model
The cooling medium forms a liquid film through the atomizing nozzles and then breaks down into droplets of different diameters. These droplets impinge on the heated surface at various directions and velocities, forming a thin liquid film that enhances heat exchange. Considering the relatively low spray flow rate, the volume fraction of atomized droplets in the computational domain remains below 10–12%. Therefore, the Euler-Lagrangian method is employed, where the ambient gas is treated as the continuous phase and the droplets as the dispersed phase, to simulate the unsteady heat transfer process after the droplets impinge on the wall. This model takes into account the evaporation process involving heat and mass transfer of droplets and liquid films, while ignoring the influence of the droplet volume fraction on the continuous phase and droplet-droplet interactions.
3.3. Initial and Boundary Conditions
The ambient temperature is 20 °C.
The operating pressure is standard atmospheric pressure, 101.325 kPa.
Gravity acceleration g = 9.8 m2/s.
Pressure outlet boundary conditions are set around the fluid domain and on the back of the atomizing nozzle.
Set the discrete phase boundary condition as the escape model.
Simulate the rail surface to be set as a non-slip wall surface.
Discrete phase boundary conditions using a wall film model.
The side and back of the rail are considered insulation walls.
Set the initial temperature of the solid domain of the simulated rail to 400 °C.
3.4. Mesh Division of the Rail
The mesh division result is shown in
Figure 13, After meshing and initializing the model, it is necessary to simulate the model with a different number of grids. It is repeated by first solving the model with fewer grids, then refining the grid, and finally solving the refined model. When the difference between the calculation results of the model before and after the mesh refinement is small enough, it is considered that the continuous increase of the number of meshes will not affect the calculation results. It means the mesh independence verification has been completed. Since the spray cooling experimental system mainly studies the droplet motion and the heat transfer between the droplet and the rail surface, the mesh refinement is mainly focused on the near-wall of the rail and the spray area. In this study, the cooling process is chosen to last for 1 s, and the average temperature change of the rail surface, as well as the temperature distribution along the rail surface center line, are used to confirm the grid independence. The simulation results are shown in
Figure 14 and
Figure 15.
By comparing the calculation results, it is found that when the number of grids reaches 542,700, the average temperature of the wall surface changes with time, and the temperature distribution of the rail centerline basically does not change, indicating that the grid density is enough for the simulation calculation of the spray cooling model. Therefore, this paper selects a grid with a number of 542,700 grids for subsequent simulation analysis.
Due to the large number of grids in this simulation and the strong phase transition near the wall, in order to ensure the convergence of each step in the simulation process, it is necessary to set the time step size smaller in the initial stage. Therefore, in the initial stage of the simulation, the time step size is set to 0.00001 s. After 20,000 steps of simulation calculation, i.e., 2 s of cooling, the time step size is increased to 0.00005 s and the calculation continues to 10,000 steps. At this time, each time step size in the simulation calculation process can converge within 20 iterations. Then increase the time step to 0.0005 s and continue with the 10,000-step calculation. During this process, the convergence of the simulation calculation is still very good. Therefore, in the final stage of simulation calculation, set the time step to 0.001 s to complete the remaining simulation work.
3.5. Model Reliability Verification
In order to verify the reliability of the rail spray cooling simulation model in the subsequent simulation analysis process, this model was used to conduct a simulation under the optimal operating condition obtained from the previous experimental study. Specifically, the optimal operating condition is as follows: spray cone angle of 40°, nozzle inlet pressure of 0.5 MPa, spray flow rate of 3.9 L/min, and spraying perpendicular to the rail surface.
It can be seen from
Figure 16 that the simulation results show good agreement with the experimental data. The critical heat flux (CHF) in the experimental data is 158 W/cm
2, while that in the simulation results is 171.7 W/cm
2, with a deviation of approximately 8.7%. The occurrence time of CHF in the experimental data is 12 s after the start of cooling, and the occurrence time of CHF in the simulation results is 12.6 s after the start of cooling, with a deviation of 5%. Thus, it can be concluded that the rail spray cooling model established in this study is reliable and can be used for further simulation research in subsequent work.
4. Study on the Influencing Factors of Spray Cooling
4.1. Effect of Spraying Cone Angle on the Heat Transfer Characteristics
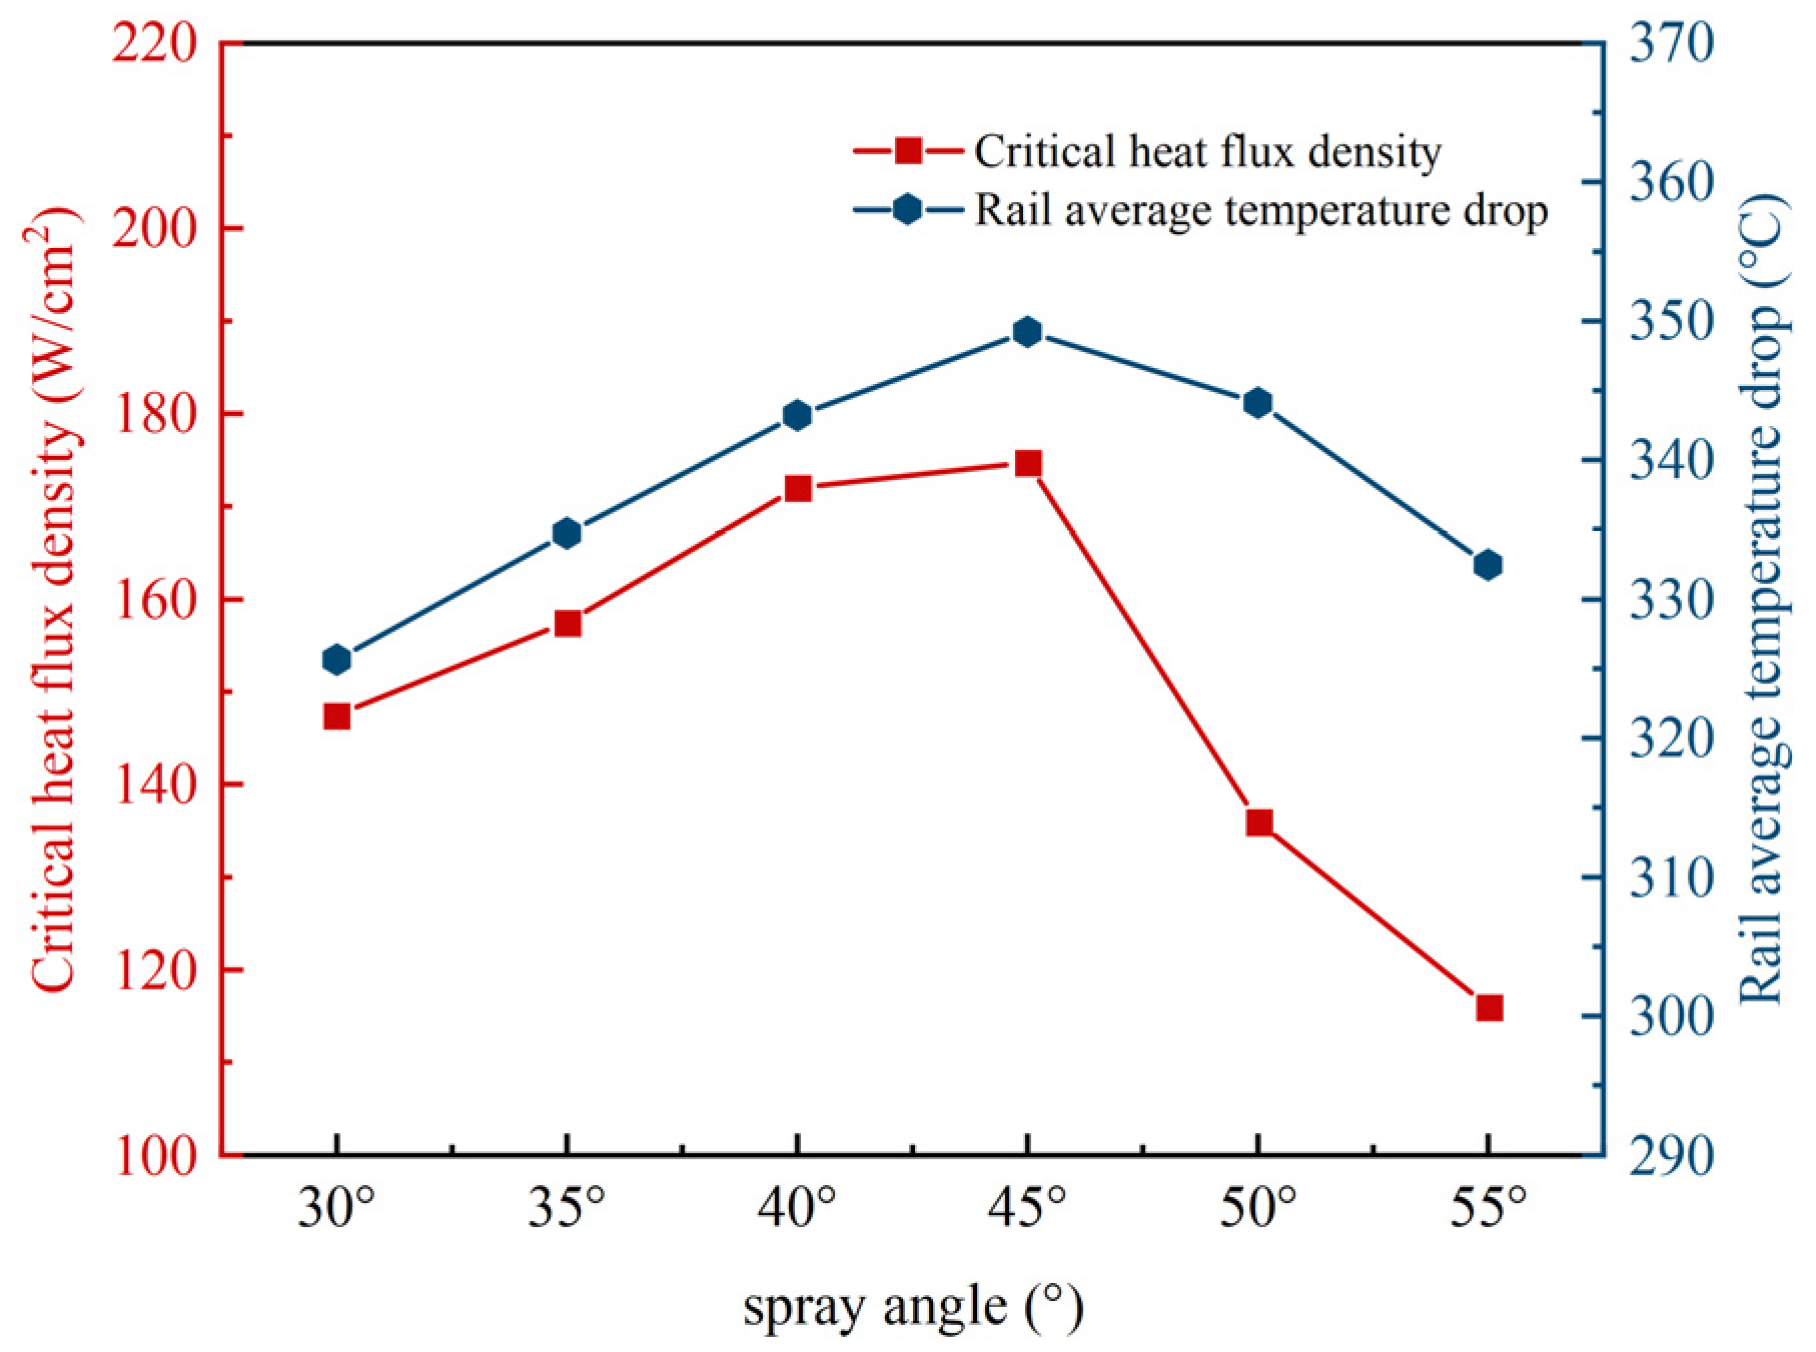
In the present work, the effect of spraying cone angle is investigated under the conditions that the inlet pressure of the nozzle is 0.5 MPa, the spray flow rate of a single nozzle is 3.9 L/min, the spray distance is 15 cm, the spraying angle is 0°, the initial temperature of the rail wall is 400 °C, and the spraying cone angle is increased by 5° as the step length. The spraying conditions with the spraying cone angle ranging from 35° to 55° are simulated, and the results are shown in
Figure 17 and
Figure 18.
Figure 17 shows the variation of the average heat flux density of the rail heat transfer wall with time under different spraying cone angles.
Figure 18 shows the change of critical heat flux density and the rail average temperature under different spraying cone angles.
It can be seen from
Figure 17 that the heat transfer process is in the transition boiling stage at the beginning of the cooling process. As the spraying cone angle increases, the heat transfer time in the transition boiling zone gradually shortens. After the start of spray cooling, the larger the spraying cone angle, the faster the heat flux climbs, and the better the heat transfer effect. However, it can be seen from
Figure 17 that after entering the nucleate boiling stage, when the spraying cone angle increases from 30° to 55°, the critical heat flux density increases first and then decreases. When the spraying cone angle is 45°, the critical heat flux density reaches the maximum of 174.7 W / cm
2. As the spray cone angle continues to increase, the critical heat flux decreases. When the spraying cone angle increases to 55°, the critical heat flux decreases to 116.34 W/cm
2, which is 33.41% less than the maximum value.
The reason is that at the spray distance of 15 cm, the spray area on both sides of the cooling system is almost tangent to the wall when the spraying cone angle is 45°. Therefore, increasing the spraying cone angle will lead to a part of the spray area outside the wall. For a single nozzle, most of the droplets are distributed in the spray edge area. With the increase of the spraying cone angle, the proportion of ineffective droplets will increase, which results in the reduction of the effective spray flow and heat flow density for cooling the wall.
According to
Figure 18, the rail average temperature drop increases with the increase of spraying cone angle first, as the cone angle increases to 45°, the rail average temperature drop reaches the maximum value of 348 °C, and then begins to decrease with the increase of spraying cone angle, which means the means that the spray cooling effect is best when the spray cone angle is 45°.
4.2. Effect of Spray Distance on Heat Transfer Characteristics
From the above research, it can be seen that when the spray distance is 15 cm, the spray area is almost tangent to the wall. Continuing to increase the spray distance will make a part of the spray area outside the heat transfer wall. Therefore, this section takes 5 cm as the step length to simulate the spray conditions with spray distances of 5 cm, 10 cm, and 15 cm. The velocity distribution of droplets in the vertical direction under different spray distances, the velocity distribution of droplets in the horizontal direction under different spray distances, and the average velocity variation of droplets under different spray distances are shown in
Figure 19,
Figure 20 and
Figure 21.
It can be seen from
Figure 19 and
Figure 20 that in the vertical direction, the droplet velocity in the central area of the spray is lower than that at the edge of the spray, and as the spray distance increases, the maximum droplet velocity gradually decreases, while the droplet velocity in the central area of the spray gradually increases, the position where the maximum droplet velocity appears gradually spreads to the edge area of the spray, and the droplet velocity distribution becomes more uniform. In the horizontal direction, the droplet velocity variation of a single nozzle is the same as that in the vertical direction. With the increase of spray distance, the distance between adjacent spray areas decreases, the velocity distribution range of droplets decreases continuously, and the velocity distribution is more uniform.
From
Figure 21, it can be seen that the average velocity of the droplet decreases with the increase of spray distance, but the trend of change is not very significant. When the nozzle-wall distance varies from 5 cm to 15 cm, the average velocity of the droplet decreases from 6.24 m/s to 5.95 m/s.
At the same time, the average heat flux density of the rail wall at different spray distances varies with time, and the average temperature drop at different spray distances, as well as the temperature non-uniformity of the wall after spray cooling at different spray distances, are also obtained. The changes are shown in
Figure 22,
Figure 23 and
Figure 24.
It can be seen from
Figure 22 and
Figure 23 that in the boiling zone, as the spray distance increases, the heat transfer effect of the spray cooling process is enhanced, and the critical heat flux increases from 139.2 W/cm
2 to 174.7 W/cm
2, an increase of 25.5%. The reason is that when the spray distance is small, most of the cooling fluid has not broken into droplets when it reaches the wall and still exists in the form of a liquid film.
During the heat transfer in the boiling zone, when the liquid film impinges on the wall surface for heat transfer, a part of the fluid will be lost in the form of a splash before heat transfer, thus reducing the heat transfer. In addition, as the spray distance increases, the average particle size of the droplet gradually increases, but the average velocity attenuation is not obvious, so the momentum of the droplet is larger.
In the transition boiling zone, the heat transfer surface will form a gas film due to the excessive evaporation of the cooling medium, but the droplets with greater momentum can pass through this layer of gas film and the wall for heat transfer. In the nucleate boiling zone, when the droplets collide with the liquid film, the droplets with larger momentum and particle size can bring in more air, which promotes the secondary nucleation in the heat transfer process, so that the entire boiling zone has a better heat transfer effect.
After the cooling process enters the single-phase region, the heat transfer mainly depends on the convective heat transfer, and the particle size with larger momentum has a more obvious disturbance to the liquid film on the heat transfer surface, which strengthens the convective heat transfer process of the liquid film.
From
Figure 24, it can be seen that the farther the spray distance is, the smaller the unevenness of the rail surface is. This is because, on the one hand, the increase in spray distance increases the area covered by the spray on the rail wall. On the other hand, at a farther distance from the nozzle, the particle size distribution of the droplets is more concentrated, and the velocity distribution of the droplets is more uniform, which makes the temperature distribution on the wall more uniform.
4.3. Quantitative Uncertainty Analysis
In spray cooling experiments, the heat flux and temperature of the heat transfer surface cannot be directly measured and must instead be indirectly determined by calculating the temperature differences and distances across different cross-sections along the measuring track. Errors in direct measurements propagate to indirect measurements through corresponding functional relationships. In this study, heat flux, track-averaged temperature drop, and wall temperature non-uniformity are considered indirect measurements, while cross-sectional temperature, thermocouple spacing, and nozzle inlet temperature serve as direct measurements.
The combined standard uncertainty of the direct measurements is first evaluated. The standard deviations of the direct measurements are calculated according to Equation (5), based on three repeated measurements and with a t-value of 1.32. The Type A uncertainties for cross-sectional temperature, thermocouple spacing, and nozzle inlet temperature, determined via Equation (6), are 1.9 °C, 0.04 mm, and 0.37 °C, respectively. Neglecting the estimation uncertainty, the Type B uncertainties for these direct measurements are 1.3 °C, 0.01 mm, and 0.25 °C, respectively. Using Equation (7), the combined standard uncertainties for the three direct measurements—cross-sectional temperature, thermocouple spacing, and nozzle inlet temperature—are calculated to be 2.3 °C, 0.04 mm, and 0.45 °C, respectively.
Assume that the indirect measurement
y has the following functional relationship with
n mutually independent direct measurements:
Then, the uncertainty of y can be calculated using the error propagation formula in Equation (9), where the terms in the equation represent the uncertainties of the direct measurement values. By substituting the calculation formulas of heat flux, average temperature drop of the rail, and wall temperature non-uniformity into Equation (9) and performing calculations for each set of data, the maximum uncertainties of the indirectly measured values (heat flux, average temperature drop of the rail, and wall temperature non-uniformity) are obtained as 3.86%, 2.30%, and 3.57% respectively.


