Article

A Study on the Optimal Design of Subsurface Pumping Energy Storage Under Varying Reservoir Conditions

Chongqing University, Chongqing 400044, China
*
Author to whom correspondence should be addressed.
Energies 2025, 18(19), 5252; https://doi.org/10.3390/en18195252
Submission received: 29 August 2025 / Revised: 27 September 2025 / Accepted: 28 September 2025 / Published: 3 October 2025
(This article belongs to the Section D: Energy Storage and Application)

Abstract

To foster innovation in stored energy solutions and advance the development of green energy, this work presents a novel energy storage patented technology which involves storing energy in subsurface fractures through pumping. A new mechanical model was established to examine how variations in fracture size and operating parameters (i.e., injection and flow-back rates) modulate the scale and efficiency of energy storage under various geological conditions, and an optimized design scheme is proposed. The study demonstrates that both the scale and efficiency of energy storage are influenced by geological conditions. Selecting reservoirs with greater fracture toughness or lower permeability can achieve higher efficiency. Additionally, increasing reservoir fracture toughness also significantly enhances the scale of energy storage. Variations in geological conditions have a small impact on the optimal design of fracture size and injection/flow-back rate. Whether dealing with shallow penny-shaped fractures or deep elliptical fractures, using a moderate injection/flow-back rate in larger fractures is the optimal approach. The model presented in this paper is essential for tackling design challenges and interpreting data in subsurface pumping energy storage field applications.

1. Introduction

The rapid evolution of energy storage systems has played a pivotal role in accelerating the global transition toward renewable energy [1,2,3,4,5,6,7]. Subsurface pumped energy storage (SPES) is a novel patented technology that utilizes pumping for energy storage in subsurface artificial fractures (as shown in Figure 1) [8,9,10]. This technology not only offers a promising solution for long-duration energy storage [11,12,13,14] but also addresses the geographical and environmental limitations associated with traditional methods [15,16,17,18,19]. It provides broader applicability, lower operational costs, and reduced environmental and safety concerns [20,21,22,23,24]. Additionally, it offers the potential for repurposing depleted hydrocarbon reservoirs.
In previous works [10], we utilized a fully coupled numerical model for hydraulic fracturing to examine and quantify the significant influence of wellbore geometry parameters, pumping rate, and proppant on energy storage capacity and efficiency. However, this simulator was primarily developed for oil and gas extraction research, and its computational speed is relatively slow. As the number of grids increases, the computation time escalates exponentially, posing challenges for meeting the extensive parameter optimization demands required for SPES design. Currently, no mechanical model currently exists to deliver design guidelines for the field-scale deployment of subsurface pumped energy storage. Therefore, a novel, rapid and specialized mechanical model that takes into account various geological conditions and wellbore configuration parameters is crucial for addressing the design challenges (e.g., reservoir selection, target size, and pumping rate parameter prediction, etc.) and field data interpretation that may arise during the practical application of this technology. As a dynamically adjustable parameter in the energy storage process, pumping rate plays a critical role in the optimization design. Although previous studies have established mechanical models using mixed boundary conditions [25], this work only conducted a simple analysis of the influence of pumping rate on efficiency under specific conditions. In the practical application of SPES, reservoir conditions exhibit considerable variability. Variations in geological factors and fracture dimensions may result in significant changes in storage capacity, potentially altering the effect of pumping rate on storage efficiency. Consequently, selecting optimal operational parameters (e.g., injection and reflow rates) based on varying reservoir conditions is essential for ensuring the economic viability of this technology. Moreover, previous studies have only been applicable to shallow horizontal fractures, without considering the significant application potential of fractures in deep reservoirs.
In this work, a new hybrid analytical–numerical solution model for subsurface pumping energy storage analysis at varying depths is presented. The paper first introduces the governing equations of the model and demonstrates basic cases for various fracture shapes at different depths. Next, it analyzes the effects of fracture size and pump flow rate on storage scale and efficiency with different geological conditions for the two specific fracture shapes. Finally, the optimal design scheme for subsurface pumping energy storage is discussed and provided. The computational efficiency advantage of this model compared to previous fully coupled reservoir simulators is also demonstrated. In field applications, the model can calculate the energy storage scale and efficiency based on actual geological conditions, wellbore structure, and other parameters, providing planning and predictions for the optimal design of subsurface pumping energy storage.

2. Model Description

2.1. Shallow Reservoir Model

For shallow vertical wells, the fractures are typically penny-shaped. As shown in Figure 2, since the section of a penny-shaped fracture is equal in any direction along the diameter and symmetrical relative to the wellbore, it is sufficient to analyze only half of the cross-section in any diameter direction. The studied half section is discretized into n segments along the radial direction under the assumption of uniform net pressure distribution across each radial segment. The contribution of the i-th discrete segment to the global fracture aperture is formulated as [26]:
w f r i 1 r r i 8 p i π E r i 1 R f ξ 2 r i 1 2 ξ 2 r 2 d ξ r i R f ξ 2 r i 2 ξ 2 r 2 d ξ     f o r     0 r r i 1 8 p i π E r R f ξ 2 r i 1 2 ξ 2 r 2 d ξ r i R f ξ 2 r i 2 ξ 2 r 2 d ξ     f o r     r i 1 r r i 8 p i π E r R f ξ 2 r i 1 2 ξ 2 r 2 d ξ r R f ξ 2 r i 2 ξ 2 r 2 d ξ     f o r       r i r R f
where r i 1 and r i are the radial nodes before and after the i-th radial subdomain, respectively, p i is the net pressure within the i-th radial subdomain, R f is the radius of the penny-shaped fracture, and E is the modulus of plane-strain, which is expressed as:
E = E ( 1 σ 2 )
where E is the modulus of elasticity, and σ is the poisson coefficient. By superimposing the contributions from all segments, the width along the fracture is derived as:
w f r = i = 1 n w f r i 1 r r i
According to the conservation of volume, the continuity equation for fluid flow within the fracture can be expressed as:
w f t + 1 r ( r q ) r + 2 v l e a k o f f = 0 ,         q = v w f
where q is the fluid flux in the crack, v l e a k o f f is the fluid leak-off rate, and v is the average velocity of the fluid can be expressed as:
v = Q 2 π r w f
where Q is the volumetric flow rate in the crack. The boundary conditions are:
Q = Q f ,       r 0 Q = 0 ,       r R f
where Q f is the injection/flow-back volume flow rate, which is +/− during the injection/return process and 0 during the shut-in process. The leak-off rate is represented using the Carter leak-off model as follows:
v l e a k o f f = k m m c r π μ p m i n p o t + t c
where k m is the reservoir permeability, m is the porosity, c r is the compressibility, μ is the fluid viscosity, p m i n is the minimum principal stress, p o is the pore pressure of the reservoir, t is the total time, and t c is the time when the fracture first contacts the fluid before the start of energy storage. By rearranging Equations (4)–(7), the volumetric flow rate Q i within the i -th segment ( 2 i n + 1 ) can be expressed as:
Q i = Q 1 i = 1 i 1 2 w f i t + 2 k m m c r π μ p m i n p o t + t c π r i   r
where Q 1 = Q f , Q n + 1 = 0 , w f i is the change in width of the i -th elements in t time, w f i ,   r i are the width and radius of the i -th segment, respectively. The radius and average width of each segment are calculated by taking the radius and width in the middle of each segment to calculate the pressure drop:
r i = r i 1 + r i 2 w f i = w f r = r i 1 + r i 2
Taking into account the frictional resistance in the fracture, the fluid flux q is related to the pressure drop through the following expression:
q = w f 3 12 μ f D ¯ p r
where f D ¯ is the Darcy friction factor:
f D ¯ = ( 1 + A ¯ + B ¯ 1.5 ) 1 12 ,   A ¯ = ( 8.511 R e 1 2 f 0 ) 16 B ¯ = ( R e t r a n s R e ) 24 f 0 = | l o g [ 7 R e 0.9 + 0.27 v ] | ,       R e = 2 ρ f q μ ,   v = δ 2 w f ,
where R e is the Reynolds number, R e t r a n s is the transition value (When R e is lower than R e t r a n s , f D ¯ 1 ), δ is the roughness. By spatially discretizing Equation (10), the net fluid pressure in the j-th segment of the fracture can be obtained as:
p i = p 1 i = 1 i 1 6 μ f D ¯ Q i r π r i w f i 3
where p 1 is the net pressure at the perforation p p e r f , and p n is the fracture tip pressure p t i p . Although open hole completion can minimize perforation friction to a negligible level [27,28,29], the influence of frictional pressure losses along the wellbore and within the fracture on energy storage efficiency is non-negligible [30,31,32,33,34,35]. Considering the frictional pressure drop of the fluid along the wellbore and the gravity of the fluid within the wellbore, the surface pressure at the wellhead can be expressed as:
p w e l l h e a d = p w e l l + p m i n + p d w e l l G w e l l
where p d w e l l is the frictional pressure drop of the fluid along the wellbore, and G w e l l is the gravity of the fluid within the wellbore. The frictional pressure drop of the fluid along the wellbore can be obtained through the following formula:
q = D 3 12 μ f D ¯ p L ,     q = < v > D = 4 Q f π D
where D is the diameter of the wellbore and the integration range for the wellbore length is the vertical depth S. The friction factor in the wellbore is given by Equation (11), where δ represents the roughness of the wellbore. The fluid gravity within the wellbore can be expressed as:
G w e l l = ρ f g H
where ρ f denotes fluid mass density, and g is the acceleration due to gravity, 9.8 m 3 / s . The core mechanism of subsurface pumped energy storage (SPES) involves cyclic fracture aperture modulation—opening for energy injection and closing for recovery—without inducing fracture propagation. Consequently, the pressure evolution at the fracture boundary is governed by the following constraint:
p w e l l 0 p t i p p m a x
where p m a x is the maximum net pressure at the fracture tip without expansion:
p m a x = k I c 2 π R f
where k I c is the fracture toughness. This means that with each cycle when the net fluid pressure at the crack tip reaches its maximum, injection stops, and shut-in and flow-back begin. When the net fluid pressure at the perforation drops to zero, the fracture will close, flowback will stop, and reinjection will begin. The single cycle efficiency a can be expressed as:
η = t f l o w b e g t f l o w e n d p w e l l h e a d | Q f | t t i n j b e g t i n j e n d p w e l l h e a d | Q f | t
where t f l o w b e g and t f l o w e n d are the initiation and conclusion of flow-back during a single cycle, respectively, and t i n j b e g and t i n j e n d are the initiation and conclusion of injection, respectively.

2.2. Deep Reservoir Model

For horizontal wells with greater burial depth, the crack height is often constrained by the upper and lower layers, resulting in a crack length much greater than the height, so the fracture can be approximated as a PKN model [36,37,38]. As shown in Figure 3, after the fluid enters the fracture, it flows parallel to both ends along the length direction. Since the cross-sections of the fracture are parallel to each other and symmetrical along the wellbore, it is only necessary to study half of the cross-section along the length direction. Similarly to a penny-shaped fracture, after discretizing the half cross-section into n segments along the fracture length direction, the impact of each independent segment on the entire fracture width can be obtained from Equation (1), and the entire fracture width distribution can be obtained from Equation (3). According to the conservation of volume, the continuity equation for fluid flow within the elliptical fracture can be expressed as:
w f t + q l + 2 v l e a k o f f = 0 ,     q = v w f
The average speed v is expressed as:
v = Q h f w f
where h f is the height of the fracture. The boundary conditions are:
Q = Q f 2 ,       r 0 Q = 0 ,       r L f
where L f is the half-length of the fracture. The leak-off rate can be obtained from Equation (7). The volumetric flow rate Q i within the i -th segment ( 2 i n + 1 ) can be expressed as:
Q i = Q 1 i = 1 i 1 2 w f i t + 2 k m m c r π μ p m i n p o t + t c h f   l
where Q 1 = Q f 2 , Q n + 1 = 0 . The pressure drop of fluid flow within the fracture can be obtained from Equation (10). The net pressure within the fracture and the surface pressure at the wellhead can be obtained from Equations (12) and (13), respectively. The frictional pressure drop of the fluid along the wellbore can be obtained from Equation (14), where the integration range for the wellbore length is the measured depth S. The gravity of the fluid within the wellbore can be obtained from Equation (15). The boundary conditions for energy storage can be obtained from Equation (16), where the maximum net pressure at the crack tip without expansion is:
P m a x = 2 K I c E ( k ) h f L f π
where E k is the complete elliptic integral of the second kind. The energy storage efficiency of a single cycle can be obtained from Equation (18).

3. Base Case

This section presents two foundational scenarios involving penny-shaped fractures and elliptical fractures in detail. The specific input parameters are as shown in Table 1. It should be noted that the input parameters listed in Table 1 are primarily synthesized from existing literature and engineering experience, intended to reflect representative parameter ranges rather than correspond to any specific geological formation [25].

3.1. Shallow Reservoir Case

Figure 4 illustrates the temporal evolution of wellhead pressure and perforation-level fracture pressure. A full SPES operational cycle consists of three phases: ① injection; ② shut-in; and ③ flow-back. As can be seen from Figure 4, five complete cycles were accomplished within five days. Across one operational cycle, wellhead and perforation pressures exhibit monotonic increases or decreases during injection and flow-back phases, respectively. During the shut-in period, the wellhead surface and perforation pressures slightly decrease over time due to leakage. It is noteworthy that, unlike the pressure at the perforation, the wellhead surface pressure undergoes a brief rapid drop at the beginning and end of the shut-in period. This phenomenon primarily arises from sudden shifts in wellbore frictional resistance coinciding with injection termination or flow-back initiation. Additionally, the hydrostatic pressure gradient induced by the fluid column results in approximately 5 MPa pressure differential between the perforation and wellhead.
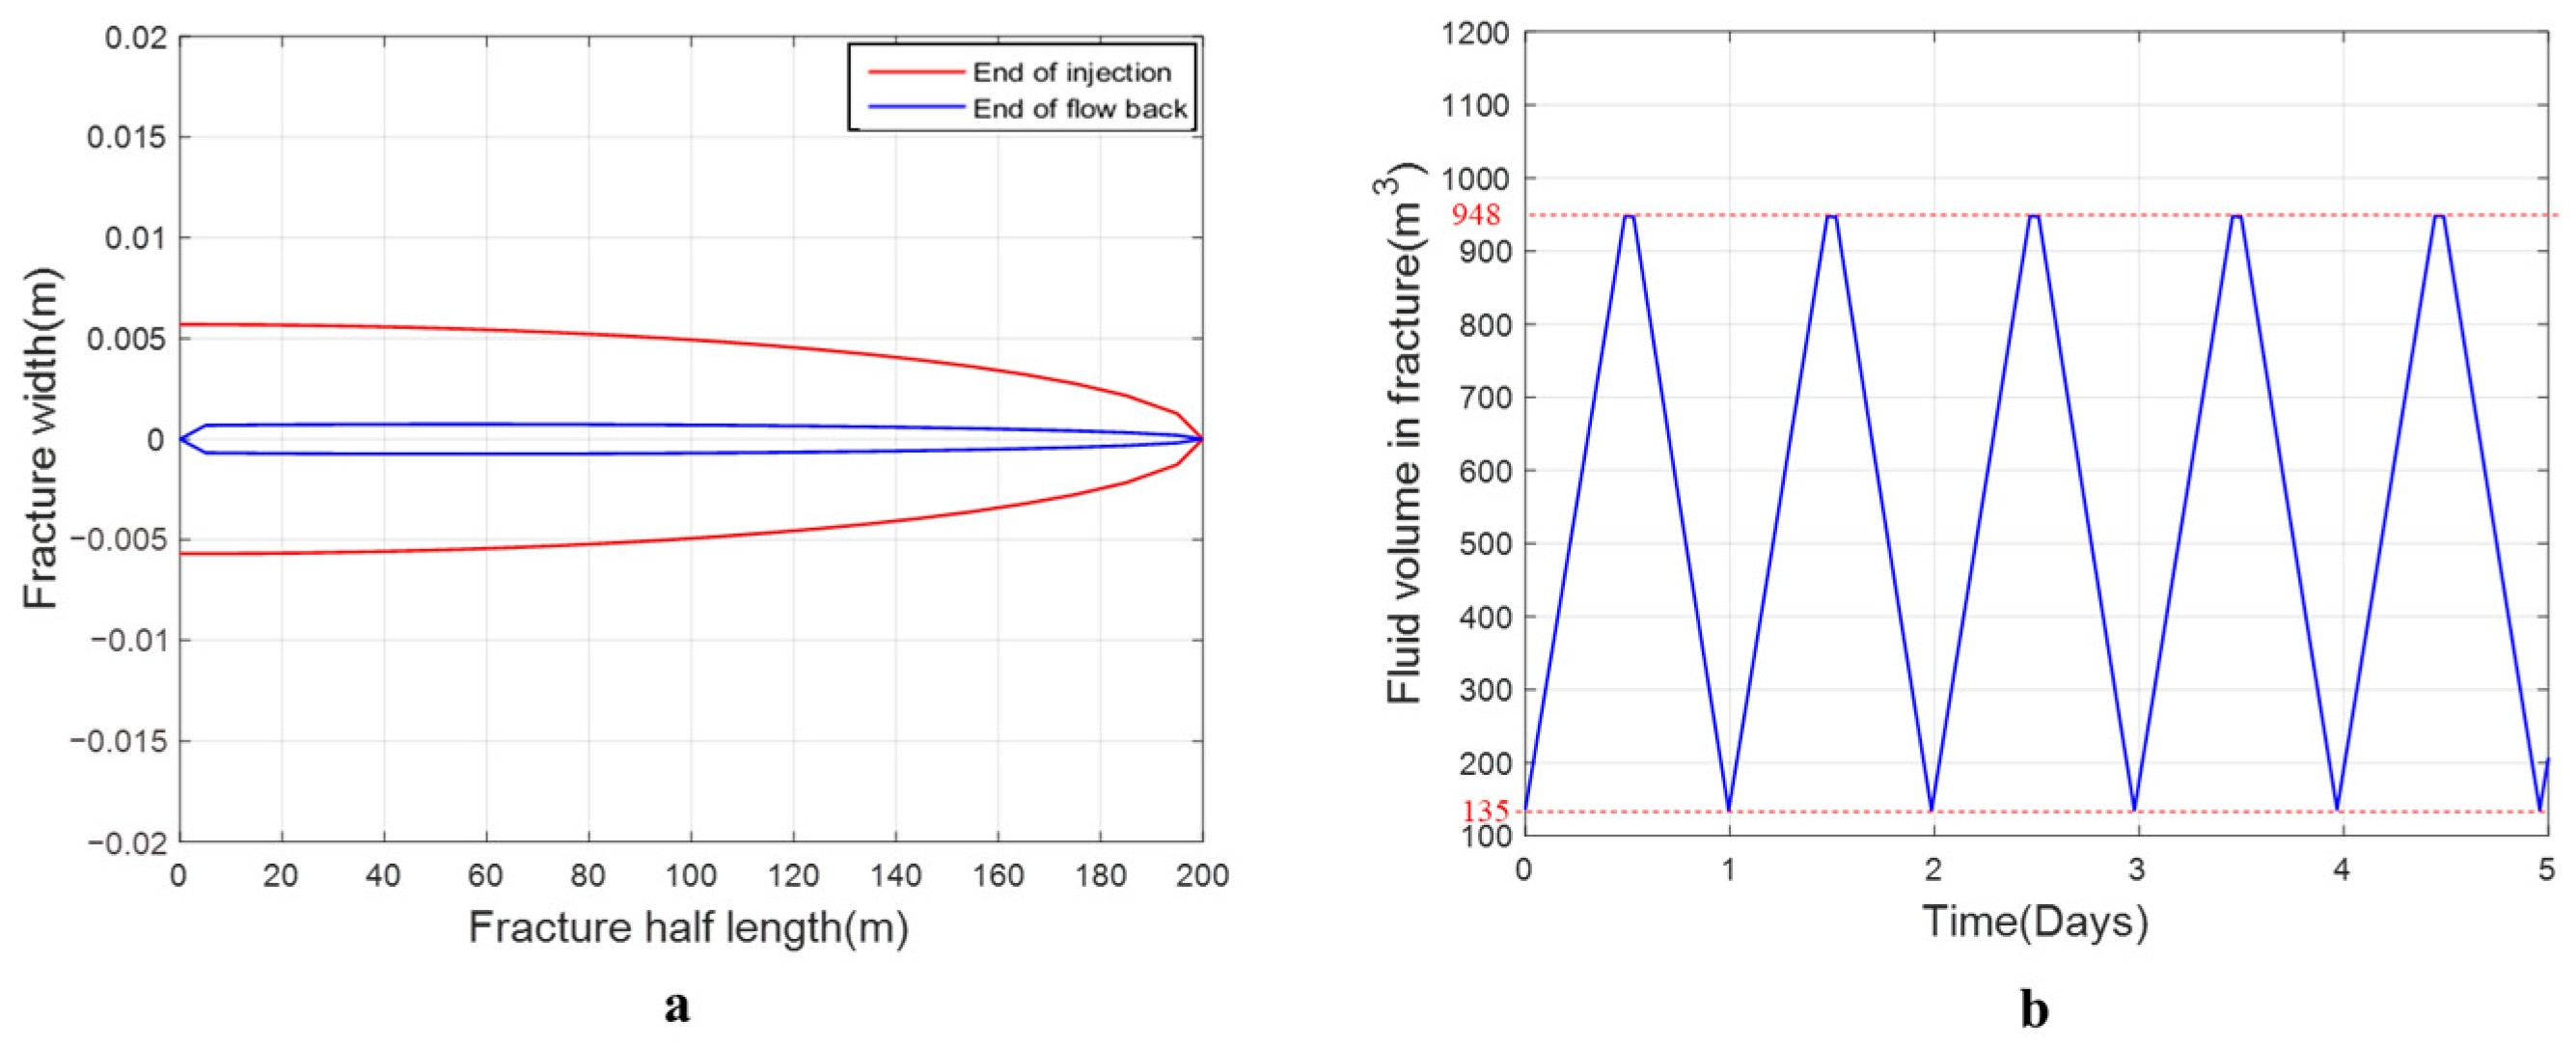
Figure 5 and Figure 6 depict the spatial distributions of net pressure and fracture aperture at the conclusion of injection and flow-back phases, respectively, alongside the temporal variation in in-fracture fluid volume. Net pressure within the fracture declines progressively along the flow path, predominantly owing to viscous dissipation (see Figure 5). Observing Figure 5a, during injection, fluid migrates radially from the perforation toward the fracture tip, inducing a progressive pressure drop along the flow path. The pressure gradient magnitude depends on fluid flux—itself governed by fracture aperture geometry. As the fluid diverges from the perforation along the radius towards the fracture tip, the fracture width continuously decreases, leading to a reduction in fluid flux and consequently a decrease in pressure drop along the fluid flow direction. The flowback process is just the opposite (as shown in Figure 5b). Notably, upon completion of flow-back, although perforation pressure reaches zero, residual net pressure persists throughout the fracture network. Consequently, closure initiates proximal to the wellbore during flow-back. At this point, the fracture is unable to release energy through natural closure, and there remains a residual amount of unrecovered fluid within the fracture (as shown in Figure 6a). This indicates that part of the fracture volume remains underutilized, which may limit the system’s peak energy storage potential. Figure 6b reveals that the maximum fluid volume stored per cycle is 948 m3. Following the conclusion of each flow-back, approximately 135 m3 of fluid remains unrecovered, resulting in a fracture volume utilization rate of 86%. This efficiency level is considered acceptable given its marginal effect on the fracture’s maximum energy storage potential.
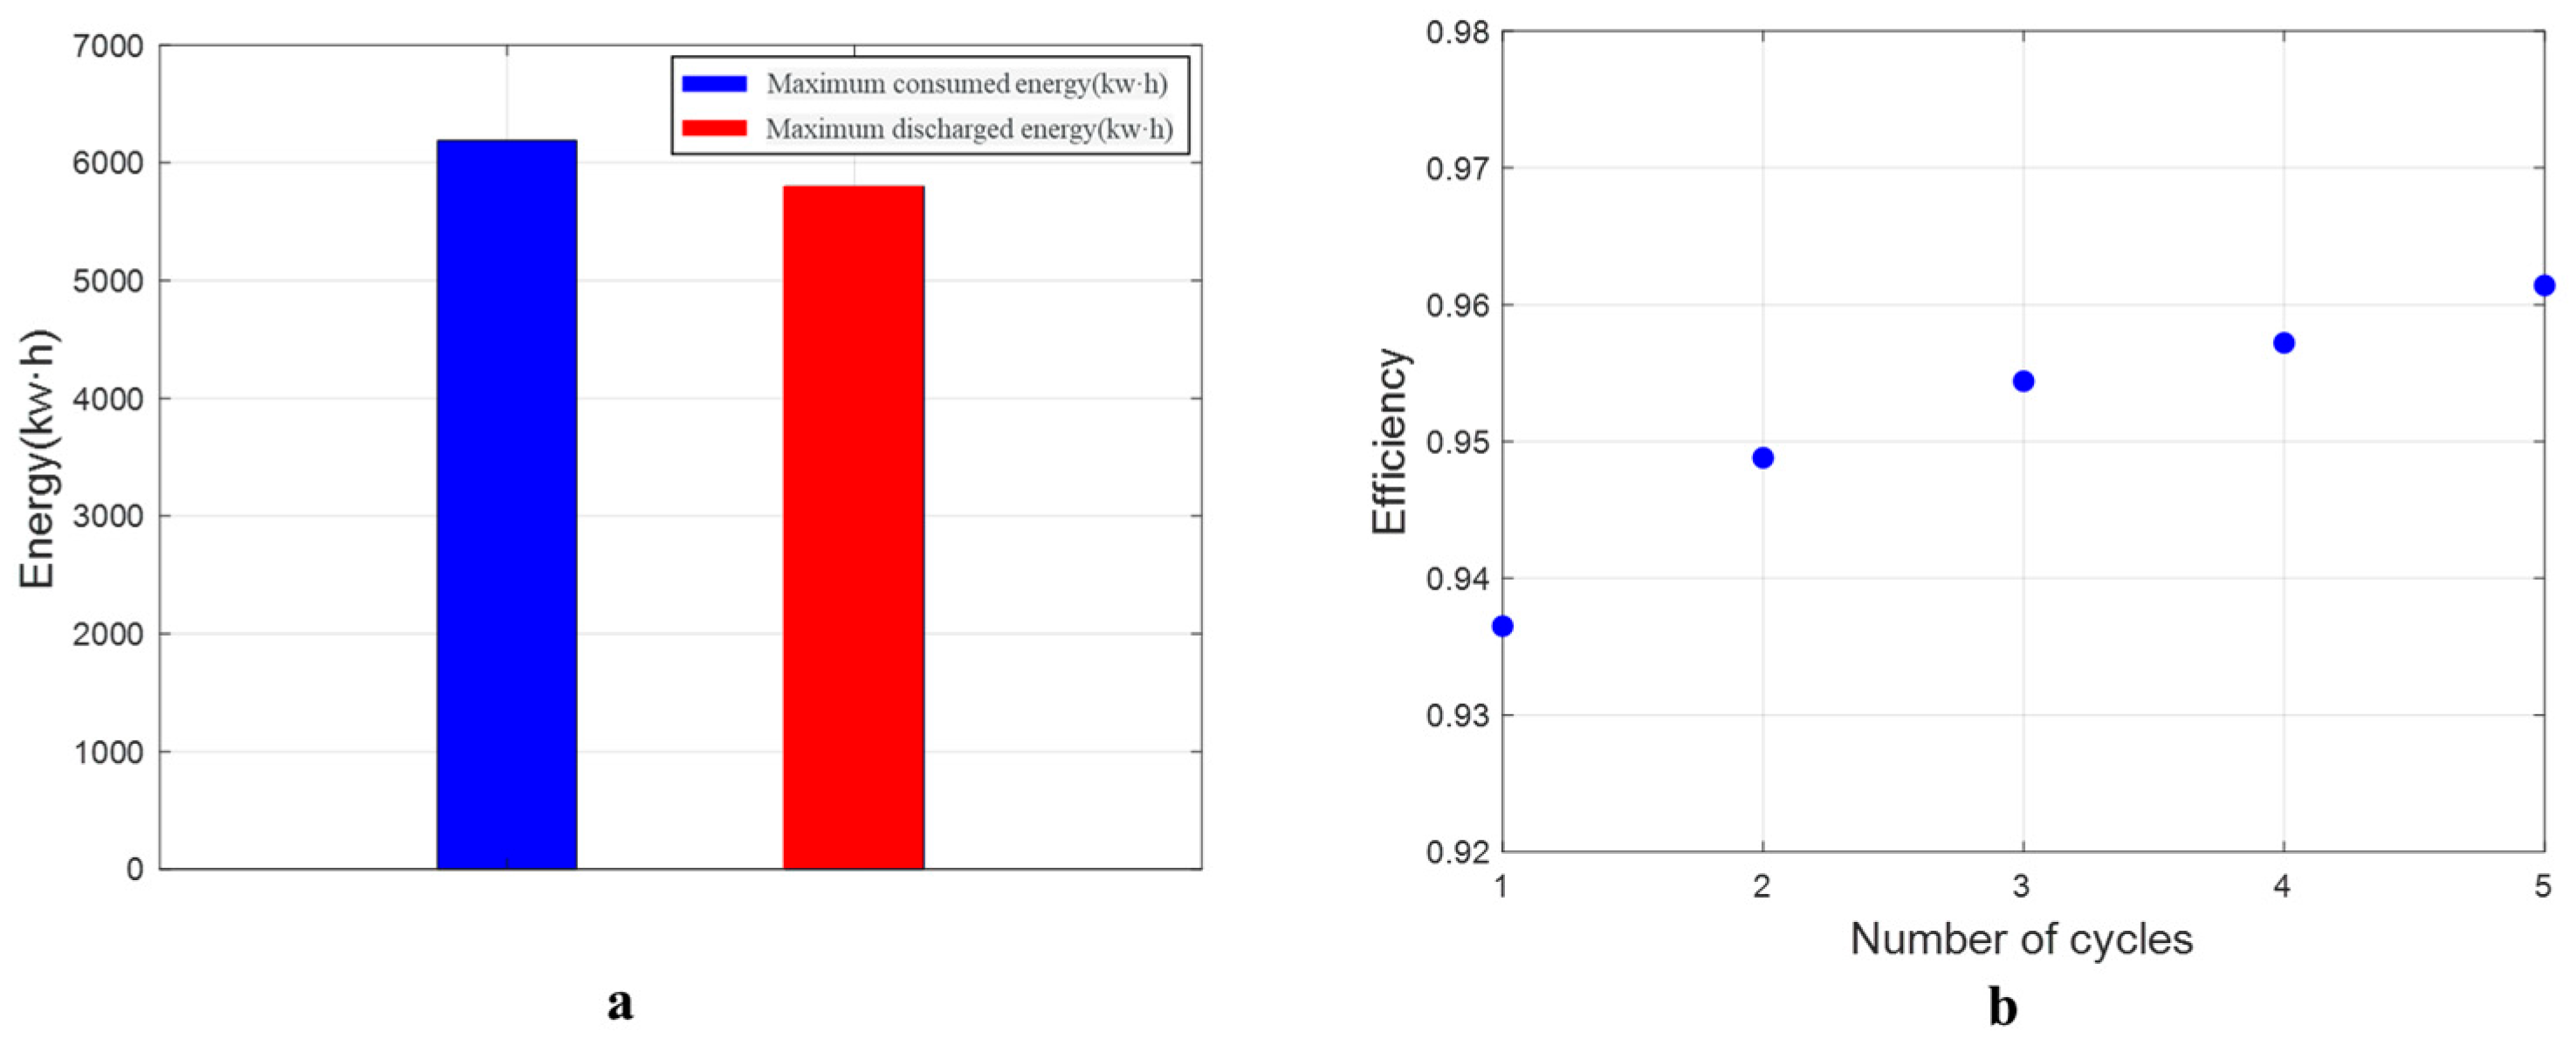
Figure 7 presents the peak energy input and output per cycle, along with the evolution of fracture efficiency as a function of cycle count. As depicted in Figure 7a, peak energy input per cycle attains 6190 kW·h, whereas recovered energy stabilizes near 5800 kW·h. Figure 7b illustrates the temporal trend of energy storage efficiency across cycles. It is evident that with increasing cycle count, fluid leakage progressively declines, leading to incremental efficiency gains, albeit at a diminishing rate. The initial cycle achieves an efficiency of 93.65%.

3.2. Deep Reservoir Case

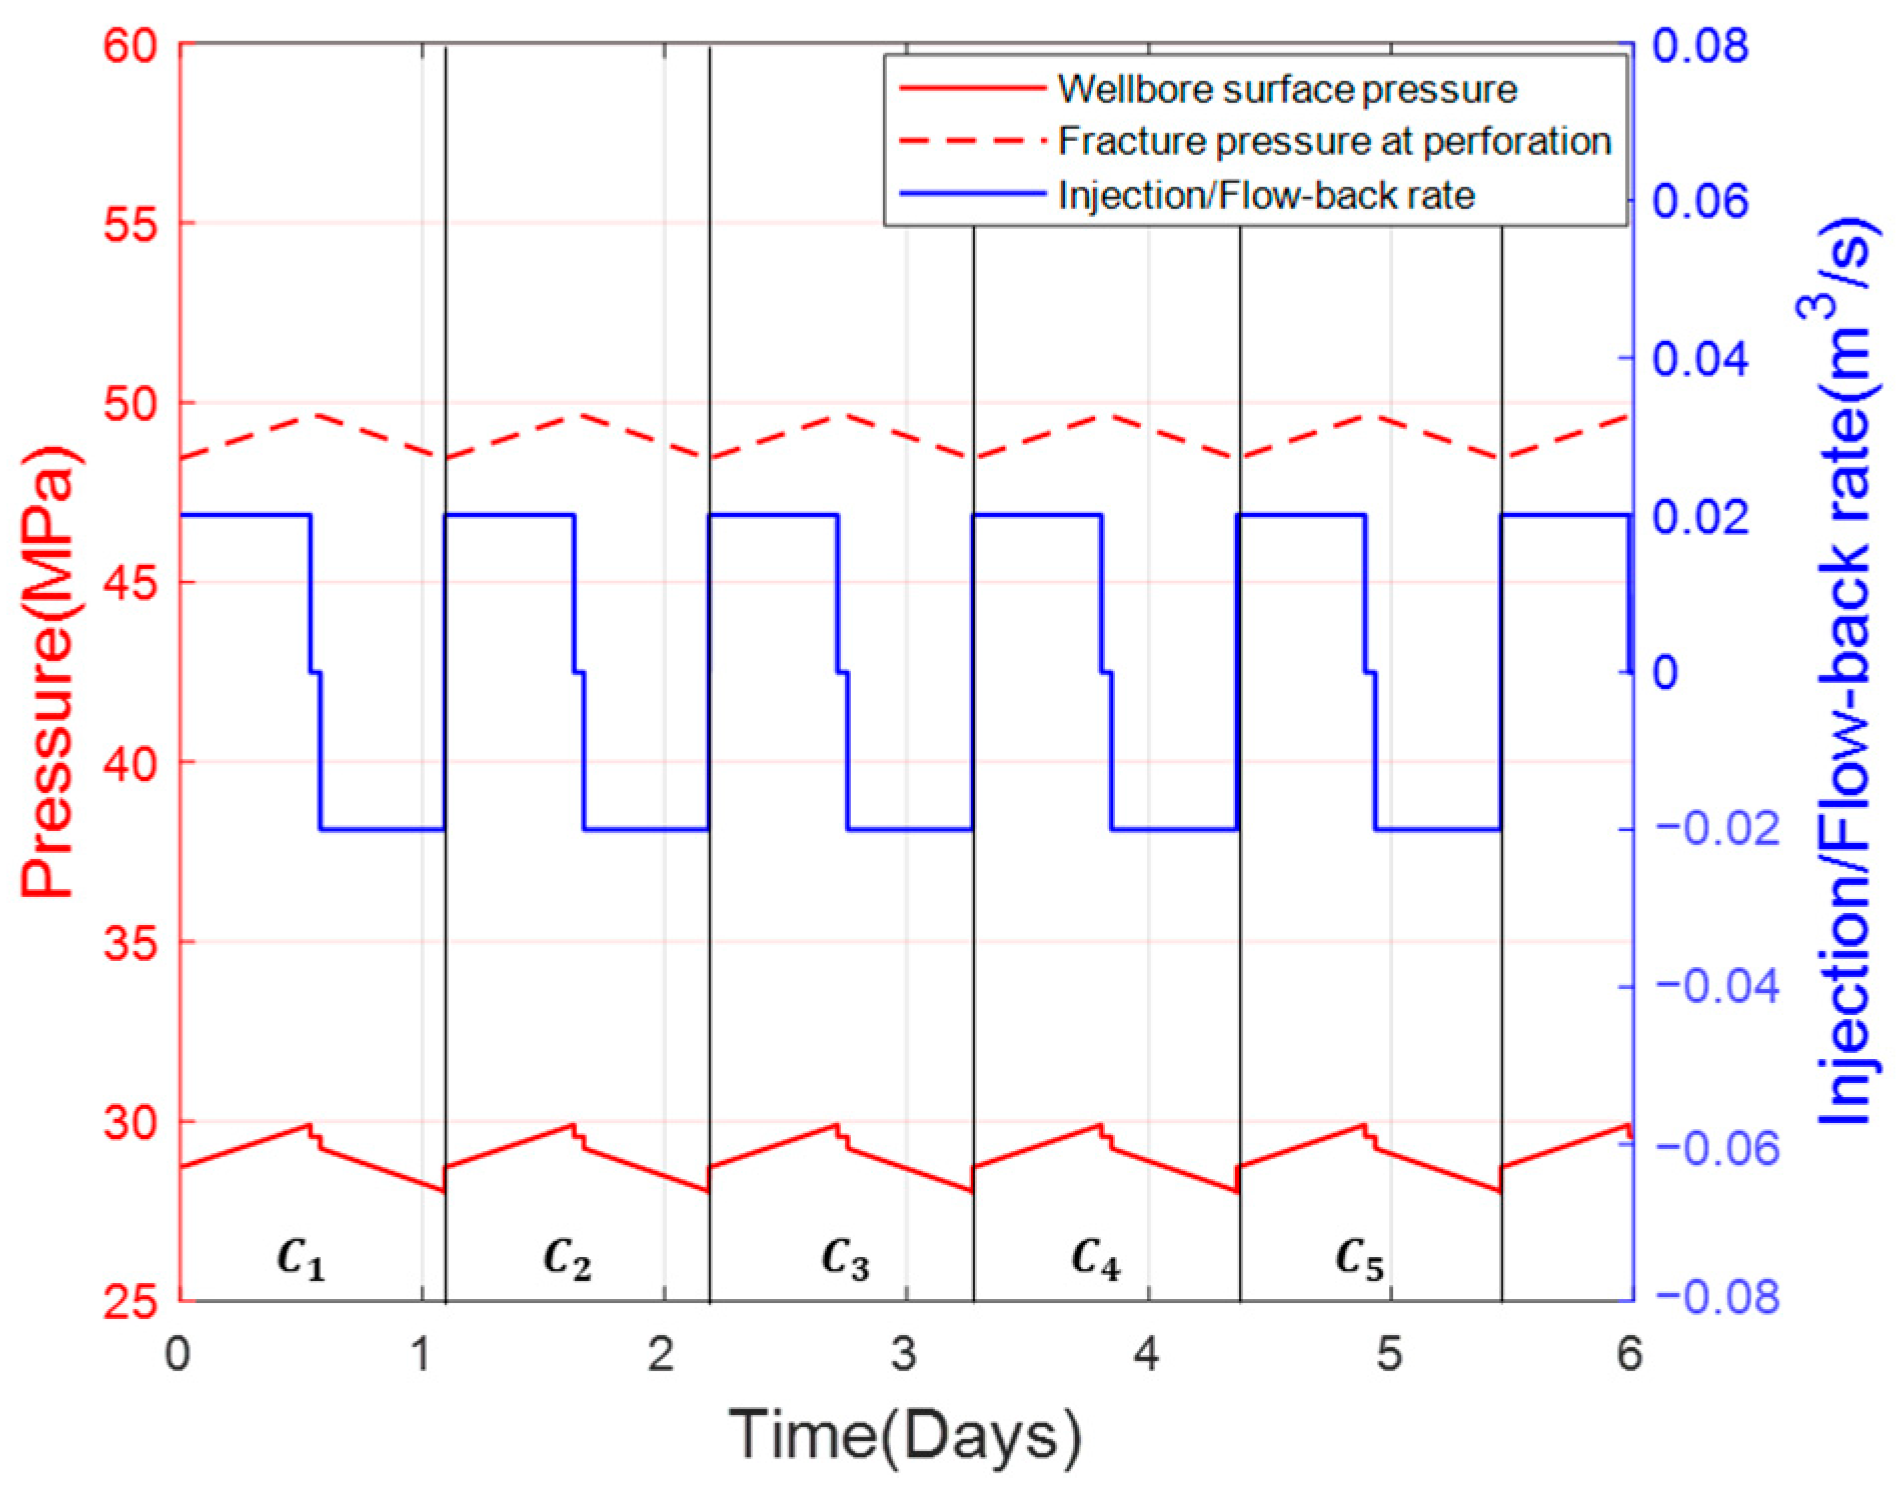
Figure 8 illustrates the temporal evolution of wellhead surface pressure and fracture pressures at the perforation. Within 6 days, the elliptical fracture completed 5 operational cycles. Similarly to the penny-shaped fracture, across the injection, shut-in, and flow-back phases, the wellhead surface pressure and fracture pressure at the perforation rise/slightly decrease/increase, respectively. In addition, due to the friction along the wellbore, wellhead pressure exhibits a sharp decline at injection termination and flow-back initiation. Relative to the penny-shaped geometry, the elliptical fracture possesses increased vertical extent, leading to enhanced hydrostatic loading within the wellbore. Consequently, the pressure differential between wellhead and perforation-level fracture pressure exceeds that observed in penny-shaped geometries by approximately 20 MPa.
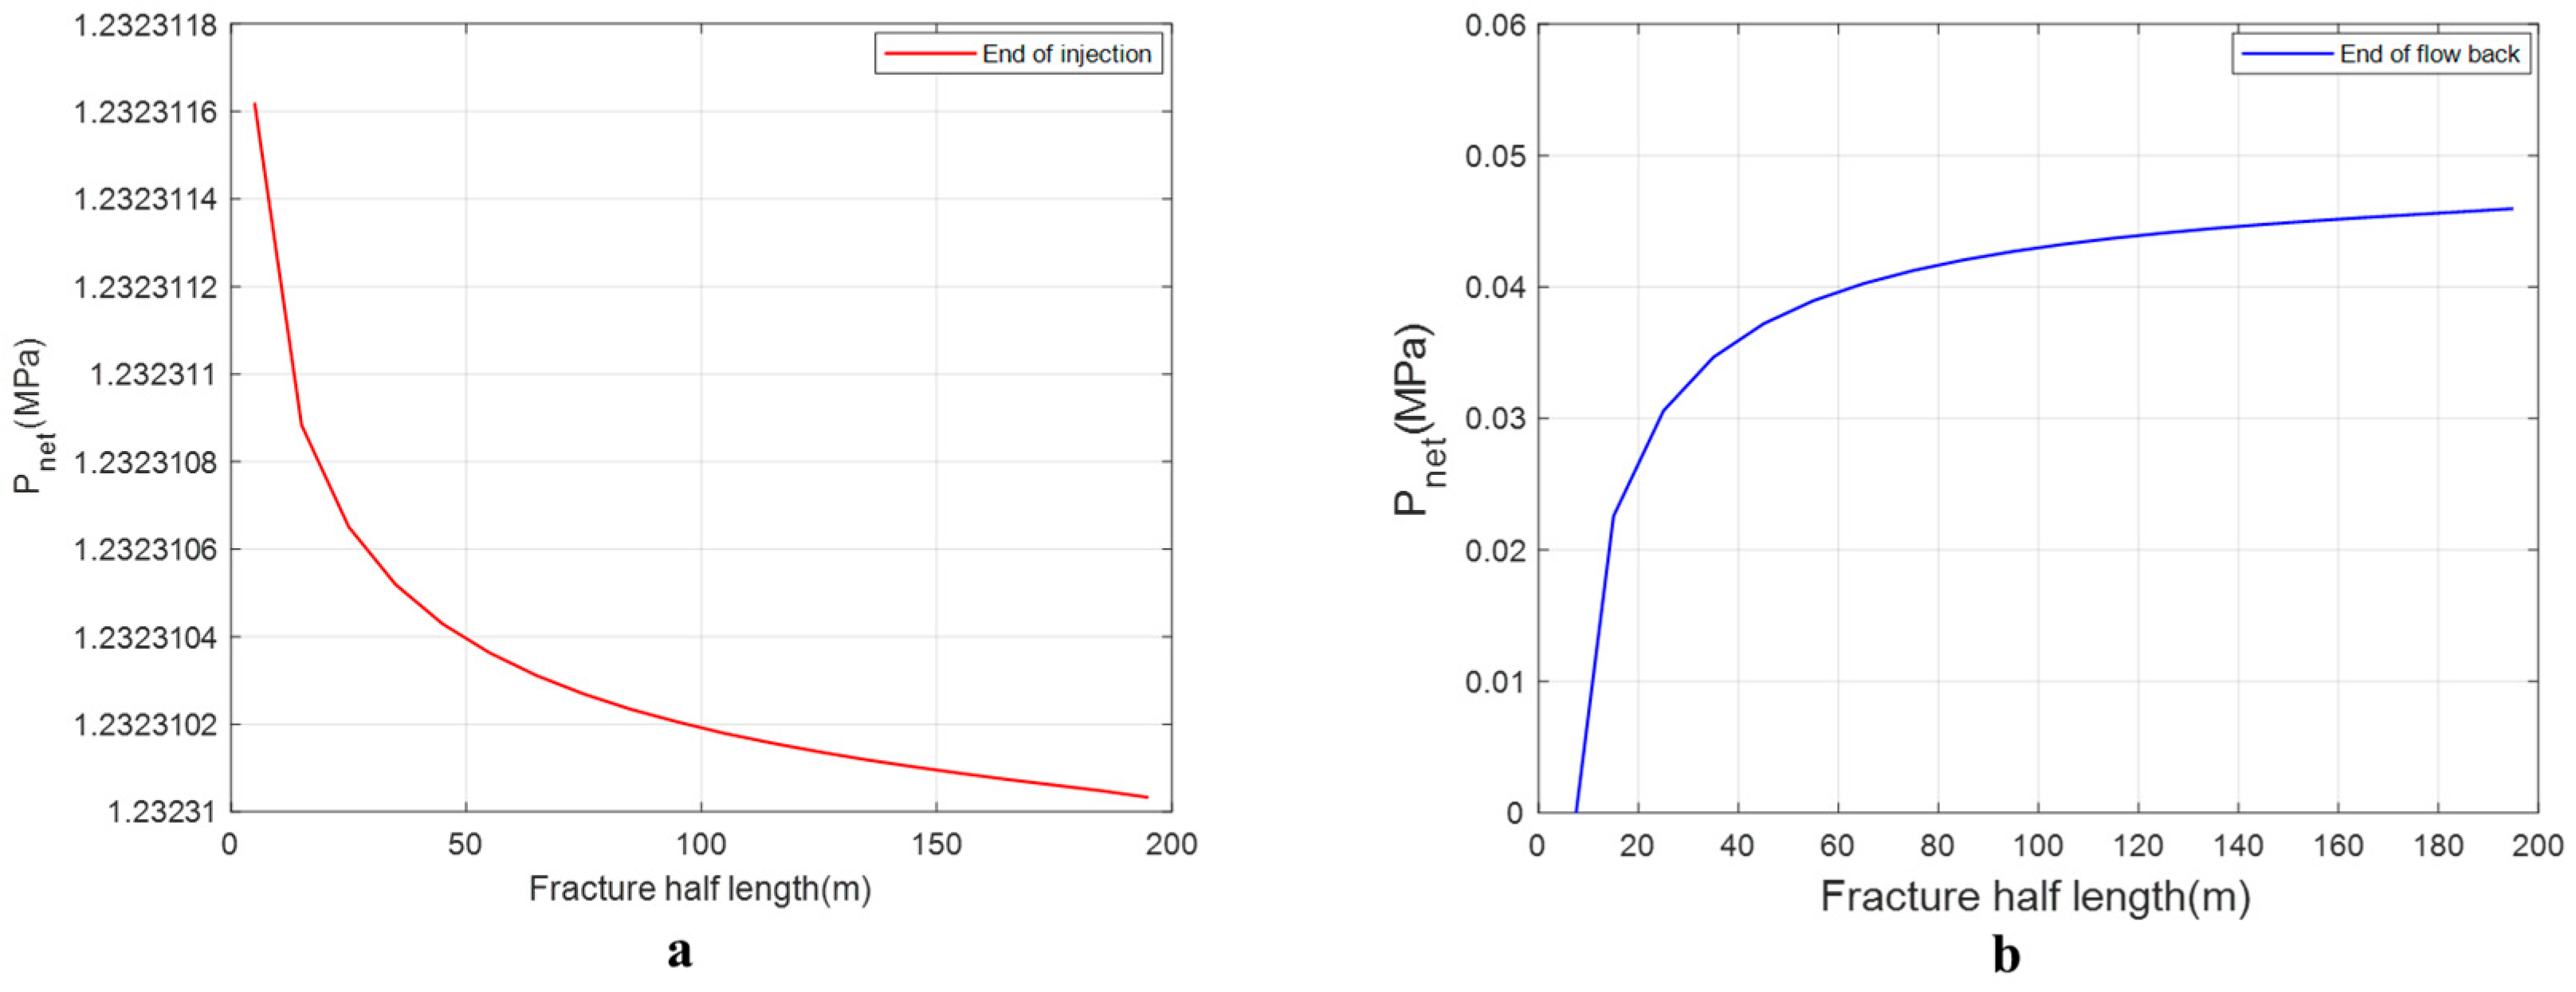
Figure 9 illustrates the spatial profile of net pressure inside the fracture at the conclusion of injection and flow-back phases. Due to the friction within the fracture, owing to viscous dissipation along the fracture, net pressure declines progressively with flow direction. During the injection process, during injection, the pressure gradient from perforation to tip weakens progressively; flow-back exhibits the reverse trend. Analogous to the penny-shaped geometry, internal friction drives perforation pressure to zero at the end of the flow-back, upon completion of flow-back, though net pressure inside the fracture remains positive.
Figure 10 illustrates the spatial profile of fracture aperture at the conclusion of injection and flow-back phases, alongside its temporal evolution of contained fluid volume. As depicted in Figure 10a, analogous to the penny-shaped geometry, the fracture aperture reaches maximum extent post-injection and minimum at flow-back completion. The friction within the fracture internal friction induces a rapid pressure drop at the perforation, triggering initial closure. This leads to residual fluid retention after each discharge phase, constraining the fracture’s peak energy storage potential. As illustrated in Figure 10b, peak fluid volume per cycle is 932 m3, with 31 m3 remaining trapped post-flow-back.
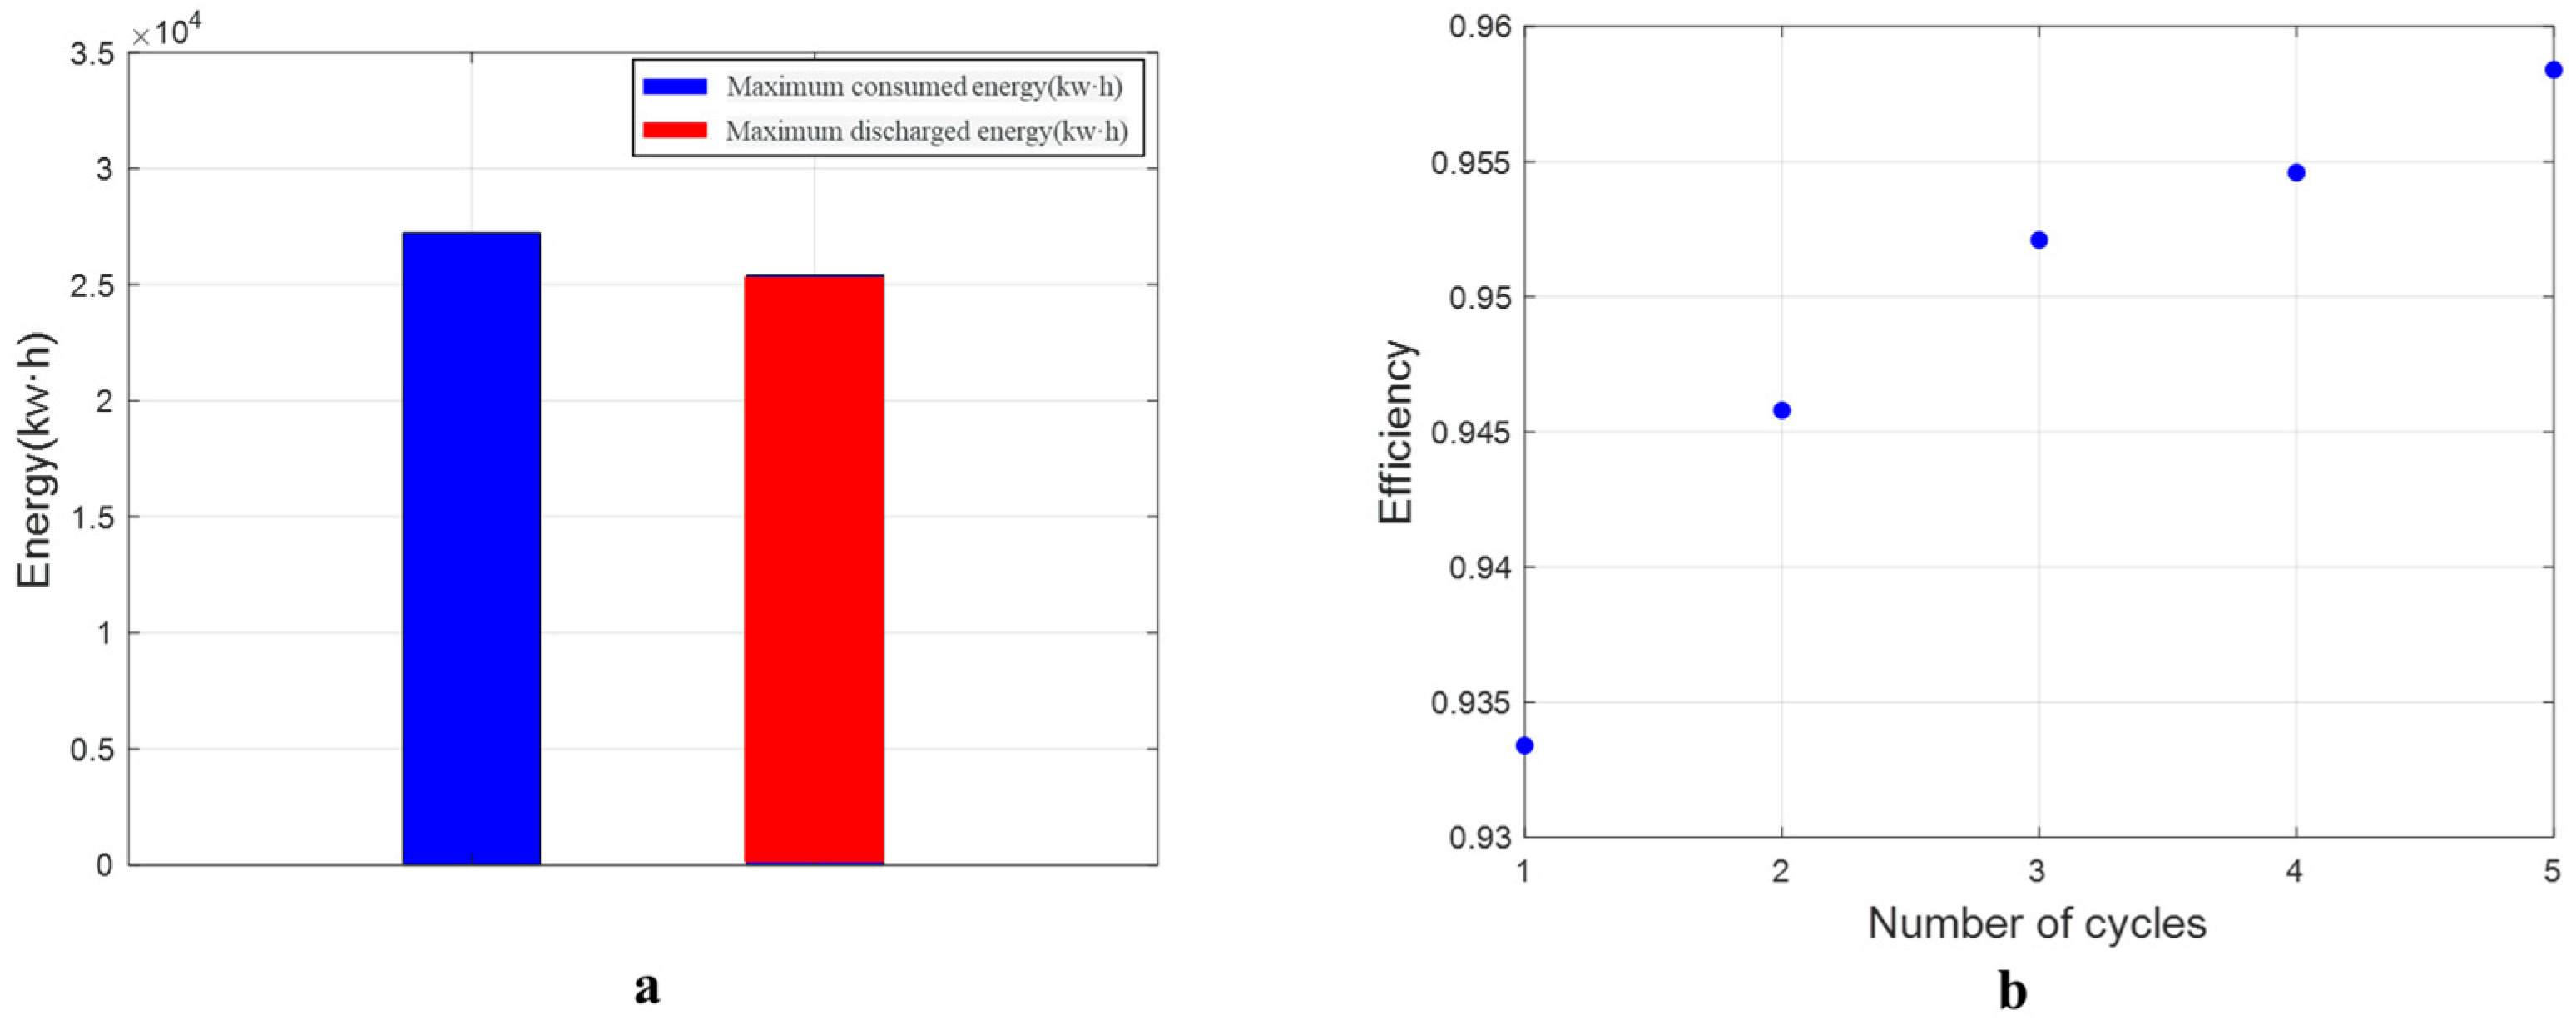
Figure 11 illustrates the peak energy input and output per cycle, along with the evolution of storage efficiency across operational cycles. As depicted in Figure 11a, peak energy input per cycle for the elliptical fracture reaches 27,200 kW·h. Recovered energy peaks at 25,413 kW·h, which significantly exceeds that of penny-shaped geometries. This stems from the increasing work required to counteract the minimum principal stress during fracture propagation with greater vertical extent, thereby boosting peak storage capacity. As illustrated in Figure 11b, declining leakage drives incremental efficiency gains over successive cycles, albeit at a decelerating rate. Although greater vertical extent elevates leakage and frictional losses, the initial-cycle efficiency of elliptical fractures surpasses 93%, attributable to enhanced maximum storage capacity.

4. Parameter Design

Energy losses from fluid leakage and friction are pivotal factors influencing the efficiency of subsurface pumping energy storage. The choice of fracture size significantly impacts the scale of energy storage and consequently affects the duration of a single energy storage cycle. Larger fractures enable greater energy storage scale but also escalate fluid leakage and friction within the wellbore and fractures. Raising the injection and flow-back rates speeds up the energy storage process, which reduces leakage but also increases friction within the wellbore and fractures. Therefore, the design of fracture size and injection power has a complex impact on energy storage efficiency. In our previous work [8], we also found that the selection of fracture toughness and reservoir permeability influences energy storage efficiency. In this study, we simulate the variation in energy storage scale and efficiency of the first cycle by choosing different injection and flow-back rates in different fracture sizes under different reservoir permeability and fracture toughness for both penny-shaped and elliptical fractures. The specific input parameters for the fracture size and injection/flow-back rate of penny-shaped and elliptical fractures are shown in Table 2. The other input parameters are shown in Table 1.

4.1. Shallow Reservoir

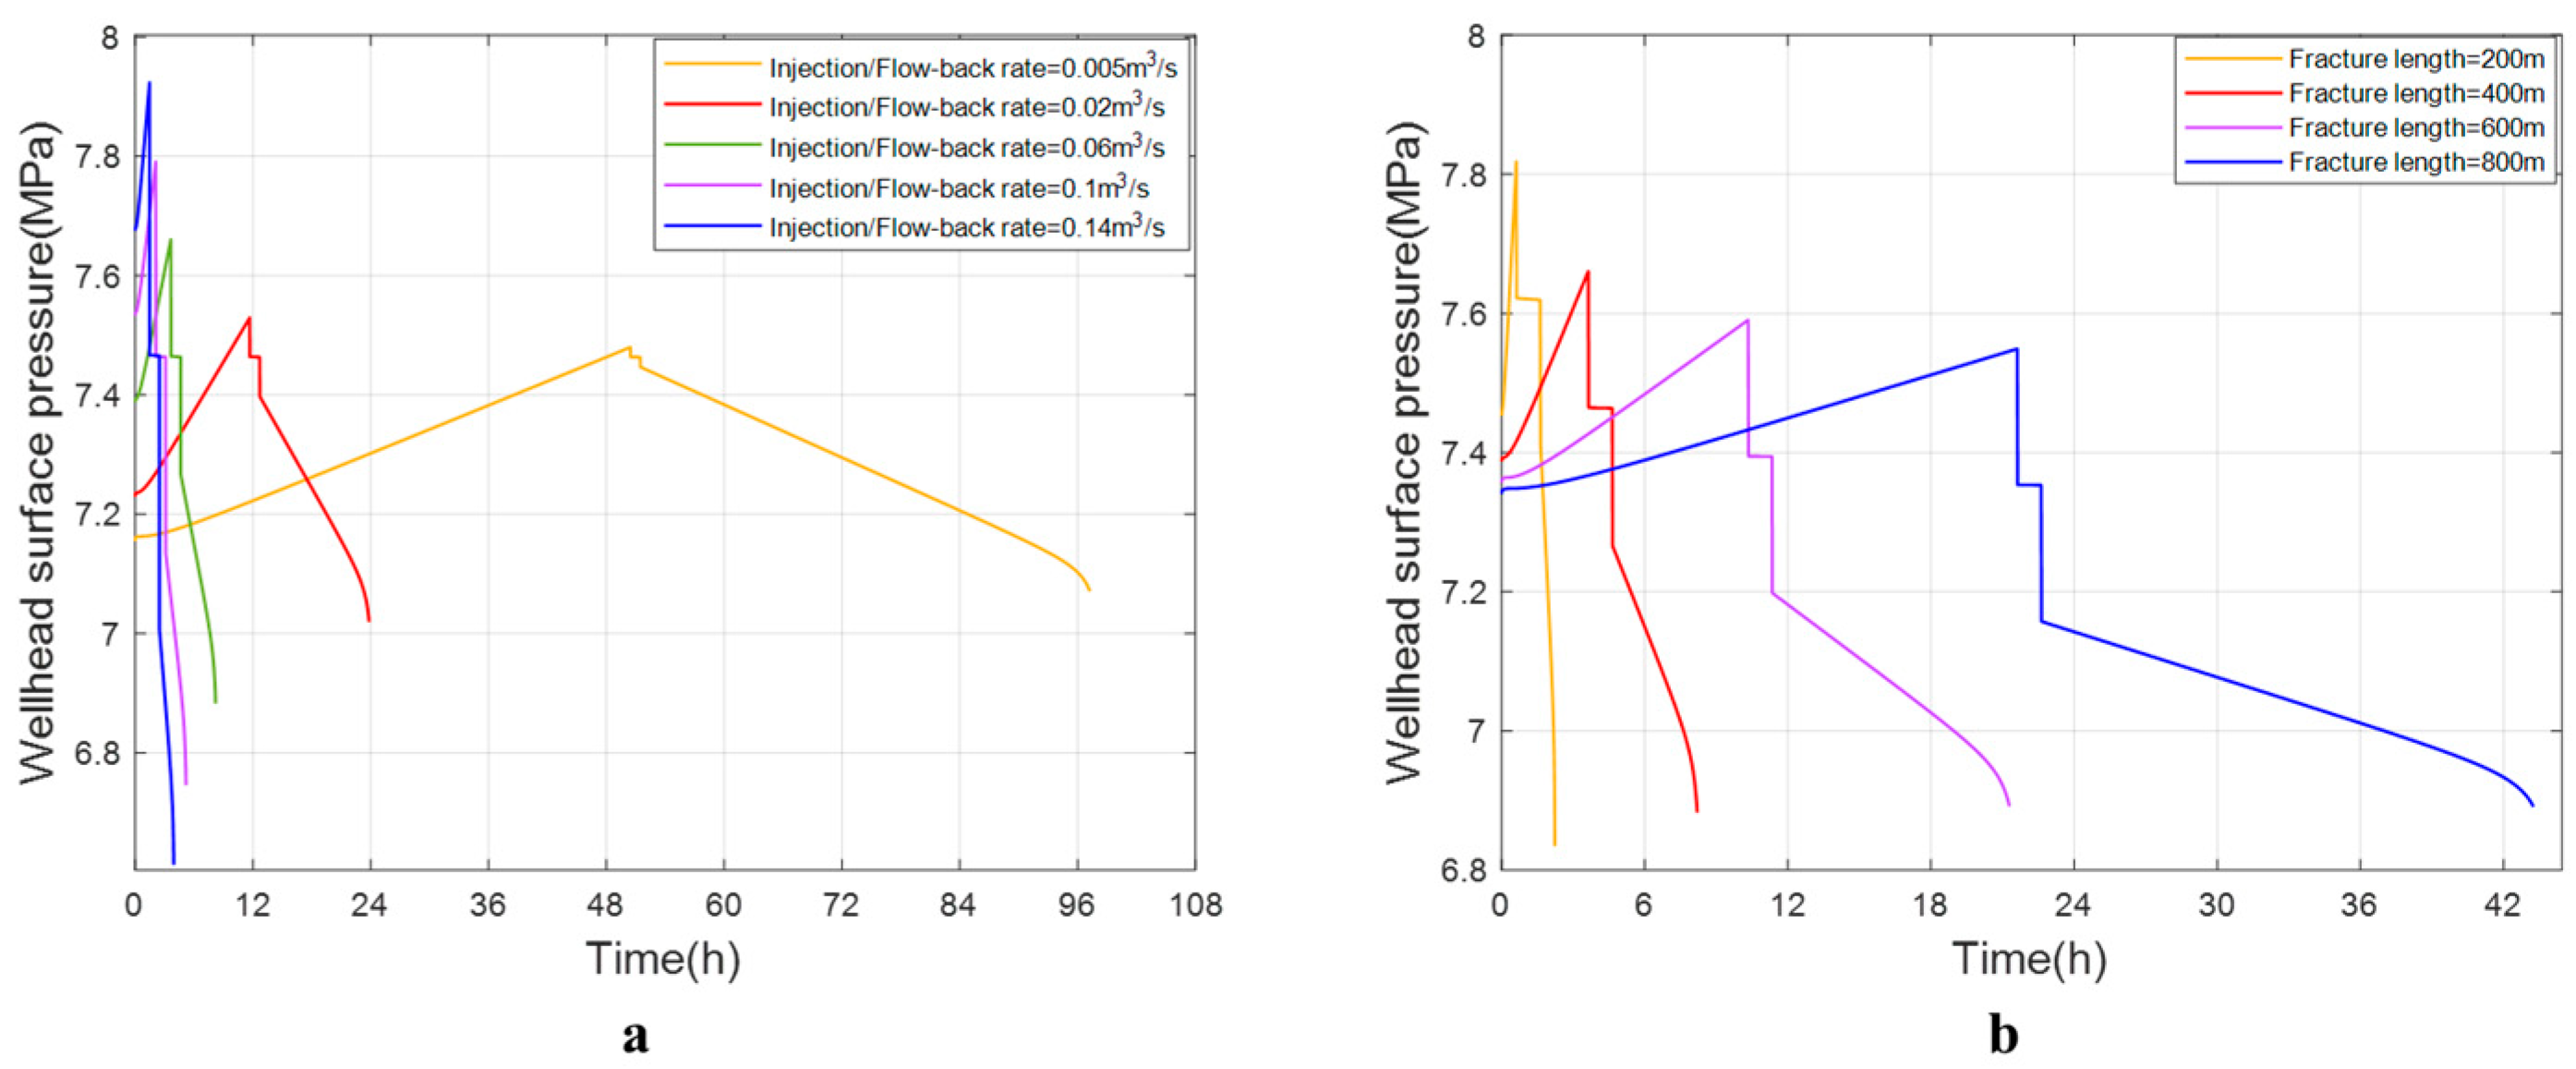
Given the consistent trend in responses, a specific injection/flow-back rate suffices to evaluate the influence of varying fracture lengths on wellhead pressure. Similarly, the effect of different injection/flow-back rates on wellhead surface pressure is analyzed in the same way. Figure 12 illustrates temporal variations in wellhead pressure under varying fracture lengths and injection/flow-back rates. Figure 12a depicts how injection/flow-back rates modulate wellhead pressure for a 200 m fracture. With increasing injection/flow-back rates, both injection and flow-back durations shorten. Moreover, higher injection/flow-back rates intensify frictional resistance across the wellbore-fracture system, amplifying the amplitude of wellhead pressure fluctuations. Figure 12b illustrates how fracture length governs wellhead pressure response at 0.06 m3/s injection/flow-back rate. With increasing fracture length, peak wellhead pressure during injection declines. Concurrently, extended fracture length yields greater fluid capacity, extending both injection and flow-back durations at fixed injection/flow-back rates. Notably, wellhead pressure undergoes a sharp decline at injection termination/flow-back initiation, driven by abrupt changes in frictional resistance within the wellbore-fracture system. Consequently, elevated injection/flow-back rates induce a more pronounced pressure drop at injection termination and flow-back onset.
Figure 13 illustrates the spatial profile of fracture aperture at flow-back completion under varying injection/flow-back rates and fracture dimensions. Figure 13a depicts how fracture aperture evolves at flow-back termination across injection/flow-back rates for a 200 m fracture. With rising injection/flow-back rates, residual aperture at flow-back completion correspondingly expands. This stems from elevated frictional resistance induced by higher injection/flow-back rates along the fracture. Consequently, accelerated pressure decline and premature fracture closure occur at the perforation during flow-back. Figure 13b illustrates fracture aperture profiles at flow-back completion across varying fracture lengths at 0.06 m3/s injection/flow-back rate. Extended fracture length similarly elevates frictional resistance, yielding a broader residual aperture at flow-back termination.
Figure 14 illustrates the evolution of recovered fluid volume and storage efficiency as functions of injection/flow-back rate and fracture dimension. The cases illustrated in Figure 14a,b correspond to a fracture length of 200 m and an injection/flow-back rate of 0.06 m3/s, respectively. Analysis of Figure 14a,b indicates that recovered fluid volume rises monotonically with elevated injection/flow-back rates and extended fracture dimensions, reflecting post-flow-back residual storage. Notably, higher injection/flow-back rates induce a progressive decline in storage efficiency. Conversely, while longer fractures retain more recovered fluid, they simultaneously enable greater total fluid storage capacity. Consequently, storage efficiency improves with increasing fracture dimension.
Figure 15 illustrates how peak energy input and output vary with injection/flow-back rate across varying fracture dimensions. Fluctuations in injection/flow-back rate induce variability in both peak energy input and output. With increasing injection/flow-back rates, peak energy input and output typically exhibit a downward trend. When comparing fracture dimensions, it is evident that longer fractures accommodate greater fluid storage capacity, thereby enhancing both peak energy input and output.
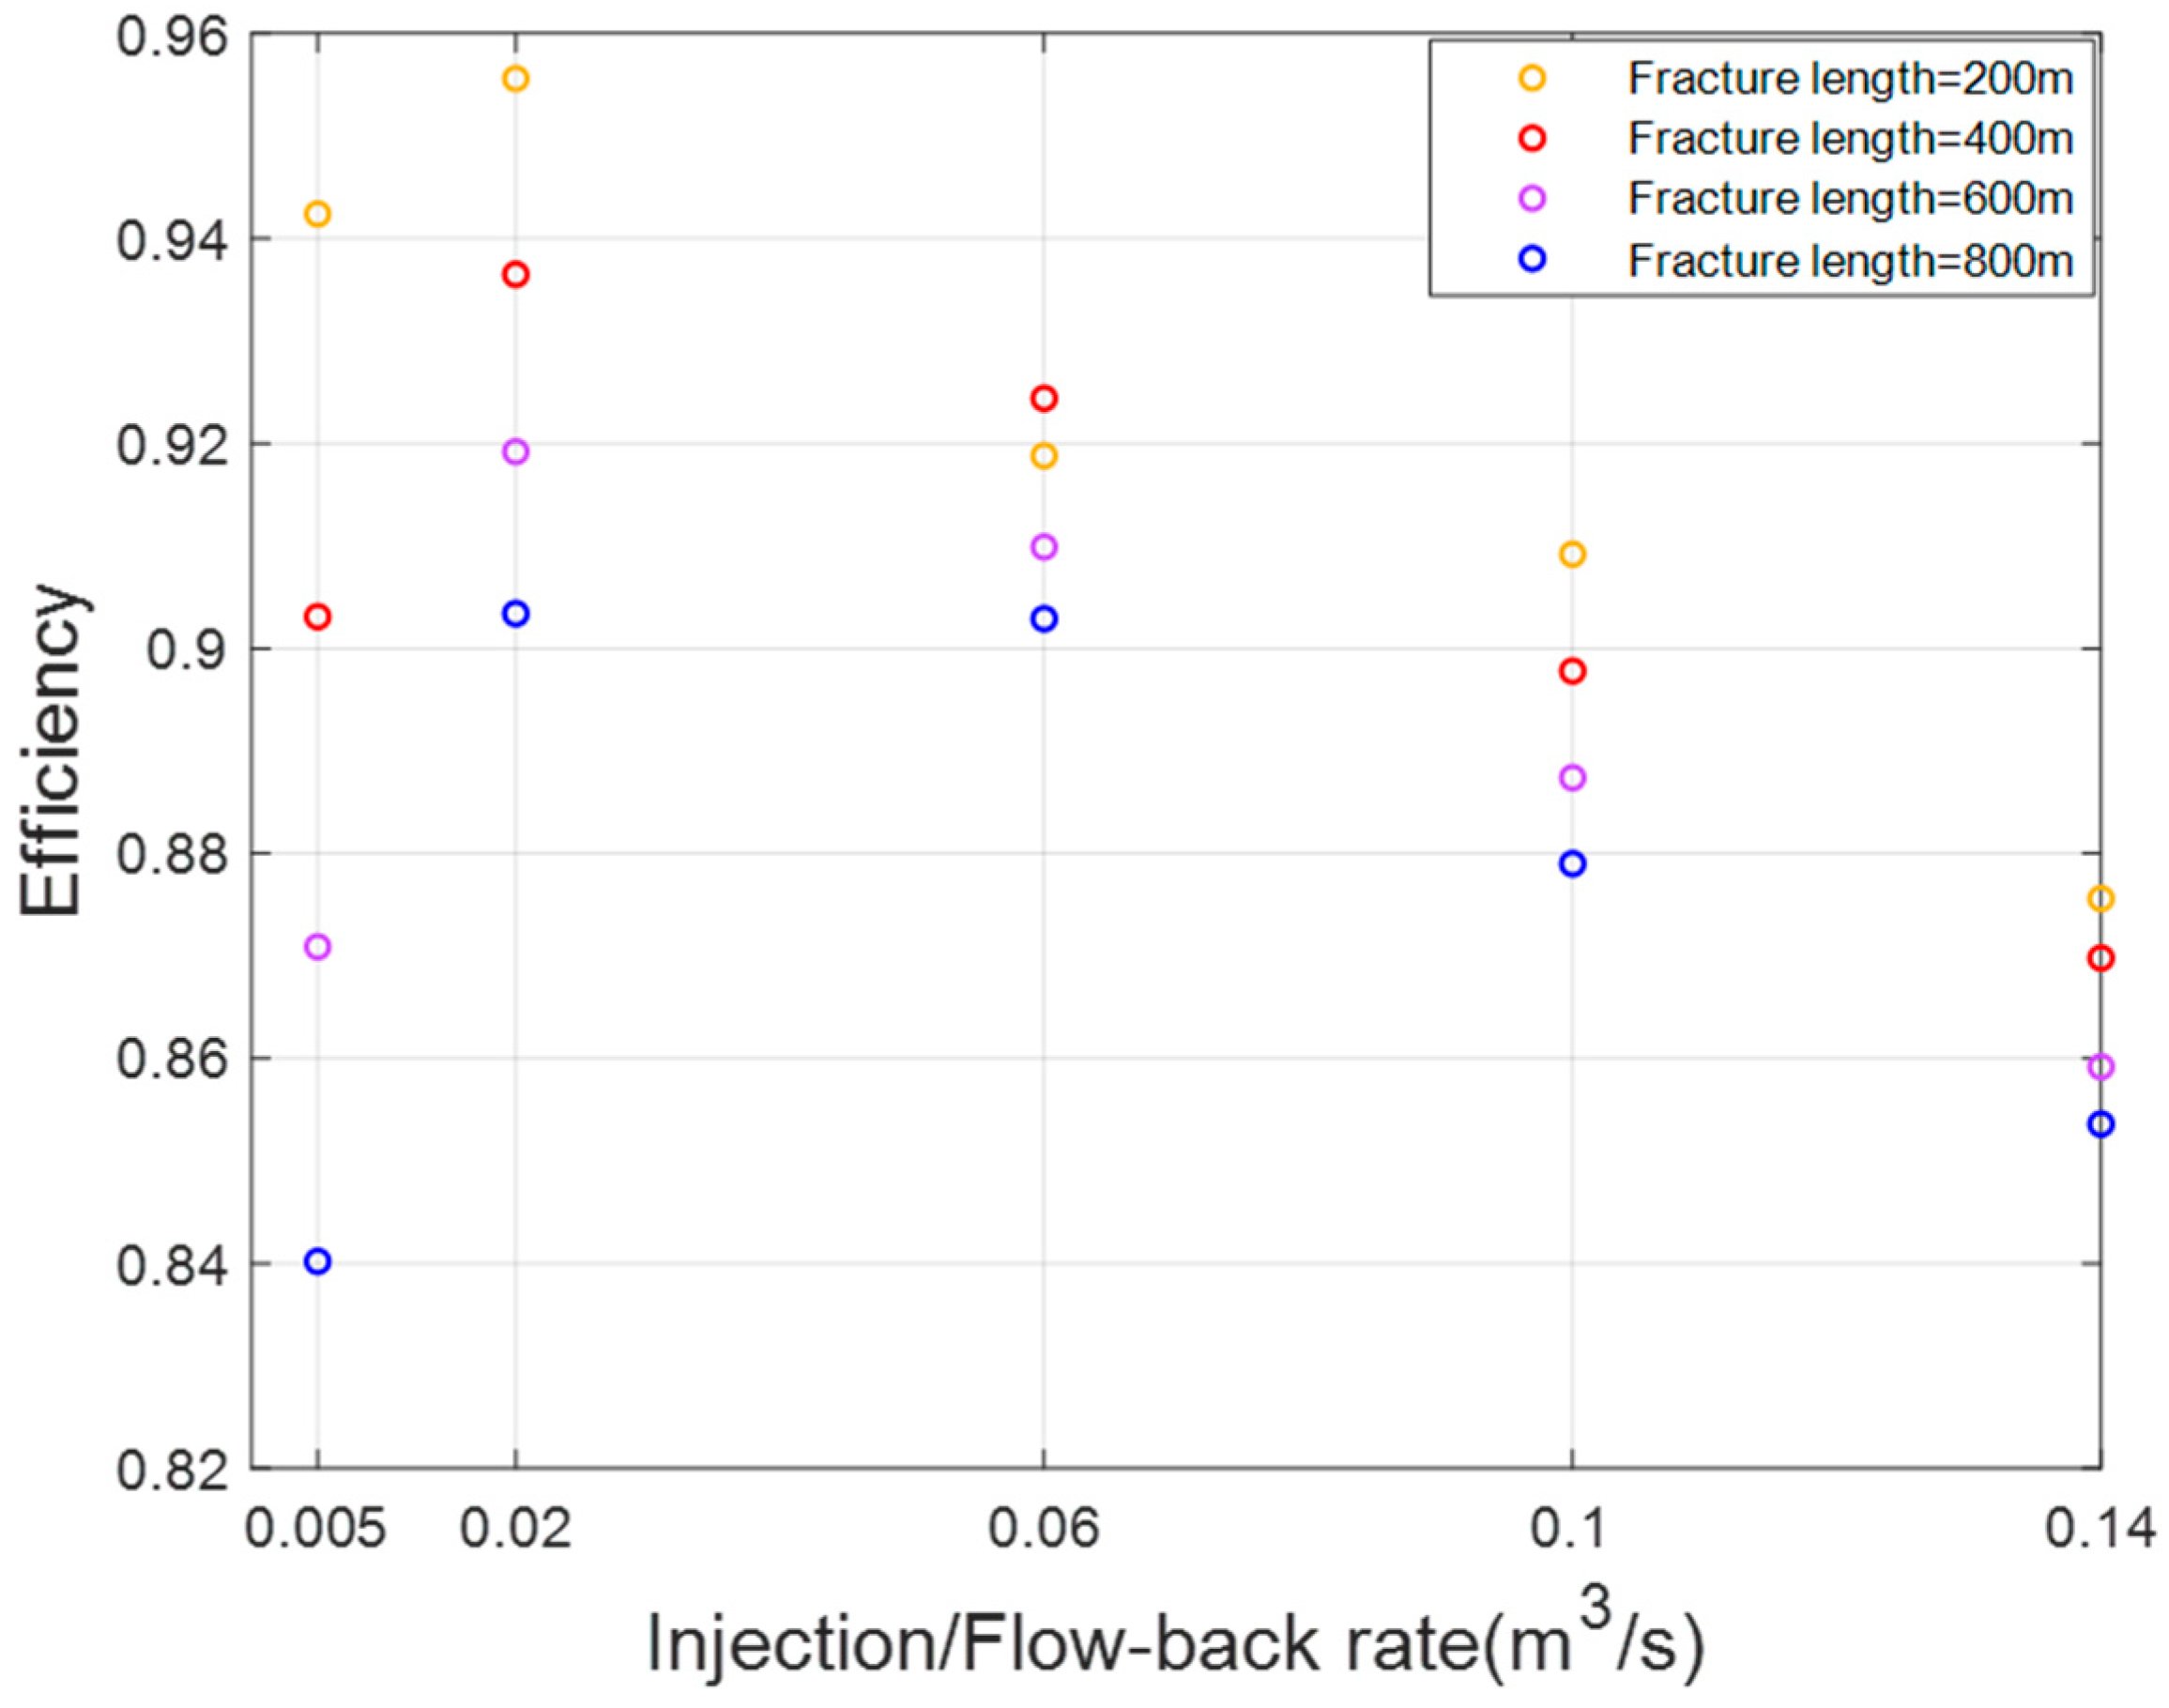
Figure 16 shows the efficiency versus injection/flow-back rate with different fracture lengths. As the injection/flow-back rate increases, efficiency initially rises and then falls. When the injection/flow-back rate is very low, friction along the wellbore and fractures are minimal, and efficiency is primarily affected by fluid leakage. As the injection/flow-back rate increases, the energy storage time shortens, reducing energy loss due to fluid leakage and thereby increasing efficiency. However, when the injection/flow-back rate reaches a certain threshold, the impact of fluid leakage on efficiency diminishes, and friction along the wellbore and fractures becomes more significant and dominant. With further increases in the injection/flow-back rate, energy loss due to friction gradually rises, leading to a decrease in efficiency. Observing the efficiency of different fracture lengths, it can be found that shorter fractures generally yield higher efficiency across different injection/flow-back rates. This is because longer fractures have larger leakage areas and extended storage times. Regardless of whether the injection/flow-back rate is low or high, longer fractures may result in greater total energy loss due to fluid leakage or friction.

4.2. Deep Reservoir

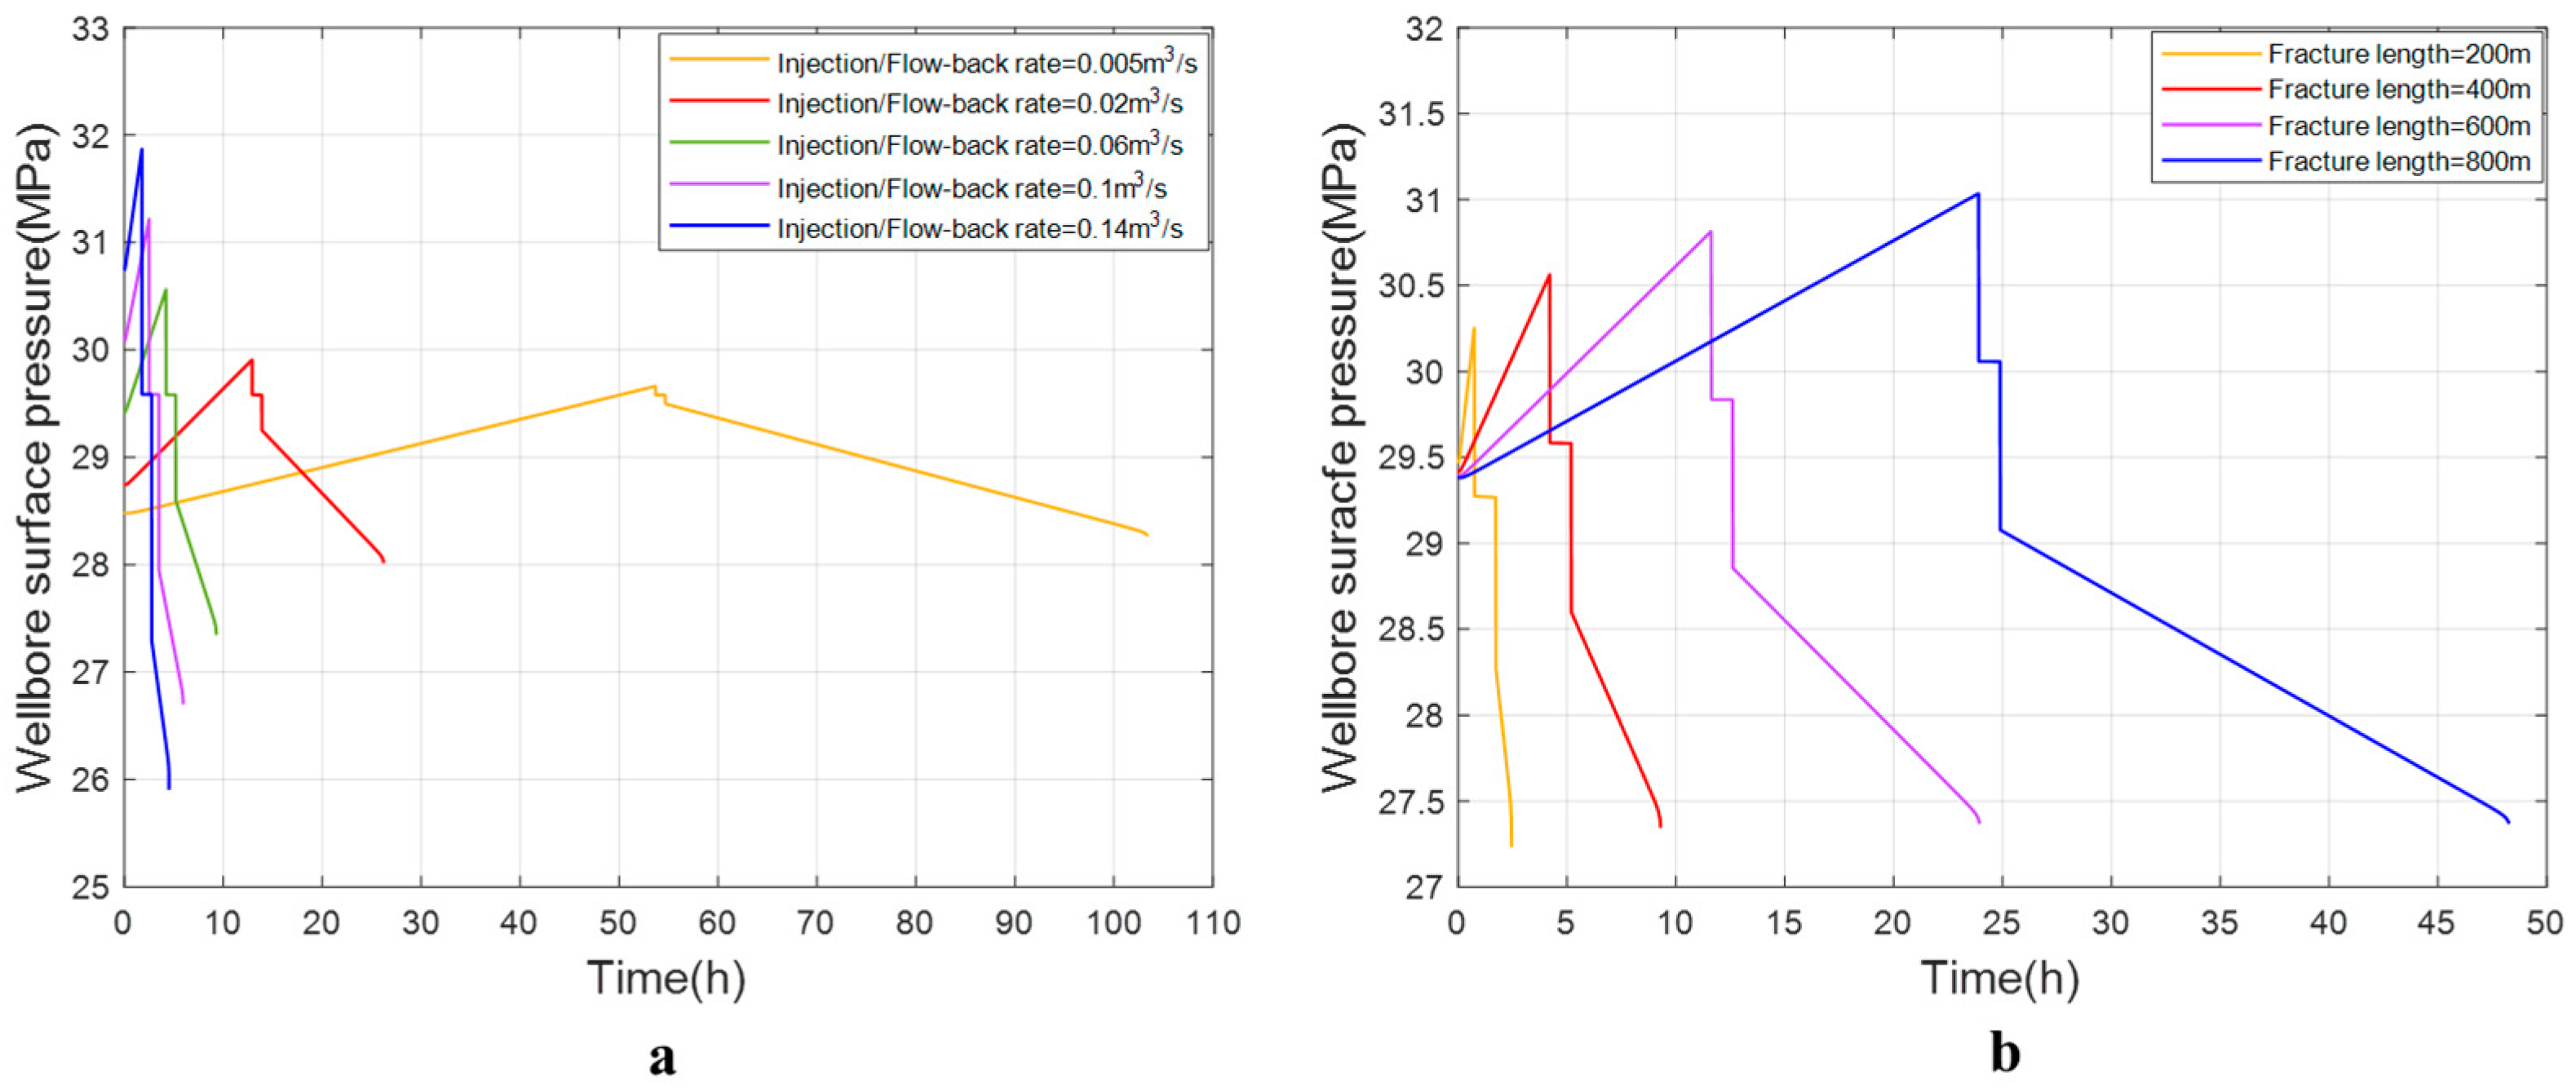
Figure 17 shows the change in wellbore surface pressure over time with different fracture lengths and injection/flow-back rates. Figure 17a shows the effect of different injection/flow-back rates on wellhead surface pressure for a fracture length of 200 m. Similarly to penny-shaped fractures, the wellhead surface pressure variation in elliptical fractures increases with the injection/flow-back rate, while the storage time decreases. Figure 17b shows the effect of different fracture lengths on wellhead surface pressure at an injection/flow-back rate of 0.06 m3/s. As the fracture length increases, the storage time progressively extends. Unlike penny-shaped fractures, longer elliptical fractures are capable of reaching higher wellbore surface pressures during the storage process. Additionally, in elliptical fractures, the wellhead surface pressure will also experience a sudden drop when injection ceases and backflow begins.
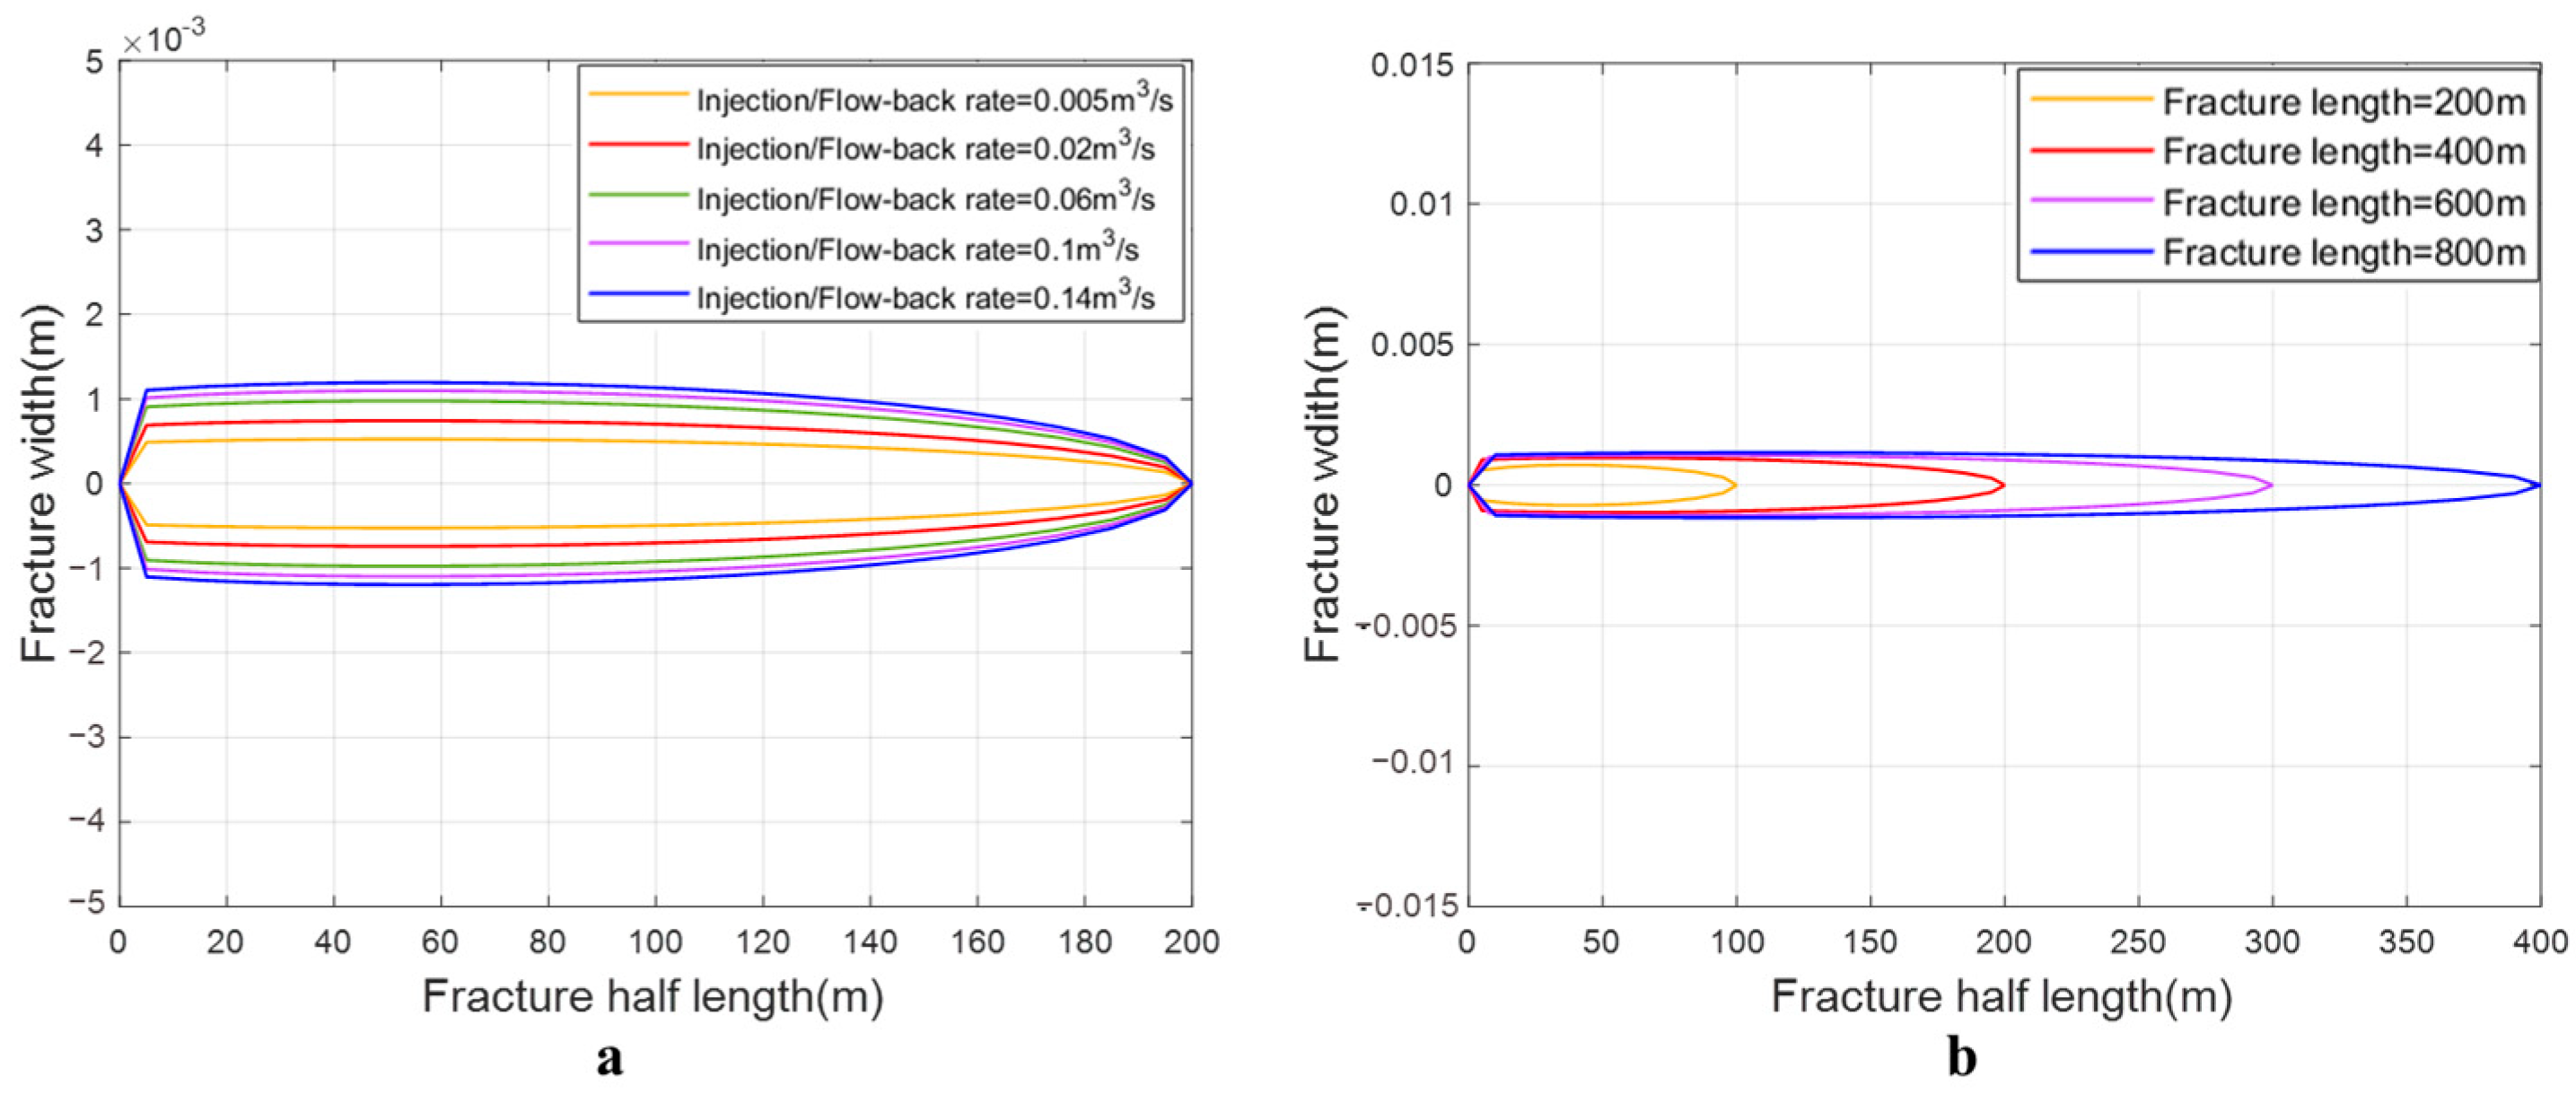
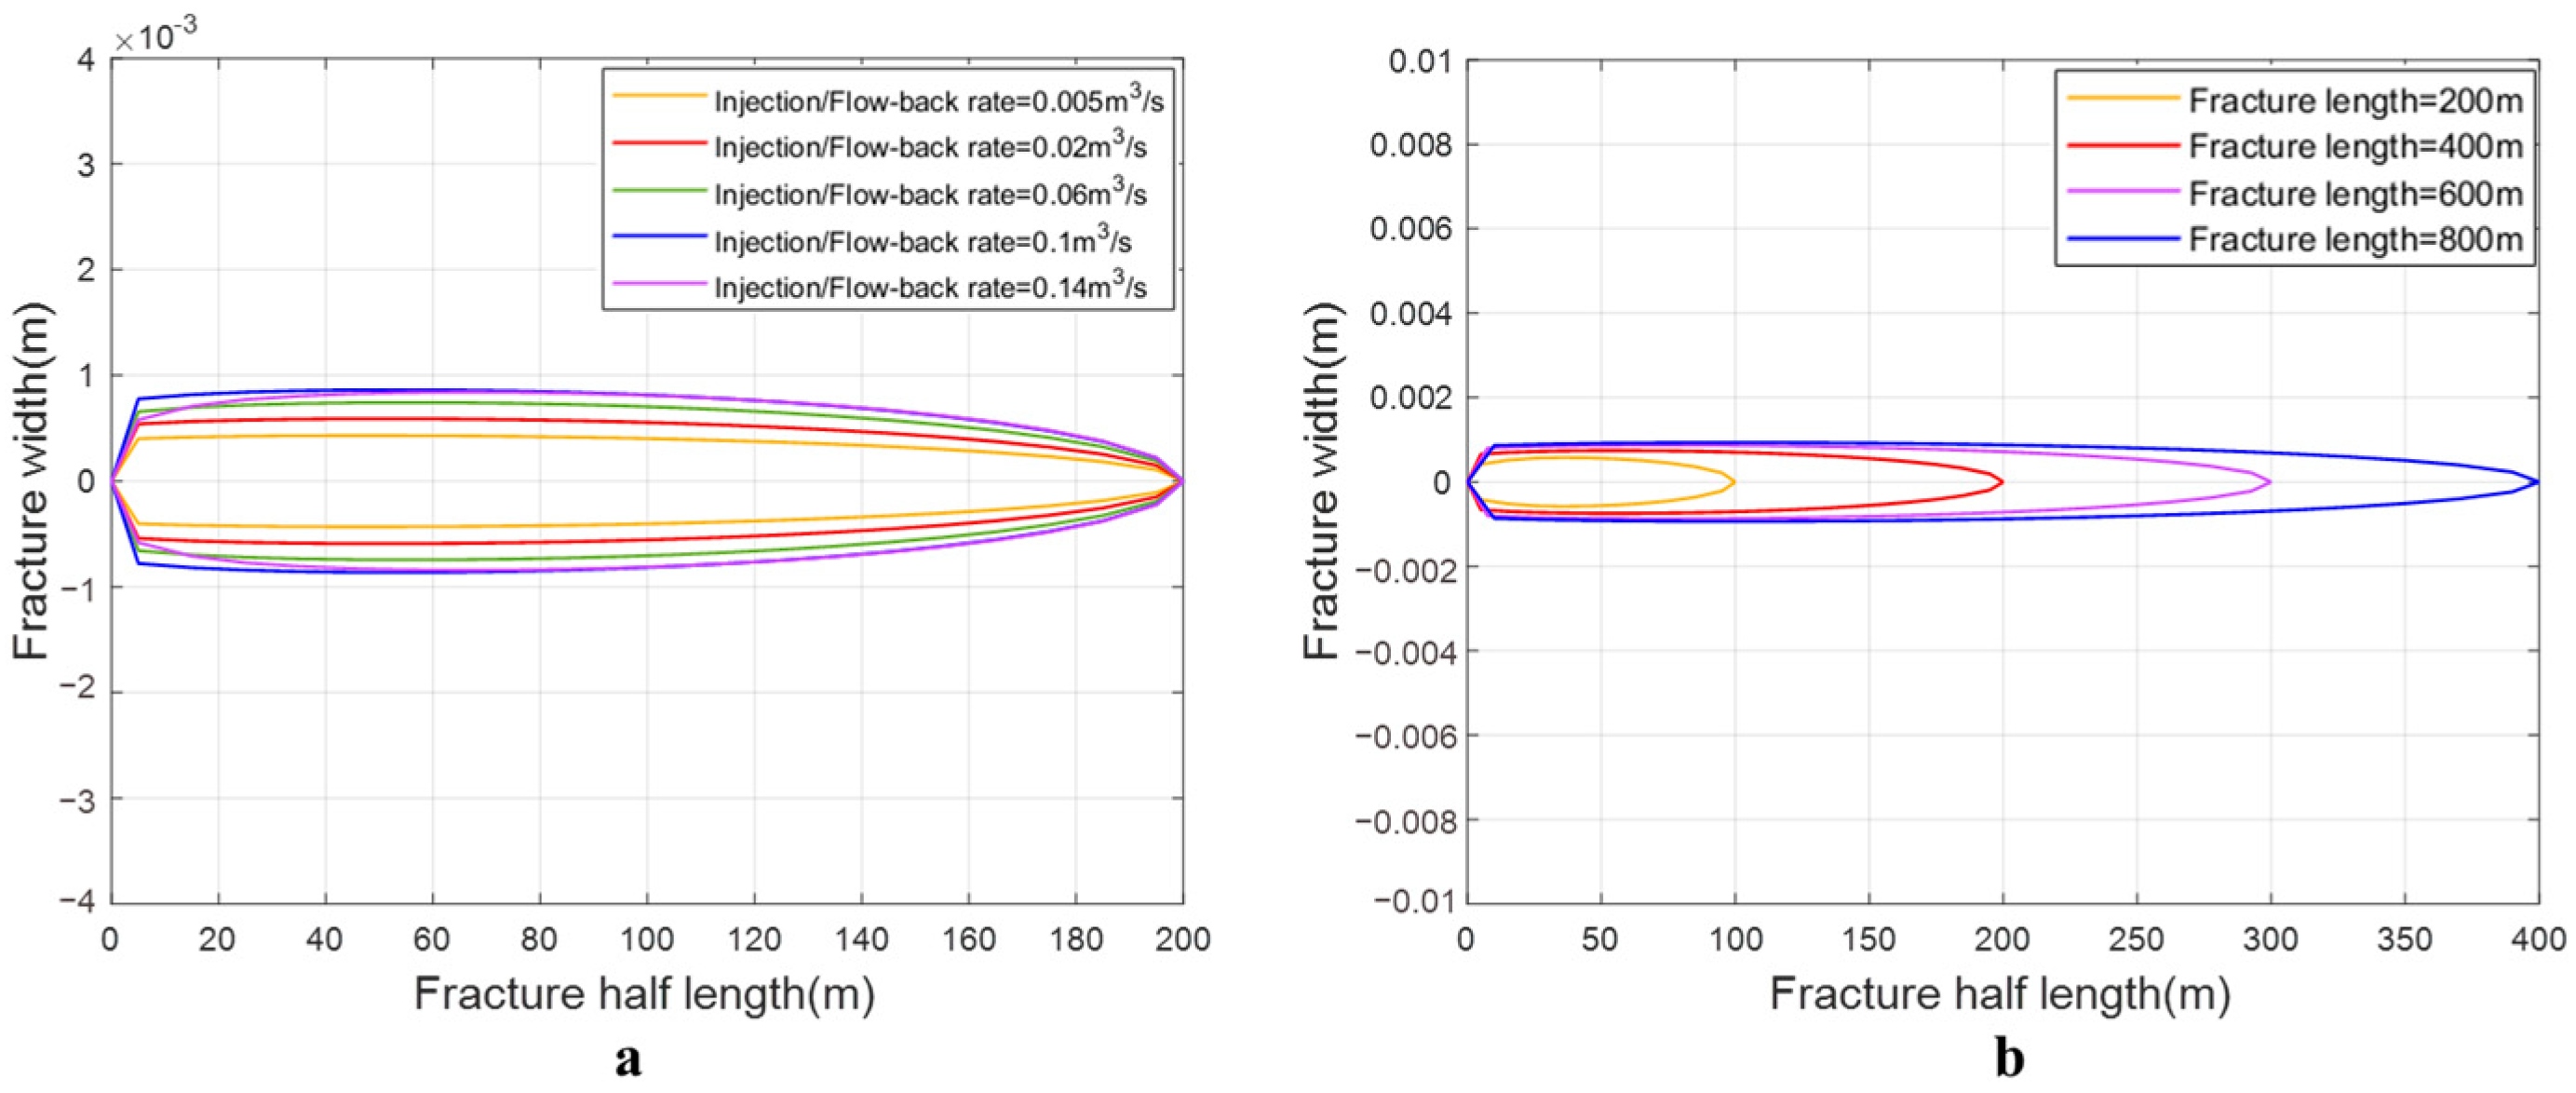
Figure 18 shows the distribution of fracture width at the end of flow-back with different injection/flow-back rates and fracture lengths. Similarly to penny-shaped fractures, as the injection/flow-back rate and fracture length increase, both the residual width in the fracture increases at the end of the flow-back.
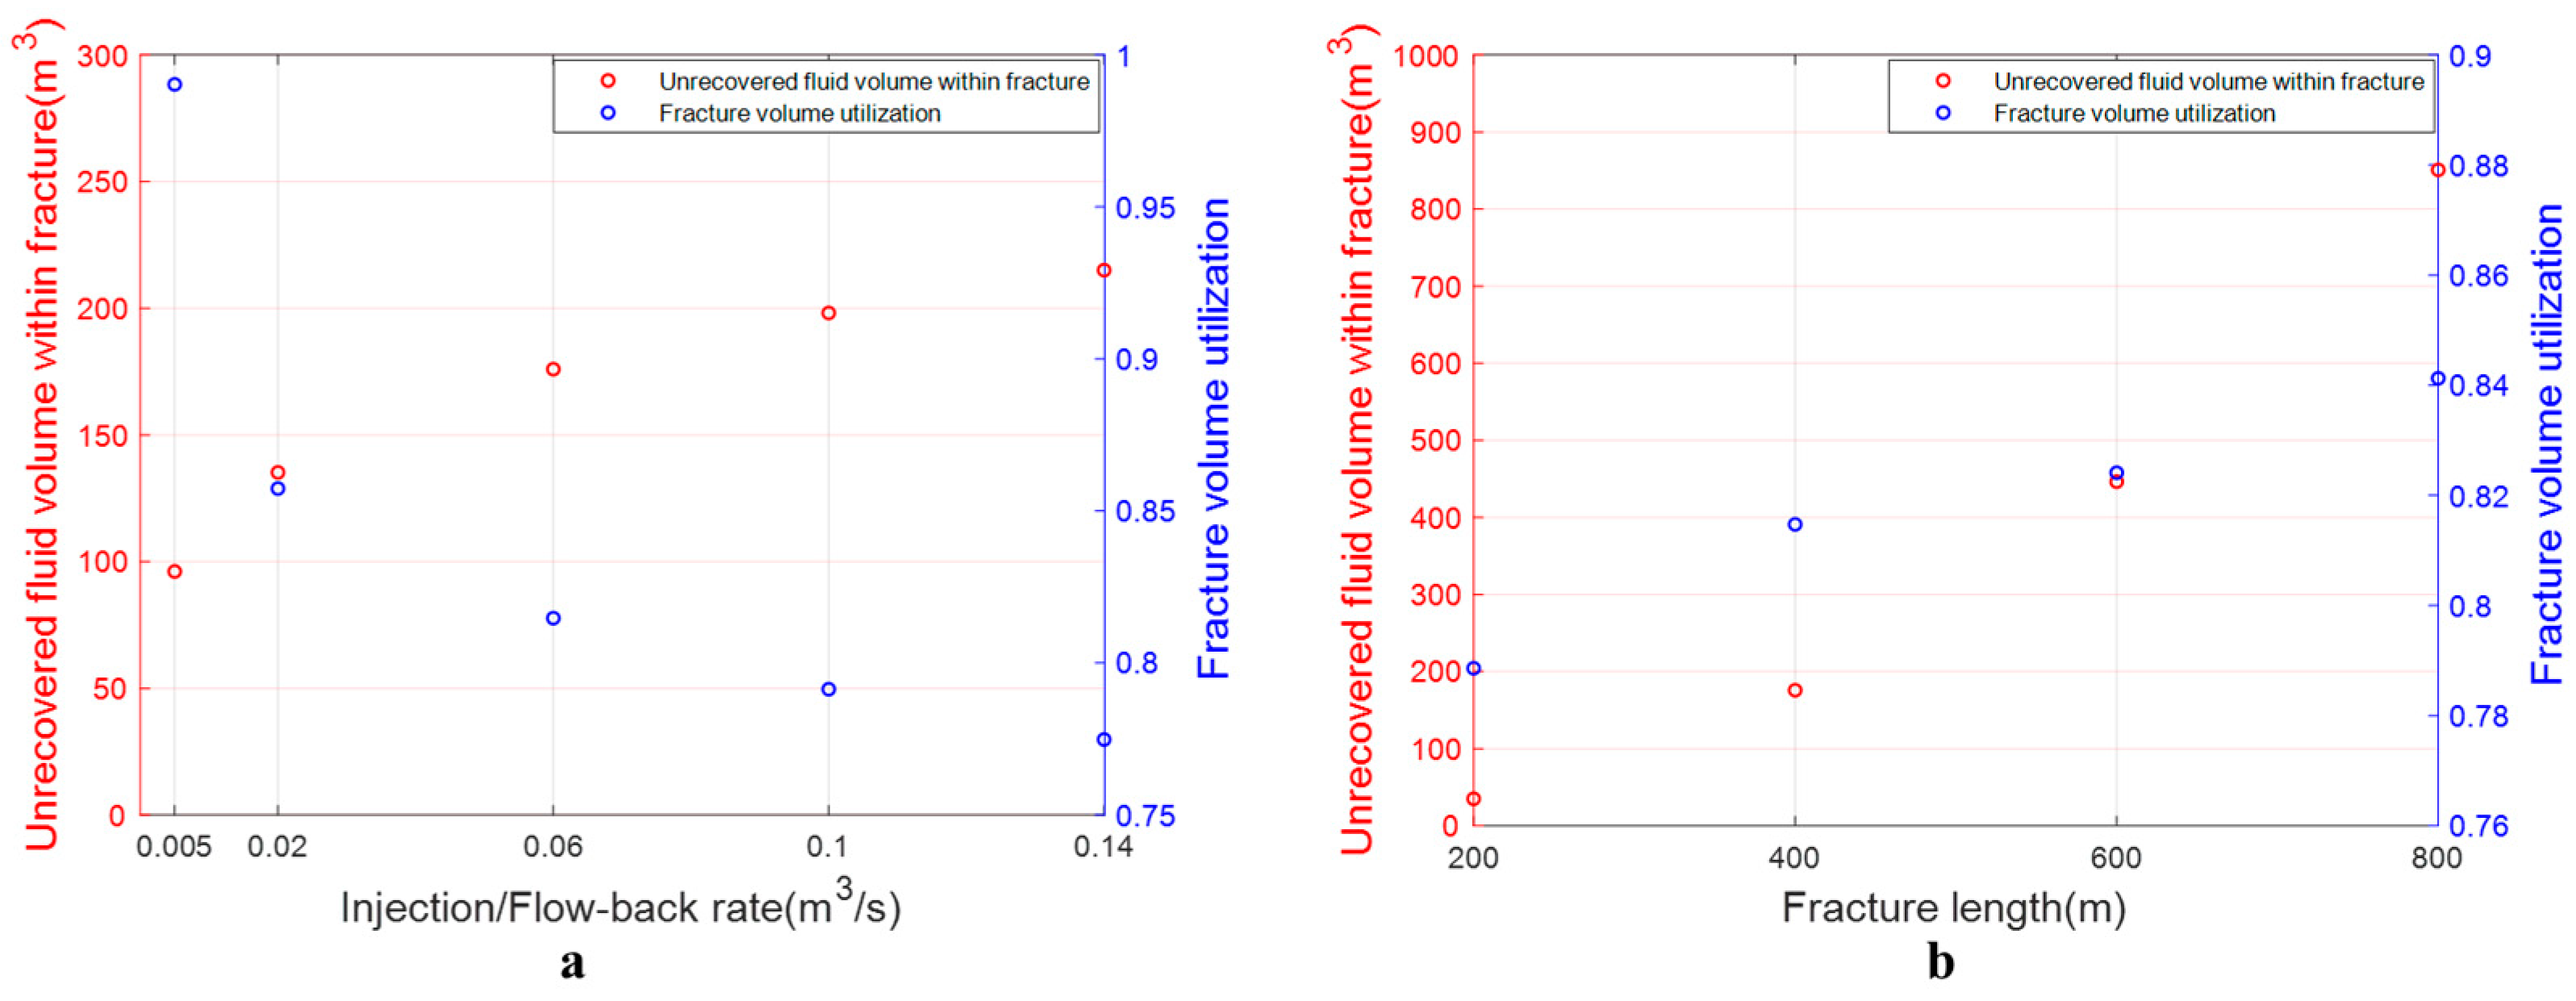
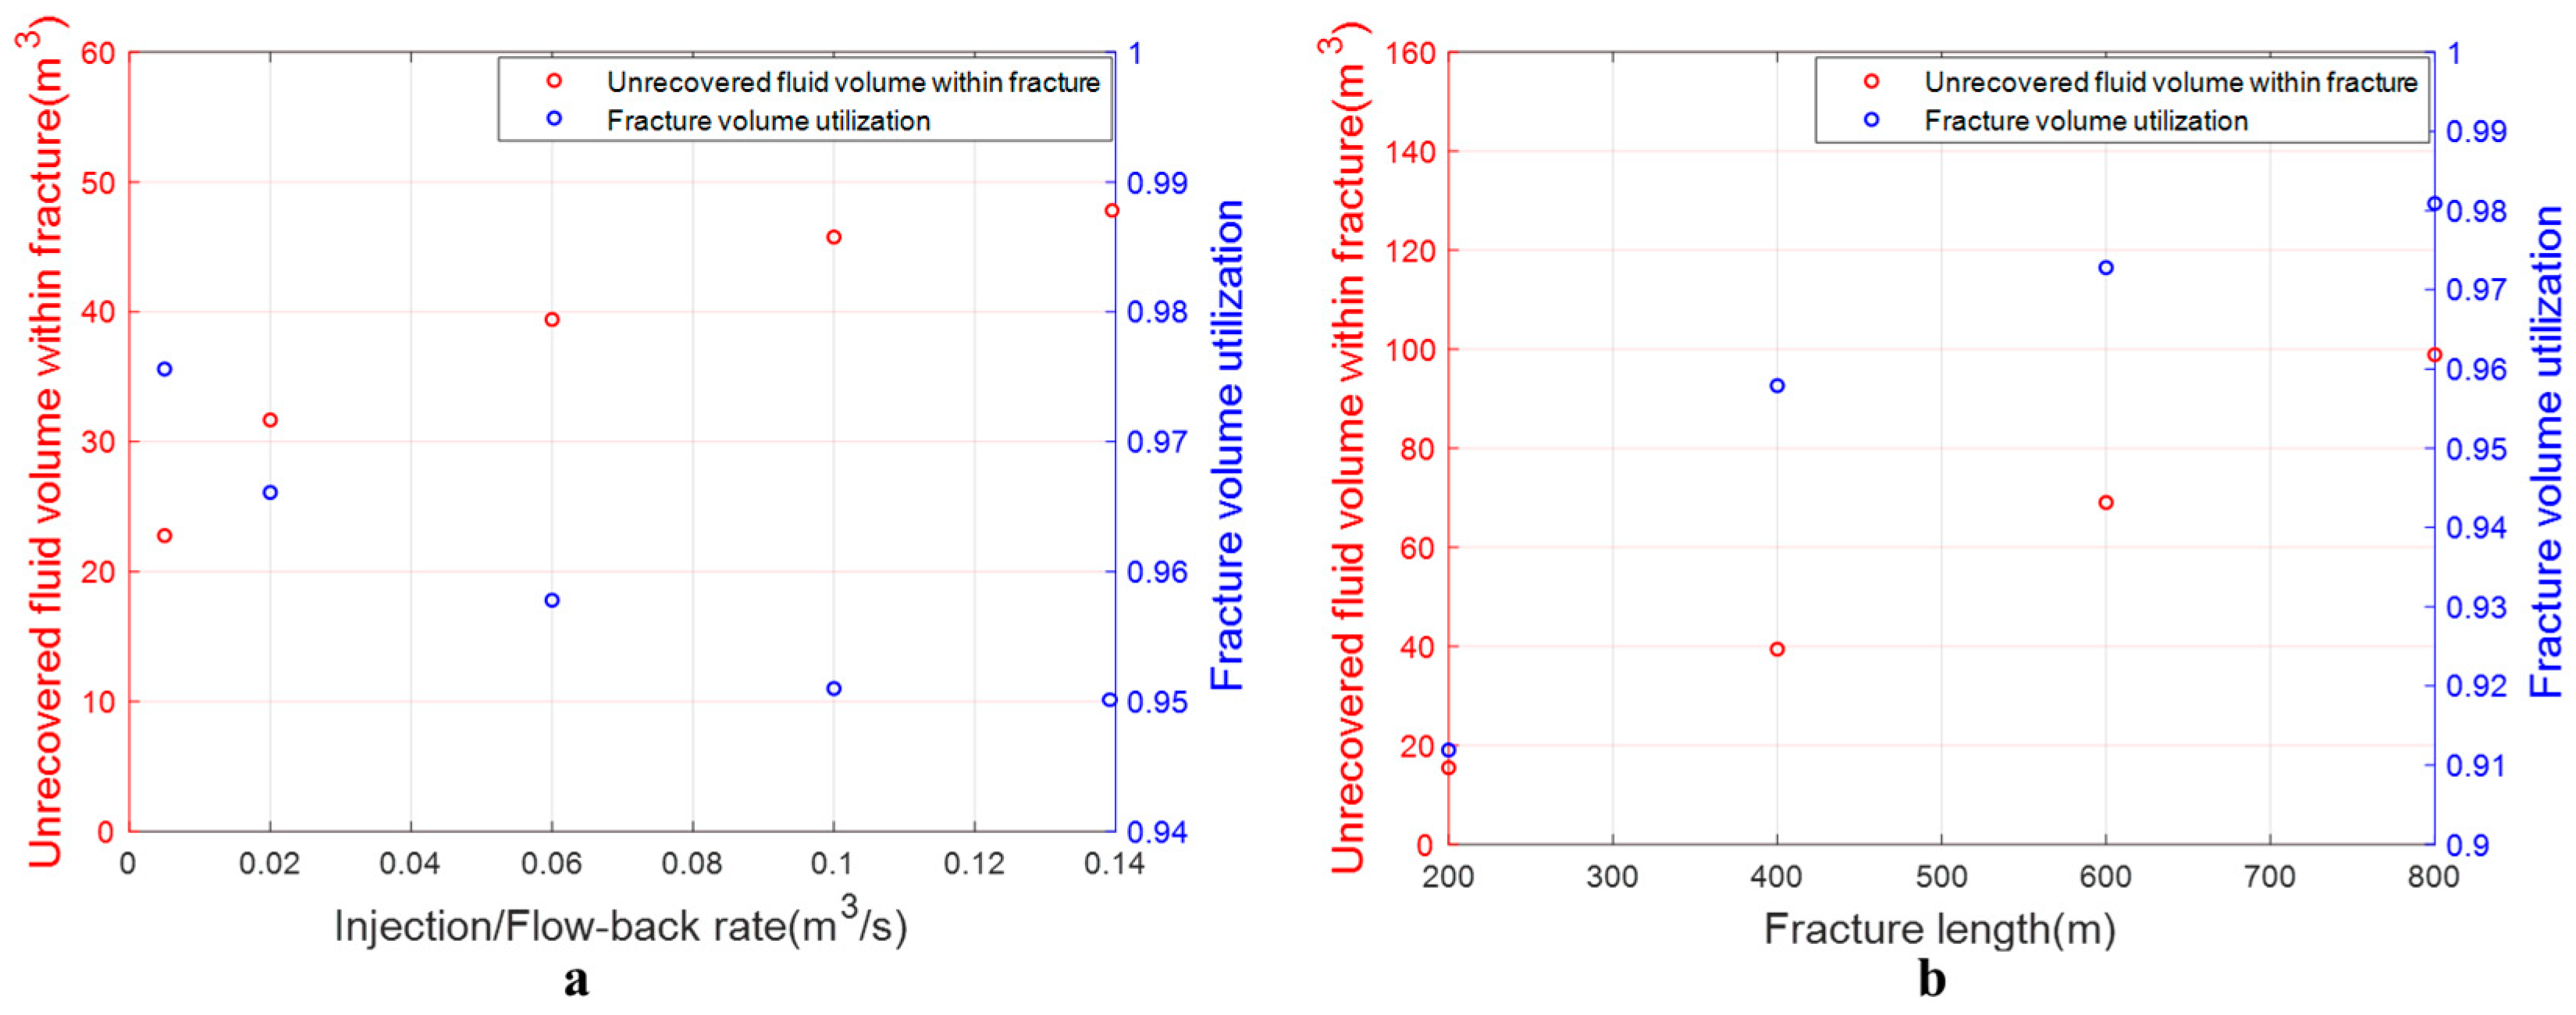
Figure 19 shows the change in unrecovered fluid volume within fracture and fracture volume utilization over injection/flow-back rate and fracture length. As the injection/flow-back rate increases, the unrecovered fluid volume in the fracture increases, leading to a decrease in fracture volume utilization. Conversely, as the fracture length increases, the unrecovered fluid volume grows, but the fracture volume utilization improves. The specific cause analysis is consistent with that of the penny-shaped fracture case.
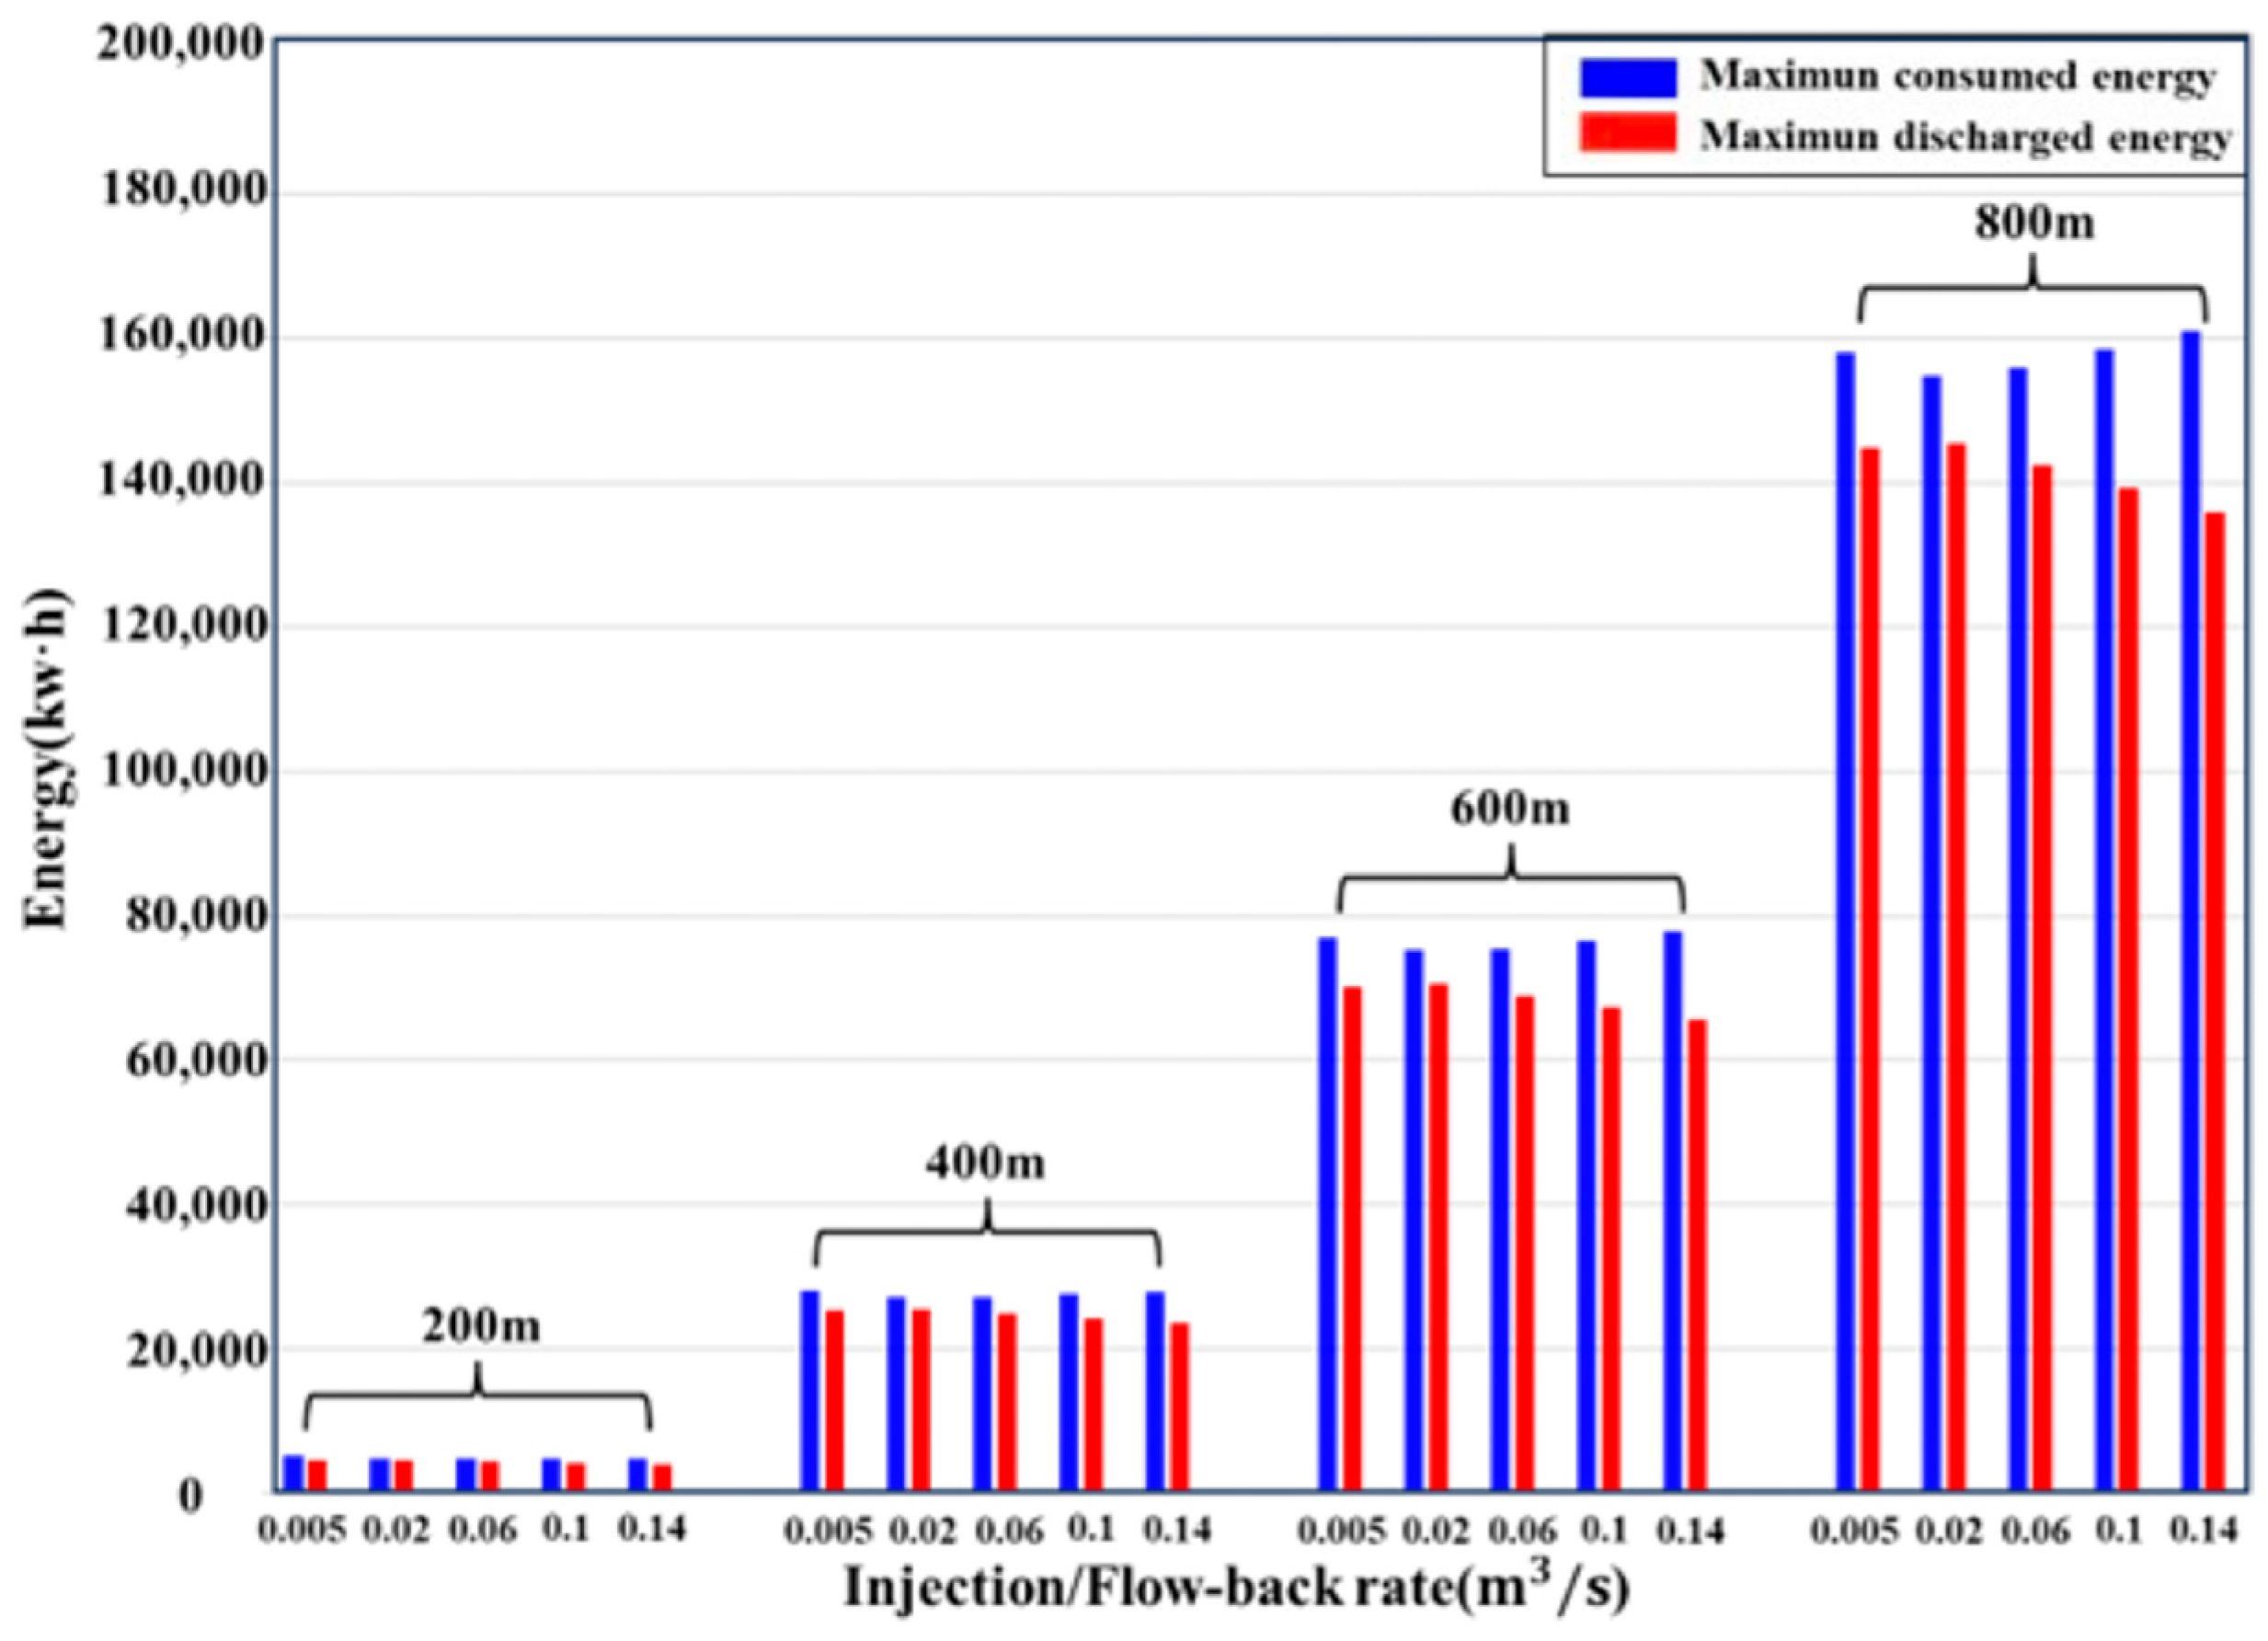
Figure 20 shows the change in maximum consumed energy and maximum discharged energy over injection/flow-back rate with different fracture lengths. Unlike penny-shaped fractures, changes in injection/flow-back rates in elliptical fractures lead to smaller fluctuations in maximum consumed energy and maximum discharged energy. As the injection/flow-back rates increase, the maximum consumed energy initially decreases before increasing again, while the maximum discharge energy is the opposite. Comparing different fracture lengths, it can be observed that as the fracture length increases, the maximum fluid volume that can be stored within the fracture grows, leading to a significant rise in both the maximum consumed energy and the maximum discharged energy.
Figure 21 shows the change in efficiency over injection/flow-back rate with different fracture lengths. As the injection/flow-back rate increases, efficiency initially rises and then falls. Combining the penny-shaped fracture case, we can see that the effect of injection/flow-back rate changes on energy and efficiency is essentially a balance between the fluid leakage effect and the friction effect. Next, we analyze the impact of fracture length on efficiency. At lower injection/flow-back rates, friction is minimal, and efficiency is primarily affected by fluid leakage. Although longer fractures may result in greater total energy loss due to fluid leakage, the total energy storage capacity also increases, making larger fractures ultimately have higher efficiency. As injection/flow-back rates increase, fluid leakage decreases, and the impact of friction on efficiency becomes more significant. Longer fractures not only result in greater total energy loss due to fluid leakage but also due to friction. Consequently, larger fractures have lower energy storage efficiency.

4.3. Fracture Toughness

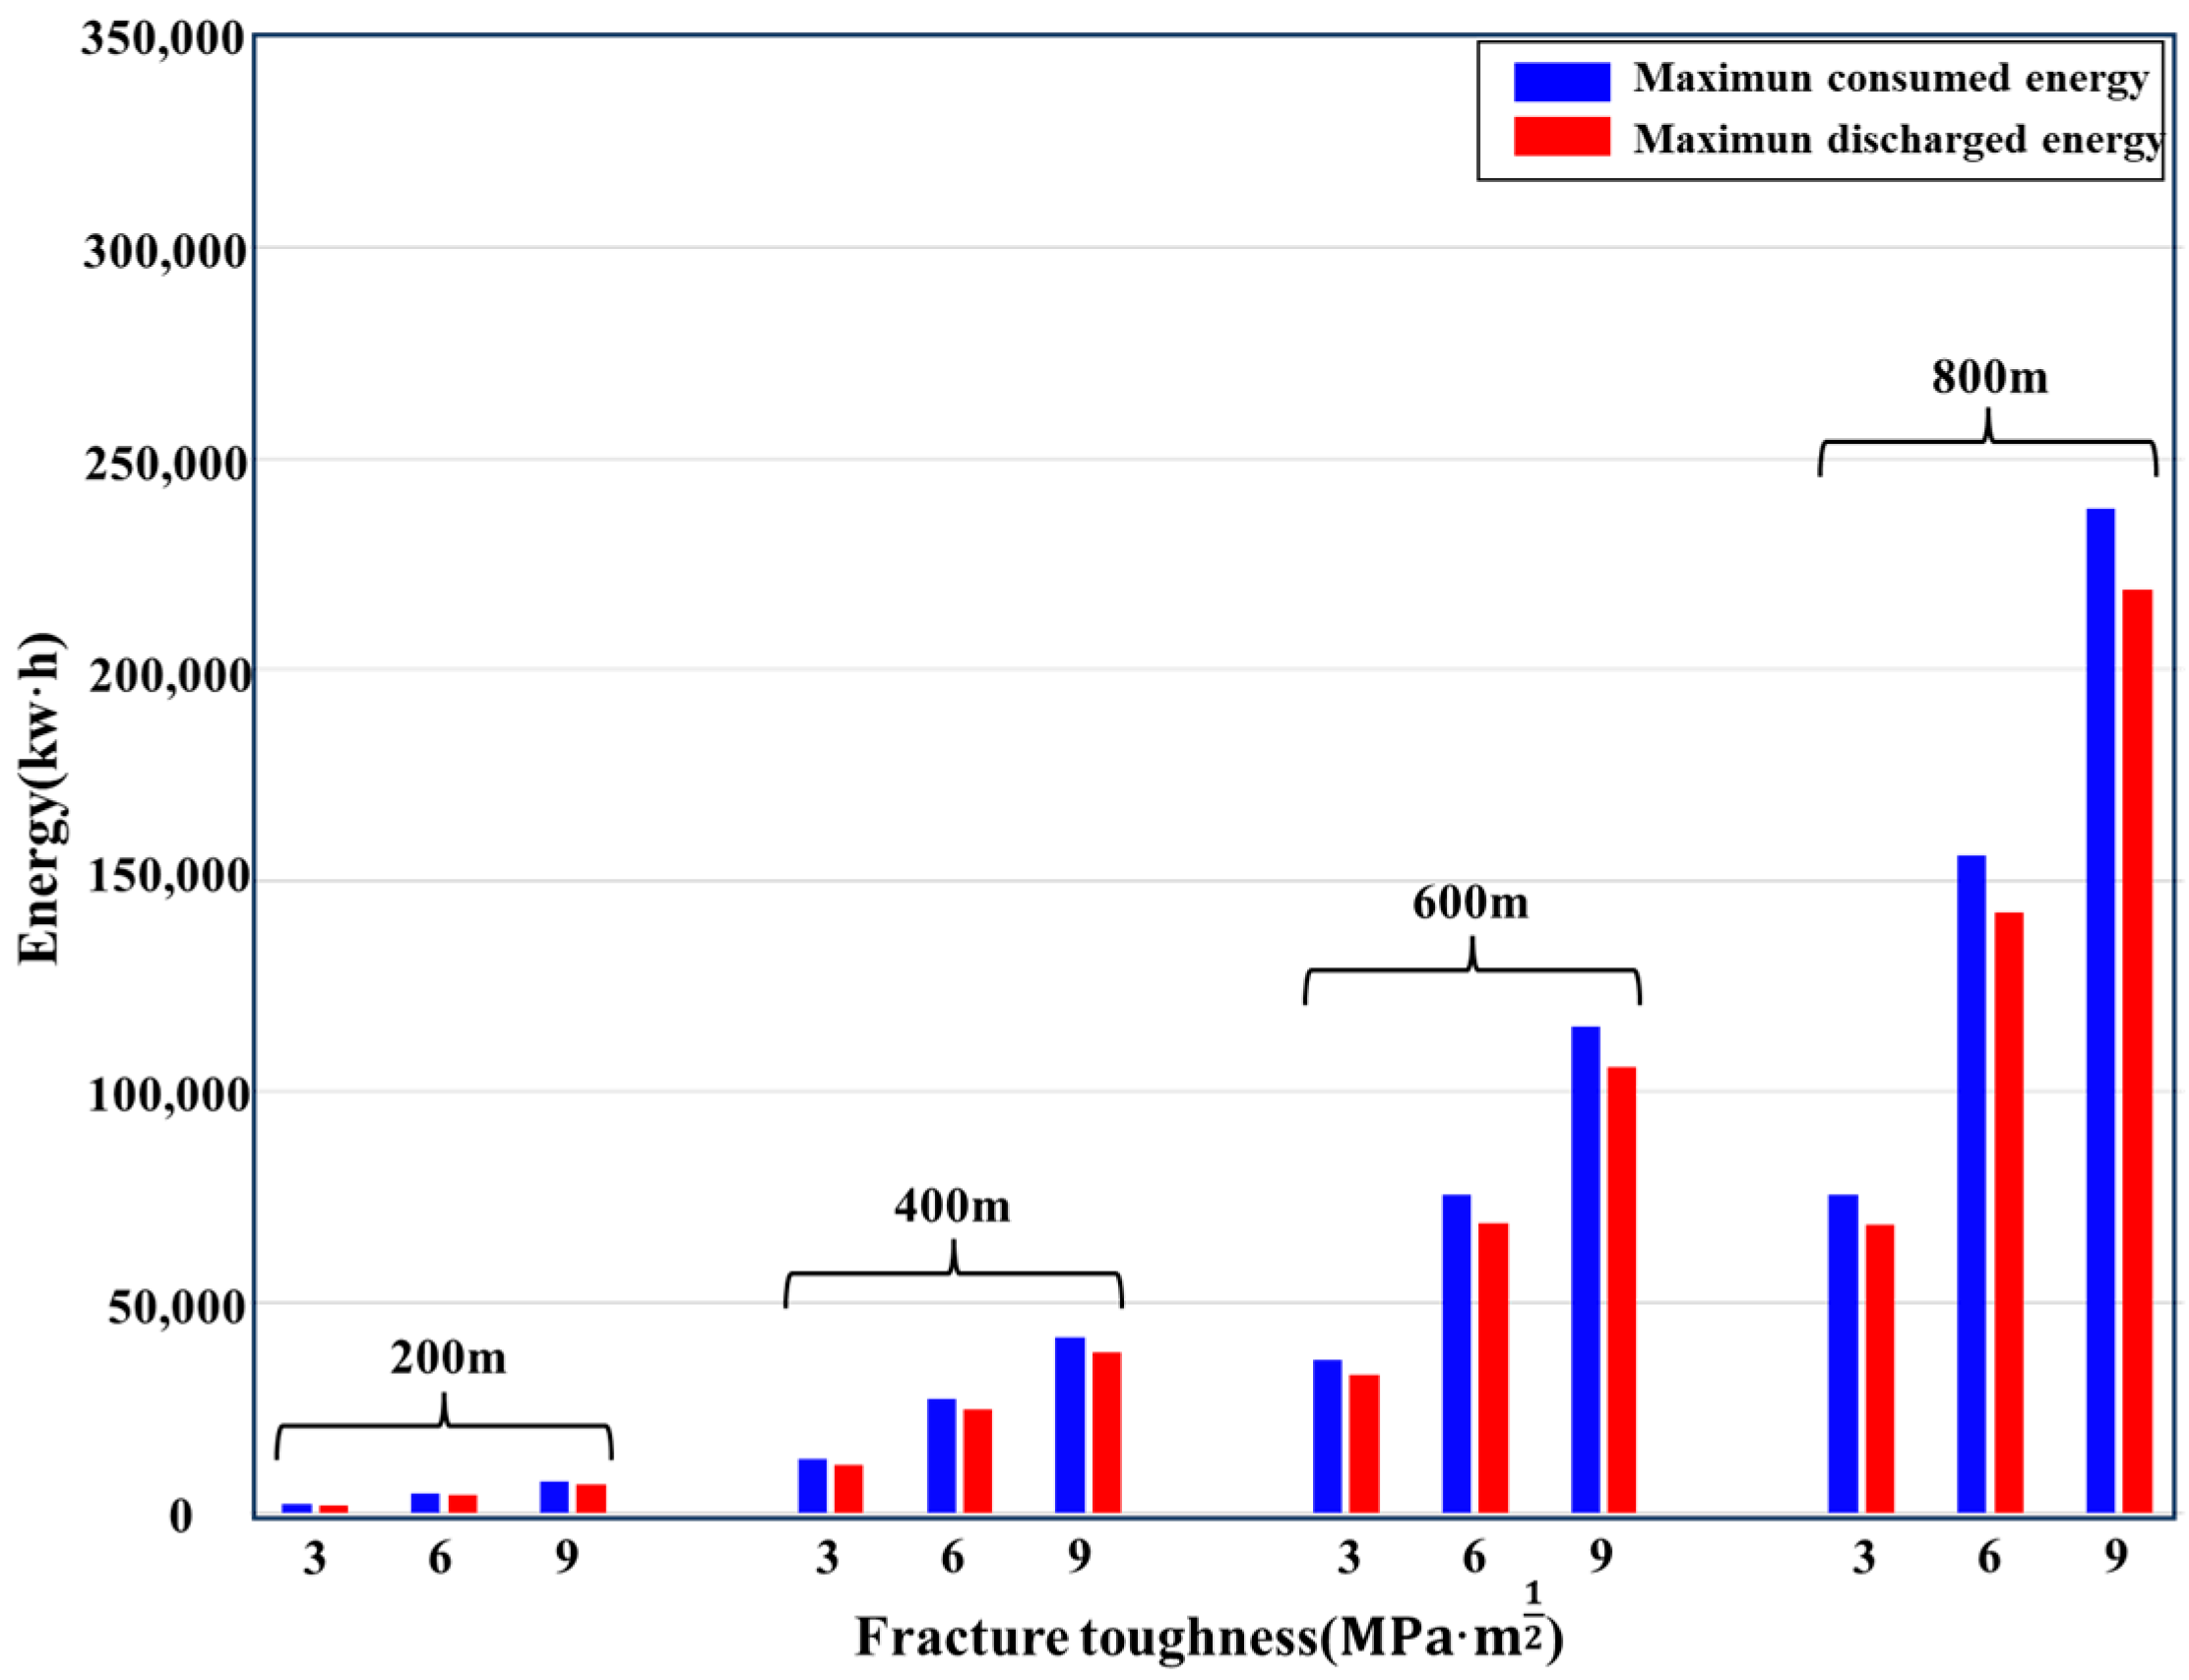
Changes in reservoir fracture toughness not only alter the scale of energy storage but may also impact energy storage efficiency. The fracture toughness values are set at 3 MPa· m 1 2 , 6 MPa· m 1 2 , and 9 MPa· m 1 2 . Remaining model inputs are detailed in Table 1 and Table 2. A representative injection/flow-back rate scenario was selected to demonstrate how fracture toughness governs peak energy input and output. Figure 22 and Figure 23 depict how peak energy input and output evolve with fracture toughness across varying fracture dimensions for penny-shaped and elliptical geometries, respectively. Irrespective of geometry (penny-shaped or elliptical), enhanced fracture toughness substantially boosts both peak energy input and output.
Figure 24 and Figure 25 show the change in efficiency over injection/flow-back rate and fracture length with different fracture toughness for penny-shaped fracture and elliptical fracture, respectively. Figure 24a–c show the conditions of penny-shaped fractures when the fracture toughness is 3 MPa· m 1 2 , 6 MPa· m 1 2 , and 9 MPa· m 1 2 , respectively. Figure 25a–c show the conditions of elliptical fractures when the fracture toughness is 3 MPa· m 1 2 , 6 MPa· m 1 2 , and 9 MPa· m 1 2 , respectively. Observing these figures, it is evident that the effects of fracture length and injection/reflow rate on energy storage efficiency are generally consistent across different fracture toughness conditions for both penny-shaped and elliptical fractures. Notably, a comparison of Figure 25a–c reveals that, under the same fracture length and injection/reflow rate conditions, the energy storage efficiency of penny-shaped fracture increases progressively with higher fracture toughness. Similarly, Figure 25a–c demonstrate the same trend for elliptical fracture. This stems from enhanced fracture toughness expanding the effective storage capacity. Moreover, when accommodating greater energy volumes, wider apertures and prolonged storage durations mitigate losses from fluid leakage and frictional dissipation within the fracture (see Figure 26).

4.4. Reservoir Permeability

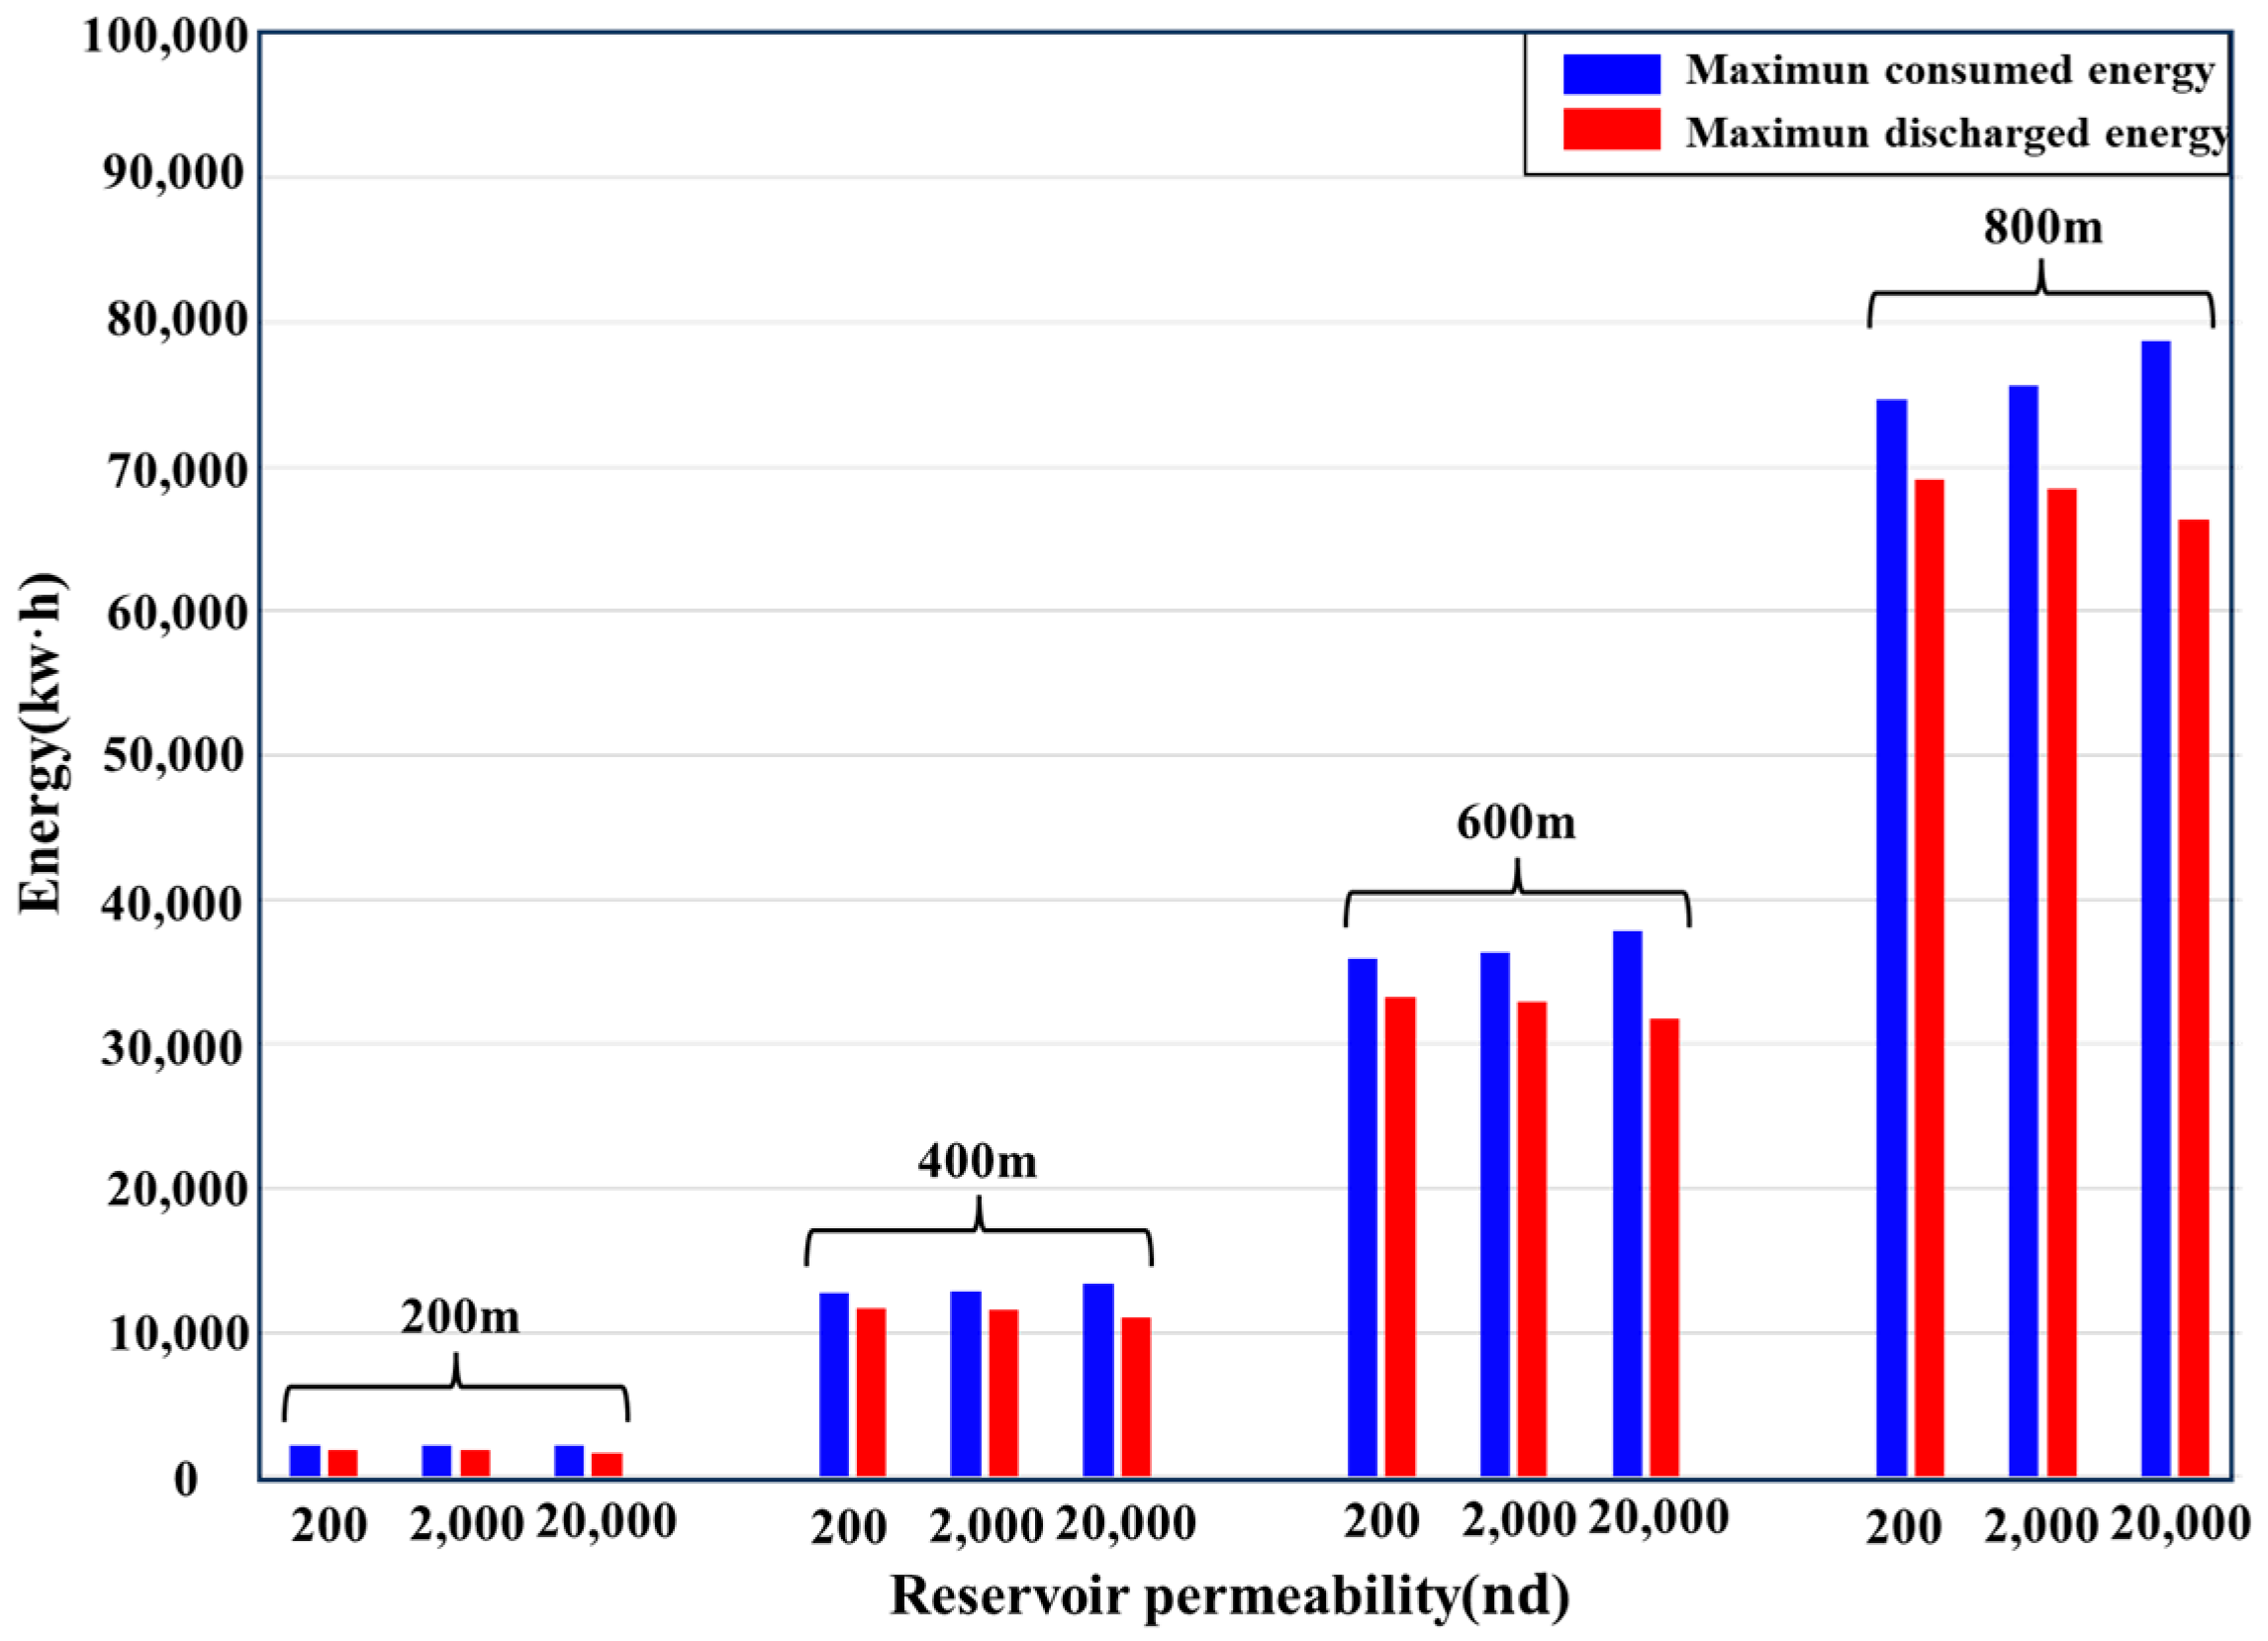
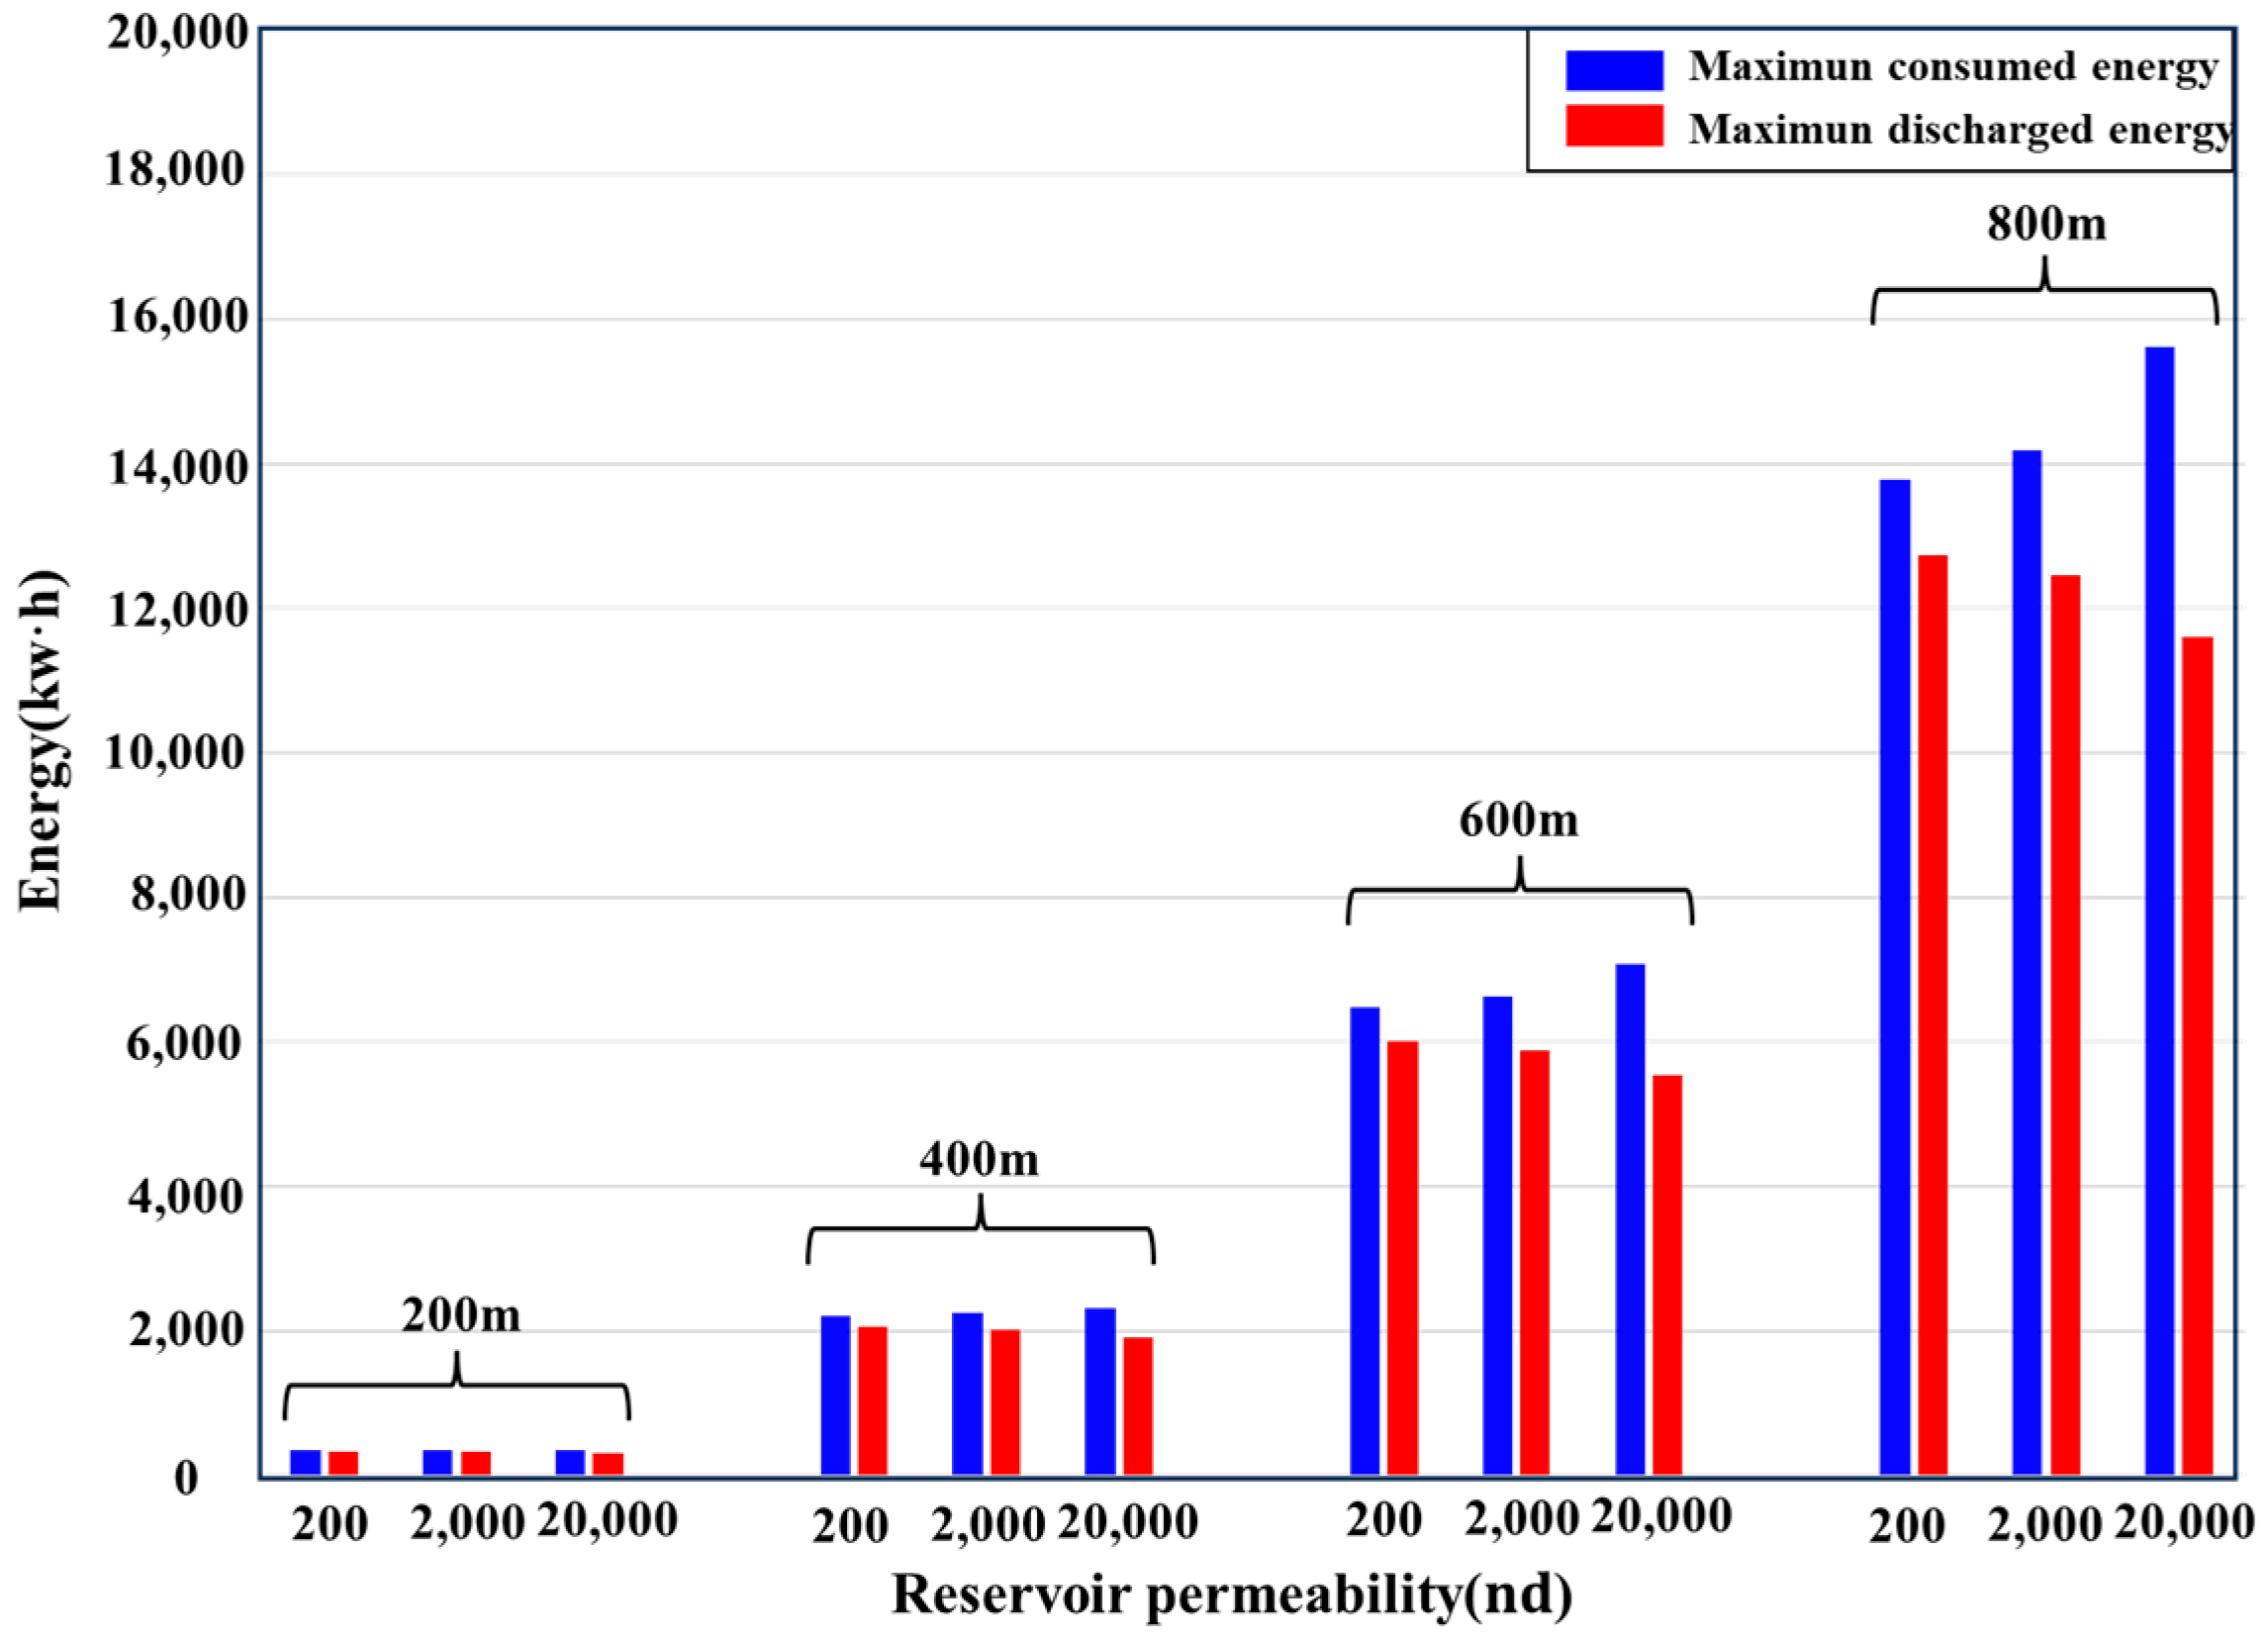
Reservoir permeability is a key factor affecting energy storage efficiency. The permeability values are set at 200 nd, 2000 nd, and 20,000 nd. The fracture toughness is 3 MPa· m 1 2 . The remaining input parameters are shown in Table 1 and Table 2. We chose one of the injection/flow-back rate scenarios to illustrate the effect of fracture toughness on the maximum consumed energy and the maximum discharged energy. Figure 27 and Figure 28 show the change in maximum consumed energy and maximum discharged energy over reservoir permeability with different fracture lengths for penny-shaped fracture and elliptical fracture, respectively. With rising reservoir permeability, energy dissipation from fluid leakage intensifies throughout the storage phase. Regardless of whether the fracture is penny-shaped or elliptical, the maximum energy consumption during the energy storage process rises, while the maximum energy release decreases.
Figure 29 and Figure 30 show the change in efficiency over injection/flow-back rate and fracture length with different reservoir permeability for penny-shaped fracture and elliptical fracture, respectively. Figure 29a–c show the conditions of penny-shaped fractures when the permeability is 20,000 nd, 2000 nd, and 200 nd, respectively. Figure 30a–c show the conditions of elliptical fractures when the permeability is 20,000 nd, 2000 nd, and 200 nd, respectively. In the previous analysis, we found that the effect of different injection/reflow rates on efficiency depends on the balance between fluid leakage and friction along the fracture. Lowering reservoir permeability progressively attenuates the influence of fluid leakage on system efficiency. Consequently, comparison of Figure 30a–c shows that declining permeability correlates with a progressive reduction in the optimal injection/flow-back rate for penny-shaped fractures. Likewise, examination of Figure 30a–c confirms an analogous trend for elliptical geometries. Moreover, reduced reservoir permeability progressively mitigates energy losses attributable to fluid leakage during storage. As a result, aggregate storage efficiency enhances across both penny-shaped and elliptical configurations. Concurrently, at fixed injection/flow-back rates, the efficiency gap among varying fracture dimensions progressively narrows.

5. Discussion

As shown in Figure 31, we can conclude that selecting a reservoir with higher fracture toughness not only expands the scale of energy storage but also improves energy storage efficiency. Reservoir permeability is a crucial parameter for the optimal design of subsurface pumping energy storage. Low-permeability reservoirs are the primary choice to ensure the economic feasibility of subsurface pumping energy storage. However, high-permeability rock formations treated with fluid loss agents can also serve as potential reservoirs, enhancing the economic applicability of subsurface pumping energy storage. Additionally, fluid loss additives can also be employed to further decrease the permeability of existing reservoirs, thereby enhancing energy storage efficiency. For shallow penny-shaped fractures, smaller fracture sizes can maintain slightly higher energy storage efficiency, but the energy storage scale is significantly reduced. Therefore, choosing a larger fracture size to meet greater energy storage needs seems to be the best option in most cases. It is worth discussing that choosing smaller fracture sizes to enhance energy storage efficiency can be a good decision in regions with limited resources or low energy demand. The impact of injection/flow-back rates on energy storage efficiency remains consistent across different fracture-size conditions. During the pumping operation, an injection/flow-back rate that is too small or too large can lead to a decrease in energy storage efficiency. Hence, choosing an injection/flow-back rate within a moderate range, based on actual energy storage requirements, maybe the optimal approach. For deep elliptical fractures, selecting larger fractures and adopting moderate injection/flow-back rates can maintain higher energy storage efficiency. During field application, based on actual energy storage power requirements, the use of fluid loss control agents and resistance-reducing agents can mitigate the adverse effects of excessively small or large injection/flow-back rates on energy storage efficiency, thereby broadening the optimal range of injection/flow-back rates. In the actual construction process of subsurface pumping energy storage, when using depleted shale oil and gas wells for energy storage, especially those employing the ‘‘limited-entry’’ completion method, each perforation cluster can be re-perforated to reduce friction losses, or a casing cutter can be used to remove part of the casing to minimize friction losses. When drilling a new well for energy storage, the target shale layer can be completed using open hole completion, thereby reducing friction losses near the wellbore.
Beyond efficiency optimization, this study reveals a subtle yet important phenomenon: friction within fractures prevents fluid recovery from reaching 100%, thereby limiting the effective storage capacity. This negative effect becomes more pronounced at higher injection rates. While our results indicate that the impact remains within an acceptable range, it nonetheless warrants consideration. For constant injection rates, the residual fluid volume after each cycle stabilizes over the long term (Figure 32). Practical system design sometimes requires a trade-off between output power and storage capacity. For instance, in some cases, moderately lowering the injection rate (thus sacrificing a portion of output power) can directly improve recovery rate. In others, the addition of drag-reducing agents offers an effective approach to simultaneously balance output power, storage capacity, and storage efficiency.
Cost is also a critical consideration in the optimization design of Subsurface Pumped Energy Storage (SPES) systems. Due to the lack of geographical constraints, the subsurface pumped energy storage system can be deployed in areas with well-developed power infrastructure, thereby minimizing installation costs. The primary advantage of subsurface pumped energy storage compared to other energy storage technologies lies mainly in the cost associated with storage capacity. Owing to the relative simplicity in drilling technology, equipment requirements, construction difficulty, and risk management, the investment cost of vertical wells is lower compared to that of horizontal wells. We use vertical well as an example to estimate the investment cost of subsurface pumped energy storage. The equation for calculating the capacity of subsurface pumped energy storage has been provided in previous studies [8]. A subsurface pumped energy storage system with a capacity of 400 MWh can be constructed using eight vertical energy storage wells, each with a capacity of 50 MWh (depth of 800 m and fracture radius of 800 m). Table 3 shows a detailed breakdown of the estimated costs related to energy storage capacity, with approximate expenses referenced from an economic analysis of vertical well fracturing and hydropower systems [39,40,41,42,43,44]. All required labor, materials, and commissioning costs are included in the estimates. It can be seen that the investment cost of this system is only $252/kWh (The costs associated with compressed air energy storage, pumped hydro storage, and Li-ion batteries at the same capacity are $300/kWh, $500/kWh, and $400/kWh, respectively [45]). Additionally, the renovation and reuse of depleted oil and gas wells can further reduce investment costs.
A fully coupled numerical model was employed to compare with the semi-analytical solution model developed in this study. The numerical model was validated against established analytical frameworks for fracture propagation and poroelastic behavior. Its relevance to full-field scenarios was validated via benchmarking against practical field applications [46]. A 200 m elliptical fracture case was selected for demonstration, with the remaining parameters detailed in Table 1. As illustrated in Figure 33, outcomes from the semi-analytical model align closely with those of the numerical simulation.
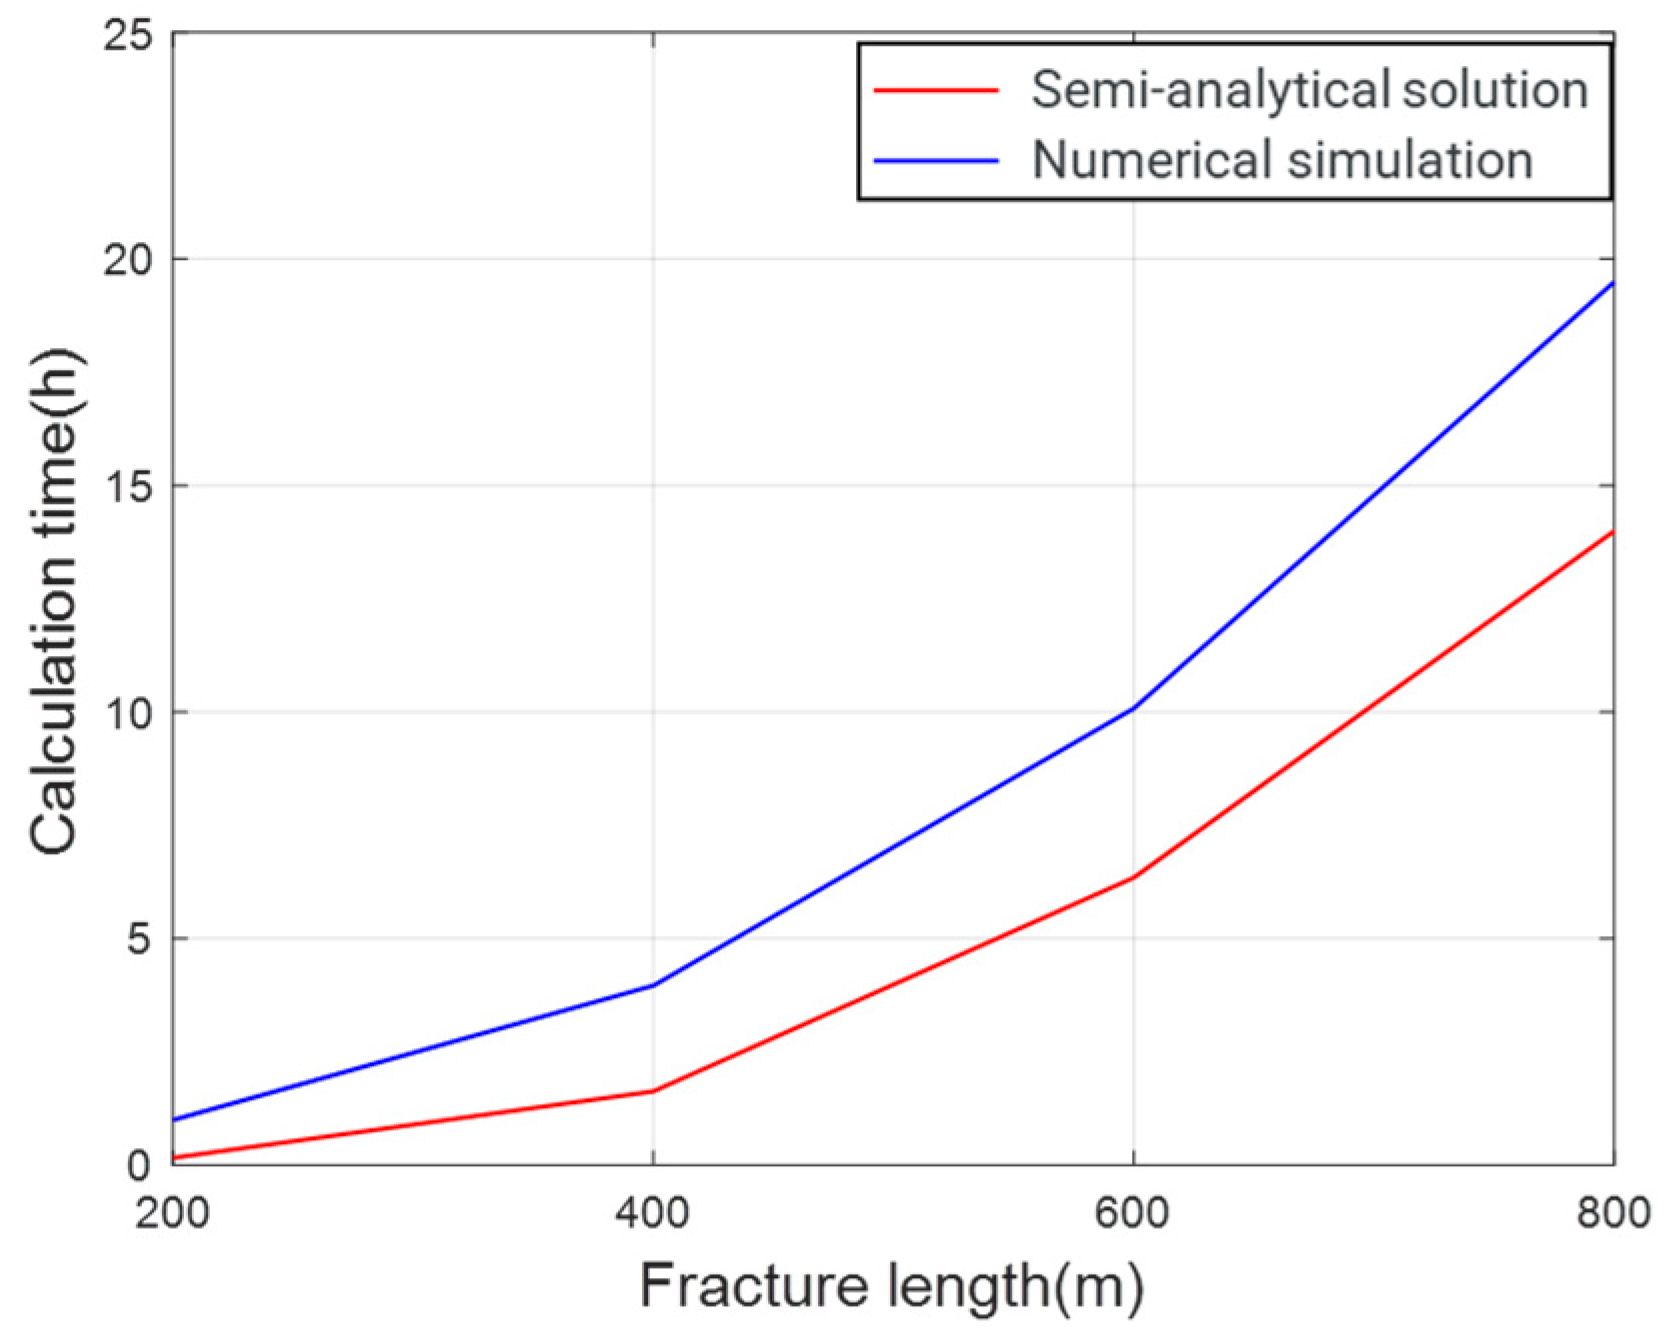
Figure 34 shows a time comparison between the semi-analytical solution and numerical simulation for calculating elliptical cracks of varying lengths. It is evident that the semi-analytical solution model offers faster calculation speed and efficiency compared to the numerical model. Moreover, as the size of the calculated farcture increases, the advantages of the semi-analytical solution model may become more pronounced.

6. Conclusions

In this study, we introduced a new energy storage method which stores energy in subsurface fractures through pumping technology. A new mechanical model was established to investigate the effects of fracture size and injection/flow-back rate on energy storage scale and efficiency under different geological conditions, and corresponding optimization design schemes were proposed. Compared to existing fracturing models, the proposed semi-analytical model exhibits a substantial improvement in computational efficiency. The conclusions drawn from this study are as follows:
  • The effects of changes in injection/flow-back rates and fracture size on energy storage efficiency in reservoirs with different fracture toughness are essentially the same.
  • Choosing reservoirs with higher fracture toughness not only fulfills larger-scale energy storage requirements but also enhances energy storage efficiency.
  • Lowering reservoir permeability will enhance energy storage efficiency. Additionally, it will minimize the efficiency gap between the optimal injection/flow-back rate and various fracture sizes.
  • For shallow circular fractures, smaller fracture sizes exhibit higher energy storage efficiency across all various injection/flow-back conditions.
  • For deep elliptical fractures, the optimal fracture size shows an opposite trend with the increase in injection/flow-back rate.
  • The impact of injection/flow-back rate on energy storage efficiency in fractures of different sizes remains consistent, with efficiency initially increasing and then decreasing as the injection/flowback rate rises.
  • Although the fluid recovery rate within the fractures cannot reach 100% during the energy discharged process and is influenced by the flowback rate, its impact on the scale of energy storage remains within an acceptable range.
  • Employing moderate injection/flow-back rates in larger fractures is the optimal strategy for subsurface pumping energy storage.
In future work, the model can be further enhanced by incorporating methods such as genetic algorithms and discrete element methods. This will enable the model to address the design and planning of subsurface pumping energy storage under conditions involving complex fractures or granular materials (e.g., proppant migration of depleted oil and gas wells, addition of filter loss control agents, etc.). Additionally, the model can be directly utilized to solve problems related to the design of target parameters, including reservoir geological conditions and depth, fracture size, pumping rate, and the interpretation of test data for subsequent field tests. The field test data, in turn, can also provide valuable references for the verification and optimization of the model.

Author Contributions

Conceptualization, Z.H. and H.W.; Methodology, Z.H. and H.W.; Software, Z.H.; Validation, Z.H.; Formal analysis, Z.H. and H.W.; Investigation, Z.H.; Resources, Z.H.; Data curation, Z.H.; Writing—original draft, Z.H.; Writing—review & editing, H.W. All authors have read and agreed to the published version of the manuscript.

Funding

This research received no external funding.

Data Availability Statement

The original contributions presented in this study are included in the article. Further inquiries can be directed to the corresponding author.

Conflicts of Interest

The authors declare no conflict of interest.

References

  1. Mclarnon, F.R.; Cairns, E.J. Energy storage. Ann. Rev. Energy 1989, 14, 241–271. [Google Scholar] [CrossRef]
  2. Baker, J.; Collinson, A. Electrical energy storage at the turn of the Millennium. Power Eng. J. 1999, 6, 107–112. [Google Scholar] [CrossRef]
  3. Dti Report. In Status of Electrical Energy Storage Systems; DG/DTI/00050/00/00. URN NUMBER 04/1878; UK Department of Trade and Industry: London, UK, 2004; pp. 1–24. Available online: https://www.osti.gov/etdeweb/biblio/20562504#:~:text=This%20report%20presents%20an%20overview%20of%20the%20status,the%20interest%20of%20the%20UK%20electricity%20supply%20industry (accessed on 1 August 2025).
  4. Australian Greenhouse Office. Advanced Electricity Storage Technologies Programme; Australian Greenhouse Office: Canberra, Australia, 2005; pp. 1–35. ISBN 1-921120-37-1. [Google Scholar]
  5. Walawalkar, R.; Apt, J.; Mancini, R. Economics of electric energy storage for energy arbitrage and regulation. Energy Policy 2007, 5, 2558–2568. [Google Scholar] [CrossRef]
  6. Rahman, M.; Oni, A.O.; Gemechu, E.; Kumar, A. Assessment of energy storage technologies: A review. Energy Convers. Manag. 2020, 223, 113295. [Google Scholar] [CrossRef]
  7. Chen, H.; Cong, T.N.; Yang, W.; Tan, C.; Li, Y.; Ding, Y. Progress in electrical energy storage system: A critical review. Prog. Nat. Sci. 2009, 19, 291–312. [Google Scholar] [CrossRef]
  8. Hu, Z.; Wang, H. Feasibility study of energy storage using hydraulic fracturing in shale formations. Appl. Energy 2024, 354, 122251. [Google Scholar] [CrossRef]
  9. Hu, Z.W.; Wang, H.Y. Feasibility study of geothermal assisted energy storage using hydraulic fracturing. Geoenergy Sci. Eng. 2024, 242, 213220. [Google Scholar] [CrossRef]
  10. Hu, Z.W.; Wang, H.Y.; Zheng, S. Numerical modelling of energy storage using hydraulic fracturing in shale formations. Geoenergy Sci. Eng. 2025, 244, 213424. [Google Scholar] [CrossRef]
  11. da Rosa, A.V.; Ordóñez, J.C. Fundamentals of Renewable Energy Processes; Elsevier: Amsterdam, The Netherlands, 2021. [Google Scholar]
  12. Herzog, A.V.; Lipman, T.E.; Kammen, D.M. Renewable energy sources. Encycl. Life Support Syst. (EOLSS) Fore-Run. Vol.-Perspect. Overv. Life Support Syst. Sustain. Dev. 2001, 76, 8–62. [Google Scholar]
  13. Moriarty, P.; Honnery, D. Can renewable energy power the future? Energy Policy 2016, 93, 3–7. [Google Scholar] [CrossRef]
  14. Ellabban, O.; Abu-Rub, H.; Blaabjerg, F. Renewable energy resources: Current status, future prospects and their enabling tech-nology. Renew. Sustain. Energy Rev. 2014, 39, 748–764. [Google Scholar] [CrossRef]
  15. Choudhury, S. Flywheel energy storage systems: A critical review on technologies, applications, and future prospects. Int. Trans. Electr. Energy Syst. 2021, 31, e13024. [Google Scholar] [CrossRef]
  16. Rehman, S.; Al-Hadhrami, L.M.; Alam, M.M. Pumped hydro energy storage system: A technological review. Renew. Sustain. Energy Rev. 2015, 44, 586–598. [Google Scholar] [CrossRef]
  17. Luo, X.; Wang, J.; Dooner, M.; Clarke, J.; Krupke, C. Overview of Current Development in Compressed Air Energy Storage Technology. Energy Procedia 2014, 62, 603–611. [Google Scholar] [CrossRef]
  18. Li, H.; Ma, H.; Liu, J.; Zhu, S.; Zhao, K.; Zheng, Z.; Zeng, Z.; Yang, C. Large-scale CAES in bedded rock salt: A case study in Jiangsu Province, China. Energy 2023, 281, 128271. [Google Scholar] [CrossRef]
  19. Olabi, A.G.; Wilberforce, T.; Abdelkareem, M.A.; Ramadan, M. Critical Review of Flywheel Energy Storage System. Energies 2021, 14, 2159. [Google Scholar] [CrossRef]
  20. Koohi-Fayegh, S.; Rosen, M. A review of energy storage types, applications and recent developments. J. Energy Storage 2020, 27, 101047. [Google Scholar] [CrossRef]
  21. Blakers, A.; Stocks, M.; Lu, B.; Cheng, C. A review of pumped hydro energy storage. Prog. Energy 2021, 3, 022003. [Google Scholar] [CrossRef]
  22. Li, H.; Ma, H.; Yang, C.; Zhao, K.; Hu, Z.; Daemen, J. Acoustic emission characteristics of rock salt under multi-stage cyclic loading. Int. J. Fatigue 2023, 176, 107911. [Google Scholar] [CrossRef]
  23. Akpoti, K.; Obahoundje, S.; Mortey, E.M.; Diawuo, F.A.; Antwi, E.O.; Gyamfi, S.; Domfeh, M.K.; Kabo-Bah, A.T. Technological advances in prospecting sites for pumped hydro energy storage. In Pumped Hydro Energy Storage for Hybrid Systems; Academic Press: New York, NY, USA, 2023; pp. 105–118. [Google Scholar]
  24. Hannan, M.; Wali, S.; Ker, P.; Rahman, M.A.; Mansor, M.; Ramachandaramurthy, V.; Muttaqi, K.; Mahlia, T.; Dong, Z. Battery energy-storage system: A review of technologies optimization objectives constraints approaches and outstanding issues. J. Energy Storage 2021, 42, 103023. [Google Scholar] [CrossRef]
  25. Bunger, A.P.; Lau, H.; Wright, S.; Schmidt, H. Mechanical model for geomechanical pumped storage in horizontal fluid-filled lenses. Int. J. Numer. Anal. Methods Géoméch. 2023, 47, 1349–1372. [Google Scholar] [CrossRef]
  26. Wang, H.Y.; Yi, S.T.; Sharma, M.M. A computationally efficient approach to modeling contact problems and fracture closure using superposition method. Theor. Appl. Fract. Mech. 2018, 93, 276–287. [Google Scholar] [CrossRef]
  27. Guo, Y.; Zhang, M.; Yang, H.; Wang, D.; Ramos, M.A.; Hu, T.S.; Xu, Q. Friction Challenge in Hydraulic Fracturing. Lubricants 2022, 10, 14. [Google Scholar] [CrossRef]
  28. Daneshy, A.A. Experimental Investigation of Hydraulic Fracturing Through Perforations. J. Pet. Technol. 1973, 25, 1201–1206. [Google Scholar] [CrossRef]
  29. Gottschling, J.C. Openhole vs. Cased-Hole Hydraulic Fracturing. In Proceedings of the SPE Annual Technical Conference and Exhibition, Dallas, TX, USA, 9–12 October 2005; p. SPE-97172-MS. [Google Scholar]
  30. Hanson, M.E.; Anderson, G.D.; Shaffer, R.J.; Thorson, L.D. Some Effects of Stress, Friction, and Fluid Flow on Hydraulic Fracturing. Soc. Pet. Eng. J. 1982, 22, 321–332. [Google Scholar] [CrossRef]
  31. Hanson, M.E.; Shaffer, R.J.; Anderson, G.D. Effects of Various Parameters on Hydraulic Fracturing Geometry. Soc. Pet. Eng. J. 1981, 21, 435–443. [Google Scholar] [CrossRef]
  32. Barree, R.D.; Gilbert, J.V.; Conway, M.W. An Effective Model for Pipe Friction Estimation in Hydraulic Fracturing Treatments. In Proceedings of the SPE Rocky Mountain Petroleum Technology Conference/Low-Permeability Reservoirs Symposium, Oklahoma City, OK, USA, 9–10 April 2009; p. SPE-122917-MS. [Google Scholar]
  33. Ba Geri, M.; Imqam, A.; Flori, R. A critical review of using high viscosity friction reducers as fracturing fluids for hydraulic fracturing applications. In Proceedings of the SPE Oklahoma City Oil and Gas Symposium/Production and Operations Symposium, Oklahoma City, OK, USA, 9–10 April 2019; p. D021S004R001. [Google Scholar]
  34. Smith, C.G.; Khiat, S.; Albadraoui, D. An Effective Technique to Reduce Bottomhole Friction Pressure During Hydraulic Fracturing Treatments. In Proceedings of the SPE International Symposium and Exhibition on Formation Damage Control, Lafayette, LA, USA, 13–15 February 2008. [Google Scholar]
  35. Nizamidin, N.; Kim, A.; Belcourt, K.; Angeles, M.; Kim, D.H.; Matovic, G.; Lege, E. New casing friction model for slickwater: Field data validation, application, and optimization for hydraulic fracturing. In Proceedings of the SPE Hydraulic Fracturing Technology Conference and Exhibition, The Woodlands, TX, USA, 1–3 February 2022; p. D021S003R005. [Google Scholar]
  36. Nguyen, H.T.; Lee, J.H.; Elraies, K.A. A review of PKN-type modeling of hydraulic fractures. J. Pet. Sci. Eng. 2020, 195, 107607. [Google Scholar] [CrossRef]
  37. Kovalyshen, Y.; Detournay, E. A Reexamination of the Classical PKN Model of Hydraulic Fracture. Transp. Porous Media 2010, 81, 317–339. [Google Scholar] [CrossRef]
  38. Fjær, E.; Holt, R.M.; Horsrud, P.; Raaen, A.M.; Risnes, R. Mechanics of hydraulic fracturing. Dev. Pet. Sci. 2008, 53, 369–390. [Google Scholar]
  39. Lukawski, M.Z.; Anderson, B.J.; Augustine, C.; Capuano, L.E.; Beckers, K.F.; Livesay, B.; Tester, J.W. Cost analysis of oil, gas, and geothermal well drilling. J. Pet. Sci. Eng. 2014, 118, 1–14. [Google Scholar] [CrossRef]
  40. Xu, S.; Guo, J.; Feng, Q.; Ren, G.; Li, Y.; Wang, S. Optimization of hydraulic fracturing treatment parameters to maximize economic benefit in tight oil. Fuel 2022, 329, 125329. [Google Scholar] [CrossRef]
  41. Marongiu-Porcu, M.; Economides, M.J.; Holditch, S.A. Economic and physical optimization of hydraulic fracturing. J. Nat. Gas Sci. Eng. 2013, 14, 91–107. [Google Scholar] [CrossRef]
  42. Mishra, S.; Singal, S.; Khatod, D. Optimal installation of small hydropower plant—A review. Renew. Sustain. Energy Rev. 2011, 15, 3862–3869. [Google Scholar] [CrossRef]
  43. Mishra, S.; Singal, S.K.; Khatod, D.K. Costing of a Small Hydropower Projects. Int. J. Eng. Technol. 2012, 4, 239–242. [Google Scholar] [CrossRef]
  44. Aggidis, G.; Luchinskaya, E.; Rothschild, R.; Howard, D. The costs of small-scale hydro power production: Impact on the development of existing potential. Renew. Energy 2010, 35, 2632–2638. [Google Scholar] [CrossRef]
  45. Viswanathan, V.; Mongird, K.; Franks, R.; Li, X.; Sprenkle, V.; Pacific Northwest National Laboratory. 2022 grid energy storage technology cost and performance assessment. Energy 2022, 2022, 1–151. [Google Scholar]
  46. Zheng, S. Development of a Fully Integrated Equation of State Compositional Hydraulic Fracturing and Reservoir Simulator. Ph.D. Thesis, University of Texas at Austin, Austin, TX, USA, 2021. [Google Scholar]
Figure 1. Illustration of subsurface pumping energy storage.
Energies 18 05252 g001
Figure 2. Illustration of the coupling between net pressure and width in shallow reservoir.
Energies 18 05252 g002
Figure 3. Illustration of the coupling between net pressure and width in deep reservoir.
Energies 18 05252 g003
Figure 4. Wellhead surface pressure and fracture pressure at the perforation versus time for penny-shaped fracture.
Energies 18 05252 g004
Figure 5. (a) The distribution of net pressure within the penny-shaped fracture at the end of injection; (b) the distribution of net pressure within the penny-shaped fracture at the end of flow-back.
Energies 18 05252 g005
Figure 6. (a) The distribution of fracture width at the end of injection and flow-back for penny-shaped fracture; (b) the change in fluid volume within the penny-shaped fracture over time.
Energies 18 05252 g006
Figure 7. (a) The maximum consumed and discharged energy for penny-shaped; (b) the changes in the efficiency of the penny-shaped fractures with the number of cycles.
Energies 18 05252 g007
Figure 8. The changes in wellhead surface pressure and fracture pressure at the perforation over time for elliptical fracture.
Energies 18 05252 g008
Figure 9. (a) The distribution of net pressure within the elliptical fracture at the end of injection; (b) the distribution of net pressure within the elliptical fracture at the end of flow-back.
Energies 18 05252 g009
Figure 10. (a) The distribution of fracture width at the end of injection and flow-back for elliptical fracture; (b) The change in fluid volume within the elliptical fracture over time.
Energies 18 05252 g010
Figure 11. (a) The maximum consumed and discharged energy for elliptical fracture; (b) The changes in efficiency of the elliptical fractures with the number of cycles.
Energies 18 05252 g011
Figure 12. The change in wellbore surface pressure over time with different fracture lengths (a) and injection/Flow-back rate (b).
Energies 18 05252 g012
Figure 13. (a) The distribution of fracture width at the end of flow-back with different injection/flow-back rate for penny-shaped fracture; (b) The distribution of fracture width at the end of flow-back with different fracture length for penny-shaped fracture.
Energies 18 05252 g013
Figure 14. (a) The change in unrecovered fluid volume within fracture and fracture volume utilization over injection/flow-back rate for penny-shaped fracture; (b) The change in unrecovered fluid volume within fracture and fracture volume utilization over fracture length for penny-shaped fracture.
Energies 18 05252 g014
Figure 15. The change in maximum consumed energy and maximum discharged energy over injection/flow-back rate with different fracture length for penny-shaped fracture.
Energies 18 05252 g015
Figure 16. Efficiency versus injection/flow-back rate with different fracture length for penny-shaped fracture.
Energies 18 05252 g016
Figure 17. (a) The change in wellbore surface pressure over time with different fracture lengths for elliptical fracture (b) The change in wellbore surface pressure over time with different injection/Flow-back rate for elliptical fracture.
Energies 18 05252 g017
Figure 18. (a) The distribution of fracture width at the end of flow-back with different injection/flow-back rate for elliptical fracture (b) The distribution of fracture width at the end of flow-back with different fracture length for elliptical fracture.
Energies 18 05252 g018
Figure 19. (a) The change in unrecovered fluid volume within fracture and fracture volume utilization over injection/flow-back rate for elliptical fracture (b) The change in unrecovered fluid volume within fracture and fracture volume utilization over fracture length for elliptical fracture.
Energies 18 05252 g019
Figure 20. The change in maximum consumed energy and maximum discharged energy over injection/flow-back rate with different fracture length for elliptical fracture.
Energies 18 05252 g020
Figure 21. The change in efficiency over injection/flow-back rate with different fracture length for elliptical fracture.
Energies 18 05252 g021
Figure 22. The change in maximum consumed energy and maximum discharged energy over fracture toughness with different fracture lengths for penny-shaped fracture (Injection/Flow-back rate = 0.06 m3/s).
Energies 18 05252 g022
Figure 23. The change in maximum consumed energy and maximum discharged energy over fracture toughness with different fracture lengths for elliptical fracture (Injection/Flow-back rate = 0.06 m3/s).
Energies 18 05252 g023
Figure 24. The change in efficiency over injection/flow-back rate and fracture length with different fracture toughness for penny-shaped fracture ((a) Fracture toughness = 3 MPa· m 1 2 ; (b) Fracture toughness = 6 MPa· m 1 2 ; (c) Fracture toughness = 9 MPa· m 1 2 ).
Energies 18 05252 g024
Figure 25. The change in efficiency over injection/flow-back rate and fracture length with different fracture toughness for elliptical fracture ((a) Fracture toughness = 3 MPa· m 1 2 ; (b) Fracture toughness = 6 MPa· m 1 2 ; (c) Fracture toughness = 9 MPa· m 1 2 ).
Energies 18 05252 g025
Figure 26. The schematic diagram of the maximum storage volume in a fracture changing with fracture toughness.
Energies 18 05252 g026
Figure 27. The change in maximum consumed energy and maximum discharged energy over reservoir permeability with different fracture lengths for penny-shaped fracture (Injection/Flow-back rate = 0.06 m3/s).
Energies 18 05252 g027
Figure 28. The change in maximum consumed energy and maximum discharged energy over reservoir permeability with different fracture lengths for elliptical fracture (Injection/Flow-back rate = 0.06 m3/s).
Energies 18 05252 g028
Figure 29. The change in efficiency over injection/flow-back rate and fracture length with different reservoir permeability for penny-shaped fracture ((a) permeability = 20,000 nd; (b) permeability = 2000 nd; (c) permeability = 200 nd).
Energies 18 05252 g029
Figure 30. The change in efficiency over injection/flow-back rate and fracture length with different reservoir permeability for elliptical fracture ((a) permeability = 20,000 nd; (b) permeability = 2000 nd; (c) permeability = 200 nd).
Energies 18 05252 g030
Figure 31. Schematic diagram of subsurface pumping energy storage parameter design optimization.
Energies 18 05252 g031aEnergies 18 05252 g031b
Figure 32. The change in fluid volume within the fracture over time under long-term conditions.
Energies 18 05252 g032
Figure 33. Comparison between semi-analytical solution and numerical simulation results: (a) Wellhead surface pressure (b) Total consumed/discharged energy.
Energies 18 05252 g033
Figure 34. Time comparison between semi-analytical solution and numerical simulation for elliptical fractures of varying lengths.
Energies 18 05252 g034
Table 1. Input parameters for base cases.
ParametersValue Range
Number of cycles5
Time step (s)60
Shut-in time per cycle (h)1
Injection/flow-back rate (m3/s)0.02
Minimum principal stress gradient (MPa/m)0.0242
Pore stress gradient (MPa/m)0.0113
Penny-shaped fracture vertical depth (m)500
Elliptical fracture vertical depth (m)2000
Elliptical fracture measure depth (m)2500
Poisson’s ratio0.33
Young’s modulus (GPa)15
Fracture toughness (MPa·m1/2)6
Penny-shaped fracture radius (m)200
Elliptical fracture height (m)80
Elliptical fracture length (m)400
Reservoir permeability (md)0.002
Total compressibility (MPa−1)0.00011
Fluid viscosity (cp)1
Fluid density (kg/m3)1023
Initial porosity0.1
Initial contact time(s)6000
Wellbore roughness (m)1.6 × 10⁻⁶
Reynolds number conversion value4000
parametersValue Range
Number of cycles5
Table 2. The specific input parameters for the fracture size and injection/flow-back rate of penny-shaped and elliptical fractures.
Fracture Radius (m)Injection/Flow-Back Rate (m3/s)
2000.005, 0.02, 0.06, 0.1, 0.14
4000.005, 0.02, 0.06, 0.1, 0.14
6000.005, 0.02, 0.06, 0.1, 0.14
8000.005, 0.02, 0.06, 0.1, 0.14
Table 3. The estimated CAPEX for subsurface pumped energy storage vertical wells of 400 MWh.
CAPEX ($USD)
Geological/Geophysical Surveys$1,200,000
Drilling and Completion$6,000,000
Fracture Creation$40,000,000
Fracturing Monitoring $1,200,000
Tank $8,000,000
Water Injection Pump$6,000,000
Pelton Turbine$16,000,000
Power Conversion System$8,000,000
Transformers and Electrical Equipment $4,000,000
Control System$2,400,000
Construction and Commissioning$8,000,000
TOTAL CAPEX$100,800,000
CAPEX/kWh$252/kWh
Disclaimer/Publisher’s Note: The statements, opinions and data contained in all publications are solely those of the individual author(s) and contributor(s) and not of MDPI and/or the editor(s). MDPI and/or the editor(s) disclaim responsibility for any injury to people or property resulting from any ideas, methods, instructions or products referred to in the content.