Article

Detection and Evaluation of Shield Damage Defects in Power Cables Using an Improved Dual-Frequency Time–Frequency Domain Reflectometry

by
Kun Zhao
1,2,
Stefano Grivet-Talocia
2,
Paolo Manfredi
2,
Yuan Yan
1,2 and
Hongjie Li
1,*
1
The State Key Laboratory of Insulation and Power Equipment, School of the Electrical Engineering, Xi’an Jiaotong University, Xi’an 710049, China
2
Department of Electronics and Telecommunications, Politecnico di Torino, 10129 Turin, Italy
*
Author to whom correspondence should be addressed.
Energies 2025, 18(19), 5214; https://doi.org/10.3390/en18195214
Submission received: 30 August 2025 / Revised: 27 September 2025 / Accepted: 29 September 2025 / Published: 30 September 2025

Abstract

Cable shields may develop holes when the sheath is damaged. Time–frequency domain reflectometry (TFDR) is an effective method for detecting cable defects, but it cannot directly evaluate hole sizes. To address this issue, we analyze the impact of shield hole sizes on TFDR signals. Building on this analysis, we propose an improved dual-frequency TFDR method to measure shield holes and evaluate their sizes. This method directly measures the characteristic impedances and damage ratios using dual-frequency TFDR, followed by a two-step evaluation process to determine the hole center angles and lengths based on these measurements. Simulations and experiments validate the proposed method. In laboratory-scale experiments using a scaled cable model, and considering measurement noise, the maximum relative errors for shield hole length and center angle are 11% and 5%, respectively.

Graphical Abstract

1. Introduction

Cable shield damage is a common yet severe defect in power cables. Many factors can cause holes on cable shield, such as shield corrosion, mechanical abrasion and so on [1]. Once holes appear on the cable shield, the cable heats up and the electric field distribution distorts, leading to gradual insulation damage [2]. Detecting shield damage, evaluating the size of shield holes, and providing detailed defect information are essential tasks in cable maintenance. Therefore, developing a method for the detection and size assessment of these defects is essential for effective cable maintenance.
There are many methods, such as damped AC, partial discharge detection, and reflectometry, that can be used to detect cable defects. Each method has its own advantages and suitable application scenarios. Reflectometry is an effective method for detecting and localizing shield defects [3], operating by analyzing signals reflected from defects. It is categorized into two main types based on the signals injected: time domain [4] and frequency domain methods [5,6]. Time domain reflectometry (TDR) is simple and provides high localization accuracy, but it has low sensitivity, which limits its suitability for evaluating sizes of cable defects [7]. Conversely, frequency domain reflectometry is highly sensitive but suffers from limited localization accuracy [8]. To balance localization accuracy and sensitivity, the time–frequency domain reflectometry (TFDR) method is proposed [9,10]. Early TFDR techniques were mainly used to detect and locate defects. Owing to their high sensitivity and strong anti-interference capability, many researchers have focused on detection under noisy conditions and on the identification of weak defects. References [11,12] have implemented the likelihood ratio test and a generalized time–frequency cross-correlation (TFCC) method, respectively, both of which effectively improve the sensitivity of TFDR and enhance the ability of weak defect detection. Additionally, reference [13] explored the impact of interference on localization results and introduced an instantaneous filtering technique to improve the performance of the TFDR on weak defect detection and location. With the increasing demand for defect evaluation, researchers have gradually attempted to use TFDR to estimate defect parameters. Reference [14] employed the finite element method (FEM) to analyze the influence of shield hole defects on cable characteristic impedance. Reference [15] investigated the relationship between hole size and TFCC magnitude. Moreover, reference [16] applied a faster region-based convolutional neural network (R-CNN) to classify the severity of faults and achieve a rough evaluation of defects. After numerous iterations and developments, the TFDR method can achieve precise positioning, rough assessment of defect severity, and simple classification of defects. However, it still struggles to accurately evaluate the sizes of shield hole defects. Reference [17] developed a new testing strategy and employed a spectrum ratio method to estimate the length of cable corrosion in TFDR measurement. However, this work can only estimate corrosion length and cannot handle complex shield hole defects or multiple-defect scenarios.
To overcome these limitations and further advance the research, we propose an improved dual-frequency TFDR method for the size evaluation of shield hole defects. We first model cable shield hole defects using FEM and analyze their propagation characteristics. Based on this, we derive formulas for the reflection coefficient and reflected signals associated with these defects in cables. Building on these results, we introduce a two-step evaluation process and propose an improved dual-frequency TFDR method to detect and evaluate hole sizes, including both lengths and center angles. The measurement involves two sequential excitations, with the center frequency of the second signal being twice that of the first, enabling accurate extraction of characteristic impedances and damage ratios. These measured parameters are then used in the two-step evaluation process to determine the lengths and center angles of the shield holes.
The remaining sections of this paper are organized as follows: Section 2 introduces the basic theory of TFDR and the proposed method. Section 3 presents a simulation along with its validation results. Then, an experiment is conducted, and the results are discussed in Section 4. Finally, Section 5 provides the conclusion of this paper.

2. Methodology

2.1. Basic Theory of TFDR and Modeling of Cable Shield Hole Defects

The TFDR method employs a linear frequency-modulated signal for injection to detect and locate defects along cables. The expression for the injected signals, denoted as s ( t ) , is presented as follows [9]:
s t = A · e α t t 0 2 2 + j β t t 0 2 2 + j ω 0 t t 0 ,
where A controls the amplitude of s ( t ) , α determines the duration of s ( t ) , β defines the slope of the instantaneous frequency of s ( t ) , and t 0 and ω 0 are the center time and center angular frequency of s ( t ) , respectively. Using the time–frequency characteristics of the injected signal, the defect is localized by the time–frequency cross-correlation (TFCC) method [11].
A typical single-core power cable consists of a circular core conductor, multiple insulating layers, and an outer shield [18]. When the cable undergoes corrosion or abrasion, holes may form in the shield. Although shield holes are typically irregular, for analytical simplicity, they are often modeled as rectangular apertures [14,15], as shown in Figure 1.
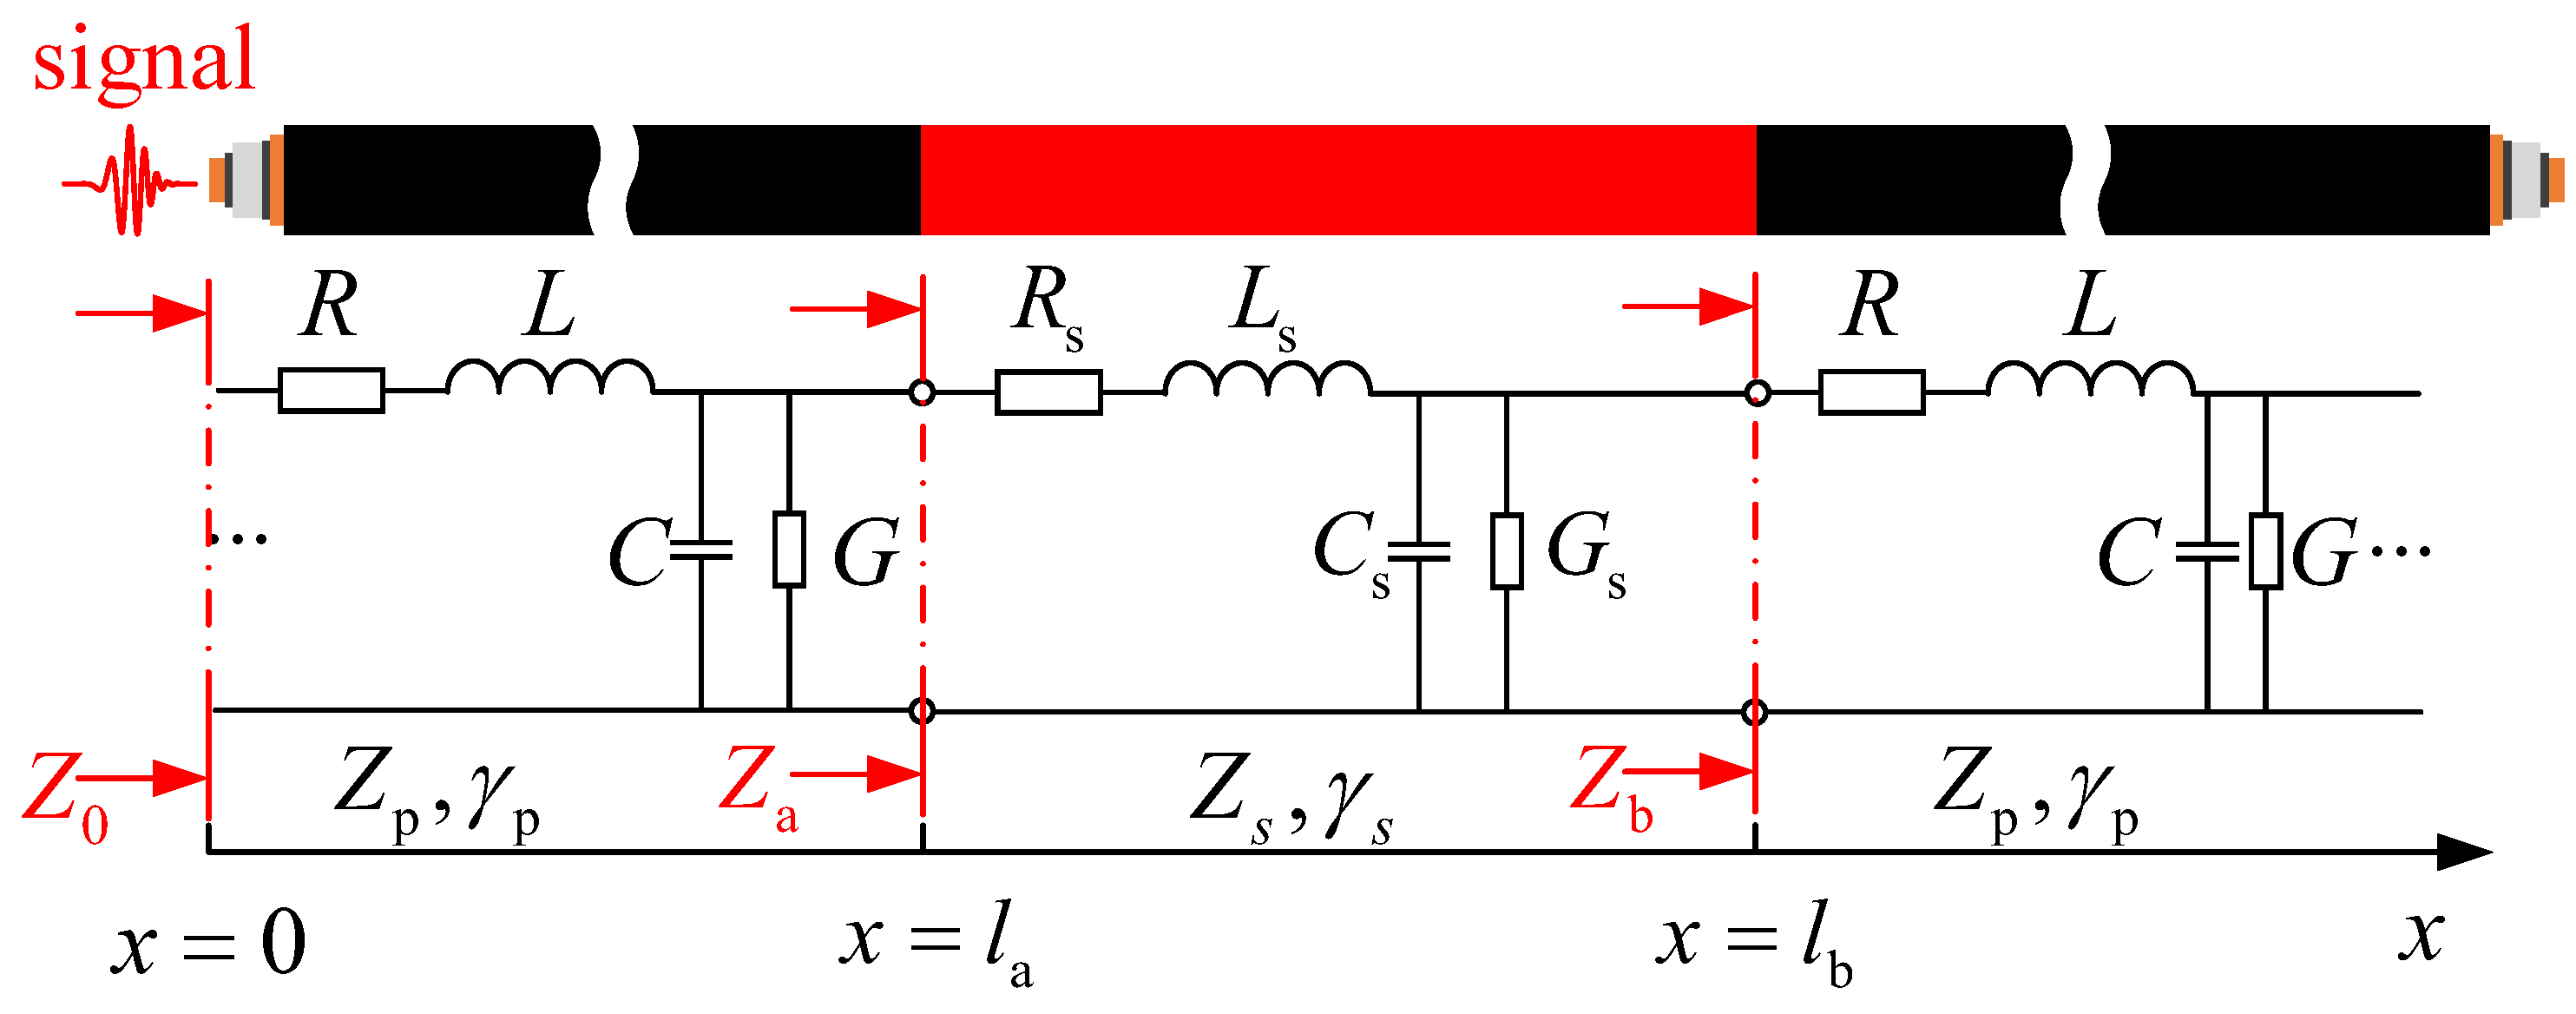
Shield holes compromise the integrity of the cable structure; therefore, FEM is employed to model and calculate the distributed parameters of cables with such defects. The distributed-parameter model of a long cable with shield holes is shown in Figure 2.
Z 0 , Z a , and  Z b denote the input impedances at x = 0 , x = l a , and  x = l b , respectively. Z p and γ p denote the characteristic impedance and propagation constant of a healthy cable, while Z s and γ s correspond to those of a cable with shield hole defects. γ p = α p + j β p and γ s = α s + j β s , where α p and α s are the attenuation constants, and  β p and β s are the phase constants. Based on transmission line theory and assuming an infinitely long cable, the reflection coefficient at x = l a can be derived as
Γ a = Γ b + Γ b e 2 γ s l c 1 Γ b 2 e 2 γ s l c
where l c denotes the defect length, and  Γ b is the reflection coefficient at x = l b , defined as
Γ b = Z p Z s Z p + Z s
The shield hole defect usually remains conductive, and the characteristic impedance Z s does not differ significantly from that of an intact cable. Therefore, Γ b satisfies the condition Γ b 2 1 . In addition, since | e 2 γ s l c | < 1 , it follows that Γ b 2 e 2 γ s l c 0 . Considering that the attenuation constant of the defect is small and the defect length under study ranges from tens of centimeters to several meters, the attenuation effect can be neglected. Thus, Γ a can be approximated as
Γ a Γ b + Γ b e 2 j β s l c 2 Γ b sin β s l c e j π 2 β s l c .

2.2. Evaluation of Shield Hole Sizes Using Improved Dual-Frequency TFDR

To evaluate shield hole dimensions, the reflected signal is derived. In the configuration of Figure 2, a defect is located at x = l a . The input signal s ( t ) is applied at x = 0 , and its spectrum S ( ω ) is expressed as
S ( ω ) = A 2 π α j β e ω ω 0 2 2 α j β j ω t 0 .
Assuming a linear frequency dependence for the phase constants ( β s = K s ω , β p = K p ω ) [9], and applying (4), the spectrum of the reflected signal R ( ω ) is derived as
R ω = A 2 π α j β e ω ω 0 2 2 α j β j ω t 0 j ω 2 K p l a + K s l c × e 2 α p l a · 2 Γ b sin K s l c ω e j π 2 .
To evaluate the size of the shield hole defects, the spectrum ratio P sr ω between R ω and S ω is calculated [19]. The magnitude of P sr ω is derived as
P sr ω = R ω S ω = 2 Γ b sin K s l c ω e 2 α p l a .
In (7), the term Γ b sin K s l c ω is determined solely by the intrinsic parameters of the defect, namely Γ b , K s , and  l c . Therefore, this term is defined as the damage ratio
M r = Γ b sin K s l c ω .
Analyzing (8) further, the terms involving Γ b and sin ( K s l c ω ) can be calculated using the dual-frequency TFDR method. Assume that M r 1 represents the damage ratio under a single-frequency condition, whereas M f 2 corresponds to that under dual-frequency excitation. Accordingly, from the trigonometric relations, Γ b can be estimated as follows:
Γ b = M r 1 1 cos K s l c ω 2 ,
cos K s l c ω = Γ b sin K s l c 2 ω 2 Γ b sin K s l c ω = M r 2 2 M r 1 .
There are two methods for obtaining M r 1 and M r 2 in practical measurements. The first is the time-scaling method, which only requires a single measurement with a broadband signal that spans both the frequency of interest and its double. The second is the frequency-shifting method, which requires two sequential measurements with center frequencies of ω 0 and 2 ω 0 . Due to the long duration of the injected signal in TFDR, the time-scaling method results in a long blind zone. Therefore, the frequency-shifting method is adopted. During the measurement, M r can be calculated as follows:
M r = P sr 2 e 2 α p l a ,
where the attenuation constant α p can be determined by using TFDR on a healthy cable of the same type with an open-circuit end. The expression for α p is given by
α p = 1 2 l x · 1 2 ln F r t F s t ,
where l x is the tested healthy cable length, and  F ( x ) indicates the Fourier transform.
Based on (9) and (3), the characteristic impedance Z s of the cable with shield hole defects can be calculated as
Z s = Z p 1 + Γ b 1 Γ b .
In practical measurements, reflections may originate from multiple sources rather than solely from shield holes. The parameter Z s enables a preliminary identification of the defect type: shield hole defects exhibit a larger Z s than healthy cables, whereas moisture defects exhibit a smaller Z s . If the defect is identified as a shield hole, its size can then be estimated using the two-step evaluation process outlined below.
From the analysis of the dual-frequency TFDR method, it follows that in (8) and (13), Z s depends on the central angle θ of the shield hole, whereas M r depends on both θ and the shield hole length l c . To decouple the effects of θ and l c , we propose a two-step evaluation process. In this process, the central angle θ is first estimated from Z s , and then the length l c is estimated from M r , constrained by the evaluated θ . This two-step process requires a reference set of characteristic impedances Z ss and damage ratios M rs , obtained by FEM simulations of cables with shield holes of various sizes. The overall procedure for size evaluation of shield hole defects using the improved dual-frequency TFDR method is summarized in Algorithm 1.
Algorithm 1 Size Assessment of Cable Shield Hole
  Block 1: Measurement Setup
 1:
Input: Cable under test, dual-frequency signals s 1 ( t ) , s 2 ( t )
 2:
Output: Reflected signals r 1 ( t ) , r 2 ( t )
 3:
Initialize equipment.
 4:
Inject s 1 ( t ) and record reflected signal r 1 ( t ) .
 5:
Inject s 2 ( t ) (with doubled center frequency) and record reflected signal r 2 ( t ) .
  Block 2: Signal Processing
 6:
Input: Reflected signals r 1 ( t ) , r 2 ( t )
 7:
Output: Damage ratios M r 1 , M r 2
 8:
for each reflected signal r i ( t )  do
 9:
    Locate defect.
10:
    Compute FFT to obtain spectra S ( ω ) , R ( ω ) .
11:
    Calculate spectrum ratio | P sr | by (7).
12:
    Calculate M r i by (11).
13:
end for
  Block 3: Parameter Evaluation
14:
Input: { Z ss } , { M rs } , M r 1 , M r 2
15:
Output: Estimated θ , l c
16:
Calculate Γ b from (9) and (10).
17:
Calculate Z s from (13).
18:
Estimate θ by searching Z s in { Z ss } .
19:
Estimate l c by searching M r 1 in { M rs } under the constraint of θ .
20:
Output final results and save data.
Multiple defects may exist in a cable, and the proposed method can be extended to estimate their sizes. When evaluating a specific defect in a multi-defect cable, the influence of the preceding defects on the reflected signal must be removed. This influence is represented by the transmission coefficients T f . As shown in Figure 2, and according to transmission line theory, the transmission coefficient T f of a defect can be expressed as
T f = e β s l c ( 1 + Γ a ) ( 1 + Γ b ) 1 + Γ b e 2 β s l c .
Therefore, when estimating the n-th defect, (11) should be modified as
M r = | P sr | 2 e 2 α p l f n i = 1 n 1 T f i 2 .

3. Simulation Validation

To validate the improved dual-frequency TFDR method and test its efficacy, we conduct a simulation on a 10 kV power cable.

3.1. Modeling and Analyzing the Cable Shield Hole Defects

To build the model for shield hole defects in Figure 1, we establish the defect models in COMSOL Multiphysics 6.2, a FEM software. This involves creating a two-dimensional cross-section model of a 10 kV single-core cable. The specific parameters of the cable used in the simulation are detailed in Table 1.
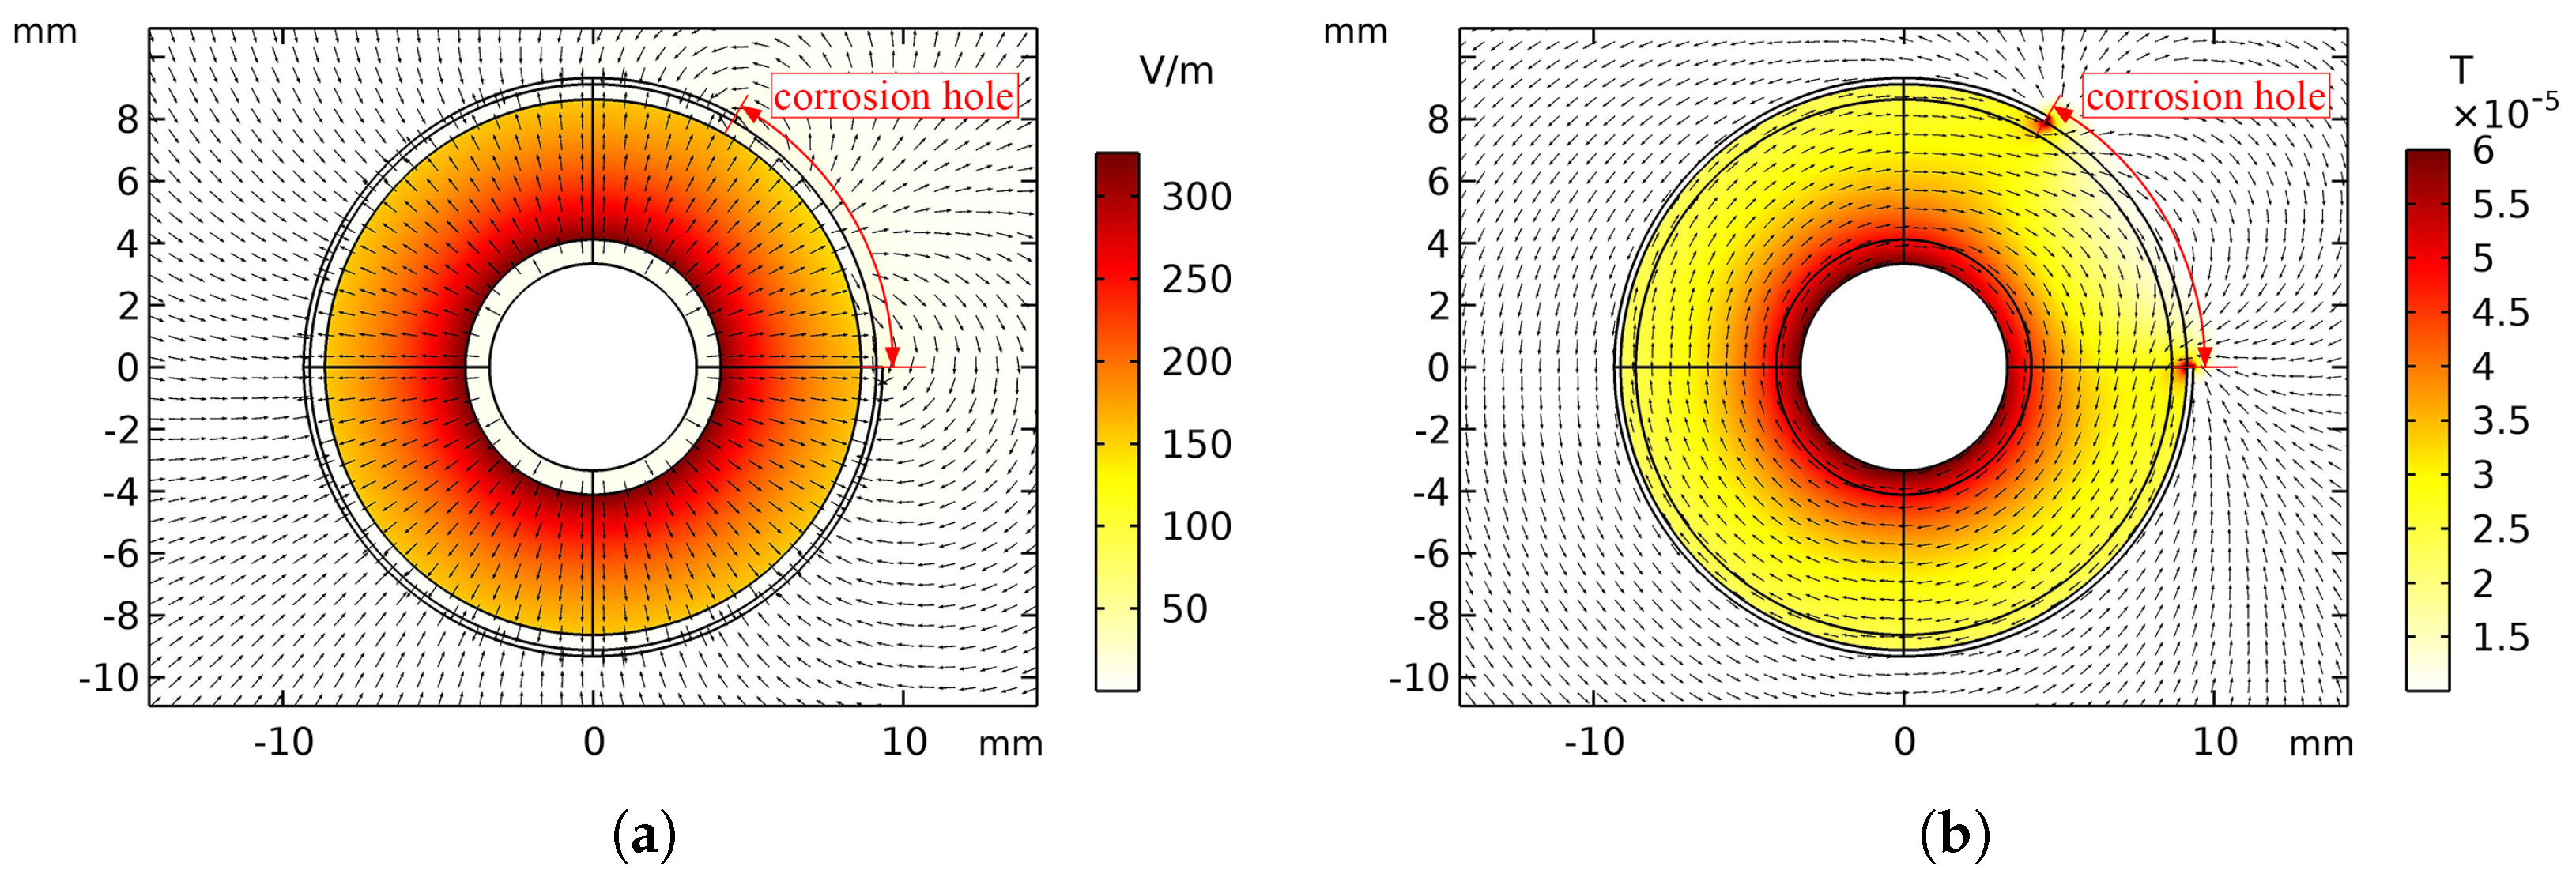
First, the simulation computes the electric and magnetic field distributions of the defect, and the cross-sectional views are shown in Figure 3. The results indicate that the electromagnetic wave inside the defect propagates primarily in a quasi-TEM mode, with some energy leaking through the shield holes.
Then, using the results of the electric and magnetic field distributions, the distributed parameters of shield hole defects, including R, L, G, and C, were calculated.

3.2. Simulation of Long Cables with Shield Hole Defects

The transfer function H c ( ω ) of long cables with defects can be derived using network cascading. A cable with defects can be viewed as a cascade of two long healthy sections and a section with a defect. Therefore, the H c ( ω ) can be derived as follows:
T c = T p 1 · T s · T p 2 · T o ,
where T c , T p 1 , T s , and T p 2 represent the transmission matrices of the entire cable, the first healthy cable section, the defective section, and the second healthy cable section, respectively, whereas T o denotes the transmission matrix of a high-impedance component that simulates an open terminal. H c ( ω ) is the reflected coefficient spectrum, which can be obtained using T c [20]. Therefore, the reflected signal r t of a long cable with defects is calculated as
r t = F 1 S ω · H c ( ω ) .
In the simulation, a 250 m long cable with shield hole defects located at the 50 m point was modeled. The shield hole angles ranged from 30° to 300°, and the lengths from 0.05 m to 0.5 m. A signal with a center frequency of 40 M Hz , a bandwidth of 40 M Hz , and t 0 = 100 n s was used as s 1 ( t ) for the first measurement [9]. For the second measurement, a signal with a center frequency of 80 M Hz , with the same bandwidth and center time as s 1 ( t ) , was used as s 2 ( t ) . Some reflected signals r ( t ) are shown in Figure 4. In the figure, the signals near 0 μ s correspond to the injected signal, those around 0.7   μ s are reflections from defects, and those near 3 μ s result from reflections at the open end of the cable. Figure 4a shows that the peaks of the reflected signals are delayed and their magnitudes increase. Conversely, Figure 4b indicates that while the peak times of the reflected signals remain constant with the defect angle, their magnitudes increase with larger defect angles.
The defects in Figure 4 are evaluated using the improved dual-frequency TFDR method. The attenuation constant α p of a healthy cable, calculated from (12), is 0.001867 m−1 at 40 M Hz and 0.002831 m−1 at 80 M Hz . The reference sets for Z ss and M rs are shown in Figure 5.
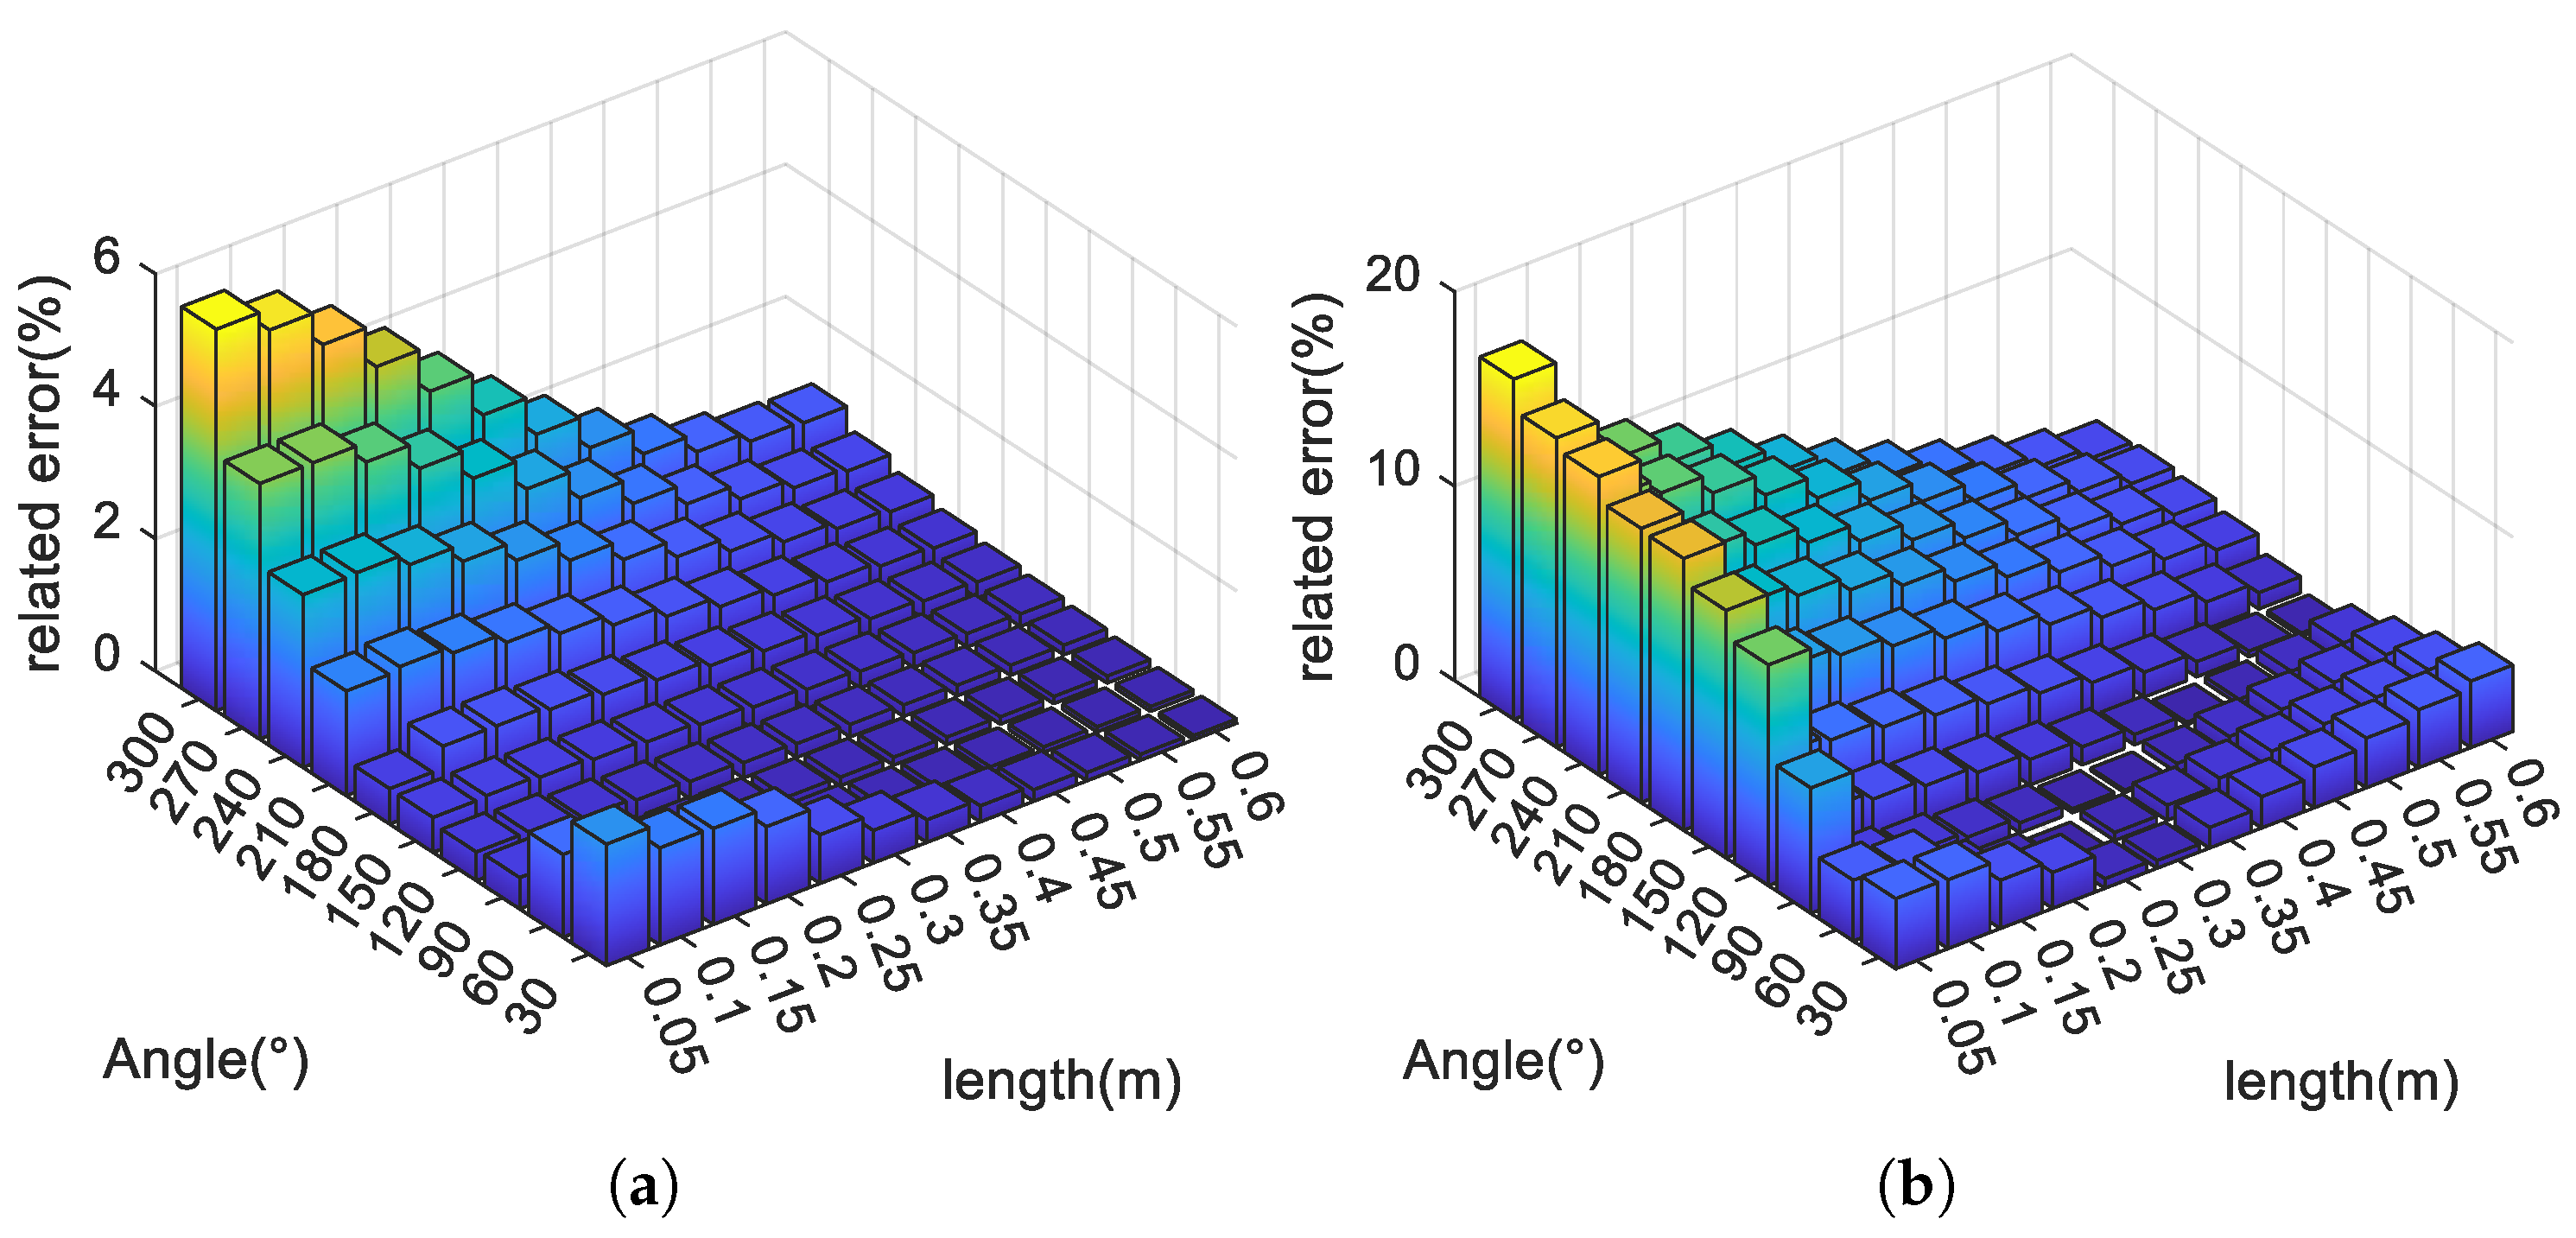
Using the two-step process, shield hole defects with various angles and lengths were estimated, and the corresponding errors are shown in Figure 6. The results indicate that as the defect angle increases, the estimation errors of both angle and length also increase, owing to the growing approximation error of (4). When the defect angle is 300° and the length is 0.05   m , the relative errors of angle and length estimation reach 5.76 % and 17.5 %, respectively. As the angle increases beyond 300°, the assumption Γ b 1 becomes invalid, and the method is no longer reliable.
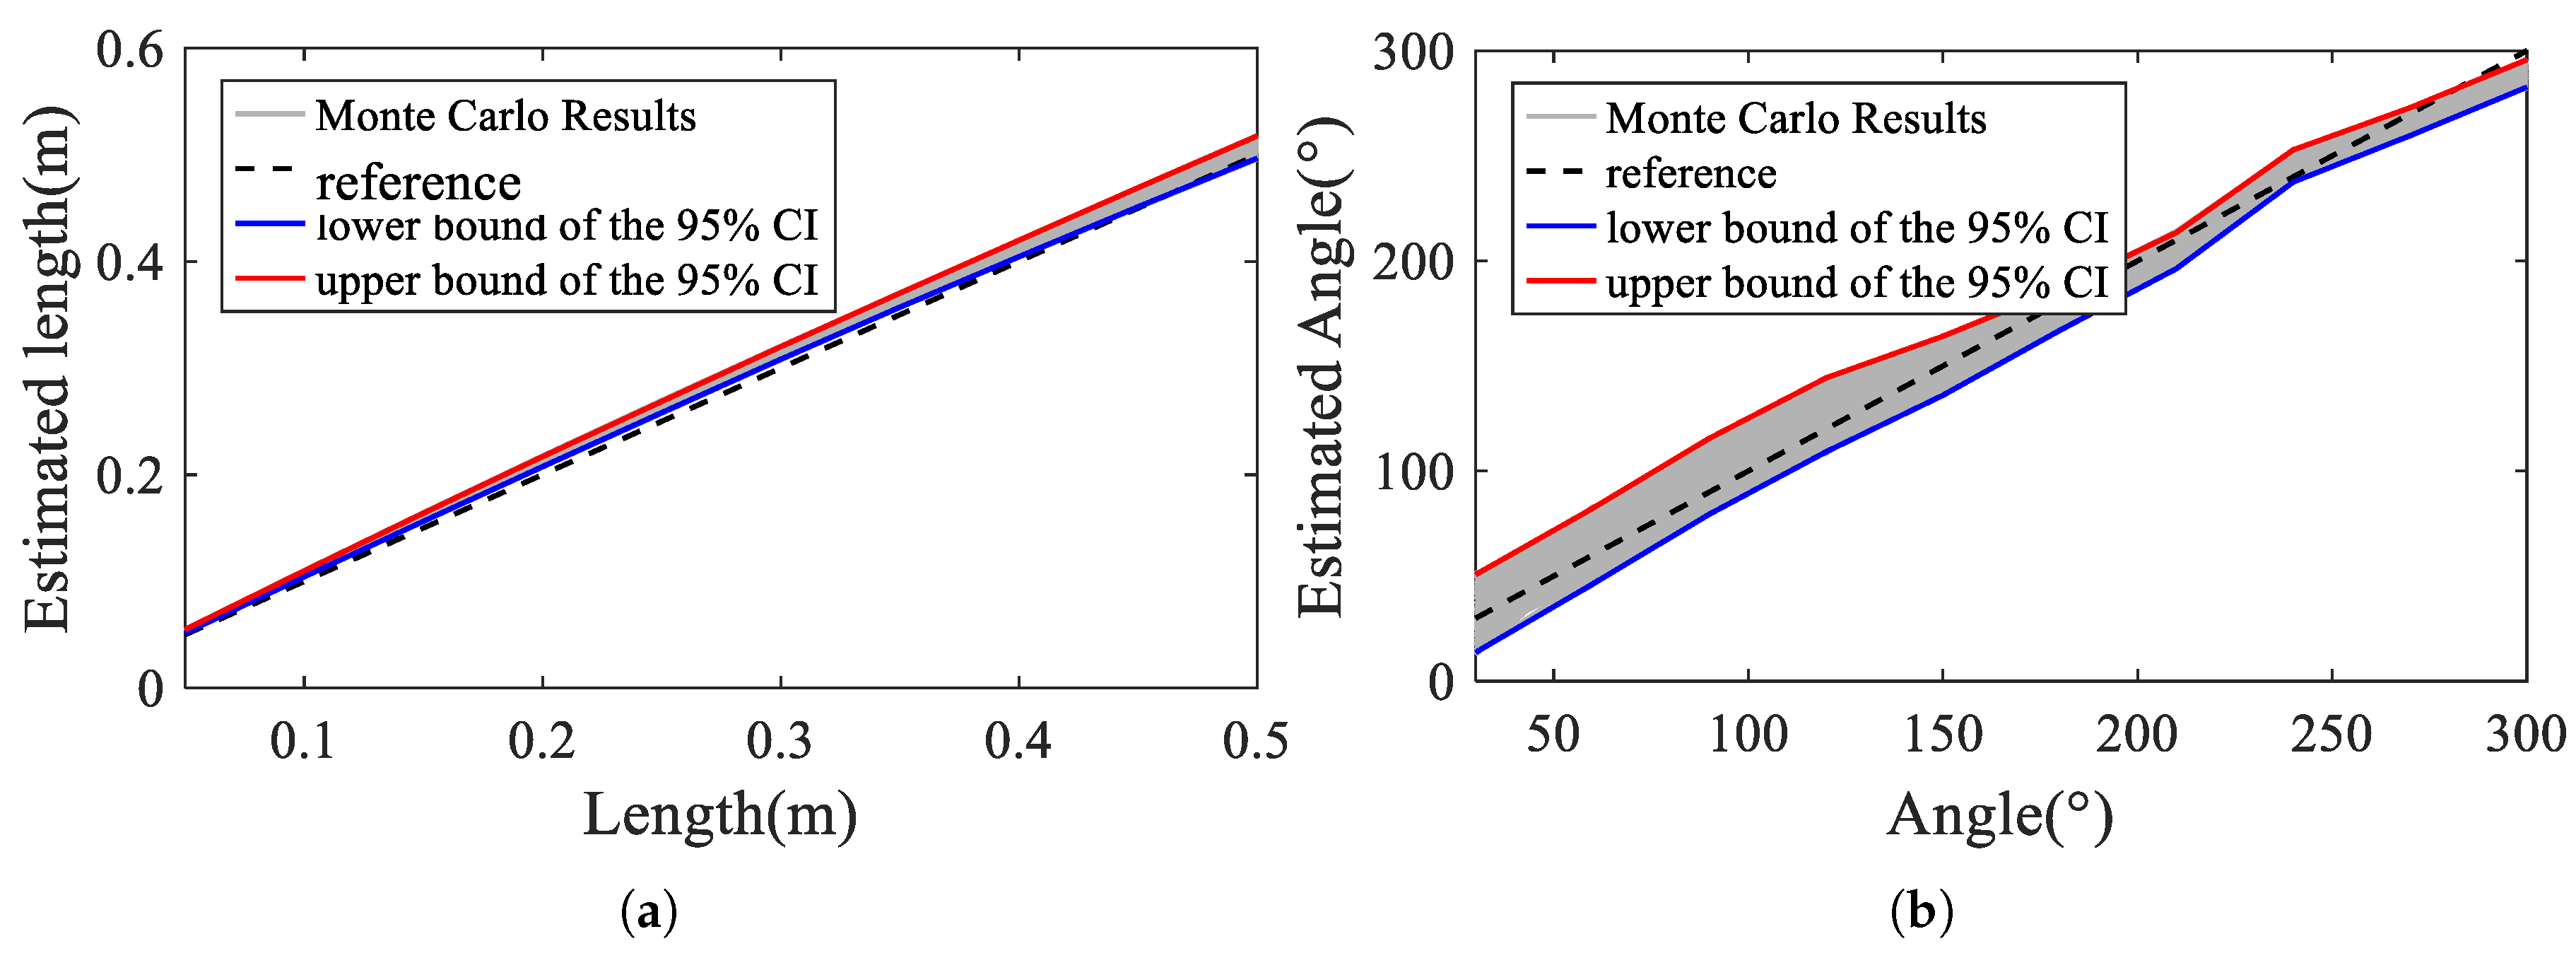
When using the two-step estimation process, the reference set has a significant influence on the estimated results. In practical measurements, there are differences between the tested cable and the reference cable, such as manufacturing tolerances. Therefore, the influence of cable parameter tolerances on the estimated results was analyzed. In the simulation, the core radius, shield radius, relative permittivity, and conductivity of the cable varied by ± 5 % to account for parameter tolerances. Using the Monte Carlo method, the estimated results and their 95% confidence intervals were calculated and are shown in Figure 7.
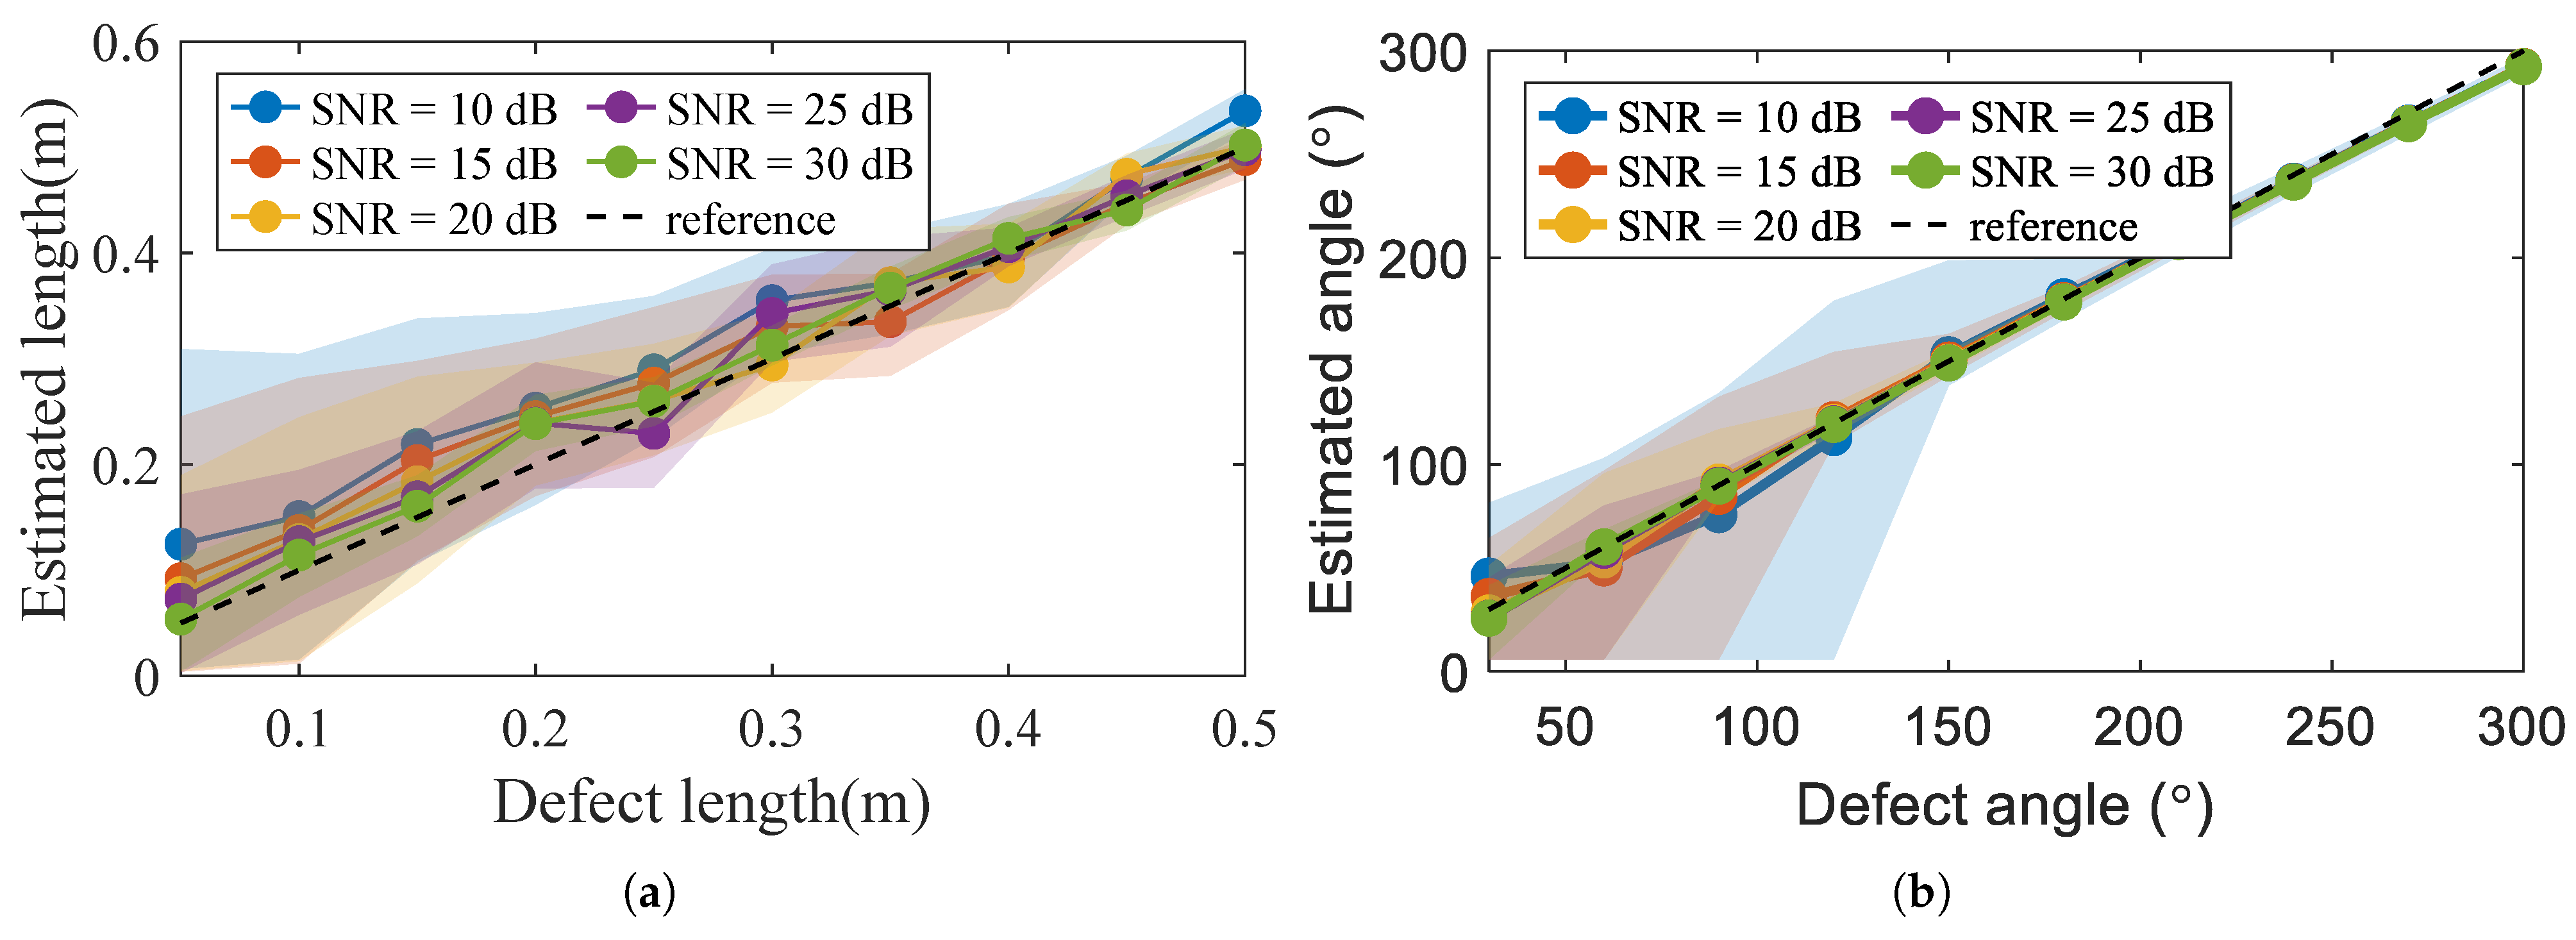
Noise is another factor influencing estimation accuracy. To analyze its effect on the proposed method, we evaluated performance under various signal-to-noise ratios (SNRs). For each defect and SNR level, 1000 Monte Carlo simulations were performed. The mean estimates and their 95% confidence intervals are presented in Figure 8.
As shown in Figure 8, length estimation is more sensitive to noise than angle estimation. With increasing SNR, the mean estimation errors of both length and angle decrease, the 95% confidence intervals become narrower, and the estimation results become more accurate.
In practice, shield holes are normally irregular. To evaluate the robustness of the proposed method, 12 irregular shield hole defects were modeled and simulated. These irregular holes were generated by dividing a regular shield hole into multiple subsections and randomly perturbing their central angles. The structural parameters of the irregular shield holes are listed in Table 2, and an example of a typical irregular hole is shown in Figure 9.
The estimated sizes of the irregular shield holes are presented in Figure 10. Additionally, the estimated results are compared with the average geometric values of the corresponding holes. From the comparison, it can be observed that the estimated values are close to the average values and exhibit a consistent trend. Although the estimated angles and lengths for irregular shield holes show larger errors compared to those for regular holes, the deviations remain within an acceptable range. These results indicate that the proposed method is capable of providing a reliable evaluation of the sizes of irregular shield holes.

4. Experiments and Results

In this section, an experiment was carried out to validate the proposed method. Direct validation on many long power cables is not feasible due to their high cost. Therefore, a scaled-model experiment was designed using a coaxial signal cable, which was chosen because of the structural similarity between signal cables and power cables. The experiment platform is shown in Figure 11.
It consists of an arbitrary waveform generator to inject signals, an oscilloscope to capture the reflected signals, a computer to process and analyze the reflected signals, and a long cable under test. The cable under test consists of two healthy long sections, approximately 30 m and 150 m in length, and several 1 m long short cables with artificial defects. The short defective cables are inserted between the healthy sections using SMA connectors. The arbitrary waveform generator is Keysight 33621A (Keysight, Santa Rosa, CA, USA), and the oscilloscope is Tektronix MSO5204B (Tektronix, Beaverton, OR, USA). Both the output impedance of the waveform generator and the input impedance of the oscilloscope is 50 Ω . The cable under test is an SYV50 type with a 50 Ω characteristic impedance.
Shield hole defects were emulated by removing specific areas from the shield foil of short cable sections. To assess the performance of the proposed method, eleven cable samples were fabricated and tested. Among them, eight had regular shield holes, while three featured irregular ones. Considering both Type A uncertainty (from repeated measurements) and Type B uncertainty (from approximation of the method), the estimation results and their 95% confidence intervals are presented in Table 3, and the corresponding cable samples are shown in Figure 12.
Figure 13 shows the measurement of reflected signals from defective cable samples. In the figure, the signals reflected by the defects are located between 0.25   μ s and 0.35   μ s . The analysis of the effect of the shield hole length and angle on the reflected signals reveals that the amplitude of the reflected signals increases with the length of the shield hole. Similarly, the amplitude also increases with the widening of the shield hole angles.
The reference set Z ss and M rs were obtained by simulation. And the attenuation constant α p of the SYV50 cable was measured using TFDR on a healthy cable. The attenuation α p is 0.0072 m −1 at 40 M Hz and 0.0085 m −1 at 80 M Hz . To eliminate occasional factors and connector influence, 20 full connector disassembly and reassembly measurements were conducted for each sample. For each reassembly, the average of five measurements was taken as the measured value to reduce noise interference. The lengths and angles of the defective cable samples were evaluated using the two-step process, and the evaluated results were compared with the reference values in Table 3. The results in Table 3 demonstrate that the improved dual-frequency TFDR method is effective for evaluating the size of shield hole defects in cables. However, discrepancies between the evaluated and actual values remain, primarily due to noise and the precision of defect fabrication. For regular defects, discrepancies are generally smaller for defect angles than for defect lengths. This is because angle estimation relies on the ratio of measurements at different frequencies, which mitigates noise effects, whereas length estimation depends on angle estimation results, so any inaccuracies in angle measurement can further degrade length accuracy. For irregular defects, the method cannot capture detailed irregular shapes, but it still provides a reasonable evaluation of the overall defect size.
To validate the effectiveness of the proposed method in multiple-defect scenarios, an additional experiment was conducted using a cable with two shield hole defects. The first defect was positioned at 30 m with varying sizes, while the second defect was fixed at 60 m with a length of 0.4   m and an angle of 180°. The reflected signals from the cable with two defects are shown in Figure 14.
Using the proposed method, the second defect was evaluated, and the results are presented in Table 4. A comparison of the estimated results with and without compensation for the first defect shows that compensation significantly improves the accuracy of the second defect’s evaluation. The estimated results for multiple defects exhibit larger errors than those for single defects, primarily due to the accumulation of errors in evaluating multiple defects.

5. Conclusions

In this work, we modeled cable shield hole defects and analyzed their effect on the propagation of TFDR signals. Building upon the analysis results, we proposed an improved dual-frequency TFDR method to evaluate the length and angle of the shield holes. A simulation and an experiment were conducted to demonstrate the improved dual-frequency TFDR method in detail and test its validity and accuracy. The main conclusions are summarized as follows:
1.
In the long cable simulation results, the estimated error of defect angles and lengths increased with the increase in defect angle. When the defect angle is lower than 300°, the proposed method has a high accuracy and robustness.
2.
In the experimental results, the maximum relative errors for regular defects were 11% in length estimation and 5% in angle estimation. For irregular defects, the proposed method was able to estimate both defect length and average angle, with errors of 8.7% and 9.06%, respectively. In multiple-defect scenarios, the method remained effective, yielding maximum relative errors of 14.43% for length and 11.97% for angle.
3.
In practical measurements, the proposed method requires the signal source and data acquisition device to have a bandwidth of at least 100 M Hz to ensure estimation accuracy. The on-site SNR is not lower than 20 dB, and excessive noise can lead to larger errors.
The estimated defect lengths and angles can be used to model defects in cable digital twins and to assess the operational state of the cable. By comparing these results with alarm criteria, appropriate maintenance plans can be formulated. Therefore, the proposed method can significantly enhance cable condition monitoring and increase the effectiveness of cable maintenance. The characteristic impedance of power cables is less strictly controlled than that of signal cables, which may affect the accuracy of the proposed method. As future work, we will investigate the impact of characteristic impedance variations on accuracy and perform experiments on power cables to further validate the effectiveness of the method.

Author Contributions

K.Z.: Conceptualization, Methodology, Writing—original draft. S.G.-T.: Supervision, Methodology, Writing—review and editing. P.M.: Supervision, Validation, Writing—review and editing. Y.Y.: Writing – review and editing. H.L.: Supervision, Writing—review and editing. All authors have read and agreed to the published version of the manuscript.

Funding

This research was founded by the China Postdoctoral Science Foundation (Certificate Number: 2024M762595).

Data Availability Statement

The original contributions presented in this study are included in the article. Further inquiries can be directed to the corresponding author.

Conflicts of Interest

The authors declare no potential conflicts of interests.

References

  1. Tu, H.; Peng, C.; Chen, Y.; Li, L.; Deng, H.; Liu, G. Characteristic impedance modeling of nuclear power instrumentation and control cable shield breakage. Energies 2025, 18, 3008. [Google Scholar] [CrossRef]
  2. Shao, Q.; Fan, S.; Zhang, Z.; Liu, F.; Fu, Z.; Lv, P.; Mu, Z. Artificial intelligence in cable fault detection and localization: Recent advances and research challenges. Energies 2025, 18, 3662. [Google Scholar] [CrossRef]
  3. IEEE 1617-2022; IEEE Guide for Assessment, Mitigation, and Control of Corrosion of Metallic Shields for Extruded Dielectric Cables Rated 5 kv to 46 kv. IEEE: New York, NY, USA, 2022.
  4. Liang, H.; Liu, Y.; Sheng, G.; Jiang, X. Fault-cause identification method based on adaptive deep belief network and time–frequency characteristics of travelling wave. IET Gener. Transm. Distrib. 2019, 13, 724–732. [Google Scholar] [CrossRef]
  5. Jiang, K.; Zhou, K.; Ren, X.; Xu, Y. Frequency domain sampling optimization of cable defect detection and location method based on exponentially increased frequency reflection coefficient spectrum. Energies 2025, 18, 2428. [Google Scholar] [CrossRef]
  6. Zhang, H.; Zhou, K.; Ren, X.; Xu, Y. Moisture localization and diagnosis method for power distribution cables based on dynamic frequency domain reflectometry. Energies 2025, 18, 2430. [Google Scholar] [CrossRef]
  7. Abboud, L.; Cozza, A.; Pichon, L. A matched-pulse approach for soft-fault detection in complex wire networks. IEEE Trans. Instrum. Meas. 2012, 61, 1719–1732. [Google Scholar] [CrossRef]
  8. Mu, H.B.; Zhang, H.T.; Zou, X.Y.; Zhang, D.N.; Lu, X.; Zhang, G.J. Sensitivity improvement in cable faults location by using broadband impedance spectroscopy with dolph-chebyshev window. IEEE Trans. Power Deliv. 2022, 37, 3846–3854. [Google Scholar] [CrossRef]
  9. Song, E.; Shin, Y.J.; Stone, P.E.; Wang, J.; Choe, T.S.; Yook, J.G.; Park, J.B. Application of time-frequency domain reflectometry for detection and localization of a fault on a coaxial cable. IEEE Trans. Electromagn. Compat. 2009, 54, 2493–2500. [Google Scholar]
  10. Lee, S.H.; Park, J.B.; Choi, Y.H. Wavelet-transform-based time-frequency domain reflectometry for reduction of blind spot. Meas. Sci. Technol. 2012, 23, 065004. [Google Scholar] [CrossRef]
  11. Lim, H.; Kwon, G.Y.; Shin, Y.J. Fault detection and localization of shielded cable via optimal detection of time-frequency-domain reflectometry. IEEE Trans. Instrum. Meas. 2021, 70, 3521510. [Google Scholar] [CrossRef]
  12. Lim, H.; Lee, Y.H.; Bang, S.S.; Shin, Y.J. Application of enhanced optimal-detection of time-frequency domain reflectometry on hts cable with high-resolution. IEEE Trans. Appl. Supercond. 2023, 33, 9000306. [Google Scholar] [CrossRef]
  13. Zou, X.; Mu, H.; Wang, R.; Fan, K.; Cheng, Z.; He, Y.; Zhang, G. An efficient accuracy improvement method for cable defect location based on instantaneous filtering in time-frequency domain. Measurement 2024, 226, 114178. [Google Scholar] [CrossRef]
  14. Manet, A.; Kameni, A.; Loete, F.; Genoulaz, J.; Pichon, L.; Picon, O. Equivalent circuit model of soft shield defects in coaxial cables using numerical modeling. IEEE Trans. Electromagn. Compat. 2017, 59, 533–536. [Google Scholar] [CrossRef]
  15. Zou, X.Y.; Mu, H.B.; Zhang, H.T.; Qu, L.Q.; He, Y.F.; Zhang, G.J. An efficient cross-terms suppression method in time-frequency domain reflectometry for cable defect localization. IEEE Trans. Instrum. Meas. 2022, 71, 3511610. [Google Scholar] [CrossRef]
  16. Lee, C.K.; Shin, Y.J. Detection and assessment of i&c cable faults using time-frequency R-CNN-based reflectometry. IEEE Trans. Ind. Electron. 2021, 68, 1581–1590. [Google Scholar]
  17. Zhao, K.; Grivet-Talocia, S.; Manfredi, P.; Yan, Y.; Li, H. Size assessment of power cable shield corrosion defects using double-frequency time–frequency-domain reflectometry. IEEE Trans. Instrum. Meas. 2025, 74, 3513911. [Google Scholar] [CrossRef]
  18. Papaleonidopoulos, I.C.; Karagiannopoulos, C.G.; Theodorou, N.J. Evaluation of the two-conductor hf transmission-line model for symmetrical indoor triple-pole cables. Measurement 2006, 39, 719–728. [Google Scholar] [CrossRef]
  19. Yunusa-Kaltungo, A.; Sinha, J.K.; Elbhbah, K. An improved data fusion technique for faults diagnosis in rotating machines. Measurement 2014, 58, 27–32. [Google Scholar] [CrossRef]
  20. Khan, A.S. Microwave Engineering: Concepts and Fundamentals, 1st ed.; CRC Press: Boca Raton, FL, USA, 2014. [Google Scholar]
Figure 1. Illustration of a cable with shield holes.
Energies 18 05214 g001
Figure 2. Distributed-parameter model of a long cable with shield hole defects.
Energies 18 05214 g002
Figure 3. The distribution of the electric and magnetic fields in the cross-section of a cable defect. (a) The electric field; (b) the magnetic field. The arrows indicate the field directions.
Energies 18 05214 g003
Figure 4. Reflected signals from shield hole defects of various sizes. (a) Results for defects with different lengths ( θ = 150 ). (b) Results for defects with different angles ( l c = 0.5 m).
Energies 18 05214 g004
Figure 5. Reference values for assessing the size of shield hole defects in the 10 kV cable (shown in Table 1). (a) Reference characteristic impedance Z ss for various angles θ (with θ = 0 representing a healthy cable); (b) reference damage ratio M rs for various angles θ and lengths l c .
Energies 18 05214 g005
Figure 6. The estimation error of defect angle and length under various angles and lengths. (a) The estimation error of angles; (b) the estimation error of lengths. The colors also represent the magnitude of the error.
Energies 18 05214 g006
Figure 7. Estimated defect lengths and angles for a cable with ±5% manufacturing tolerance. (a) Defect angles are 150°, and (b) defect lengths are 0.5   m .
Energies 18 05214 g007
Figure 8. Size evaluation of shield hole defects under the signals with various SNRs. (a) Defect angles are 150°. (b) Defect lengths are 0.5 m.
Energies 18 05214 g008
Figure 9. Irregular shield hole of sample 2 in Table 2.
Energies 18 05214 g009
Figure 10. Size evaluation of irregular shield holes. (a) The estimated results of defect angles; (b) the estimated results of defect lengths.
Energies 18 05214 g010
Figure 11. Experiment setup.
Energies 18 05214 g011
Figure 12. Cable sample mimicking shield hole defects. (a) A regular defect. (bd) Irregular defects.
Energies 18 05214 g012
Figure 13. Effect of shield hole length l c and angle θ on reflected signals.
Energies 18 05214 g013
Figure 14. Reflected signals from cable with two shield hole defects.
Energies 18 05214 g014
Table 1. Parameters of the cable in the simulation.
ComponentRadius (mm)Electric Parameters
Core3.335 γ c = 5.98 × 10 7 S/m
Inner semiconductor4.115 ϵ = 70
XLPE8.635 ϵ = 2.3
Outer semiconductor9.125 ϵ = 100
Shield9.325 γ s = 5.98 × 10 7 S/m
Sheath12.115 ϵ = 2.25
Table 2. Angle and length parameters of the samples in the simulation.
Sample θ g (°) Δ θ g (°) l c (m) θ ave (°)
190 ± 15 0.288.69
290 ± 45 0.285.97
3120 ± 15 0.2118.18
4135 ± 45 0.2136.62
5150 ± 15 0.2150.90
6150 ± 60 0.2148.72
7180 ± 15 0.2180.22
8180 ± 60 0.2182.16
9180 ± 60 0.4179.99
10180 ± 60 0.6178.85
11210 ± 60 0.2208.49
12225 ± 45 0.2228.01
Table 3. Comparison between actual defect sizes and their estimation results.
TypeDefect Size L e and
Confidence
Interval (cm)
Relative
Error (%)
θ e and
Confidence
Interval (°)
Relative
Error (%)
Regular
defects
30 cm, 90°32.54 ± 1.28.4785.9 ± 2.194.56
30 cm, 180°32.38 ± 1.947.93174.01 ± 4.573.33
40 cm, 90°44.27 ± 1.4510.6886.93 ± 2.213.41
40 cm, 180°39.06 ± 2.032.35181.87 ± 3.551.04
50 cm, 90°53.95 ± 2.027.0988.04 ± 1.482.18
50 cm, 180°54.38 ± 2.138.76175.17 ± 4.162.68
60 cm, 190°66.50 ± 1.6810.83184.24 ± 4.293.03
60 cm, 230°55.19 ± 2.888.02229.54 ± 6.140.2
Irregular
defects
40 cm, 225°37.26 ± 2.466.85238.83 ± 7.46.15
40 cm, 202.5°42.46 ± 2.66.15211.8 ± 5.164.59
50 cm, 216°54.35 ± 2.768.7196.43 ± 3.959.06
The angle of irregular defects is the weighted average angle of the irregular shield hole, which is calculated as θ ave = i = 1 N θ i l ci i = 1 N l ci .
Table 4. Comparison the estimated results of the second defect with and without compensation for the first defect.
AlgorithmDefect 1Defect 2 (40 cm, 180°)
L e and
Confidence
Interval (cm)
Relative
Error (%)
θ e and
Confidence
Interval (°)
Relative
Error (%)
No
Comp.
30 cm, 90°33.56 ± 1.8516.1145.38 ± 3.3219.2
30 cm, 180°44.63 ± 2.2311.58126.74 ± 3.4729.59
40 cm, 90°52.12 ± 2.1730.3138.97 ± 3.8422.79
50 cm, 90°48.35 ± 2.1820.87125.83 ± 2.6330.1
50 cm, 180°26.72 ± 1.7833.2105.41 ± 2.7641.44
60 cm, 190°35.14 ± 2.0112.1590.25 ± 2.4449.86
60 cm, 230°46.98 ± 2.3717.4588.76 ± 1.9750.59
With
Comp.
30 cm, 90°42.52 ± 26.3165.24 ± 4.098.2
30 cm, 180°35.43 ± 2.0411.43159.92 ± 3.8511.16
40 cm, 90°35.75 ± 1.9310.63161.85 ± 3.4910.08
50 cm, 90°43.23 ± 2.128.3173.36 ± 3.383.69
50 cm, 180°34.23 ± 1.8814.43195.26 ± 4.118.48
60 cm, 190°33.28 ± 1.9816.8161.72 ± 3.2910.16
60 cm, 230°44.15 ± 2.310.38158.45 ± 2.9111.97
Disclaimer/Publisher’s Note: The statements, opinions and data contained in all publications are solely those of the individual author(s) and contributor(s) and not of MDPI and/or the editor(s). MDPI and/or the editor(s) disclaim responsibility for any injury to people or property resulting from any ideas, methods, instructions or products referred to in the content.